Falcon, NC Map & Demographics
Falcon Map
Falcon Overview
$20,707
PER CAPITA INCOME
$146,250
AVG FAMILY INCOME
$71,786
AVG HOUSEHOLD INCOME
0.43
INEQUALITY / GINI INDEX
186
TOTAL POPULATION
75
MALE POPULATION
111
FEMALE POPULATION
67.57
MALES / 100 FEMALES
148.00
FEMALES / 100 MALES
55.5
MEDIAN AGE
4.1
AVG FAMILY SIZE
2.4
AVG HOUSEHOLD SIZE
56
LABOR FORCE [ PEOPLE ]
33.9%
PERCENT IN LABOR FORCE
Falcon Zip Codes
Falcon Area Codes
Income in Falcon
Income Overview in Falcon
Per Capita Income in Falcon is $20,707, while median incomes of families and households are $146,250 and $71,786 respectively.
| Characteristic | Number | Measure |
| Per Capita Income | 186 | $20,707 |
| Median Family Income | 17 | $146,250 |
| Mean Family Income | 17 | $135,776 |
| Median Household Income | 38 | $71,786 |
| Mean Household Income | 38 | $80,405 |
| Income Deficit | 17 | $0 |
| Wage / Income Gap (%) | 186 | 0.00% |
| Wage / Income Gap ($) | 186 | 100.00¢ per $1 |
| Gini / Inequality Index | 186 | 0.43 |
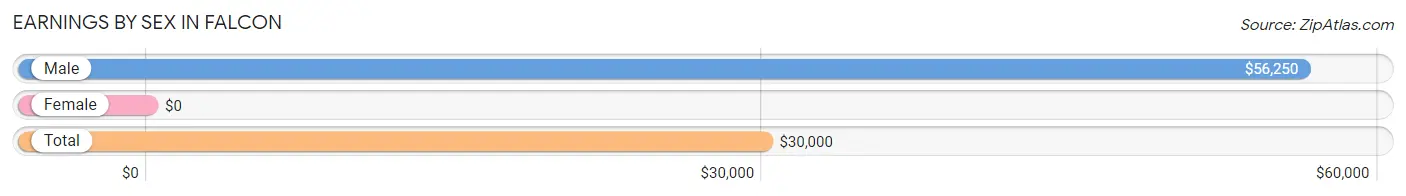
Earnings by Sex in Falcon
| Sex | Number | Average Earnings |
| Male | 31 (38.8%) | $56,250 |
| Female | 49 (61.3%) | $0 |
| Total | 80 (100.0%) | $30,000 |
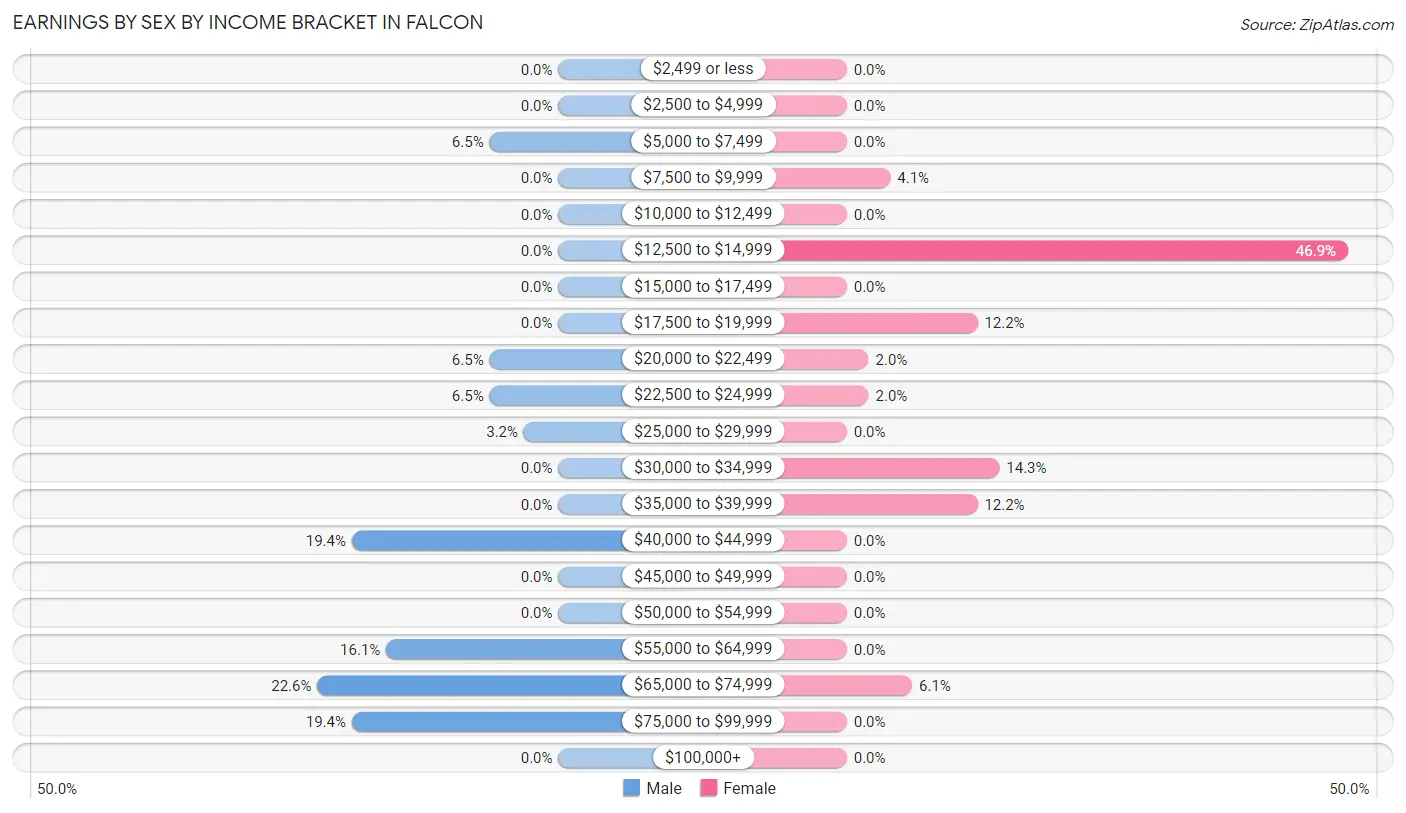
Earnings by Sex by Income Bracket in Falcon
The most common earnings brackets in Falcon are $65,000 to $74,999 for men (7 | 22.6%) and $12,500 to $14,999 for women (23 | 46.9%).
| Income | Male | Female |
| $2,499 or less | 0 (0.0%) | 0 (0.0%) |
| $2,500 to $4,999 | 0 (0.0%) | 0 (0.0%) |
| $5,000 to $7,499 | 2 (6.5%) | 0 (0.0%) |
| $7,500 to $9,999 | 0 (0.0%) | 2 (4.1%) |
| $10,000 to $12,499 | 0 (0.0%) | 0 (0.0%) |
| $12,500 to $14,999 | 0 (0.0%) | 23 (46.9%) |
| $15,000 to $17,499 | 0 (0.0%) | 0 (0.0%) |
| $17,500 to $19,999 | 0 (0.0%) | 6 (12.2%) |
| $20,000 to $22,499 | 2 (6.5%) | 1 (2.0%) |
| $22,500 to $24,999 | 2 (6.5%) | 1 (2.0%) |
| $25,000 to $29,999 | 1 (3.2%) | 0 (0.0%) |
| $30,000 to $34,999 | 0 (0.0%) | 7 (14.3%) |
| $35,000 to $39,999 | 0 (0.0%) | 6 (12.2%) |
| $40,000 to $44,999 | 6 (19.4%) | 0 (0.0%) |
| $45,000 to $49,999 | 0 (0.0%) | 0 (0.0%) |
| $50,000 to $54,999 | 0 (0.0%) | 0 (0.0%) |
| $55,000 to $64,999 | 5 (16.1%) | 0 (0.0%) |
| $65,000 to $74,999 | 7 (22.6%) | 3 (6.1%) |
| $75,000 to $99,999 | 6 (19.4%) | 0 (0.0%) |
| $100,000+ | 0 (0.0%) | 0 (0.0%) |
| Total | 31 (100.0%) | 49 (100.0%) |
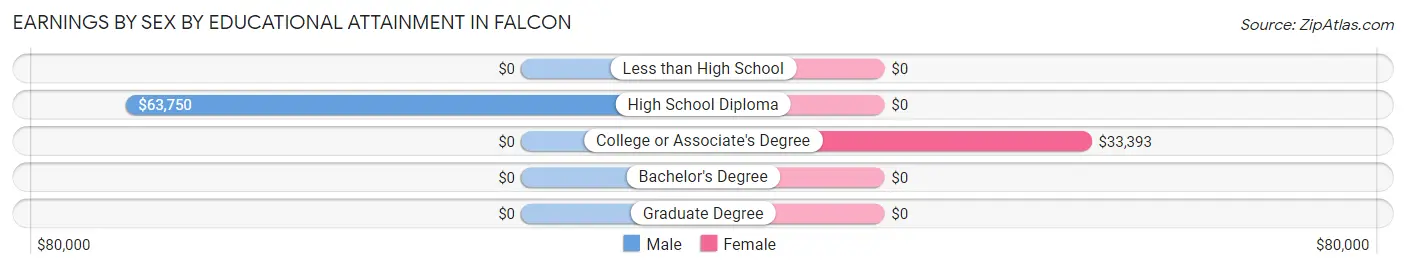
Earnings by Sex by Educational Attainment in Falcon
Average earnings in Falcon are $56,500 for men and $33,571 for women, a difference of 40.6%. Men with an educational attainment of high school diploma enjoy the highest average annual earnings of $63,750, while those with high school diploma education earn the least with $63,750. Women with an educational attainment of college or associate's degree earn the most with the average annual earnings of $33,393, while those with college or associate's degree education have the smallest earnings of $33,393.
| Educational Attainment | Male Income | Female Income |
| Less than High School | - | - |
| High School Diploma | $63,750 | $0 |
| College or Associate's Degree | - | - |
| Bachelor's Degree | - | - |
| Graduate Degree | - | - |
| Total | $56,500 | $33,571 |
Family Income in Falcon
Family Income Brackets in Falcon
According to the Falcon family income data, there are 6 families falling into the $75,000 to $99,999 income range, which is the most common income bracket and makes up 35.3% of all families.
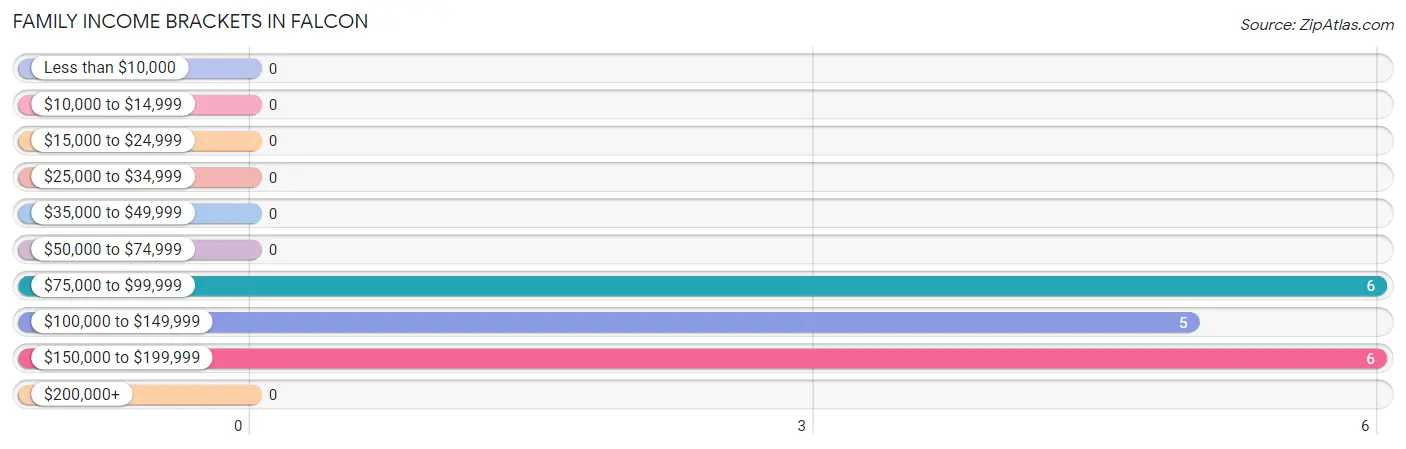
| Income Bracket | # Families | % Families |
| Less than $10,000 | 0 | 0.0% |
| $10,000 to $14,999 | 0 | 0.0% |
| $15,000 to $24,999 | 0 | 0.0% |
| $25,000 to $34,999 | 0 | 0.0% |
| $35,000 to $49,999 | 0 | 0.0% |
| $50,000 to $74,999 | 0 | 0.0% |
| $75,000 to $99,999 | 6 | 35.3% |
| $100,000 to $149,999 | 5 | 29.4% |
| $150,000 to $199,999 | 6 | 35.3% |
| $200,000+ | 0 | 0.0% |
Family Income by Famaliy Size in Falcon
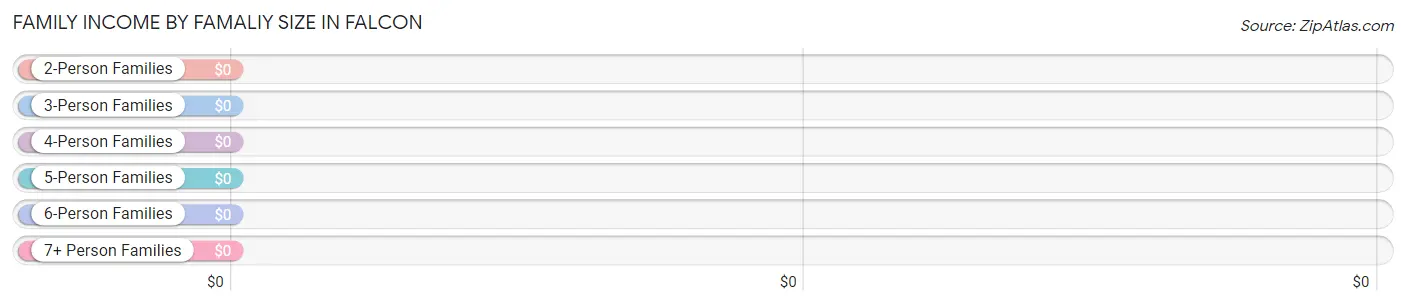
| Income Bracket | # Families | Median Income |
| 2-Person Families | 6 (35.3%) | $0 |
| 3-Person Families | 0 (0.0%) | $0 |
| 4-Person Families | 0 (0.0%) | $0 |
| 5-Person Families | 6 (35.3%) | $0 |
| 6-Person Families | 5 (29.4%) | $0 |
| 7+ Person Families | 0 (0.0%) | $0 |
| Total | 17 (100.0%) | $146,250 |
Family Income by Number of Earners in Falcon
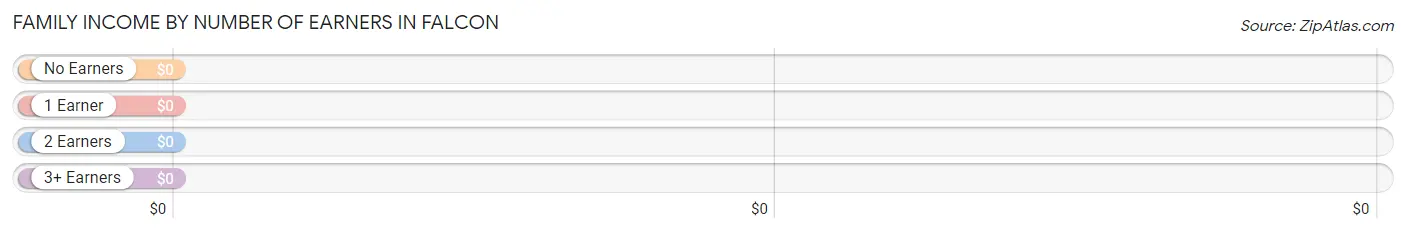
| Number of Earners | # Families | Median Income |
| No Earners | 0 (0.0%) | $0 |
| 1 Earner | 0 (0.0%) | $0 |
| 2 Earners | 11 (64.7%) | $0 |
| 3+ Earners | 6 (35.3%) | $0 |
| Total | 17 (100.0%) | $146,250 |
Household Income in Falcon
Household Income Brackets in Falcon
With 8 households falling in the category, the $25,000 to $34,999 income range is the most frequent in Falcon, accounting for 21.0% of all households.
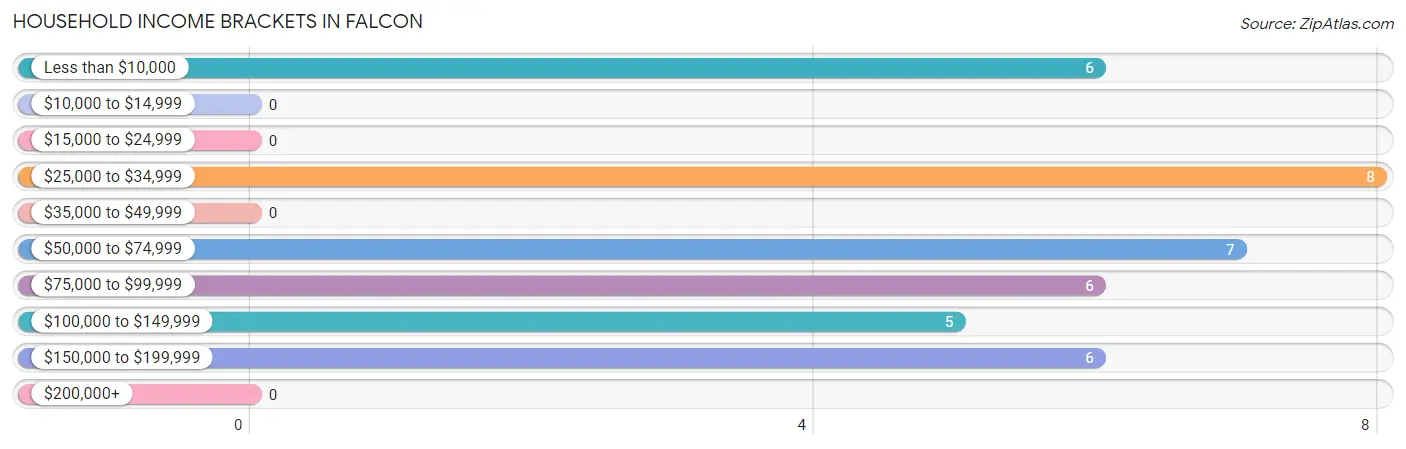
| Income Bracket | # Households | % Households |
| Less than $10,000 | 6 | 15.8% |
| $10,000 to $14,999 | 0 | 0.0% |
| $15,000 to $24,999 | 0 | 0.0% |
| $25,000 to $34,999 | 8 | 21.1% |
| $35,000 to $49,999 | 0 | 0.0% |
| $50,000 to $74,999 | 7 | 18.4% |
| $75,000 to $99,999 | 6 | 15.8% |
| $100,000 to $149,999 | 5 | 13.2% |
| $150,000 to $199,999 | 6 | 15.8% |
| $200,000+ | 0 | 0.0% |
Household Income by Householder Age in Falcon
| Income Bracket | # Households | Median Income |
| 15 to 24 Years | 0 (0.0%) | $0 |
| 25 to 44 Years | 0 (0.0%) | $0 |
| 45 to 64 Years | 24 (63.2%) | $0 |
| 65+ Years | 14 (36.8%) | $0 |
| Total | 38 (100.0%) | $71,786 |
Poverty in Falcon
Income Below Poverty by Sex and Age in Falcon
With 6.4% poverty level for males and 46.6% for females among the residents of Falcon, 25 to 34 year old males and 75 year old and over females are the most vulnerable to poverty, with 2 males (50.0%) and 39 females (75.0%) in their respective age groups living below the poverty level.
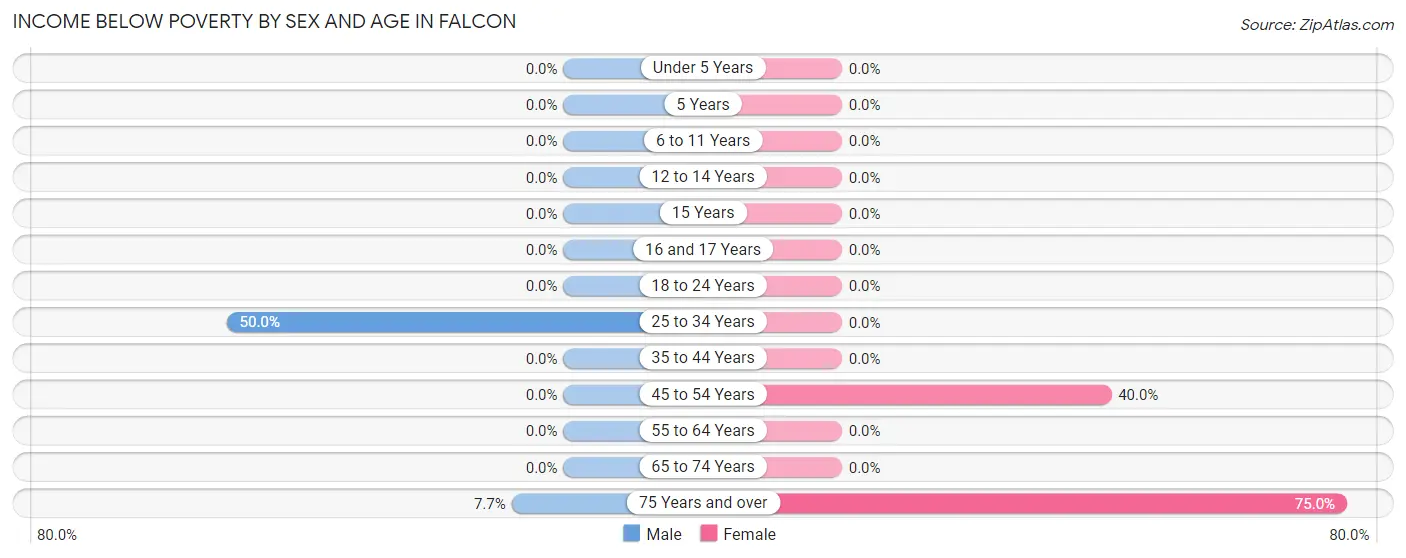
| Age Bracket | Male | Female |
| Under 5 Years | 0 (0.0%) | 0 (0.0%) |
| 5 Years | 0 (0.0%) | 0 (0.0%) |
| 6 to 11 Years | 0 (0.0%) | 0 (0.0%) |
| 12 to 14 Years | 0 (0.0%) | 0 (0.0%) |
| 15 Years | 0 (0.0%) | 0 (0.0%) |
| 16 and 17 Years | 0 (0.0%) | 0 (0.0%) |
| 18 to 24 Years | 0 (0.0%) | 0 (0.0%) |
| 25 to 34 Years | 2 (50.0%) | 0 (0.0%) |
| 35 to 44 Years | 0 (0.0%) | 0 (0.0%) |
| 45 to 54 Years | 0 (0.0%) | 2 (40.0%) |
| 55 to 64 Years | 0 (0.0%) | 0 (0.0%) |
| 65 to 74 Years | 0 (0.0%) | 0 (0.0%) |
| 75 Years and over | 1 (7.7%) | 39 (75.0%) |
| Total | 3 (6.4%) | 41 (46.6%) |
Income Above Poverty by Sex and Age in Falcon
According to the poverty statistics in Falcon, males aged 12 to 14 years and females aged 6 to 11 years are the age groups that are most secure financially, with 100.0% of males and 100.0% of females in these age groups living above the poverty line.
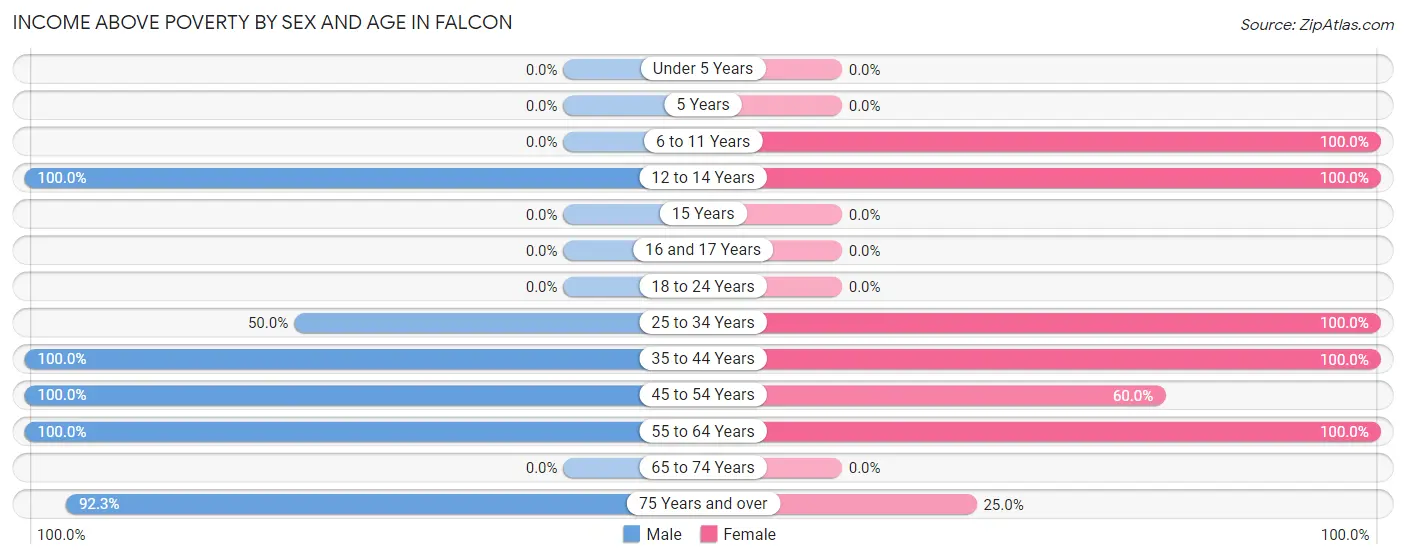
| Age Bracket | Male | Female |
| Under 5 Years | 0 (0.0%) | 0 (0.0%) |
| 5 Years | 0 (0.0%) | 0 (0.0%) |
| 6 to 11 Years | 0 (0.0%) | 6 (100.0%) |
| 12 to 14 Years | 4 (100.0%) | 4 (100.0%) |
| 15 Years | 0 (0.0%) | 0 (0.0%) |
| 16 and 17 Years | 0 (0.0%) | 0 (0.0%) |
| 18 to 24 Years | 0 (0.0%) | 0 (0.0%) |
| 25 to 34 Years | 2 (50.0%) | 7 (100.0%) |
| 35 to 44 Years | 2 (100.0%) | 2 (100.0%) |
| 45 to 54 Years | 13 (100.0%) | 3 (60.0%) |
| 55 to 64 Years | 11 (100.0%) | 12 (100.0%) |
| 65 to 74 Years | 0 (0.0%) | 0 (0.0%) |
| 75 Years and over | 12 (92.3%) | 13 (25.0%) |
| Total | 44 (93.6%) | 47 (53.4%) |
Income Below Poverty Among Married-Couple Families in Falcon
| Children | Above Poverty | Below Poverty |
| No Children | 6 (100.0%) | 0 (0.0%) |
| 1 or 2 Children | 11 (100.0%) | 0 (0.0%) |
| 3 or 4 Children | 0 (0.0%) | 0 (0.0%) |
| 5 or more Children | 0 (0.0%) | 0 (0.0%) |
| Total | 17 (100.0%) | 0 (0.0%) |
Income Below Poverty Among Single-Parent Households in Falcon
| Children | Single Father | Single Mother |
| No Children | 0 (0.0%) | 0 (0.0%) |
| 1 or 2 Children | 0 (0.0%) | 0 (0.0%) |
| 3 or 4 Children | 0 (0.0%) | 0 (0.0%) |
| 5 or more Children | 0 (0.0%) | 0 (0.0%) |
| Total | 0 (0.0%) | 0 (0.0%) |
Income Below Poverty Among Married-Couple vs Single-Parent Households in Falcon
| Children | Married-Couple Families | Single-Parent Households |
| No Children | 0 (0.0%) | 0 (0.0%) |
| 1 or 2 Children | 0 (0.0%) | 0 (0.0%) |
| 3 or 4 Children | 0 (0.0%) | 0 (0.0%) |
| 5 or more Children | 0 (0.0%) | 0 (0.0%) |
| Total | 0 (0.0%) | 0 (0.0%) |
Race in Falcon
The most populous races in Falcon are White / Caucasian (150 | 80.6%), Two or more Races (21 | 11.3%), and Black / African American (15 | 8.1%).
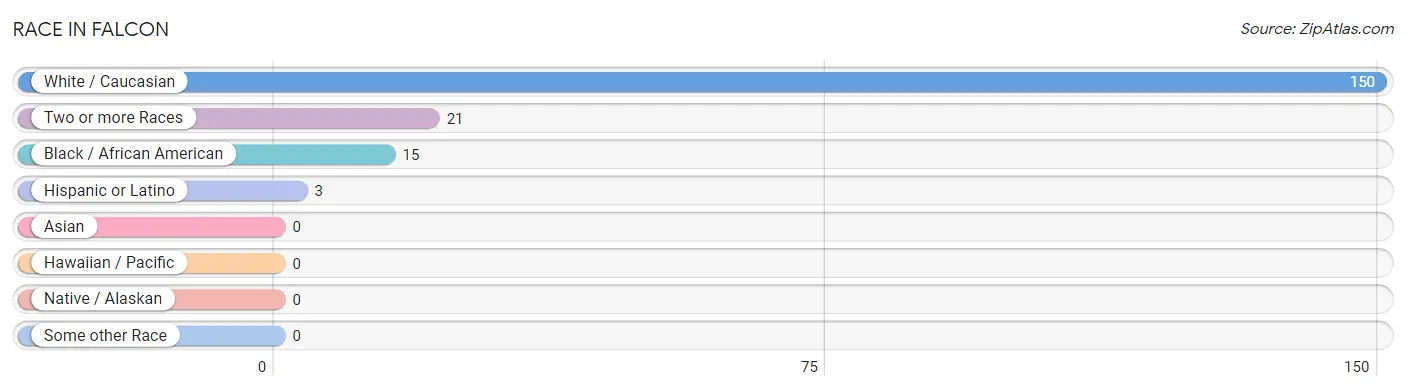
| Race | # Population | % Population |
| Asian | 0 | 0.0% |
| Black / African American | 15 | 8.1% |
| Hawaiian / Pacific | 0 | 0.0% |
| Hispanic or Latino | 3 | 1.6% |
| Native / Alaskan | 0 | 0.0% |
| White / Caucasian | 150 | 80.6% |
| Two or more Races | 21 | 11.3% |
| Some other Race | 0 | 0.0% |
| Total | 186 | 100.0% |
Ancestry in Falcon
The most populous ancestries reported in Falcon are Irish (36 | 19.4%), Lumbee (18 | 9.7%), American (16 | 8.6%), Canadian (14 | 7.5%), and English (13 | 7.0%), together accounting for 52.1% of all Falcon residents.
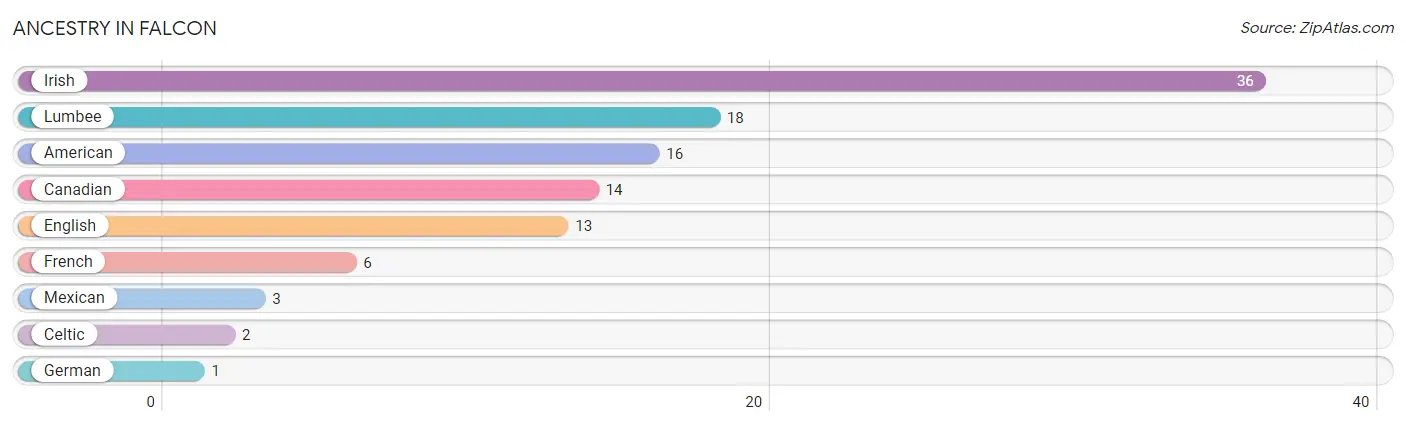
| Ancestry | # Population | % Population |
| American | 16 | 8.6% |
| Canadian | 14 | 7.5% |
| Celtic | 2 | 1.1% |
| English | 13 | 7.0% |
| French | 6 | 3.2% |
| German | 1 | 0.5% |
| Irish | 36 | 19.4% |
| Lumbee | 18 | 9.7% |
| Mexican | 3 | 1.6% | View All 9 Rows |
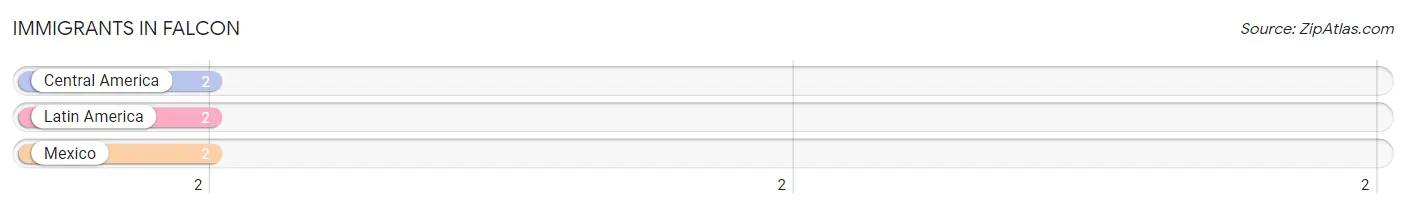
Immigrants in Falcon
The most numerous immigrant groups reported in Falcon came from Central America (2 | 1.1%), Latin America (2 | 1.1%), and Mexico (2 | 1.1%), together accounting for 3.2% of all Falcon residents.
| Immigration Origin | # Population | % Population |
| Central America | 2 | 1.1% |
| Latin America | 2 | 1.1% |
| Mexico | 2 | 1.1% | View All 3 Rows |
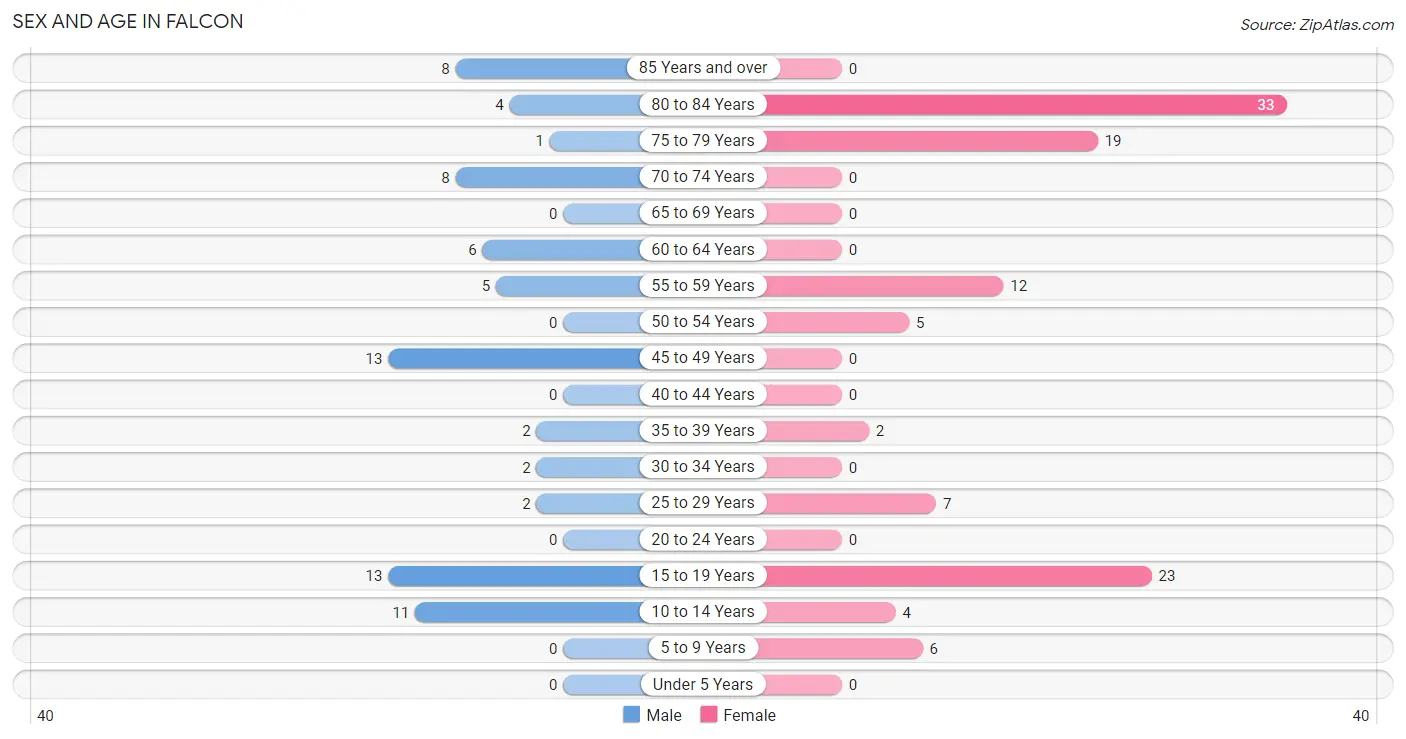
Sex and Age in Falcon
Sex and Age in Falcon
The most populous age groups in Falcon are 15 to 19 Years (13 | 17.3%) for men and 80 to 84 Years (33 | 29.7%) for women.
| Age Bracket | Male | Female |
| Under 5 Years | 0 (0.0%) | 0 (0.0%) |
| 5 to 9 Years | 0 (0.0%) | 6 (5.4%) |
| 10 to 14 Years | 11 (14.7%) | 4 (3.6%) |
| 15 to 19 Years | 13 (17.3%) | 23 (20.7%) |
| 20 to 24 Years | 0 (0.0%) | 0 (0.0%) |
| 25 to 29 Years | 2 (2.7%) | 7 (6.3%) |
| 30 to 34 Years | 2 (2.7%) | 0 (0.0%) |
| 35 to 39 Years | 2 (2.7%) | 2 (1.8%) |
| 40 to 44 Years | 0 (0.0%) | 0 (0.0%) |
| 45 to 49 Years | 13 (17.3%) | 0 (0.0%) |
| 50 to 54 Years | 0 (0.0%) | 5 (4.5%) |
| 55 to 59 Years | 5 (6.7%) | 12 (10.8%) |
| 60 to 64 Years | 6 (8.0%) | 0 (0.0%) |
| 65 to 69 Years | 0 (0.0%) | 0 (0.0%) |
| 70 to 74 Years | 8 (10.7%) | 0 (0.0%) |
| 75 to 79 Years | 1 (1.3%) | 19 (17.1%) |
| 80 to 84 Years | 4 (5.3%) | 33 (29.7%) |
| 85 Years and over | 8 (10.7%) | 0 (0.0%) |
| Total | 75 (100.0%) | 111 (100.0%) |
Families and Households in Falcon
Median Family Size in Falcon
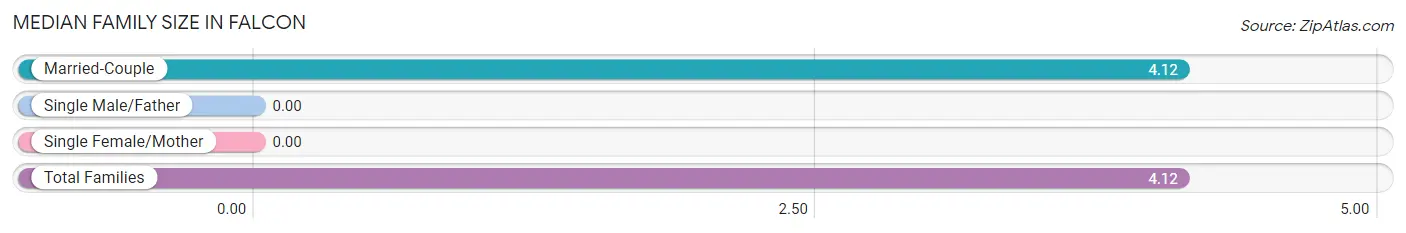
| Family Type | # Families | Family Size |
| Married-Couple | 17 (100.0%) | 4.12 |
| Single Male/Father | 0 (0.0%) | - |
| Single Female/Mother | 0 (0.0%) | - |
| Total Families | 17 (100.0%) | 4.12 |
Median Household Size in Falcon
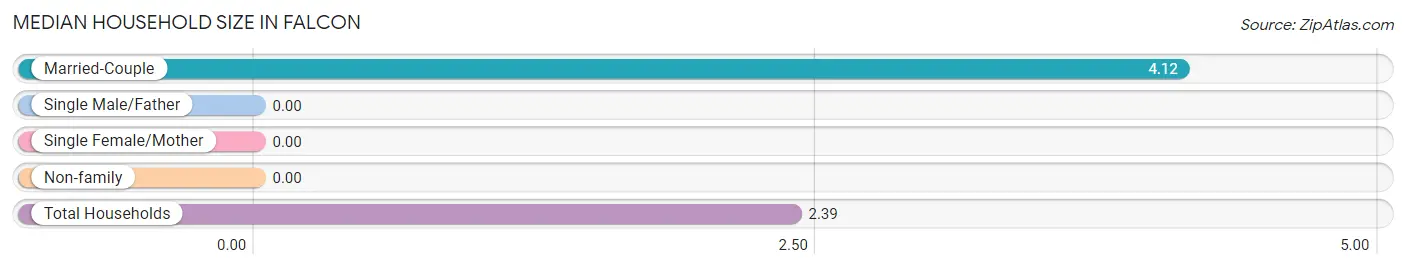
| Household Type | # Households | Household Size |
| Married-Couple | 17 (44.7%) | 4.12 |
| Single Male/Father | 0 (0.0%) | - |
| Single Female/Mother | 0 (0.0%) | - |
| Non-family | 21 (55.3%) | - |
| Total Households | 38 (100.0%) | 2.39 |
Household Size by Marriage Status in Falcon
Out of a total of 38 households in Falcon, 17 (44.7%) are family households, while 21 (55.3%) are nonfamily households. The most numerous type of family households are 2-person households, comprising 6, and the most common type of nonfamily households are 1-person households, comprising 21.
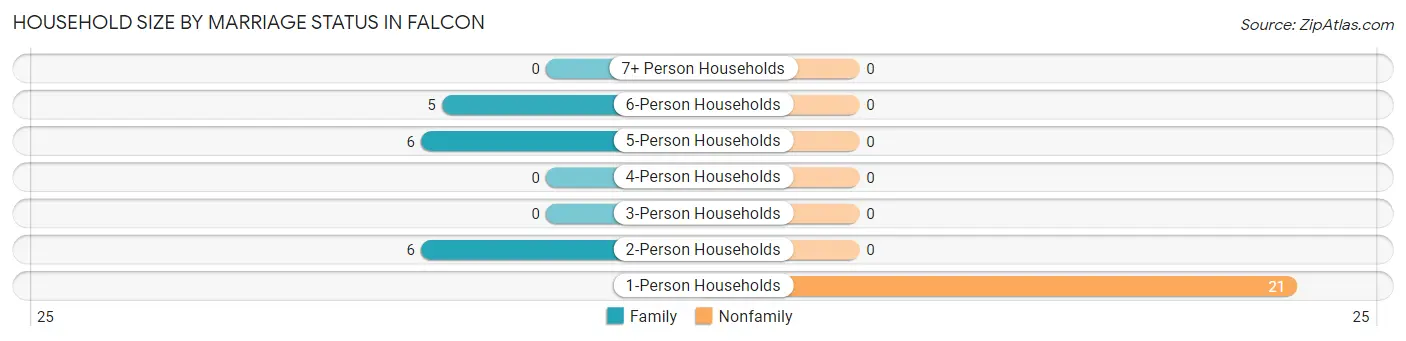
| Household Size | Family Households | Nonfamily Households |
| 1-Person Households | - | 21 (55.3%) |
| 2-Person Households | 6 (15.8%) | 0 (0.0%) |
| 3-Person Households | 0 (0.0%) | 0 (0.0%) |
| 4-Person Households | 0 (0.0%) | 0 (0.0%) |
| 5-Person Households | 6 (15.8%) | 0 (0.0%) |
| 6-Person Households | 5 (13.2%) | 0 (0.0%) |
| 7+ Person Households | 0 (0.0%) | 0 (0.0%) |
| Total | 17 (44.7%) | 21 (55.3%) |
Female Fertility in Falcon
Fertility by Age in Falcon
| Age Bracket | Women with Births | Births / 1,000 Women |
| 15 to 19 years | 0 (0.0%) | 0.0 |
| 20 to 34 years | 0 (0.0%) | 0.0 |
| 35 to 50 years | 0 (0.0%) | 0.0 |
| Total | 0 (0.0%) | 0.0 |
Fertility by Age by Marriage Status in Falcon
| Age Bracket | Married | Unmarried |
| 15 to 19 years | 0 (0.0%) | 0 (0.0%) |
| 20 to 34 years | 0 (0.0%) | 0 (0.0%) |
| 35 to 50 years | 0 (0.0%) | 0 (0.0%) |
| Total | 0 (0.0%) | 0 (0.0%) |
Fertility by Education in Falcon
| Educational Attainment | Women with Births | Births / 1,000 Women |
| Less than High School | 0 (0.0%) | 0.0 |
| High School Diploma | 0 (0.0%) | 0.0 |
| College or Associate's Degree | 0 (0.0%) | 0.0 |
| Bachelor's Degree | 0 (0.0%) | 0.0 |
| Graduate Degree | 0 (0.0%) | 0.0 |
| Total | 0 (0.0%) | 0.0 |
Fertility by Education by Marriage Status in Falcon
| Educational Attainment | Married | Unmarried |
| Less than High School | 0 (0.0%) | 0 (0.0%) |
| High School Diploma | 0 (0.0%) | 0 (0.0%) |
| College or Associate's Degree | 0 (0.0%) | 0 (0.0%) |
| Bachelor's Degree | 0 (0.0%) | 0 (0.0%) |
| Graduate Degree | 0 (0.0%) | 0 (0.0%) |
| Total | 0 (0.0%) | 0 (0.0%) |
Employment Characteristics in Falcon
Employment by Class of Employer in Falcon
Among the 56 employed individuals in Falcon, private company employees (29 | 51.8%), state government employees (11 | 19.6%), and self-employed (not incorporated) (7 | 12.5%) make up the most common classes of employment.
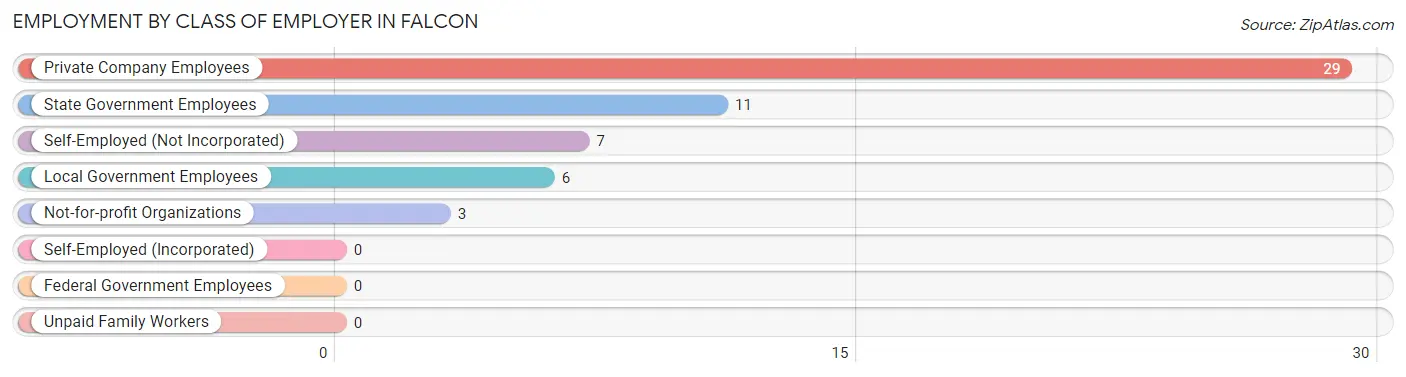
| Employer Class | # Employees | % Employees |
| Private Company Employees | 29 | 51.8% |
| Self-Employed (Incorporated) | 0 | 0.0% |
| Self-Employed (Not Incorporated) | 7 | 12.5% |
| Not-for-profit Organizations | 3 | 5.4% |
| Local Government Employees | 6 | 10.7% |
| State Government Employees | 11 | 19.6% |
| Federal Government Employees | 0 | 0.0% |
| Unpaid Family Workers | 0 | 0.0% |
| Total | 56 | 100.0% |
Employment Status by Age in Falcon
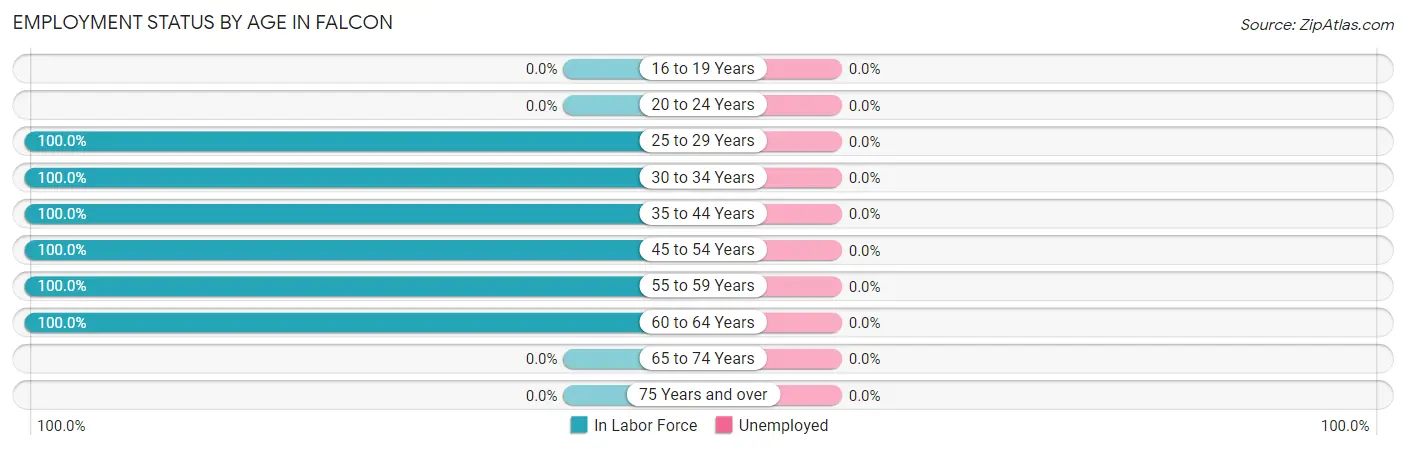
| Age Bracket | In Labor Force | Unemployed |
| 16 to 19 Years | 0 (0.0%) | 0 (0.0%) |
| 20 to 24 Years | 0 (0.0%) | 0 (0.0%) |
| 25 to 29 Years | 9 (100.0%) | 0 (0.0%) |
| 30 to 34 Years | 2 (100.0%) | 0 (0.0%) |
| 35 to 44 Years | 4 (100.0%) | 0 (0.0%) |
| 45 to 54 Years | 18 (100.0%) | 0 (0.0%) |
| 55 to 59 Years | 17 (100.0%) | 0 (0.0%) |
| 60 to 64 Years | 6 (100.0%) | 0 (0.0%) |
| 65 to 74 Years | 0 (0.0%) | 0 (0.0%) |
| 75 Years and over | 0 (0.0%) | 0 (0.0%) |
| Total | 56 (33.9%) | 0 (0.0%) |
Employment Status by Educational Attainment in Falcon
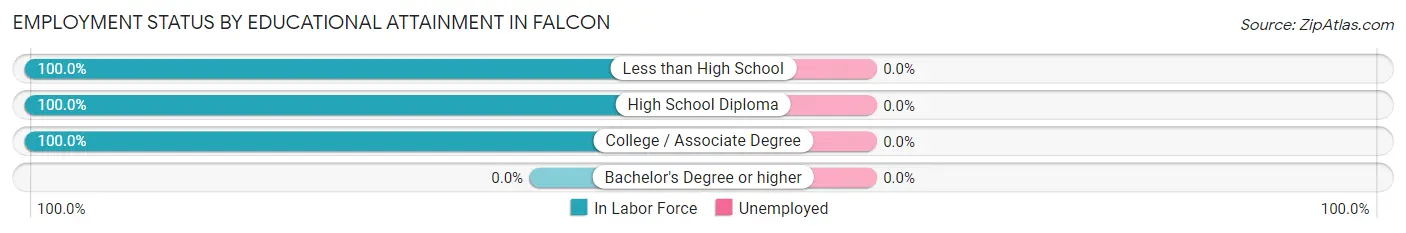
| Educational Attainment | In Labor Force | Unemployed |
| Less than High School | 2 (100.0%) | 0 (0.0%) |
| High School Diploma | 31 (100.0%) | 0 (0.0%) |
| College / Associate Degree | 23 (100.0%) | 0 (0.0%) |
| Bachelor's Degree or higher | 0 (0.0%) | 0 (0.0%) |
| Total | 56 (100.0%) | 0 (0.0%) |
Employment Occupations by Sex in Falcon
Management, Business, Science and Arts Occupations
The most common Management, Business, Science and Arts occupations in Falcon are Management (16 | 28.6%), and Health Diagnosing & Treating (7 | 12.5%).
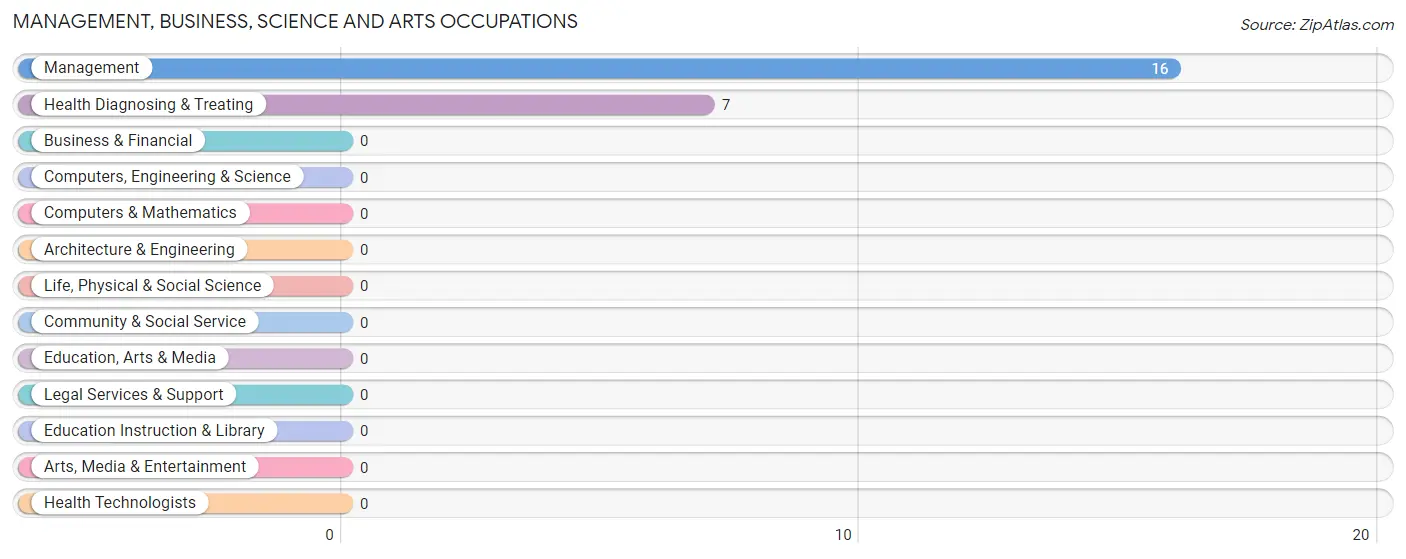
Management, Business, Science and Arts Occupations by Sex
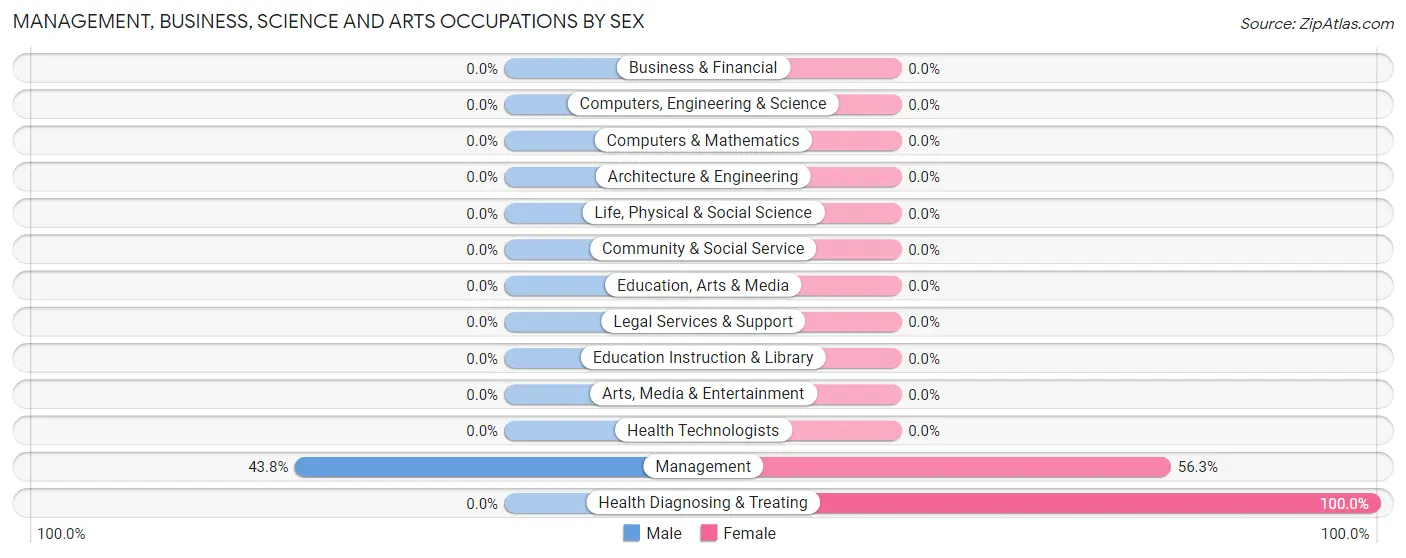
| Occupation | Male | Female |
| Management | 7 (43.8%) | 9 (56.2%) |
| Business & Financial | 0 (0.0%) | 0 (0.0%) |
| Computers, Engineering & Science | 0 (0.0%) | 0 (0.0%) |
| Computers & Mathematics | 0 (0.0%) | 0 (0.0%) |
| Architecture & Engineering | 0 (0.0%) | 0 (0.0%) |
| Life, Physical & Social Science | 0 (0.0%) | 0 (0.0%) |
| Community & Social Service | 0 (0.0%) | 0 (0.0%) |
| Education, Arts & Media | 0 (0.0%) | 0 (0.0%) |
| Legal Services & Support | 0 (0.0%) | 0 (0.0%) |
| Education Instruction & Library | 0 (0.0%) | 0 (0.0%) |
| Arts, Media & Entertainment | 0 (0.0%) | 0 (0.0%) |
| Health Diagnosing & Treating | 0 (0.0%) | 7 (100.0%) |
| Health Technologists | 0 (0.0%) | 0 (0.0%) |
| Total (Category) | 7 (30.4%) | 16 (69.6%) |
| Total (Overall) | 30 (53.6%) | 26 (46.4%) |
Services Occupations
The most common Services occupations in Falcon are Personal Care & Service (8 | 14.3%), Security & Protection (6 | 10.7%), and Law Enforcement (6 | 10.7%).
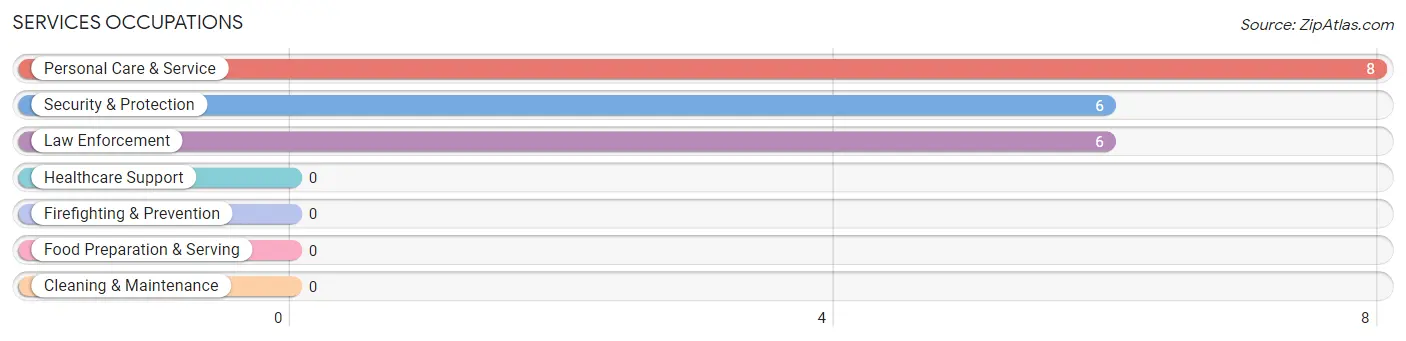
Services Occupations by Sex
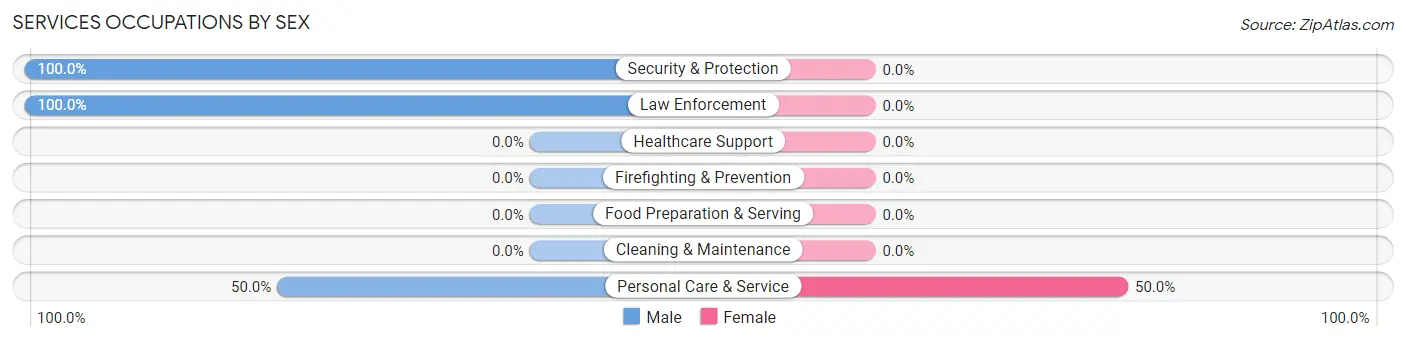
| Occupation | Male | Female |
| Healthcare Support | 0 (0.0%) | 0 (0.0%) |
| Security & Protection | 6 (100.0%) | 0 (0.0%) |
| Firefighting & Prevention | 0 (0.0%) | 0 (0.0%) |
| Law Enforcement | 6 (100.0%) | 0 (0.0%) |
| Food Preparation & Serving | 0 (0.0%) | 0 (0.0%) |
| Cleaning & Maintenance | 0 (0.0%) | 0 (0.0%) |
| Personal Care & Service | 4 (50.0%) | 4 (50.0%) |
| Total (Category) | 10 (71.4%) | 4 (28.6%) |
| Total (Overall) | 30 (53.6%) | 26 (46.4%) |
Sales and Office Occupations
The most common Sales and Office occupations in Falcon are , and Office & Administration (6 | 10.7%).
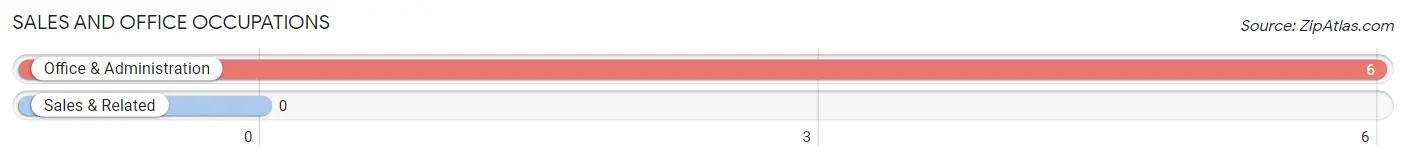
Sales and Office Occupations by Sex
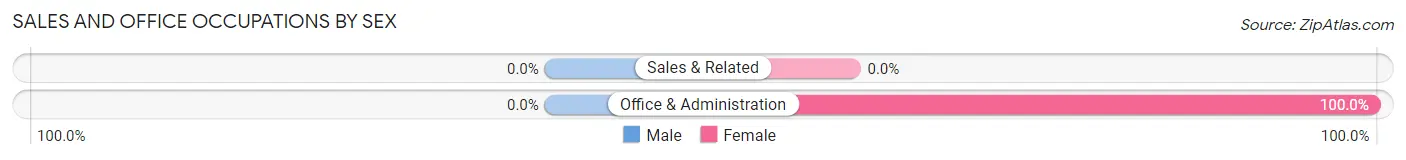
| Occupation | Male | Female |
| Sales & Related | 0 (0.0%) | 0 (0.0%) |
| Office & Administration | 0 (0.0%) | 6 (100.0%) |
| Total (Category) | 0 (0.0%) | 6 (100.0%) |
| Total (Overall) | 30 (53.6%) | 26 (46.4%) |
Natural Resources, Construction and Maintenance Occupations
The most common Natural Resources, Construction and Maintenance occupations in Falcon are Construction & Extraction (11 | 19.6%), and Farming, Fishing & Forestry (2 | 3.6%).
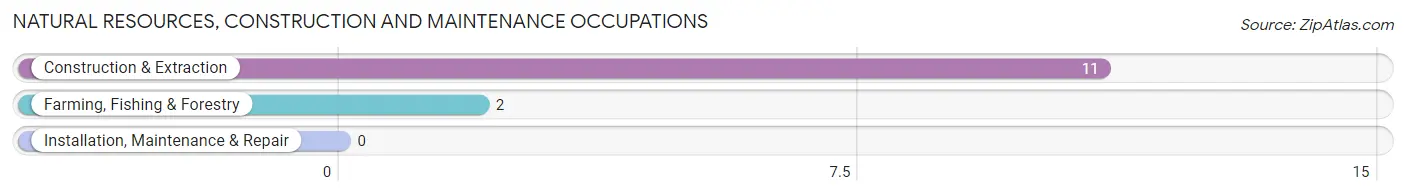
Natural Resources, Construction and Maintenance Occupations by Sex
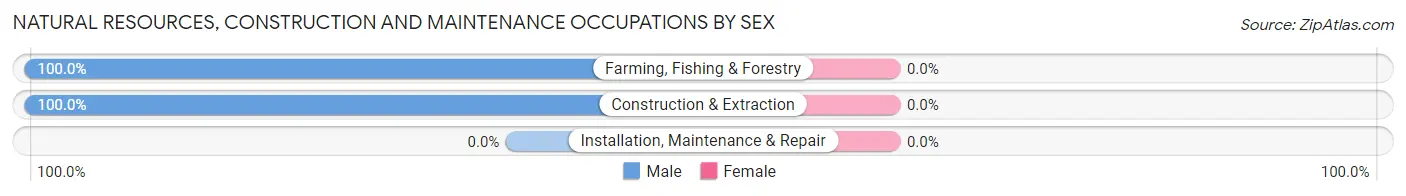
| Occupation | Male | Female |
| Farming, Fishing & Forestry | 2 (100.0%) | 0 (0.0%) |
| Construction & Extraction | 11 (100.0%) | 0 (0.0%) |
| Installation, Maintenance & Repair | 0 (0.0%) | 0 (0.0%) |
| Total (Category) | 13 (100.0%) | 0 (0.0%) |
| Total (Overall) | 30 (53.6%) | 26 (46.4%) |
Production, Transportation and Moving Occupations
Production, Transportation and Moving Occupations by Sex
| Occupation | Male | Female |
| Production | 0 (0.0%) | 0 (0.0%) |
| Transportation | 0 (0.0%) | 0 (0.0%) |
| Material Moving | 0 (0.0%) | 0 (0.0%) |
| Total (Category) | 0 (0.0%) | 0 (0.0%) |
| Total (Overall) | 30 (53.6%) | 26 (46.4%) |
Employment Industries by Sex in Falcon
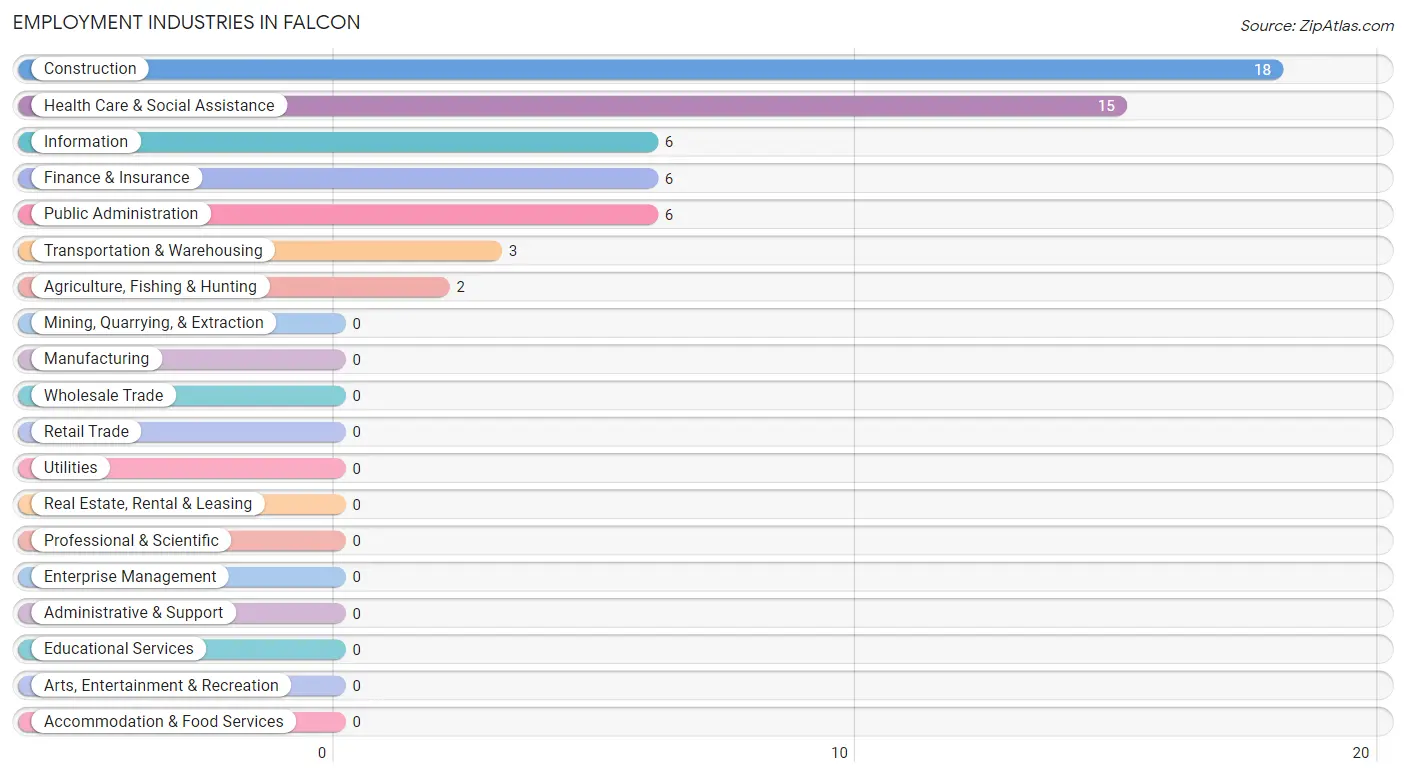
Employment Industries in Falcon
The major employment industries in Falcon include Construction (18 | 32.1%), Health Care & Social Assistance (15 | 26.8%), Information (6 | 10.7%), Finance & Insurance (6 | 10.7%), and Public Administration (6 | 10.7%).
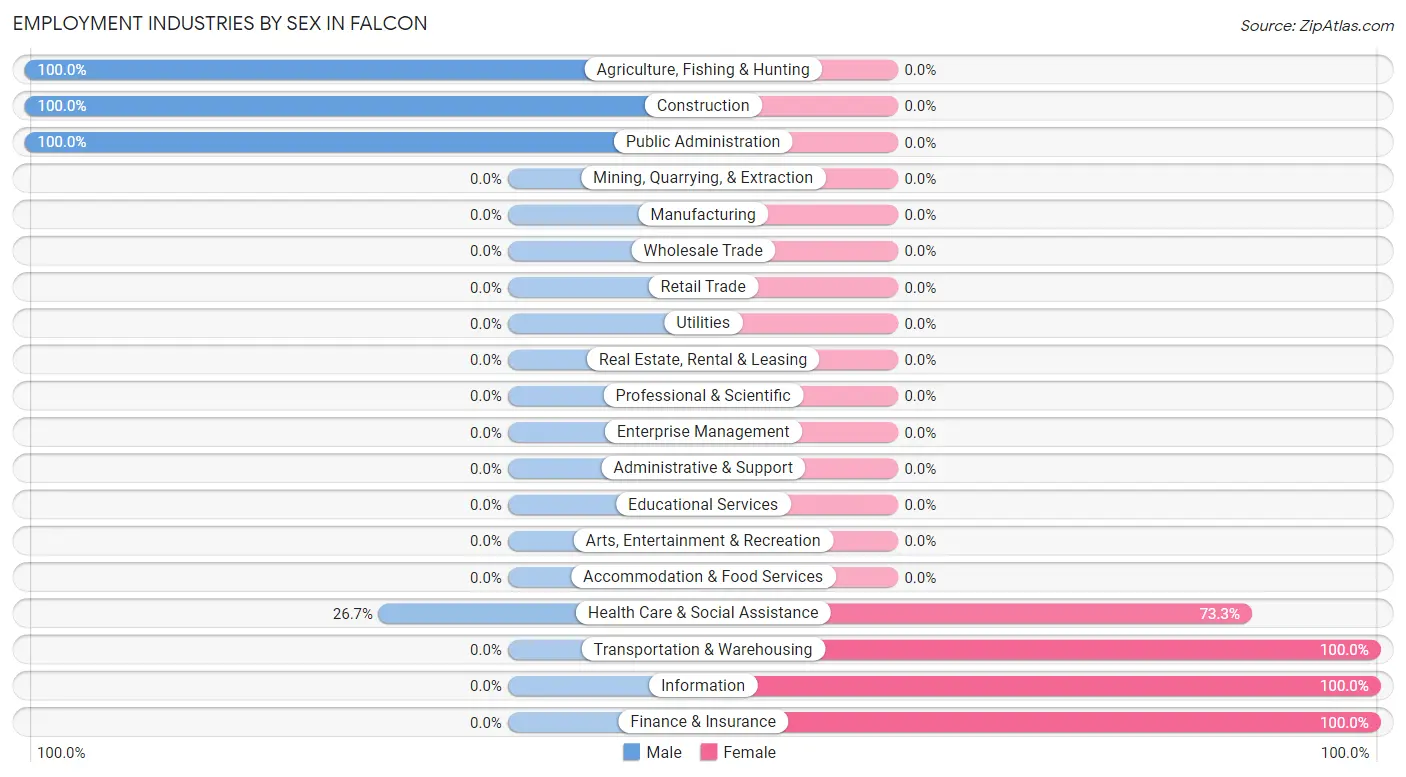
Employment Industries by Sex in Falcon
The Falcon industries that see more men than women are Agriculture, Fishing & Hunting (100.0%), Construction (100.0%), and Public Administration (100.0%), whereas the industries that tend to have a higher number of women are Transportation & Warehousing (100.0%), Information (100.0%), and Finance & Insurance (100.0%).
| Industry | Male | Female |
| Agriculture, Fishing & Hunting | 2 (100.0%) | 0 (0.0%) |
| Mining, Quarrying, & Extraction | 0 (0.0%) | 0 (0.0%) |
| Construction | 18 (100.0%) | 0 (0.0%) |
| Manufacturing | 0 (0.0%) | 0 (0.0%) |
| Wholesale Trade | 0 (0.0%) | 0 (0.0%) |
| Retail Trade | 0 (0.0%) | 0 (0.0%) |
| Transportation & Warehousing | 0 (0.0%) | 3 (100.0%) |
| Utilities | 0 (0.0%) | 0 (0.0%) |
| Information | 0 (0.0%) | 6 (100.0%) |
| Finance & Insurance | 0 (0.0%) | 6 (100.0%) |
| Real Estate, Rental & Leasing | 0 (0.0%) | 0 (0.0%) |
| Professional & Scientific | 0 (0.0%) | 0 (0.0%) |
| Enterprise Management | 0 (0.0%) | 0 (0.0%) |
| Administrative & Support | 0 (0.0%) | 0 (0.0%) |
| Educational Services | 0 (0.0%) | 0 (0.0%) |
| Health Care & Social Assistance | 4 (26.7%) | 11 (73.3%) |
| Arts, Entertainment & Recreation | 0 (0.0%) | 0 (0.0%) |
| Accommodation & Food Services | 0 (0.0%) | 0 (0.0%) |
| Public Administration | 6 (100.0%) | 0 (0.0%) |
| Total | 30 (53.6%) | 26 (46.4%) |
Education in Falcon
School Enrollment in Falcon
The most common levels of schooling among the 57 students in Falcon are high school (44 | 77.2%), middle school (7 | 12.3%), and elementary school (6 | 10.5%).
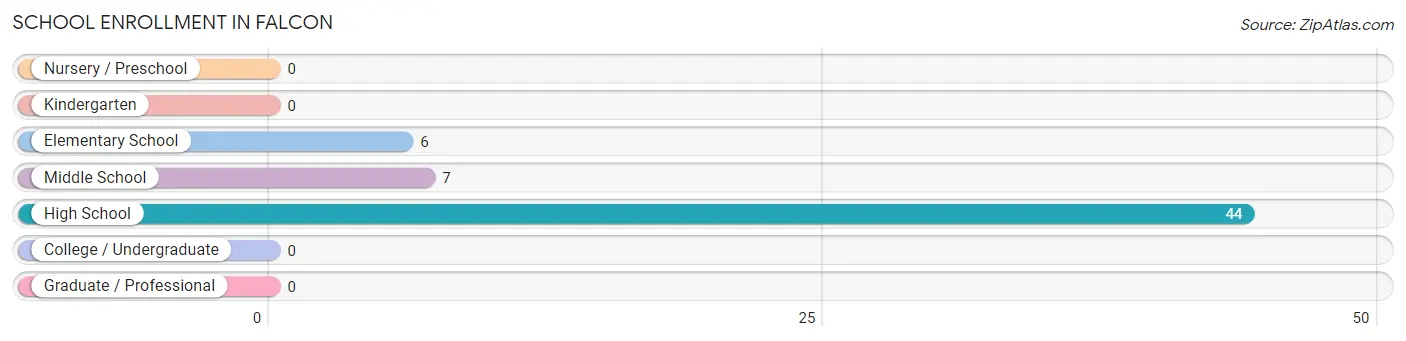
| School Level | # Students | % Students |
| Nursery / Preschool | 0 | 0.0% |
| Kindergarten | 0 | 0.0% |
| Elementary School | 6 | 10.5% |
| Middle School | 7 | 12.3% |
| High School | 44 | 77.2% |
| College / Undergraduate | 0 | 0.0% |
| Graduate / Professional | 0 | 0.0% |
| Total | 57 | 100.0% |
School Enrollment by Age by Funding Source in Falcon
Out of a total of 57 students who are enrolled in schools in Falcon, 17 (29.8%) attend a private institution, while the remaining 40 (70.2%) are enrolled in public schools. The age group of 5 to 9 year old has the highest likelihood of being enrolled in private schools, with 6 (100.0% in the age bracket) enrolled. Conversely, the age group of 18 to 19 year olds has the lowest likelihood of being enrolled in a private school, with 23 (100.0% in the age bracket) attending a public institution.
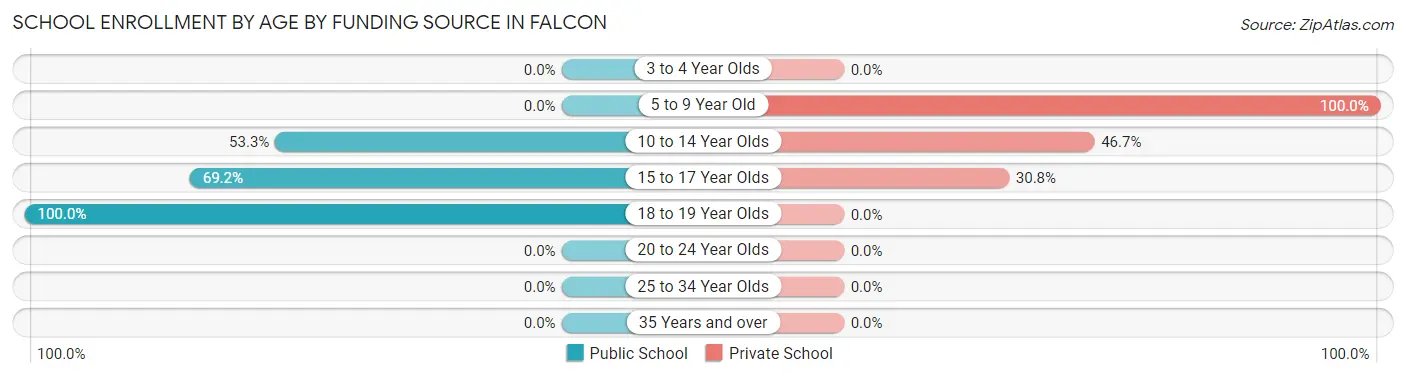
| Age Bracket | Public School | Private School |
| 3 to 4 Year Olds | 0 (0.0%) | 0 (0.0%) |
| 5 to 9 Year Old | 0 (0.0%) | 6 (100.0%) |
| 10 to 14 Year Olds | 8 (53.3%) | 7 (46.7%) |
| 15 to 17 Year Olds | 9 (69.2%) | 4 (30.8%) |
| 18 to 19 Year Olds | 23 (100.0%) | 0 (0.0%) |
| 20 to 24 Year Olds | 0 (0.0%) | 0 (0.0%) |
| 25 to 34 Year Olds | 0 (0.0%) | 0 (0.0%) |
| 35 Years and over | 0 (0.0%) | 0 (0.0%) |
| Total | 40 (70.2%) | 17 (29.8%) |
Educational Attainment by Field of Study in Falcon
Liberal arts & history (33 | 82.5%), and education (7 | 17.5%) are the most common fields of study among 40 individuals in Falcon who have obtained a bachelor's degree or higher.
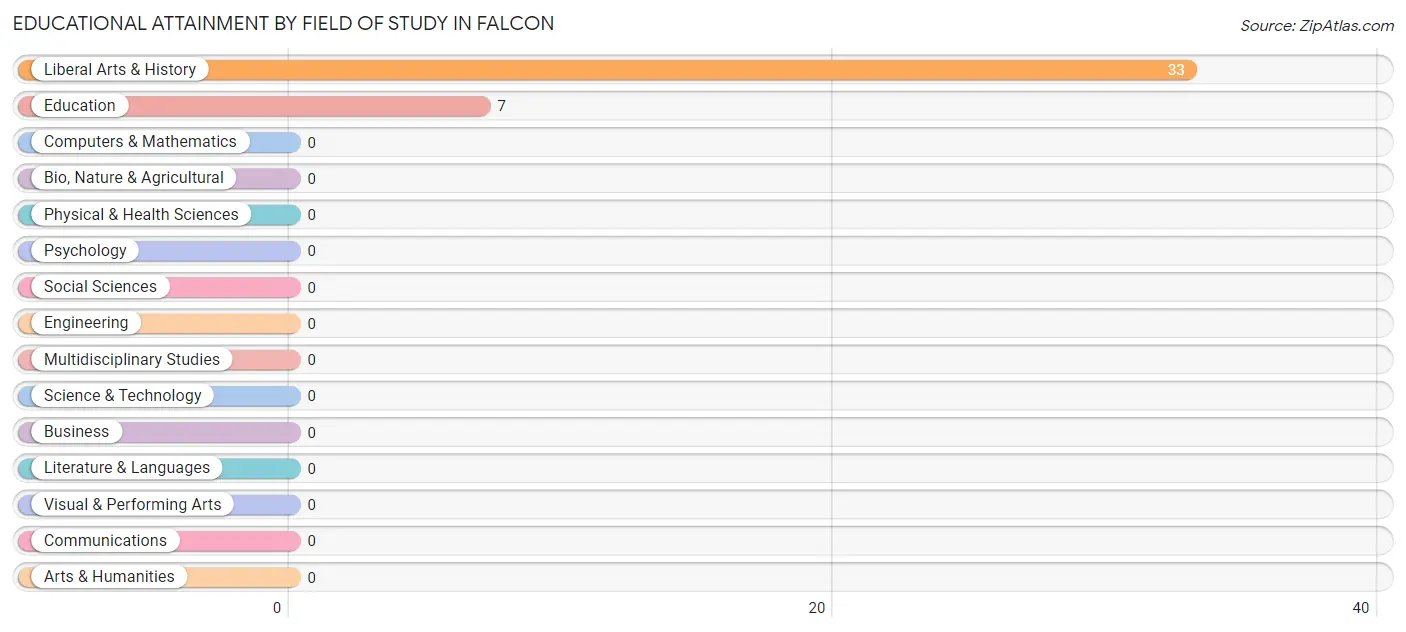
| Field of Study | # Graduates | % Graduates |
| Computers & Mathematics | 0 | 0.0% |
| Bio, Nature & Agricultural | 0 | 0.0% |
| Physical & Health Sciences | 0 | 0.0% |
| Psychology | 0 | 0.0% |
| Social Sciences | 0 | 0.0% |
| Engineering | 0 | 0.0% |
| Multidisciplinary Studies | 0 | 0.0% |
| Science & Technology | 0 | 0.0% |
| Business | 0 | 0.0% |
| Education | 7 | 17.5% |
| Literature & Languages | 0 | 0.0% |
| Liberal Arts & History | 33 | 82.5% |
| Visual & Performing Arts | 0 | 0.0% |
| Communications | 0 | 0.0% |
| Arts & Humanities | 0 | 0.0% |
| Total | 40 | 100.0% |
Transportation & Commute in Falcon
Vehicle Availability by Sex in Falcon
The most prevalent vehicle ownership categories in Falcon are males with 2 vehicles (13, accounting for 54.2%) and females with 2 vehicles (6, making up 59.1%).
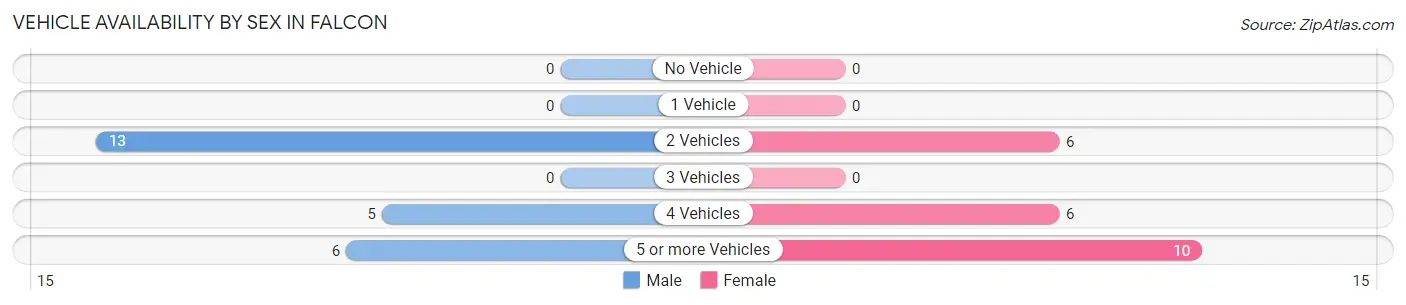
| Vehicles Available | Male | Female |
| No Vehicle | 0 (0.0%) | 0 (0.0%) |
| 1 Vehicle | 0 (0.0%) | 0 (0.0%) |
| 2 Vehicles | 13 (54.2%) | 6 (27.3%) |
| 3 Vehicles | 0 (0.0%) | 0 (0.0%) |
| 4 Vehicles | 5 (20.8%) | 6 (27.3%) |
| 5 or more Vehicles | 6 (25.0%) | 10 (45.5%) |
| Total | 24 (100.0%) | 22 (100.0%) |
Commute Time in Falcon
The most frequently occuring commute durations in Falcon are 60 to 89 minutes (12 commuters, 30.0%), 30 to 34 minutes (11 commuters, 27.5%), and 25 to 29 minutes (7 commuters, 17.5%).
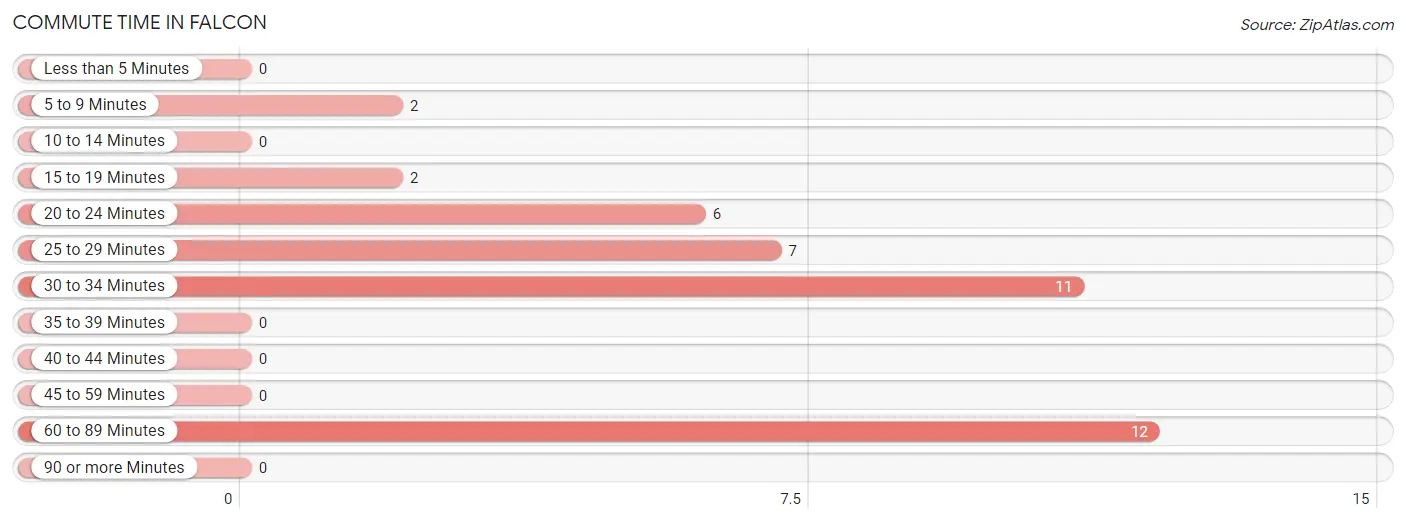
| Commute Time | # Commuters | % Commuters |
| Less than 5 Minutes | 0 | 0.0% |
| 5 to 9 Minutes | 2 | 5.0% |
| 10 to 14 Minutes | 0 | 0.0% |
| 15 to 19 Minutes | 2 | 5.0% |
| 20 to 24 Minutes | 6 | 15.0% |
| 25 to 29 Minutes | 7 | 17.5% |
| 30 to 34 Minutes | 11 | 27.5% |
| 35 to 39 Minutes | 0 | 0.0% |
| 40 to 44 Minutes | 0 | 0.0% |
| 45 to 59 Minutes | 0 | 0.0% |
| 60 to 89 Minutes | 12 | 30.0% |
| 90 or more Minutes | 0 | 0.0% |
Commute Time by Sex in Falcon
The most common commute times in Falcon are 30 to 34 minutes (7 commuters, 33.3%) for males and 25 to 29 minutes (7 commuters, 36.8%) for females.
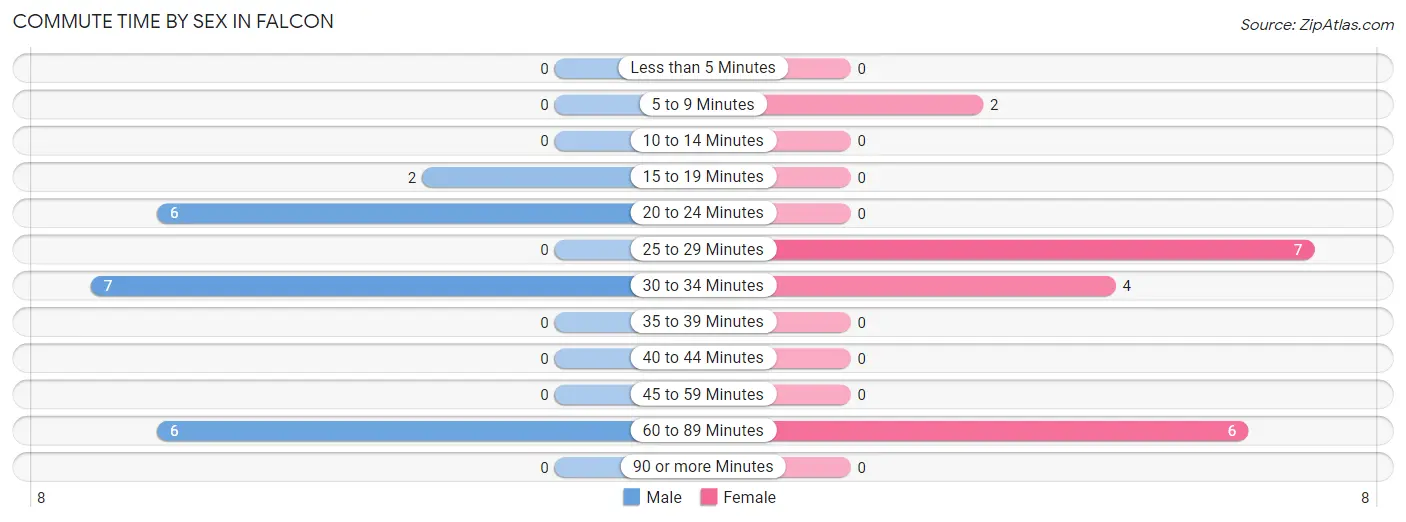
| Commute Time | Male | Female |
| Less than 5 Minutes | 0 (0.0%) | 0 (0.0%) |
| 5 to 9 Minutes | 0 (0.0%) | 2 (10.5%) |
| 10 to 14 Minutes | 0 (0.0%) | 0 (0.0%) |
| 15 to 19 Minutes | 2 (9.5%) | 0 (0.0%) |
| 20 to 24 Minutes | 6 (28.6%) | 0 (0.0%) |
| 25 to 29 Minutes | 0 (0.0%) | 7 (36.8%) |
| 30 to 34 Minutes | 7 (33.3%) | 4 (21.0%) |
| 35 to 39 Minutes | 0 (0.0%) | 0 (0.0%) |
| 40 to 44 Minutes | 0 (0.0%) | 0 (0.0%) |
| 45 to 59 Minutes | 0 (0.0%) | 0 (0.0%) |
| 60 to 89 Minutes | 6 (28.6%) | 6 (31.6%) |
| 90 or more Minutes | 0 (0.0%) | 0 (0.0%) |
Time of Departure to Work by Sex in Falcon
The most frequent times of departure to work in Falcon are 6:00 AM to 6:29 AM (7, 33.3%) for males and 12:00 PM to 3:59 PM (10, 52.6%) for females.
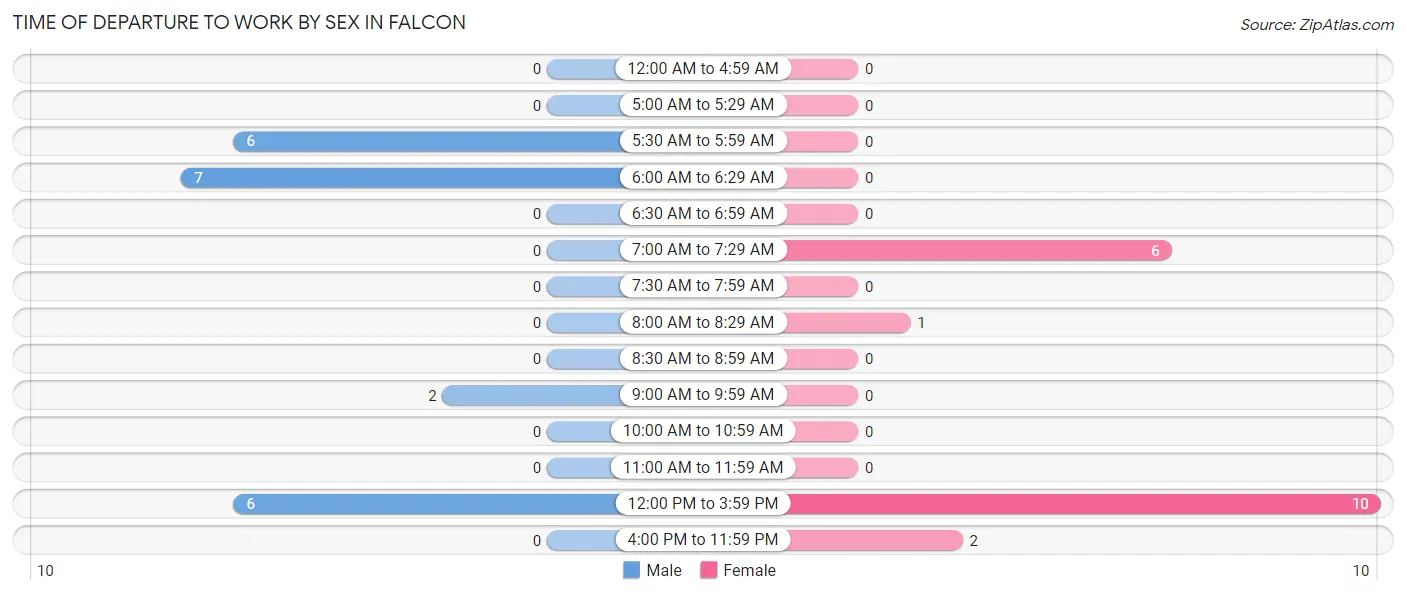
| Time of Departure | Male | Female |
| 12:00 AM to 4:59 AM | 0 (0.0%) | 0 (0.0%) |
| 5:00 AM to 5:29 AM | 0 (0.0%) | 0 (0.0%) |
| 5:30 AM to 5:59 AM | 6 (28.6%) | 0 (0.0%) |
| 6:00 AM to 6:29 AM | 7 (33.3%) | 0 (0.0%) |
| 6:30 AM to 6:59 AM | 0 (0.0%) | 0 (0.0%) |
| 7:00 AM to 7:29 AM | 0 (0.0%) | 6 (31.6%) |
| 7:30 AM to 7:59 AM | 0 (0.0%) | 0 (0.0%) |
| 8:00 AM to 8:29 AM | 0 (0.0%) | 1 (5.3%) |
| 8:30 AM to 8:59 AM | 0 (0.0%) | 0 (0.0%) |
| 9:00 AM to 9:59 AM | 2 (9.5%) | 0 (0.0%) |
| 10:00 AM to 10:59 AM | 0 (0.0%) | 0 (0.0%) |
| 11:00 AM to 11:59 AM | 0 (0.0%) | 0 (0.0%) |
| 12:00 PM to 3:59 PM | 6 (28.6%) | 10 (52.6%) |
| 4:00 PM to 11:59 PM | 0 (0.0%) | 2 (10.5%) |
| Total | 21 (100.0%) | 19 (100.0%) |
Housing Occupancy in Falcon
Occupancy by Ownership in Falcon
Of the total 38 dwellings in Falcon, owner-occupied units account for 38 (100.0%), while renter-occupied units make up 0 (0.0%).
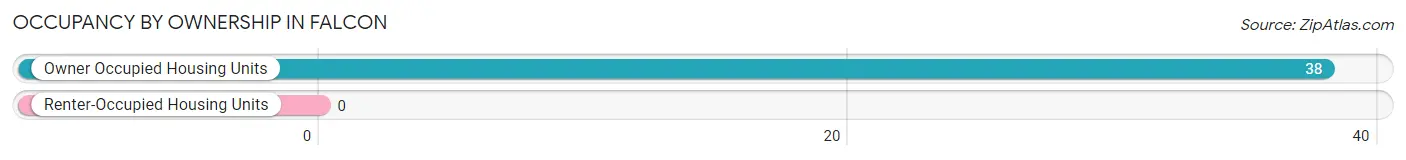
| Occupancy | # Housing Units | % Housing Units |
| Owner Occupied Housing Units | 38 | 100.0% |
| Renter-Occupied Housing Units | 0 | 0.0% |
| Total Occupied Housing Units | 38 | 100.0% |
Occupancy by Household Size in Falcon
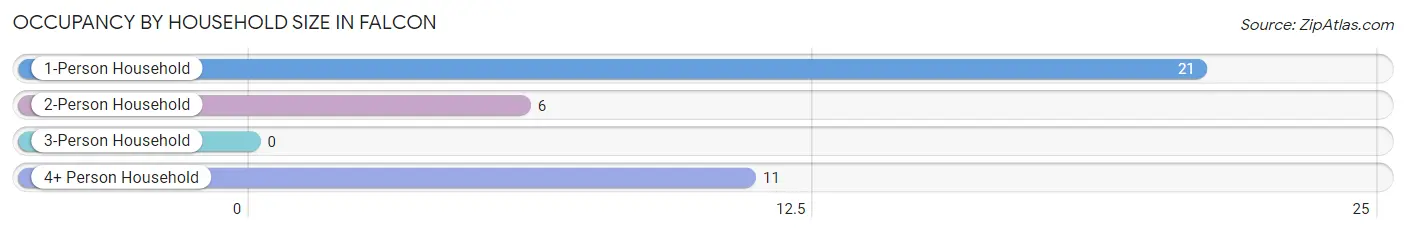
| Household Size | # Housing Units | % Housing Units |
| 1-Person Household | 21 | 55.3% |
| 2-Person Household | 6 | 15.8% |
| 3-Person Household | 0 | 0.0% |
| 4+ Person Household | 11 | 28.9% |
| Total Housing Units | 38 | 100.0% |
Occupancy by Ownership by Household Size in Falcon
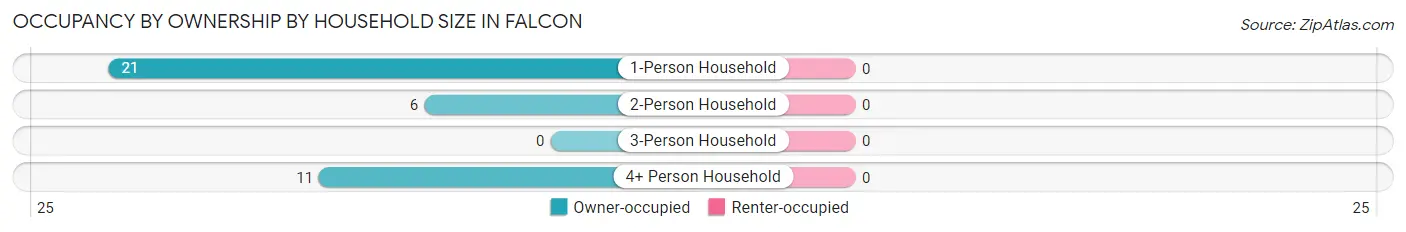
| Household Size | Owner-occupied | Renter-occupied |
| 1-Person Household | 21 (100.0%) | 0 (0.0%) |
| 2-Person Household | 6 (100.0%) | 0 (0.0%) |
| 3-Person Household | 0 (0.0%) | 0 (0.0%) |
| 4+ Person Household | 11 (100.0%) | 0 (0.0%) |
| Total Housing Units | 38 (100.0%) | 0 (0.0%) |
Occupancy by Educational Attainment in Falcon
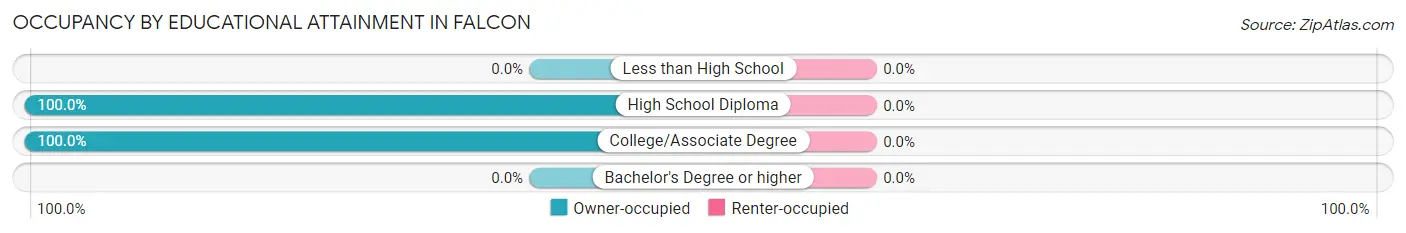
| Household Size | Owner-occupied | Renter-occupied |
| Less than High School | 0 (0.0%) | 0 (0.0%) |
| High School Diploma | 30 (100.0%) | 0 (0.0%) |
| College/Associate Degree | 8 (100.0%) | 0 (0.0%) |
| Bachelor's Degree or higher | 0 (0.0%) | 0 (0.0%) |
Occupancy by Age of Householder in Falcon
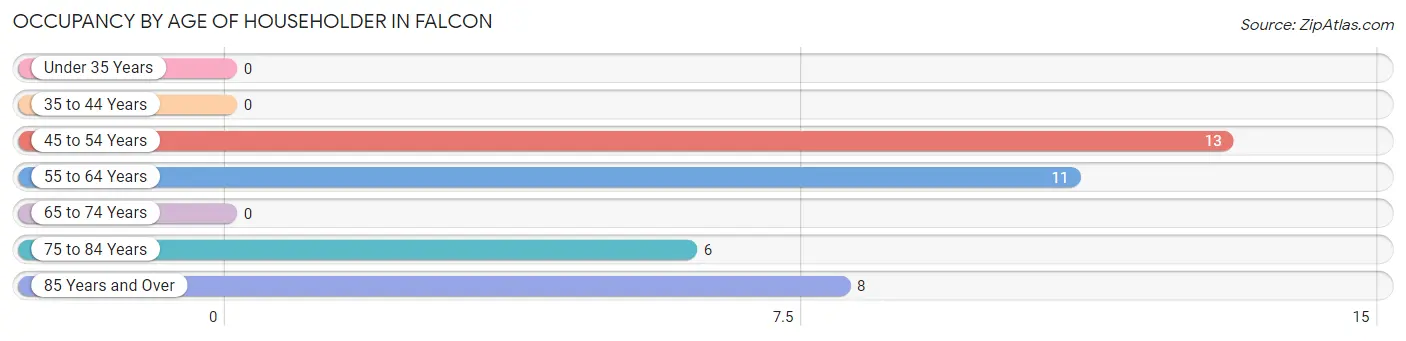
| Age Bracket | # Households | % Households |
| Under 35 Years | 0 | 0.0% |
| 35 to 44 Years | 0 | 0.0% |
| 45 to 54 Years | 13 | 34.2% |
| 55 to 64 Years | 11 | 28.9% |
| 65 to 74 Years | 0 | 0.0% |
| 75 to 84 Years | 6 | 15.8% |
| 85 Years and Over | 8 | 21.0% |
| Total | 38 | 100.0% |
Housing Finances in Falcon
Median Income by Occupancy in Falcon
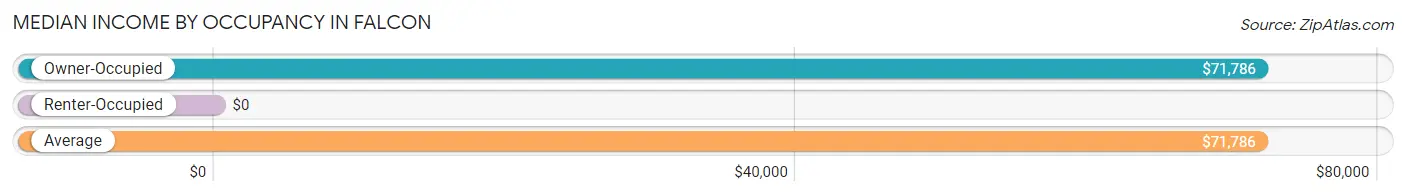
| Occupancy Type | # Households | Median Income |
| Owner-Occupied | 38 (100.0%) | $71,786 |
| Renter-Occupied | 0 (0.0%) | $0 |
| Average | 38 (100.0%) | $71,786 |
Occupancy by Householder Income Bracket in Falcon
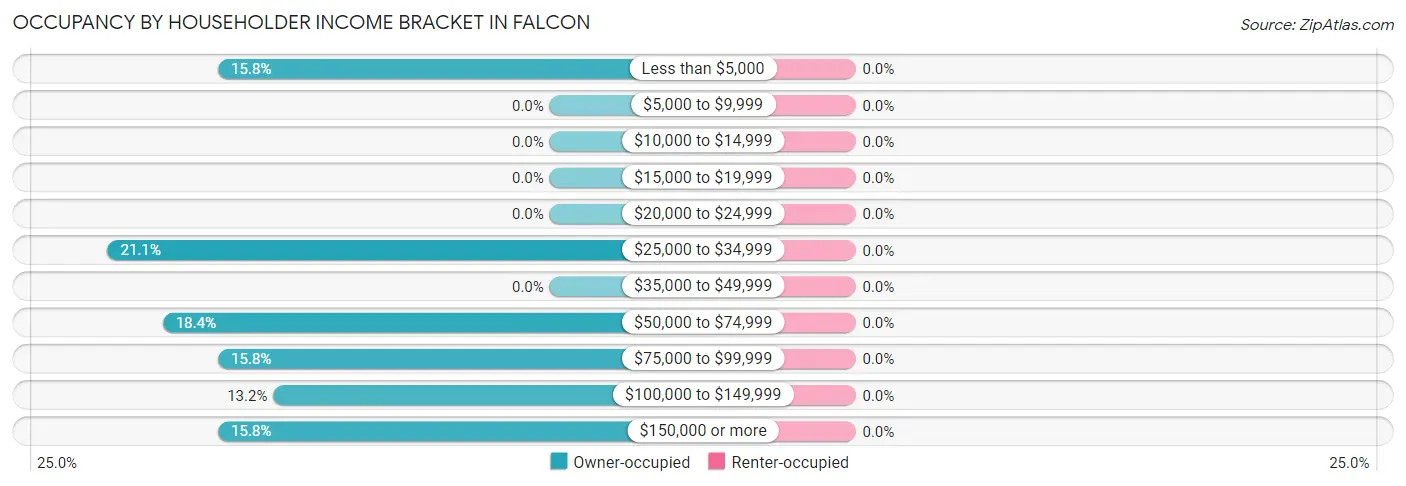
| Income Bracket | Owner-occupied | Renter-occupied |
| Less than $5,000 | 6 (15.8%) | 0 (0.0%) |
| $5,000 to $9,999 | 0 (0.0%) | 0 (0.0%) |
| $10,000 to $14,999 | 0 (0.0%) | 0 (0.0%) |
| $15,000 to $19,999 | 0 (0.0%) | 0 (0.0%) |
| $20,000 to $24,999 | 0 (0.0%) | 0 (0.0%) |
| $25,000 to $34,999 | 8 (21.0%) | 0 (0.0%) |
| $35,000 to $49,999 | 0 (0.0%) | 0 (0.0%) |
| $50,000 to $74,999 | 7 (18.4%) | 0 (0.0%) |
| $75,000 to $99,999 | 6 (15.8%) | 0 (0.0%) |
| $100,000 to $149,999 | 5 (13.2%) | 0 (0.0%) |
| $150,000 or more | 6 (15.8%) | 0 (0.0%) |
| Total | 38 (100.0%) | 0 (0.0%) |
Monthly Housing Cost Tiers in Falcon
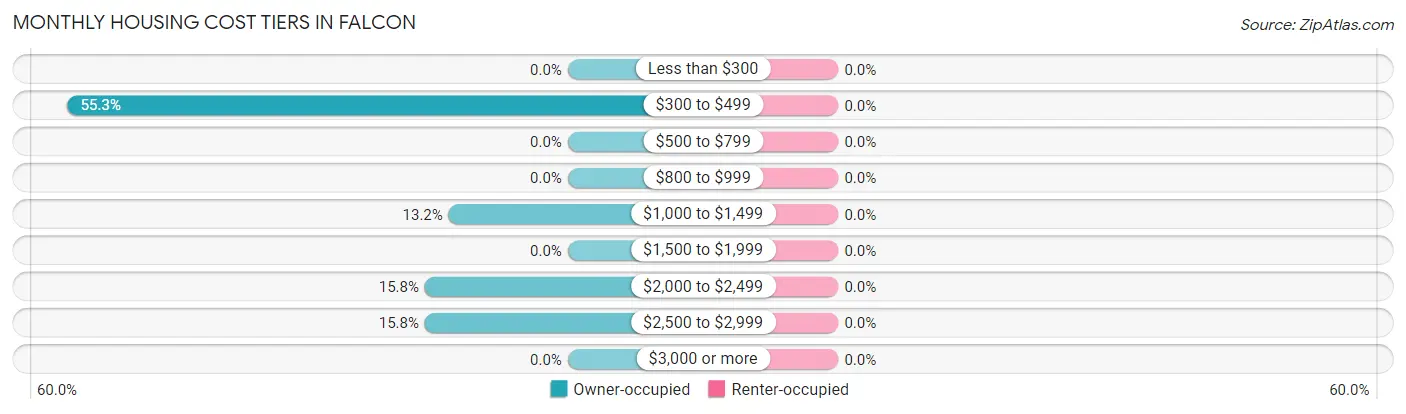
| Monthly Cost | Owner-occupied | Renter-occupied |
| Less than $300 | 0 (0.0%) | 0 (0.0%) |
| $300 to $499 | 21 (55.3%) | 0 (0.0%) |
| $500 to $799 | 0 (0.0%) | 0 (0.0%) |
| $800 to $999 | 0 (0.0%) | 0 (0.0%) |
| $1,000 to $1,499 | 5 (13.2%) | 0 (0.0%) |
| $1,500 to $1,999 | 0 (0.0%) | 0 (0.0%) |
| $2,000 to $2,499 | 6 (15.8%) | 0 (0.0%) |
| $2,500 to $2,999 | 6 (15.8%) | 0 (0.0%) |
| $3,000 or more | 0 (0.0%) | 0 (0.0%) |
| Total | 38 (100.0%) | 0 (0.0%) |
Physical Housing Characteristics in Falcon
Housing Structures in Falcon
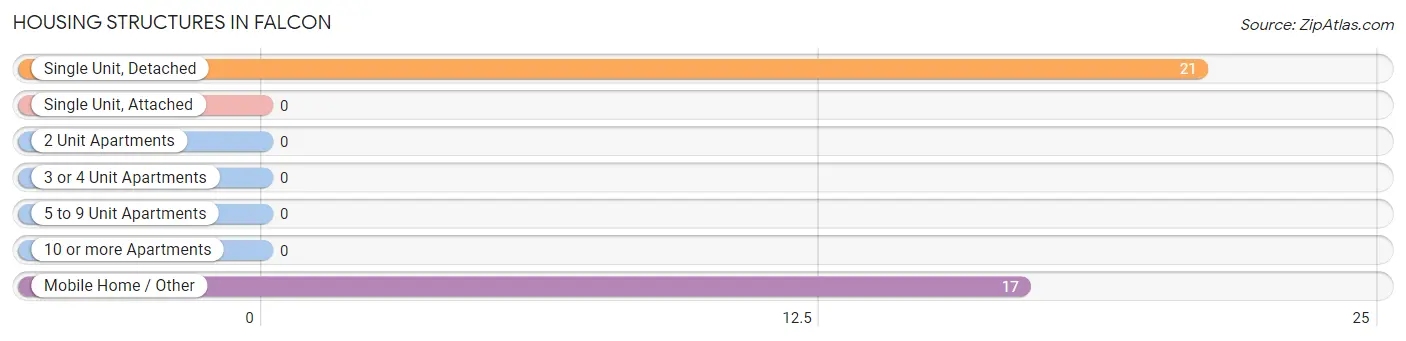
| Structure Type | # Housing Units | % Housing Units |
| Single Unit, Detached | 21 | 55.3% |
| Single Unit, Attached | 0 | 0.0% |
| 2 Unit Apartments | 0 | 0.0% |
| 3 or 4 Unit Apartments | 0 | 0.0% |
| 5 to 9 Unit Apartments | 0 | 0.0% |
| 10 or more Apartments | 0 | 0.0% |
| Mobile Home / Other | 17 | 44.7% |
| Total | 38 | 100.0% |
Housing Structures by Occupancy in Falcon
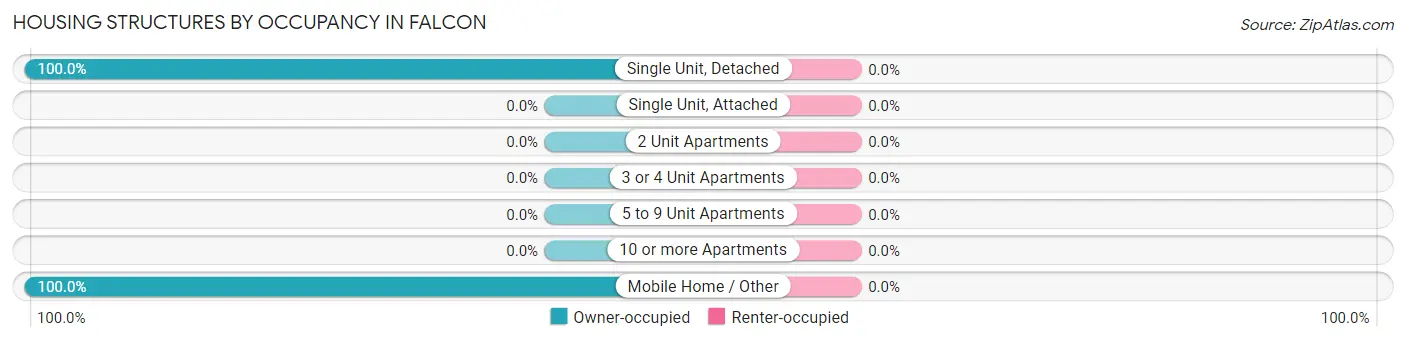
| Structure Type | Owner-occupied | Renter-occupied |
| Single Unit, Detached | 21 (100.0%) | 0 (0.0%) |
| Single Unit, Attached | 0 (0.0%) | 0 (0.0%) |
| 2 Unit Apartments | 0 (0.0%) | 0 (0.0%) |
| 3 or 4 Unit Apartments | 0 (0.0%) | 0 (0.0%) |
| 5 to 9 Unit Apartments | 0 (0.0%) | 0 (0.0%) |
| 10 or more Apartments | 0 (0.0%) | 0 (0.0%) |
| Mobile Home / Other | 17 (100.0%) | 0 (0.0%) |
| Total | 38 (100.0%) | 0 (0.0%) |
Housing Structures by Number of Rooms in Falcon
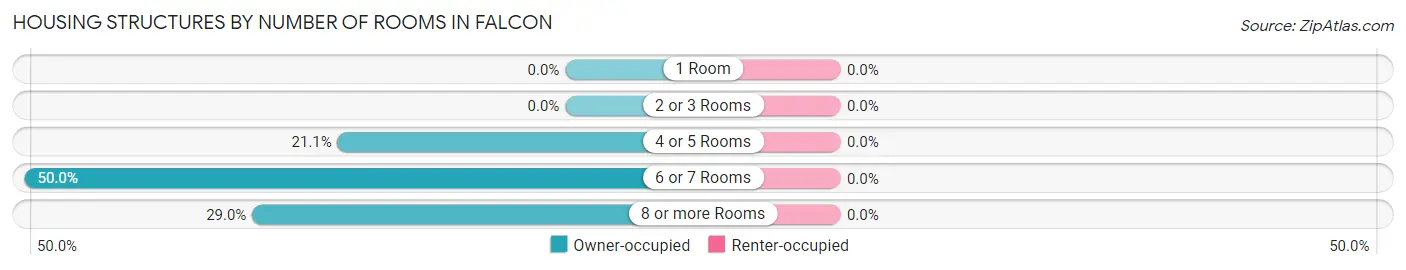
| Number of Rooms | Owner-occupied | Renter-occupied |
| 1 Room | 0 (0.0%) | 0 (0.0%) |
| 2 or 3 Rooms | 0 (0.0%) | 0 (0.0%) |
| 4 or 5 Rooms | 8 (21.0%) | 0 (0.0%) |
| 6 or 7 Rooms | 19 (50.0%) | 0 (0.0%) |
| 8 or more Rooms | 11 (28.9%) | 0 (0.0%) |
| Total | 38 (100.0%) | 0 (0.0%) |
Housing Structure by Heating Type in Falcon
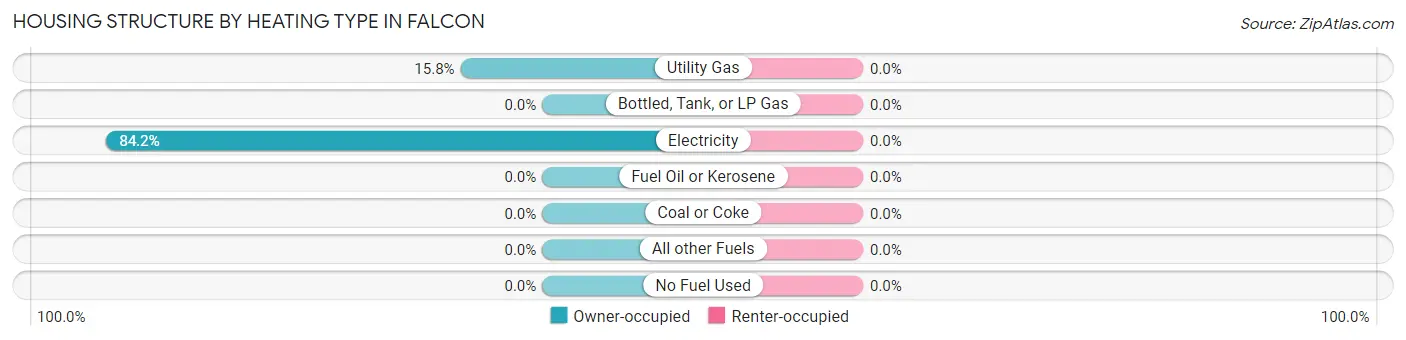
| Heating Type | Owner-occupied | Renter-occupied |
| Utility Gas | 6 (15.8%) | 0 (0.0%) |
| Bottled, Tank, or LP Gas | 0 (0.0%) | 0 (0.0%) |
| Electricity | 32 (84.2%) | 0 (0.0%) |
| Fuel Oil or Kerosene | 0 (0.0%) | 0 (0.0%) |
| Coal or Coke | 0 (0.0%) | 0 (0.0%) |
| All other Fuels | 0 (0.0%) | 0 (0.0%) |
| No Fuel Used | 0 (0.0%) | 0 (0.0%) |
| Total | 38 (100.0%) | 0 (0.0%) |
Household Vehicle Usage in Falcon
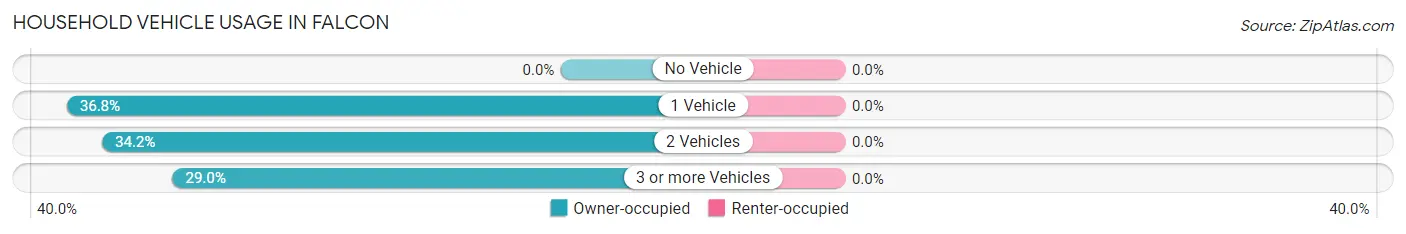
| Vehicles per Household | Owner-occupied | Renter-occupied |
| No Vehicle | 0 (0.0%) | 0 (0.0%) |
| 1 Vehicle | 14 (36.8%) | 0 (0.0%) |
| 2 Vehicles | 13 (34.2%) | 0 (0.0%) |
| 3 or more Vehicles | 11 (28.9%) | 0 (0.0%) |
| Total | 38 (100.0%) | 0 (0.0%) |
Real Estate & Mortgages in Falcon
Real Estate and Mortgage Overview in Falcon
| Characteristic | Without Mortgage | With Mortgage |
| Housing Units | 21 | 17 |
| Median Property Value | - | - |
| Median Household Income | - | - |
| Monthly Housing Costs | $338 | $0 |
| Real Estate Taxes | - | - |
Property Value by Mortgage Status in Falcon
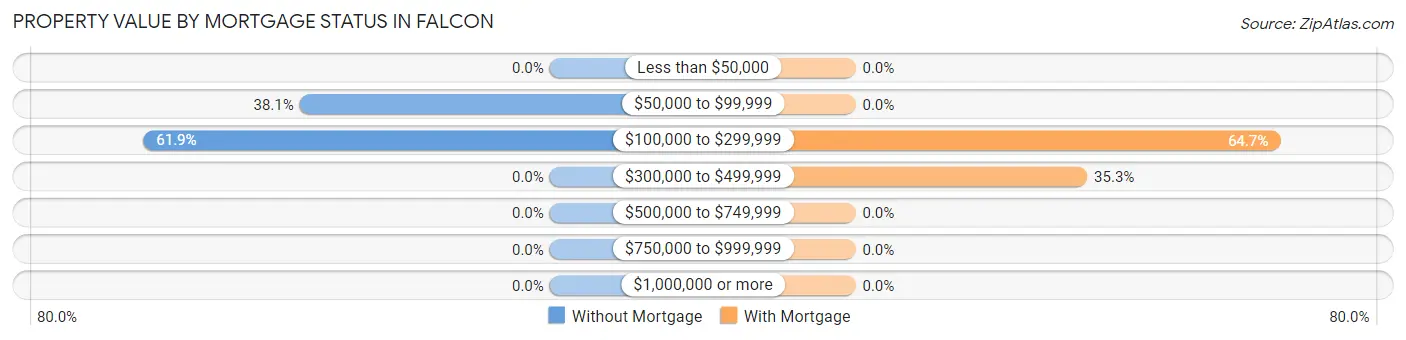
| Property Value | Without Mortgage | With Mortgage |
| Less than $50,000 | 0 (0.0%) | 0 (0.0%) |
| $50,000 to $99,999 | 8 (38.1%) | 0 (0.0%) |
| $100,000 to $299,999 | 13 (61.9%) | 11 (64.7%) |
| $300,000 to $499,999 | 0 (0.0%) | 6 (35.3%) |
| $500,000 to $749,999 | 0 (0.0%) | 0 (0.0%) |
| $750,000 to $999,999 | 0 (0.0%) | 0 (0.0%) |
| $1,000,000 or more | 0 (0.0%) | 0 (0.0%) |
| Total | 21 (100.0%) | 17 (100.0%) |
Household Income by Mortgage Status in Falcon
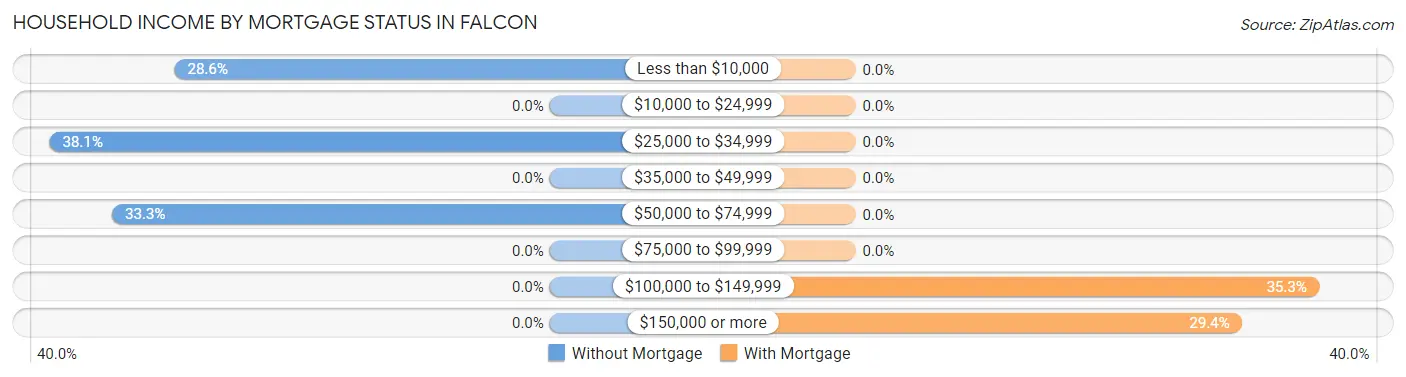
| Household Income | Without Mortgage | With Mortgage |
| Less than $10,000 | 6 (28.6%) | 0 (0.0%) |
| $10,000 to $24,999 | 0 (0.0%) | 0 (0.0%) |
| $25,000 to $34,999 | 8 (38.1%) | 0 (0.0%) |
| $35,000 to $49,999 | 0 (0.0%) | 0 (0.0%) |
| $50,000 to $74,999 | 7 (33.3%) | 0 (0.0%) |
| $75,000 to $99,999 | 0 (0.0%) | 0 (0.0%) |
| $100,000 to $149,999 | 0 (0.0%) | 6 (35.3%) |
| $150,000 or more | 0 (0.0%) | 5 (29.4%) |
| Total | 21 (100.0%) | 17 (100.0%) |
Property Value to Household Income Ratio in Falcon
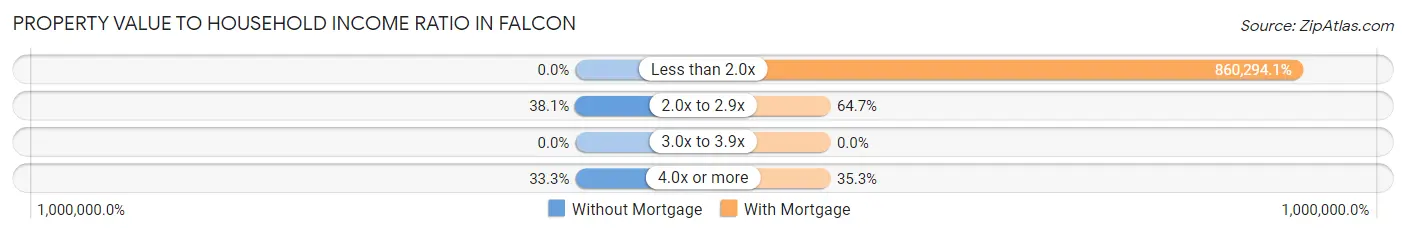
| Value-to-Income Ratio | Without Mortgage | With Mortgage |
| Less than 2.0x | 0 (0.0%) | 146,250 (860,294.1%) |
| 2.0x to 2.9x | 8 (38.1%) | 11 (64.7%) |
| 3.0x to 3.9x | 0 (0.0%) | 0 (0.0%) |
| 4.0x or more | 7 (33.3%) | 6 (35.3%) |
| Total | 21 (100.0%) | 17 (100.0%) |
Real Estate Taxes by Mortgage Status in Falcon
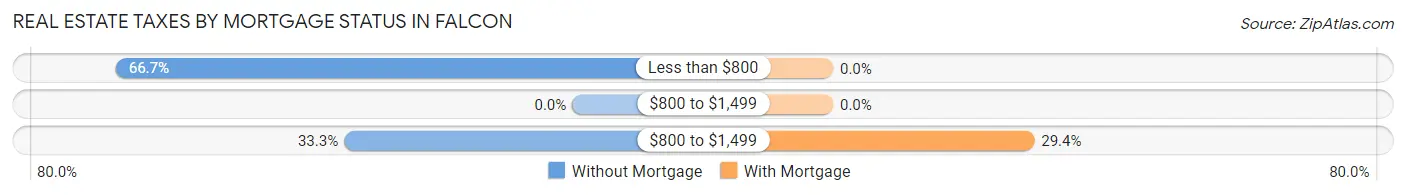
| Property Taxes | Without Mortgage | With Mortgage |
| Less than $800 | 14 (66.7%) | 0 (0.0%) |
| $800 to $1,499 | 0 (0.0%) | 0 (0.0%) |
| $800 to $1,499 | 7 (33.3%) | 5 (29.4%) |
| Total | 21 (100.0%) | 17 (100.0%) |
Health & Disability in Falcon
Health Insurance Coverage by Age in Falcon
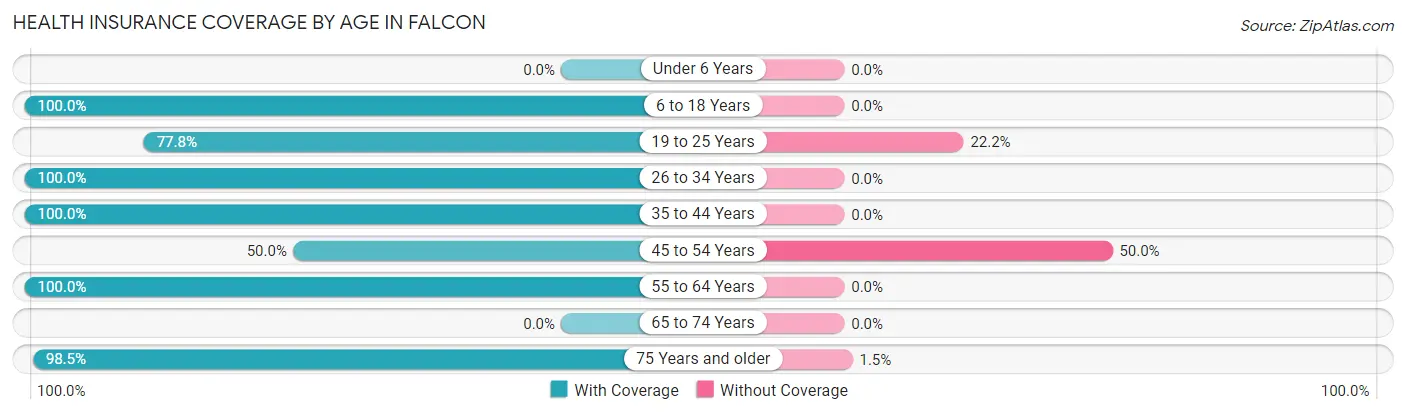
| Age Bracket | With Coverage | Without Coverage |
| Under 6 Years | 0 (0.0%) | 0 (0.0%) |
| 6 to 18 Years | 14 (100.0%) | 0 (0.0%) |
| 19 to 25 Years | 7 (77.8%) | 2 (22.2%) |
| 26 to 34 Years | 2 (100.0%) | 0 (0.0%) |
| 35 to 44 Years | 4 (100.0%) | 0 (0.0%) |
| 45 to 54 Years | 9 (50.0%) | 9 (50.0%) |
| 55 to 64 Years | 23 (100.0%) | 0 (0.0%) |
| 65 to 74 Years | 0 (0.0%) | 0 (0.0%) |
| 75 Years and older | 64 (98.5%) | 1 (1.5%) |
| Total | 123 (91.1%) | 12 (8.9%) |
Health Insurance Coverage by Citizenship Status in Falcon
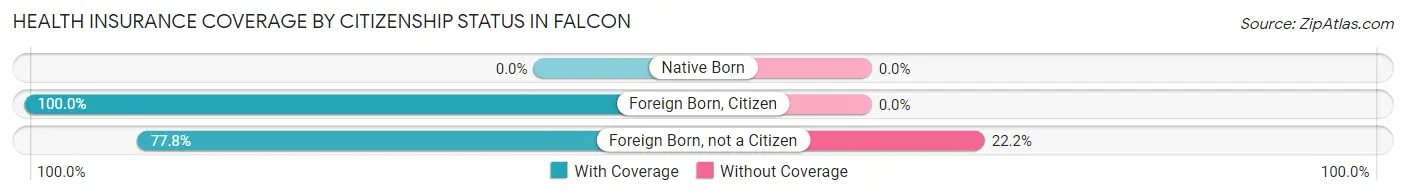
| Citizenship Status | With Coverage | Without Coverage |
| Native Born | 0 (0.0%) | 0 (0.0%) |
| Foreign Born, Citizen | 14 (100.0%) | 0 (0.0%) |
| Foreign Born, not a Citizen | 7 (77.8%) | 2 (22.2%) |
Health Insurance Coverage by Household Income in Falcon
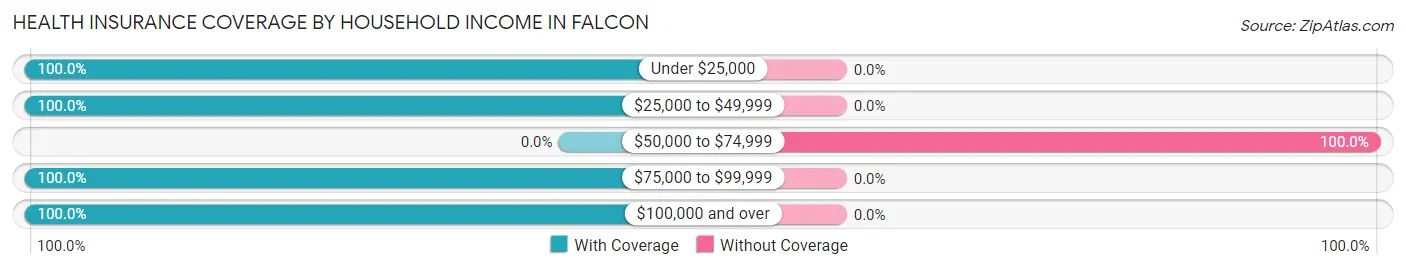
| Household Income | With Coverage | Without Coverage |
| Under $25,000 | 6 (100.0%) | 0 (0.0%) |
| $25,000 to $49,999 | 8 (100.0%) | 0 (0.0%) |
| $50,000 to $74,999 | 0 (0.0%) | 7 (100.0%) |
| $75,000 to $99,999 | 12 (100.0%) | 0 (0.0%) |
| $100,000 and over | 58 (100.0%) | 0 (0.0%) |
Public vs Private Health Insurance Coverage by Age in Falcon
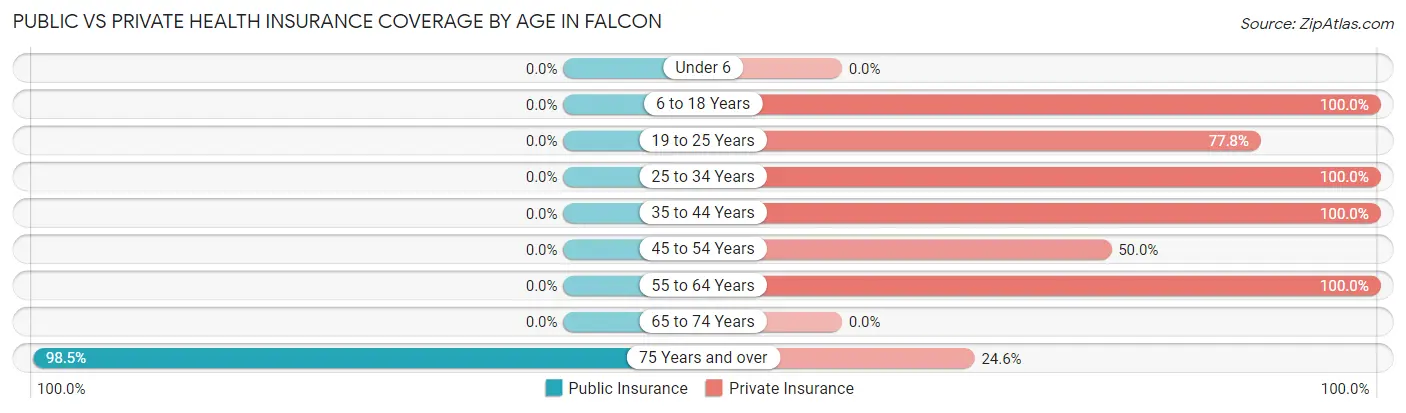
| Age Bracket | Public Insurance | Private Insurance |
| Under 6 | 0 (0.0%) | 0 (0.0%) |
| 6 to 18 Years | 0 (0.0%) | 14 (100.0%) |
| 19 to 25 Years | 0 (0.0%) | 7 (77.8%) |
| 25 to 34 Years | 0 (0.0%) | 2 (100.0%) |
| 35 to 44 Years | 0 (0.0%) | 4 (100.0%) |
| 45 to 54 Years | 0 (0.0%) | 9 (50.0%) |
| 55 to 64 Years | 0 (0.0%) | 23 (100.0%) |
| 65 to 74 Years | 0 (0.0%) | 0 (0.0%) |
| 75 Years and over | 64 (98.5%) | 16 (24.6%) |
| Total | 64 (47.4%) | 75 (55.6%) |
Disability Status by Sex by Age in Falcon
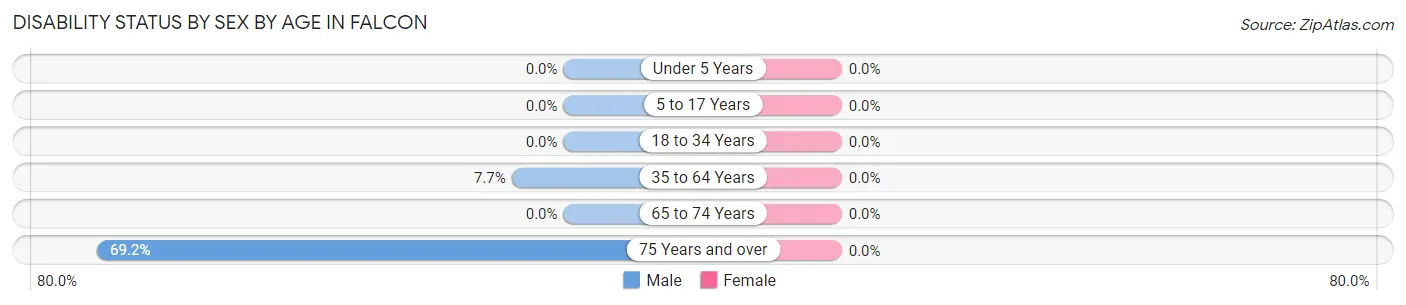
| Age Bracket | Male | Female |
| Under 5 Years | 0 (0.0%) | 0 (0.0%) |
| 5 to 17 Years | 0 (0.0%) | 0 (0.0%) |
| 18 to 34 Years | 0 (0.0%) | 0 (0.0%) |
| 35 to 64 Years | 2 (7.7%) | 0 (0.0%) |
| 65 to 74 Years | 0 (0.0%) | 0 (0.0%) |
| 75 Years and over | 9 (69.2%) | 0 (0.0%) |
Disability Class by Sex by Age in Falcon
Disability Class: Hearing Difficulty
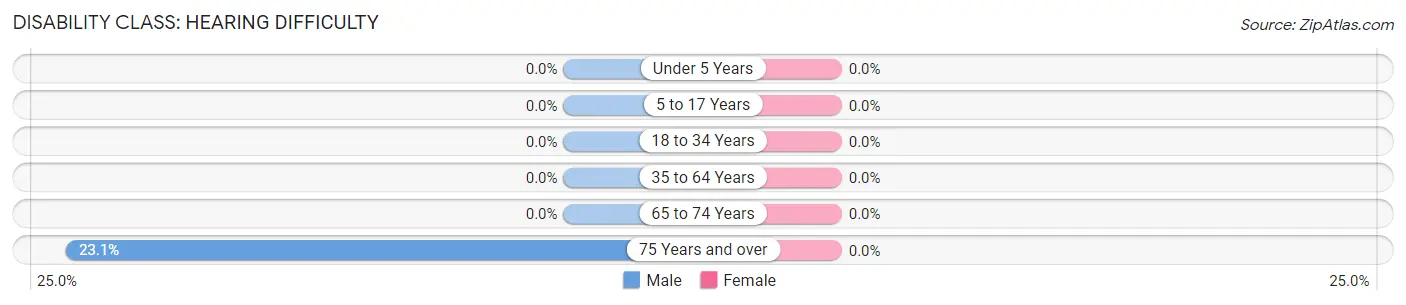
| Age Bracket | Male | Female |
| Under 5 Years | 0 (0.0%) | 0 (0.0%) |
| 5 to 17 Years | 0 (0.0%) | 0 (0.0%) |
| 18 to 34 Years | 0 (0.0%) | 0 (0.0%) |
| 35 to 64 Years | 0 (0.0%) | 0 (0.0%) |
| 65 to 74 Years | 0 (0.0%) | 0 (0.0%) |
| 75 Years and over | 3 (23.1%) | 0 (0.0%) |
Disability Class: Vision Difficulty
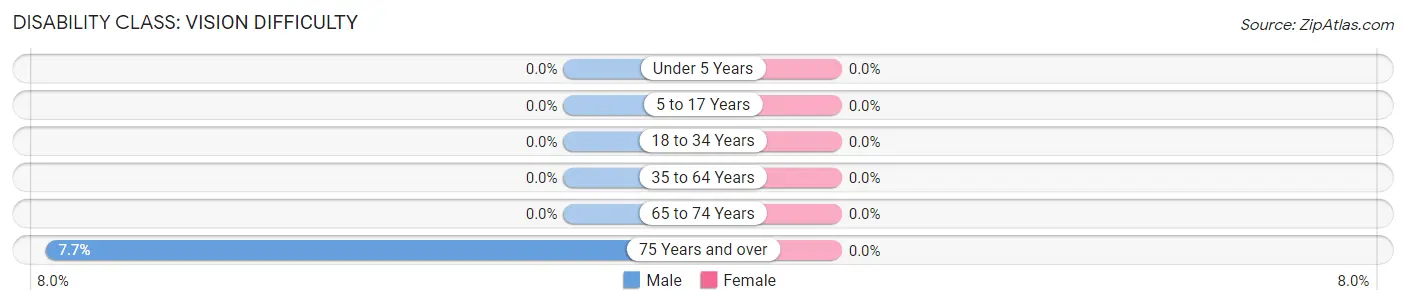
| Age Bracket | Male | Female |
| Under 5 Years | 0 (0.0%) | 0 (0.0%) |
| 5 to 17 Years | 0 (0.0%) | 0 (0.0%) |
| 18 to 34 Years | 0 (0.0%) | 0 (0.0%) |
| 35 to 64 Years | 0 (0.0%) | 0 (0.0%) |
| 65 to 74 Years | 0 (0.0%) | 0 (0.0%) |
| 75 Years and over | 1 (7.7%) | 0 (0.0%) |
Disability Class: Cognitive Difficulty
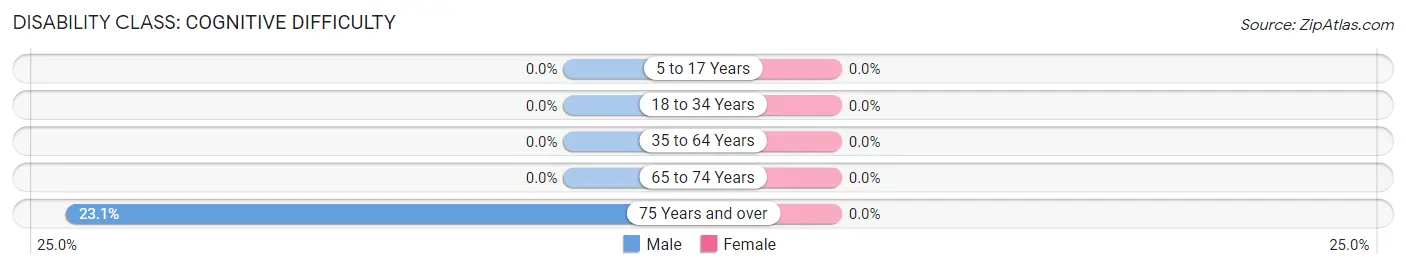
| Age Bracket | Male | Female |
| 5 to 17 Years | 0 (0.0%) | 0 (0.0%) |
| 18 to 34 Years | 0 (0.0%) | 0 (0.0%) |
| 35 to 64 Years | 0 (0.0%) | 0 (0.0%) |
| 65 to 74 Years | 0 (0.0%) | 0 (0.0%) |
| 75 Years and over | 3 (23.1%) | 0 (0.0%) |
Disability Class: Ambulatory Difficulty
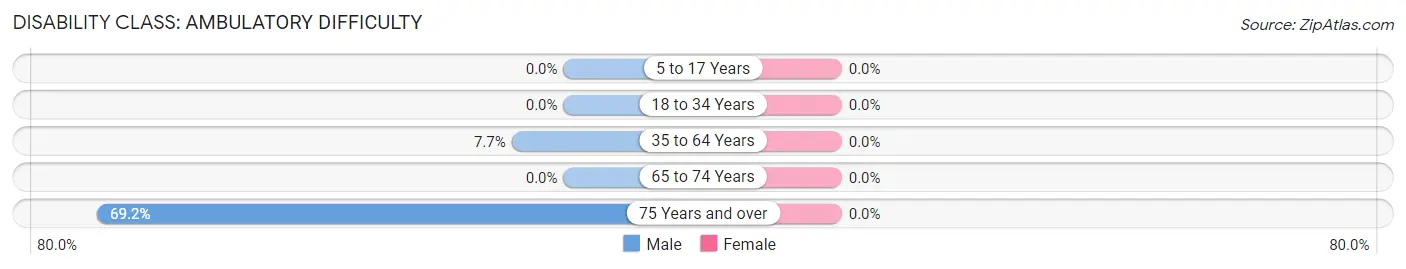
| Age Bracket | Male | Female |
| 5 to 17 Years | 0 (0.0%) | 0 (0.0%) |
| 18 to 34 Years | 0 (0.0%) | 0 (0.0%) |
| 35 to 64 Years | 2 (7.7%) | 0 (0.0%) |
| 65 to 74 Years | 0 (0.0%) | 0 (0.0%) |
| 75 Years and over | 9 (69.2%) | 0 (0.0%) |
Disability Class: Self-Care Difficulty
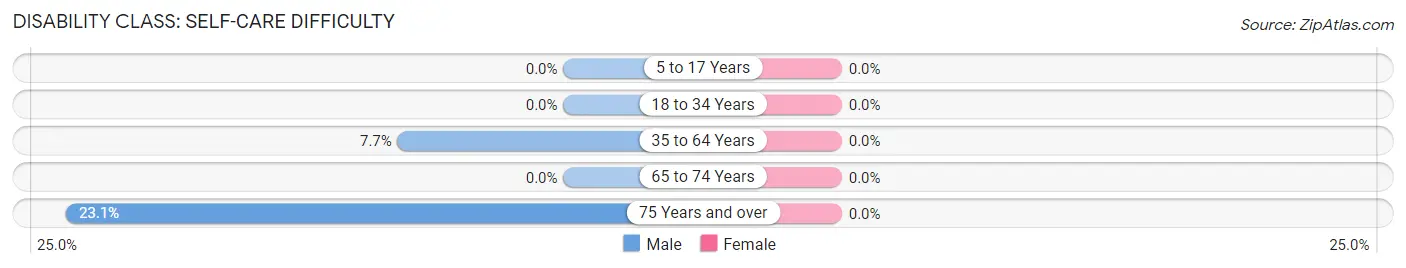
| Age Bracket | Male | Female |
| 5 to 17 Years | 0 (0.0%) | 0 (0.0%) |
| 18 to 34 Years | 0 (0.0%) | 0 (0.0%) |
| 35 to 64 Years | 2 (7.7%) | 0 (0.0%) |
| 65 to 74 Years | 0 (0.0%) | 0 (0.0%) |
| 75 Years and over | 3 (23.1%) | 0 (0.0%) |
Technology Access in Falcon
Computing Device Access in Falcon
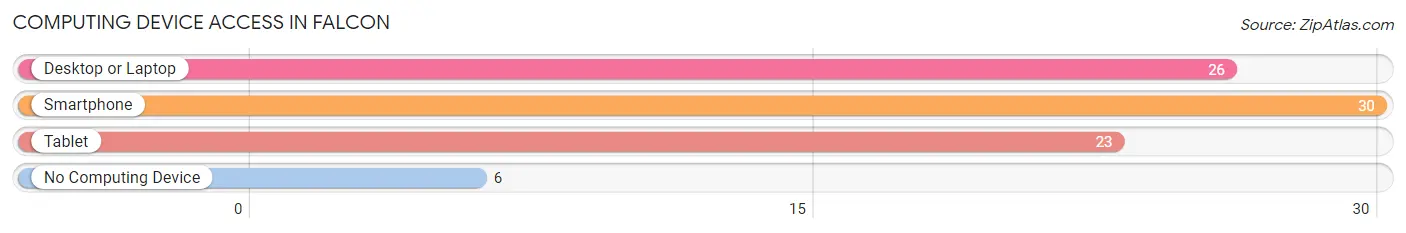
| Device Type | # Households | % Households |
| Desktop or Laptop | 26 | 68.4% |
| Smartphone | 30 | 78.9% |
| Tablet | 23 | 60.5% |
| No Computing Device | 6 | 15.8% |
| Total | 38 | 100.0% |
Internet Access in Falcon
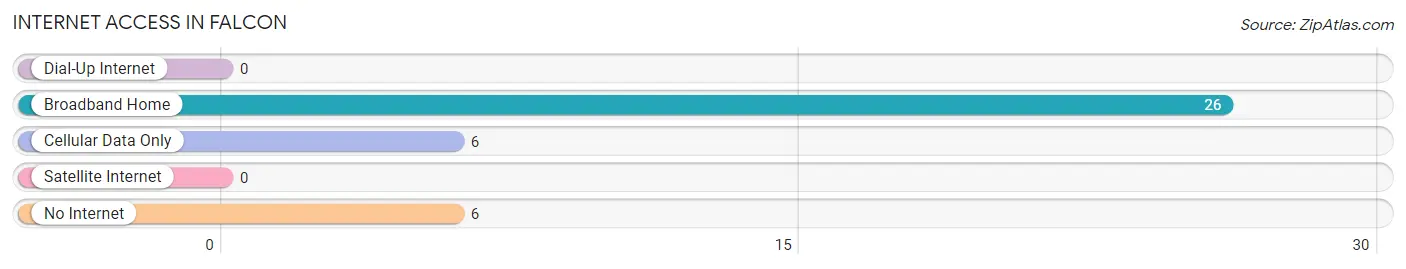
| Internet Type | # Households | % Households |
| Dial-Up Internet | 0 | 0.0% |
| Broadband Home | 26 | 68.4% |
| Cellular Data Only | 6 | 15.8% |
| Satellite Internet | 0 | 0.0% |
| No Internet | 6 | 15.8% |
| Total | 38 | 100.0% |
Falcon Summary
Falcon, North Carolina is a small town located in the southeastern corner of the state, in Cumberland County. It is situated on the banks of the Cape Fear River, and is part of the Fayetteville metropolitan area. The town has a population of approximately 1,500 people, and is known for its rural charm and small-town atmosphere.
History
Falcon was first settled in the late 1700s by a group of settlers from Scotland. The town was originally known as “McKenzie’s Crossroads”, named after the first settler, John McKenzie. The town was officially incorporated in 1887, and was named after the falcon, a bird of prey that was commonly seen in the area.
In the early 1900s, Falcon was a thriving agricultural community, with cotton, tobacco, and corn being the main crops. The town also had a number of small businesses, including a general store, a blacksmith, and a sawmill.
In the 1950s, the town began to experience a decline in population as many of its residents moved away in search of better economic opportunities. However, in recent years, the town has seen a resurgence in population as people have moved back to the area in search of a more rural lifestyle.
Geography
Falcon is located in the southeastern corner of North Carolina, in Cumberland County. It is situated on the banks of the Cape Fear River, and is part of the Fayetteville metropolitan area. The town is located approximately 25 miles south of Fayetteville, and is bordered by the towns of Hope Mills, Spring Lake, and Wade.
The town has a total area of 1.3 square miles, all of which is land. The terrain is mostly flat, with some rolling hills in the surrounding area. The climate is humid subtropical, with hot, humid summers and mild winters.
Economy
The economy of Falcon is largely based on agriculture and tourism. The town is home to several farms, which produce a variety of crops, including cotton, tobacco, corn, and soybeans. The town also has a number of small businesses, including restaurants, retail stores, and service providers.
In recent years, the town has seen an increase in tourism, as people have come to the area to enjoy its rural charm and small-town atmosphere. The town is home to several parks and recreational areas, including the Falcon Nature Preserve, which offers hiking, biking, and bird watching opportunities.
Demographics
As of the 2010 census, the population of Falcon was 1,500 people. The racial makeup of the town was 79.3% White, 15.3% African American, 0.7% Native American, 0.7% Asian, and 3.7% from other races. The median household income was $37,500, and the median age was 37.
Conclusion
Falcon, North Carolina is a small town located in the southeastern corner of the state, in Cumberland County. It is situated on the banks of the Cape Fear River, and is part of the Fayetteville metropolitan area. The town has a population of approximately 1,500 people, and is known for its rural charm and small-town atmosphere. The economy of Falcon is largely based on agriculture and tourism, and the town is home to several parks and recreational areas. The racial makeup of the town is 79.3% White, 15.3% African American, 0.7% Native American, 0.7% Asian, and 3.7% from other races. The median household income was $37,500, and the median age was 37.
Common Questions
What is Per Capita Income in Falcon?
Per Capita income in Falcon is $20,707.
What is the Median Family Income in Falcon?
Median Family Income in Falcon is $146,250.
What is the Median Household income in Falcon?
Median Household Income in Falcon is $71,786.
What is Inequality or Gini Index in Falcon?
Inequality or Gini Index in Falcon is 0.43.
What is the Total Population of Falcon?
Total Population of Falcon is 186.
What is the Total Male Population of Falcon?
Total Male Population of Falcon is 75.
What is the Total Female Population of Falcon?
Total Female Population of Falcon is 111.
What is the Ratio of Males per 100 Females in Falcon?
There are 67.57 Males per 100 Females in Falcon.
What is the Ratio of Females per 100 Males in Falcon?
There are 148.00 Females per 100 Males in Falcon.
What is the Median Population Age in Falcon?
Median Population Age in Falcon is 55.5 Years.
What is the Average Family Size in Falcon
Average Family Size in Falcon is 4.1 People.
What is the Average Household Size in Falcon
Average Household Size in Falcon is 2.4 People.
How Large is the Labor Force in Falcon?
There are 56 People in the Labor Forcein in Falcon.
What is the Percentage of People in the Labor Force in Falcon?
33.9% of People are in the Labor Force in Falcon.