Dobbins Heights, NC Map & Demographics
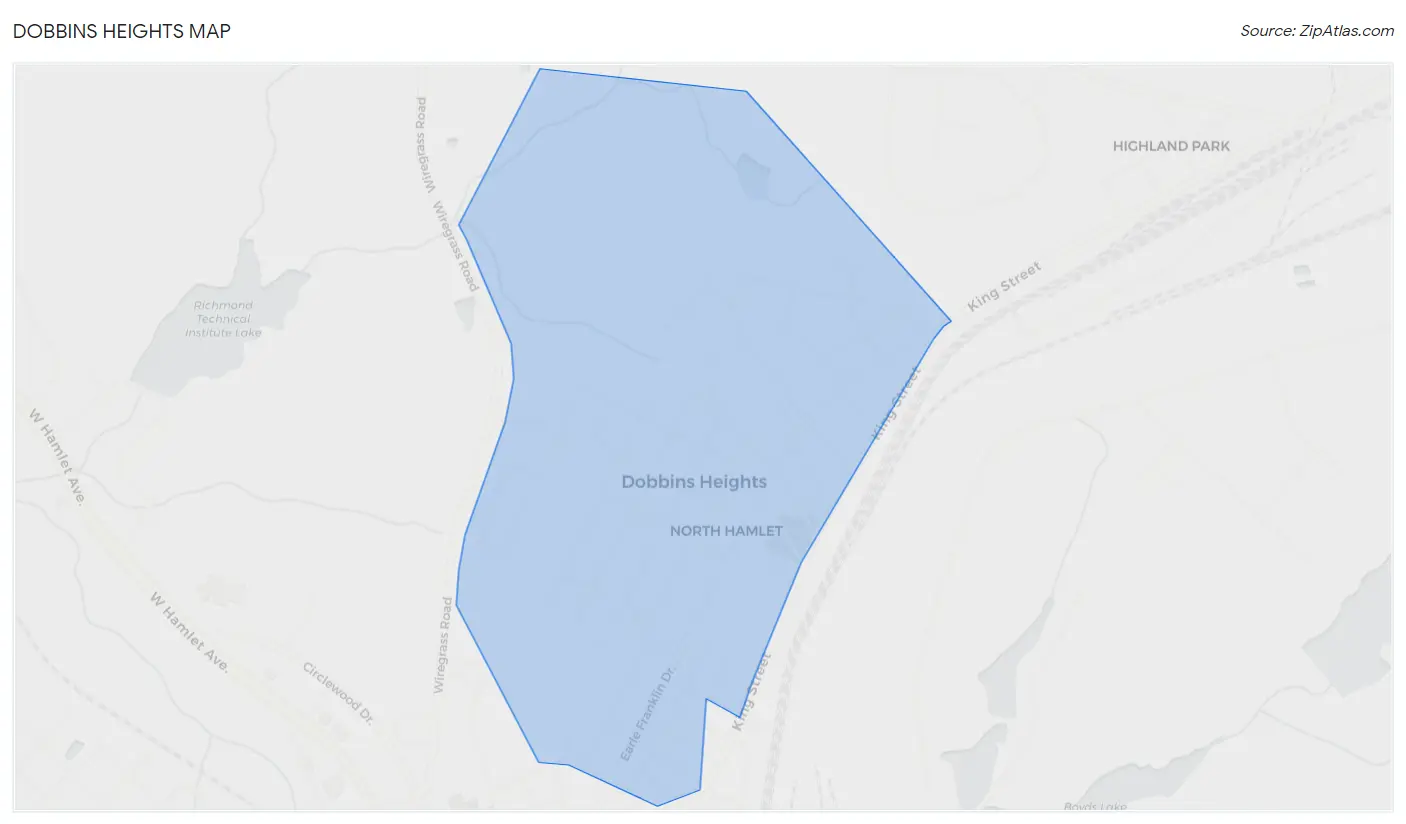
Dobbins Heights Map
Dobbins Heights Overview
$18,080
PER CAPITA INCOME
$38,009
AVG FAMILY INCOME
$24,167
AVG HOUSEHOLD INCOME
51.1%
WAGE / INCOME GAP [ % ]
48.9¢/ $1
WAGE / INCOME GAP [ $ ]
0.49
INEQUALITY / GINI INDEX
645
TOTAL POPULATION
315
MALE POPULATION
330
FEMALE POPULATION
95.45
MALES / 100 FEMALES
104.76
FEMALES / 100 MALES
39.4
MEDIAN AGE
2.8
AVG FAMILY SIZE
1.9
AVG HOUSEHOLD SIZE
321
LABOR FORCE [ PEOPLE ]
55.6%
PERCENT IN LABOR FORCE
33.0%
UNEMPLOYMENT RATE
Income in Dobbins Heights
Income Overview in Dobbins Heights
Per Capita Income in Dobbins Heights is $18,080, while median incomes of families and households are $38,009 and $24,167 respectively.
| Characteristic | Number | Measure |
| Per Capita Income | 645 | $18,080 |
| Median Family Income | 155 | $38,009 |
| Mean Family Income | 155 | $45,682 |
| Median Household Income | 338 | $24,167 |
| Mean Household Income | 338 | $34,966 |
| Income Deficit | 155 | $0 |
| Wage / Income Gap (%) | 645 | 51.12% |
| Wage / Income Gap ($) | 645 | 48.88¢ per $1 |
| Gini / Inequality Index | 645 | 0.49 |
Earnings by Sex in Dobbins Heights
Average Earnings in Dobbins Heights are $18,162, $23,594 for men and $11,532 for women, a difference of 51.1%.
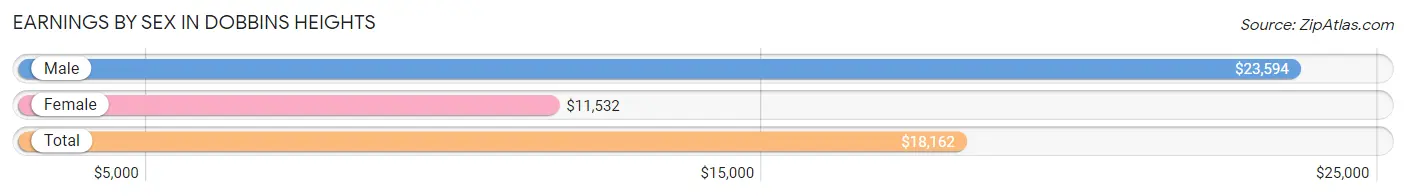
| Sex | Number | Average Earnings |
| Male | 153 (52.6%) | $23,594 |
| Female | 138 (47.4%) | $11,532 |
| Total | 291 (100.0%) | $18,162 |
Earnings by Sex by Income Bracket in Dobbins Heights
The most common earnings brackets in Dobbins Heights are $22,500 to $24,999 for men (40 | 26.1%) and $17,500 to $19,999 for women (51 | 37.0%).
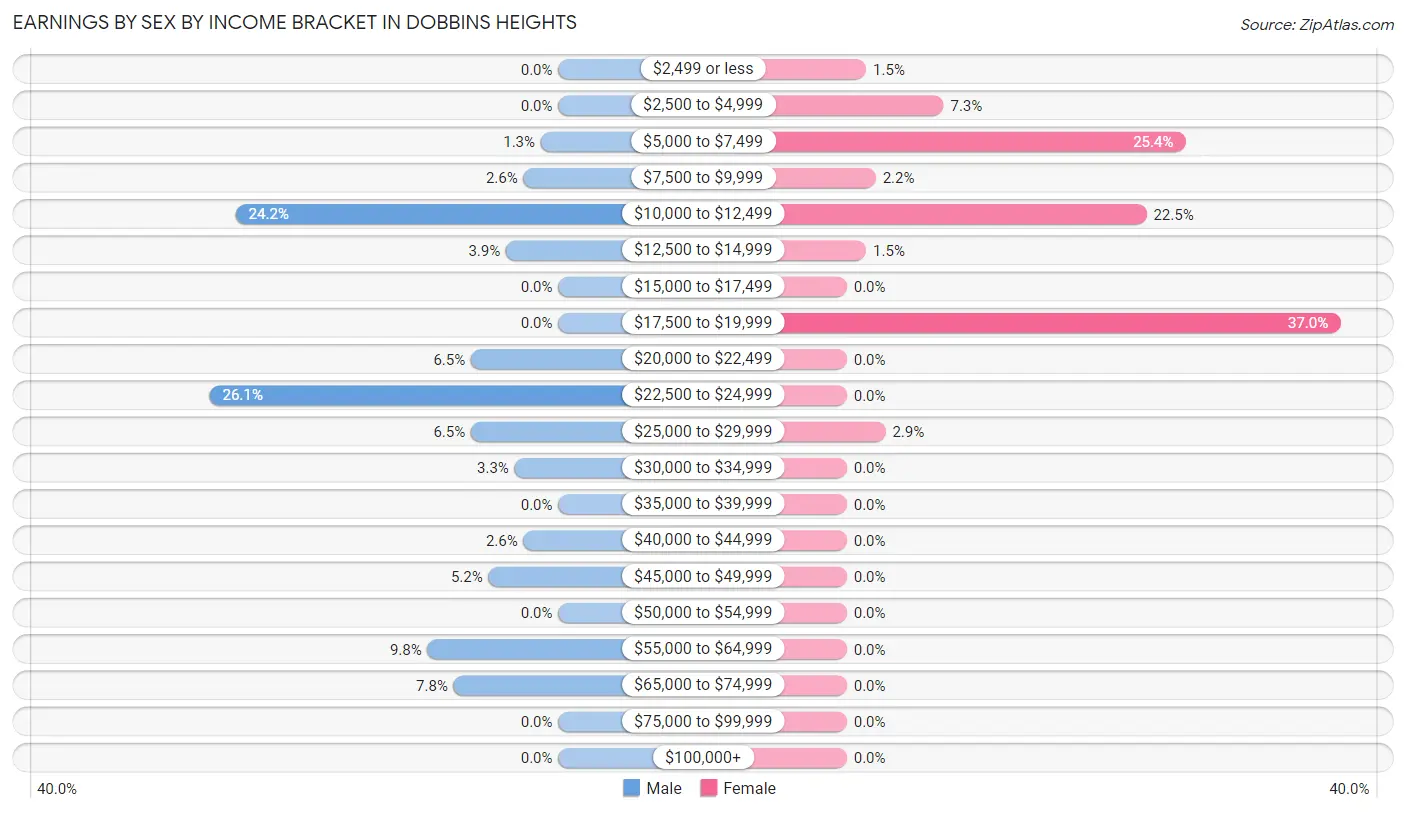
| Income | Male | Female |
| $2,499 or less | 0 (0.0%) | 2 (1.5%) |
| $2,500 to $4,999 | 0 (0.0%) | 10 (7.2%) |
| $5,000 to $7,499 | 2 (1.3%) | 35 (25.4%) |
| $7,500 to $9,999 | 4 (2.6%) | 3 (2.2%) |
| $10,000 to $12,499 | 37 (24.2%) | 31 (22.5%) |
| $12,500 to $14,999 | 6 (3.9%) | 2 (1.5%) |
| $15,000 to $17,499 | 0 (0.0%) | 0 (0.0%) |
| $17,500 to $19,999 | 0 (0.0%) | 51 (37.0%) |
| $20,000 to $22,499 | 10 (6.5%) | 0 (0.0%) |
| $22,500 to $24,999 | 40 (26.1%) | 0 (0.0%) |
| $25,000 to $29,999 | 10 (6.5%) | 4 (2.9%) |
| $30,000 to $34,999 | 5 (3.3%) | 0 (0.0%) |
| $35,000 to $39,999 | 0 (0.0%) | 0 (0.0%) |
| $40,000 to $44,999 | 4 (2.6%) | 0 (0.0%) |
| $45,000 to $49,999 | 8 (5.2%) | 0 (0.0%) |
| $50,000 to $54,999 | 0 (0.0%) | 0 (0.0%) |
| $55,000 to $64,999 | 15 (9.8%) | 0 (0.0%) |
| $65,000 to $74,999 | 12 (7.8%) | 0 (0.0%) |
| $75,000 to $99,999 | 0 (0.0%) | 0 (0.0%) |
| $100,000+ | 0 (0.0%) | 0 (0.0%) |
| Total | 153 (100.0%) | 138 (100.0%) |
Earnings by Sex by Educational Attainment in Dobbins Heights
Average earnings in Dobbins Heights are $30,500 for men and $11,855 for women, a difference of 61.1%. Men with an educational attainment of college or associate's degree enjoy the highest average annual earnings of $48,906, while those with college or associate's degree education earn the least with $48,906. Women with an educational attainment of high school diploma earn the most with the average annual earnings of $14,375, while those with high school diploma education have the smallest earnings of $14,375.
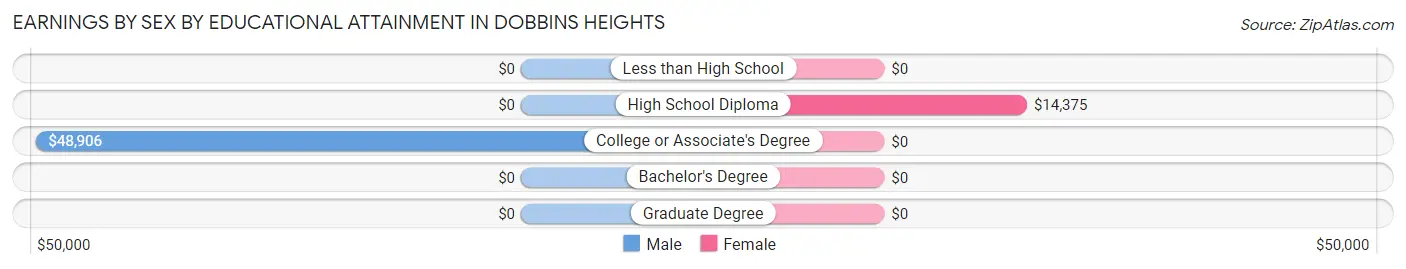
| Educational Attainment | Male Income | Female Income |
| Less than High School | - | - |
| High School Diploma | - | - |
| College or Associate's Degree | $48,906 | $0 |
| Bachelor's Degree | - | - |
| Graduate Degree | - | - |
| Total | $30,500 | $11,855 |
Family Income in Dobbins Heights
Family Income Brackets in Dobbins Heights
According to the Dobbins Heights family income data, there are 36 families falling into the $75,000 to $99,999 income range, which is the most common income bracket and makes up 23.2% of all families.
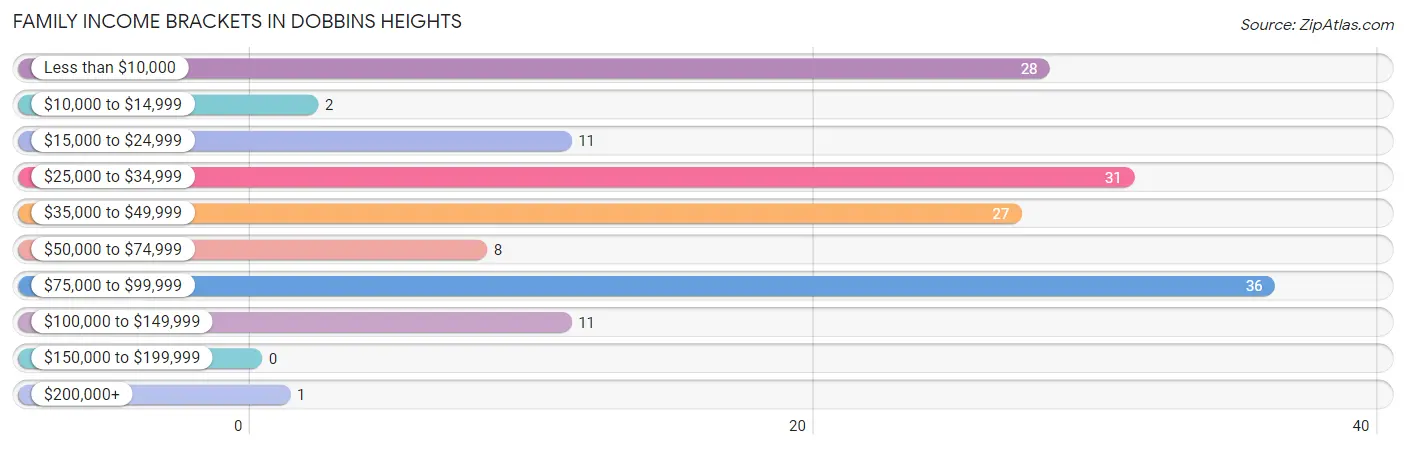
| Income Bracket | # Families | % Families |
| Less than $10,000 | 28 | 18.1% |
| $10,000 to $14,999 | 2 | 1.3% |
| $15,000 to $24,999 | 11 | 7.1% |
| $25,000 to $34,999 | 31 | 20.0% |
| $35,000 to $49,999 | 27 | 17.4% |
| $50,000 to $74,999 | 8 | 5.2% |
| $75,000 to $99,999 | 36 | 23.2% |
| $100,000 to $149,999 | 11 | 7.1% |
| $150,000 to $199,999 | 0 | 0.0% |
| $200,000+ | 1 | 0.6% |
Family Income by Famaliy Size in Dobbins Heights
| Income Bracket | # Families | Median Income |
| 2-Person Families | 85 (54.8%) | $0 |
| 3-Person Families | 31 (20.0%) | $0 |
| 4-Person Families | 39 (25.2%) | $0 |
| 5-Person Families | 0 (0.0%) | $0 |
| 6-Person Families | 0 (0.0%) | $0 |
| 7+ Person Families | 0 (0.0%) | $0 |
| Total | 155 (100.0%) | $38,009 |
Family Income by Number of Earners in Dobbins Heights
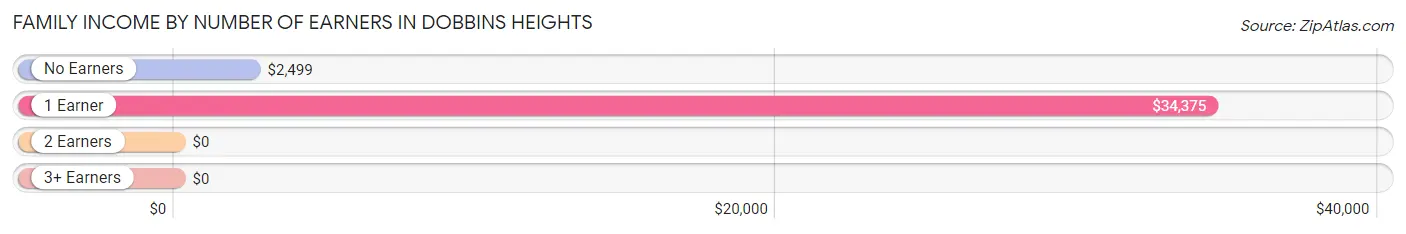
| Number of Earners | # Families | Median Income |
| No Earners | 38 (24.5%) | $2,499 |
| 1 Earner | 67 (43.2%) | $34,375 |
| 2 Earners | 39 (25.2%) | $0 |
| 3+ Earners | 11 (7.1%) | $0 |
| Total | 155 (100.0%) | $38,009 |
Household Income in Dobbins Heights
Household Income Brackets in Dobbins Heights
With 89 households falling in the category, the less than $10,000 income range is the most frequent in Dobbins Heights, accounting for 26.3% of all households.
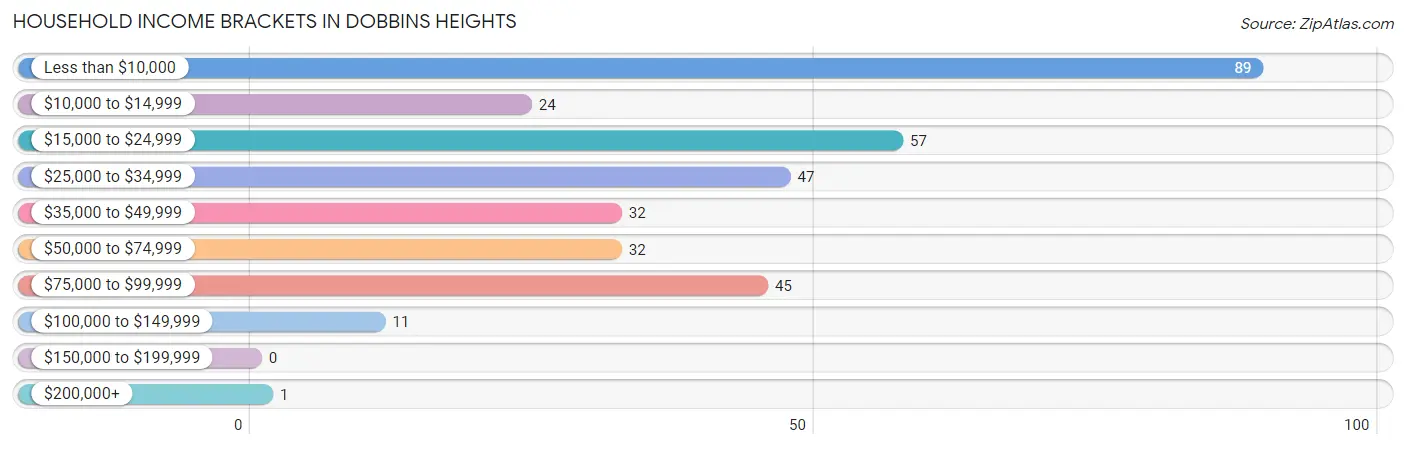
| Income Bracket | # Households | % Households |
| Less than $10,000 | 89 | 26.3% |
| $10,000 to $14,999 | 24 | 7.1% |
| $15,000 to $24,999 | 57 | 16.9% |
| $25,000 to $34,999 | 47 | 13.9% |
| $35,000 to $49,999 | 32 | 9.5% |
| $50,000 to $74,999 | 32 | 9.5% |
| $75,000 to $99,999 | 45 | 13.3% |
| $100,000 to $149,999 | 11 | 3.3% |
| $150,000 to $199,999 | 0 | 0.0% |
| $200,000+ | 1 | 0.3% |
Household Income by Householder Age in Dobbins Heights
The median household income in Dobbins Heights is $24,167, with the highest median household income of $25,813 found in the 45 to 64 years age bracket for the primary householder. A total of 121 households (35.8%) fall into this category.
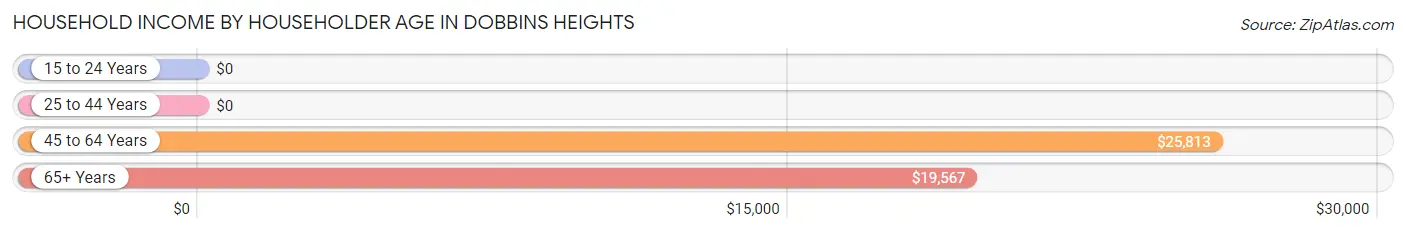
| Income Bracket | # Households | Median Income |
| 15 to 24 Years | 0 (0.0%) | $0 |
| 25 to 44 Years | 94 (27.8%) | $0 |
| 45 to 64 Years | 121 (35.8%) | $25,813 |
| 65+ Years | 123 (36.4%) | $19,567 |
| Total | 338 (100.0%) | $24,167 |
Poverty in Dobbins Heights
Income Below Poverty by Sex and Age in Dobbins Heights
With 22.9% poverty level for males and 37.9% for females among the residents of Dobbins Heights, 5 year old males and 18 to 24 year old females are the most vulnerable to poverty, with 7 males (100.0%) and 8 females (100.0%) in their respective age groups living below the poverty level.
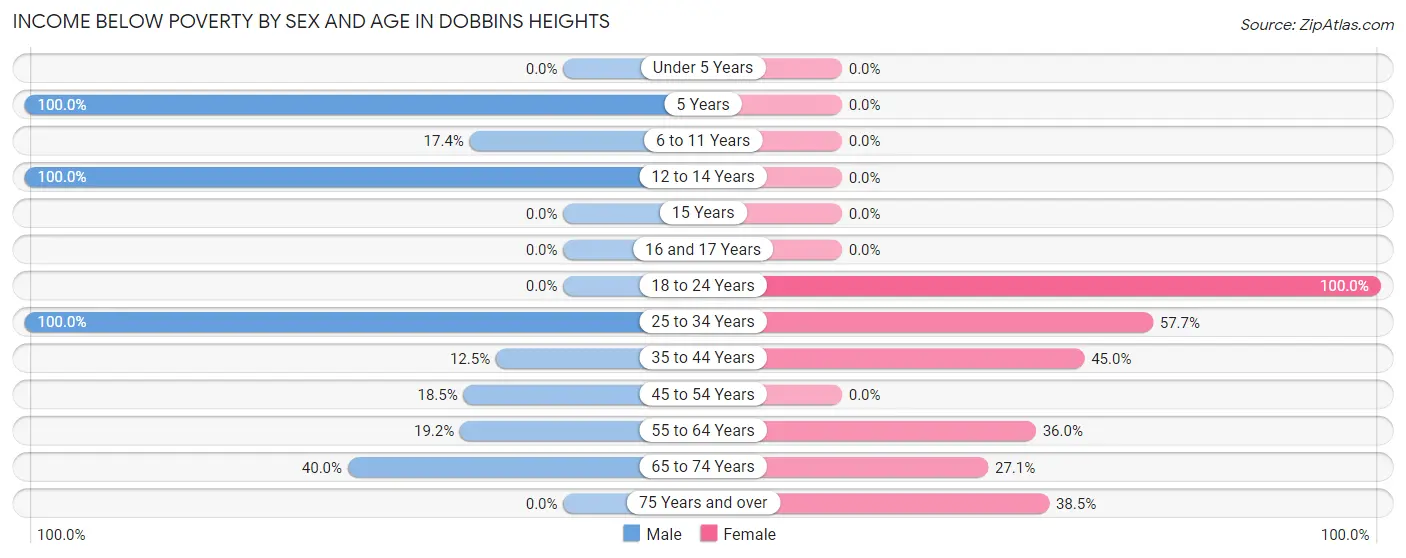
| Age Bracket | Male | Female |
| Under 5 Years | 0 (0.0%) | 0 (0.0%) |
| 5 Years | 7 (100.0%) | 0 (0.0%) |
| 6 to 11 Years | 4 (17.4%) | 0 (0.0%) |
| 12 to 14 Years | 22 (100.0%) | 0 (0.0%) |
| 15 Years | 0 (0.0%) | 0 (0.0%) |
| 16 and 17 Years | 0 (0.0%) | 0 (0.0%) |
| 18 to 24 Years | 0 (0.0%) | 8 (100.0%) |
| 25 to 34 Years | 13 (100.0%) | 56 (57.7%) |
| 35 to 44 Years | 3 (12.5%) | 9 (45.0%) |
| 45 to 54 Years | 5 (18.5%) | 0 (0.0%) |
| 55 to 64 Years | 14 (19.2%) | 18 (36.0%) |
| 65 to 74 Years | 4 (40.0%) | 19 (27.1%) |
| 75 Years and over | 0 (0.0%) | 15 (38.5%) |
| Total | 72 (22.9%) | 125 (37.9%) |
Income Above Poverty by Sex and Age in Dobbins Heights
According to the poverty statistics in Dobbins Heights, males aged 18 to 24 years and females aged 6 to 11 years are the age groups that are most secure financially, with 100.0% of males and 100.0% of females in these age groups living above the poverty line.
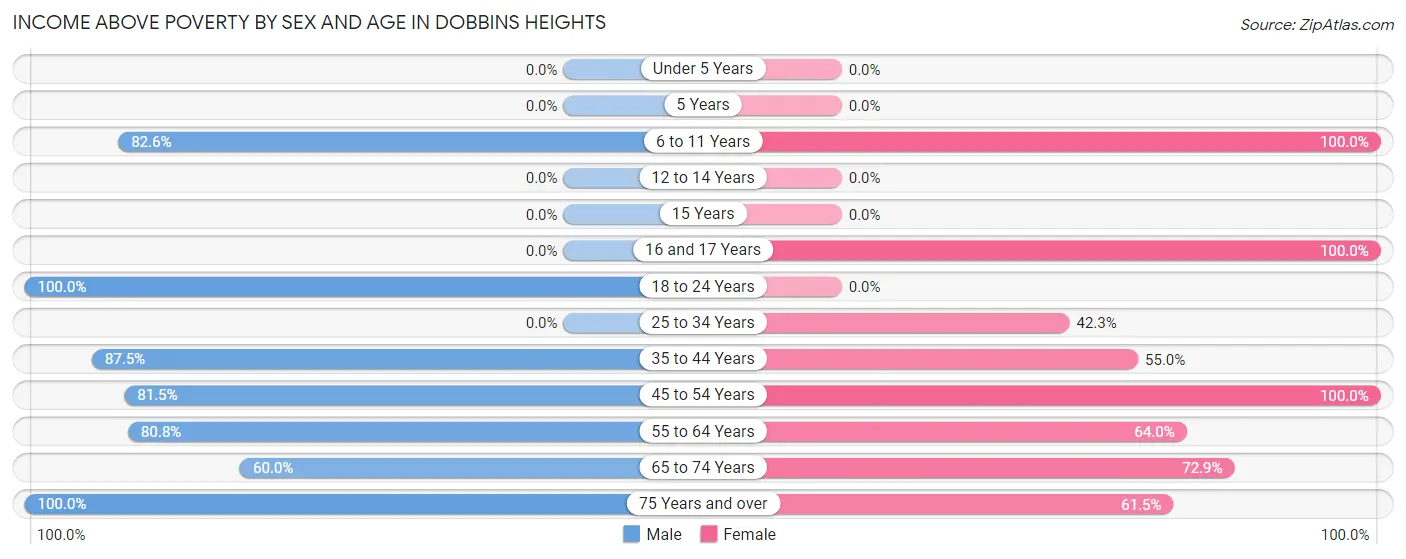
| Age Bracket | Male | Female |
| Under 5 Years | 0 (0.0%) | 0 (0.0%) |
| 5 Years | 0 (0.0%) | 0 (0.0%) |
| 6 to 11 Years | 19 (82.6%) | 16 (100.0%) |
| 12 to 14 Years | 0 (0.0%) | 0 (0.0%) |
| 15 Years | 0 (0.0%) | 0 (0.0%) |
| 16 and 17 Years | 0 (0.0%) | 10 (100.0%) |
| 18 to 24 Years | 104 (100.0%) | 0 (0.0%) |
| 25 to 34 Years | 0 (0.0%) | 41 (42.3%) |
| 35 to 44 Years | 21 (87.5%) | 11 (55.0%) |
| 45 to 54 Years | 22 (81.5%) | 20 (100.0%) |
| 55 to 64 Years | 59 (80.8%) | 32 (64.0%) |
| 65 to 74 Years | 6 (60.0%) | 51 (72.9%) |
| 75 Years and over | 12 (100.0%) | 24 (61.5%) |
| Total | 243 (77.1%) | 205 (62.1%) |
Income Below Poverty Among Married-Couple Families in Dobbins Heights
The poverty statistics for married-couple families in Dobbins Heights show that 6.6% or 5 of the total 76 families live below the poverty line. Families with 1 or 2 children have the highest poverty rate of 7.9%, comprising of 3 families. On the other hand, families with no children have the lowest poverty rate of 5.3%, which includes 2 families.
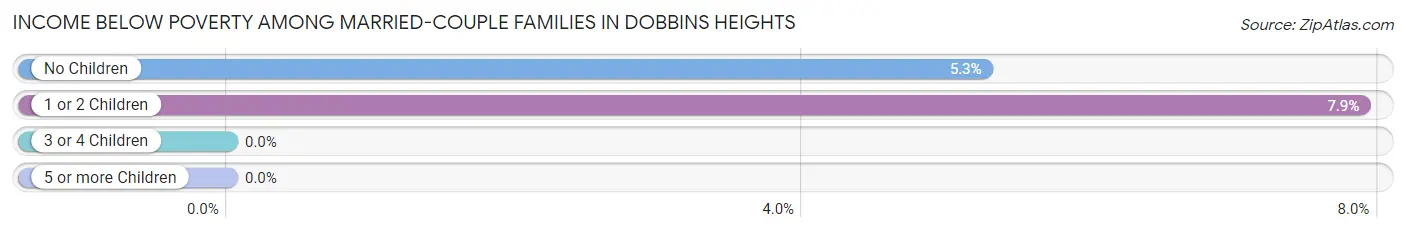
| Children | Above Poverty | Below Poverty |
| No Children | 36 (94.7%) | 2 (5.3%) |
| 1 or 2 Children | 35 (92.1%) | 3 (7.9%) |
| 3 or 4 Children | 0 (0.0%) | 0 (0.0%) |
| 5 or more Children | 0 (0.0%) | 0 (0.0%) |
| Total | 71 (93.4%) | 5 (6.6%) |
Income Below Poverty Among Single-Parent Households in Dobbins Heights
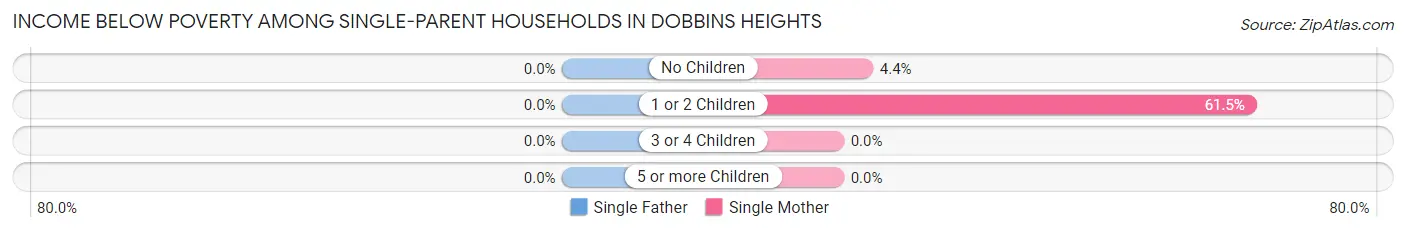
| Children | Single Father | Single Mother |
| No Children | 0 (0.0%) | 1 (4.3%) |
| 1 or 2 Children | 0 (0.0%) | 32 (61.5%) |
| 3 or 4 Children | 0 (0.0%) | 0 (0.0%) |
| 5 or more Children | 0 (0.0%) | 0 (0.0%) |
| Total | 0 (0.0%) | 33 (44.0%) |
Income Below Poverty Among Married-Couple vs Single-Parent Households in Dobbins Heights
The poverty data for Dobbins Heights shows that 5 of the married-couple family households (6.6%) and 33 of the single-parent households (41.8%) are living below the poverty level. Within the married-couple family households, those with 1 or 2 children have the highest poverty rate, with 3 households (7.9%) falling below the poverty line. Among the single-parent households, those with 1 or 2 children have the highest poverty rate, with 32 household (61.5%) living below poverty.
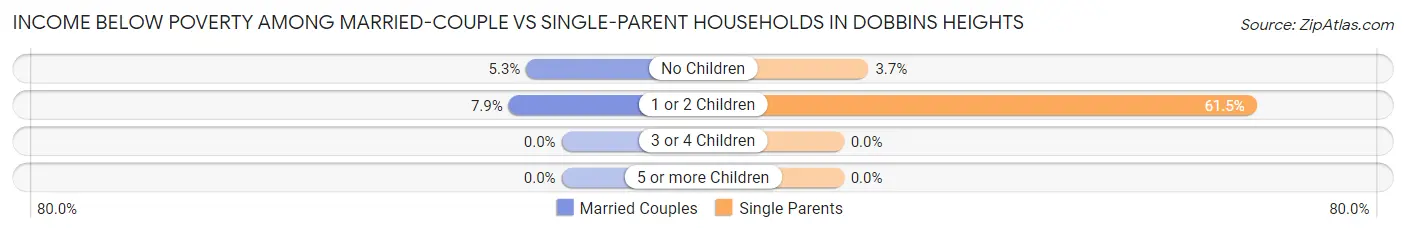
| Children | Married-Couple Families | Single-Parent Households |
| No Children | 2 (5.3%) | 1 (3.7%) |
| 1 or 2 Children | 3 (7.9%) | 32 (61.5%) |
| 3 or 4 Children | 0 (0.0%) | 0 (0.0%) |
| 5 or more Children | 0 (0.0%) | 0 (0.0%) |
| Total | 5 (6.6%) | 33 (41.8%) |
Race in Dobbins Heights
The most populous races in Dobbins Heights are Black / African American (476 | 73.8%), White / Caucasian (143 | 22.2%), and Two or more Races (16 | 2.5%).
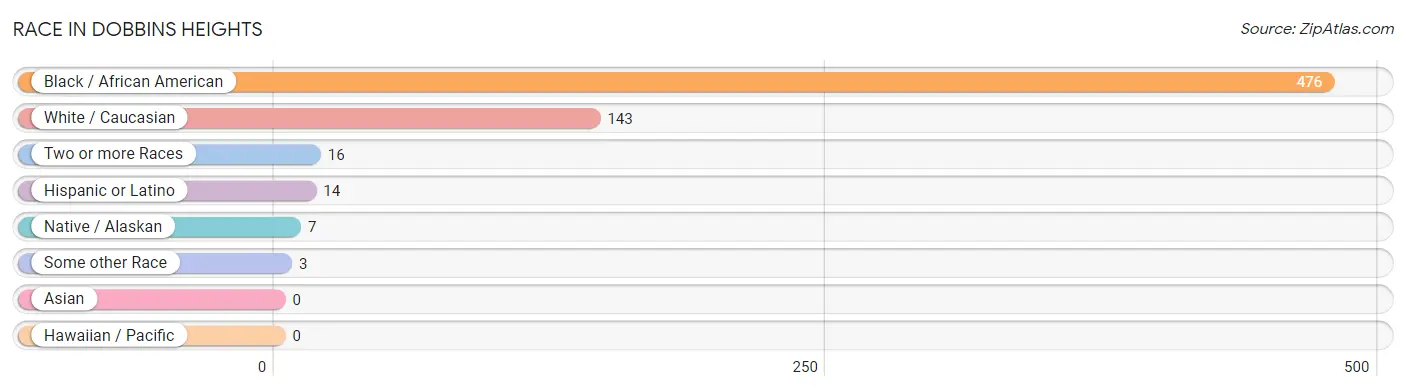
| Race | # Population | % Population |
| Asian | 0 | 0.0% |
| Black / African American | 476 | 73.8% |
| Hawaiian / Pacific | 0 | 0.0% |
| Hispanic or Latino | 14 | 2.2% |
| Native / Alaskan | 7 | 1.1% |
| White / Caucasian | 143 | 22.2% |
| Two or more Races | 16 | 2.5% |
| Some other Race | 3 | 0.5% |
| Total | 645 | 100.0% |
Ancestry in Dobbins Heights
The most populous ancestries reported in Dobbins Heights are Scotch-Irish (30 | 4.6%), English (14 | 2.2%), Lumbee (7 | 1.1%), Mexican (7 | 1.1%), and Puerto Rican (7 | 1.1%), together accounting for 10.1% of all Dobbins Heights residents.
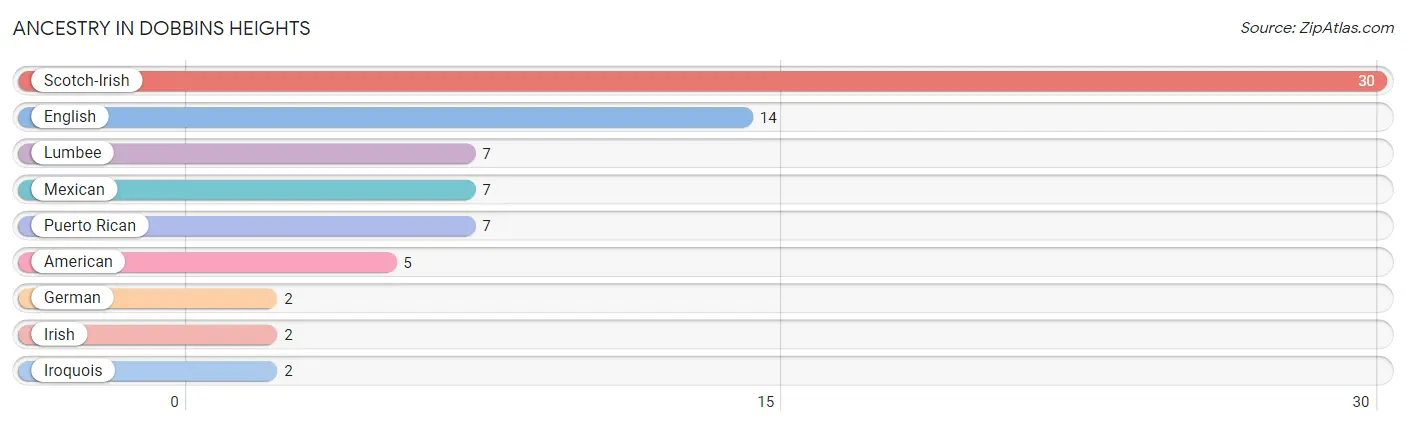
| Ancestry | # Population | % Population |
| American | 5 | 0.8% |
| English | 14 | 2.2% |
| German | 2 | 0.3% |
| Irish | 2 | 0.3% |
| Iroquois | 2 | 0.3% |
| Lumbee | 7 | 1.1% |
| Mexican | 7 | 1.1% |
| Puerto Rican | 7 | 1.1% |
| Scotch-Irish | 30 | 4.6% | View All 9 Rows |
Immigrants in Dobbins Heights
The most numerous immigrant groups reported in Dobbins Heights came from Central America (14 | 2.2%), Latin America (14 | 2.2%), and Mexico (14 | 2.2%), together accounting for 6.5% of all Dobbins Heights residents.
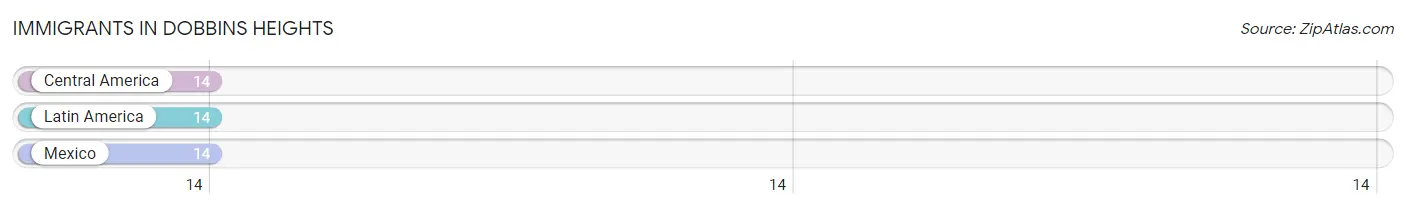
| Immigration Origin | # Population | % Population |
| Central America | 14 | 2.2% |
| Latin America | 14 | 2.2% |
| Mexico | 14 | 2.2% | View All 3 Rows |
Sex and Age in Dobbins Heights
Sex and Age in Dobbins Heights
The most populous age groups in Dobbins Heights are 20 to 24 Years (104 | 33.0%) for men and 30 to 34 Years (91 | 27.6%) for women.
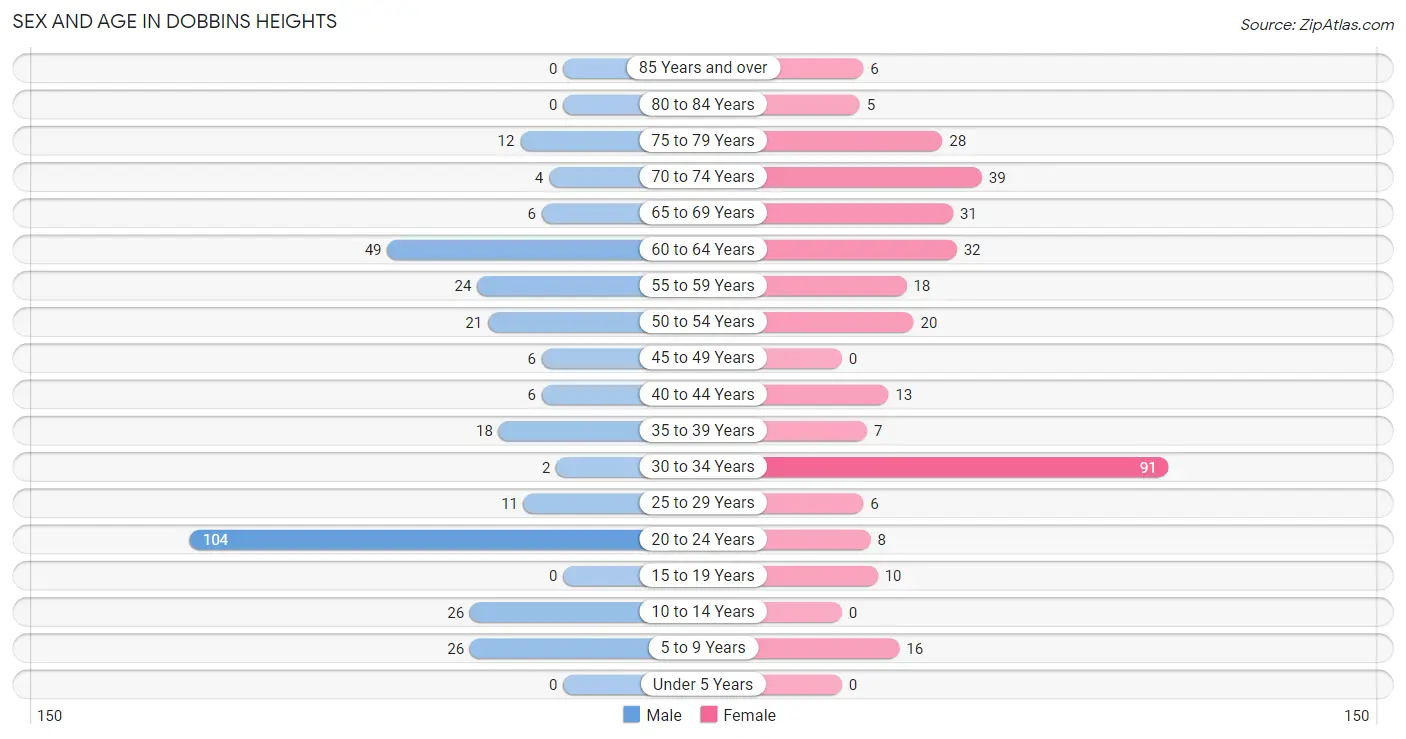
| Age Bracket | Male | Female |
| Under 5 Years | 0 (0.0%) | 0 (0.0%) |
| 5 to 9 Years | 26 (8.3%) | 16 (4.9%) |
| 10 to 14 Years | 26 (8.3%) | 0 (0.0%) |
| 15 to 19 Years | 0 (0.0%) | 10 (3.0%) |
| 20 to 24 Years | 104 (33.0%) | 8 (2.4%) |
| 25 to 29 Years | 11 (3.5%) | 6 (1.8%) |
| 30 to 34 Years | 2 (0.6%) | 91 (27.6%) |
| 35 to 39 Years | 18 (5.7%) | 7 (2.1%) |
| 40 to 44 Years | 6 (1.9%) | 13 (3.9%) |
| 45 to 49 Years | 6 (1.9%) | 0 (0.0%) |
| 50 to 54 Years | 21 (6.7%) | 20 (6.1%) |
| 55 to 59 Years | 24 (7.6%) | 18 (5.4%) |
| 60 to 64 Years | 49 (15.6%) | 32 (9.7%) |
| 65 to 69 Years | 6 (1.9%) | 31 (9.4%) |
| 70 to 74 Years | 4 (1.3%) | 39 (11.8%) |
| 75 to 79 Years | 12 (3.8%) | 28 (8.5%) |
| 80 to 84 Years | 0 (0.0%) | 5 (1.5%) |
| 85 Years and over | 0 (0.0%) | 6 (1.8%) |
| Total | 315 (100.0%) | 330 (100.0%) |
Families and Households in Dobbins Heights
Median Family Size in Dobbins Heights
The median family size in Dobbins Heights is 2.80 persons per family, with single male/father families (4 | 2.6%) accounting for the largest median family size of 5 persons per family. On the other hand, married-couple families (76 | 49.0%) represent the smallest median family size with 2.57 persons per family.
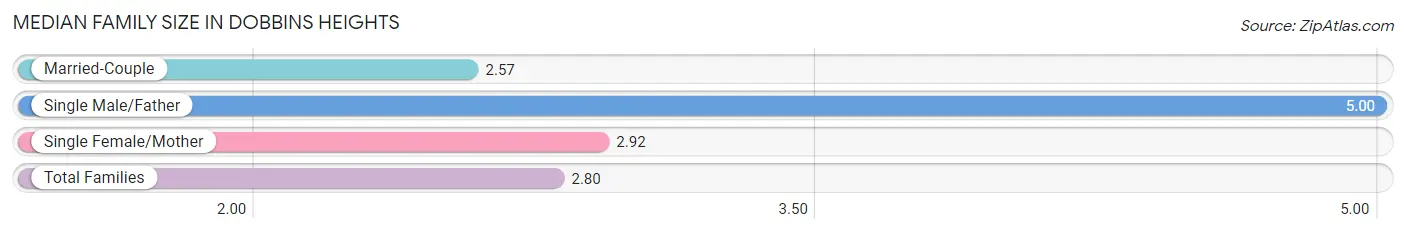
| Family Type | # Families | Family Size |
| Married-Couple | 76 (49.0%) | 2.57 |
| Single Male/Father | 4 (2.6%) | 5.00 |
| Single Female/Mother | 75 (48.4%) | 2.92 |
| Total Families | 155 (100.0%) | 2.80 |
Median Household Size in Dobbins Heights
The median household size in Dobbins Heights is 1.91 persons per household, with single male/father households (4 | 1.2%) accounting for the largest median household size of 5 persons per household. non-family households (183 | 54.1%) represent the smallest median household size with 1.15 persons per household.
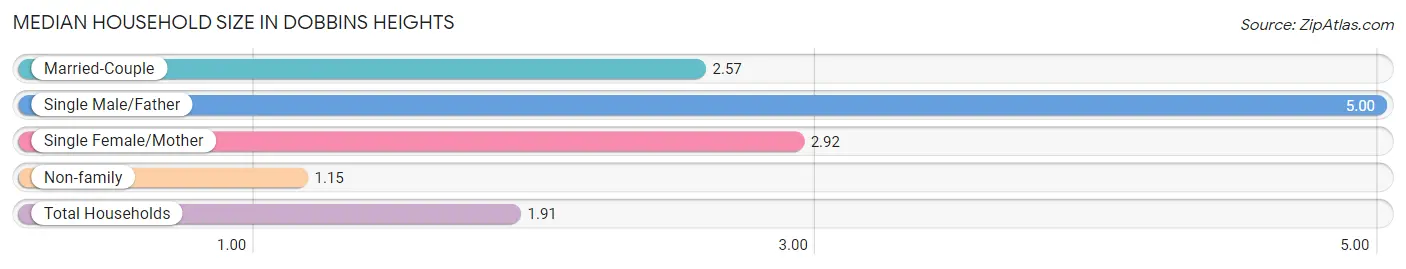
| Household Type | # Households | Household Size |
| Married-Couple | 76 (22.5%) | 2.57 |
| Single Male/Father | 4 (1.2%) | 5.00 |
| Single Female/Mother | 75 (22.2%) | 2.92 |
| Non-family | 183 (54.1%) | 1.15 |
| Total Households | 338 (100.0%) | 1.91 |
Household Size by Marriage Status in Dobbins Heights
Out of a total of 338 households in Dobbins Heights, 155 (45.9%) are family households, while 183 (54.1%) are nonfamily households. The most numerous type of family households are 2-person households, comprising 85, and the most common type of nonfamily households are 1-person households, comprising 174.
| Household Size | Family Households | Nonfamily Households |
| 1-Person Households | - | 174 (51.5%) |
| 2-Person Households | 85 (25.2%) | 9 (2.7%) |
| 3-Person Households | 31 (9.2%) | 0 (0.0%) |
| 4-Person Households | 39 (11.5%) | 0 (0.0%) |
| 5-Person Households | 0 (0.0%) | 0 (0.0%) |
| 6-Person Households | 0 (0.0%) | 0 (0.0%) |
| 7+ Person Households | 0 (0.0%) | 0 (0.0%) |
| Total | 155 (45.9%) | 183 (54.1%) |
Female Fertility in Dobbins Heights
Fertility by Age in Dobbins Heights
| Age Bracket | Women with Births | Births / 1,000 Women |
| 15 to 19 years | 0 (0.0%) | 0.0 |
| 20 to 34 years | 0 (0.0%) | 0.0 |
| 35 to 50 years | 0 (0.0%) | 0.0 |
| Total | 0 (0.0%) | 0.0 |
Fertility by Age by Marriage Status in Dobbins Heights
| Age Bracket | Married | Unmarried |
| 15 to 19 years | 0 (0.0%) | 0 (0.0%) |
| 20 to 34 years | 0 (0.0%) | 0 (0.0%) |
| 35 to 50 years | 0 (0.0%) | 0 (0.0%) |
| Total | 0 (0.0%) | 0 (0.0%) |
Fertility by Education in Dobbins Heights
| Educational Attainment | Women with Births | Births / 1,000 Women |
| Less than High School | 0 (0.0%) | 0.0 |
| High School Diploma | 0 (0.0%) | 0.0 |
| College or Associate's Degree | 0 (0.0%) | 0.0 |
| Bachelor's Degree | 0 (0.0%) | 0.0 |
| Graduate Degree | 0 (0.0%) | 0.0 |
| Total | 0 (0.0%) | 0.0 |
Fertility by Education by Marriage Status in Dobbins Heights
| Educational Attainment | Married | Unmarried |
| Less than High School | 0 (0.0%) | 0 (0.0%) |
| High School Diploma | 0 (0.0%) | 0 (0.0%) |
| College or Associate's Degree | 0 (0.0%) | 0 (0.0%) |
| Bachelor's Degree | 0 (0.0%) | 0 (0.0%) |
| Graduate Degree | 0 (0.0%) | 0 (0.0%) |
| Total | 0 (0.0%) | 0 (0.0%) |
Employment Characteristics in Dobbins Heights
Employment by Class of Employer in Dobbins Heights
Among the 215 employed individuals in Dobbins Heights, private company employees (189 | 87.9%), state government employees (13 | 6.0%), and self-employed (not incorporated) (6 | 2.8%) make up the most common classes of employment.
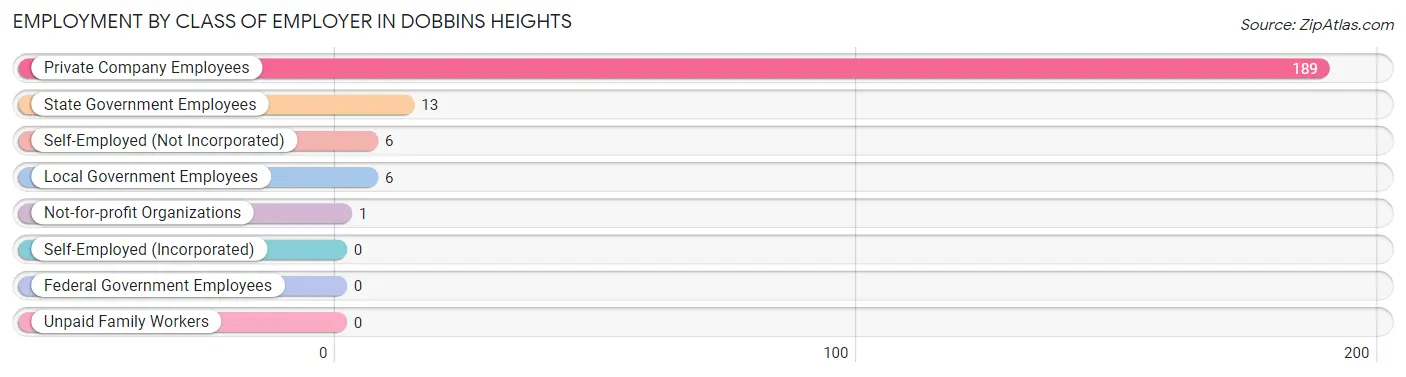
| Employer Class | # Employees | % Employees |
| Private Company Employees | 189 | 87.9% |
| Self-Employed (Incorporated) | 0 | 0.0% |
| Self-Employed (Not Incorporated) | 6 | 2.8% |
| Not-for-profit Organizations | 1 | 0.5% |
| Local Government Employees | 6 | 2.8% |
| State Government Employees | 13 | 6.0% |
| Federal Government Employees | 0 | 0.0% |
| Unpaid Family Workers | 0 | 0.0% |
| Total | 215 | 100.0% |
Employment Status by Age in Dobbins Heights
According to the labor force statistics for Dobbins Heights, out of the total population over 16 years of age (577), 55.6% or 321 individuals are in the labor force, with 33.0% or 106 of them unemployed. The age group with the highest labor force participation rate is 20 to 24 years, with 100.0% or 112 individuals in the labor force. Within the labor force, the 30 to 34 years age range has the highest percentage of unemployed individuals, with 100.0% or 56 of them being unemployed.
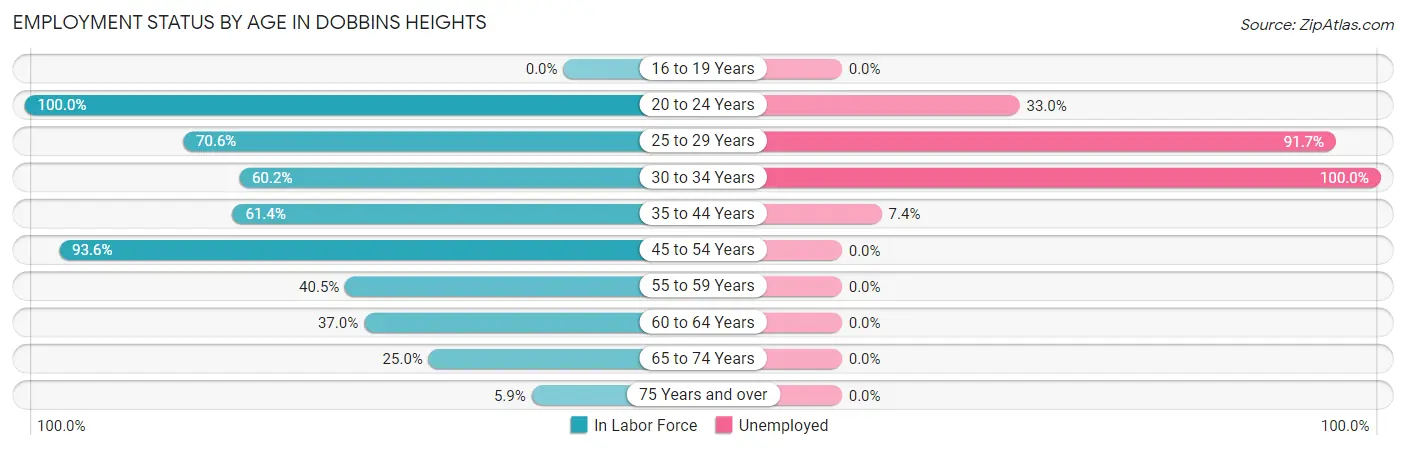
| Age Bracket | In Labor Force | Unemployed |
| 16 to 19 Years | 0 (0.0%) | 0 (0.0%) |
| 20 to 24 Years | 112 (100.0%) | 37 (33.0%) |
| 25 to 29 Years | 12 (70.6%) | 11 (91.7%) |
| 30 to 34 Years | 56 (60.2%) | 56 (100.0%) |
| 35 to 44 Years | 27 (61.4%) | 2 (7.4%) |
| 45 to 54 Years | 44 (93.6%) | 0 (0.0%) |
| 55 to 59 Years | 17 (40.5%) | 0 (0.0%) |
| 60 to 64 Years | 30 (37.0%) | 0 (0.0%) |
| 65 to 74 Years | 20 (25.0%) | 0 (0.0%) |
| 75 Years and over | 3 (5.9%) | 0 (0.0%) |
| Total | 321 (55.6%) | 106 (33.0%) |
Employment Status by Educational Attainment in Dobbins Heights
According to labor force statistics for Dobbins Heights, 57.4% of individuals (186) out of the total population between 25 and 64 years of age (324) are in the labor force, with 37.1% or 69 of them being unemployed. The group with the highest labor force participation rate are those with the educational attainment of bachelor's degree or higher, with 100.0% or 23 individuals in the labor force. Within the labor force, individuals with college / associate degree education have the highest percentage of unemployment, with 54.5% or 30 of them being unemployed.
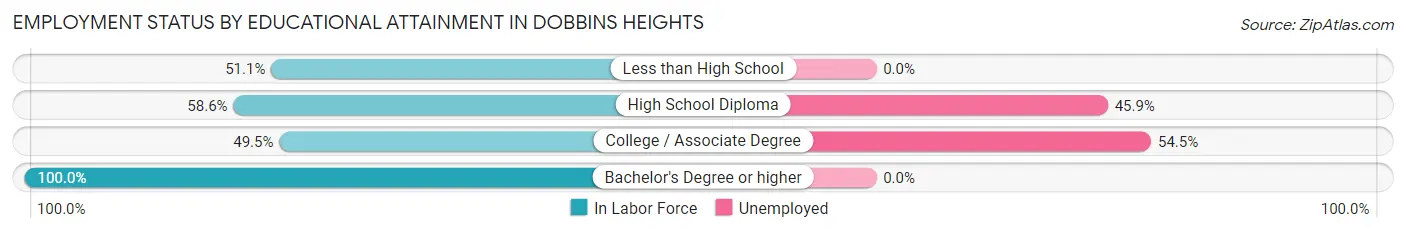
| Educational Attainment | In Labor Force | Unemployed |
| Less than High School | 23 (51.1%) | 0 (0.0%) |
| High School Diploma | 85 (58.6%) | 67 (45.9%) |
| College / Associate Degree | 55 (49.5%) | 60 (54.5%) |
| Bachelor's Degree or higher | 23 (100.0%) | 0 (0.0%) |
| Total | 186 (57.4%) | 120 (37.1%) |
Employment Occupations by Sex in Dobbins Heights
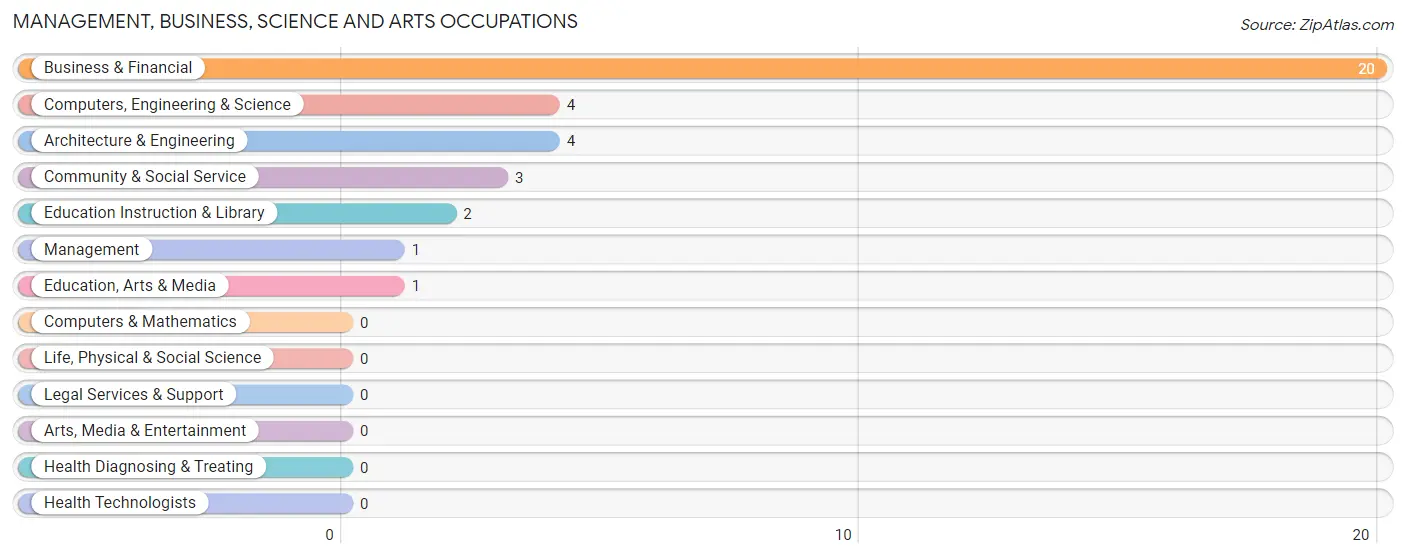
Management, Business, Science and Arts Occupations
The most common Management, Business, Science and Arts occupations in Dobbins Heights are Business & Financial (20 | 9.3%), Computers, Engineering & Science (4 | 1.9%), Architecture & Engineering (4 | 1.9%), Community & Social Service (3 | 1.4%), and Education Instruction & Library (2 | 0.9%).
Management, Business, Science and Arts Occupations by Sex
Within the Management, Business, Science and Arts occupations in Dobbins Heights, the most male-oriented occupations are Computers, Engineering & Science (100.0%), Architecture & Engineering (100.0%), and Education, Arts & Media (100.0%), while the most female-oriented occupations are Management (100.0%), Business & Financial (100.0%), and Education Instruction & Library (100.0%).
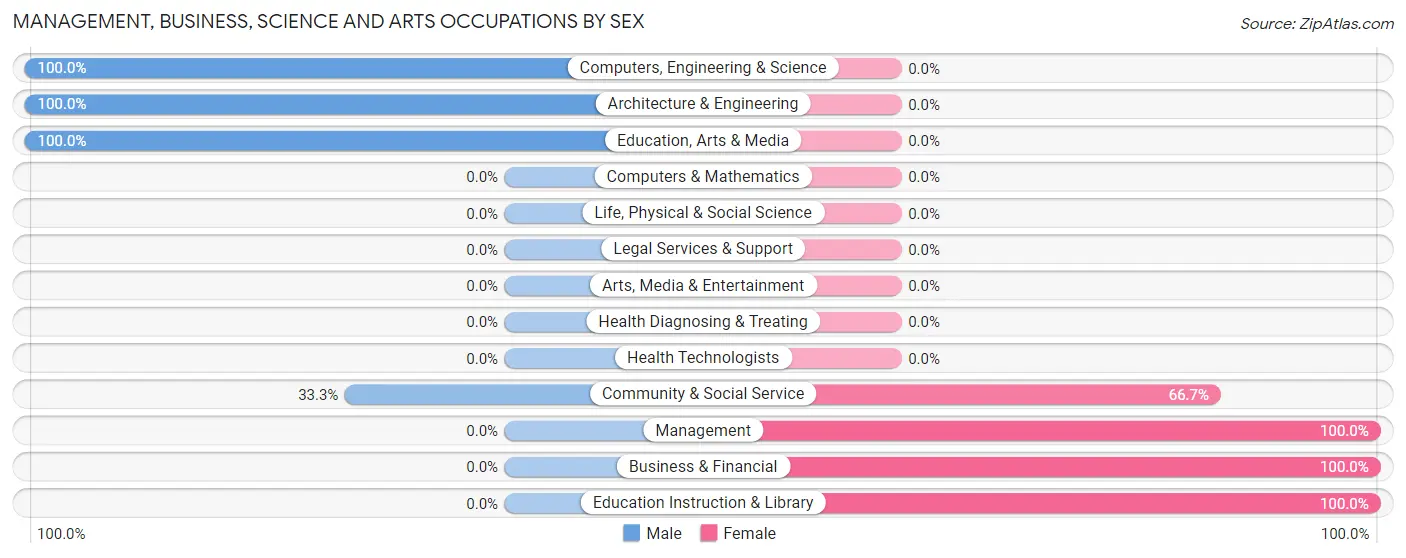
| Occupation | Male | Female |
| Management | 0 (0.0%) | 1 (100.0%) |
| Business & Financial | 0 (0.0%) | 20 (100.0%) |
| Computers, Engineering & Science | 4 (100.0%) | 0 (0.0%) |
| Computers & Mathematics | 0 (0.0%) | 0 (0.0%) |
| Architecture & Engineering | 4 (100.0%) | 0 (0.0%) |
| Life, Physical & Social Science | 0 (0.0%) | 0 (0.0%) |
| Community & Social Service | 1 (33.3%) | 2 (66.7%) |
| Education, Arts & Media | 1 (100.0%) | 0 (0.0%) |
| Legal Services & Support | 0 (0.0%) | 0 (0.0%) |
| Education Instruction & Library | 0 (0.0%) | 2 (100.0%) |
| Arts, Media & Entertainment | 0 (0.0%) | 0 (0.0%) |
| Health Diagnosing & Treating | 0 (0.0%) | 0 (0.0%) |
| Health Technologists | 0 (0.0%) | 0 (0.0%) |
| Total (Category) | 5 (17.9%) | 23 (82.1%) |
| Total (Overall) | 153 (71.2%) | 62 (28.8%) |
Services Occupations
The most common Services occupations in Dobbins Heights are Food Preparation & Serving (43 | 20.0%), Cleaning & Maintenance (11 | 5.1%), and Healthcare Support (8 | 3.7%).
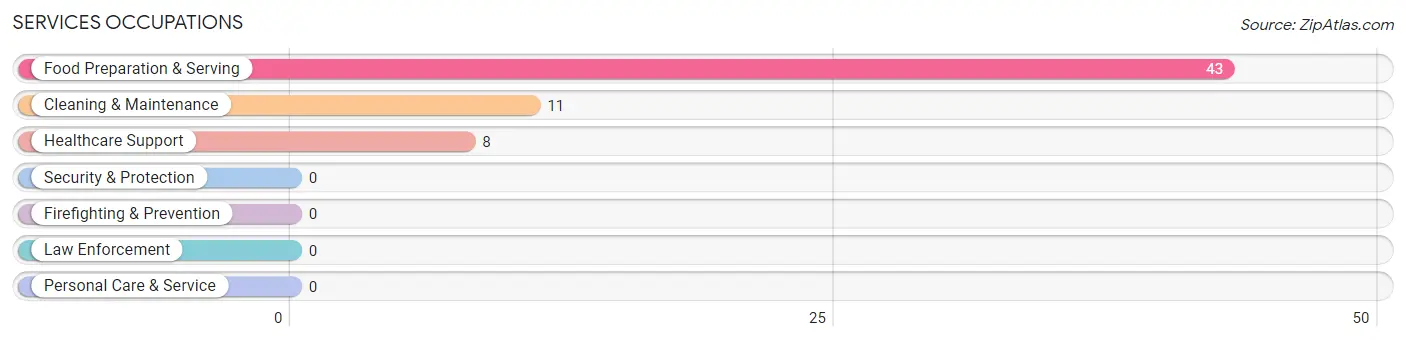
Services Occupations by Sex
Within the Services occupations in Dobbins Heights, the most male-oriented occupations are Food Preparation & Serving (100.0%), and Cleaning & Maintenance (36.4%), while the most female-oriented occupations are Healthcare Support (100.0%), and Cleaning & Maintenance (63.6%).
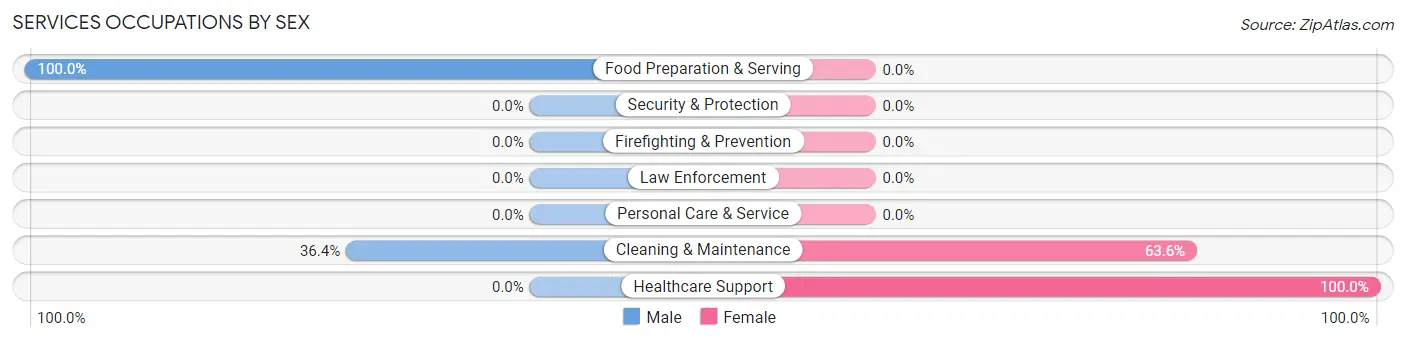
| Occupation | Male | Female |
| Healthcare Support | 0 (0.0%) | 8 (100.0%) |
| Security & Protection | 0 (0.0%) | 0 (0.0%) |
| Firefighting & Prevention | 0 (0.0%) | 0 (0.0%) |
| Law Enforcement | 0 (0.0%) | 0 (0.0%) |
| Food Preparation & Serving | 43 (100.0%) | 0 (0.0%) |
| Cleaning & Maintenance | 4 (36.4%) | 7 (63.6%) |
| Personal Care & Service | 0 (0.0%) | 0 (0.0%) |
| Total (Category) | 47 (75.8%) | 15 (24.2%) |
| Total (Overall) | 153 (71.2%) | 62 (28.8%) |
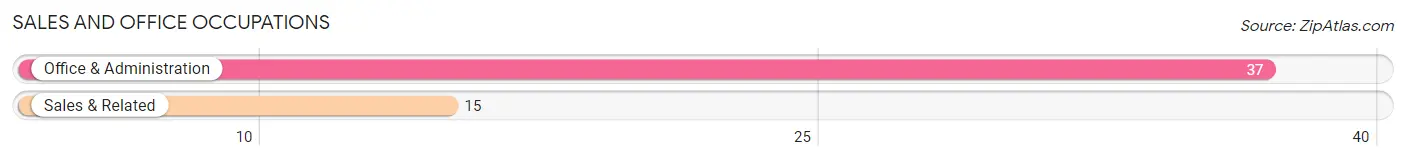
Sales and Office Occupations
The most common Sales and Office occupations in Dobbins Heights are Office & Administration (37 | 17.2%), and Sales & Related (15 | 7.0%).
Sales and Office Occupations by Sex
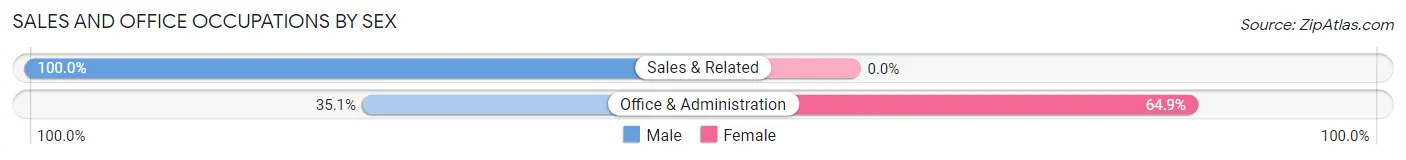
| Occupation | Male | Female |
| Sales & Related | 15 (100.0%) | 0 (0.0%) |
| Office & Administration | 13 (35.1%) | 24 (64.9%) |
| Total (Category) | 28 (53.8%) | 24 (46.2%) |
| Total (Overall) | 153 (71.2%) | 62 (28.8%) |
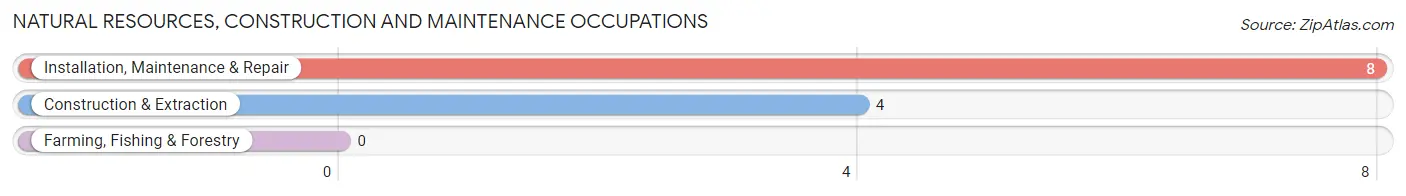
Natural Resources, Construction and Maintenance Occupations
The most common Natural Resources, Construction and Maintenance occupations in Dobbins Heights are Installation, Maintenance & Repair (8 | 3.7%), and Construction & Extraction (4 | 1.9%).
Natural Resources, Construction and Maintenance Occupations by Sex
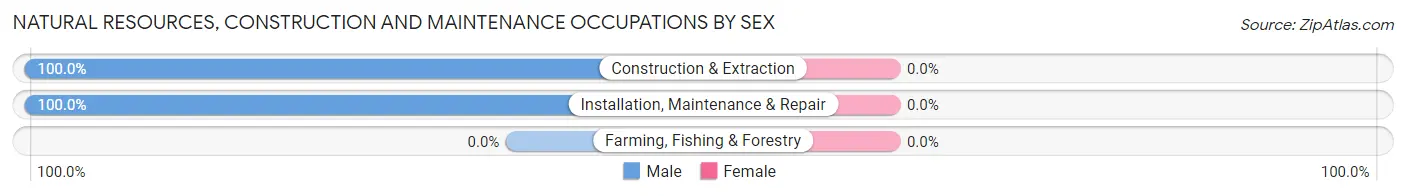
| Occupation | Male | Female |
| Farming, Fishing & Forestry | 0 (0.0%) | 0 (0.0%) |
| Construction & Extraction | 4 (100.0%) | 0 (0.0%) |
| Installation, Maintenance & Repair | 8 (100.0%) | 0 (0.0%) |
| Total (Category) | 12 (100.0%) | 0 (0.0%) |
| Total (Overall) | 153 (71.2%) | 62 (28.8%) |
Production, Transportation and Moving Occupations
The most common Production, Transportation and Moving occupations in Dobbins Heights are Material Moving (42 | 19.5%), Production (10 | 4.6%), and Transportation (9 | 4.2%).
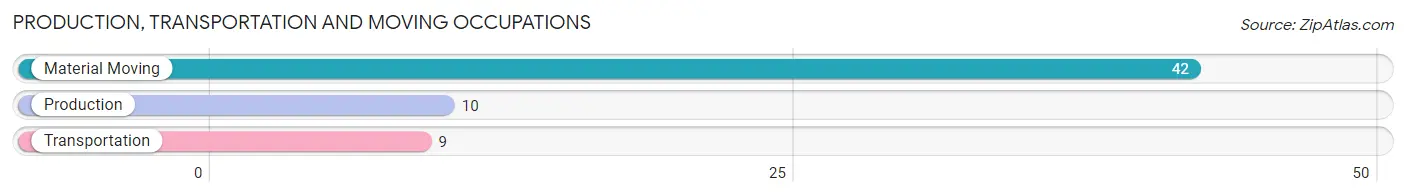
Production, Transportation and Moving Occupations by Sex
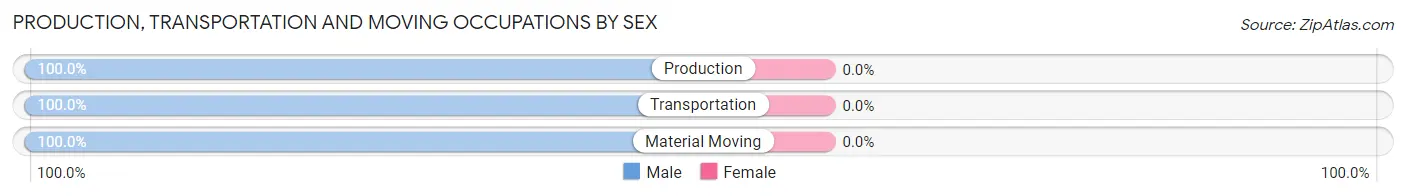
| Occupation | Male | Female |
| Production | 10 (100.0%) | 0 (0.0%) |
| Transportation | 9 (100.0%) | 0 (0.0%) |
| Material Moving | 42 (100.0%) | 0 (0.0%) |
| Total (Category) | 61 (100.0%) | 0 (0.0%) |
| Total (Overall) | 153 (71.2%) | 62 (28.8%) |
Employment Industries by Sex in Dobbins Heights
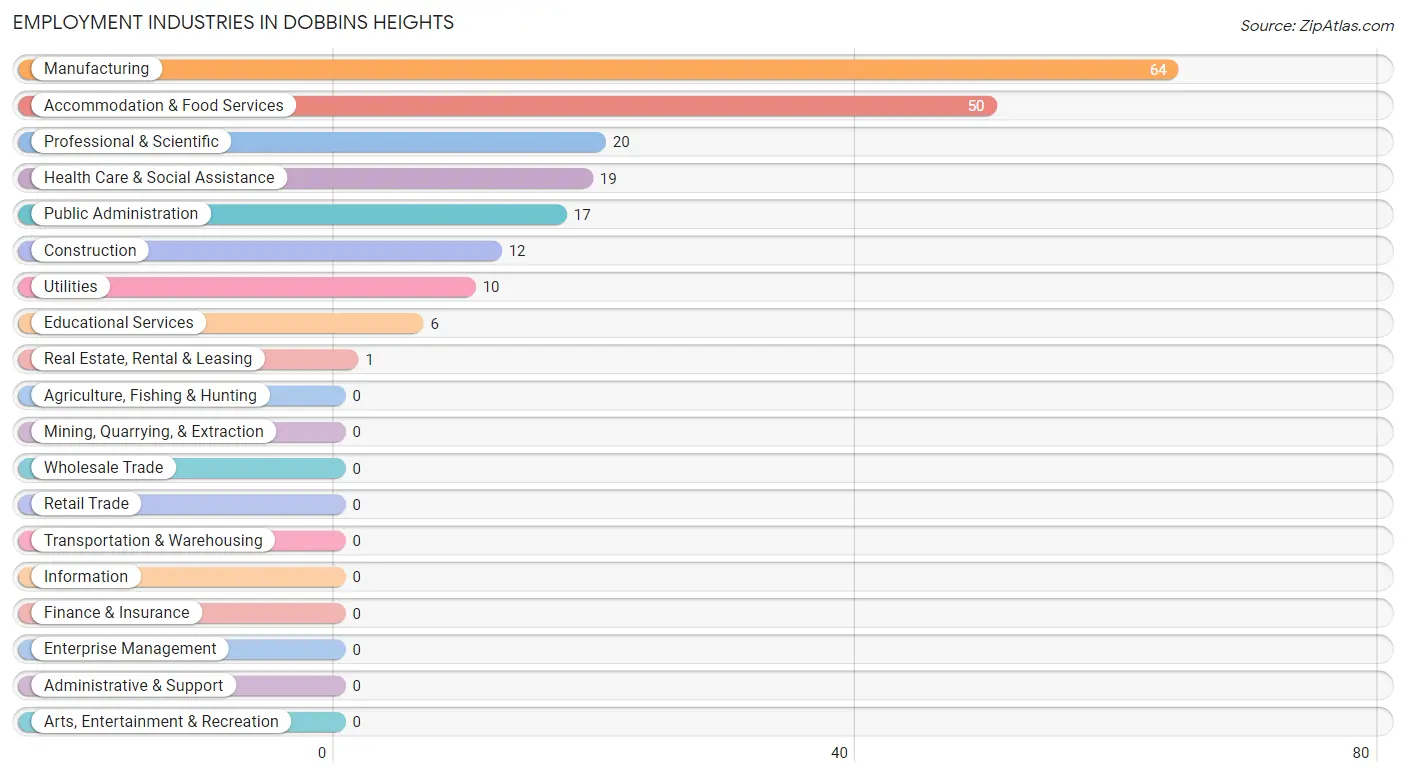
Employment Industries in Dobbins Heights
The major employment industries in Dobbins Heights include Manufacturing (64 | 29.8%), Accommodation & Food Services (50 | 23.3%), Professional & Scientific (20 | 9.3%), Health Care & Social Assistance (19 | 8.8%), and Public Administration (17 | 7.9%).
Employment Industries by Sex in Dobbins Heights
The Dobbins Heights industries that see more men than women are Construction (100.0%), Manufacturing (100.0%), and Utilities (100.0%), whereas the industries that tend to have a higher number of women are Real Estate, Rental & Leasing (100.0%), Professional & Scientific (100.0%), and Health Care & Social Assistance (100.0%).
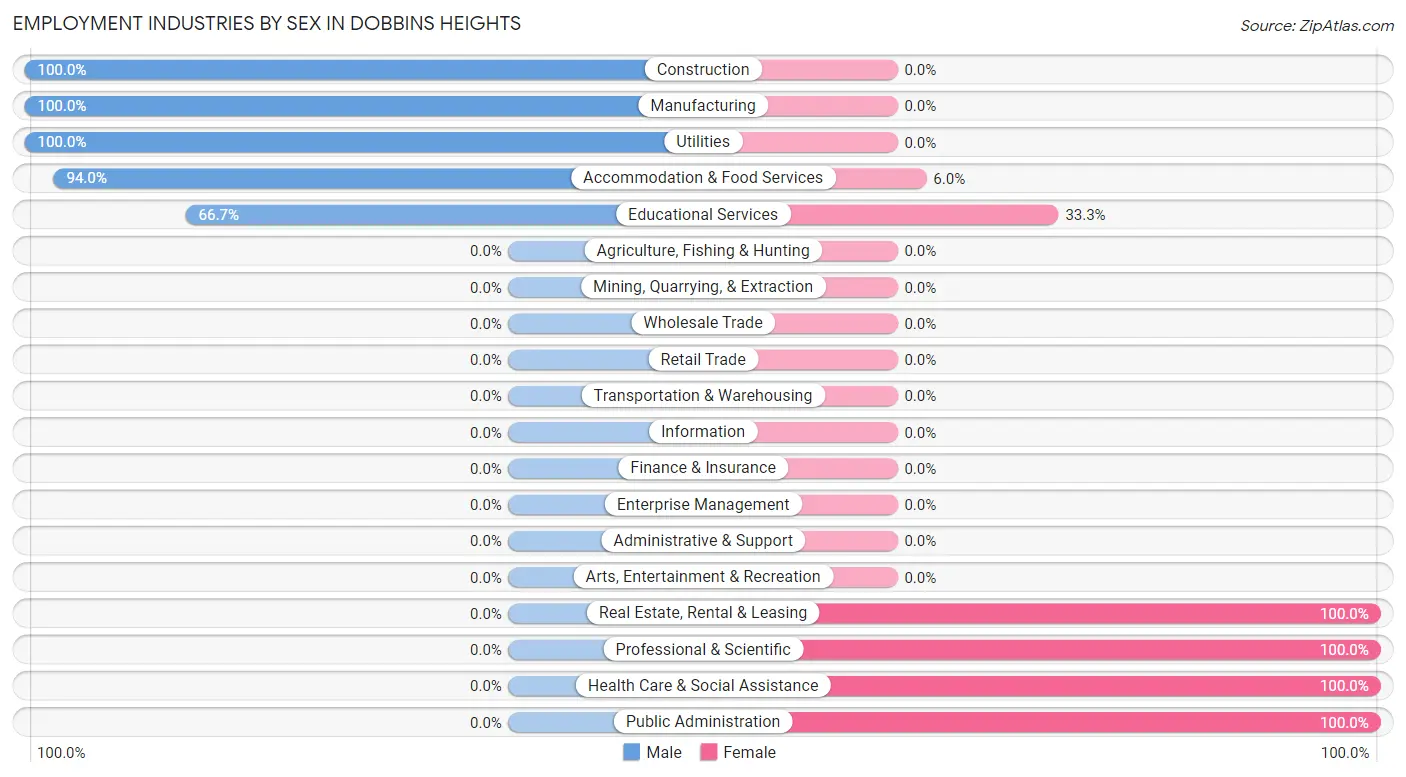
| Industry | Male | Female |
| Agriculture, Fishing & Hunting | 0 (0.0%) | 0 (0.0%) |
| Mining, Quarrying, & Extraction | 0 (0.0%) | 0 (0.0%) |
| Construction | 12 (100.0%) | 0 (0.0%) |
| Manufacturing | 64 (100.0%) | 0 (0.0%) |
| Wholesale Trade | 0 (0.0%) | 0 (0.0%) |
| Retail Trade | 0 (0.0%) | 0 (0.0%) |
| Transportation & Warehousing | 0 (0.0%) | 0 (0.0%) |
| Utilities | 10 (100.0%) | 0 (0.0%) |
| Information | 0 (0.0%) | 0 (0.0%) |
| Finance & Insurance | 0 (0.0%) | 0 (0.0%) |
| Real Estate, Rental & Leasing | 0 (0.0%) | 1 (100.0%) |
| Professional & Scientific | 0 (0.0%) | 20 (100.0%) |
| Enterprise Management | 0 (0.0%) | 0 (0.0%) |
| Administrative & Support | 0 (0.0%) | 0 (0.0%) |
| Educational Services | 4 (66.7%) | 2 (33.3%) |
| Health Care & Social Assistance | 0 (0.0%) | 19 (100.0%) |
| Arts, Entertainment & Recreation | 0 (0.0%) | 0 (0.0%) |
| Accommodation & Food Services | 47 (94.0%) | 3 (6.0%) |
| Public Administration | 0 (0.0%) | 17 (100.0%) |
| Total | 153 (71.2%) | 62 (28.8%) |
Education in Dobbins Heights
School Enrollment in Dobbins Heights
The most common levels of schooling among the 118 students in Dobbins Heights are elementary school (39 | 33.1%), college / undergraduate (35 | 29.7%), and middle school (22 | 18.6%).
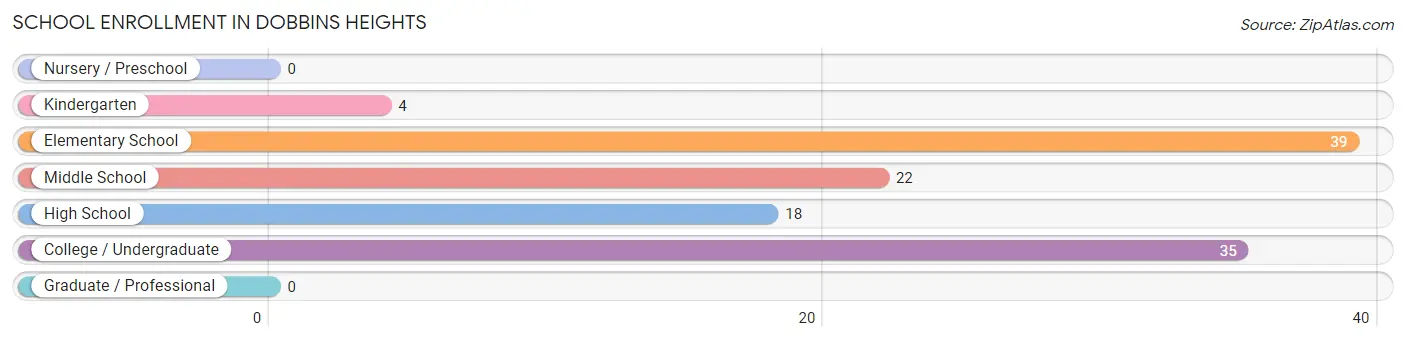
| School Level | # Students | % Students |
| Nursery / Preschool | 0 | 0.0% |
| Kindergarten | 4 | 3.4% |
| Elementary School | 39 | 33.1% |
| Middle School | 22 | 18.6% |
| High School | 18 | 15.2% |
| College / Undergraduate | 35 | 29.7% |
| Graduate / Professional | 0 | 0.0% |
| Total | 118 | 100.0% |
School Enrollment by Age by Funding Source in Dobbins Heights
Out of a total of 118 students who are enrolled in schools in Dobbins Heights, 4 (3.4%) attend a private institution, while the remaining 114 (96.6%) are enrolled in public schools. The age group of 10 to 14 year olds has the highest likelihood of being enrolled in private schools, with 4 (15.4% in the age bracket) enrolled. Conversely, the age group of 5 to 9 year old has the lowest likelihood of being enrolled in a private school, with 39 (100.0% in the age bracket) attending a public institution.
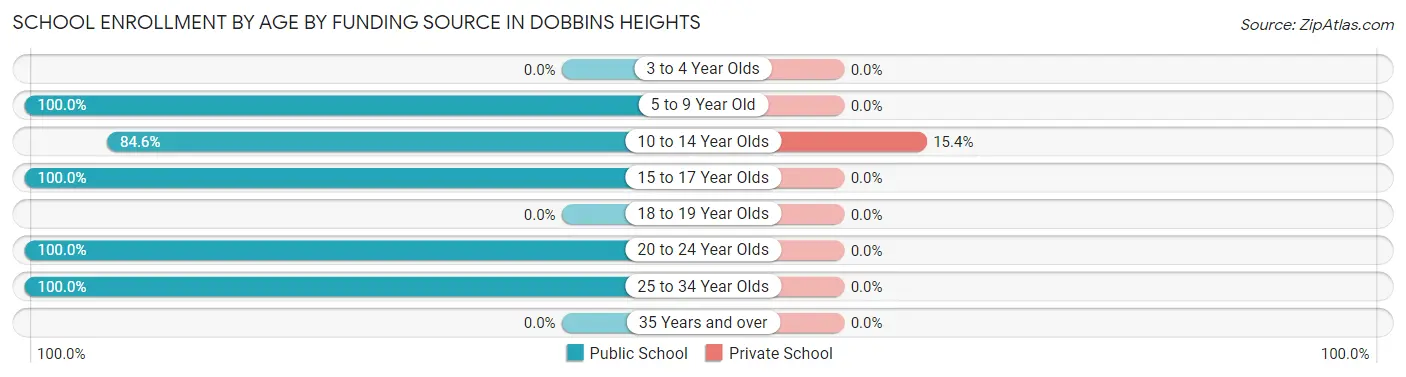
| Age Bracket | Public School | Private School |
| 3 to 4 Year Olds | 0 (0.0%) | 0 (0.0%) |
| 5 to 9 Year Old | 39 (100.0%) | 0 (0.0%) |
| 10 to 14 Year Olds | 22 (84.6%) | 4 (15.4%) |
| 15 to 17 Year Olds | 10 (100.0%) | 0 (0.0%) |
| 18 to 19 Year Olds | 0 (0.0%) | 0 (0.0%) |
| 20 to 24 Year Olds | 8 (100.0%) | 0 (0.0%) |
| 25 to 34 Year Olds | 35 (100.0%) | 0 (0.0%) |
| 35 Years and over | 0 (0.0%) | 0 (0.0%) |
| Total | 114 (96.6%) | 4 (3.4%) |
Educational Attainment by Field of Study in Dobbins Heights
Business (25 | 69.4%), education (5 | 13.9%), science & technology (3 | 8.3%), and arts & humanities (3 | 8.3%) are the most common fields of study among 36 individuals in Dobbins Heights who have obtained a bachelor's degree or higher.
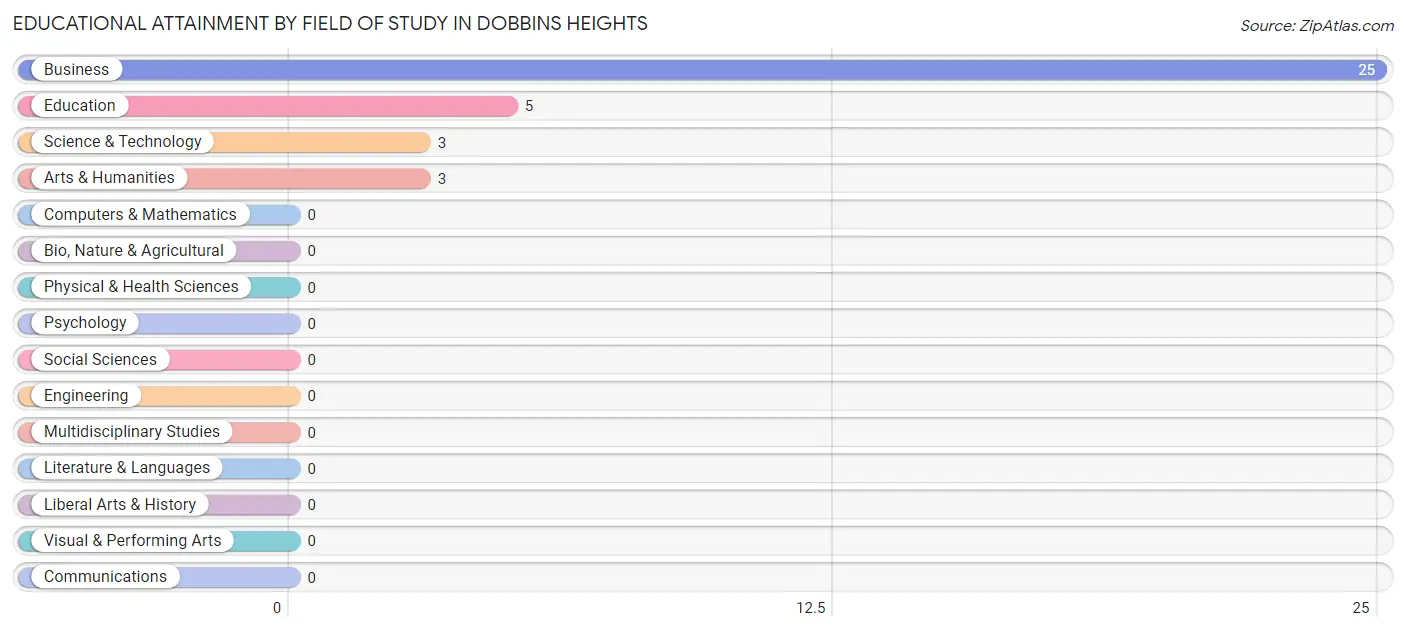
| Field of Study | # Graduates | % Graduates |
| Computers & Mathematics | 0 | 0.0% |
| Bio, Nature & Agricultural | 0 | 0.0% |
| Physical & Health Sciences | 0 | 0.0% |
| Psychology | 0 | 0.0% |
| Social Sciences | 0 | 0.0% |
| Engineering | 0 | 0.0% |
| Multidisciplinary Studies | 0 | 0.0% |
| Science & Technology | 3 | 8.3% |
| Business | 25 | 69.4% |
| Education | 5 | 13.9% |
| Literature & Languages | 0 | 0.0% |
| Liberal Arts & History | 0 | 0.0% |
| Visual & Performing Arts | 0 | 0.0% |
| Communications | 0 | 0.0% |
| Arts & Humanities | 3 | 8.3% |
| Total | 36 | 100.0% |
Transportation & Commute in Dobbins Heights
Vehicle Availability by Sex in Dobbins Heights
The most prevalent vehicle ownership categories in Dobbins Heights are males with 1 vehicle (68, accounting for 44.4%) and females with 1 vehicle (27, making up 109.7%).
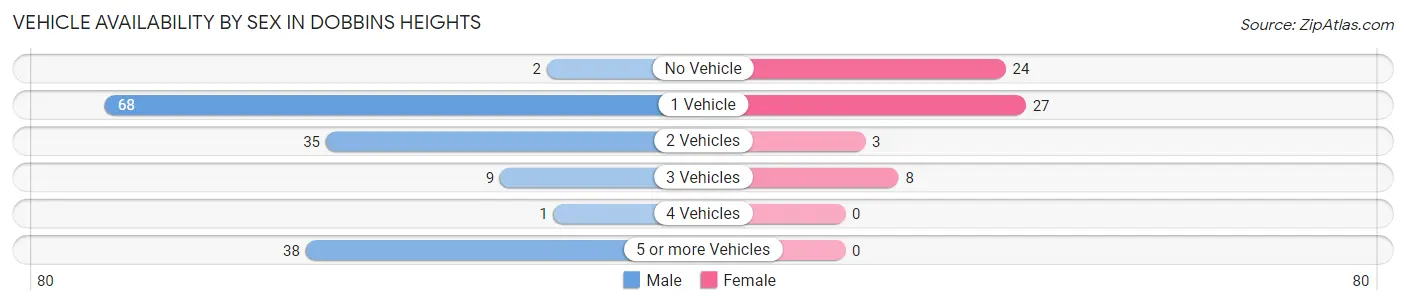
| Vehicles Available | Male | Female |
| No Vehicle | 2 (1.3%) | 24 (38.7%) |
| 1 Vehicle | 68 (44.4%) | 27 (43.5%) |
| 2 Vehicles | 35 (22.9%) | 3 (4.8%) |
| 3 Vehicles | 9 (5.9%) | 8 (12.9%) |
| 4 Vehicles | 1 (0.6%) | 0 (0.0%) |
| 5 or more Vehicles | 38 (24.8%) | 0 (0.0%) |
| Total | 153 (100.0%) | 62 (100.0%) |
Commute Time in Dobbins Heights
The most frequently occuring commute durations in Dobbins Heights are 10 to 14 minutes (99 commuters, 46.7%), 25 to 29 minutes (30 commuters, 14.1%), and 30 to 34 minutes (23 commuters, 10.8%).
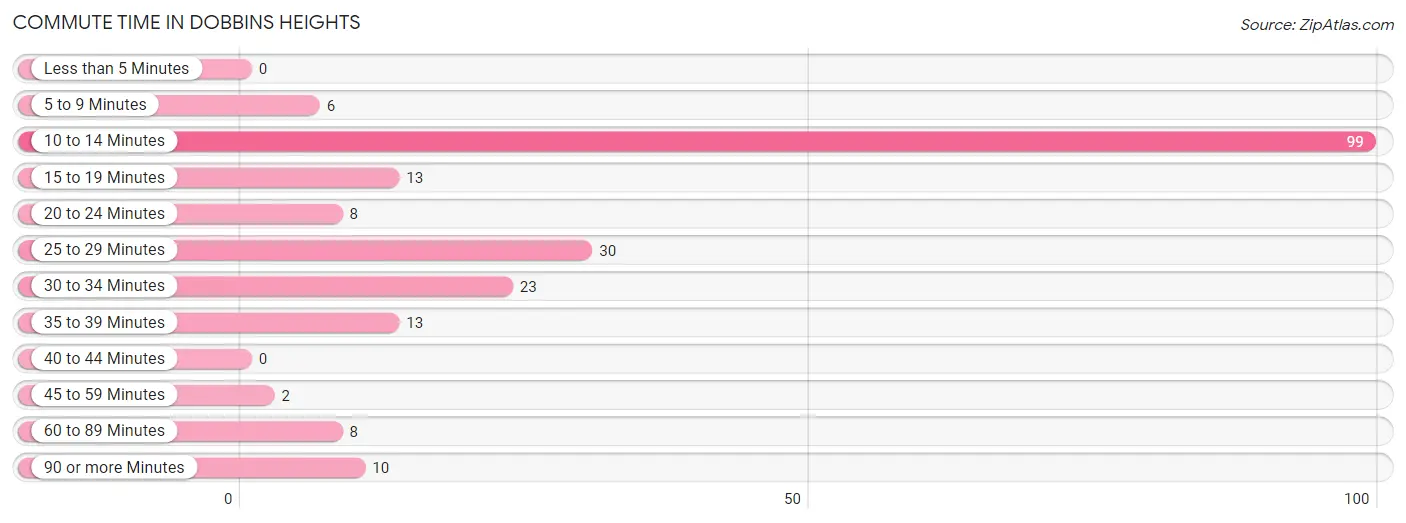
| Commute Time | # Commuters | % Commuters |
| Less than 5 Minutes | 0 | 0.0% |
| 5 to 9 Minutes | 6 | 2.8% |
| 10 to 14 Minutes | 99 | 46.7% |
| 15 to 19 Minutes | 13 | 6.1% |
| 20 to 24 Minutes | 8 | 3.8% |
| 25 to 29 Minutes | 30 | 14.1% |
| 30 to 34 Minutes | 23 | 10.8% |
| 35 to 39 Minutes | 13 | 6.1% |
| 40 to 44 Minutes | 0 | 0.0% |
| 45 to 59 Minutes | 2 | 0.9% |
| 60 to 89 Minutes | 8 | 3.8% |
| 90 or more Minutes | 10 | 4.7% |
Commute Time by Sex in Dobbins Heights
The most common commute times in Dobbins Heights are 10 to 14 minutes (74 commuters, 48.4%) for males and 10 to 14 minutes (25 commuters, 42.4%) for females.
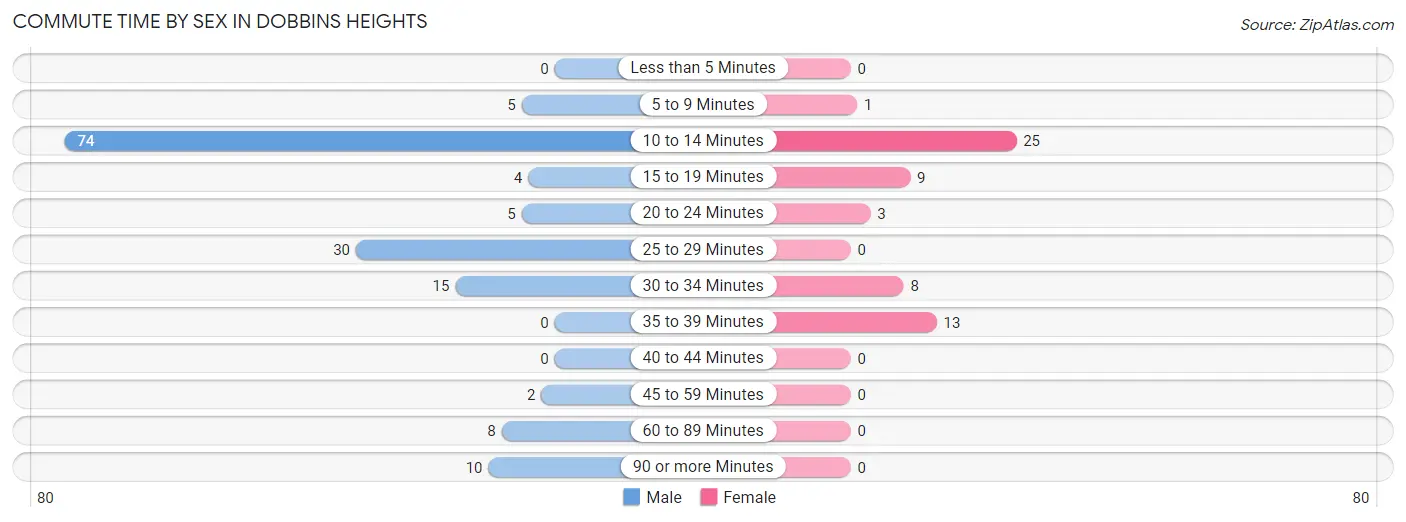
| Commute Time | Male | Female |
| Less than 5 Minutes | 0 (0.0%) | 0 (0.0%) |
| 5 to 9 Minutes | 5 (3.3%) | 1 (1.7%) |
| 10 to 14 Minutes | 74 (48.4%) | 25 (42.4%) |
| 15 to 19 Minutes | 4 (2.6%) | 9 (15.2%) |
| 20 to 24 Minutes | 5 (3.3%) | 3 (5.1%) |
| 25 to 29 Minutes | 30 (19.6%) | 0 (0.0%) |
| 30 to 34 Minutes | 15 (9.8%) | 8 (13.6%) |
| 35 to 39 Minutes | 0 (0.0%) | 13 (22.0%) |
| 40 to 44 Minutes | 0 (0.0%) | 0 (0.0%) |
| 45 to 59 Minutes | 2 (1.3%) | 0 (0.0%) |
| 60 to 89 Minutes | 8 (5.2%) | 0 (0.0%) |
| 90 or more Minutes | 10 (6.5%) | 0 (0.0%) |
Time of Departure to Work by Sex in Dobbins Heights
The most frequent times of departure to work in Dobbins Heights are 4:00 PM to 11:59 PM (47, 30.7%) for males and 8:30 AM to 8:59 AM (20, 33.9%) for females.
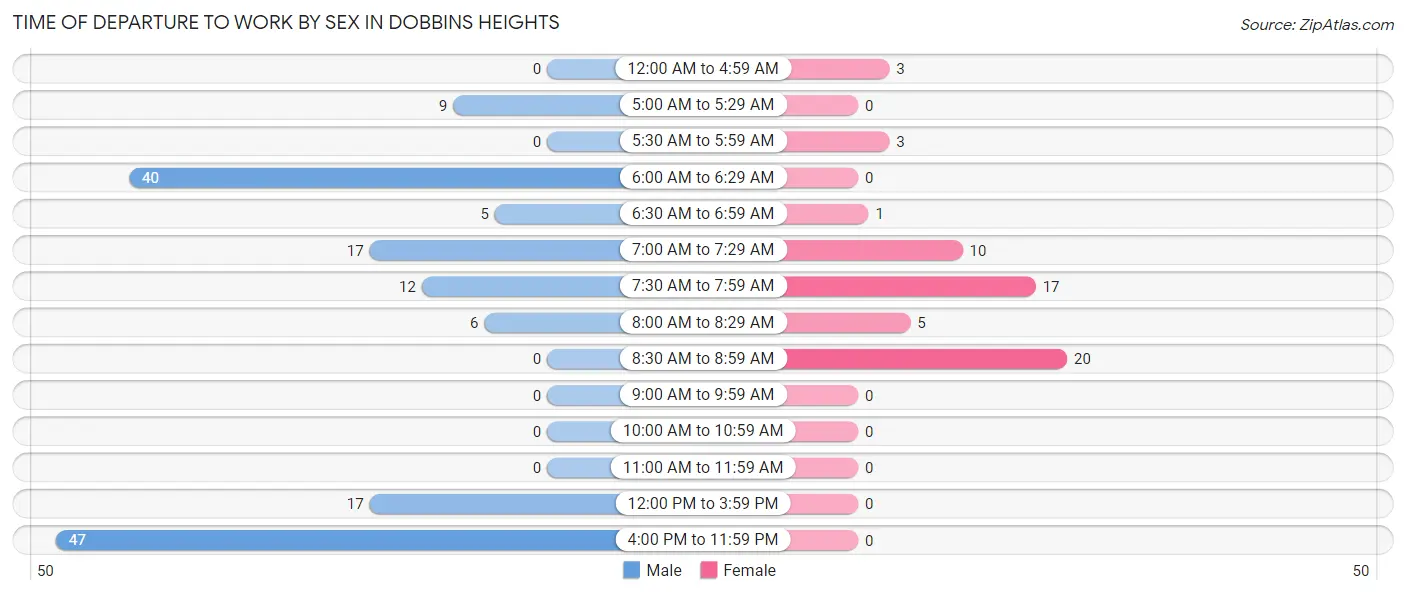
| Time of Departure | Male | Female |
| 12:00 AM to 4:59 AM | 0 (0.0%) | 3 (5.1%) |
| 5:00 AM to 5:29 AM | 9 (5.9%) | 0 (0.0%) |
| 5:30 AM to 5:59 AM | 0 (0.0%) | 3 (5.1%) |
| 6:00 AM to 6:29 AM | 40 (26.1%) | 0 (0.0%) |
| 6:30 AM to 6:59 AM | 5 (3.3%) | 1 (1.7%) |
| 7:00 AM to 7:29 AM | 17 (11.1%) | 10 (17.0%) |
| 7:30 AM to 7:59 AM | 12 (7.8%) | 17 (28.8%) |
| 8:00 AM to 8:29 AM | 6 (3.9%) | 5 (8.5%) |
| 8:30 AM to 8:59 AM | 0 (0.0%) | 20 (33.9%) |
| 9:00 AM to 9:59 AM | 0 (0.0%) | 0 (0.0%) |
| 10:00 AM to 10:59 AM | 0 (0.0%) | 0 (0.0%) |
| 11:00 AM to 11:59 AM | 0 (0.0%) | 0 (0.0%) |
| 12:00 PM to 3:59 PM | 17 (11.1%) | 0 (0.0%) |
| 4:00 PM to 11:59 PM | 47 (30.7%) | 0 (0.0%) |
| Total | 153 (100.0%) | 59 (100.0%) |
Housing Occupancy in Dobbins Heights
Occupancy by Ownership in Dobbins Heights
Of the total 338 dwellings in Dobbins Heights, owner-occupied units account for 184 (54.4%), while renter-occupied units make up 154 (45.6%).
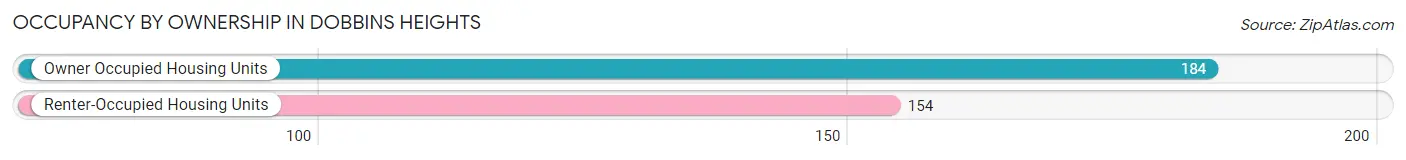
| Occupancy | # Housing Units | % Housing Units |
| Owner Occupied Housing Units | 184 | 54.4% |
| Renter-Occupied Housing Units | 154 | 45.6% |
| Total Occupied Housing Units | 338 | 100.0% |
Occupancy by Household Size in Dobbins Heights
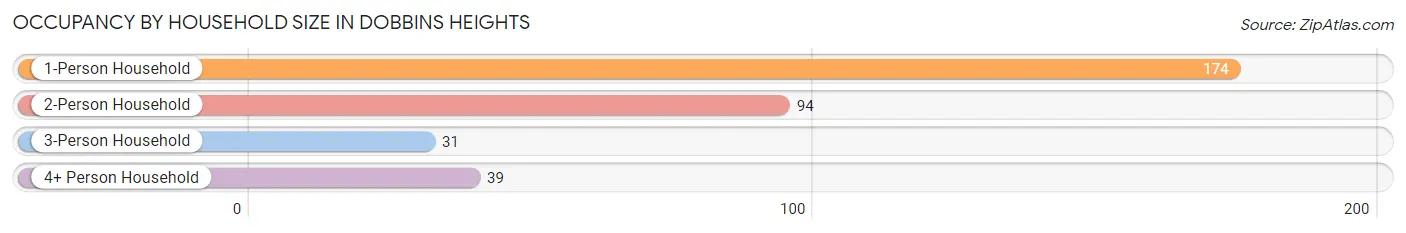
| Household Size | # Housing Units | % Housing Units |
| 1-Person Household | 174 | 51.5% |
| 2-Person Household | 94 | 27.8% |
| 3-Person Household | 31 | 9.2% |
| 4+ Person Household | 39 | 11.5% |
| Total Housing Units | 338 | 100.0% |
Occupancy by Ownership by Household Size in Dobbins Heights
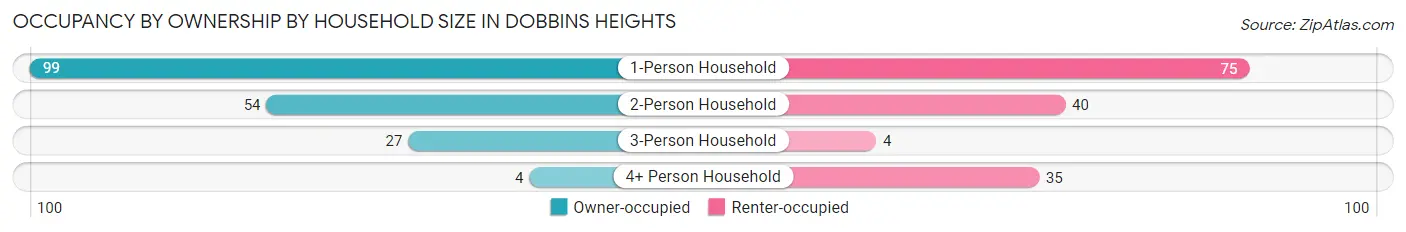
| Household Size | Owner-occupied | Renter-occupied |
| 1-Person Household | 99 (56.9%) | 75 (43.1%) |
| 2-Person Household | 54 (57.5%) | 40 (42.5%) |
| 3-Person Household | 27 (87.1%) | 4 (12.9%) |
| 4+ Person Household | 4 (10.3%) | 35 (89.7%) |
| Total Housing Units | 184 (54.4%) | 154 (45.6%) |
Occupancy by Educational Attainment in Dobbins Heights
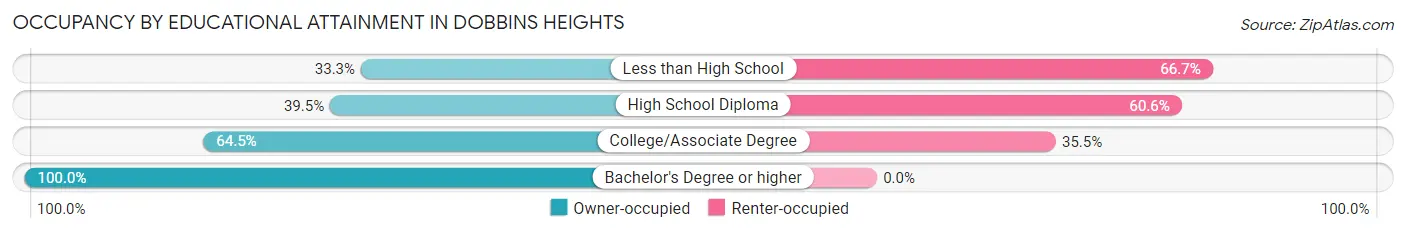
| Household Size | Owner-occupied | Renter-occupied |
| Less than High School | 19 (33.3%) | 38 (66.7%) |
| High School Diploma | 43 (39.5%) | 66 (60.6%) |
| College/Associate Degree | 91 (64.5%) | 50 (35.5%) |
| Bachelor's Degree or higher | 31 (100.0%) | 0 (0.0%) |
Occupancy by Age of Householder in Dobbins Heights
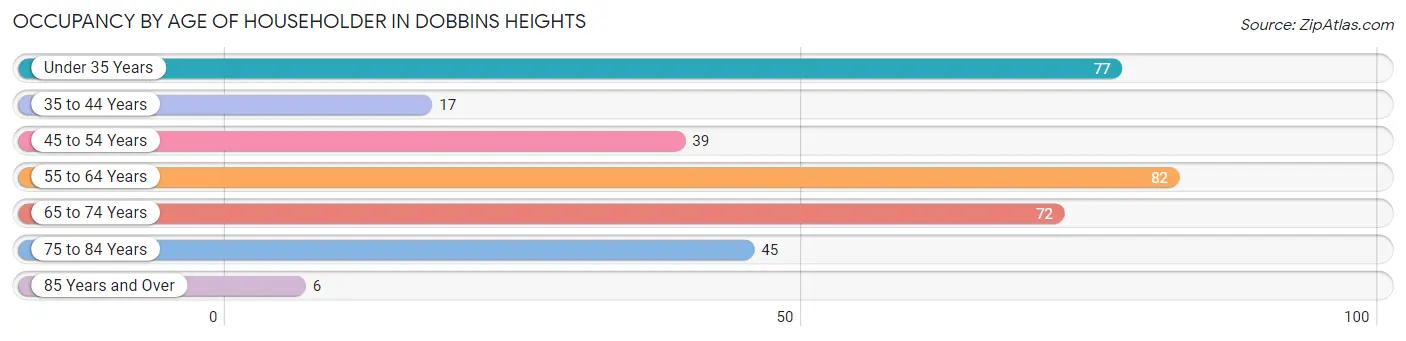
| Age Bracket | # Households | % Households |
| Under 35 Years | 77 | 22.8% |
| 35 to 44 Years | 17 | 5.0% |
| 45 to 54 Years | 39 | 11.5% |
| 55 to 64 Years | 82 | 24.3% |
| 65 to 74 Years | 72 | 21.3% |
| 75 to 84 Years | 45 | 13.3% |
| 85 Years and Over | 6 | 1.8% |
| Total | 338 | 100.0% |
Housing Finances in Dobbins Heights
Median Income by Occupancy in Dobbins Heights
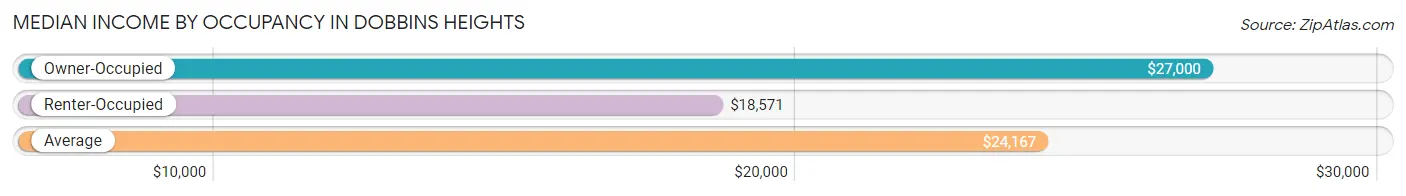
| Occupancy Type | # Households | Median Income |
| Owner-Occupied | 184 (54.4%) | $27,000 |
| Renter-Occupied | 154 (45.6%) | $18,571 |
| Average | 338 (100.0%) | $24,167 |
Occupancy by Householder Income Bracket in Dobbins Heights
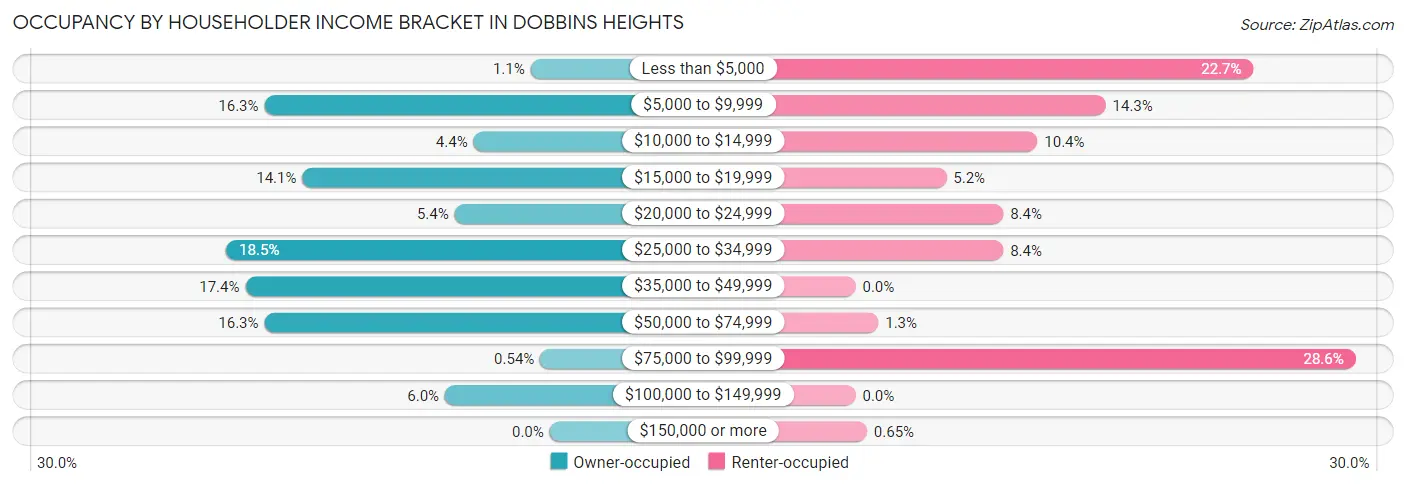
| Income Bracket | Owner-occupied | Renter-occupied |
| Less than $5,000 | 2 (1.1%) | 35 (22.7%) |
| $5,000 to $9,999 | 30 (16.3%) | 22 (14.3%) |
| $10,000 to $14,999 | 8 (4.3%) | 16 (10.4%) |
| $15,000 to $19,999 | 26 (14.1%) | 8 (5.2%) |
| $20,000 to $24,999 | 10 (5.4%) | 13 (8.4%) |
| $25,000 to $34,999 | 34 (18.5%) | 13 (8.4%) |
| $35,000 to $49,999 | 32 (17.4%) | 0 (0.0%) |
| $50,000 to $74,999 | 30 (16.3%) | 2 (1.3%) |
| $75,000 to $99,999 | 1 (0.5%) | 44 (28.6%) |
| $100,000 to $149,999 | 11 (6.0%) | 0 (0.0%) |
| $150,000 or more | 0 (0.0%) | 1 (0.6%) |
| Total | 184 (100.0%) | 154 (100.0%) |
Monthly Housing Cost Tiers in Dobbins Heights
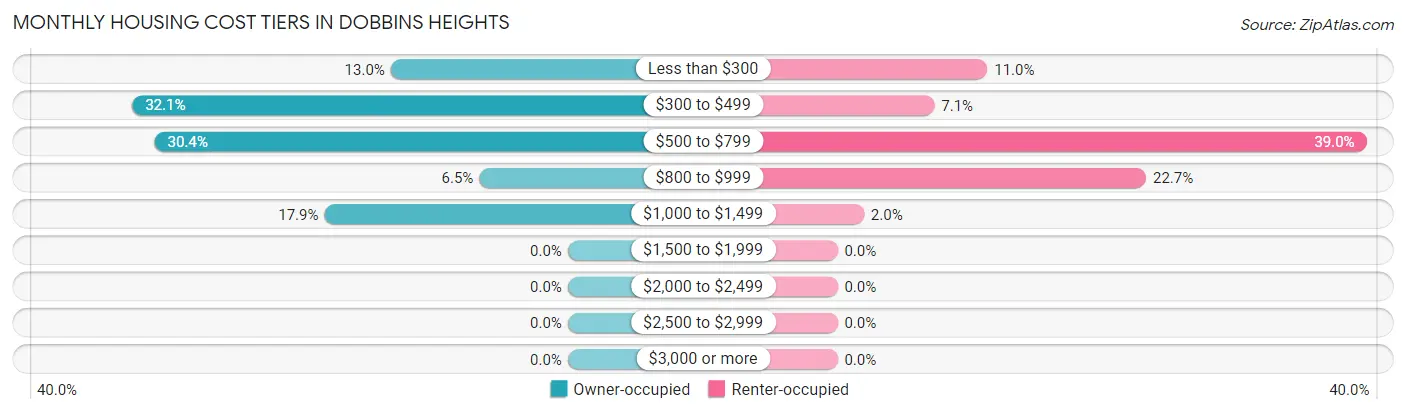
| Monthly Cost | Owner-occupied | Renter-occupied |
| Less than $300 | 24 (13.0%) | 17 (11.0%) |
| $300 to $499 | 59 (32.1%) | 11 (7.1%) |
| $500 to $799 | 56 (30.4%) | 60 (39.0%) |
| $800 to $999 | 12 (6.5%) | 35 (22.7%) |
| $1,000 to $1,499 | 33 (17.9%) | 3 (1.9%) |
| $1,500 to $1,999 | 0 (0.0%) | 0 (0.0%) |
| $2,000 to $2,499 | 0 (0.0%) | 0 (0.0%) |
| $2,500 to $2,999 | 0 (0.0%) | 0 (0.0%) |
| $3,000 or more | 0 (0.0%) | 0 (0.0%) |
| Total | 184 (100.0%) | 154 (100.0%) |
Physical Housing Characteristics in Dobbins Heights
Housing Structures in Dobbins Heights
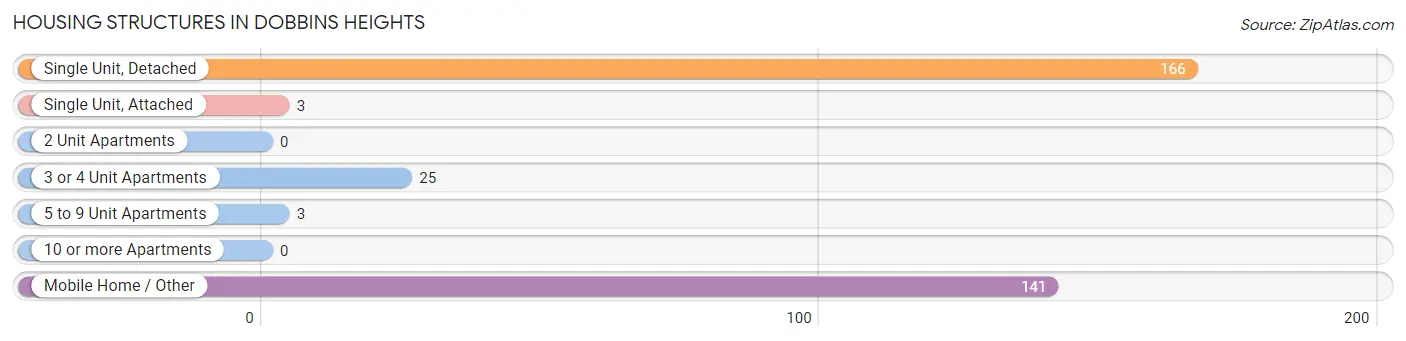
| Structure Type | # Housing Units | % Housing Units |
| Single Unit, Detached | 166 | 49.1% |
| Single Unit, Attached | 3 | 0.9% |
| 2 Unit Apartments | 0 | 0.0% |
| 3 or 4 Unit Apartments | 25 | 7.4% |
| 5 to 9 Unit Apartments | 3 | 0.9% |
| 10 or more Apartments | 0 | 0.0% |
| Mobile Home / Other | 141 | 41.7% |
| Total | 338 | 100.0% |
Housing Structures by Occupancy in Dobbins Heights
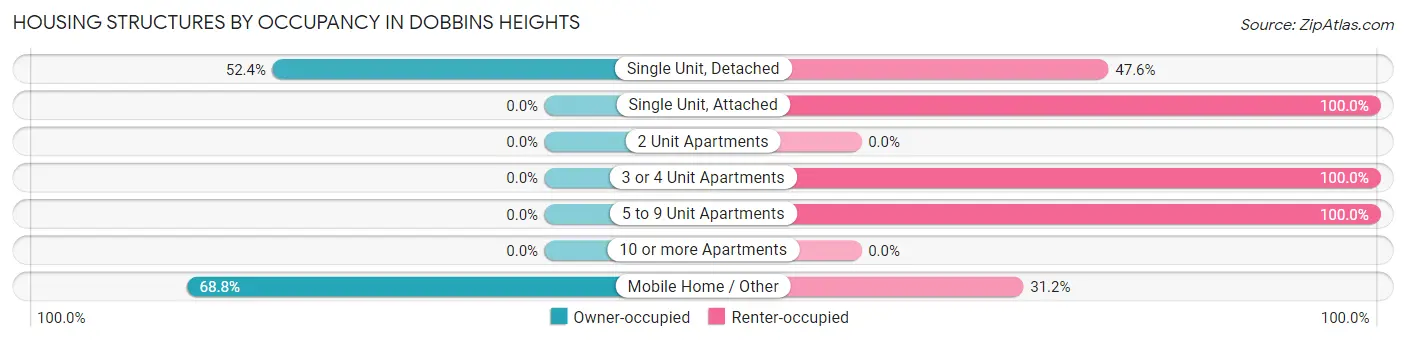
| Structure Type | Owner-occupied | Renter-occupied |
| Single Unit, Detached | 87 (52.4%) | 79 (47.6%) |
| Single Unit, Attached | 0 (0.0%) | 3 (100.0%) |
| 2 Unit Apartments | 0 (0.0%) | 0 (0.0%) |
| 3 or 4 Unit Apartments | 0 (0.0%) | 25 (100.0%) |
| 5 to 9 Unit Apartments | 0 (0.0%) | 3 (100.0%) |
| 10 or more Apartments | 0 (0.0%) | 0 (0.0%) |
| Mobile Home / Other | 97 (68.8%) | 44 (31.2%) |
| Total | 184 (54.4%) | 154 (45.6%) |
Housing Structures by Number of Rooms in Dobbins Heights
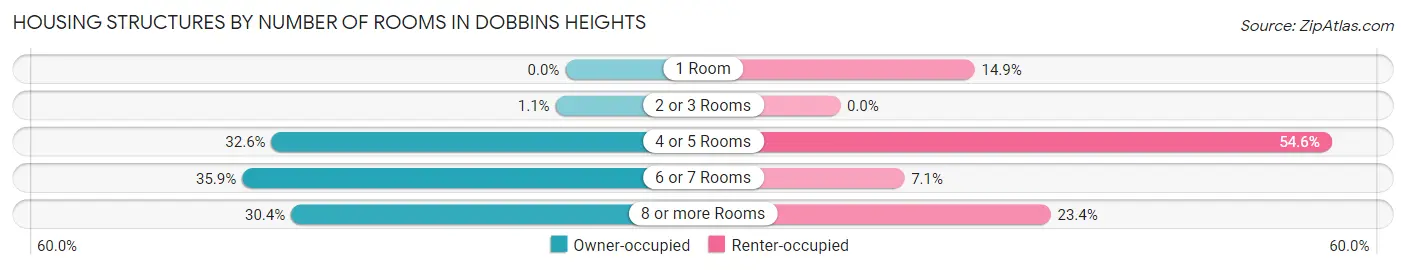
| Number of Rooms | Owner-occupied | Renter-occupied |
| 1 Room | 0 (0.0%) | 23 (14.9%) |
| 2 or 3 Rooms | 2 (1.1%) | 0 (0.0%) |
| 4 or 5 Rooms | 60 (32.6%) | 84 (54.5%) |
| 6 or 7 Rooms | 66 (35.9%) | 11 (7.1%) |
| 8 or more Rooms | 56 (30.4%) | 36 (23.4%) |
| Total | 184 (100.0%) | 154 (100.0%) |
Housing Structure by Heating Type in Dobbins Heights
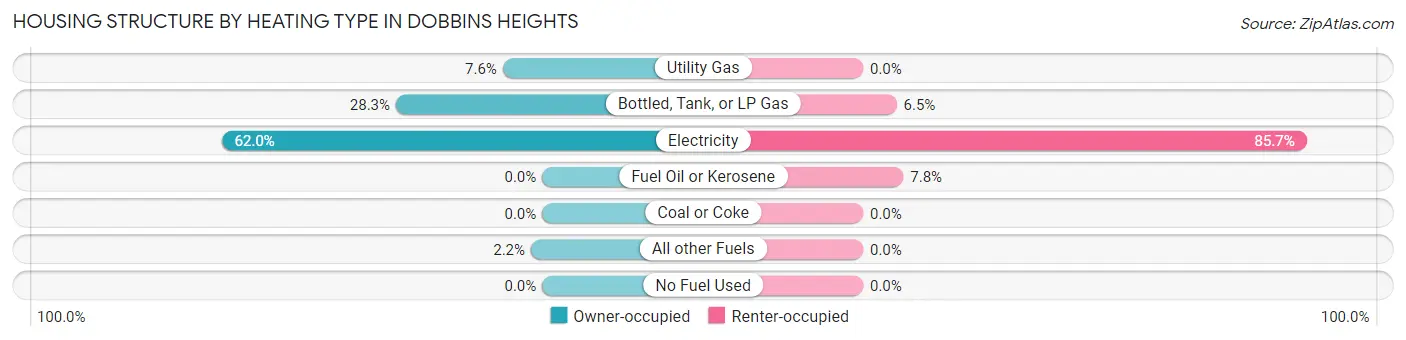
| Heating Type | Owner-occupied | Renter-occupied |
| Utility Gas | 14 (7.6%) | 0 (0.0%) |
| Bottled, Tank, or LP Gas | 52 (28.3%) | 10 (6.5%) |
| Electricity | 114 (62.0%) | 132 (85.7%) |
| Fuel Oil or Kerosene | 0 (0.0%) | 12 (7.8%) |
| Coal or Coke | 0 (0.0%) | 0 (0.0%) |
| All other Fuels | 4 (2.2%) | 0 (0.0%) |
| No Fuel Used | 0 (0.0%) | 0 (0.0%) |
| Total | 184 (100.0%) | 154 (100.0%) |
Household Vehicle Usage in Dobbins Heights
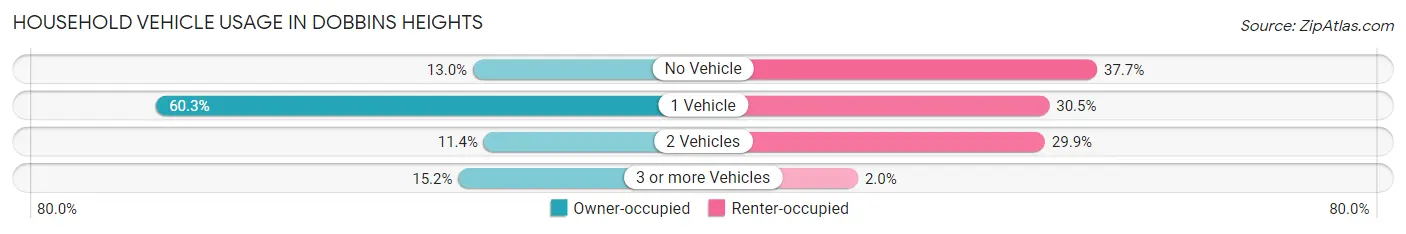
| Vehicles per Household | Owner-occupied | Renter-occupied |
| No Vehicle | 24 (13.0%) | 58 (37.7%) |
| 1 Vehicle | 111 (60.3%) | 47 (30.5%) |
| 2 Vehicles | 21 (11.4%) | 46 (29.9%) |
| 3 or more Vehicles | 28 (15.2%) | 3 (1.9%) |
| Total | 184 (100.0%) | 154 (100.0%) |
Real Estate & Mortgages in Dobbins Heights
Real Estate and Mortgage Overview in Dobbins Heights
| Characteristic | Without Mortgage | With Mortgage |
| Housing Units | 135 | 49 |
| Median Property Value | $42,900 | $92,300 |
| Median Household Income | $21,250 | $0 |
| Monthly Housing Costs | $456 | $0 |
| Real Estate Taxes | $603 | $0 |
Property Value by Mortgage Status in Dobbins Heights
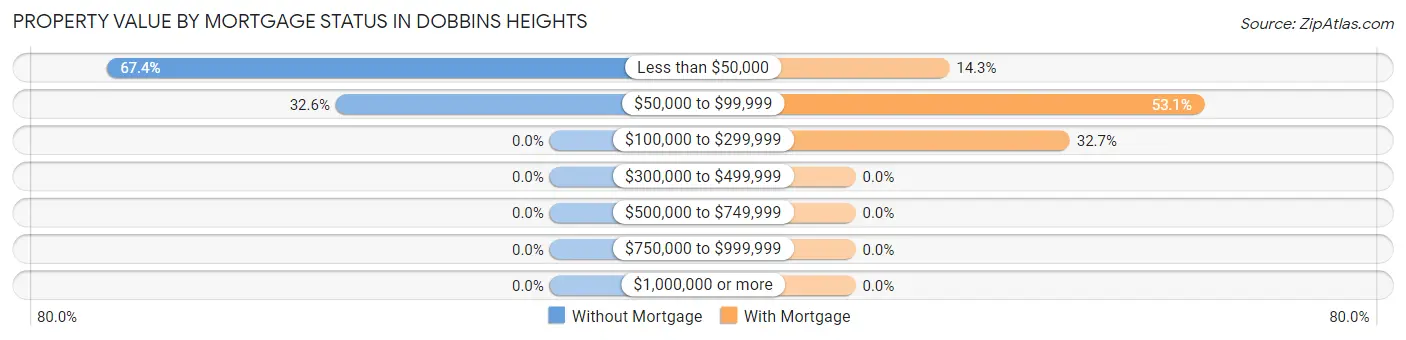
| Property Value | Without Mortgage | With Mortgage |
| Less than $50,000 | 91 (67.4%) | 7 (14.3%) |
| $50,000 to $99,999 | 44 (32.6%) | 26 (53.1%) |
| $100,000 to $299,999 | 0 (0.0%) | 16 (32.7%) |
| $300,000 to $499,999 | 0 (0.0%) | 0 (0.0%) |
| $500,000 to $749,999 | 0 (0.0%) | 0 (0.0%) |
| $750,000 to $999,999 | 0 (0.0%) | 0 (0.0%) |
| $1,000,000 or more | 0 (0.0%) | 0 (0.0%) |
| Total | 135 (100.0%) | 49 (100.0%) |
Household Income by Mortgage Status in Dobbins Heights
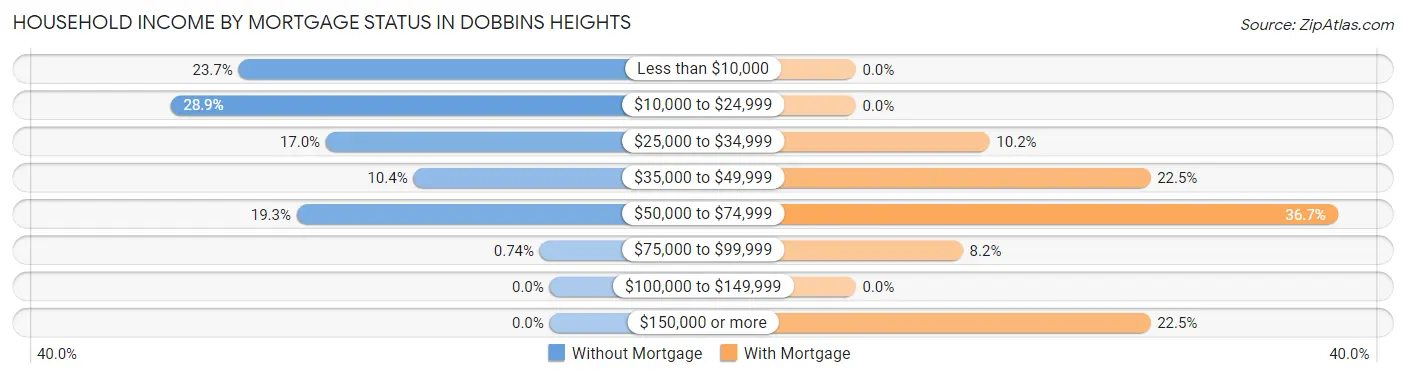
| Household Income | Without Mortgage | With Mortgage |
| Less than $10,000 | 32 (23.7%) | 0 (0.0%) |
| $10,000 to $24,999 | 39 (28.9%) | 0 (0.0%) |
| $25,000 to $34,999 | 23 (17.0%) | 5 (10.2%) |
| $35,000 to $49,999 | 14 (10.4%) | 11 (22.5%) |
| $50,000 to $74,999 | 26 (19.3%) | 18 (36.7%) |
| $75,000 to $99,999 | 1 (0.7%) | 4 (8.2%) |
| $100,000 to $149,999 | 0 (0.0%) | 0 (0.0%) |
| $150,000 or more | 0 (0.0%) | 11 (22.5%) |
| Total | 135 (100.0%) | 49 (100.0%) |
Property Value to Household Income Ratio in Dobbins Heights
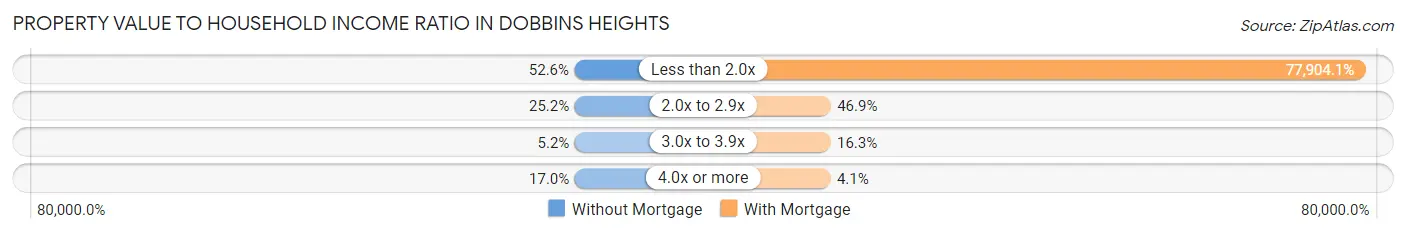
| Value-to-Income Ratio | Without Mortgage | With Mortgage |
| Less than 2.0x | 71 (52.6%) | 38,173 (77,904.1%) |
| 2.0x to 2.9x | 34 (25.2%) | 23 (46.9%) |
| 3.0x to 3.9x | 7 (5.2%) | 8 (16.3%) |
| 4.0x or more | 23 (17.0%) | 2 (4.1%) |
| Total | 135 (100.0%) | 49 (100.0%) |
Real Estate Taxes by Mortgage Status in Dobbins Heights
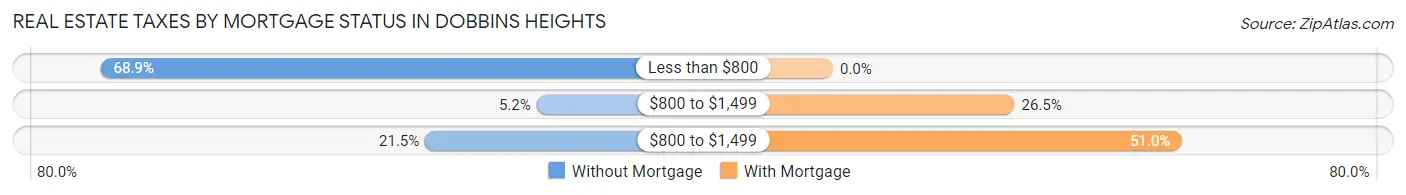
| Property Taxes | Without Mortgage | With Mortgage |
| Less than $800 | 93 (68.9%) | 0 (0.0%) |
| $800 to $1,499 | 7 (5.2%) | 13 (26.5%) |
| $800 to $1,499 | 29 (21.5%) | 25 (51.0%) |
| Total | 135 (100.0%) | 49 (100.0%) |
Health & Disability in Dobbins Heights
Health Insurance Coverage by Age in Dobbins Heights
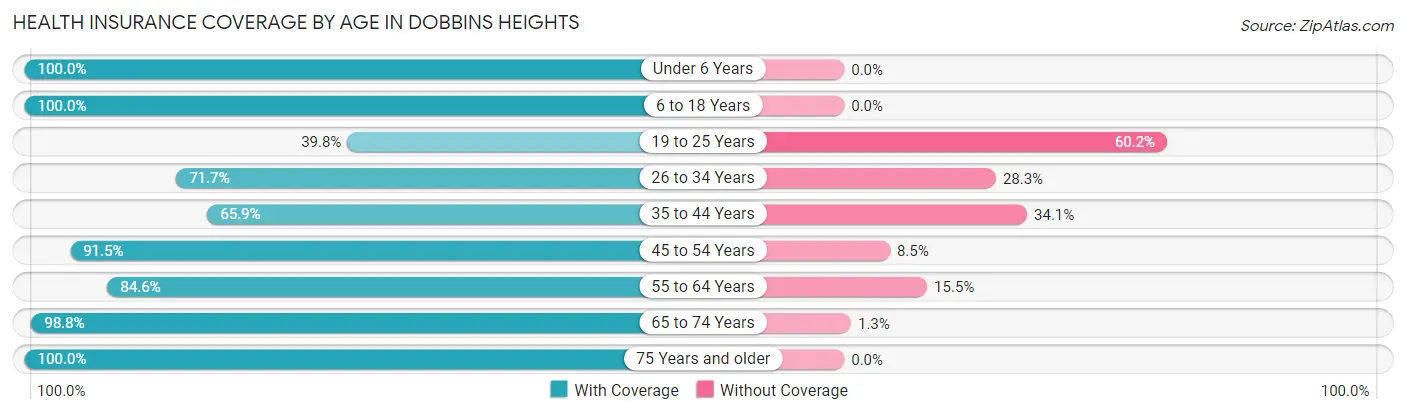
| Age Bracket | With Coverage | Without Coverage |
| Under 6 Years | 7 (100.0%) | 0 (0.0%) |
| 6 to 18 Years | 71 (100.0%) | 0 (0.0%) |
| 19 to 25 Years | 49 (39.8%) | 74 (60.2%) |
| 26 to 34 Years | 71 (71.7%) | 28 (28.3%) |
| 35 to 44 Years | 29 (65.9%) | 15 (34.1%) |
| 45 to 54 Years | 43 (91.5%) | 4 (8.5%) |
| 55 to 64 Years | 104 (84.6%) | 19 (15.4%) |
| 65 to 74 Years | 79 (98.8%) | 1 (1.3%) |
| 75 Years and older | 51 (100.0%) | 0 (0.0%) |
| Total | 504 (78.1%) | 141 (21.9%) |
Health Insurance Coverage by Citizenship Status in Dobbins Heights
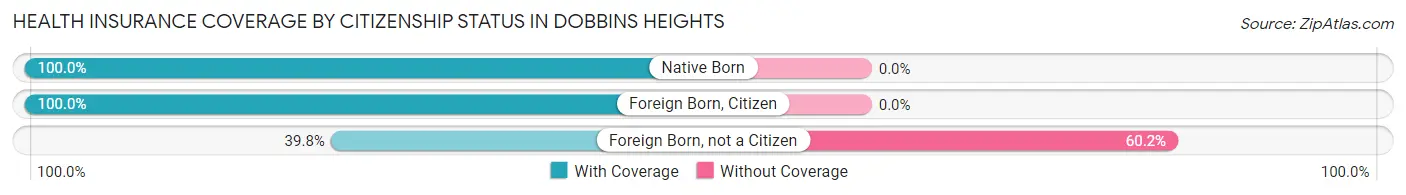
| Citizenship Status | With Coverage | Without Coverage |
| Native Born | 7 (100.0%) | 0 (0.0%) |
| Foreign Born, Citizen | 71 (100.0%) | 0 (0.0%) |
| Foreign Born, not a Citizen | 49 (39.8%) | 74 (60.2%) |
Health Insurance Coverage by Household Income in Dobbins Heights
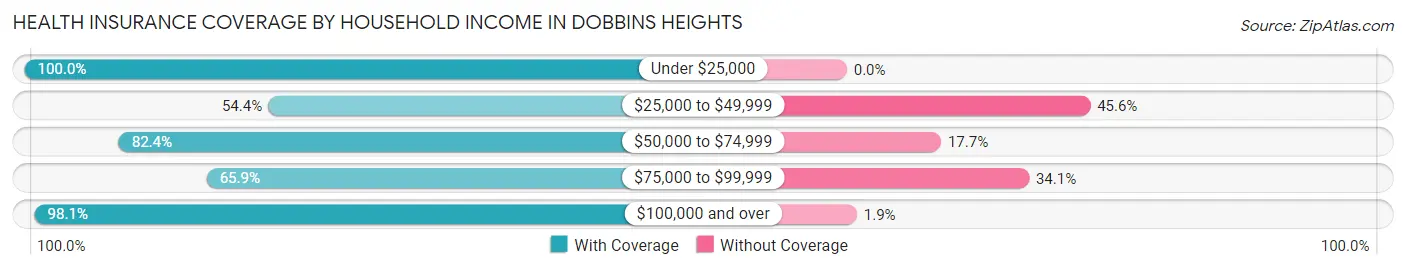
| Household Income | With Coverage | Without Coverage |
| Under $25,000 | 222 (100.0%) | 0 (0.0%) |
| $25,000 to $49,999 | 105 (54.4%) | 88 (45.6%) |
| $50,000 to $74,999 | 42 (82.4%) | 9 (17.6%) |
| $75,000 to $99,999 | 83 (65.9%) | 43 (34.1%) |
| $100,000 and over | 52 (98.1%) | 1 (1.9%) |
Public vs Private Health Insurance Coverage by Age in Dobbins Heights
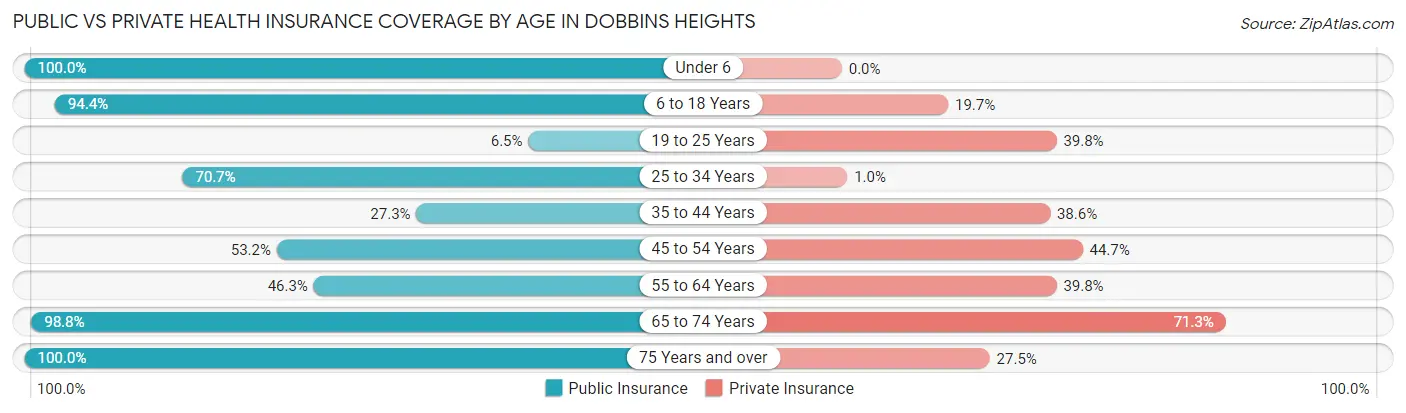
| Age Bracket | Public Insurance | Private Insurance |
| Under 6 | 7 (100.0%) | 0 (0.0%) |
| 6 to 18 Years | 67 (94.4%) | 14 (19.7%) |
| 19 to 25 Years | 8 (6.5%) | 49 (39.8%) |
| 25 to 34 Years | 70 (70.7%) | 1 (1.0%) |
| 35 to 44 Years | 12 (27.3%) | 17 (38.6%) |
| 45 to 54 Years | 25 (53.2%) | 21 (44.7%) |
| 55 to 64 Years | 57 (46.3%) | 49 (39.8%) |
| 65 to 74 Years | 79 (98.8%) | 57 (71.3%) |
| 75 Years and over | 51 (100.0%) | 14 (27.5%) |
| Total | 376 (58.3%) | 222 (34.4%) |
Disability Status by Sex by Age in Dobbins Heights
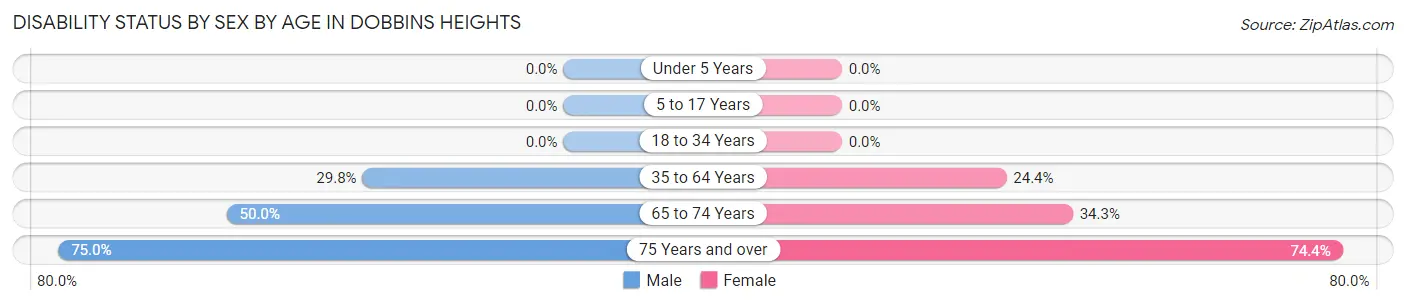
| Age Bracket | Male | Female |
| Under 5 Years | 0 (0.0%) | 0 (0.0%) |
| 5 to 17 Years | 0 (0.0%) | 0 (0.0%) |
| 18 to 34 Years | 0 (0.0%) | 0 (0.0%) |
| 35 to 64 Years | 37 (29.8%) | 22 (24.4%) |
| 65 to 74 Years | 5 (50.0%) | 24 (34.3%) |
| 75 Years and over | 9 (75.0%) | 29 (74.4%) |
Disability Class by Sex by Age in Dobbins Heights
Disability Class: Hearing Difficulty
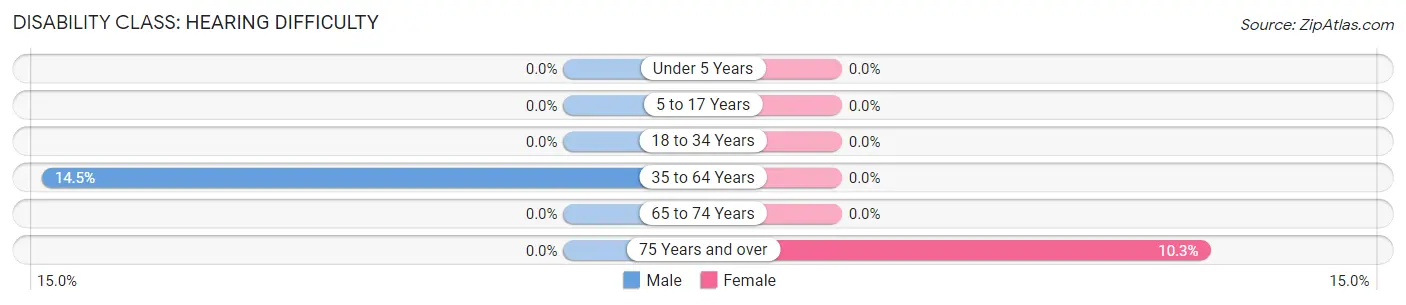
| Age Bracket | Male | Female |
| Under 5 Years | 0 (0.0%) | 0 (0.0%) |
| 5 to 17 Years | 0 (0.0%) | 0 (0.0%) |
| 18 to 34 Years | 0 (0.0%) | 0 (0.0%) |
| 35 to 64 Years | 18 (14.5%) | 0 (0.0%) |
| 65 to 74 Years | 0 (0.0%) | 0 (0.0%) |
| 75 Years and over | 0 (0.0%) | 4 (10.3%) |
Disability Class: Vision Difficulty
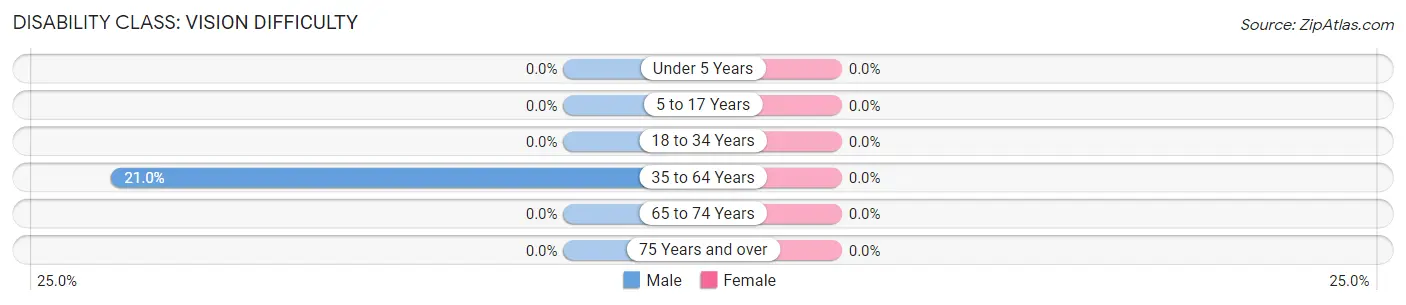
| Age Bracket | Male | Female |
| Under 5 Years | 0 (0.0%) | 0 (0.0%) |
| 5 to 17 Years | 0 (0.0%) | 0 (0.0%) |
| 18 to 34 Years | 0 (0.0%) | 0 (0.0%) |
| 35 to 64 Years | 26 (21.0%) | 0 (0.0%) |
| 65 to 74 Years | 0 (0.0%) | 0 (0.0%) |
| 75 Years and over | 0 (0.0%) | 0 (0.0%) |
Disability Class: Cognitive Difficulty
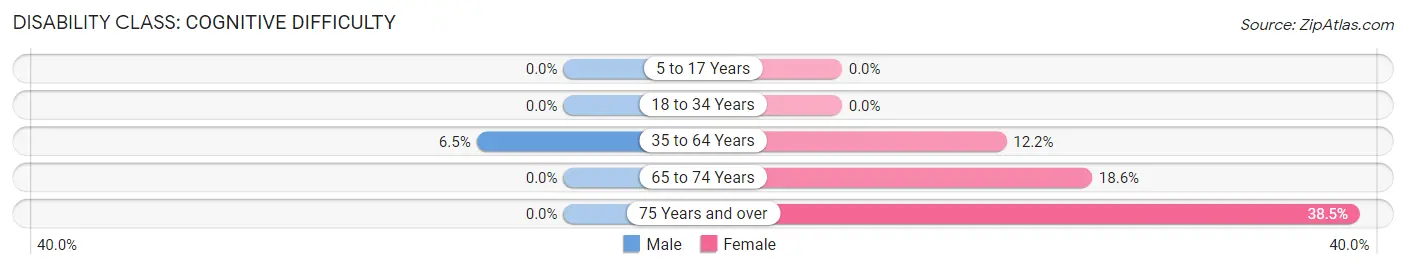
| Age Bracket | Male | Female |
| 5 to 17 Years | 0 (0.0%) | 0 (0.0%) |
| 18 to 34 Years | 0 (0.0%) | 0 (0.0%) |
| 35 to 64 Years | 8 (6.5%) | 11 (12.2%) |
| 65 to 74 Years | 0 (0.0%) | 13 (18.6%) |
| 75 Years and over | 0 (0.0%) | 15 (38.5%) |
Disability Class: Ambulatory Difficulty
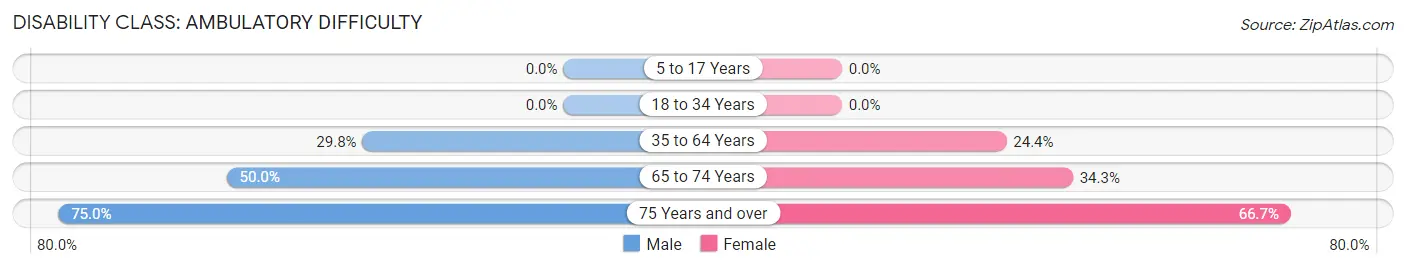
| Age Bracket | Male | Female |
| 5 to 17 Years | 0 (0.0%) | 0 (0.0%) |
| 18 to 34 Years | 0 (0.0%) | 0 (0.0%) |
| 35 to 64 Years | 37 (29.8%) | 22 (24.4%) |
| 65 to 74 Years | 5 (50.0%) | 24 (34.3%) |
| 75 Years and over | 9 (75.0%) | 26 (66.7%) |
Disability Class: Self-Care Difficulty
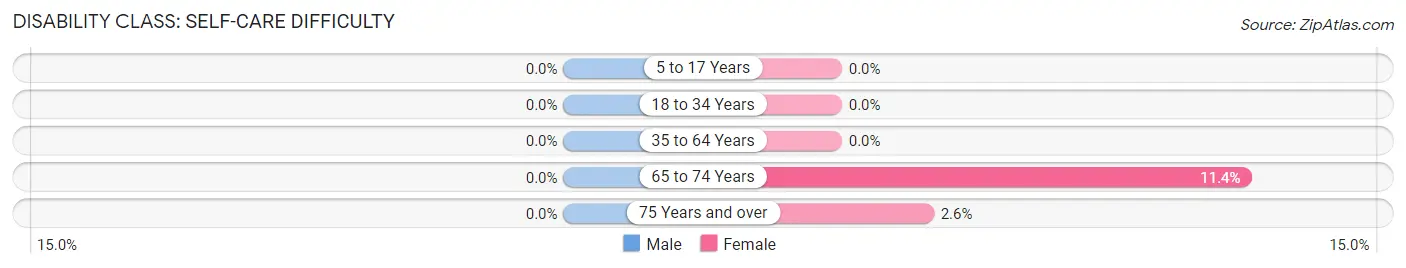
| Age Bracket | Male | Female |
| 5 to 17 Years | 0 (0.0%) | 0 (0.0%) |
| 18 to 34 Years | 0 (0.0%) | 0 (0.0%) |
| 35 to 64 Years | 0 (0.0%) | 0 (0.0%) |
| 65 to 74 Years | 0 (0.0%) | 8 (11.4%) |
| 75 Years and over | 0 (0.0%) | 1 (2.6%) |
Technology Access in Dobbins Heights
Computing Device Access in Dobbins Heights
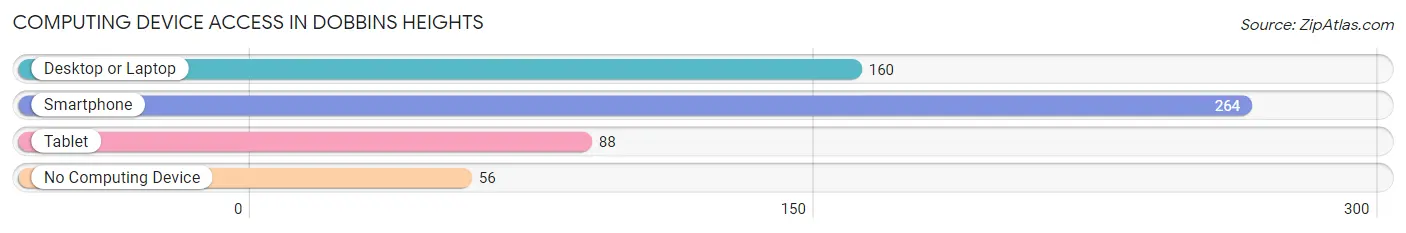
| Device Type | # Households | % Households |
| Desktop or Laptop | 160 | 47.3% |
| Smartphone | 264 | 78.1% |
| Tablet | 88 | 26.0% |
| No Computing Device | 56 | 16.6% |
| Total | 338 | 100.0% |
Internet Access in Dobbins Heights
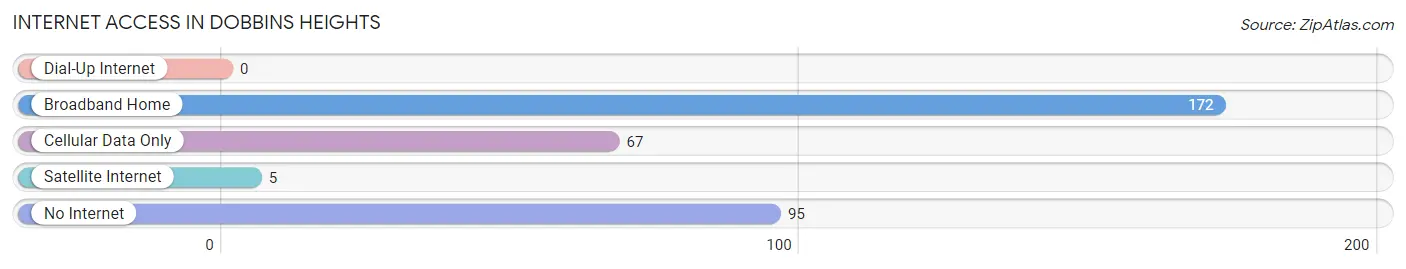
| Internet Type | # Households | % Households |
| Dial-Up Internet | 0 | 0.0% |
| Broadband Home | 172 | 50.9% |
| Cellular Data Only | 67 | 19.8% |
| Satellite Internet | 5 | 1.5% |
| No Internet | 95 | 28.1% |
| Total | 338 | 100.0% |
Dobbins Heights Summary
Dobbins Heights is a small town located in North Carolina, United States. It is situated in the county of Richmond, and is part of the Fayetteville Metropolitan Statistical Area. The town has a population of 1,845 people, according to the 2010 census.
History
Dobbins Heights was founded in the early 1900s by a group of African-American farmers. The town was named after the Dobbins family, who were among the first settlers in the area. The town was incorporated in 1915, and was the first African-American town in North Carolina to be incorporated.
The town was originally a farming community, and the main crops grown were cotton, corn, and tobacco. The town also had a sawmill, a gristmill, and a cotton gin.
In the 1950s, the town began to experience a decline in population due to the mechanization of farming and the migration of African-Americans to larger cities. The town was also affected by the construction of Interstate 95, which bypassed the town.
Geography
Dobbins Heights is located in the southeastern part of North Carolina, in the county of Richmond. The town is situated on the banks of the Lumber River, and is surrounded by the towns of Hamlet, Rockingham, and Laurinburg.
The town has a total area of 1.2 square miles, all of which is land. The town is located at an elevation of 140 feet above sea level.
Economy
The economy of Dobbins Heights is largely based on agriculture. The main crops grown in the area are cotton, corn, and tobacco. The town also has a sawmill, a gristmill, and a cotton gin.
In addition to agriculture, the town also has a few small businesses, including a grocery store, a gas station, and a few restaurants.
Demographics
As of the 2010 census, the population of Dobbins Heights was 1,845 people. The racial makeup of the town was 79.3% African-American, 19.2% White, 0.5% Native American, 0.2% Asian, and 0.8% from other races.
The median household income in the town was $25,938, and the median family income was $30,938. The per capita income in the town was $13,938.
Conclusion
Dobbins Heights is a small town located in North Carolina, United States. It was founded in the early 1900s by a group of African-American farmers, and was the first African-American town in North Carolina to be incorporated. The town has a population of 1,845 people, according to the 2010 census. The economy of Dobbins Heights is largely based on agriculture, and the town also has a few small businesses. The racial makeup of the town is 79.3% African-American, 19.2% White, 0.5% Native American, 0.2% Asian, and 0.8% from other races. The median household income in the town was $25,938, and the median family income was $30,938.
Common Questions
What is Per Capita Income in Dobbins Heights?
Per Capita income in Dobbins Heights is $18,080.
What is the Median Family Income in Dobbins Heights?
Median Family Income in Dobbins Heights is $38,009.
What is the Median Household income in Dobbins Heights?
Median Household Income in Dobbins Heights is $24,167.
What is Income or Wage Gap in Dobbins Heights?
Income or Wage Gap in Dobbins Heights is 51.1%.
Women in Dobbins Heights earn 48.9 cents for every dollar earned by a man.
What is Inequality or Gini Index in Dobbins Heights?
Inequality or Gini Index in Dobbins Heights is 0.49.
What is the Total Population of Dobbins Heights?
Total Population of Dobbins Heights is 645.
What is the Total Male Population of Dobbins Heights?
Total Male Population of Dobbins Heights is 315.
What is the Total Female Population of Dobbins Heights?
Total Female Population of Dobbins Heights is 330.
What is the Ratio of Males per 100 Females in Dobbins Heights?
There are 95.45 Males per 100 Females in Dobbins Heights.
What is the Ratio of Females per 100 Males in Dobbins Heights?
There are 104.76 Females per 100 Males in Dobbins Heights.
What is the Median Population Age in Dobbins Heights?
Median Population Age in Dobbins Heights is 39.4 Years.
What is the Average Family Size in Dobbins Heights
Average Family Size in Dobbins Heights is 2.8 People.
What is the Average Household Size in Dobbins Heights
Average Household Size in Dobbins Heights is 1.9 People.
How Large is the Labor Force in Dobbins Heights?
There are 321 People in the Labor Forcein in Dobbins Heights.
What is the Percentage of People in the Labor Force in Dobbins Heights?
55.6% of People are in the Labor Force in Dobbins Heights.
What is the Unemployment Rate in Dobbins Heights?
Unemployment Rate in Dobbins Heights is 33.0%.