Bennett, NC Map & Demographics
Bennett Map
Bennett Overview
$29,800
PER CAPITA INCOME
$83,553
AVG FAMILY INCOME
$63,750
AVG HOUSEHOLD INCOME
58.6%
WAGE / INCOME GAP [ % ]
41.4¢/ $1
WAGE / INCOME GAP [ $ ]
0.37
INEQUALITY / GINI INDEX
228
TOTAL POPULATION
111
MALE POPULATION
117
FEMALE POPULATION
94.87
MALES / 100 FEMALES
105.41
FEMALES / 100 MALES
46.5
MEDIAN AGE
2.6
AVG FAMILY SIZE
2.1
AVG HOUSEHOLD SIZE
102
LABOR FORCE [ PEOPLE ]
50.0%
PERCENT IN LABOR FORCE
Bennett Zip Codes
Income in Bennett
Income Overview in Bennett
Per Capita Income in Bennett is $29,800, while median incomes of families and households are $83,553 and $63,750 respectively.
| Characteristic | Number | Measure |
| Per Capita Income | 228 | $29,800 |
| Median Family Income | 70 | $83,553 |
| Mean Family Income | 70 | $85,316 |
| Median Household Income | 108 | $63,750 |
| Mean Household Income | 108 | $61,018 |
| Income Deficit | 70 | $0 |
| Wage / Income Gap (%) | 228 | 58.57% |
| Wage / Income Gap ($) | 228 | 41.43¢ per $1 |
| Gini / Inequality Index | 228 | 0.37 |
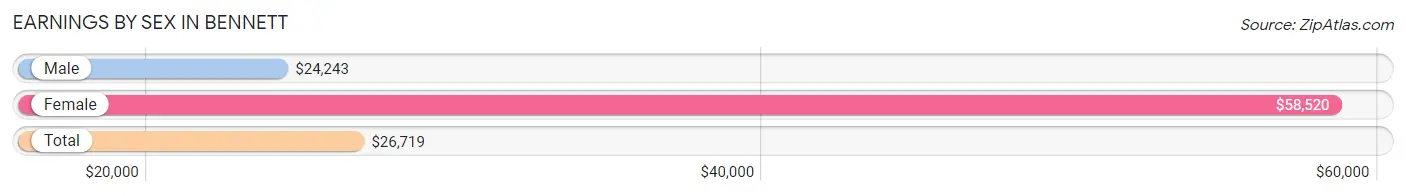
Earnings by Sex in Bennett
Average Earnings in Bennett are $26,719, $24,243 for men and $58,520 for women, a difference of 58.6%.
| Sex | Number | Average Earnings |
| Male | 85 (56.7%) | $24,243 |
| Female | 65 (43.3%) | $58,520 |
| Total | 150 (100.0%) | $26,719 |
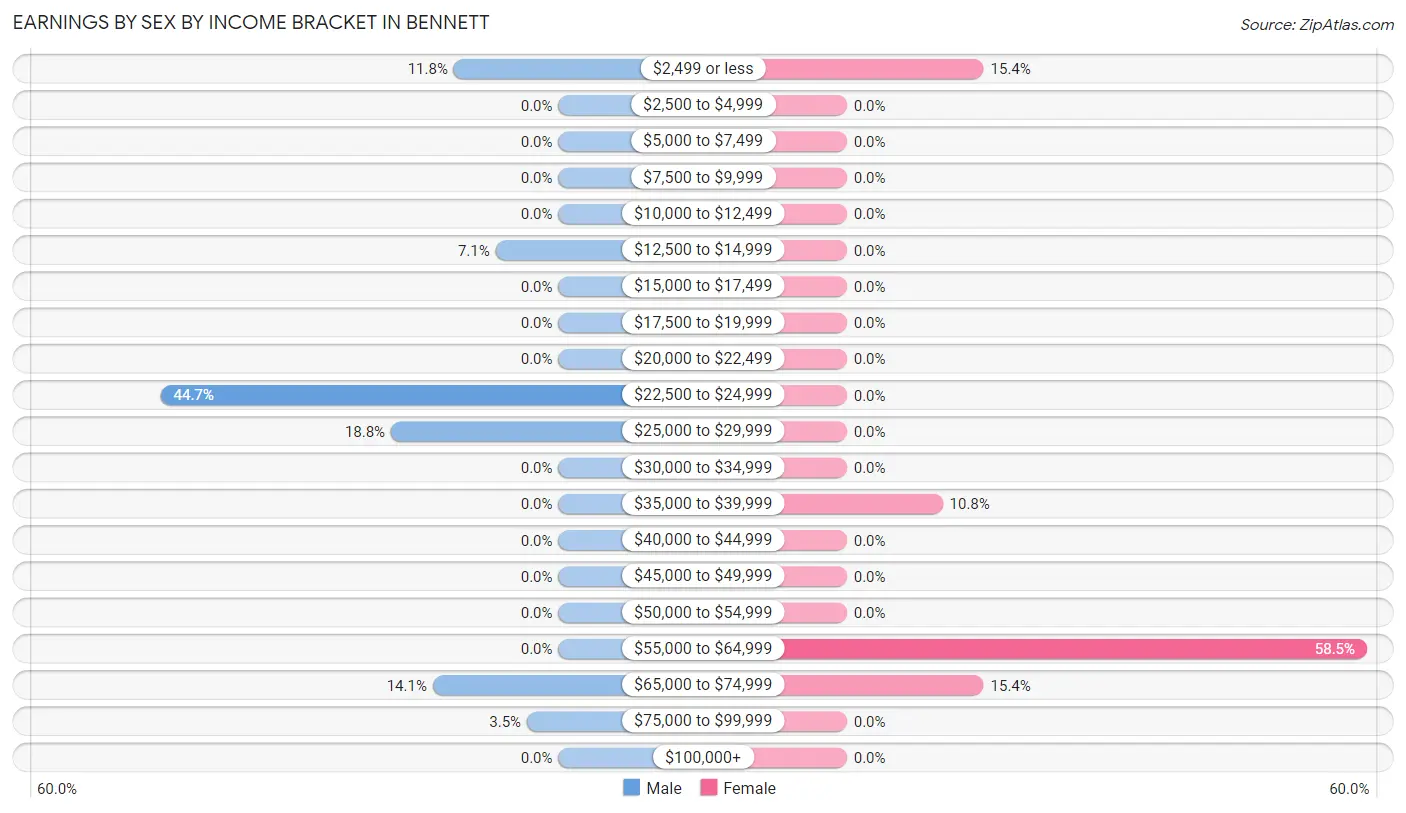
Earnings by Sex by Income Bracket in Bennett
The most common earnings brackets in Bennett are $22,500 to $24,999 for men (38 | 44.7%) and $55,000 to $64,999 for women (38 | 58.5%).
| Income | Male | Female |
| $2,499 or less | 10 (11.8%) | 10 (15.4%) |
| $2,500 to $4,999 | 0 (0.0%) | 0 (0.0%) |
| $5,000 to $7,499 | 0 (0.0%) | 0 (0.0%) |
| $7,500 to $9,999 | 0 (0.0%) | 0 (0.0%) |
| $10,000 to $12,499 | 0 (0.0%) | 0 (0.0%) |
| $12,500 to $14,999 | 6 (7.1%) | 0 (0.0%) |
| $15,000 to $17,499 | 0 (0.0%) | 0 (0.0%) |
| $17,500 to $19,999 | 0 (0.0%) | 0 (0.0%) |
| $20,000 to $22,499 | 0 (0.0%) | 0 (0.0%) |
| $22,500 to $24,999 | 38 (44.7%) | 0 (0.0%) |
| $25,000 to $29,999 | 16 (18.8%) | 0 (0.0%) |
| $30,000 to $34,999 | 0 (0.0%) | 0 (0.0%) |
| $35,000 to $39,999 | 0 (0.0%) | 7 (10.8%) |
| $40,000 to $44,999 | 0 (0.0%) | 0 (0.0%) |
| $45,000 to $49,999 | 0 (0.0%) | 0 (0.0%) |
| $50,000 to $54,999 | 0 (0.0%) | 0 (0.0%) |
| $55,000 to $64,999 | 0 (0.0%) | 38 (58.5%) |
| $65,000 to $74,999 | 12 (14.1%) | 10 (15.4%) |
| $75,000 to $99,999 | 3 (3.5%) | 0 (0.0%) |
| $100,000+ | 0 (0.0%) | 0 (0.0%) |
| Total | 85 (100.0%) | 65 (100.0%) |
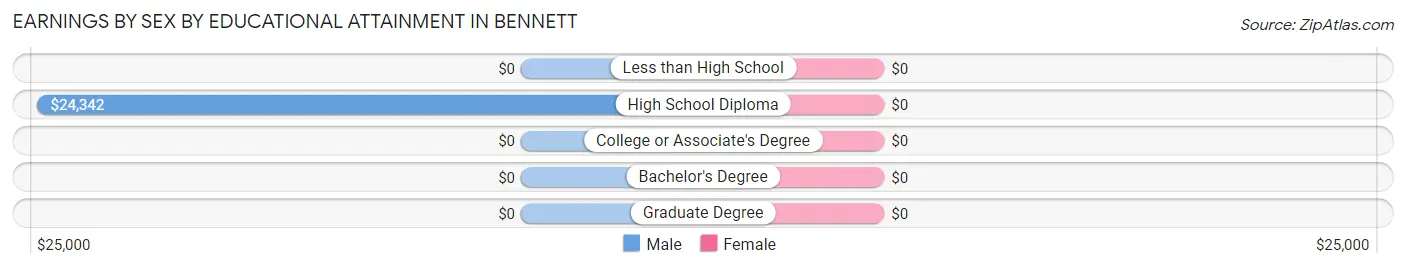
Earnings by Sex by Educational Attainment in Bennett
| Educational Attainment | Male Income | Female Income |
| Less than High School | - | - |
| High School Diploma | $24,342 | $0 |
| College or Associate's Degree | - | - |
| Bachelor's Degree | - | - |
| Graduate Degree | - | - |
| Total | $24,243 | $58,520 |
Family Income in Bennett
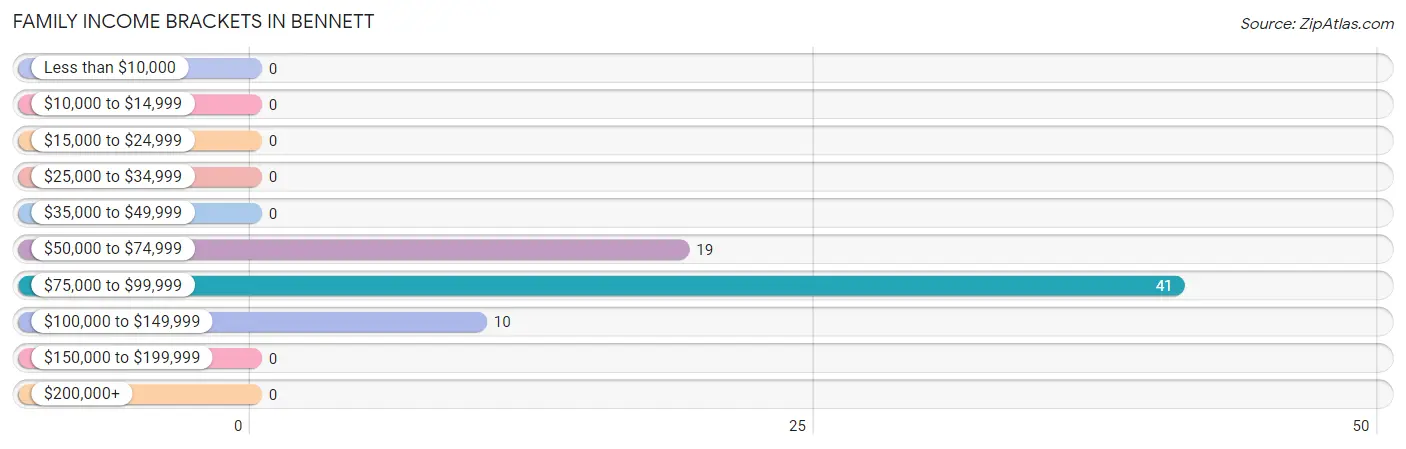
Family Income Brackets in Bennett
According to the Bennett family income data, there are 41 families falling into the $75,000 to $99,999 income range, which is the most common income bracket and makes up 58.6% of all families.
| Income Bracket | # Families | % Families |
| Less than $10,000 | 0 | 0.0% |
| $10,000 to $14,999 | 0 | 0.0% |
| $15,000 to $24,999 | 0 | 0.0% |
| $25,000 to $34,999 | 0 | 0.0% |
| $35,000 to $49,999 | 0 | 0.0% |
| $50,000 to $74,999 | 19 | 27.1% |
| $75,000 to $99,999 | 41 | 58.6% |
| $100,000 to $149,999 | 10 | 14.3% |
| $150,000 to $199,999 | 0 | 0.0% |
| $200,000+ | 0 | 0.0% |
Family Income by Famaliy Size in Bennett
| Income Bracket | # Families | Median Income |
| 2-Person Families | 44 (62.9%) | $0 |
| 3-Person Families | 23 (32.9%) | $0 |
| 4-Person Families | 0 (0.0%) | $0 |
| 5-Person Families | 0 (0.0%) | $0 |
| 6-Person Families | 3 (4.3%) | $0 |
| 7+ Person Families | 0 (0.0%) | $0 |
| Total | 70 (100.0%) | $83,553 |
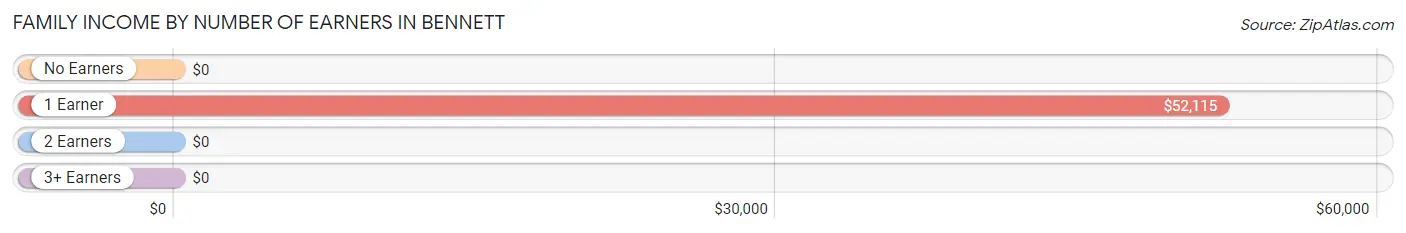
Family Income by Number of Earners in Bennett
| Number of Earners | # Families | Median Income |
| No Earners | 0 (0.0%) | $0 |
| 1 Earner | 22 (31.4%) | $52,115 |
| 2 Earners | 48 (68.6%) | $0 |
| 3+ Earners | 0 (0.0%) | $0 |
| Total | 70 (100.0%) | $83,553 |
Household Income in Bennett
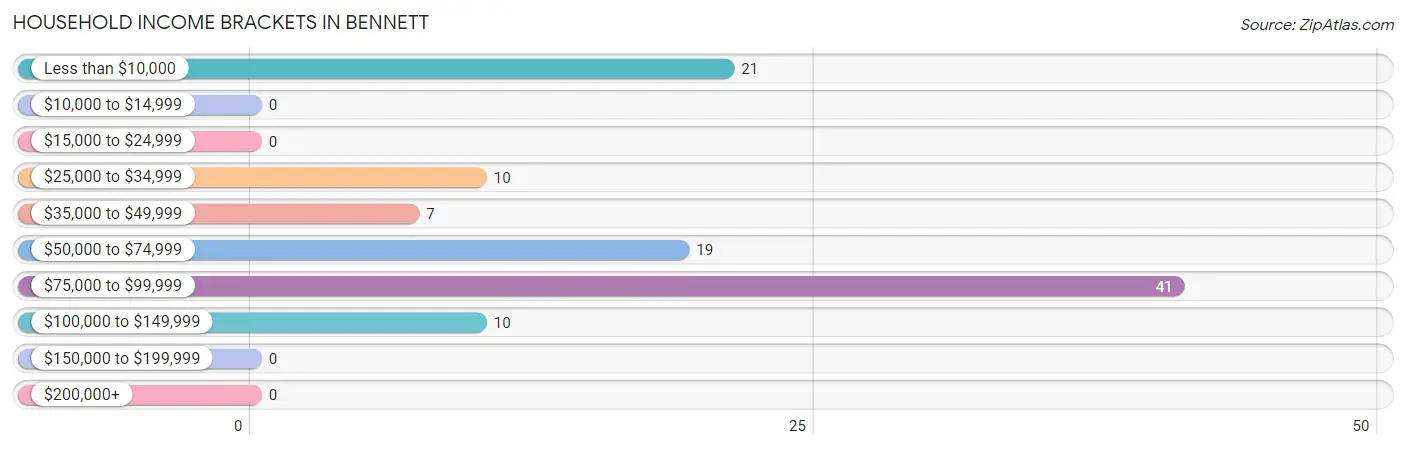
Household Income Brackets in Bennett
With 41 households falling in the category, the $75,000 to $99,999 income range is the most frequent in Bennett, accounting for 38.0% of all households.
| Income Bracket | # Households | % Households |
| Less than $10,000 | 21 | 19.4% |
| $10,000 to $14,999 | 0 | 0.0% |
| $15,000 to $24,999 | 0 | 0.0% |
| $25,000 to $34,999 | 10 | 9.3% |
| $35,000 to $49,999 | 7 | 6.5% |
| $50,000 to $74,999 | 19 | 17.6% |
| $75,000 to $99,999 | 41 | 38.0% |
| $100,000 to $149,999 | 10 | 9.3% |
| $150,000 to $199,999 | 0 | 0.0% |
| $200,000+ | 0 | 0.0% |
Household Income by Householder Age in Bennett
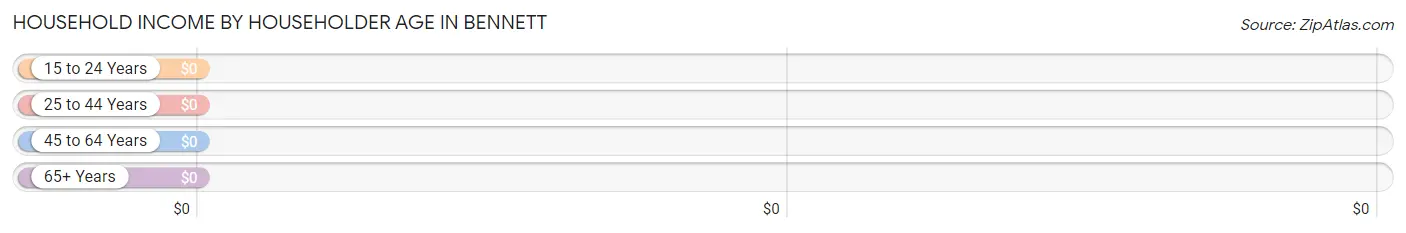
| Income Bracket | # Households | Median Income |
| 15 to 24 Years | 0 (0.0%) | $0 |
| 25 to 44 Years | 20 (18.5%) | $0 |
| 45 to 64 Years | 38 (35.2%) | $0 |
| 65+ Years | 50 (46.3%) | $0 |
| Total | 108 (100.0%) | $63,750 |
Poverty in Bennett
Income Below Poverty by Sex and Age in Bennett
With 9.0% poverty level for males and 17.9% for females among the residents of Bennett, 25 to 34 year old males and 65 to 74 year old females are the most vulnerable to poverty, with 10 males (100.0%) and 21 females (43.8%) in their respective age groups living below the poverty level.
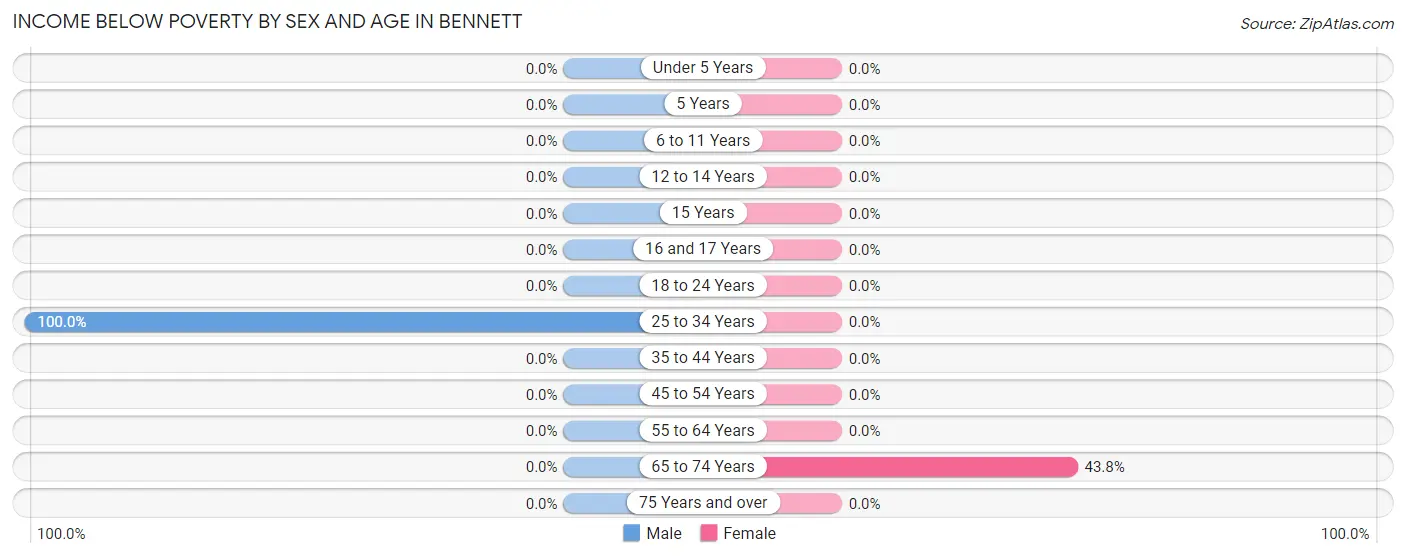
| Age Bracket | Male | Female |
| Under 5 Years | 0 (0.0%) | 0 (0.0%) |
| 5 Years | 0 (0.0%) | 0 (0.0%) |
| 6 to 11 Years | 0 (0.0%) | 0 (0.0%) |
| 12 to 14 Years | 0 (0.0%) | 0 (0.0%) |
| 15 Years | 0 (0.0%) | 0 (0.0%) |
| 16 and 17 Years | 0 (0.0%) | 0 (0.0%) |
| 18 to 24 Years | 0 (0.0%) | 0 (0.0%) |
| 25 to 34 Years | 10 (100.0%) | 0 (0.0%) |
| 35 to 44 Years | 0 (0.0%) | 0 (0.0%) |
| 45 to 54 Years | 0 (0.0%) | 0 (0.0%) |
| 55 to 64 Years | 0 (0.0%) | 0 (0.0%) |
| 65 to 74 Years | 0 (0.0%) | 21 (43.8%) |
| 75 Years and over | 0 (0.0%) | 0 (0.0%) |
| Total | 10 (9.0%) | 21 (17.9%) |
Income Above Poverty by Sex and Age in Bennett
According to the poverty statistics in Bennett, males aged 6 to 11 years and females aged under 5 years are the age groups that are most secure financially, with 100.0% of males and 100.0% of females in these age groups living above the poverty line.
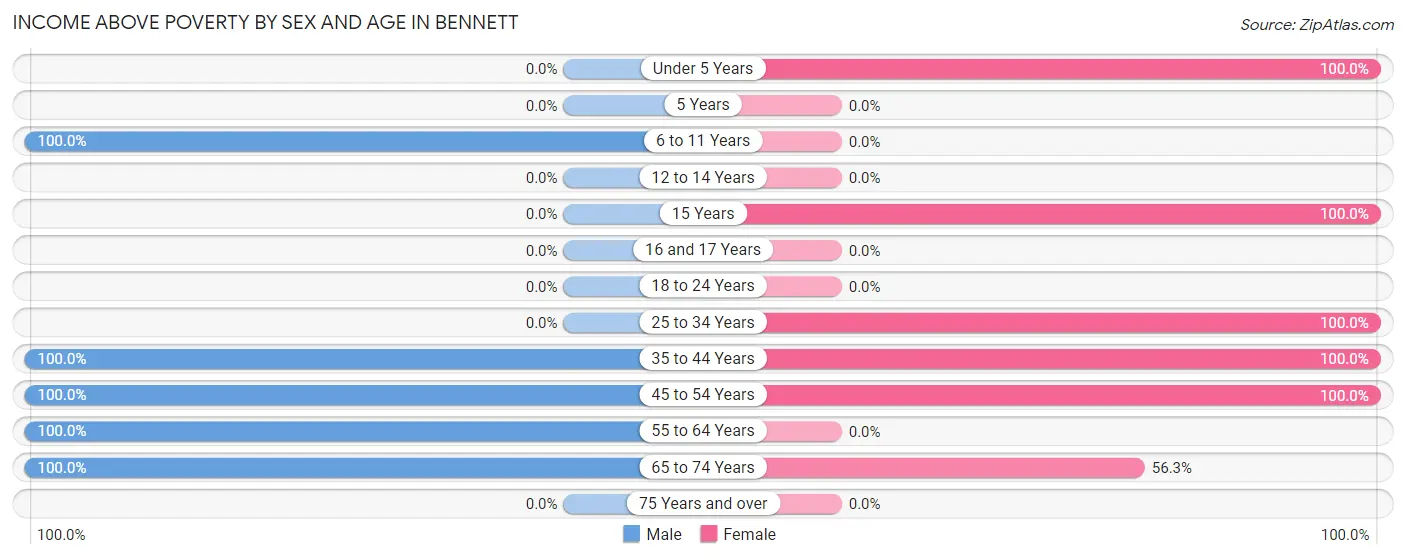
| Age Bracket | Male | Female |
| Under 5 Years | 0 (0.0%) | 7 (100.0%) |
| 5 Years | 0 (0.0%) | 0 (0.0%) |
| 6 to 11 Years | 13 (100.0%) | 0 (0.0%) |
| 12 to 14 Years | 0 (0.0%) | 0 (0.0%) |
| 15 Years | 0 (0.0%) | 4 (100.0%) |
| 16 and 17 Years | 0 (0.0%) | 0 (0.0%) |
| 18 to 24 Years | 0 (0.0%) | 0 (0.0%) |
| 25 to 34 Years | 0 (0.0%) | 17 (100.0%) |
| 35 to 44 Years | 19 (100.0%) | 3 (100.0%) |
| 45 to 54 Years | 38 (100.0%) | 38 (100.0%) |
| 55 to 64 Years | 12 (100.0%) | 0 (0.0%) |
| 65 to 74 Years | 19 (100.0%) | 27 (56.2%) |
| 75 Years and over | 0 (0.0%) | 0 (0.0%) |
| Total | 101 (91.0%) | 96 (82.1%) |
Income Below Poverty Among Married-Couple Families in Bennett
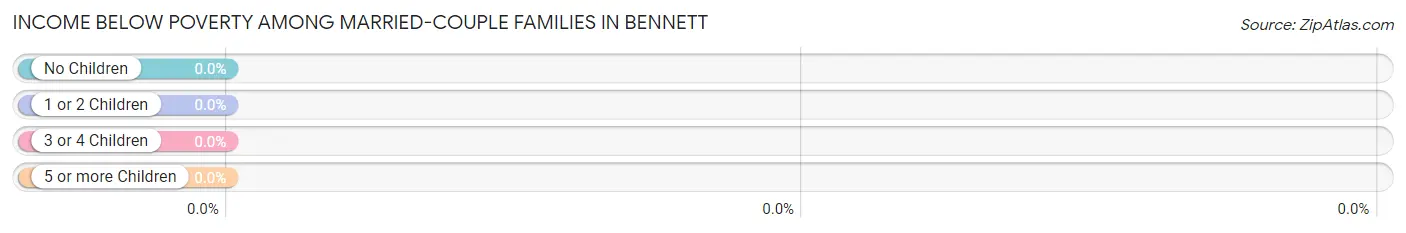
| Children | Above Poverty | Below Poverty |
| No Children | 57 (100.0%) | 0 (0.0%) |
| 1 or 2 Children | 0 (0.0%) | 0 (0.0%) |
| 3 or 4 Children | 3 (100.0%) | 0 (0.0%) |
| 5 or more Children | 0 (0.0%) | 0 (0.0%) |
| Total | 60 (100.0%) | 0 (0.0%) |
Income Below Poverty Among Single-Parent Households in Bennett
| Children | Single Father | Single Mother |
| No Children | 0 (0.0%) | 0 (0.0%) |
| 1 or 2 Children | 0 (0.0%) | 0 (0.0%) |
| 3 or 4 Children | 0 (0.0%) | 0 (0.0%) |
| 5 or more Children | 0 (0.0%) | 0 (0.0%) |
| Total | 0 (0.0%) | 0 (0.0%) |
Income Below Poverty Among Married-Couple vs Single-Parent Households in Bennett
| Children | Married-Couple Families | Single-Parent Households |
| No Children | 0 (0.0%) | 0 (0.0%) |
| 1 or 2 Children | 0 (0.0%) | 0 (0.0%) |
| 3 or 4 Children | 0 (0.0%) | 0 (0.0%) |
| 5 or more Children | 0 (0.0%) | 0 (0.0%) |
| Total | 0 (0.0%) | 0 (0.0%) |
Race in Bennett
The most populous races in Bennett are , and White / Caucasian (228 | 100.0%).
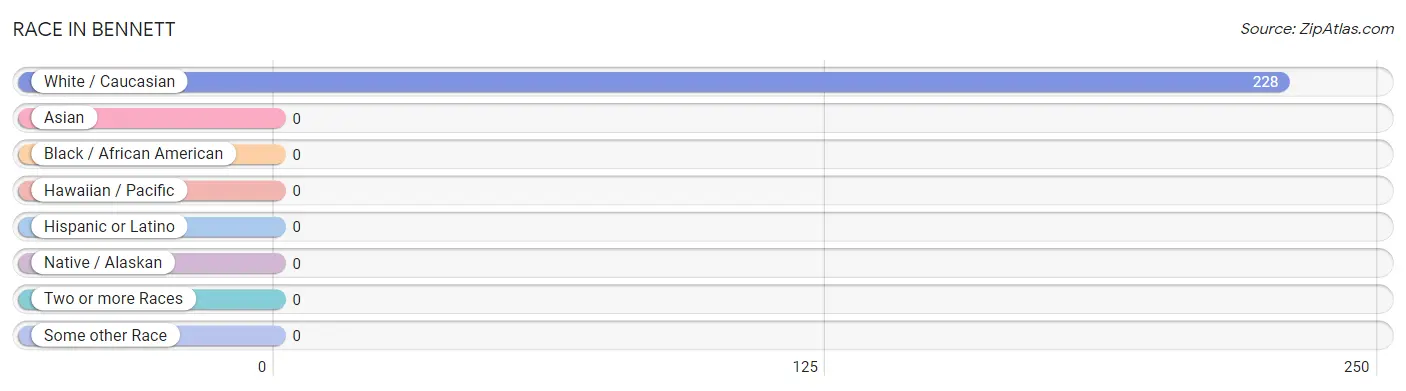
| Race | # Population | % Population |
| Asian | 0 | 0.0% |
| Black / African American | 0 | 0.0% |
| Hawaiian / Pacific | 0 | 0.0% |
| Hispanic or Latino | 0 | 0.0% |
| Native / Alaskan | 0 | 0.0% |
| White / Caucasian | 228 | 100.0% |
| Two or more Races | 0 | 0.0% |
| Some other Race | 0 | 0.0% |
| Total | 228 | 100.0% |
Ancestry in Bennett
The most populous ancestries reported in Bennett are American (43 | 18.9%), and Irish (40 | 17.5%), together accounting for 36.4% of all Bennett residents.
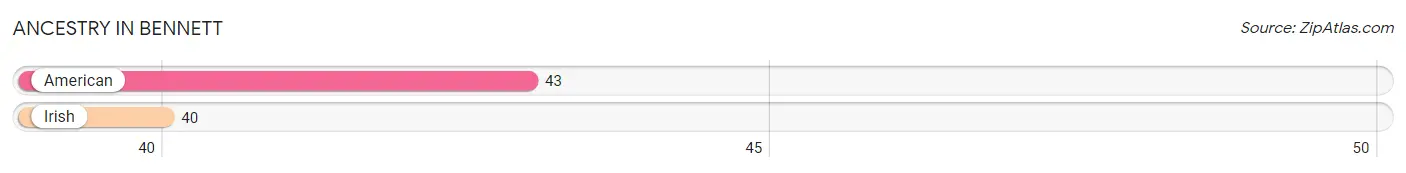
| Ancestry | # Population | % Population |
| American | 43 | 18.9% |
| Irish | 40 | 17.5% | View All 2 Rows |
Immigrants in Bennett

| Immigration Origin | # Population | % Population | View All 0 Rows |
Sex and Age in Bennett
Sex and Age in Bennett
The most populous age groups in Bennett are 45 to 49 Years (38 | 34.2%) for men and 45 to 49 Years (38 | 32.5%) for women.
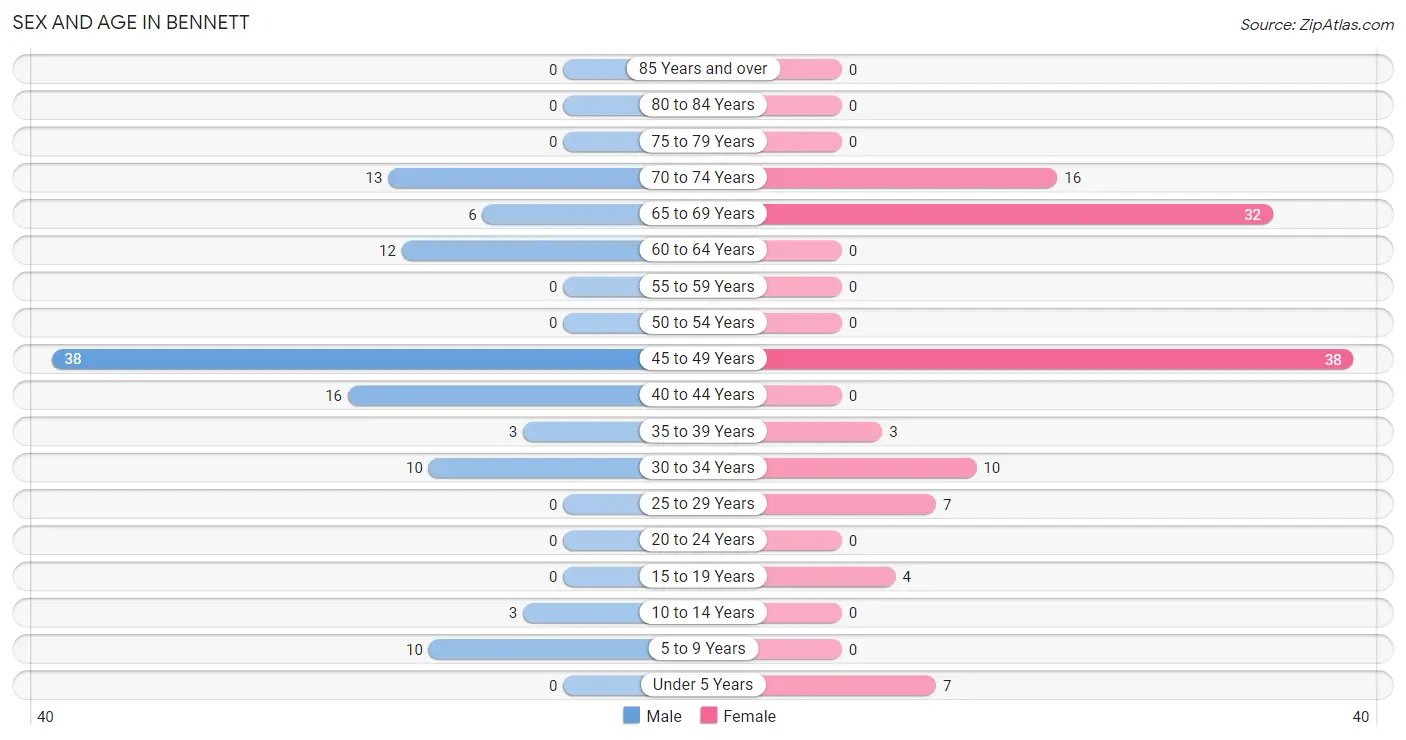
| Age Bracket | Male | Female |
| Under 5 Years | 0 (0.0%) | 7 (6.0%) |
| 5 to 9 Years | 10 (9.0%) | 0 (0.0%) |
| 10 to 14 Years | 3 (2.7%) | 0 (0.0%) |
| 15 to 19 Years | 0 (0.0%) | 4 (3.4%) |
| 20 to 24 Years | 0 (0.0%) | 0 (0.0%) |
| 25 to 29 Years | 0 (0.0%) | 7 (6.0%) |
| 30 to 34 Years | 10 (9.0%) | 10 (8.6%) |
| 35 to 39 Years | 3 (2.7%) | 3 (2.6%) |
| 40 to 44 Years | 16 (14.4%) | 0 (0.0%) |
| 45 to 49 Years | 38 (34.2%) | 38 (32.5%) |
| 50 to 54 Years | 0 (0.0%) | 0 (0.0%) |
| 55 to 59 Years | 0 (0.0%) | 0 (0.0%) |
| 60 to 64 Years | 12 (10.8%) | 0 (0.0%) |
| 65 to 69 Years | 6 (5.4%) | 32 (27.4%) |
| 70 to 74 Years | 13 (11.7%) | 16 (13.7%) |
| 75 to 79 Years | 0 (0.0%) | 0 (0.0%) |
| 80 to 84 Years | 0 (0.0%) | 0 (0.0%) |
| 85 Years and over | 0 (0.0%) | 0 (0.0%) |
| Total | 111 (100.0%) | 117 (100.0%) |
Families and Households in Bennett
Median Family Size in Bennett
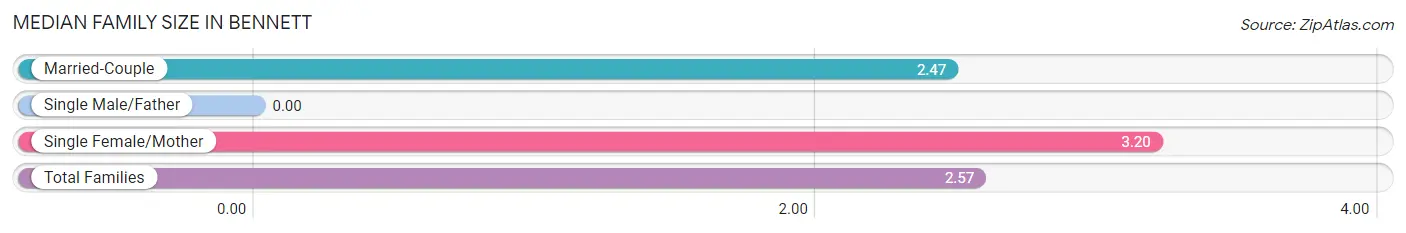
| Family Type | # Families | Family Size |
| Married-Couple | 60 (85.7%) | 2.47 |
| Single Male/Father | 0 (0.0%) | - |
| Single Female/Mother | 10 (14.3%) | 3.20 |
| Total Families | 70 (100.0%) | 2.57 |
Median Household Size in Bennett
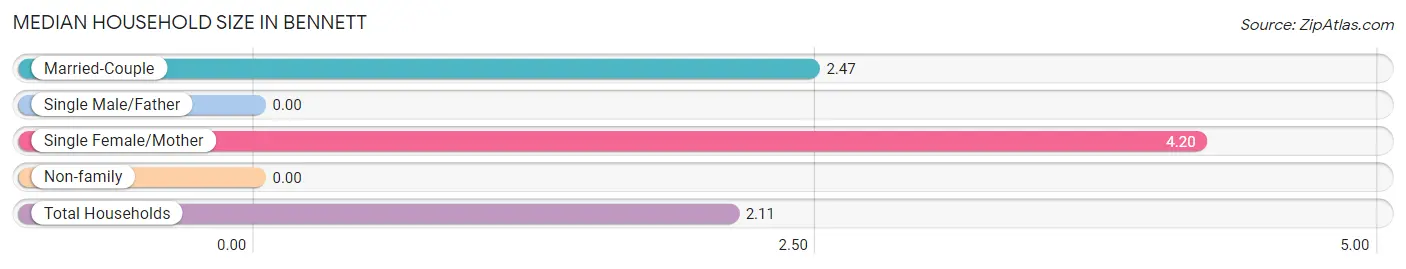
| Household Type | # Households | Household Size |
| Married-Couple | 60 (55.6%) | 2.47 |
| Single Male/Father | 0 (0.0%) | - |
| Single Female/Mother | 10 (9.3%) | 4.20 |
| Non-family | 38 (35.2%) | - |
| Total Households | 108 (100.0%) | 2.11 |
Household Size by Marriage Status in Bennett
Out of a total of 108 households in Bennett, 70 (64.8%) are family households, while 38 (35.2%) are nonfamily households. The most numerous type of family households are 2-person households, comprising 44, and the most common type of nonfamily households are 1-person households, comprising 38.
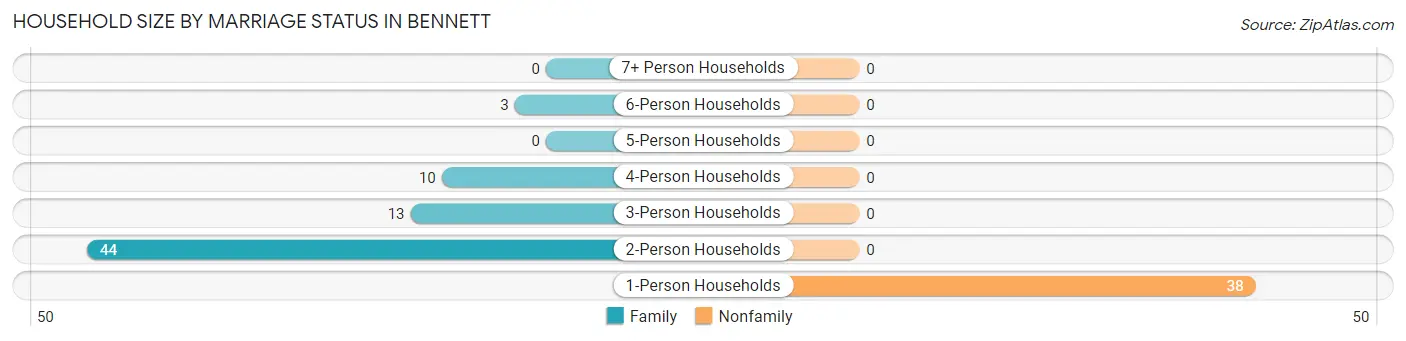
| Household Size | Family Households | Nonfamily Households |
| 1-Person Households | - | 38 (35.2%) |
| 2-Person Households | 44 (40.7%) | 0 (0.0%) |
| 3-Person Households | 13 (12.0%) | 0 (0.0%) |
| 4-Person Households | 10 (9.3%) | 0 (0.0%) |
| 5-Person Households | 0 (0.0%) | 0 (0.0%) |
| 6-Person Households | 3 (2.8%) | 0 (0.0%) |
| 7+ Person Households | 0 (0.0%) | 0 (0.0%) |
| Total | 70 (64.8%) | 38 (35.2%) |
Female Fertility in Bennett
Fertility by Age in Bennett
| Age Bracket | Women with Births | Births / 1,000 Women |
| 15 to 19 years | 0 (0.0%) | 0.0 |
| 20 to 34 years | 0 (0.0%) | 0.0 |
| 35 to 50 years | 0 (0.0%) | 0.0 |
| Total | 0 (0.0%) | 0.0 |
Fertility by Age by Marriage Status in Bennett
| Age Bracket | Married | Unmarried |
| 15 to 19 years | 0 (0.0%) | 0 (0.0%) |
| 20 to 34 years | 0 (0.0%) | 0 (0.0%) |
| 35 to 50 years | 0 (0.0%) | 0 (0.0%) |
| Total | 0 (0.0%) | 0 (0.0%) |
Fertility by Education in Bennett
| Educational Attainment | Women with Births | Births / 1,000 Women |
| Less than High School | 0 (0.0%) | 0.0 |
| High School Diploma | 0 (0.0%) | 0.0 |
| College or Associate's Degree | 0 (0.0%) | 0.0 |
| Bachelor's Degree | 0 (0.0%) | 0.0 |
| Graduate Degree | 0 (0.0%) | 0.0 |
| Total | 0 (0.0%) | 0.0 |
Fertility by Education by Marriage Status in Bennett
| Educational Attainment | Married | Unmarried |
| Less than High School | 0 (0.0%) | 0 (0.0%) |
| High School Diploma | 0 (0.0%) | 0 (0.0%) |
| College or Associate's Degree | 0 (0.0%) | 0 (0.0%) |
| Bachelor's Degree | 0 (0.0%) | 0 (0.0%) |
| Graduate Degree | 0 (0.0%) | 0 (0.0%) |
| Total | 0 (0.0%) | 0 (0.0%) |
Employment Characteristics in Bennett
Employment by Class of Employer in Bennett
Among the 102 employed individuals in Bennett, private company employees (95 | 93.1%), and local government employees (7 | 6.9%) make up the most common classes of employment.

| Employer Class | # Employees | % Employees |
| Private Company Employees | 95 | 93.1% |
| Self-Employed (Incorporated) | 0 | 0.0% |
| Self-Employed (Not Incorporated) | 0 | 0.0% |
| Not-for-profit Organizations | 0 | 0.0% |
| Local Government Employees | 7 | 6.9% |
| State Government Employees | 0 | 0.0% |
| Federal Government Employees | 0 | 0.0% |
| Unpaid Family Workers | 0 | 0.0% |
| Total | 102 | 100.0% |
Employment Status by Age in Bennett
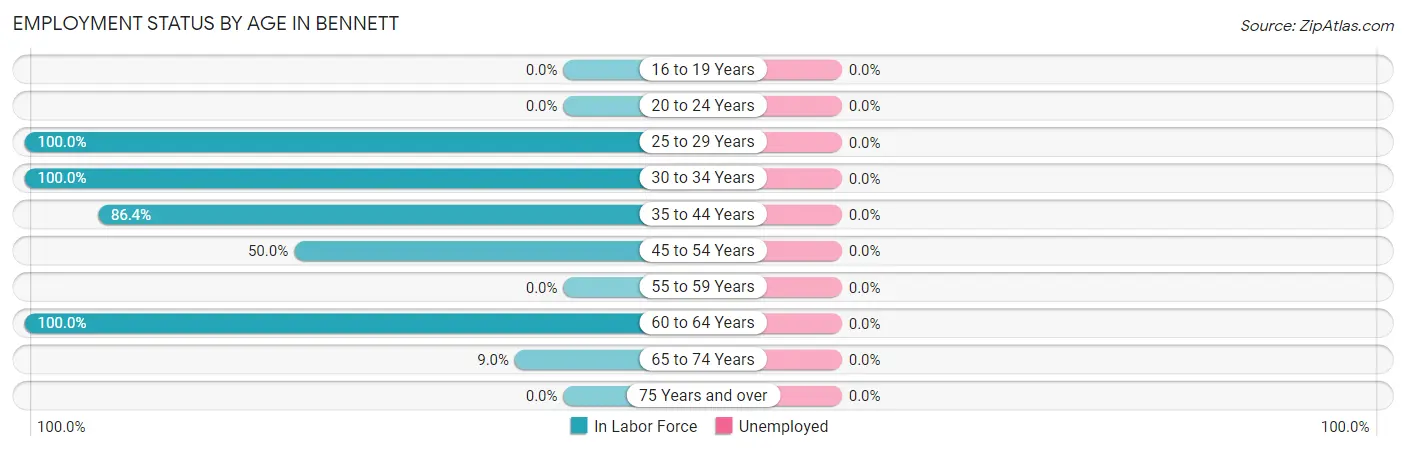
| Age Bracket | In Labor Force | Unemployed |
| 16 to 19 Years | 0 (0.0%) | 0 (0.0%) |
| 20 to 24 Years | 0 (0.0%) | 0 (0.0%) |
| 25 to 29 Years | 7 (100.0%) | 0 (0.0%) |
| 30 to 34 Years | 20 (100.0%) | 0 (0.0%) |
| 35 to 44 Years | 19 (86.4%) | 0 (0.0%) |
| 45 to 54 Years | 38 (50.0%) | 0 (0.0%) |
| 55 to 59 Years | 0 (0.0%) | 0 (0.0%) |
| 60 to 64 Years | 12 (100.0%) | 0 (0.0%) |
| 65 to 74 Years | 6 (9.0%) | 0 (0.0%) |
| 75 Years and over | 0 (0.0%) | 0 (0.0%) |
| Total | 102 (50.0%) | 0 (0.0%) |
Employment Status by Educational Attainment in Bennett
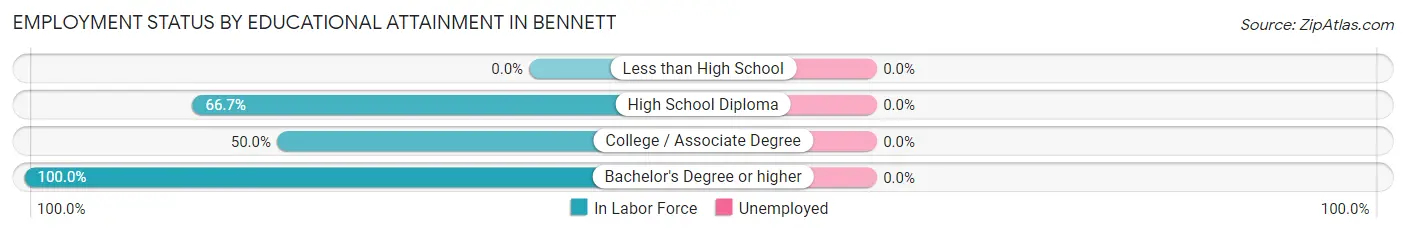
| Educational Attainment | In Labor Force | Unemployed |
| Less than High School | 0 (0.0%) | 0 (0.0%) |
| High School Diploma | 76 (66.7%) | 0 (0.0%) |
| College / Associate Degree | 3 (50.0%) | 0 (0.0%) |
| Bachelor's Degree or higher | 17 (100.0%) | 0 (0.0%) |
| Total | 96 (70.1%) | 0 (0.0%) |
Employment Occupations by Sex in Bennett
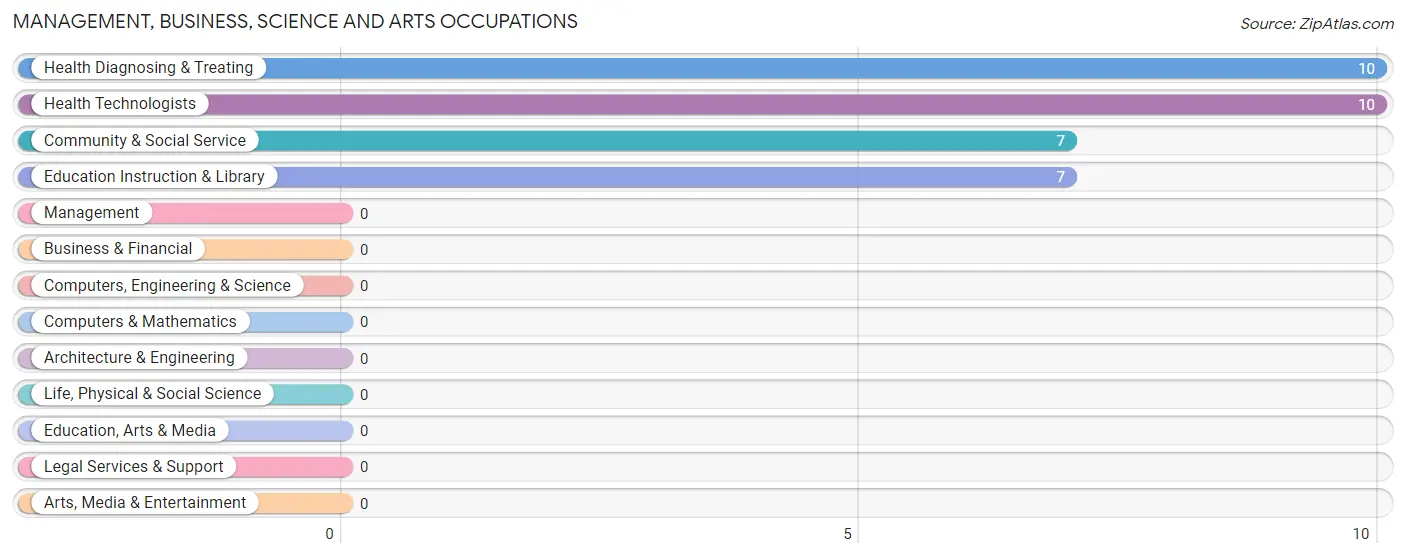
Management, Business, Science and Arts Occupations
The most common Management, Business, Science and Arts occupations in Bennett are Health Diagnosing & Treating (10 | 9.8%), Health Technologists (10 | 9.8%), Community & Social Service (7 | 6.9%), and Education Instruction & Library (7 | 6.9%).
Management, Business, Science and Arts Occupations by Sex
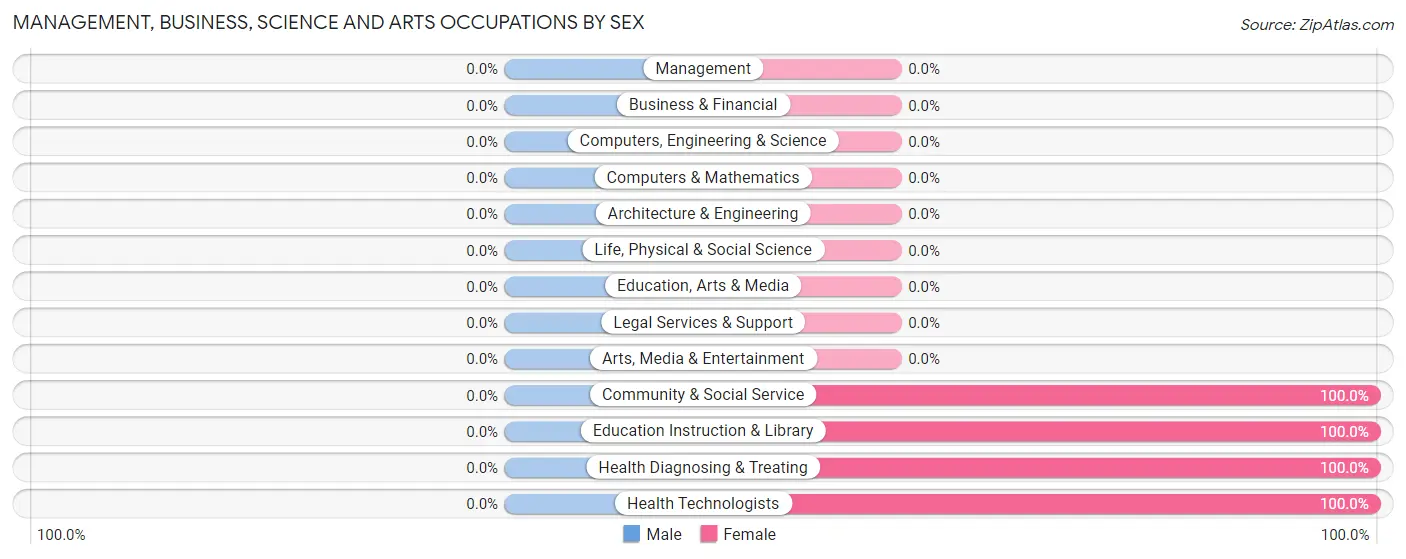
| Occupation | Male | Female |
| Management | 0 (0.0%) | 0 (0.0%) |
| Business & Financial | 0 (0.0%) | 0 (0.0%) |
| Computers, Engineering & Science | 0 (0.0%) | 0 (0.0%) |
| Computers & Mathematics | 0 (0.0%) | 0 (0.0%) |
| Architecture & Engineering | 0 (0.0%) | 0 (0.0%) |
| Life, Physical & Social Science | 0 (0.0%) | 0 (0.0%) |
| Community & Social Service | 0 (0.0%) | 7 (100.0%) |
| Education, Arts & Media | 0 (0.0%) | 0 (0.0%) |
| Legal Services & Support | 0 (0.0%) | 0 (0.0%) |
| Education Instruction & Library | 0 (0.0%) | 7 (100.0%) |
| Arts, Media & Entertainment | 0 (0.0%) | 0 (0.0%) |
| Health Diagnosing & Treating | 0 (0.0%) | 10 (100.0%) |
| Health Technologists | 0 (0.0%) | 10 (100.0%) |
| Total (Category) | 0 (0.0%) | 17 (100.0%) |
| Total (Overall) | 85 (83.3%) | 17 (16.7%) |
Services Occupations
Services Occupations by Sex
| Occupation | Male | Female |
| Healthcare Support | 0 (0.0%) | 0 (0.0%) |
| Security & Protection | 0 (0.0%) | 0 (0.0%) |
| Firefighting & Prevention | 0 (0.0%) | 0 (0.0%) |
| Law Enforcement | 0 (0.0%) | 0 (0.0%) |
| Food Preparation & Serving | 0 (0.0%) | 0 (0.0%) |
| Cleaning & Maintenance | 0 (0.0%) | 0 (0.0%) |
| Personal Care & Service | 0 (0.0%) | 0 (0.0%) |
| Total (Category) | 0 (0.0%) | 0 (0.0%) |
| Total (Overall) | 85 (83.3%) | 17 (16.7%) |
Sales and Office Occupations
The most common Sales and Office occupations in Bennett are , and Sales & Related (19 | 18.6%).
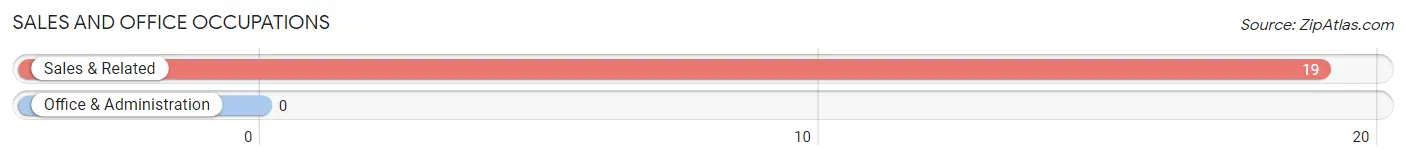
Sales and Office Occupations by Sex
| Occupation | Male | Female |
| Sales & Related | 19 (100.0%) | 0 (0.0%) |
| Office & Administration | 0 (0.0%) | 0 (0.0%) |
| Total (Category) | 19 (100.0%) | 0 (0.0%) |
| Total (Overall) | 85 (83.3%) | 17 (16.7%) |
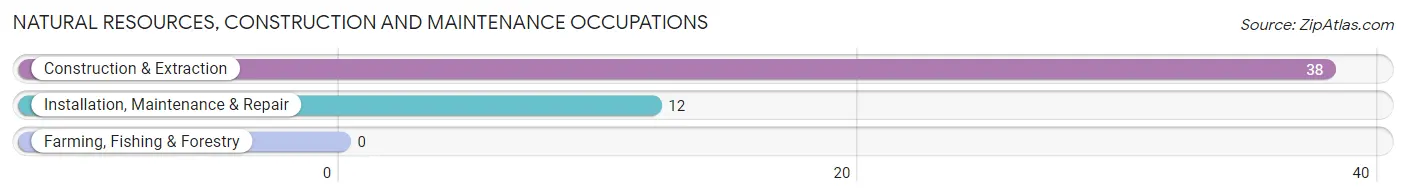
Natural Resources, Construction and Maintenance Occupations
The most common Natural Resources, Construction and Maintenance occupations in Bennett are Construction & Extraction (38 | 37.2%), and Installation, Maintenance & Repair (12 | 11.8%).
Natural Resources, Construction and Maintenance Occupations by Sex
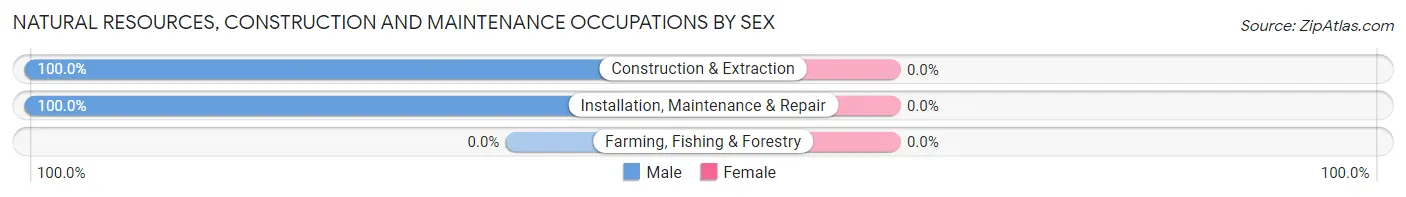
| Occupation | Male | Female |
| Farming, Fishing & Forestry | 0 (0.0%) | 0 (0.0%) |
| Construction & Extraction | 38 (100.0%) | 0 (0.0%) |
| Installation, Maintenance & Repair | 12 (100.0%) | 0 (0.0%) |
| Total (Category) | 50 (100.0%) | 0 (0.0%) |
| Total (Overall) | 85 (83.3%) | 17 (16.7%) |
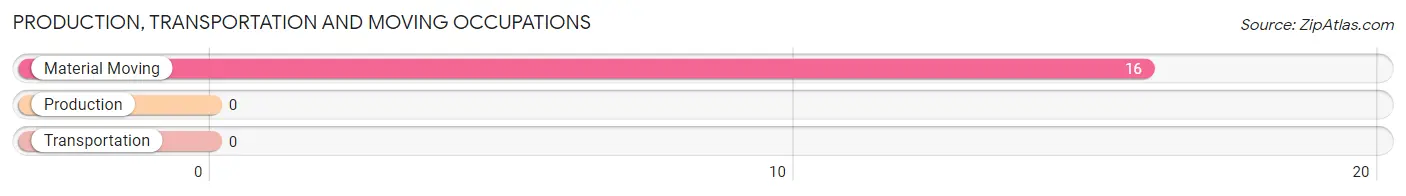
Production, Transportation and Moving Occupations
The most common Production, Transportation and Moving occupations in Bennett are , and Material Moving (16 | 15.7%).
Production, Transportation and Moving Occupations by Sex
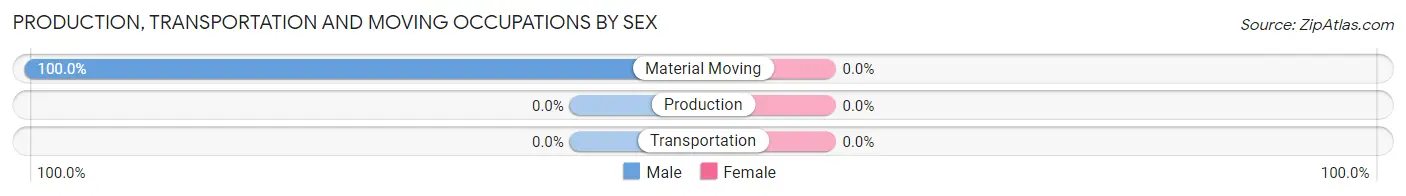
| Occupation | Male | Female |
| Production | 0 (0.0%) | 0 (0.0%) |
| Transportation | 0 (0.0%) | 0 (0.0%) |
| Material Moving | 16 (100.0%) | 0 (0.0%) |
| Total (Category) | 16 (100.0%) | 0 (0.0%) |
| Total (Overall) | 85 (83.3%) | 17 (16.7%) |
Employment Industries by Sex in Bennett
Employment Industries in Bennett
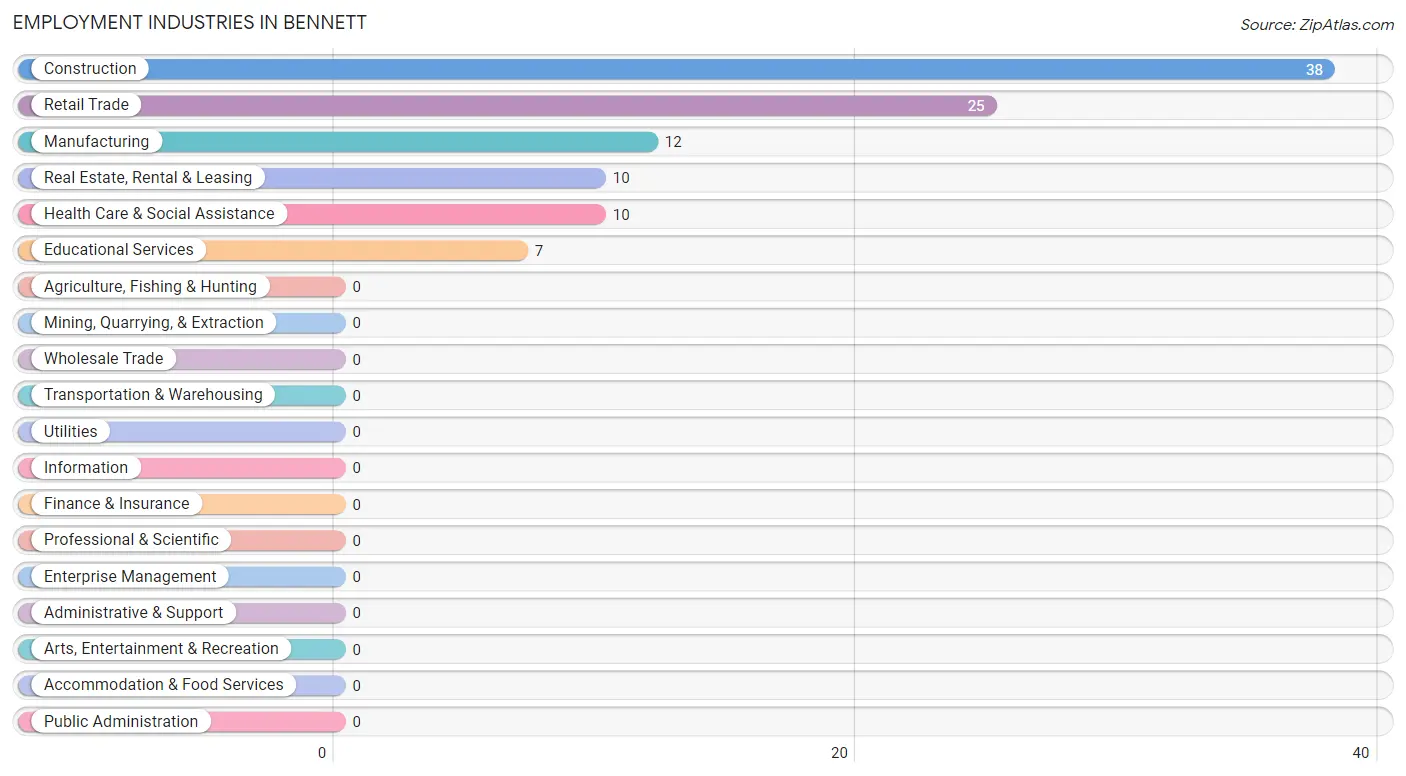
The major employment industries in Bennett include Construction (38 | 37.2%), Retail Trade (25 | 24.5%), Manufacturing (12 | 11.8%), Real Estate, Rental & Leasing (10 | 9.8%), and Health Care & Social Assistance (10 | 9.8%).
Employment Industries by Sex in Bennett
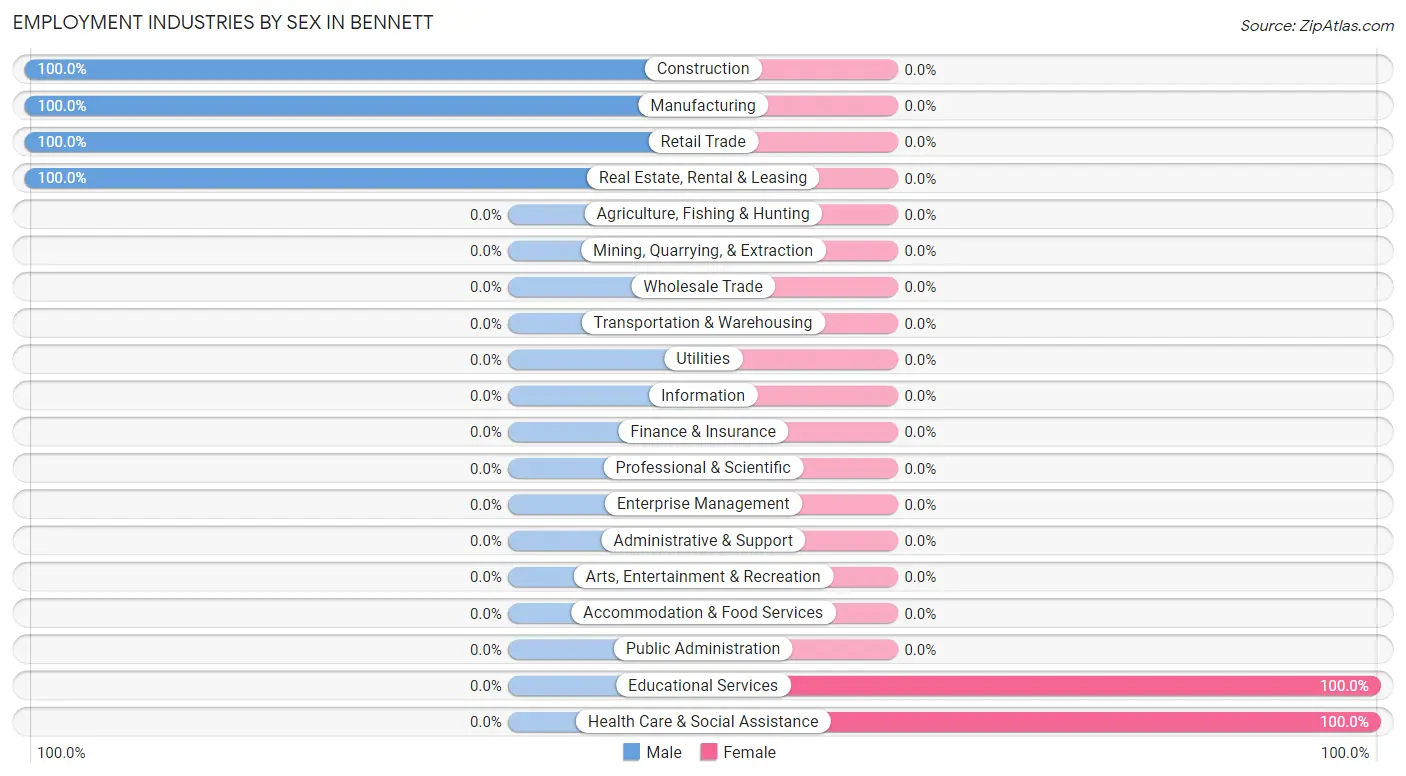
The Bennett industries that see more men than women are Construction (100.0%), Manufacturing (100.0%), and Retail Trade (100.0%), whereas the industries that tend to have a higher number of women are Educational Services (100.0%), and Health Care & Social Assistance (100.0%).
| Industry | Male | Female |
| Agriculture, Fishing & Hunting | 0 (0.0%) | 0 (0.0%) |
| Mining, Quarrying, & Extraction | 0 (0.0%) | 0 (0.0%) |
| Construction | 38 (100.0%) | 0 (0.0%) |
| Manufacturing | 12 (100.0%) | 0 (0.0%) |
| Wholesale Trade | 0 (0.0%) | 0 (0.0%) |
| Retail Trade | 25 (100.0%) | 0 (0.0%) |
| Transportation & Warehousing | 0 (0.0%) | 0 (0.0%) |
| Utilities | 0 (0.0%) | 0 (0.0%) |
| Information | 0 (0.0%) | 0 (0.0%) |
| Finance & Insurance | 0 (0.0%) | 0 (0.0%) |
| Real Estate, Rental & Leasing | 10 (100.0%) | 0 (0.0%) |
| Professional & Scientific | 0 (0.0%) | 0 (0.0%) |
| Enterprise Management | 0 (0.0%) | 0 (0.0%) |
| Administrative & Support | 0 (0.0%) | 0 (0.0%) |
| Educational Services | 0 (0.0%) | 7 (100.0%) |
| Health Care & Social Assistance | 0 (0.0%) | 10 (100.0%) |
| Arts, Entertainment & Recreation | 0 (0.0%) | 0 (0.0%) |
| Accommodation & Food Services | 0 (0.0%) | 0 (0.0%) |
| Public Administration | 0 (0.0%) | 0 (0.0%) |
| Total | 85 (83.3%) | 17 (16.7%) |
Education in Bennett
School Enrollment in Bennett
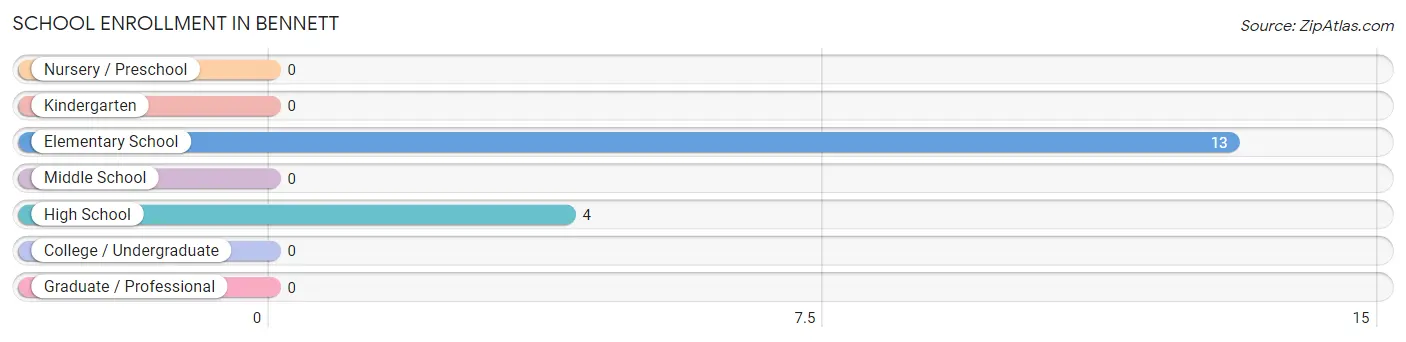
The most common levels of schooling among the 17 students in Bennett are elementary school (13 | 76.5%), and high school (4 | 23.5%).
| School Level | # Students | % Students |
| Nursery / Preschool | 0 | 0.0% |
| Kindergarten | 0 | 0.0% |
| Elementary School | 13 | 76.5% |
| Middle School | 0 | 0.0% |
| High School | 4 | 23.5% |
| College / Undergraduate | 0 | 0.0% |
| Graduate / Professional | 0 | 0.0% |
| Total | 17 | 100.0% |
School Enrollment by Age by Funding Source in Bennett
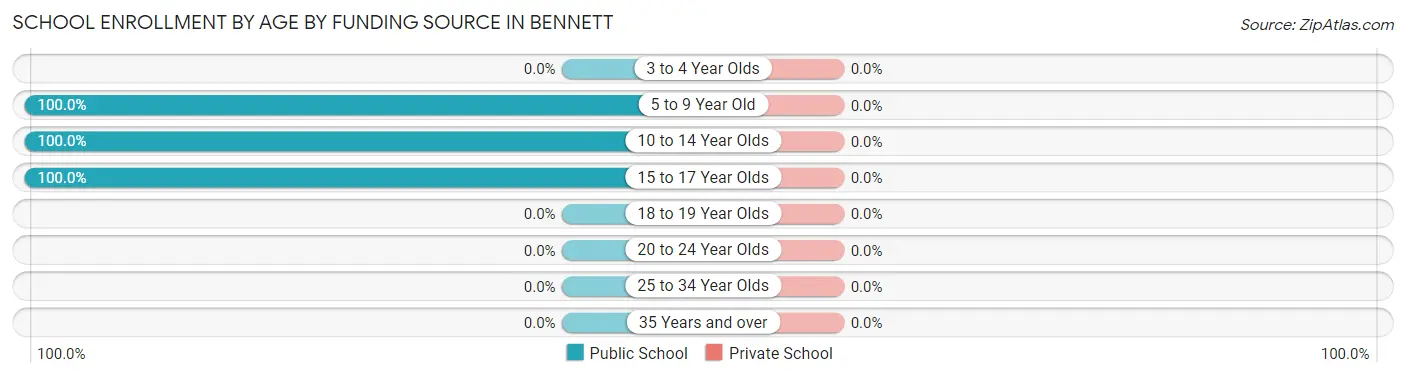
| Age Bracket | Public School | Private School |
| 3 to 4 Year Olds | 0 (0.0%) | 0 (0.0%) |
| 5 to 9 Year Old | 10 (100.0%) | 0 (0.0%) |
| 10 to 14 Year Olds | 3 (100.0%) | 0 (0.0%) |
| 15 to 17 Year Olds | 4 (100.0%) | 0 (0.0%) |
| 18 to 19 Year Olds | 0 (0.0%) | 0 (0.0%) |
| 20 to 24 Year Olds | 0 (0.0%) | 0 (0.0%) |
| 25 to 34 Year Olds | 0 (0.0%) | 0 (0.0%) |
| 35 Years and over | 0 (0.0%) | 0 (0.0%) |
| Total | 17 (100.0%) | 0 (0.0%) |
Educational Attainment by Field of Study in Bennett
Science & technology (10 | 58.8%), and education (7 | 41.2%) are the most common fields of study among 17 individuals in Bennett who have obtained a bachelor's degree or higher.
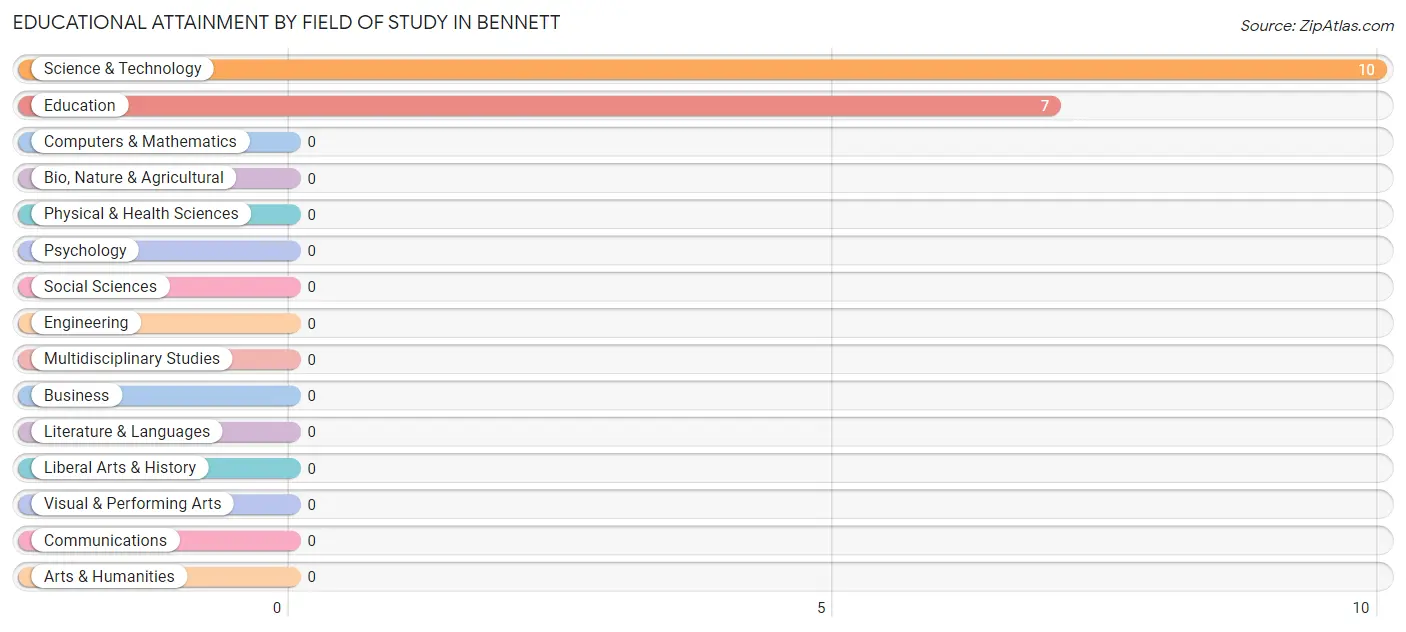
| Field of Study | # Graduates | % Graduates |
| Computers & Mathematics | 0 | 0.0% |
| Bio, Nature & Agricultural | 0 | 0.0% |
| Physical & Health Sciences | 0 | 0.0% |
| Psychology | 0 | 0.0% |
| Social Sciences | 0 | 0.0% |
| Engineering | 0 | 0.0% |
| Multidisciplinary Studies | 0 | 0.0% |
| Science & Technology | 10 | 58.8% |
| Business | 0 | 0.0% |
| Education | 7 | 41.2% |
| Literature & Languages | 0 | 0.0% |
| Liberal Arts & History | 0 | 0.0% |
| Visual & Performing Arts | 0 | 0.0% |
| Communications | 0 | 0.0% |
| Arts & Humanities | 0 | 0.0% |
| Total | 17 | 100.0% |
Transportation & Commute in Bennett
Vehicle Availability by Sex in Bennett
The most prevalent vehicle ownership categories in Bennett are males with 2 vehicles (63, accounting for 74.1%) and females with 2 vehicles (10, making up 370.6%).
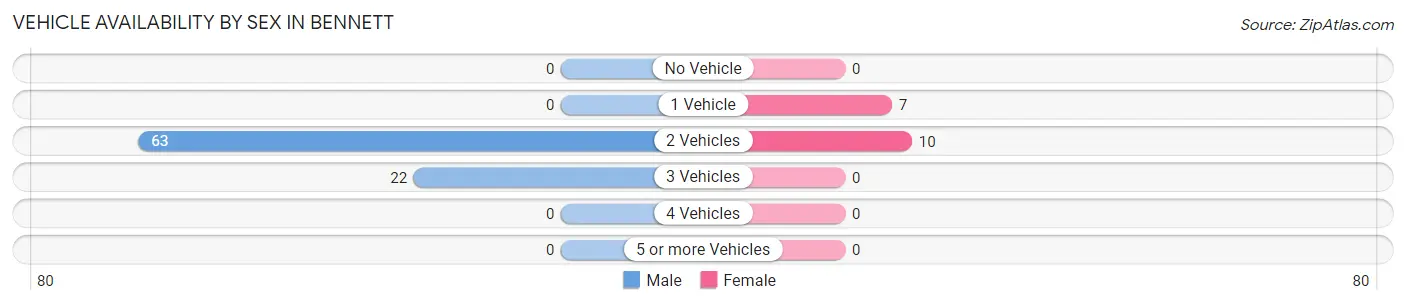
| Vehicles Available | Male | Female |
| No Vehicle | 0 (0.0%) | 0 (0.0%) |
| 1 Vehicle | 0 (0.0%) | 7 (41.2%) |
| 2 Vehicles | 63 (74.1%) | 10 (58.8%) |
| 3 Vehicles | 22 (25.9%) | 0 (0.0%) |
| 4 Vehicles | 0 (0.0%) | 0 (0.0%) |
| 5 or more Vehicles | 0 (0.0%) | 0 (0.0%) |
| Total | 85 (100.0%) | 17 (100.0%) |
Commute Time in Bennett
The most frequently occuring commute durations in Bennett are 25 to 29 minutes (54 commuters, 54.5%), 30 to 34 minutes (32 commuters, 32.3%), and 5 to 9 minutes (7 commuters, 7.1%).
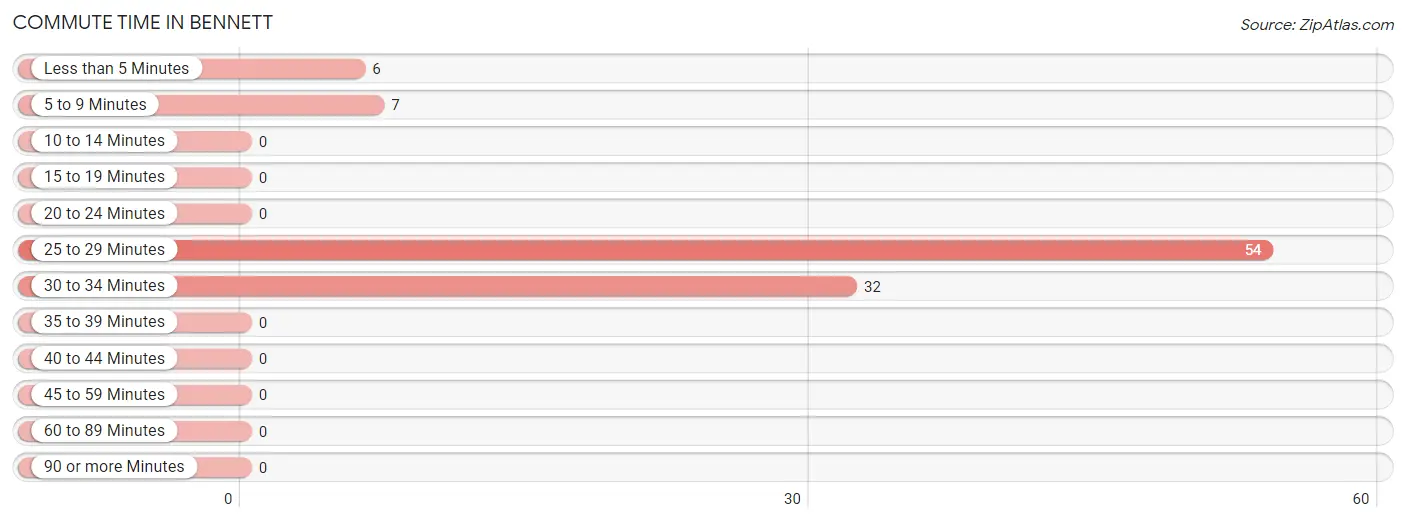
| Commute Time | # Commuters | % Commuters |
| Less than 5 Minutes | 6 | 6.1% |
| 5 to 9 Minutes | 7 | 7.1% |
| 10 to 14 Minutes | 0 | 0.0% |
| 15 to 19 Minutes | 0 | 0.0% |
| 20 to 24 Minutes | 0 | 0.0% |
| 25 to 29 Minutes | 54 | 54.5% |
| 30 to 34 Minutes | 32 | 32.3% |
| 35 to 39 Minutes | 0 | 0.0% |
| 40 to 44 Minutes | 0 | 0.0% |
| 45 to 59 Minutes | 0 | 0.0% |
| 60 to 89 Minutes | 0 | 0.0% |
| 90 or more Minutes | 0 | 0.0% |
Commute Time by Sex in Bennett
The most common commute times in Bennett are 25 to 29 minutes (54 commuters, 65.8%) for males and 30 to 34 minutes (10 commuters, 58.8%) for females.
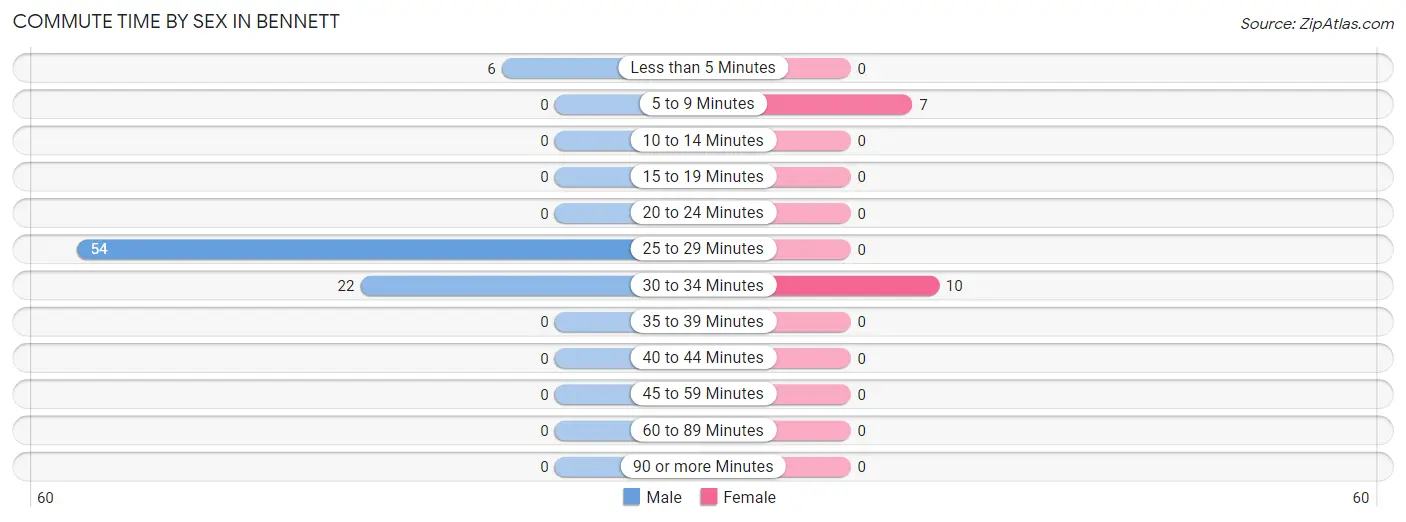
| Commute Time | Male | Female |
| Less than 5 Minutes | 6 (7.3%) | 0 (0.0%) |
| 5 to 9 Minutes | 0 (0.0%) | 7 (41.2%) |
| 10 to 14 Minutes | 0 (0.0%) | 0 (0.0%) |
| 15 to 19 Minutes | 0 (0.0%) | 0 (0.0%) |
| 20 to 24 Minutes | 0 (0.0%) | 0 (0.0%) |
| 25 to 29 Minutes | 54 (65.8%) | 0 (0.0%) |
| 30 to 34 Minutes | 22 (26.8%) | 10 (58.8%) |
| 35 to 39 Minutes | 0 (0.0%) | 0 (0.0%) |
| 40 to 44 Minutes | 0 (0.0%) | 0 (0.0%) |
| 45 to 59 Minutes | 0 (0.0%) | 0 (0.0%) |
| 60 to 89 Minutes | 0 (0.0%) | 0 (0.0%) |
| 90 or more Minutes | 0 (0.0%) | 0 (0.0%) |
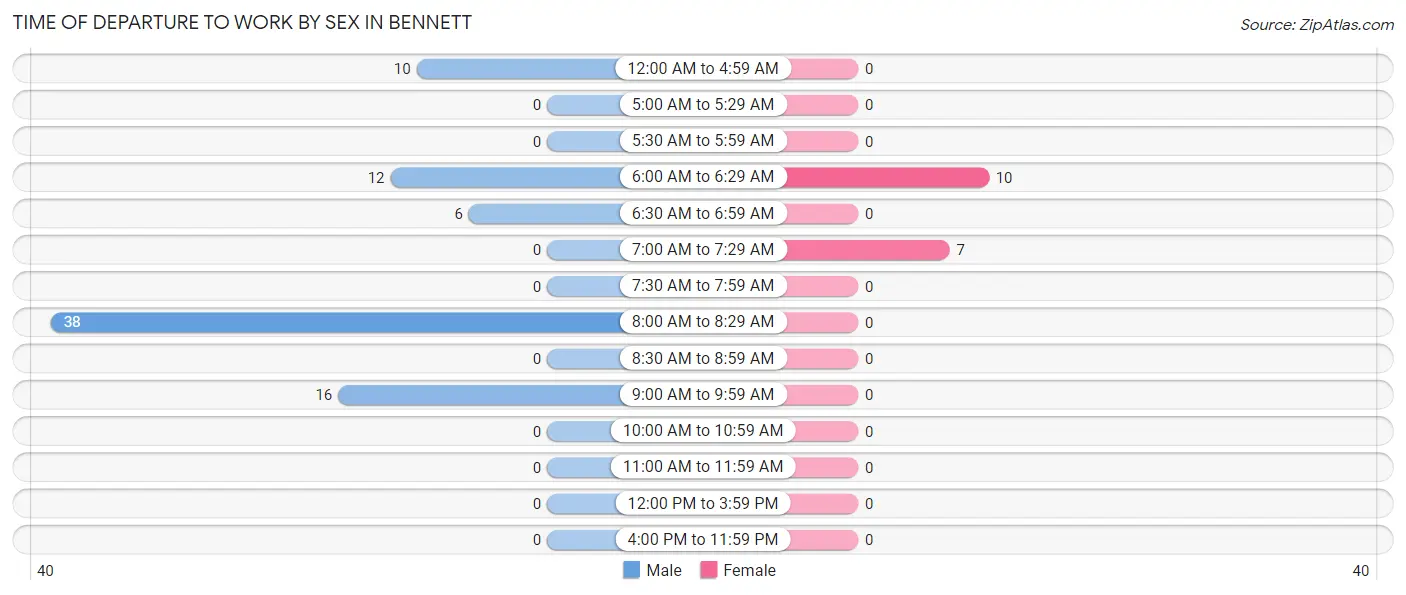
Time of Departure to Work by Sex in Bennett
The most frequent times of departure to work in Bennett are 8:00 AM to 8:29 AM (38, 46.3%) for males and 6:00 AM to 6:29 AM (10, 58.8%) for females.
| Time of Departure | Male | Female |
| 12:00 AM to 4:59 AM | 10 (12.2%) | 0 (0.0%) |
| 5:00 AM to 5:29 AM | 0 (0.0%) | 0 (0.0%) |
| 5:30 AM to 5:59 AM | 0 (0.0%) | 0 (0.0%) |
| 6:00 AM to 6:29 AM | 12 (14.6%) | 10 (58.8%) |
| 6:30 AM to 6:59 AM | 6 (7.3%) | 0 (0.0%) |
| 7:00 AM to 7:29 AM | 0 (0.0%) | 7 (41.2%) |
| 7:30 AM to 7:59 AM | 0 (0.0%) | 0 (0.0%) |
| 8:00 AM to 8:29 AM | 38 (46.3%) | 0 (0.0%) |
| 8:30 AM to 8:59 AM | 0 (0.0%) | 0 (0.0%) |
| 9:00 AM to 9:59 AM | 16 (19.5%) | 0 (0.0%) |
| 10:00 AM to 10:59 AM | 0 (0.0%) | 0 (0.0%) |
| 11:00 AM to 11:59 AM | 0 (0.0%) | 0 (0.0%) |
| 12:00 PM to 3:59 PM | 0 (0.0%) | 0 (0.0%) |
| 4:00 PM to 11:59 PM | 0 (0.0%) | 0 (0.0%) |
| Total | 82 (100.0%) | 17 (100.0%) |
Housing Occupancy in Bennett
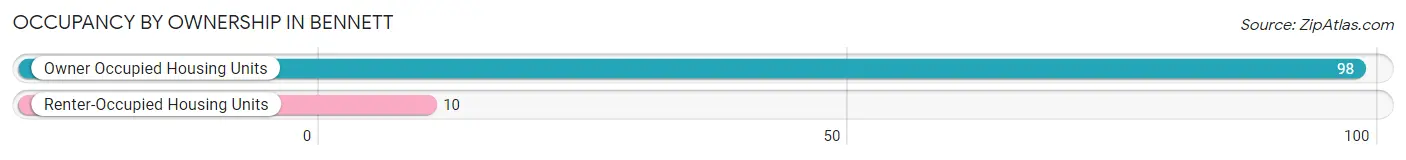
Occupancy by Ownership in Bennett
Of the total 108 dwellings in Bennett, owner-occupied units account for 98 (90.7%), while renter-occupied units make up 10 (9.3%).
| Occupancy | # Housing Units | % Housing Units |
| Owner Occupied Housing Units | 98 | 90.7% |
| Renter-Occupied Housing Units | 10 | 9.3% |
| Total Occupied Housing Units | 108 | 100.0% |
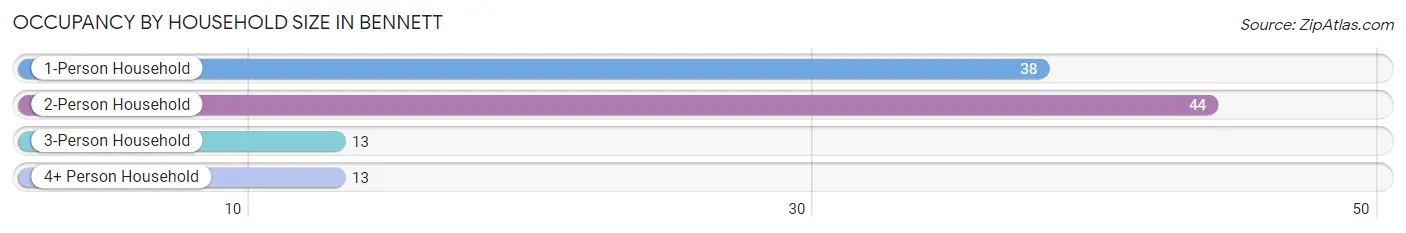
Occupancy by Household Size in Bennett
| Household Size | # Housing Units | % Housing Units |
| 1-Person Household | 38 | 35.2% |
| 2-Person Household | 44 | 40.7% |
| 3-Person Household | 13 | 12.0% |
| 4+ Person Household | 13 | 12.0% |
| Total Housing Units | 108 | 100.0% |
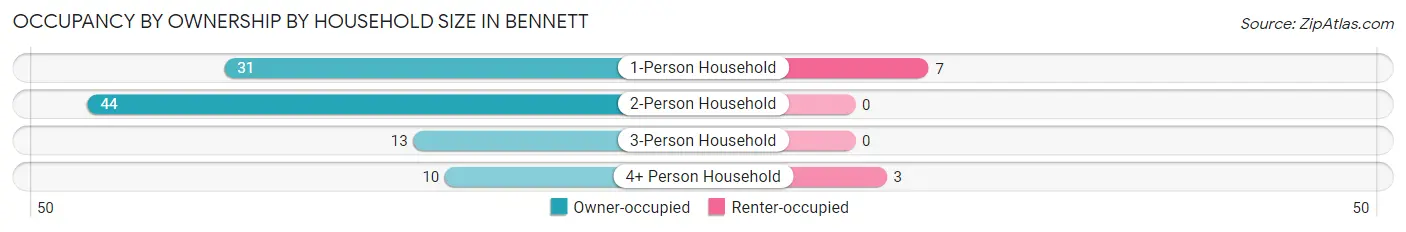
Occupancy by Ownership by Household Size in Bennett
| Household Size | Owner-occupied | Renter-occupied |
| 1-Person Household | 31 (81.6%) | 7 (18.4%) |
| 2-Person Household | 44 (100.0%) | 0 (0.0%) |
| 3-Person Household | 13 (100.0%) | 0 (0.0%) |
| 4+ Person Household | 10 (76.9%) | 3 (23.1%) |
| Total Housing Units | 98 (90.7%) | 10 (9.3%) |
Occupancy by Educational Attainment in Bennett
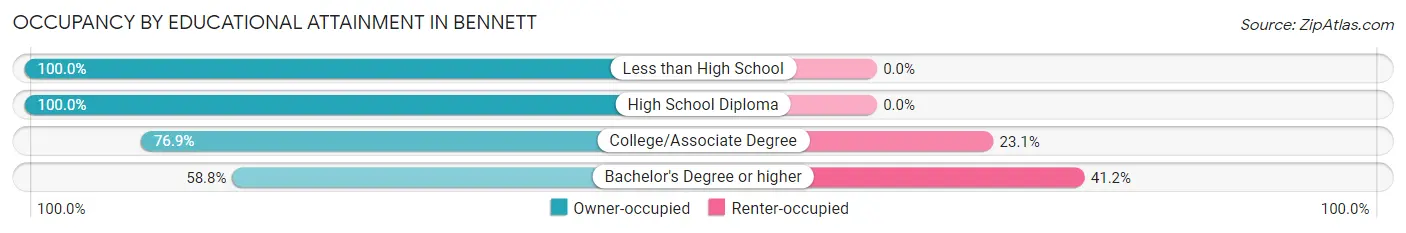
| Household Size | Owner-occupied | Renter-occupied |
| Less than High School | 6 (100.0%) | 0 (0.0%) |
| High School Diploma | 72 (100.0%) | 0 (0.0%) |
| College/Associate Degree | 10 (76.9%) | 3 (23.1%) |
| Bachelor's Degree or higher | 10 (58.8%) | 7 (41.2%) |
Occupancy by Age of Householder in Bennett
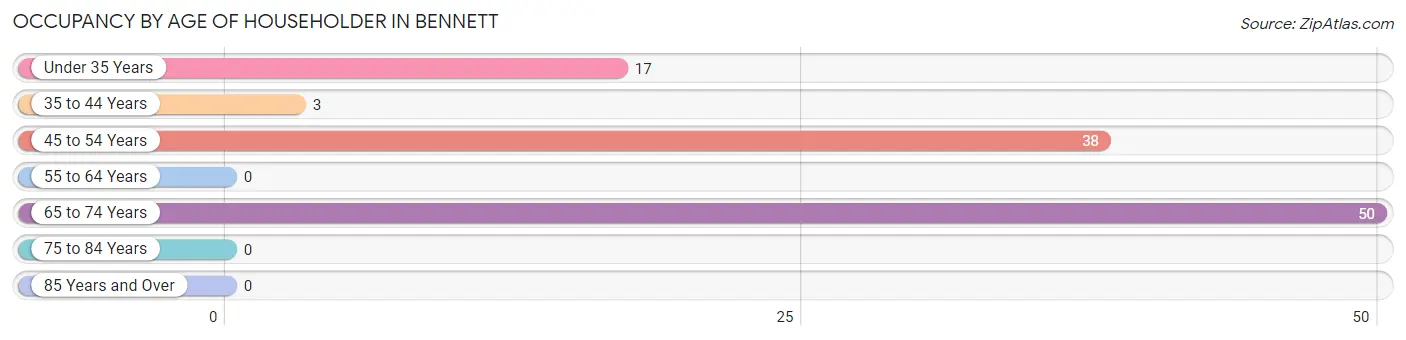
| Age Bracket | # Households | % Households |
| Under 35 Years | 17 | 15.7% |
| 35 to 44 Years | 3 | 2.8% |
| 45 to 54 Years | 38 | 35.2% |
| 55 to 64 Years | 0 | 0.0% |
| 65 to 74 Years | 50 | 46.3% |
| 75 to 84 Years | 0 | 0.0% |
| 85 Years and Over | 0 | 0.0% |
| Total | 108 | 100.0% |
Housing Finances in Bennett
Median Income by Occupancy in Bennett
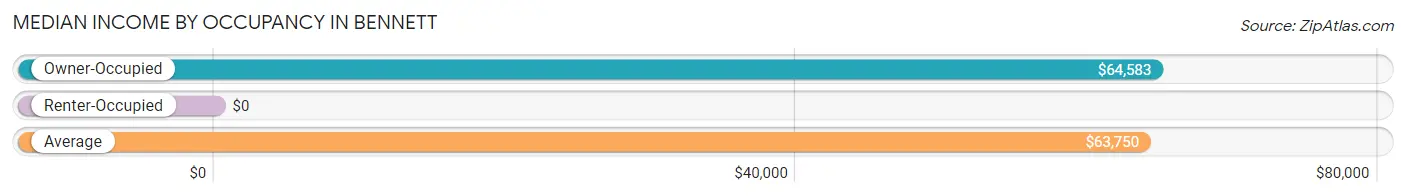
| Occupancy Type | # Households | Median Income |
| Owner-Occupied | 98 (90.7%) | $64,583 |
| Renter-Occupied | 10 (9.3%) | $0 |
| Average | 108 (100.0%) | $63,750 |
Occupancy by Householder Income Bracket in Bennett
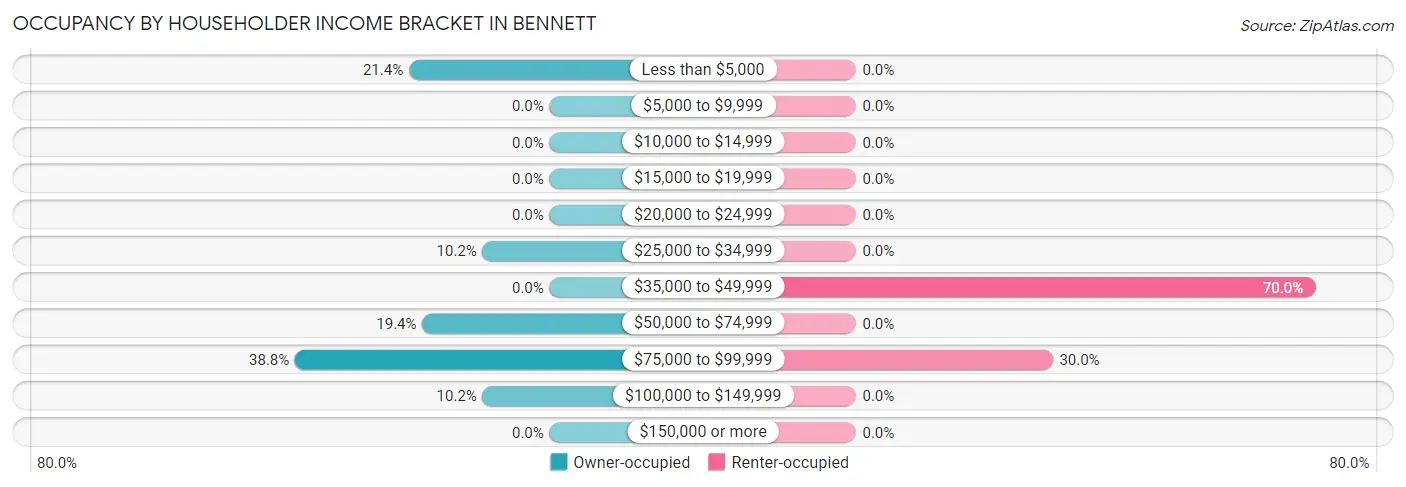
| Income Bracket | Owner-occupied | Renter-occupied |
| Less than $5,000 | 21 (21.4%) | 0 (0.0%) |
| $5,000 to $9,999 | 0 (0.0%) | 0 (0.0%) |
| $10,000 to $14,999 | 0 (0.0%) | 0 (0.0%) |
| $15,000 to $19,999 | 0 (0.0%) | 0 (0.0%) |
| $20,000 to $24,999 | 0 (0.0%) | 0 (0.0%) |
| $25,000 to $34,999 | 10 (10.2%) | 0 (0.0%) |
| $35,000 to $49,999 | 0 (0.0%) | 7 (70.0%) |
| $50,000 to $74,999 | 19 (19.4%) | 0 (0.0%) |
| $75,000 to $99,999 | 38 (38.8%) | 3 (30.0%) |
| $100,000 to $149,999 | 10 (10.2%) | 0 (0.0%) |
| $150,000 or more | 0 (0.0%) | 0 (0.0%) |
| Total | 98 (100.0%) | 10 (100.0%) |
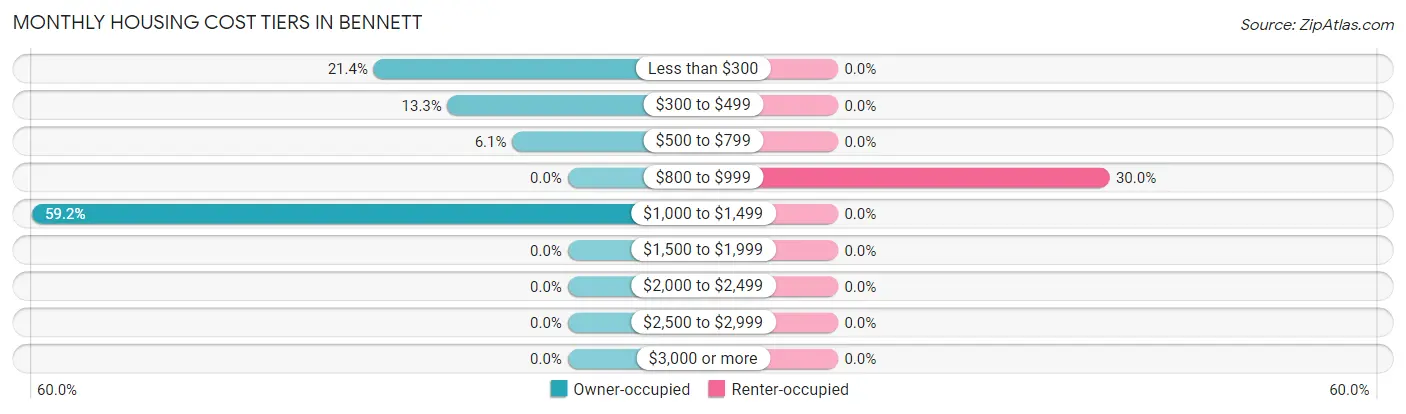
Monthly Housing Cost Tiers in Bennett
| Monthly Cost | Owner-occupied | Renter-occupied |
| Less than $300 | 21 (21.4%) | 0 (0.0%) |
| $300 to $499 | 13 (13.3%) | 0 (0.0%) |
| $500 to $799 | 6 (6.1%) | 0 (0.0%) |
| $800 to $999 | 0 (0.0%) | 3 (30.0%) |
| $1,000 to $1,499 | 58 (59.2%) | 0 (0.0%) |
| $1,500 to $1,999 | 0 (0.0%) | 0 (0.0%) |
| $2,000 to $2,499 | 0 (0.0%) | 0 (0.0%) |
| $2,500 to $2,999 | 0 (0.0%) | 0 (0.0%) |
| $3,000 or more | 0 (0.0%) | 0 (0.0%) |
| Total | 98 (100.0%) | 10 (100.0%) |
Physical Housing Characteristics in Bennett
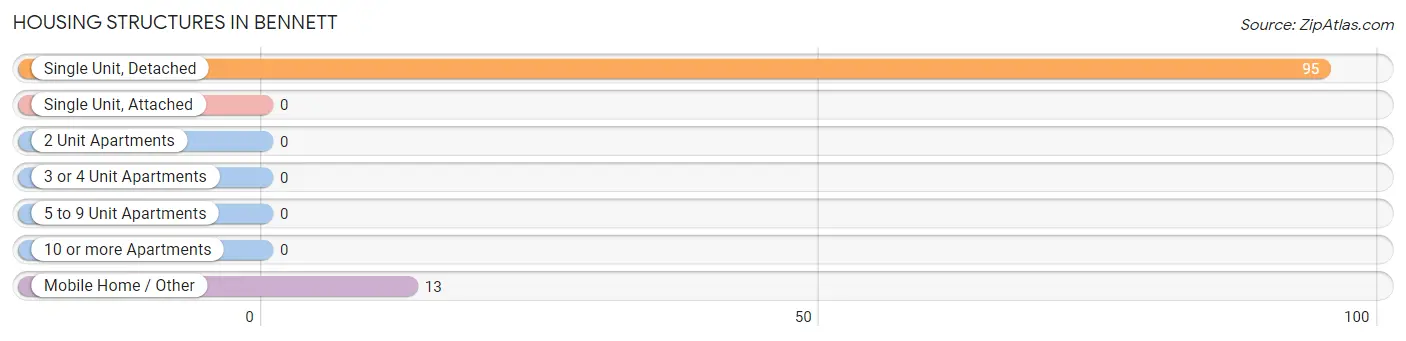
Housing Structures in Bennett
| Structure Type | # Housing Units | % Housing Units |
| Single Unit, Detached | 95 | 88.0% |
| Single Unit, Attached | 0 | 0.0% |
| 2 Unit Apartments | 0 | 0.0% |
| 3 or 4 Unit Apartments | 0 | 0.0% |
| 5 to 9 Unit Apartments | 0 | 0.0% |
| 10 or more Apartments | 0 | 0.0% |
| Mobile Home / Other | 13 | 12.0% |
| Total | 108 | 100.0% |
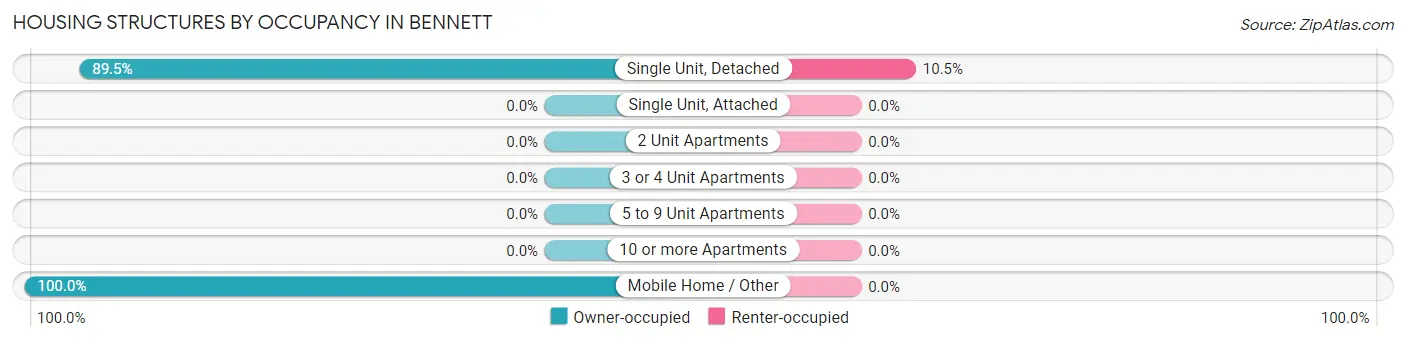
Housing Structures by Occupancy in Bennett
| Structure Type | Owner-occupied | Renter-occupied |
| Single Unit, Detached | 85 (89.5%) | 10 (10.5%) |
| Single Unit, Attached | 0 (0.0%) | 0 (0.0%) |
| 2 Unit Apartments | 0 (0.0%) | 0 (0.0%) |
| 3 or 4 Unit Apartments | 0 (0.0%) | 0 (0.0%) |
| 5 to 9 Unit Apartments | 0 (0.0%) | 0 (0.0%) |
| 10 or more Apartments | 0 (0.0%) | 0 (0.0%) |
| Mobile Home / Other | 13 (100.0%) | 0 (0.0%) |
| Total | 98 (90.7%) | 10 (9.3%) |
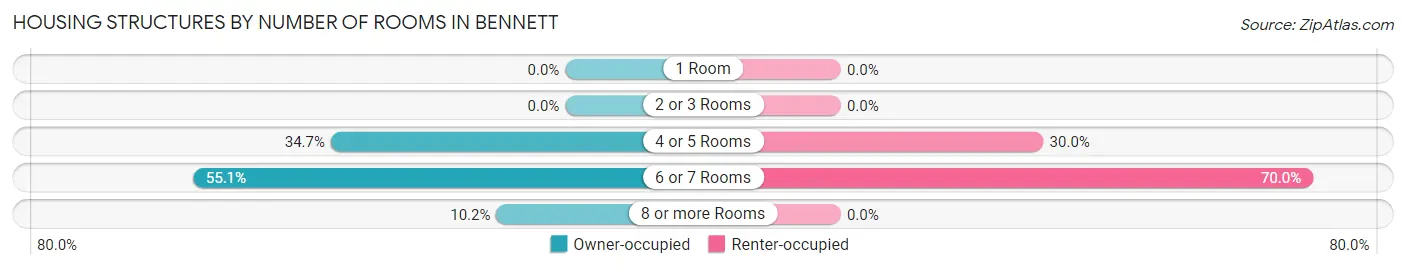
Housing Structures by Number of Rooms in Bennett
| Number of Rooms | Owner-occupied | Renter-occupied |
| 1 Room | 0 (0.0%) | 0 (0.0%) |
| 2 or 3 Rooms | 0 (0.0%) | 0 (0.0%) |
| 4 or 5 Rooms | 34 (34.7%) | 3 (30.0%) |
| 6 or 7 Rooms | 54 (55.1%) | 7 (70.0%) |
| 8 or more Rooms | 10 (10.2%) | 0 (0.0%) |
| Total | 98 (100.0%) | 10 (100.0%) |
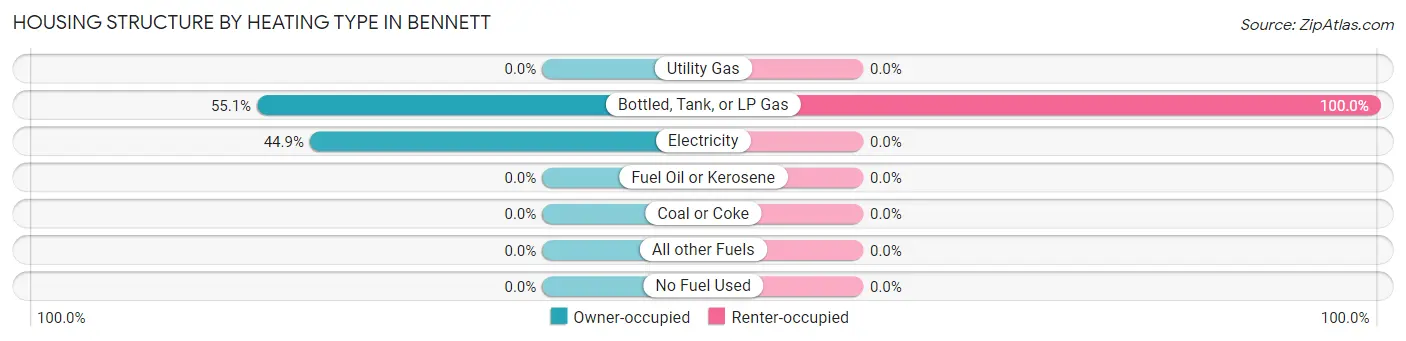
Housing Structure by Heating Type in Bennett
| Heating Type | Owner-occupied | Renter-occupied |
| Utility Gas | 0 (0.0%) | 0 (0.0%) |
| Bottled, Tank, or LP Gas | 54 (55.1%) | 10 (100.0%) |
| Electricity | 44 (44.9%) | 0 (0.0%) |
| Fuel Oil or Kerosene | 0 (0.0%) | 0 (0.0%) |
| Coal or Coke | 0 (0.0%) | 0 (0.0%) |
| All other Fuels | 0 (0.0%) | 0 (0.0%) |
| No Fuel Used | 0 (0.0%) | 0 (0.0%) |
| Total | 98 (100.0%) | 10 (100.0%) |
Household Vehicle Usage in Bennett
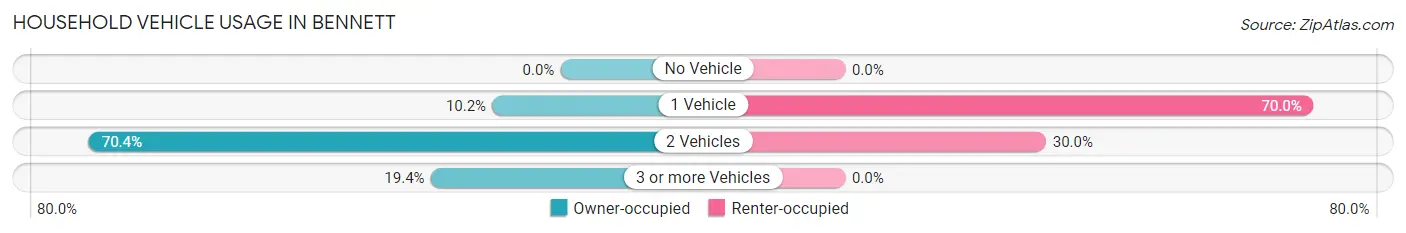
| Vehicles per Household | Owner-occupied | Renter-occupied |
| No Vehicle | 0 (0.0%) | 0 (0.0%) |
| 1 Vehicle | 10 (10.2%) | 7 (70.0%) |
| 2 Vehicles | 69 (70.4%) | 3 (30.0%) |
| 3 or more Vehicles | 19 (19.4%) | 0 (0.0%) |
| Total | 98 (100.0%) | 10 (100.0%) |
Real Estate & Mortgages in Bennett
Real Estate and Mortgage Overview in Bennett
| Characteristic | Without Mortgage | With Mortgage |
| Housing Units | 40 | 58 |
| Median Property Value | $53,300 | $144,100 |
| Median Household Income | $2,499 | $0 |
| Monthly Housing Costs | - | - |
| Real Estate Taxes | $667 | $0 |
Property Value by Mortgage Status in Bennett
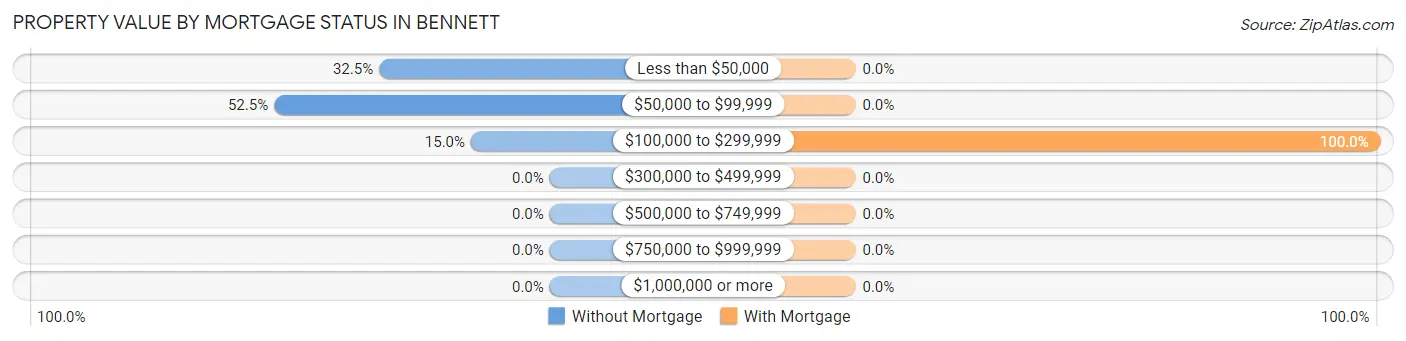
| Property Value | Without Mortgage | With Mortgage |
| Less than $50,000 | 13 (32.5%) | 0 (0.0%) |
| $50,000 to $99,999 | 21 (52.5%) | 0 (0.0%) |
| $100,000 to $299,999 | 6 (15.0%) | 58 (100.0%) |
| $300,000 to $499,999 | 0 (0.0%) | 0 (0.0%) |
| $500,000 to $749,999 | 0 (0.0%) | 0 (0.0%) |
| $750,000 to $999,999 | 0 (0.0%) | 0 (0.0%) |
| $1,000,000 or more | 0 (0.0%) | 0 (0.0%) |
| Total | 40 (100.0%) | 58 (100.0%) |
Household Income by Mortgage Status in Bennett
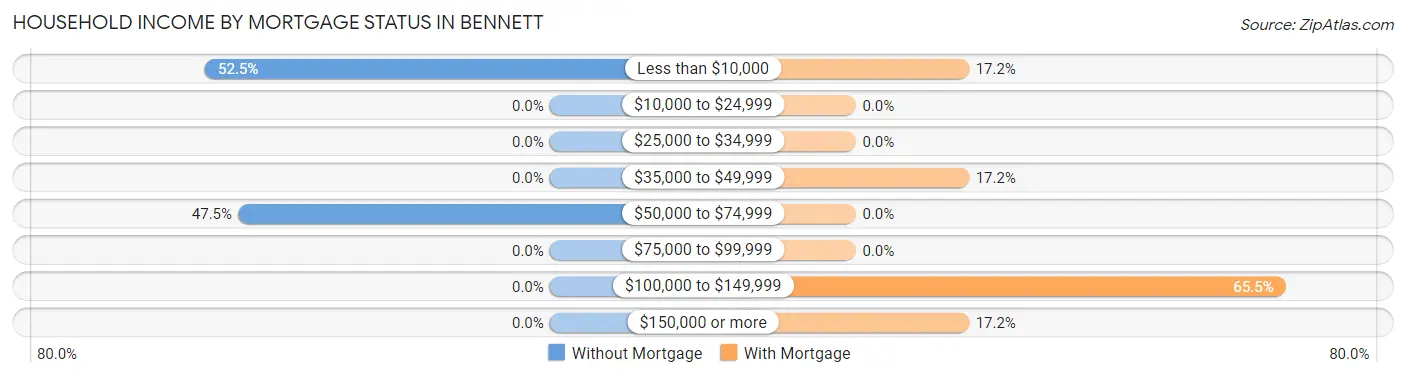
| Household Income | Without Mortgage | With Mortgage |
| Less than $10,000 | 21 (52.5%) | 10 (17.2%) |
| $10,000 to $24,999 | 0 (0.0%) | 0 (0.0%) |
| $25,000 to $34,999 | 0 (0.0%) | 0 (0.0%) |
| $35,000 to $49,999 | 0 (0.0%) | 10 (17.2%) |
| $50,000 to $74,999 | 19 (47.5%) | 0 (0.0%) |
| $75,000 to $99,999 | 0 (0.0%) | 0 (0.0%) |
| $100,000 to $149,999 | 0 (0.0%) | 38 (65.5%) |
| $150,000 or more | 0 (0.0%) | 10 (17.2%) |
| Total | 40 (100.0%) | 58 (100.0%) |
Property Value to Household Income Ratio in Bennett
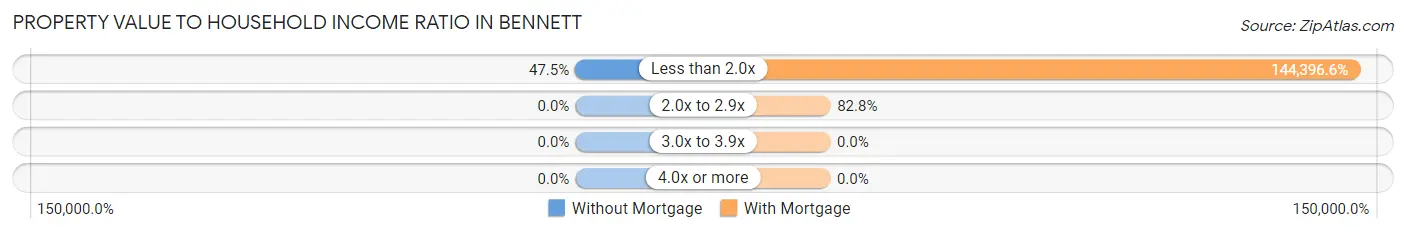
| Value-to-Income Ratio | Without Mortgage | With Mortgage |
| Less than 2.0x | 19 (47.5%) | 83,750 (144,396.6%) |
| 2.0x to 2.9x | 0 (0.0%) | 48 (82.8%) |
| 3.0x to 3.9x | 0 (0.0%) | 0 (0.0%) |
| 4.0x or more | 0 (0.0%) | 0 (0.0%) |
| Total | 40 (100.0%) | 58 (100.0%) |
Real Estate Taxes by Mortgage Status in Bennett
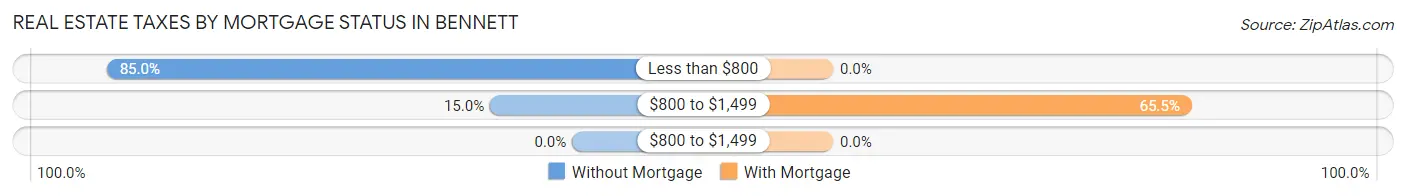
| Property Taxes | Without Mortgage | With Mortgage |
| Less than $800 | 34 (85.0%) | 0 (0.0%) |
| $800 to $1,499 | 6 (15.0%) | 38 (65.5%) |
| $800 to $1,499 | 0 (0.0%) | 0 (0.0%) |
| Total | 40 (100.0%) | 58 (100.0%) |
Health & Disability in Bennett
Health Insurance Coverage by Age in Bennett
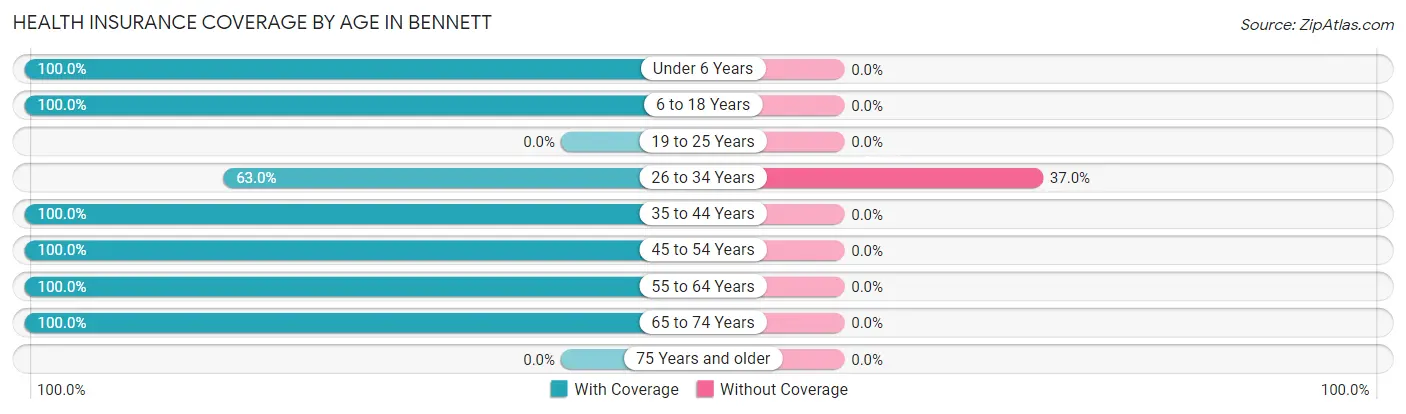
| Age Bracket | With Coverage | Without Coverage |
| Under 6 Years | 7 (100.0%) | 0 (0.0%) |
| 6 to 18 Years | 17 (100.0%) | 0 (0.0%) |
| 19 to 25 Years | 0 (0.0%) | 0 (0.0%) |
| 26 to 34 Years | 17 (63.0%) | 10 (37.0%) |
| 35 to 44 Years | 22 (100.0%) | 0 (0.0%) |
| 45 to 54 Years | 76 (100.0%) | 0 (0.0%) |
| 55 to 64 Years | 12 (100.0%) | 0 (0.0%) |
| 65 to 74 Years | 67 (100.0%) | 0 (0.0%) |
| 75 Years and older | 0 (0.0%) | 0 (0.0%) |
| Total | 218 (95.6%) | 10 (4.4%) |
Health Insurance Coverage by Citizenship Status in Bennett
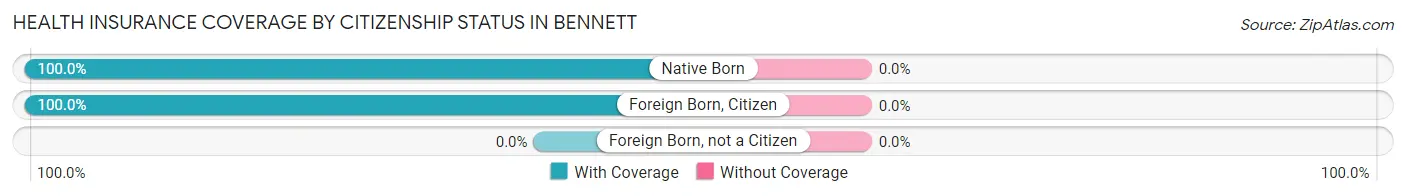
| Citizenship Status | With Coverage | Without Coverage |
| Native Born | 7 (100.0%) | 0 (0.0%) |
| Foreign Born, Citizen | 17 (100.0%) | 0 (0.0%) |
| Foreign Born, not a Citizen | 0 (0.0%) | 0 (0.0%) |
Health Insurance Coverage by Household Income in Bennett
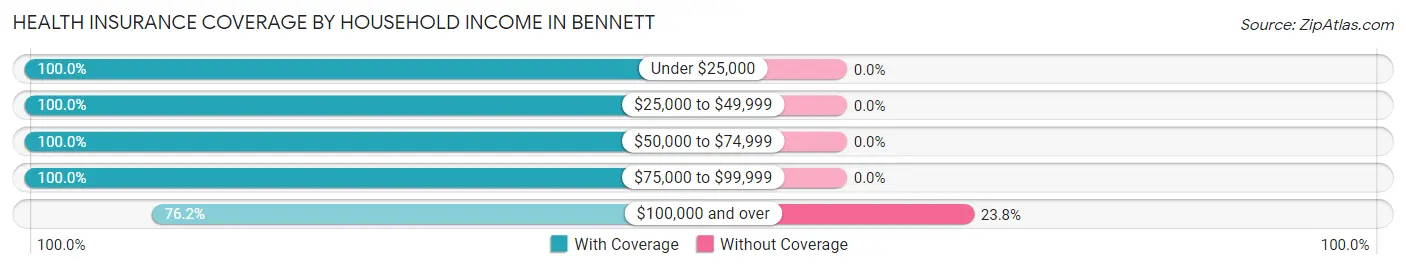
| Household Income | With Coverage | Without Coverage |
| Under $25,000 | 21 (100.0%) | 0 (0.0%) |
| $25,000 to $49,999 | 17 (100.0%) | 0 (0.0%) |
| $50,000 to $74,999 | 52 (100.0%) | 0 (0.0%) |
| $75,000 to $99,999 | 96 (100.0%) | 0 (0.0%) |
| $100,000 and over | 32 (76.2%) | 10 (23.8%) |
Public vs Private Health Insurance Coverage by Age in Bennett
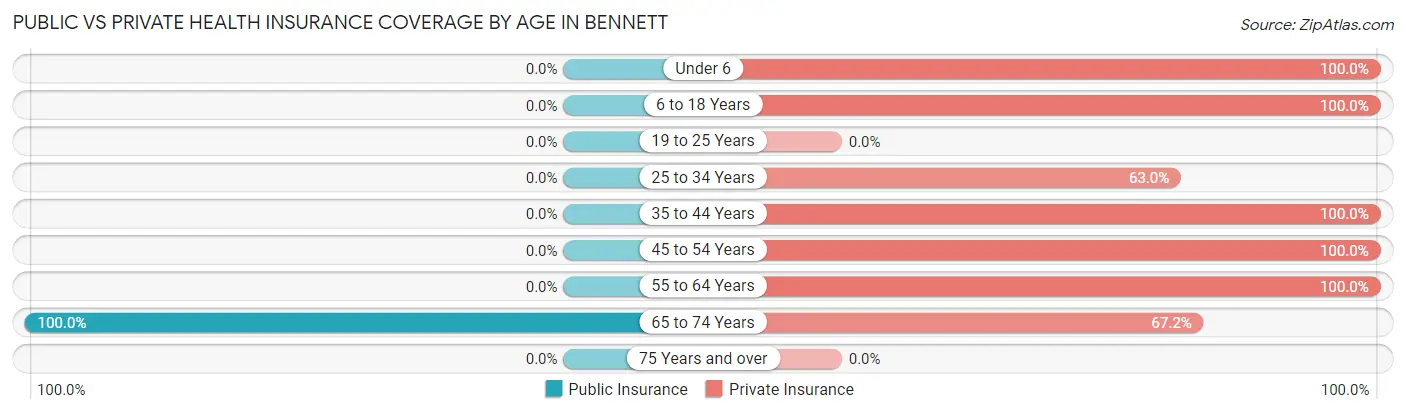
| Age Bracket | Public Insurance | Private Insurance |
| Under 6 | 0 (0.0%) | 7 (100.0%) |
| 6 to 18 Years | 0 (0.0%) | 17 (100.0%) |
| 19 to 25 Years | 0 (0.0%) | 0 (0.0%) |
| 25 to 34 Years | 0 (0.0%) | 17 (63.0%) |
| 35 to 44 Years | 0 (0.0%) | 22 (100.0%) |
| 45 to 54 Years | 0 (0.0%) | 76 (100.0%) |
| 55 to 64 Years | 0 (0.0%) | 12 (100.0%) |
| 65 to 74 Years | 67 (100.0%) | 45 (67.2%) |
| 75 Years and over | 0 (0.0%) | 0 (0.0%) |
| Total | 67 (29.4%) | 196 (86.0%) |
Disability Status by Sex by Age in Bennett
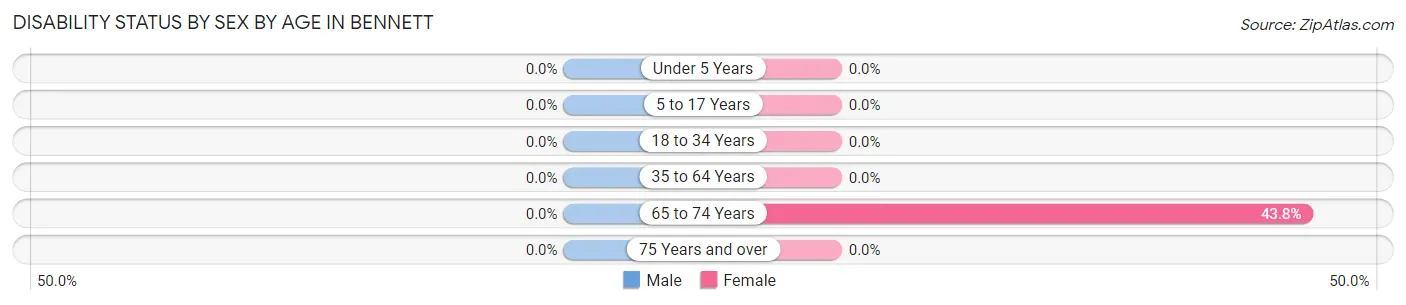
| Age Bracket | Male | Female |
| Under 5 Years | 0 (0.0%) | 0 (0.0%) |
| 5 to 17 Years | 0 (0.0%) | 0 (0.0%) |
| 18 to 34 Years | 0 (0.0%) | 0 (0.0%) |
| 35 to 64 Years | 0 (0.0%) | 0 (0.0%) |
| 65 to 74 Years | 0 (0.0%) | 21 (43.8%) |
| 75 Years and over | 0 (0.0%) | 0 (0.0%) |
Disability Class by Sex by Age in Bennett
Disability Class: Hearing Difficulty
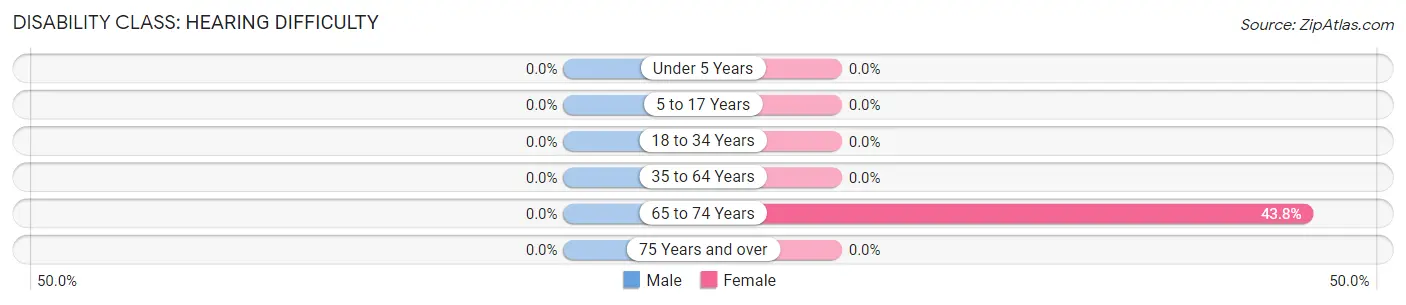
| Age Bracket | Male | Female |
| Under 5 Years | 0 (0.0%) | 0 (0.0%) |
| 5 to 17 Years | 0 (0.0%) | 0 (0.0%) |
| 18 to 34 Years | 0 (0.0%) | 0 (0.0%) |
| 35 to 64 Years | 0 (0.0%) | 0 (0.0%) |
| 65 to 74 Years | 0 (0.0%) | 21 (43.8%) |
| 75 Years and over | 0 (0.0%) | 0 (0.0%) |
Disability Class: Vision Difficulty
| Age Bracket | Male | Female |
| Under 5 Years | 0 (0.0%) | 0 (0.0%) |
| 5 to 17 Years | 0 (0.0%) | 0 (0.0%) |
| 18 to 34 Years | 0 (0.0%) | 0 (0.0%) |
| 35 to 64 Years | 0 (0.0%) | 0 (0.0%) |
| 65 to 74 Years | 0 (0.0%) | 0 (0.0%) |
| 75 Years and over | 0 (0.0%) | 0 (0.0%) |
Disability Class: Cognitive Difficulty
| Age Bracket | Male | Female |
| 5 to 17 Years | 0 (0.0%) | 0 (0.0%) |
| 18 to 34 Years | 0 (0.0%) | 0 (0.0%) |
| 35 to 64 Years | 0 (0.0%) | 0 (0.0%) |
| 65 to 74 Years | 0 (0.0%) | 0 (0.0%) |
| 75 Years and over | 0 (0.0%) | 0 (0.0%) |
Disability Class: Ambulatory Difficulty
| Age Bracket | Male | Female |
| 5 to 17 Years | 0 (0.0%) | 0 (0.0%) |
| 18 to 34 Years | 0 (0.0%) | 0 (0.0%) |
| 35 to 64 Years | 0 (0.0%) | 0 (0.0%) |
| 65 to 74 Years | 0 (0.0%) | 0 (0.0%) |
| 75 Years and over | 0 (0.0%) | 0 (0.0%) |
Disability Class: Self-Care Difficulty
| Age Bracket | Male | Female |
| 5 to 17 Years | 0 (0.0%) | 0 (0.0%) |
| 18 to 34 Years | 0 (0.0%) | 0 (0.0%) |
| 35 to 64 Years | 0 (0.0%) | 0 (0.0%) |
| 65 to 74 Years | 0 (0.0%) | 0 (0.0%) |
| 75 Years and over | 0 (0.0%) | 0 (0.0%) |
Technology Access in Bennett
Computing Device Access in Bennett
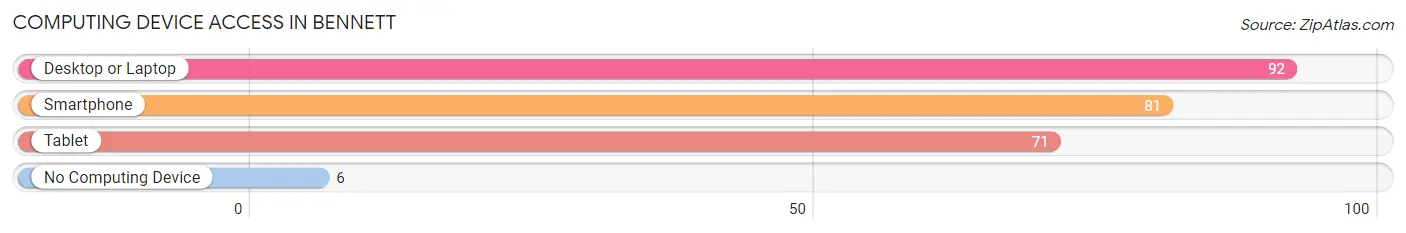
| Device Type | # Households | % Households |
| Desktop or Laptop | 92 | 85.2% |
| Smartphone | 81 | 75.0% |
| Tablet | 71 | 65.7% |
| No Computing Device | 6 | 5.6% |
| Total | 108 | 100.0% |
Internet Access in Bennett
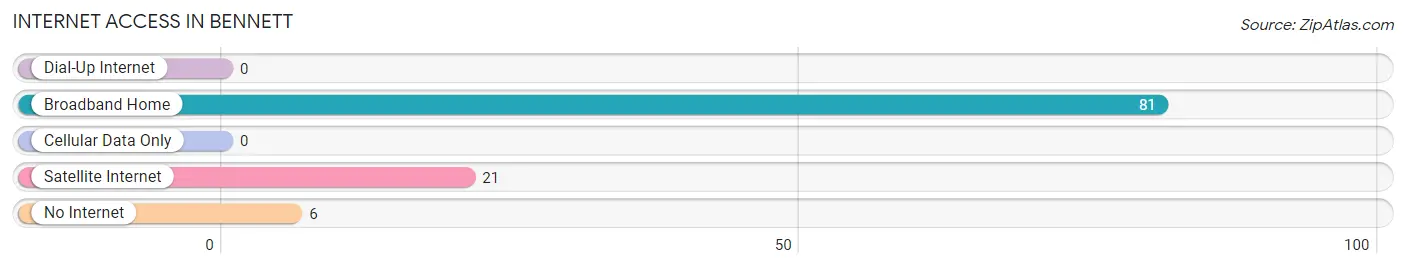
| Internet Type | # Households | % Households |
| Dial-Up Internet | 0 | 0.0% |
| Broadband Home | 81 | 75.0% |
| Cellular Data Only | 0 | 0.0% |
| Satellite Internet | 21 | 19.4% |
| No Internet | 6 | 5.6% |
| Total | 108 | 100.0% |
Bennett Summary
Bennett, North Carolina is a small town located in Chatham County, North Carolina. It is situated in the heart of the Triangle region, which includes the cities of Raleigh, Durham, and Chapel Hill. Bennett is a rural community with a population of approximately 1,000 people. The town is known for its small-town charm and its close proximity to the larger cities of the Triangle.
History
Bennett was founded in 1887 by a group of settlers from the nearby town of Pittsboro. The town was named after the Bennett family, who were among the first settlers. The town was originally a farming community, and the Bennett family owned a large farm in the area. The town grew slowly over the years, and by the early 1900s, it had become a thriving community.
In the early 1900s, Bennett was home to several businesses, including a general store, a blacksmith shop, and a post office. The town also had a school, a church, and a few other businesses. In the 1920s, Bennett was home to a cotton mill, which provided employment for many of the town’s residents.
Geography
Bennett is located in the central part of Chatham County, North Carolina. The town is situated in the Piedmont region of the state, which is characterized by rolling hills and forests. The town is located near the Haw River, which is a tributary of the Cape Fear River. Bennett is located approximately 25 miles south of Raleigh and 40 miles west of Durham.
Economy
Bennett’s economy is largely based on agriculture. The town is home to several farms, which produce a variety of crops, including corn, soybeans, and tobacco. The town also has a few small businesses, including a general store, a gas station, and a few restaurants.
Demographics
As of the 2010 census, Bennett had a population of 1,000 people. The town is predominantly white, with a small African American population. The median household income in Bennett is $41,000, and the median home value is $150,000. The town has a low unemployment rate, and the majority of the population is employed in the agricultural sector.
Bennett is a small town with a rich history and a strong sense of community. The town is located in a beautiful part of North Carolina, and it is close to the larger cities of the Triangle region. Bennett is a great place to live, work, and raise a family.
Common Questions
What is Per Capita Income in Bennett?
Per Capita income in Bennett is $29,800.
What is the Median Family Income in Bennett?
Median Family Income in Bennett is $83,553.
What is the Median Household income in Bennett?
Median Household Income in Bennett is $63,750.
What is Income or Wage Gap in Bennett?
Income or Wage Gap in Bennett is 58.6%.
Women in Bennett earn 41.4 cents for every dollar earned by a man.
What is Inequality or Gini Index in Bennett?
Inequality or Gini Index in Bennett is 0.37.
What is the Total Population of Bennett?
Total Population of Bennett is 228.
What is the Total Male Population of Bennett?
Total Male Population of Bennett is 111.
What is the Total Female Population of Bennett?
Total Female Population of Bennett is 117.
What is the Ratio of Males per 100 Females in Bennett?
There are 94.87 Males per 100 Females in Bennett.
What is the Ratio of Females per 100 Males in Bennett?
There are 105.41 Females per 100 Males in Bennett.
What is the Median Population Age in Bennett?
Median Population Age in Bennett is 46.5 Years.
What is the Average Family Size in Bennett
Average Family Size in Bennett is 2.6 People.
What is the Average Household Size in Bennett
Average Household Size in Bennett is 2.1 People.
How Large is the Labor Force in Bennett?
There are 102 People in the Labor Forcein in Bennett.
What is the Percentage of People in the Labor Force in Bennett?
50.0% of People are in the Labor Force in Bennett.