Zip Codes with the Highest Percentage of Households with Income Below $10,000 in Sanford, NC
RELATED REPORTS & OPTIONS
Household Income | $0-10k
Sanford
Compare Zip Codes
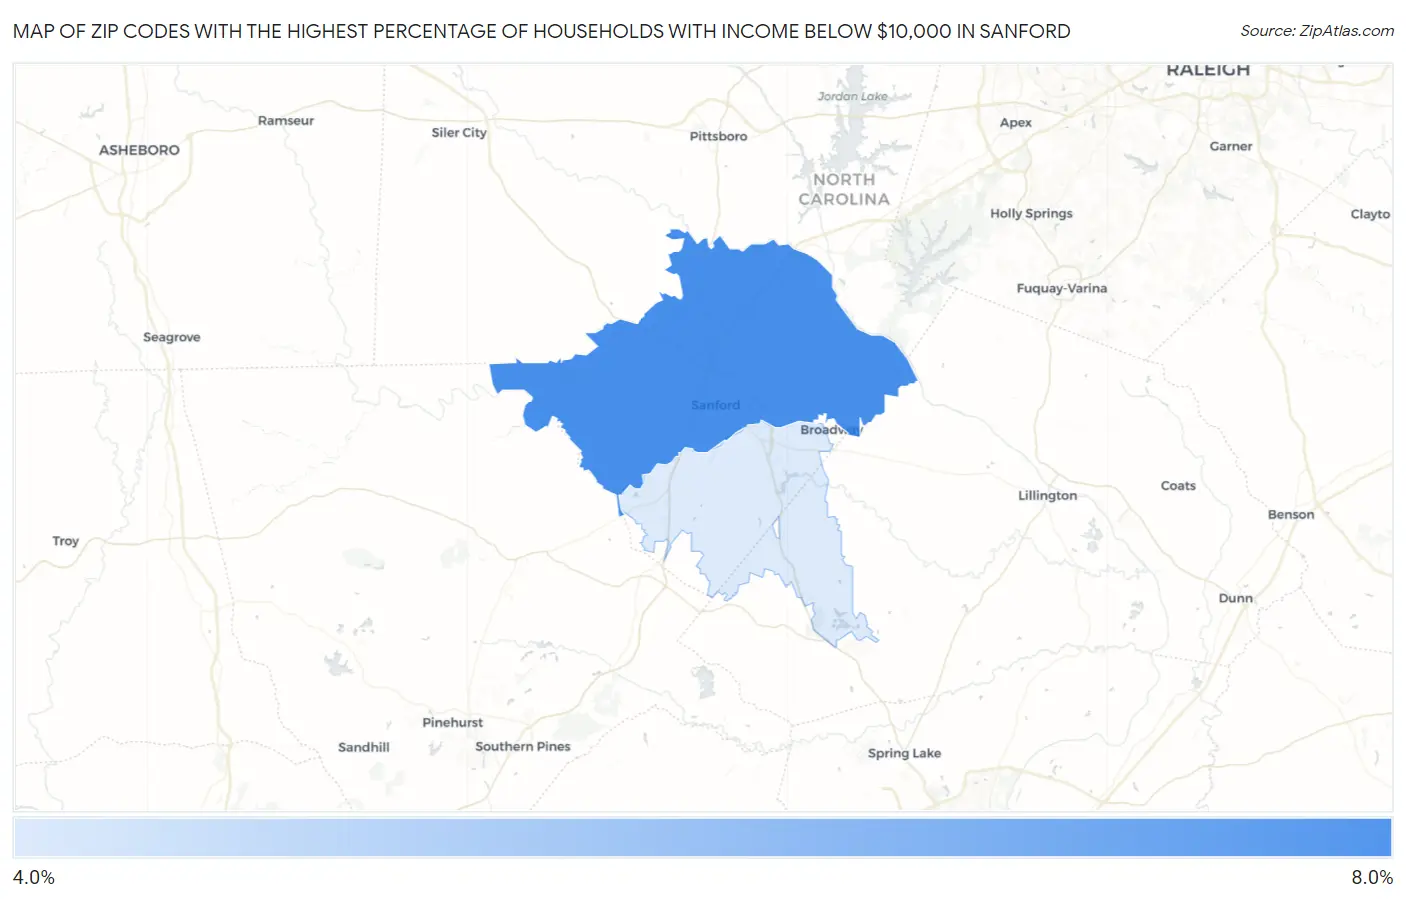
Map of Zip Codes with the Highest Percentage of Households with Income Below $10,000 in Sanford
4.3%
6.1%
Zip Codes with the Highest Percentage of Households with Income Below $10,000 in Sanford, NC
| Zip Code | Households with Income < $10k | vs State | vs National | |
| 1. | 27330 | 6.1% | 5.1%(+1.00)#266 | 4.9%(+1.20)#8,724 |
| 2. | 27332 | 4.3% | 5.1%(-0.800)#428 | 4.9%(-0.600)#14,072 |
1
Common Questions
What are the Top Zip Codes with the Highest Percentage of Households with Income Below $10,000 in Sanford, NC?
Top Zip Codes with the Highest Percentage of Households with Income Below $10,000 in Sanford, NC are:
What zip code has the Highest Percentage of Households with Income Below $10,000 in Sanford, NC?
27330 has the Highest Percentage of Households with Income Below $10,000 in Sanford, NC with 6.1%.
What is the Percentage of Households with Income Below $10,000 in Sanford, NC?
Percentage of Households with Income Below $10,000 in Sanford is 6.2%.
What is the Percentage of Households with Income Below $10,000 in North Carolina?
Percentage of Households with Income Below $10,000 in North Carolina is 5.1%.
What is the Percentage of Households with Income Below $10,000 in the United States?
Percentage of Households with Income Below $10,000 in the United States is 4.9%.