Cities with the Highest Percentage of Population Employed in Installation, Maintenance & Repair in North Carolina
RELATED REPORTS & OPTIONS
Installation, Maintenance & Repair
North Carolina
Compare Cities
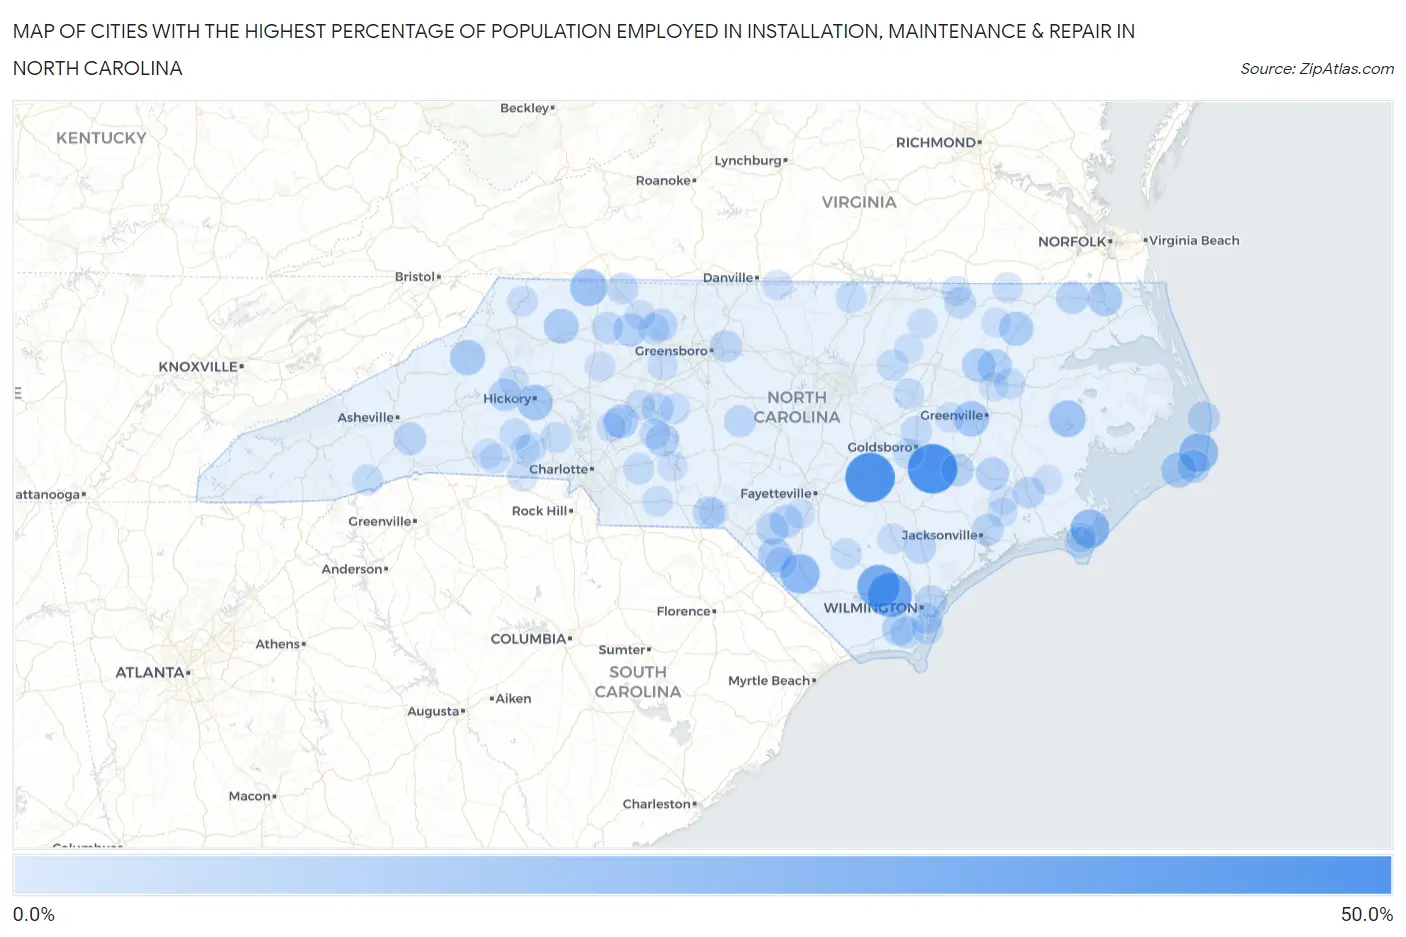
Map of Cities with the Highest Percentage of Population Employed in Installation, Maintenance & Repair in North Carolina
0.0%
50.0%
Cities with the Highest Percentage of Population Employed in Installation, Maintenance & Repair in North Carolina
| City | % Employed | vs State | vs National | |
| 1. | Seven Springs | 50.0% | 3.4%(+46.6)#1 | 3.1%(+46.9)#77 |
| 2. | Vann Crossroads | 49.5% | 3.4%(+46.1)#2 | 3.1%(+46.5)#80 |
| 3. | Delco | 37.1% | 3.4%(+33.7)#3 | 3.1%(+34.1)#179 |
| 4. | East Arcadia | 35.0% | 3.4%(+31.6)#4 | 3.1%(+32.0)#200 |
| 5. | Smithtown | 29.5% | 3.4%(+26.1)#5 | 3.1%(+26.5)#293 |
| 6. | Orrum | 27.3% | 3.4%(+23.9)#6 | 3.1%(+24.2)#352 |
| 7. | Avon | 26.2% | 3.4%(+22.8)#7 | 3.1%(+23.2)#375 |
| 8. | Davis | 25.7% | 3.4%(+22.3)#8 | 3.1%(+22.6)#387 |
| 9. | Lowgap | 22.6% | 3.4%(+19.2)#9 | 3.1%(+19.6)#516 |
| 10. | Pantego | 21.8% | 3.4%(+18.4)#10 | 3.1%(+18.7)#552 |
| 11. | Brookford | 19.3% | 3.4%(+15.9)#11 | 3.1%(+16.2)#713 |
| 12. | Bell Arthur | 19.1% | 3.4%(+15.7)#12 | 3.1%(+16.0)#729 |
| 13. | Crossnore | 18.5% | 3.4%(+15.1)#13 | 3.1%(+15.5)#770 |
| 14. | Hatteras | 18.3% | 3.4%(+14.9)#14 | 3.1%(+15.3)#781 |
| 15. | South Mills | 17.7% | 3.4%(+14.3)#15 | 3.1%(+14.7)#845 |
| 16. | Hays | 17.7% | 3.4%(+14.2)#16 | 3.1%(+14.6)#847 |
| 17. | Gold Hill | 17.1% | 3.4%(+13.7)#17 | 3.1%(+14.1)#890 |
| 18. | Aulander | 16.5% | 3.4%(+13.1)#18 | 3.1%(+13.5)#965 |
| 19. | China Grove | 16.3% | 3.4%(+12.9)#19 | 3.1%(+13.2)#986 |
| 20. | Elrod | 16.0% | 3.4%(+12.6)#20 | 3.1%(+13.0)#1,016 |
| 21. | Oak City | 15.6% | 3.4%(+12.2)#21 | 3.1%(+12.5)#1,060 |
| 22. | Bolivia | 15.2% | 3.4%(+11.7)#22 | 3.1%(+12.1)#1,128 |
| 23. | Speed | 14.8% | 3.4%(+11.4)#23 | 3.1%(+11.7)#1,189 |
| 24. | Shannon | 14.3% | 3.4%(+10.9)#24 | 3.1%(+11.2)#1,269 |
| 25. | East Bend | 14.2% | 3.4%(+10.8)#25 | 3.1%(+11.2)#1,288 |
| 26. | New London | 14.2% | 3.4%(+10.8)#26 | 3.1%(+11.2)#1,289 |
| 27. | Buxton | 14.2% | 3.4%(+10.8)#27 | 3.1%(+11.1)#1,293 |
| 28. | Cove City | 14.1% | 3.4%(+10.6)#28 | 3.1%(+11.0)#1,323 |
| 29. | Alexis | 14.0% | 3.4%(+10.6)#29 | 3.1%(+11.0)#1,328 |
| 30. | Sunbury | 14.0% | 3.4%(+10.6)#30 | 3.1%(+10.9)#1,340 |
| 31. | Jackson Heights | 13.6% | 3.4%(+10.2)#31 | 3.1%(+10.6)#1,411 |
| 32. | Hoopers Creek | 13.2% | 3.4%(+9.83)#32 | 3.1%(+10.2)#1,507 |
| 33. | Drexel | 13.1% | 3.4%(+9.72)#33 | 3.1%(+10.1)#1,530 |
| 34. | Wakulla | 13.1% | 3.4%(+9.71)#34 | 3.1%(+10.0)#1,538 |
| 35. | Watha | 12.5% | 3.4%(+9.09)#35 | 3.1%(+9.43)#1,693 |
| 36. | Rodanthe | 12.5% | 3.4%(+9.09)#36 | 3.1%(+9.43)#1,696 |
| 37. | Germanton | 12.3% | 3.4%(+8.89)#37 | 3.1%(+9.23)#1,745 |
| 38. | Barnardsville | 12.2% | 3.4%(+8.76)#38 | 3.1%(+9.11)#1,784 |
| 39. | Dudley | 12.1% | 3.4%(+8.67)#39 | 3.1%(+9.01)#1,801 |
| 40. | Southmont | 12.1% | 3.4%(+8.64)#40 | 3.1%(+8.99)#1,810 |
| 41. | Kings Grant | 12.0% | 3.4%(+8.61)#41 | 3.1%(+8.95)#1,824 |
| 42. | Mcleansville | 11.9% | 3.4%(+8.50)#42 | 3.1%(+8.84)#1,852 |
| 43. | Cordova | 11.9% | 3.4%(+8.47)#43 | 3.1%(+8.81)#1,866 |
| 44. | Pumpkin Center | 11.8% | 3.4%(+8.40)#44 | 3.1%(+8.74)#1,884 |
| 45. | Bennett | 11.8% | 3.4%(+8.36)#45 | 3.1%(+8.70)#1,893 |
| 46. | Deep Run | 11.7% | 3.4%(+8.32)#46 | 3.1%(+8.66)#1,913 |
| 47. | Nebo | 11.7% | 3.4%(+8.32)#47 | 3.1%(+8.66)#1,914 |
| 48. | James City | 11.6% | 3.4%(+8.22)#48 | 3.1%(+8.56)#1,937 |
| 49. | Boiling Spring Lakes | 11.2% | 3.4%(+7.80)#49 | 3.1%(+8.15)#2,073 |
| 50. | South Weldon | 11.2% | 3.4%(+7.78)#50 | 3.1%(+8.12)#2,079 |
| 51. | Mcdonald | 11.1% | 3.4%(+7.70)#51 | 3.1%(+8.04)#2,116 |
| 52. | Flat Rock | 11.0% | 3.4%(+7.58)#52 | 3.1%(+7.93)#2,144 |
| 53. | Boonville | 10.9% | 3.4%(+7.49)#53 | 3.1%(+7.83)#2,174 |
| 54. | Misenheimer | 10.7% | 3.4%(+7.31)#54 | 3.1%(+7.65)#2,243 |
| 55. | Stanfield | 10.6% | 3.4%(+7.20)#55 | 3.1%(+7.54)#2,287 |
| 56. | Sea Breeze | 10.5% | 3.4%(+7.09)#56 | 3.1%(+7.43)#2,332 |
| 57. | Pikeville | 10.5% | 3.4%(+7.06)#57 | 3.1%(+7.41)#2,345 |
| 58. | Silver Lake | 10.4% | 3.4%(+7.00)#58 | 3.1%(+7.34)#2,363 |
| 59. | Rural Hall | 10.4% | 3.4%(+6.99)#59 | 3.1%(+7.34)#2,367 |
| 60. | Harkers Island | 10.4% | 3.4%(+6.96)#60 | 3.1%(+7.30)#2,384 |
| 61. | Lake Royale | 10.4% | 3.4%(+6.94)#61 | 3.1%(+7.29)#2,391 |
| 62. | Iron Station | 10.0% | 3.4%(+6.59)#62 | 3.1%(+6.93)#2,544 |
| 63. | Everetts | 10.0% | 3.4%(+6.59)#63 | 3.1%(+6.93)#2,554 |
| 64. | Elizabethtown | 10.0% | 3.4%(+6.58)#64 | 3.1%(+6.92)#2,573 |
| 65. | Mar Mac | 9.9% | 3.4%(+6.53)#65 | 3.1%(+6.87)#2,591 |
| 66. | Sims | 9.9% | 3.4%(+6.48)#66 | 3.1%(+6.82)#2,616 |
| 67. | Stovall | 9.6% | 3.4%(+6.24)#67 | 3.1%(+6.58)#2,770 |
| 68. | Belwood | 9.5% | 3.4%(+6.06)#68 | 3.1%(+6.40)#2,857 |
| 69. | Rosman | 9.4% | 3.4%(+5.95)#69 | 3.1%(+6.30)#2,918 |
| 70. | Jefferson | 8.9% | 3.4%(+5.53)#70 | 3.1%(+5.87)#3,166 |
| 71. | Peachland | 8.9% | 3.4%(+5.51)#71 | 3.1%(+5.85)#3,177 |
| 72. | Grover | 8.8% | 3.4%(+5.40)#72 | 3.1%(+5.74)#3,249 |
| 73. | Harrells | 8.8% | 3.4%(+5.38)#73 | 3.1%(+5.72)#3,262 |
| 74. | Cherryville | 8.8% | 3.4%(+5.35)#74 | 3.1%(+5.69)#3,293 |
| 75. | Midway | 8.7% | 3.4%(+5.31)#75 | 3.1%(+5.65)#3,326 |
| 76. | Severn | 8.7% | 3.4%(+5.29)#76 | 3.1%(+5.63)#3,353 |
| 77. | Denton | 8.5% | 3.4%(+5.09)#77 | 3.1%(+5.44)#3,504 |
| 78. | Walstonburg | 8.5% | 3.4%(+5.07)#78 | 3.1%(+5.41)#3,527 |
| 79. | Landis | 8.3% | 3.4%(+4.93)#79 | 3.1%(+5.27)#3,621 |
| 80. | Norwood | 8.3% | 3.4%(+4.85)#80 | 3.1%(+5.19)#3,712 |
| 81. | East Spencer | 8.2% | 3.4%(+4.82)#81 | 3.1%(+5.16)#3,736 |
| 82. | Cajah S Mountain | 8.2% | 3.4%(+4.81)#82 | 3.1%(+5.15)#3,750 |
| 83. | Milton | 8.2% | 3.4%(+4.79)#83 | 3.1%(+5.13)#3,772 |
| 84. | Harmony | 8.2% | 3.4%(+4.77)#84 | 3.1%(+5.11)#3,784 |
| 85. | Mooresboro | 8.1% | 3.4%(+4.73)#85 | 3.1%(+5.07)#3,815 |
| 86. | Gaston | 8.1% | 3.4%(+4.72)#86 | 3.1%(+5.06)#3,828 |
| 87. | Hollister | 8.1% | 3.4%(+4.66)#87 | 3.1%(+5.00)#3,877 |
| 88. | Gloucester | 8.0% | 3.4%(+4.61)#88 | 3.1%(+4.95)#3,923 |
| 89. | Pollocksville | 7.9% | 3.4%(+4.46)#89 | 3.1%(+4.80)#4,048 |
| 90. | Castalia | 7.9% | 3.4%(+4.46)#90 | 3.1%(+4.80)#4,050 |
| 91. | Waco | 7.8% | 3.4%(+4.43)#91 | 3.1%(+4.78)#4,069 |
| 92. | Ellenboro | 7.8% | 3.4%(+4.43)#92 | 3.1%(+4.77)#4,075 |
| 93. | Pinnacle | 7.8% | 3.4%(+4.42)#93 | 3.1%(+4.76)#4,082 |
| 94. | Parmele | 7.8% | 3.4%(+4.42)#94 | 3.1%(+4.76)#4,083 |
| 95. | East Rockingham | 7.8% | 3.4%(+4.37)#95 | 3.1%(+4.71)#4,117 |
| 96. | Maysville | 7.7% | 3.4%(+4.28)#96 | 3.1%(+4.62)#4,192 |
| 97. | Grantsboro | 7.7% | 3.4%(+4.28)#97 | 3.1%(+4.62)#4,198 |
| 98. | Enochville | 7.7% | 3.4%(+4.26)#98 | 3.1%(+4.60)#4,238 |
| 99. | Rich Square | 7.6% | 3.4%(+4.22)#99 | 3.1%(+4.57)#4,281 |
| 100. | Parkton | 7.6% | 3.4%(+4.17)#100 | 3.1%(+4.51)#4,342 |
Common Questions
What are the Top 10 Cities with the Highest Percentage of Population Employed in Installation, Maintenance & Repair in North Carolina?
Top 10 Cities with the Highest Percentage of Population Employed in Installation, Maintenance & Repair in North Carolina are:
#1
50.0%
#2
49.5%
#3
37.1%
#4
35.0%
#5
27.3%
#6
26.2%
#7
25.7%
#8
22.6%
#9
21.8%
#10
19.3%
What city has the Highest Percentage of Population Employed in Installation, Maintenance & Repair in North Carolina?
Seven Springs has the Highest Percentage of Population Employed in Installation, Maintenance & Repair in North Carolina with 50.0%.
What is the Percentage of Population Employed in Installation, Maintenance & Repair in the State of North Carolina?
Percentage of Population Employed in Installation, Maintenance & Repair in North Carolina is 3.4%.
What is the Percentage of Population Employed in Installation, Maintenance & Repair in the United States?
Percentage of Population Employed in Installation, Maintenance & Repair in the United States is 3.1%.