Cities with the Most Immigrants from Dominican Republic in North Carolina
RELATED REPORTS & OPTIONS
Dominican Republic
North Carolina
Compare Cities
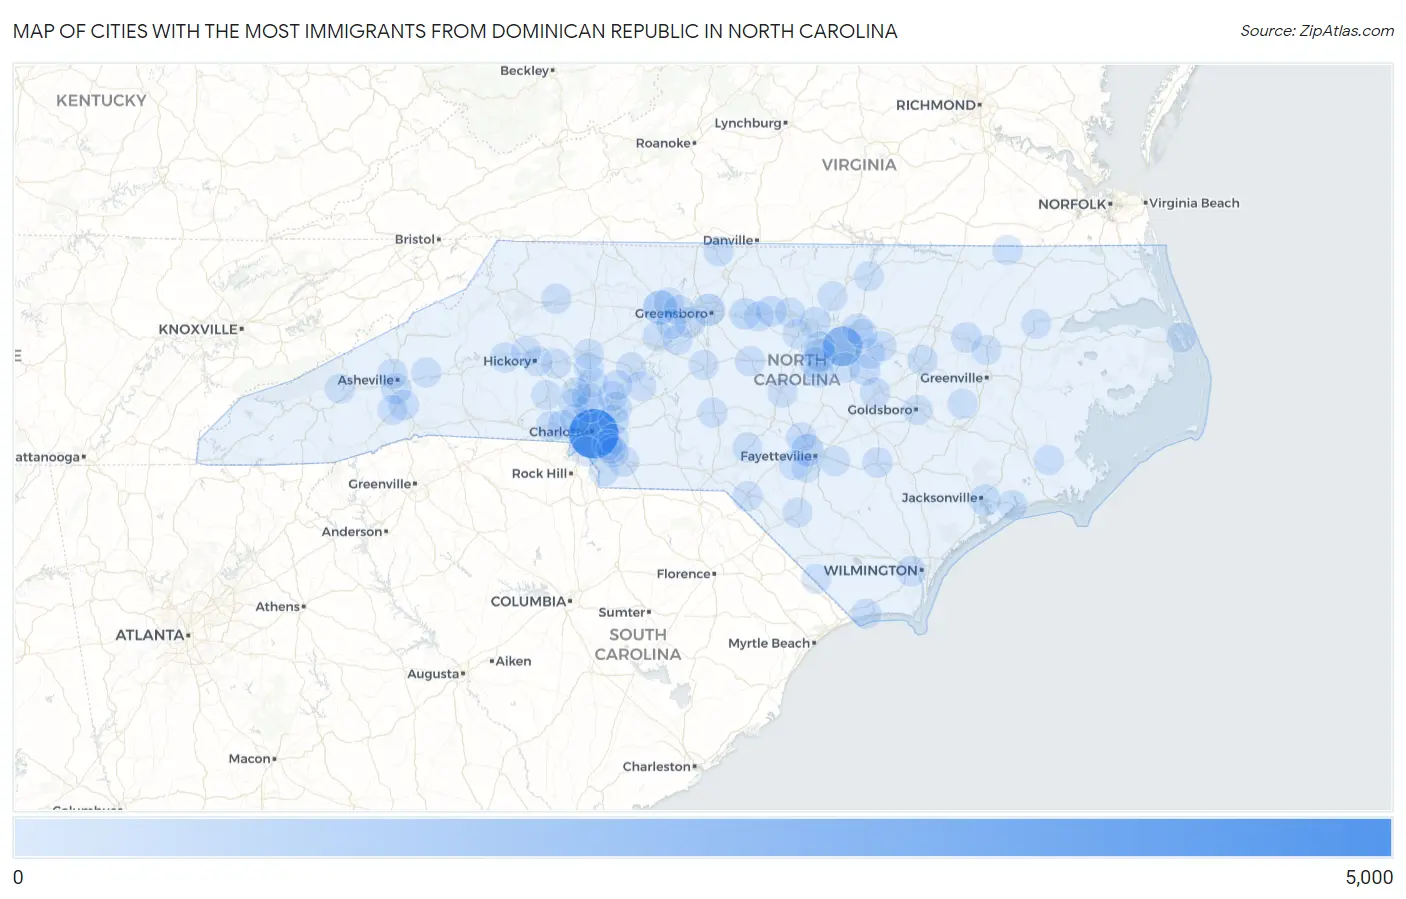
Map of Cities with the Most Immigrants from Dominican Republic in North Carolina
0
5,000
Cities with the Most Immigrants from Dominican Republic in North Carolina
| City | Dominican Republic | vs State | vs National | |
| 1. | Charlotte | 4,160 | 15,135(27.49%)#1 | 1,223,316(0.34%)#26 |
| 2. | Raleigh | 1,964 | 15,135(12.98%)#2 | 1,223,316(0.16%)#56 |
| 3. | Winston Salem | 807 | 15,135(5.33%)#3 | 1,223,316(0.07%)#130 |
| 4. | Cary | 544 | 15,135(3.59%)#4 | 1,223,316(0.04%)#203 |
| 5. | Greensboro | 452 | 15,135(2.99%)#5 | 1,223,316(0.04%)#236 |
| 6. | Fayetteville | 405 | 15,135(2.68%)#6 | 1,223,316(0.03%)#252 |
| 7. | Burlington | 304 | 15,135(2.01%)#7 | 1,223,316(0.02%)#325 |
| 8. | Jacksonville | 238 | 15,135(1.57%)#8 | 1,223,316(0.02%)#397 |
| 9. | Durham | 205 | 15,135(1.35%)#9 | 1,223,316(0.02%)#442 |
| 10. | Concord | 194 | 15,135(1.28%)#10 | 1,223,316(0.02%)#464 |
| 11. | Mebane | 170 | 15,135(1.12%)#11 | 1,223,316(0.01%)#524 |
| 12. | Asheville | 160 | 15,135(1.06%)#12 | 1,223,316(0.01%)#543 |
| 13. | High Point | 148 | 15,135(0.98%)#13 | 1,223,316(0.01%)#573 |
| 14. | Clayton | 131 | 15,135(0.87%)#14 | 1,223,316(0.01%)#628 |
| 15. | Apex | 119 | 15,135(0.79%)#15 | 1,223,316(0.01%)#664 |
| 16. | Gastonia | 118 | 15,135(0.78%)#16 | 1,223,316(0.01%)#668 |
| 17. | Harrisburg | 115 | 15,135(0.76%)#17 | 1,223,316(0.01%)#679 |
| 18. | Tarboro | 103 | 15,135(0.68%)#18 | 1,223,316(0.01%)#722 |
| 19. | Huntersville | 102 | 15,135(0.67%)#19 | 1,223,316(0.01%)#726 |
| 20. | Wake Forest | 94 | 15,135(0.62%)#20 | 1,223,316(0.01%)#771 |
| 21. | Anderson Creek | 90 | 15,135(0.59%)#21 | 1,223,316(0.01%)#798 |
| 22. | Monroe | 86 | 15,135(0.57%)#22 | 1,223,316(0.01%)#826 |
| 23. | Wendell | 78 | 15,135(0.52%)#23 | 1,223,316(0.01%)#883 |
| 24. | Clinton | 76 | 15,135(0.50%)#24 | 1,223,316(0.01%)#906 |
| 25. | Fletcher | 75 | 15,135(0.50%)#25 | 1,223,316(0.01%)#918 |
| 26. | Leland | 72 | 15,135(0.48%)#26 | 1,223,316(0.01%)#942 |
| 27. | Wilson | 70 | 15,135(0.46%)#27 | 1,223,316(0.01%)#957 |
| 28. | Mint Hill | 70 | 15,135(0.46%)#28 | 1,223,316(0.01%)#960 |
| 29. | Zebulon | 68 | 15,135(0.45%)#29 | 1,223,316(0.01%)#982 |
| 30. | Smithfield | 60 | 15,135(0.40%)#30 | 1,223,316(0.00%)#1,050 |
| 31. | Waxhaw | 47 | 15,135(0.31%)#31 | 1,223,316(0.00%)#1,184 |
| 32. | Cornelius | 44 | 15,135(0.29%)#32 | 1,223,316(0.00%)#1,226 |
| 33. | Pineville | 41 | 15,135(0.27%)#33 | 1,223,316(0.00%)#1,273 |
| 34. | Woodfin | 40 | 15,135(0.26%)#34 | 1,223,316(0.00%)#1,288 |
| 35. | Siler City | 39 | 15,135(0.26%)#35 | 1,223,316(0.00%)#1,311 |
| 36. | Eden | 35 | 15,135(0.23%)#36 | 1,223,316(0.00%)#1,387 |
| 37. | Spring Lake | 35 | 15,135(0.23%)#37 | 1,223,316(0.00%)#1,389 |
| 38. | Garner | 34 | 15,135(0.22%)#38 | 1,223,316(0.00%)#1,401 |
| 39. | Walkertown | 32 | 15,135(0.21%)#39 | 1,223,316(0.00%)#1,466 |
| 40. | Rockfish | 30 | 15,135(0.20%)#40 | 1,223,316(0.00%)#1,500 |
| 41. | Lowesville | 30 | 15,135(0.20%)#41 | 1,223,316(0.00%)#1,501 |
| 42. | Indian Trail | 29 | 15,135(0.19%)#42 | 1,223,316(0.00%)#1,510 |
| 43. | Mooresville | 27 | 15,135(0.18%)#43 | 1,223,316(0.00%)#1,567 |
| 44. | Kannapolis | 25 | 15,135(0.17%)#44 | 1,223,316(0.00%)#1,626 |
| 45. | Salisbury | 25 | 15,135(0.17%)#45 | 1,223,316(0.00%)#1,631 |
| 46. | Matthews | 25 | 15,135(0.17%)#46 | 1,223,316(0.00%)#1,634 |
| 47. | Welcome | 25 | 15,135(0.17%)#47 | 1,223,316(0.00%)#1,653 |
| 48. | Asheboro | 24 | 15,135(0.16%)#48 | 1,223,316(0.00%)#1,662 |
| 49. | Thomasville | 23 | 15,135(0.15%)#49 | 1,223,316(0.00%)#1,685 |
| 50. | Kernersville | 21 | 15,135(0.14%)#50 | 1,223,316(0.00%)#1,752 |
| 51. | Hope Mills | 21 | 15,135(0.14%)#51 | 1,223,316(0.00%)#1,757 |
| 52. | Graham | 20 | 15,135(0.13%)#52 | 1,223,316(0.00%)#1,791 |
| 53. | North Wilkesboro | 19 | 15,135(0.13%)#53 | 1,223,316(0.00%)#1,838 |
| 54. | Troutman | 19 | 15,135(0.13%)#54 | 1,223,316(0.00%)#1,841 |
| 55. | Lincolnton | 18 | 15,135(0.12%)#55 | 1,223,316(0.00%)#1,864 |
| 56. | Statesville | 17 | 15,135(0.11%)#56 | 1,223,316(0.00%)#1,893 |
| 57. | Hillsborough | 17 | 15,135(0.11%)#57 | 1,223,316(0.00%)#1,908 |
| 58. | Rockwell | 17 | 15,135(0.11%)#58 | 1,223,316(0.00%)#1,920 |
| 59. | Swansboro | 16 | 15,135(0.11%)#59 | 1,223,316(0.00%)#1,967 |
| 60. | Rolesville | 14 | 15,135(0.09%)#60 | 1,223,316(0.00%)#2,043 |
| 61. | Mills River | 14 | 15,135(0.09%)#61 | 1,223,316(0.00%)#2,048 |
| 62. | Claremont | 13 | 15,135(0.09%)#62 | 1,223,316(0.00%)#2,100 |
| 63. | Sanford | 12 | 15,135(0.08%)#63 | 1,223,316(0.00%)#2,119 |
| 64. | Drexel | 12 | 15,135(0.08%)#64 | 1,223,316(0.00%)#2,150 |
| 65. | Hickory | 11 | 15,135(0.07%)#65 | 1,223,316(0.00%)#2,160 |
| 66. | Granite Falls | 11 | 15,135(0.07%)#66 | 1,223,316(0.00%)#2,187 |
| 67. | Ocean Isle Beach | 11 | 15,135(0.07%)#67 | 1,223,316(0.00%)#2,201 |
| 68. | Goldsboro | 10 | 15,135(0.07%)#68 | 1,223,316(0.00%)#2,217 |
| 69. | Tabor City | 10 | 15,135(0.07%)#69 | 1,223,316(0.00%)#2,240 |
| 70. | Lowell | 10 | 15,135(0.07%)#70 | 1,223,316(0.00%)#2,241 |
| 71. | Windsor | 10 | 15,135(0.07%)#71 | 1,223,316(0.00%)#2,242 |
| 72. | Holly Springs | 9 | 15,135(0.06%)#72 | 1,223,316(0.00%)#2,266 |
| 73. | Chapel Hill | 8 | 15,135(0.05%)#73 | 1,223,316(0.00%)#2,327 |
| 74. | Mount Holly | 8 | 15,135(0.05%)#74 | 1,223,316(0.00%)#2,334 |
| 75. | Biscoe | 8 | 15,135(0.05%)#75 | 1,223,316(0.00%)#2,356 |
| 76. | Laurinburg | 7 | 15,135(0.05%)#76 | 1,223,316(0.00%)#2,388 |
| 77. | Westport | 7 | 15,135(0.05%)#77 | 1,223,316(0.00%)#2,414 |
| 78. | Pinebluff | 7 | 15,135(0.05%)#78 | 1,223,316(0.00%)#2,431 |
| 79. | Wallburg | 6 | 15,135(0.04%)#79 | 1,223,316(0.00%)#2,474 |
| 80. | Morrisville | 5 | 15,135(0.03%)#80 | 1,223,316(0.00%)#2,505 |
| 81. | Lumberton | 5 | 15,135(0.03%)#81 | 1,223,316(0.00%)#2,510 |
| 82. | Stallings | 5 | 15,135(0.03%)#82 | 1,223,316(0.00%)#2,514 |
| 83. | Stedman | 5 | 15,135(0.03%)#83 | 1,223,316(0.00%)#2,544 |
| 84. | Henderson | 4 | 15,135(0.03%)#84 | 1,223,316(0.00%)#2,578 |
| 85. | Bethel | 4 | 15,135(0.03%)#85 | 1,223,316(0.00%)#2,599 |
| 86. | Manteo | 3 | 15,135(0.02%)#86 | 1,223,316(0.00%)#2,639 |
| 87. | Montreat | 3 | 15,135(0.02%)#87 | 1,223,316(0.00%)#2,657 |
| 88. | Arapahoe | 3 | 15,135(0.02%)#88 | 1,223,316(0.00%)#2,658 |
| 89. | Maggie Valley | 2 | 15,135(0.01%)#89 | 1,223,316(0.00%)#2,685 |
| 90. | Stem | 2 | 15,135(0.01%)#90 | 1,223,316(0.00%)#2,696 |
| 91. | Landis | 1 | 15,135(0.01%)#91 | 1,223,316(0.00%)#2,735 |
| 92. | Hookerton | 1 | 15,135(0.01%)#92 | 1,223,316(0.00%)#2,756 |
| 93. | Severn | 1 | 15,135(0.01%)#93 | 1,223,316(0.00%)#2,760 |
Common Questions
What are the Top 10 Cities with the Most Immigrants from Dominican Republic in North Carolina?
Top 10 Cities with the Most Immigrants from Dominican Republic in North Carolina are:
#1
4,160
#2
1,964
#3
807
#4
544
#5
452
#6
405
#7
304
#8
238
#9
205
#10
194
What city has the Most Immigrants from Dominican Republic in North Carolina?
Charlotte has the Most Immigrants from Dominican Republic in North Carolina with 4,160.
What is the Total Immigrants from Dominican Republic in the State of North Carolina?
Total Immigrants from Dominican Republic in North Carolina is 15,135.
What is the Total Immigrants from Dominican Republic in the United States?
Total Immigrants from Dominican Republic in the United States is 1,223,316.