Jonesville, NC Map & Demographics
Jonesville Map
Jonesville Overview
$20,012
PER CAPITA INCOME
$46,842
AVG FAMILY INCOME
$26,044
AVG HOUSEHOLD INCOME
14.2%
WAGE / INCOME GAP [ % ]
85.8¢/ $1
WAGE / INCOME GAP [ $ ]
0.45
INEQUALITY / GINI INDEX
2,634
TOTAL POPULATION
1,127
MALE POPULATION
1,507
FEMALE POPULATION
74.78
MALES / 100 FEMALES
133.72
FEMALES / 100 MALES
42.7
MEDIAN AGE
3.1
AVG FAMILY SIZE
2.1
AVG HOUSEHOLD SIZE
1,039
LABOR FORCE [ PEOPLE ]
46.1%
PERCENT IN LABOR FORCE
2.1%
UNEMPLOYMENT RATE
Jonesville Zip Codes
Jonesville Area Codes
Income in Jonesville
Income Overview in Jonesville
Per Capita Income in Jonesville is $20,012, while median incomes of families and households are $46,842 and $26,044 respectively.
| Characteristic | Number | Measure |
| Per Capita Income | 2,634 | $20,012 |
| Median Family Income | 618 | $46,842 |
| Mean Family Income | 618 | $55,448 |
| Median Household Income | 1,250 | $26,044 |
| Mean Household Income | 1,250 | $38,888 |
| Income Deficit | 618 | $0 |
| Wage / Income Gap (%) | 2,634 | 14.23% |
| Wage / Income Gap ($) | 2,634 | 85.77¢ per $1 |
| Gini / Inequality Index | 2,634 | 0.45 |
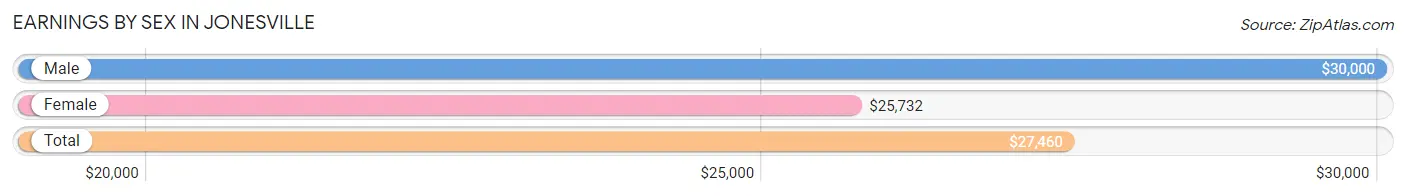
Earnings by Sex in Jonesville
Average Earnings in Jonesville are $27,460, $30,000 for men and $25,732 for women, a difference of 14.2%.
| Sex | Number | Average Earnings |
| Male | 514 (48.3%) | $30,000 |
| Female | 550 (51.7%) | $25,732 |
| Total | 1,064 (100.0%) | $27,460 |
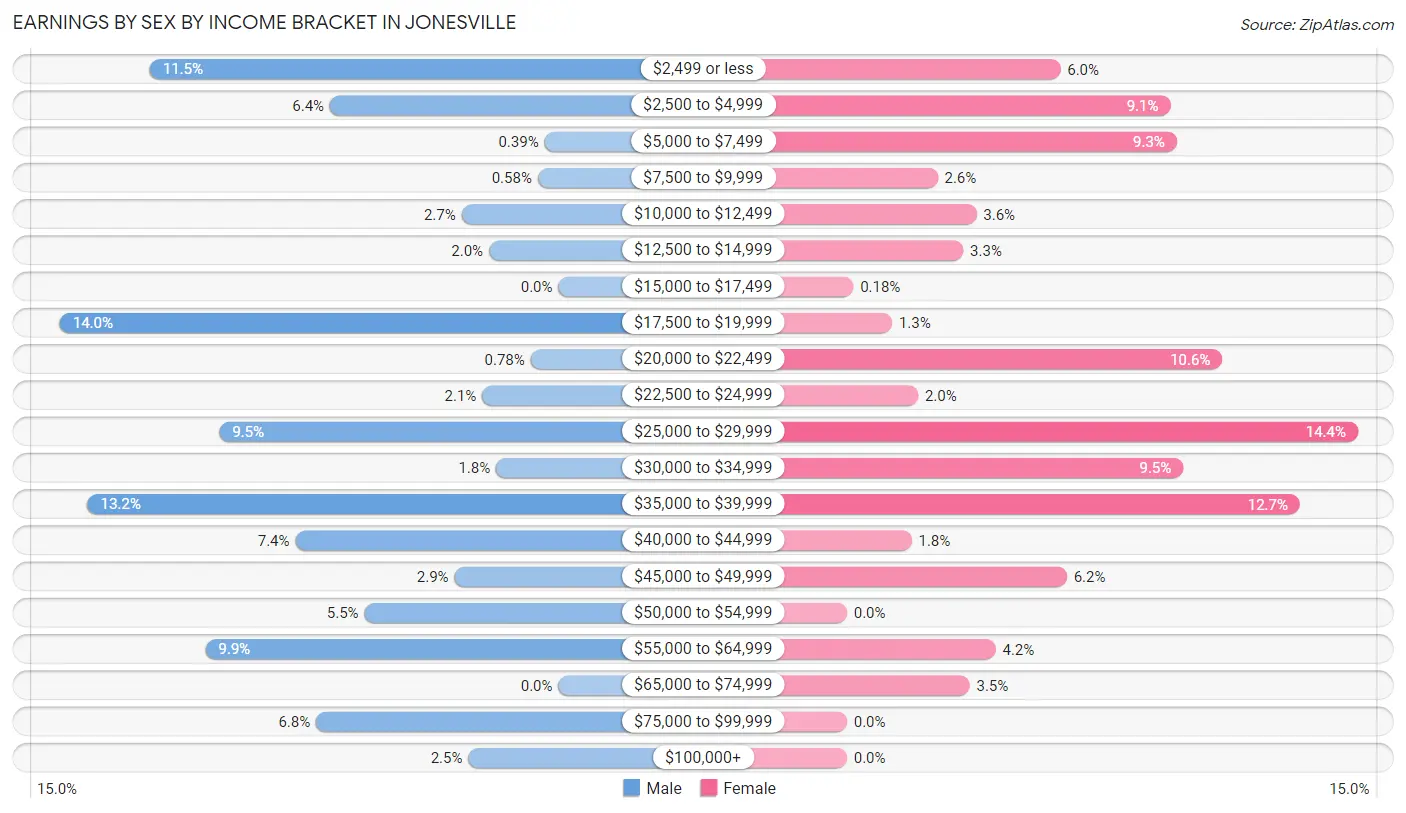
Earnings by Sex by Income Bracket in Jonesville
The most common earnings brackets in Jonesville are $17,500 to $19,999 for men (72 | 14.0%) and $25,000 to $29,999 for women (79 | 14.4%).
| Income | Male | Female |
| $2,499 or less | 59 (11.5%) | 33 (6.0%) |
| $2,500 to $4,999 | 33 (6.4%) | 50 (9.1%) |
| $5,000 to $7,499 | 2 (0.4%) | 51 (9.3%) |
| $7,500 to $9,999 | 3 (0.6%) | 14 (2.5%) |
| $10,000 to $12,499 | 14 (2.7%) | 20 (3.6%) |
| $12,500 to $14,999 | 10 (1.9%) | 18 (3.3%) |
| $15,000 to $17,499 | 0 (0.0%) | 1 (0.2%) |
| $17,500 to $19,999 | 72 (14.0%) | 7 (1.3%) |
| $20,000 to $22,499 | 4 (0.8%) | 58 (10.5%) |
| $22,500 to $24,999 | 11 (2.1%) | 11 (2.0%) |
| $25,000 to $29,999 | 49 (9.5%) | 79 (14.4%) |
| $30,000 to $34,999 | 9 (1.8%) | 52 (9.5%) |
| $35,000 to $39,999 | 68 (13.2%) | 70 (12.7%) |
| $40,000 to $44,999 | 38 (7.4%) | 10 (1.8%) |
| $45,000 to $49,999 | 15 (2.9%) | 34 (6.2%) |
| $50,000 to $54,999 | 28 (5.4%) | 0 (0.0%) |
| $55,000 to $64,999 | 51 (9.9%) | 23 (4.2%) |
| $65,000 to $74,999 | 0 (0.0%) | 19 (3.5%) |
| $75,000 to $99,999 | 35 (6.8%) | 0 (0.0%) |
| $100,000+ | 13 (2.5%) | 0 (0.0%) |
| Total | 514 (100.0%) | 550 (100.0%) |
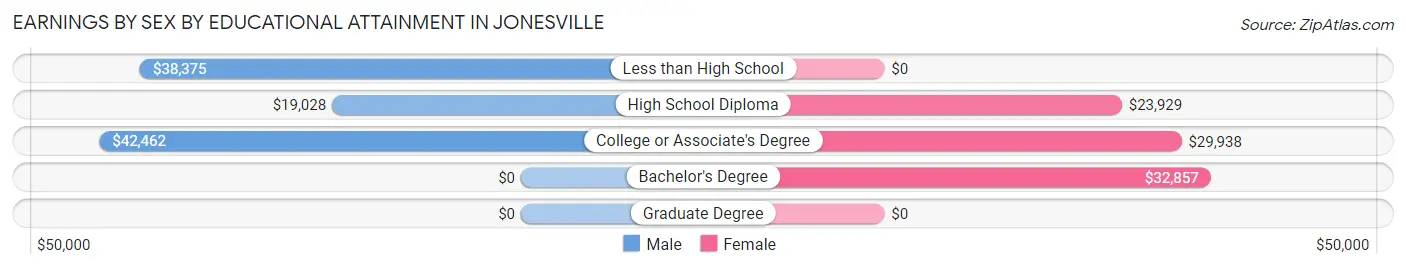
Earnings by Sex by Educational Attainment in Jonesville
Average earnings in Jonesville are $38,214 for men and $28,487 for women, a difference of 25.5%. Men with an educational attainment of college or associate's degree enjoy the highest average annual earnings of $42,462, while those with high school diploma education earn the least with $19,028. Women with an educational attainment of bachelor's degree earn the most with the average annual earnings of $32,857, while those with high school diploma education have the smallest earnings of $23,929.
| Educational Attainment | Male Income | Female Income |
| Less than High School | $38,375 | $0 |
| High School Diploma | $19,028 | $23,929 |
| College or Associate's Degree | $42,462 | $29,938 |
| Bachelor's Degree | - | - |
| Graduate Degree | - | - |
| Total | $38,214 | $28,487 |
Family Income in Jonesville
Family Income Brackets in Jonesville
According to the Jonesville family income data, there are 122 families falling into the $50,000 to $74,999 income range, which is the most common income bracket and makes up 19.7% of all families. Conversely, the $200,000+ income bracket is the least frequent group with only 4 families (0.6%) belonging to this category.
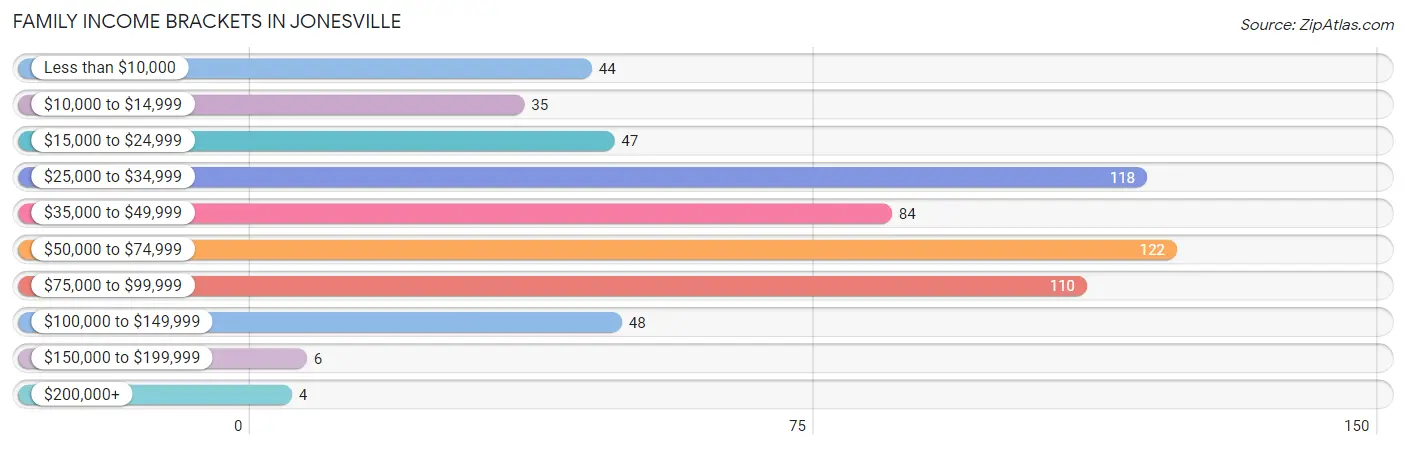
| Income Bracket | # Families | % Families |
| Less than $10,000 | 44 | 7.1% |
| $10,000 to $14,999 | 35 | 5.7% |
| $15,000 to $24,999 | 47 | 7.6% |
| $25,000 to $34,999 | 118 | 19.1% |
| $35,000 to $49,999 | 84 | 13.6% |
| $50,000 to $74,999 | 122 | 19.7% |
| $75,000 to $99,999 | 110 | 17.8% |
| $100,000 to $149,999 | 48 | 7.8% |
| $150,000 to $199,999 | 6 | 1.0% |
| $200,000+ | 4 | 0.6% |
Family Income by Famaliy Size in Jonesville
4-person families (82 | 13.3%) account for the highest median family income in Jonesville with $92,955 per family, while 4-person families (82 | 13.3%) have the highest median income of $23,239 per family member.
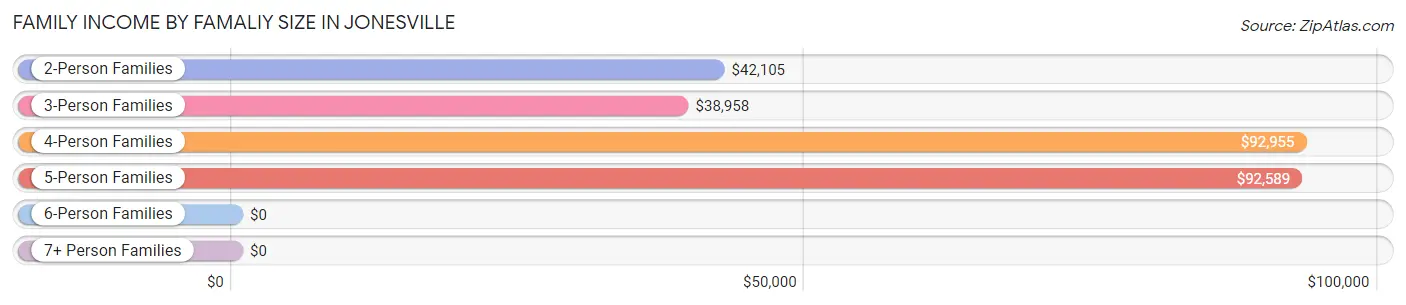
| Income Bracket | # Families | Median Income |
| 2-Person Families | 340 (55.0%) | $42,105 |
| 3-Person Families | 142 (23.0%) | $38,958 |
| 4-Person Families | 82 (13.3%) | $92,955 |
| 5-Person Families | 54 (8.7%) | $92,589 |
| 6-Person Families | 0 (0.0%) | $0 |
| 7+ Person Families | 0 (0.0%) | $0 |
| Total | 618 (100.0%) | $46,842 |
Family Income by Number of Earners in Jonesville
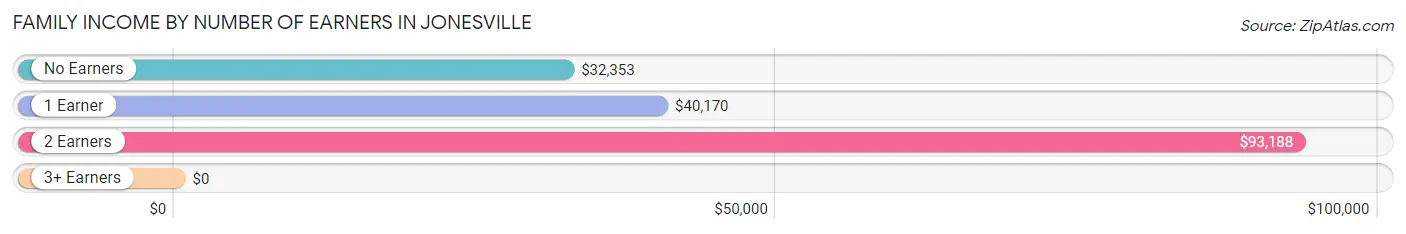
| Number of Earners | # Families | Median Income |
| No Earners | 162 (26.2%) | $32,353 |
| 1 Earner | 291 (47.1%) | $40,170 |
| 2 Earners | 138 (22.3%) | $93,188 |
| 3+ Earners | 27 (4.4%) | $0 |
| Total | 618 (100.0%) | $46,842 |
Household Income in Jonesville
Household Income Brackets in Jonesville
With 312 households falling in the category, the $15,000 to $24,999 income range is the most frequent in Jonesville, accounting for 25.0% of all households. In contrast, only 4 households (0.3%) fall into the $200,000+ income bracket, making it the least populous group.
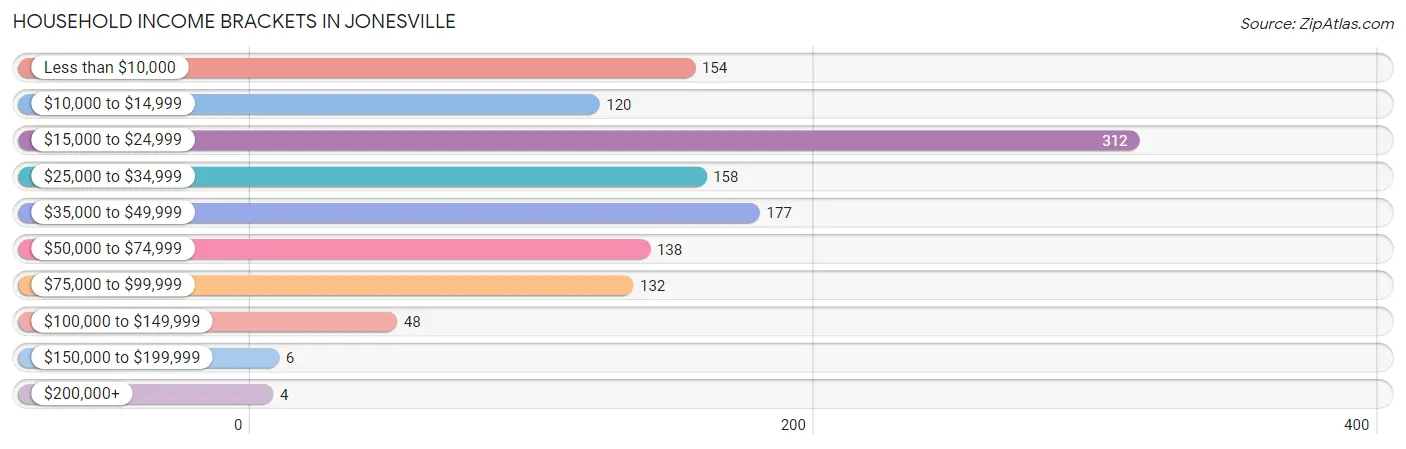
| Income Bracket | # Households | % Households |
| Less than $10,000 | 154 | 12.3% |
| $10,000 to $14,999 | 120 | 9.6% |
| $15,000 to $24,999 | 312 | 25.0% |
| $25,000 to $34,999 | 158 | 12.6% |
| $35,000 to $49,999 | 177 | 14.2% |
| $50,000 to $74,999 | 138 | 11.0% |
| $75,000 to $99,999 | 132 | 10.6% |
| $100,000 to $149,999 | 48 | 3.8% |
| $150,000 to $199,999 | 6 | 0.5% |
| $200,000+ | 4 | 0.3% |
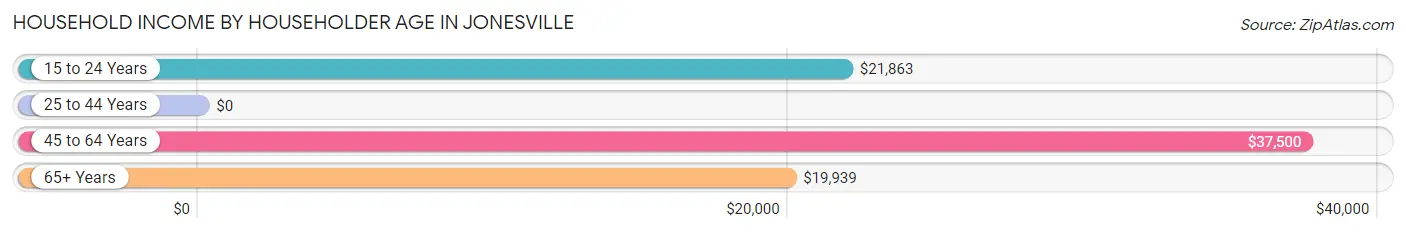
Household Income by Householder Age in Jonesville
The median household income in Jonesville is $26,044, with the highest median household income of $37,500 found in the 45 to 64 years age bracket for the primary householder. A total of 348 households (27.8%) fall into this category. Meanwhile, the 25 to 44 years age bracket for the primary householder has the lowest median household income of $0, with 242 households (19.4%) in this group.
| Income Bracket | # Households | Median Income |
| 15 to 24 Years | 83 (6.6%) | $21,863 |
| 25 to 44 Years | 242 (19.4%) | $0 |
| 45 to 64 Years | 348 (27.8%) | $37,500 |
| 65+ Years | 577 (46.2%) | $19,939 |
| Total | 1,250 (100.0%) | $26,044 |
Poverty in Jonesville
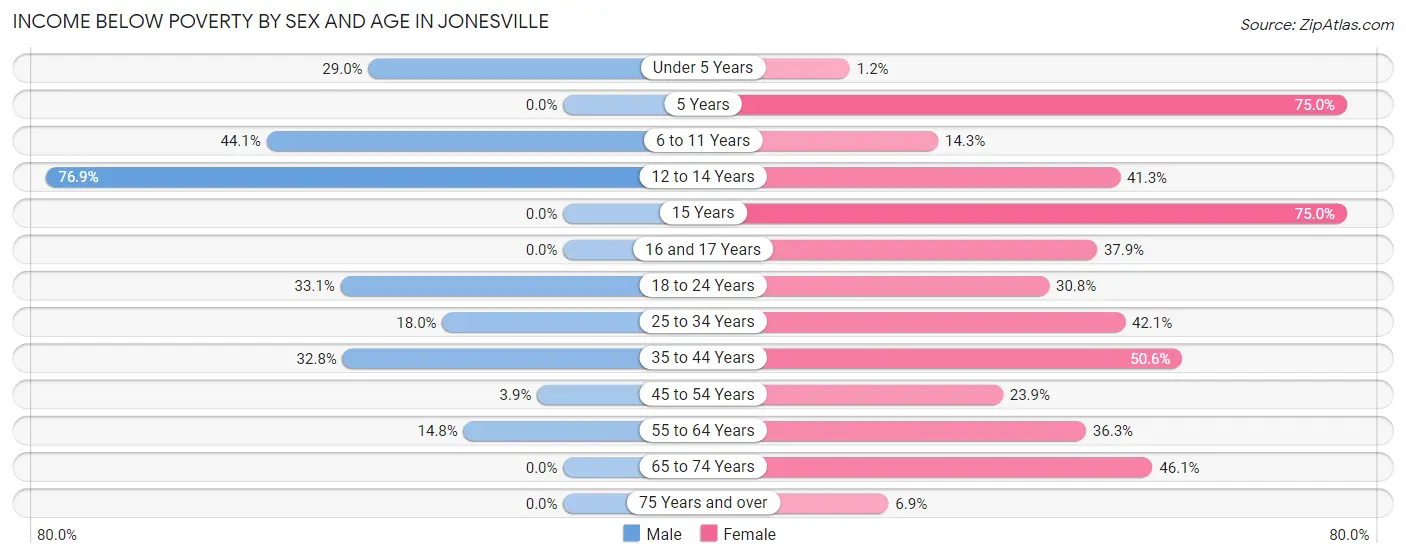
Income Below Poverty by Sex and Age in Jonesville
With 19.4% poverty level for males and 31.1% for females among the residents of Jonesville, 12 to 14 year old males and 5 year old females are the most vulnerable to poverty, with 20 males (76.9%) and 18 females (75.0%) in their respective age groups living below the poverty level.
| Age Bracket | Male | Female |
| Under 5 Years | 11 (28.9%) | 1 (1.2%) |
| 5 Years | 0 (0.0%) | 18 (75.0%) |
| 6 to 11 Years | 52 (44.1%) | 3 (14.3%) |
| 12 to 14 Years | 20 (76.9%) | 19 (41.3%) |
| 15 Years | 0 (0.0%) | 9 (75.0%) |
| 16 and 17 Years | 0 (0.0%) | 36 (37.9%) |
| 18 to 24 Years | 43 (33.1%) | 36 (30.8%) |
| 25 to 34 Years | 37 (18.0%) | 90 (42.1%) |
| 35 to 44 Years | 39 (32.8%) | 45 (50.6%) |
| 45 to 54 Years | 5 (3.9%) | 33 (23.9%) |
| 55 to 64 Years | 12 (14.8%) | 58 (36.2%) |
| 65 to 74 Years | 0 (0.0%) | 101 (46.1%) |
| 75 Years and over | 0 (0.0%) | 20 (6.9%) |
| Total | 219 (19.4%) | 469 (31.1%) |
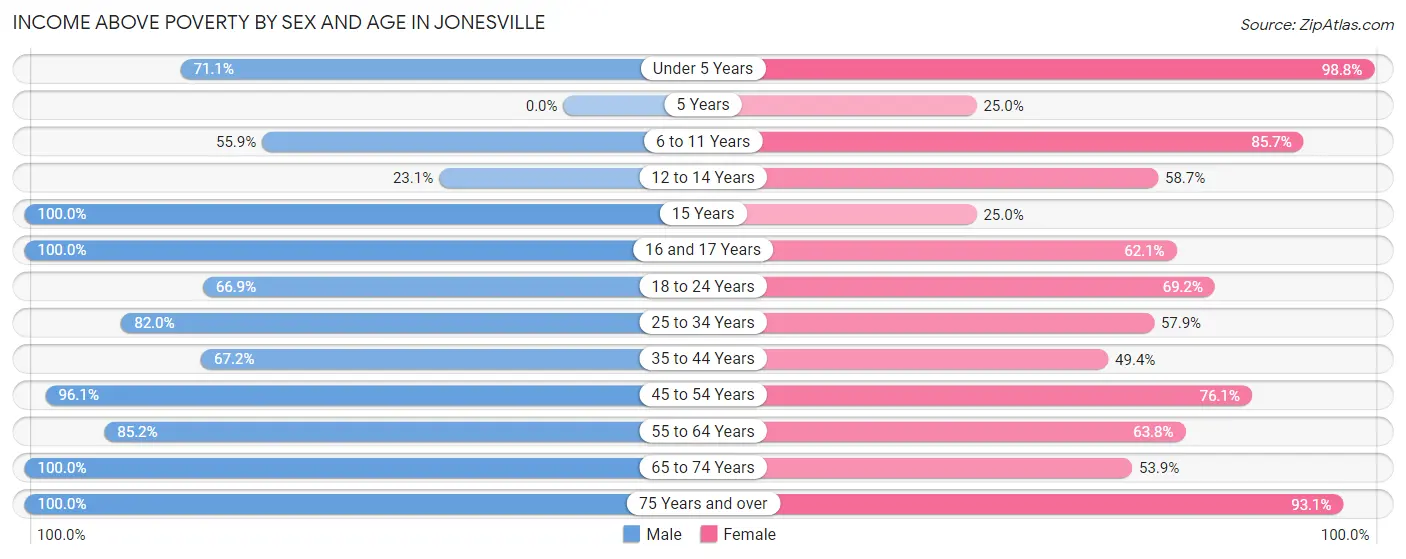
Income Above Poverty by Sex and Age in Jonesville
According to the poverty statistics in Jonesville, males aged 15 years and females aged under 5 years are the age groups that are most secure financially, with 100.0% of males and 98.8% of females in these age groups living above the poverty line.
| Age Bracket | Male | Female |
| Under 5 Years | 27 (71.1%) | 82 (98.8%) |
| 5 Years | 0 (0.0%) | 6 (25.0%) |
| 6 to 11 Years | 66 (55.9%) | 18 (85.7%) |
| 12 to 14 Years | 6 (23.1%) | 27 (58.7%) |
| 15 Years | 12 (100.0%) | 3 (25.0%) |
| 16 and 17 Years | 28 (100.0%) | 59 (62.1%) |
| 18 to 24 Years | 87 (66.9%) | 81 (69.2%) |
| 25 to 34 Years | 169 (82.0%) | 124 (57.9%) |
| 35 to 44 Years | 80 (67.2%) | 44 (49.4%) |
| 45 to 54 Years | 124 (96.1%) | 105 (76.1%) |
| 55 to 64 Years | 69 (85.2%) | 102 (63.7%) |
| 65 to 74 Years | 150 (100.0%) | 118 (53.9%) |
| 75 Years and over | 90 (100.0%) | 269 (93.1%) |
| Total | 908 (80.6%) | 1,038 (68.9%) |
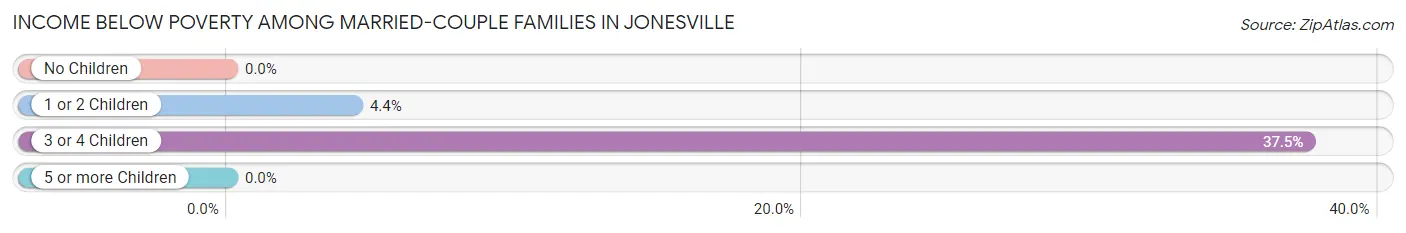
Income Below Poverty Among Married-Couple Families in Jonesville
The poverty statistics for married-couple families in Jonesville show that 2.6% or 8 of the total 312 families live below the poverty line. Families with 3 or 4 children have the highest poverty rate of 37.5%, comprising of 3 families. On the other hand, families with no children have the lowest poverty rate of 0.0%, which includes 0 families.
| Children | Above Poverty | Below Poverty |
| No Children | 189 (100.0%) | 0 (0.0%) |
| 1 or 2 Children | 110 (95.7%) | 5 (4.3%) |
| 3 or 4 Children | 5 (62.5%) | 3 (37.5%) |
| 5 or more Children | 0 (0.0%) | 0 (0.0%) |
| Total | 304 (97.4%) | 8 (2.6%) |
Income Below Poverty Among Single-Parent Households in Jonesville
According to the poverty data in Jonesville, 22.2% or 16 single-father households and 37.2% or 87 single-mother households are living below the poverty line. Among single-father households, those with no children have the highest poverty rate, with 14 households (50.0%) experiencing poverty. Likewise, among single-mother households, those with 3 or 4 children have the highest poverty rate, with 9 households (50.0%) falling below the poverty line.
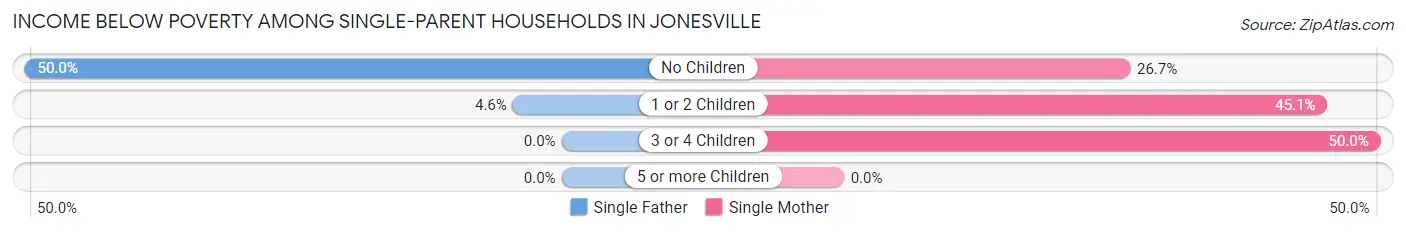
| Children | Single Father | Single Mother |
| No Children | 14 (50.0%) | 28 (26.7%) |
| 1 or 2 Children | 2 (4.5%) | 50 (45.1%) |
| 3 or 4 Children | 0 (0.0%) | 9 (50.0%) |
| 5 or more Children | 0 (0.0%) | 0 (0.0%) |
| Total | 16 (22.2%) | 87 (37.2%) |
Income Below Poverty Among Married-Couple vs Single-Parent Households in Jonesville
The poverty data for Jonesville shows that 8 of the married-couple family households (2.6%) and 103 of the single-parent households (33.7%) are living below the poverty level. Within the married-couple family households, those with 3 or 4 children have the highest poverty rate, with 3 households (37.5%) falling below the poverty line. Among the single-parent households, those with 3 or 4 children have the highest poverty rate, with 9 household (50.0%) living below poverty.
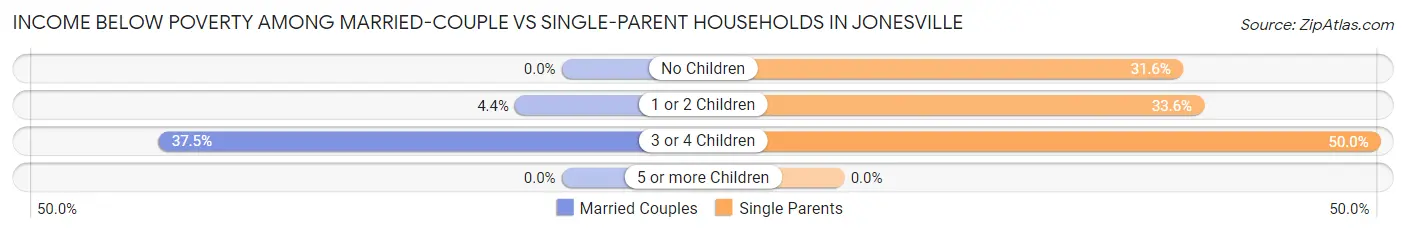
| Children | Married-Couple Families | Single-Parent Households |
| No Children | 0 (0.0%) | 42 (31.6%) |
| 1 or 2 Children | 5 (4.3%) | 52 (33.6%) |
| 3 or 4 Children | 3 (37.5%) | 9 (50.0%) |
| 5 or more Children | 0 (0.0%) | 0 (0.0%) |
| Total | 8 (2.6%) | 103 (33.7%) |
Race in Jonesville
The most populous races in Jonesville are White / Caucasian (1,907 | 72.4%), Black / African American (393 | 14.9%), and Hispanic or Latino (197 | 7.5%).
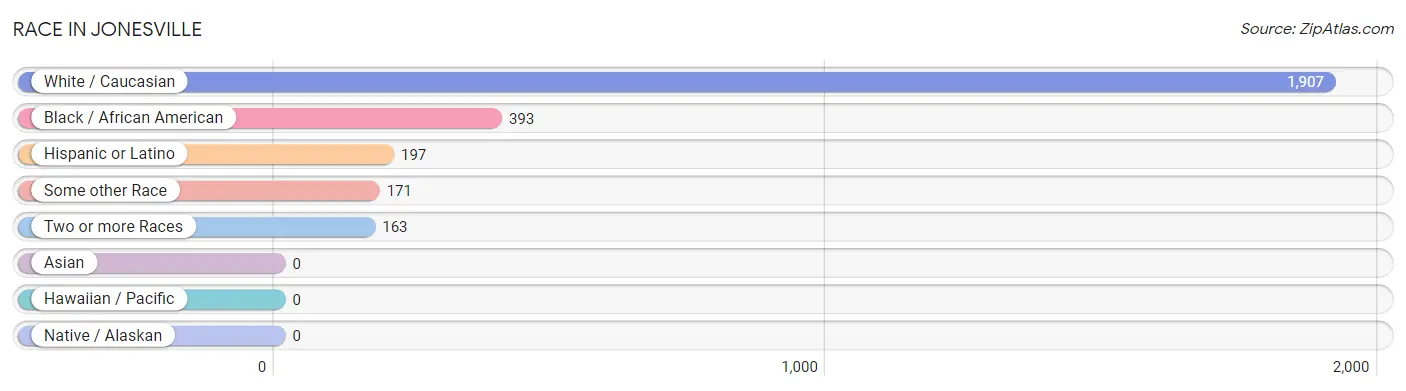
| Race | # Population | % Population |
| Asian | 0 | 0.0% |
| Black / African American | 393 | 14.9% |
| Hawaiian / Pacific | 0 | 0.0% |
| Hispanic or Latino | 197 | 7.5% |
| Native / Alaskan | 0 | 0.0% |
| White / Caucasian | 1,907 | 72.4% |
| Two or more Races | 163 | 6.2% |
| Some other Race | 171 | 6.5% |
| Total | 2,634 | 100.0% |
Ancestry in Jonesville
The most populous ancestries reported in Jonesville are American (490 | 18.6%), English (176 | 6.7%), Mexican (159 | 6.0%), Irish (133 | 5.1%), and German (128 | 4.9%), together accounting for 41.2% of all Jonesville residents.
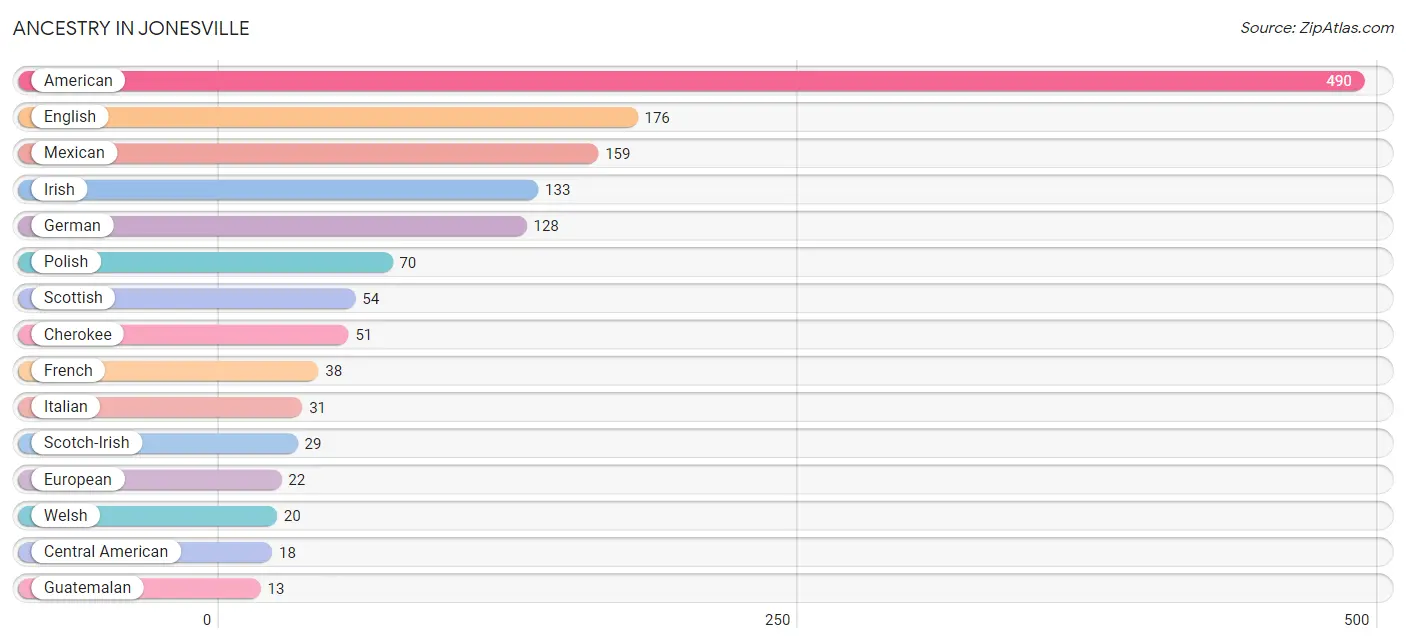
| Ancestry | # Population | % Population |
| American | 490 | 18.6% |
| Blackfeet | 2 | 0.1% |
| British | 4 | 0.2% |
| Central American | 18 | 0.7% |
| Central American Indian | 2 | 0.1% |
| Cherokee | 51 | 1.9% |
| Dutch | 7 | 0.3% |
| English | 176 | 6.7% |
| European | 22 | 0.8% |
| French | 38 | 1.4% |
| German | 128 | 4.9% |
| Guatemalan | 13 | 0.5% |
| Honduran | 5 | 0.2% |
| Hungarian | 5 | 0.2% |
| Irish | 133 | 5.1% |
| Italian | 31 | 1.2% |
| Mexican | 159 | 6.0% |
| Polish | 70 | 2.7% |
| Scotch-Irish | 29 | 1.1% |
| Scottish | 54 | 2.1% |
| Ukrainian | 2 | 0.1% |
| Welsh | 20 | 0.8% | View All 22 Rows |
Immigrants in Jonesville
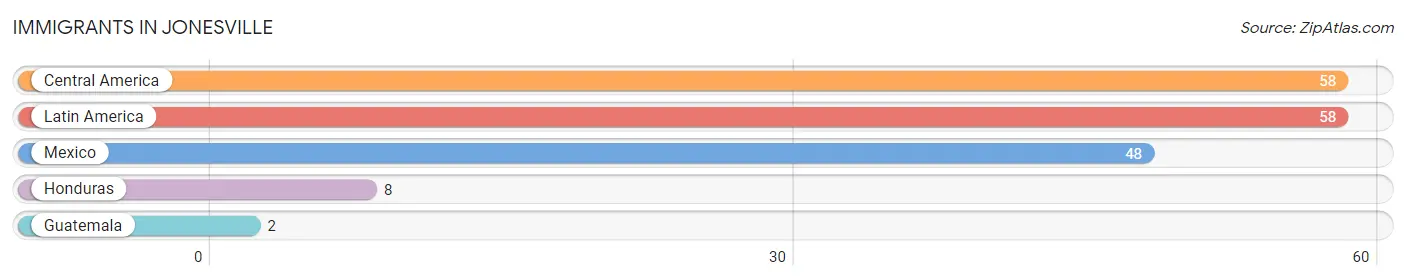
The most numerous immigrant groups reported in Jonesville came from Central America (58 | 2.2%), Latin America (58 | 2.2%), Mexico (48 | 1.8%), Honduras (8 | 0.3%), and Guatemala (2 | 0.1%), together accounting for 6.6% of all Jonesville residents.
| Immigration Origin | # Population | % Population |
| Central America | 58 | 2.2% |
| Guatemala | 2 | 0.1% |
| Honduras | 8 | 0.3% |
| Latin America | 58 | 2.2% |
| Mexico | 48 | 1.8% | View All 5 Rows |
Sex and Age in Jonesville
Sex and Age in Jonesville
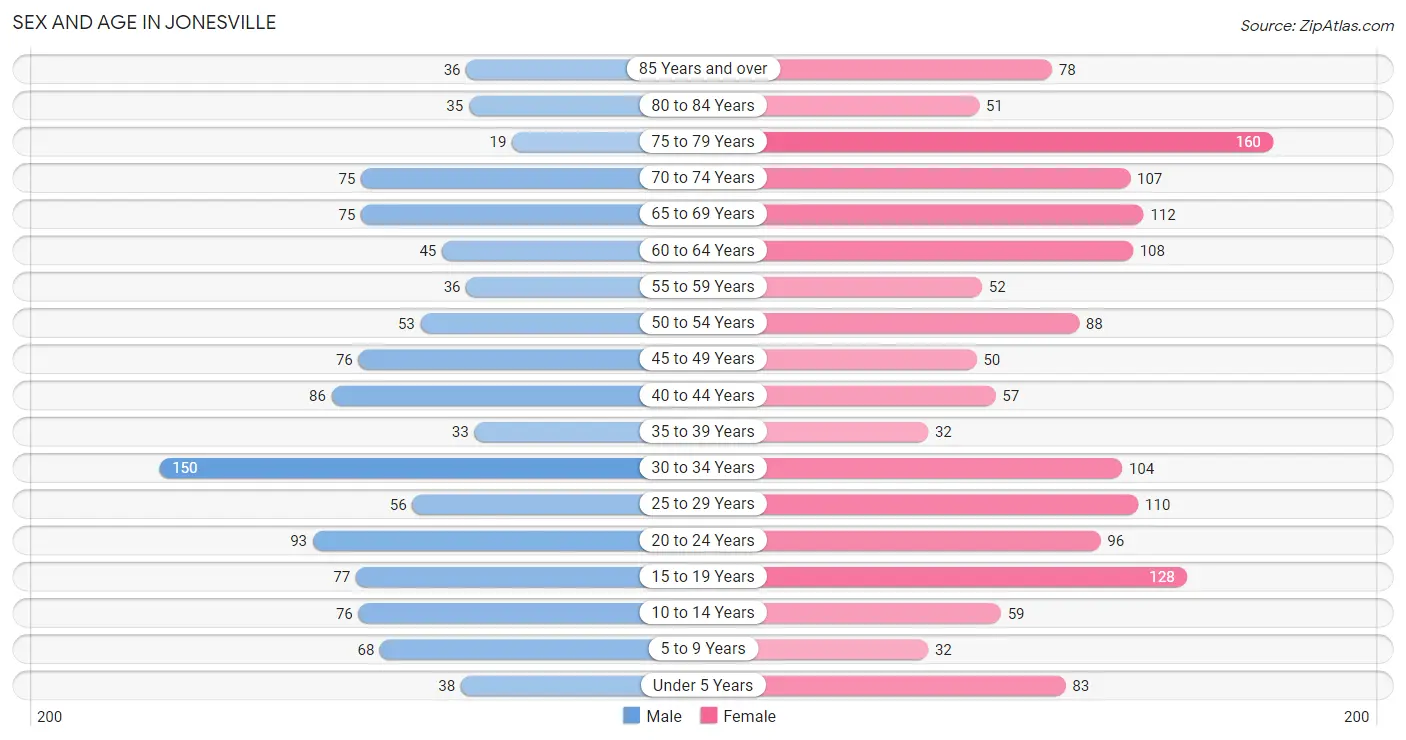
The most populous age groups in Jonesville are 30 to 34 Years (150 | 13.3%) for men and 75 to 79 Years (160 | 10.6%) for women.
| Age Bracket | Male | Female |
| Under 5 Years | 38 (3.4%) | 83 (5.5%) |
| 5 to 9 Years | 68 (6.0%) | 32 (2.1%) |
| 10 to 14 Years | 76 (6.7%) | 59 (3.9%) |
| 15 to 19 Years | 77 (6.8%) | 128 (8.5%) |
| 20 to 24 Years | 93 (8.3%) | 96 (6.4%) |
| 25 to 29 Years | 56 (5.0%) | 110 (7.3%) |
| 30 to 34 Years | 150 (13.3%) | 104 (6.9%) |
| 35 to 39 Years | 33 (2.9%) | 32 (2.1%) |
| 40 to 44 Years | 86 (7.6%) | 57 (3.8%) |
| 45 to 49 Years | 76 (6.7%) | 50 (3.3%) |
| 50 to 54 Years | 53 (4.7%) | 88 (5.8%) |
| 55 to 59 Years | 36 (3.2%) | 52 (3.5%) |
| 60 to 64 Years | 45 (4.0%) | 108 (7.2%) |
| 65 to 69 Years | 75 (6.7%) | 112 (7.4%) |
| 70 to 74 Years | 75 (6.7%) | 107 (7.1%) |
| 75 to 79 Years | 19 (1.7%) | 160 (10.6%) |
| 80 to 84 Years | 35 (3.1%) | 51 (3.4%) |
| 85 Years and over | 36 (3.2%) | 78 (5.2%) |
| Total | 1,127 (100.0%) | 1,507 (100.0%) |
Families and Households in Jonesville
Median Family Size in Jonesville
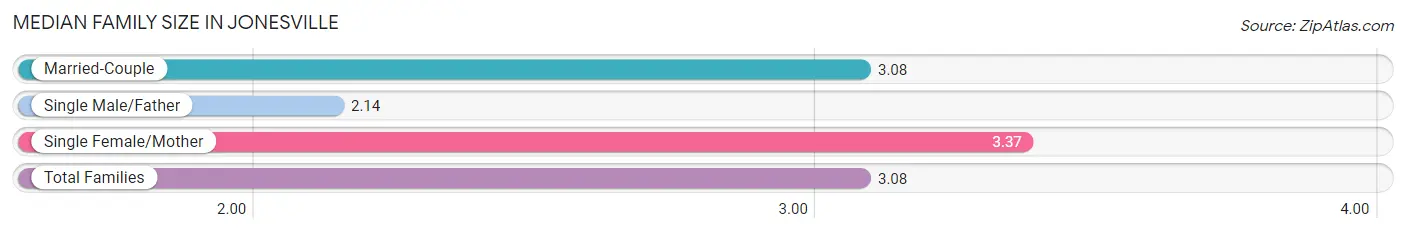
The median family size in Jonesville is 3.08 persons per family, with single female/mother families (234 | 37.9%) accounting for the largest median family size of 3.37 persons per family. On the other hand, single male/father families (72 | 11.7%) represent the smallest median family size with 2.14 persons per family.
| Family Type | # Families | Family Size |
| Married-Couple | 312 (50.5%) | 3.08 |
| Single Male/Father | 72 (11.7%) | 2.14 |
| Single Female/Mother | 234 (37.9%) | 3.37 |
| Total Families | 618 (100.0%) | 3.08 |
Median Household Size in Jonesville
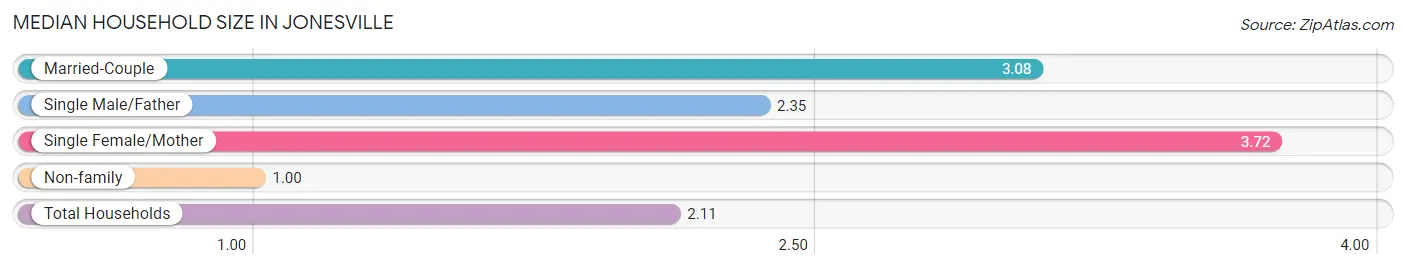
The median household size in Jonesville is 2.11 persons per household, with single female/mother households (234 | 18.7%) accounting for the largest median household size of 3.72 persons per household. non-family households (632 | 50.6%) represent the smallest median household size with 1.00 persons per household.
| Household Type | # Households | Household Size |
| Married-Couple | 312 (25.0%) | 3.08 |
| Single Male/Father | 72 (5.8%) | 2.35 |
| Single Female/Mother | 234 (18.7%) | 3.72 |
| Non-family | 632 (50.6%) | 1.00 |
| Total Households | 1,250 (100.0%) | 2.11 |
Household Size by Marriage Status in Jonesville
Out of a total of 1,250 households in Jonesville, 618 (49.4%) are family households, while 632 (50.6%) are nonfamily households. The most numerous type of family households are 2-person households, comprising 288, and the most common type of nonfamily households are 1-person households, comprising 630.
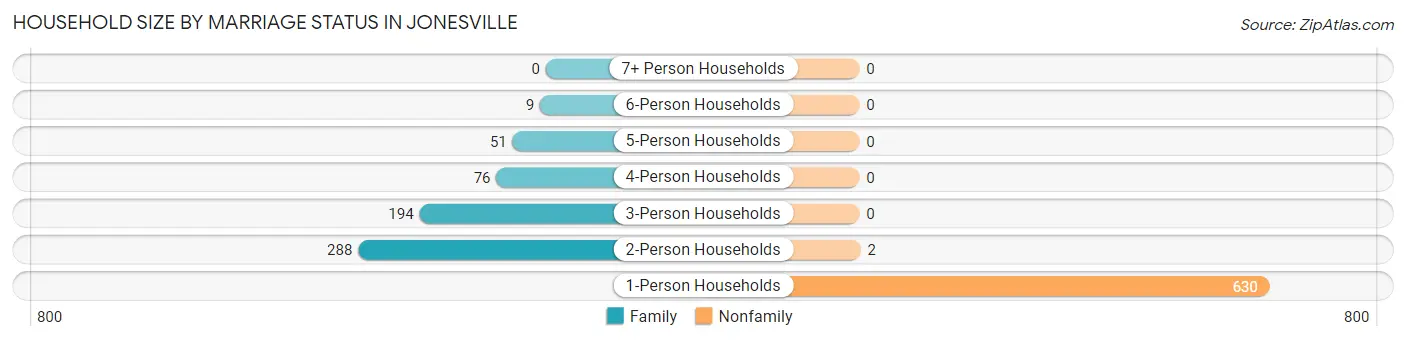
| Household Size | Family Households | Nonfamily Households |
| 1-Person Households | - | 630 (50.4%) |
| 2-Person Households | 288 (23.0%) | 2 (0.2%) |
| 3-Person Households | 194 (15.5%) | 0 (0.0%) |
| 4-Person Households | 76 (6.1%) | 0 (0.0%) |
| 5-Person Households | 51 (4.1%) | 0 (0.0%) |
| 6-Person Households | 9 (0.7%) | 0 (0.0%) |
| 7+ Person Households | 0 (0.0%) | 0 (0.0%) |
| Total | 618 (49.4%) | 632 (50.6%) |
Female Fertility in Jonesville
Fertility by Age in Jonesville
Average fertility rate in Jonesville is 151.0 births per 1,000 women. Women in the age bracket of 20 to 34 years have the highest fertility rate with 294.0 births per 1,000 women. Women in the age bracket of 20 to 34 years acount for 100.0% of all women with births.
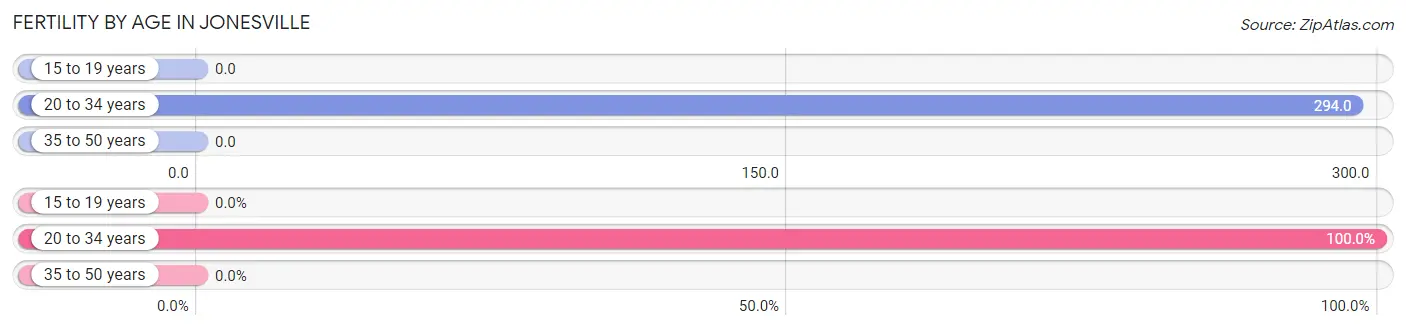
| Age Bracket | Women with Births | Births / 1,000 Women |
| 15 to 19 years | 0 (0.0%) | 0.0 |
| 20 to 34 years | 91 (100.0%) | 294.0 |
| 35 to 50 years | 0 (0.0%) | 0.0 |
| Total | 91 (100.0%) | 151.0 |
Fertility by Age by Marriage Status in Jonesville
40.7% of women with births (91) in Jonesville are married. The highest percentage of unmarried women with births falls into 20 to 34 years age bracket with 59.3% of them unmarried at the time of birth, while the lowest percentage of unmarried women with births belong to 20 to 34 years age bracket with 59.3% of them unmarried.
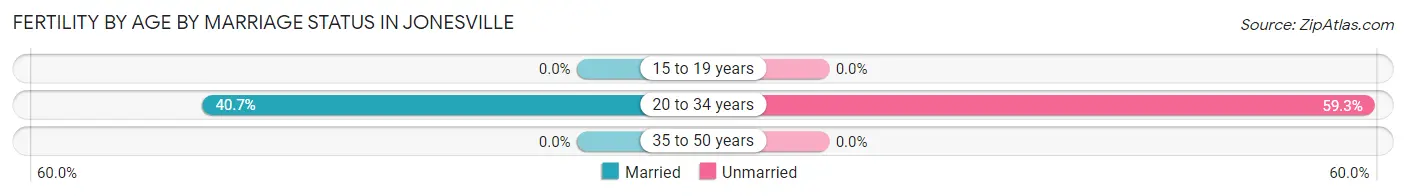
| Age Bracket | Married | Unmarried |
| 15 to 19 years | 0 (0.0%) | 0 (0.0%) |
| 20 to 34 years | 37 (40.7%) | 54 (59.3%) |
| 35 to 50 years | 0 (0.0%) | 0 (0.0%) |
| Total | 37 (40.7%) | 54 (59.3%) |
Fertility by Education in Jonesville
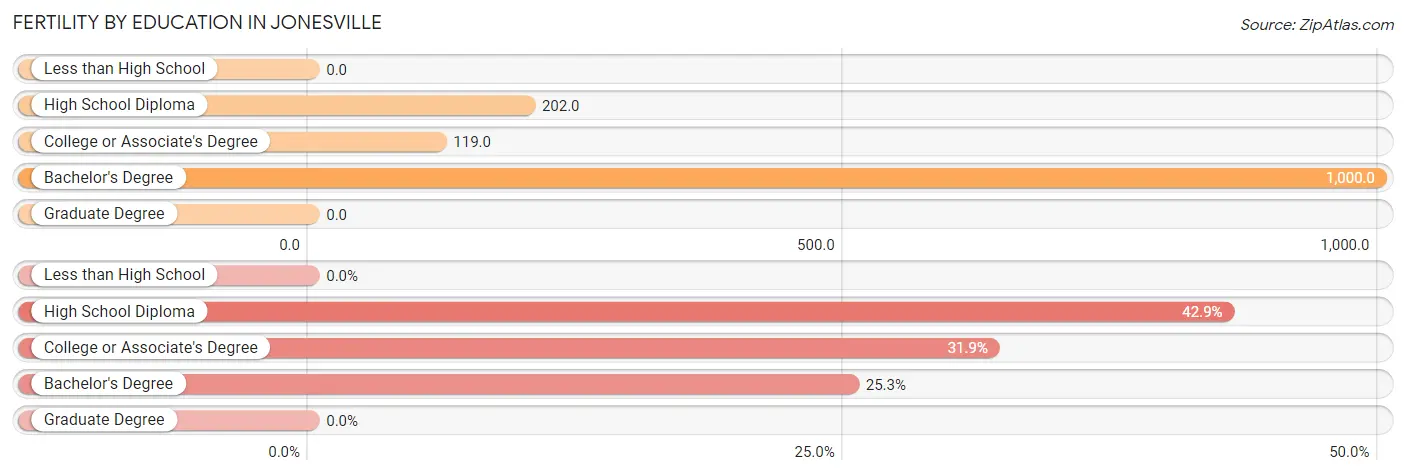
| Educational Attainment | Women with Births | Births / 1,000 Women |
| Less than High School | 0 (0.0%) | 0.0 |
| High School Diploma | 39 (42.9%) | 202.0 |
| College or Associate's Degree | 29 (31.9%) | 119.0 |
| Bachelor's Degree | 23 (25.3%) | 1,000.0 |
| Graduate Degree | 0 (0.0%) | 0.0 |
| Total | 91 (100.0%) | 151.0 |
Fertility by Education by Marriage Status in Jonesville
59.3% of women with births in Jonesville are unmarried. Women with the educational attainment of bachelor's degree are most likely to be married with 100.0% of them married at childbirth, while women with the educational attainment of high school diploma are least likely to be married with 100.0% of them unmarried at childbirth.
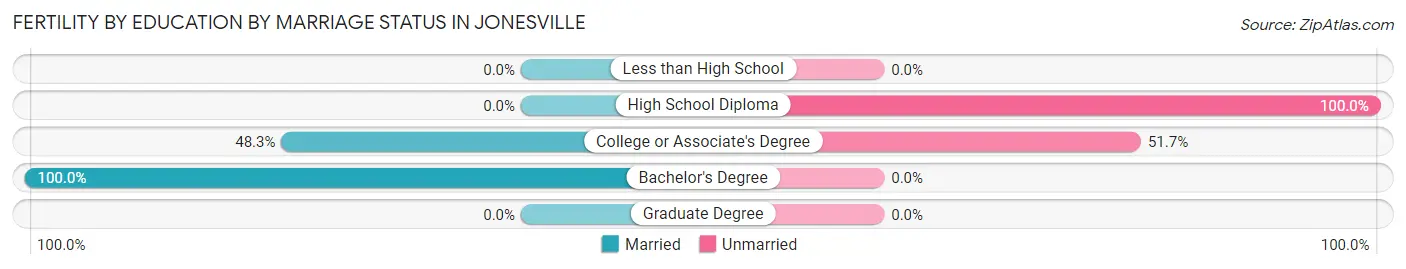
| Educational Attainment | Married | Unmarried |
| Less than High School | 0 (0.0%) | 0 (0.0%) |
| High School Diploma | 0 (0.0%) | 39 (100.0%) |
| College or Associate's Degree | 14 (48.3%) | 15 (51.7%) |
| Bachelor's Degree | 23 (100.0%) | 0 (0.0%) |
| Graduate Degree | 0 (0.0%) | 0 (0.0%) |
| Total | 37 (40.7%) | 54 (59.3%) |
Employment Characteristics in Jonesville
Employment by Class of Employer in Jonesville
Among the 992 employed individuals in Jonesville, private company employees (843 | 85.0%), federal government employees (41 | 4.1%), and self-employed (incorporated) (31 | 3.1%) make up the most common classes of employment.
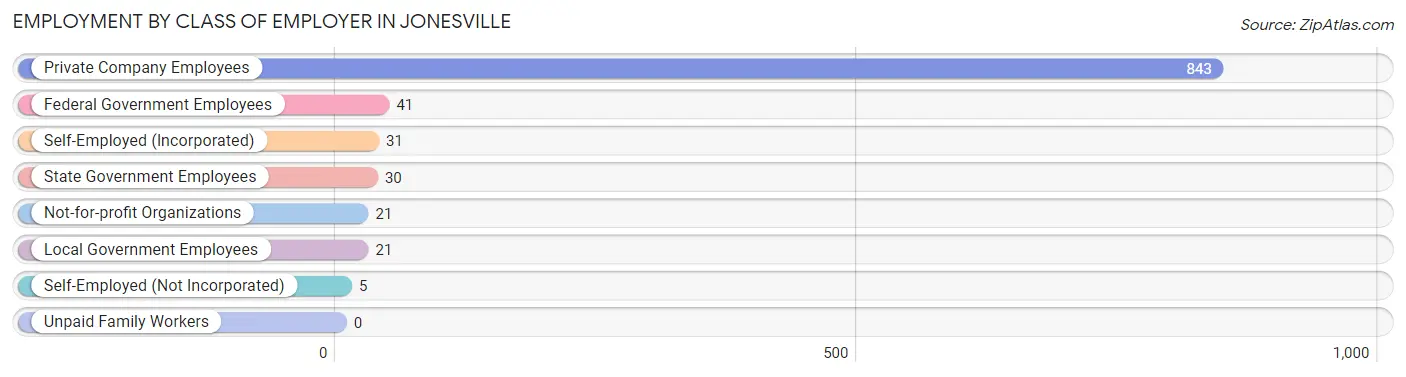
| Employer Class | # Employees | % Employees |
| Private Company Employees | 843 | 85.0% |
| Self-Employed (Incorporated) | 31 | 3.1% |
| Self-Employed (Not Incorporated) | 5 | 0.5% |
| Not-for-profit Organizations | 21 | 2.1% |
| Local Government Employees | 21 | 2.1% |
| State Government Employees | 30 | 3.0% |
| Federal Government Employees | 41 | 4.1% |
| Unpaid Family Workers | 0 | 0.0% |
| Total | 992 | 100.0% |
Employment Status by Age in Jonesville
According to the labor force statistics for Jonesville, out of the total population over 16 years of age (2,254), 46.1% or 1,039 individuals are in the labor force, with 2.1% or 22 of them unemployed. The age group with the highest labor force participation rate is 25 to 29 years, with 94.6% or 157 individuals in the labor force. Within the labor force, the 16 to 19 years age range has the highest percentage of unemployed individuals, with 16.3% or 8 of them being unemployed.
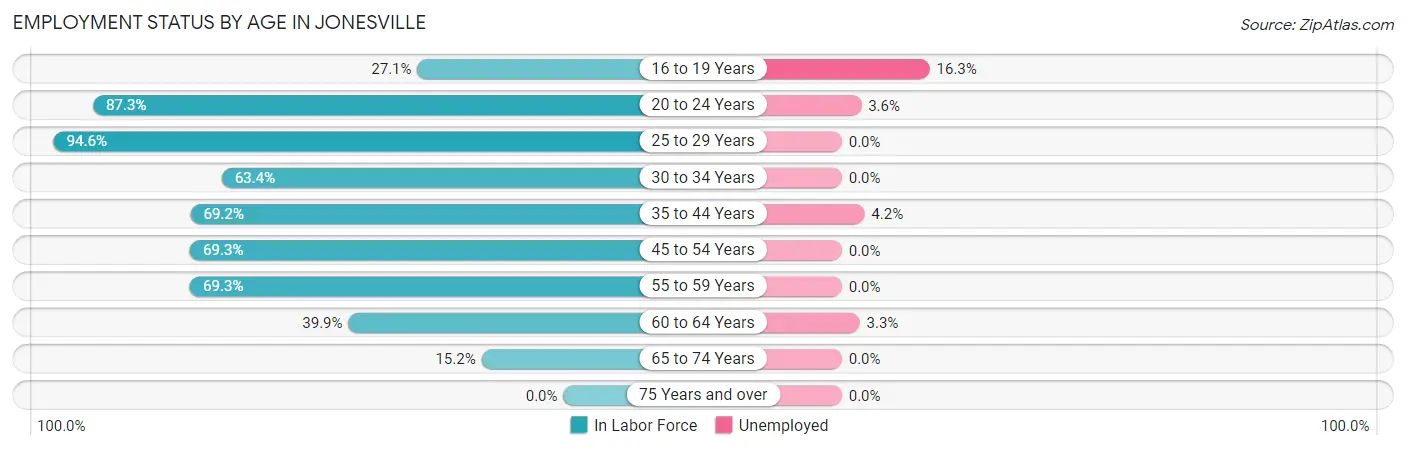
| Age Bracket | In Labor Force | Unemployed |
| 16 to 19 Years | 49 (27.1%) | 8 (16.3%) |
| 20 to 24 Years | 165 (87.3%) | 6 (3.6%) |
| 25 to 29 Years | 157 (94.6%) | 0 (0.0%) |
| 30 to 34 Years | 161 (63.4%) | 0 (0.0%) |
| 35 to 44 Years | 144 (69.2%) | 6 (4.2%) |
| 45 to 54 Years | 185 (69.3%) | 0 (0.0%) |
| 55 to 59 Years | 61 (69.3%) | 0 (0.0%) |
| 60 to 64 Years | 61 (39.9%) | 2 (3.3%) |
| 65 to 74 Years | 56 (15.2%) | 0 (0.0%) |
| 75 Years and over | 0 (0.0%) | 0 (0.0%) |
| Total | 1,039 (46.1%) | 22 (2.1%) |
Employment Status by Educational Attainment in Jonesville
According to labor force statistics for Jonesville, 67.7% of individuals (769) out of the total population between 25 and 64 years of age (1,136) are in the labor force, with 1.0% or 8 of them being unemployed. The group with the highest labor force participation rate are those with the educational attainment of bachelor's degree or higher, with 81.4% or 70 individuals in the labor force. Within the labor force, individuals with bachelor's degree or higher education have the highest percentage of unemployment, with 2.9% or 2 of them being unemployed.
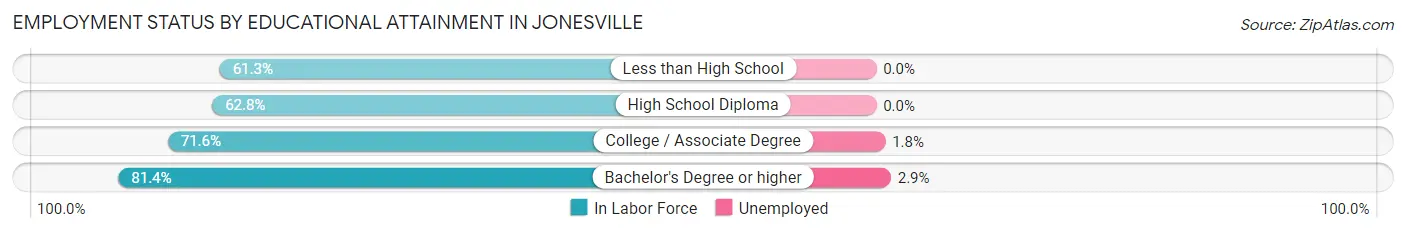
| Educational Attainment | In Labor Force | Unemployed |
| Less than High School | 100 (61.3%) | 0 (0.0%) |
| High School Diploma | 258 (62.8%) | 0 (0.0%) |
| College / Associate Degree | 341 (71.6%) | 9 (1.8%) |
| Bachelor's Degree or higher | 70 (81.4%) | 2 (2.9%) |
| Total | 769 (67.7%) | 11 (1.0%) |
Employment Occupations by Sex in Jonesville
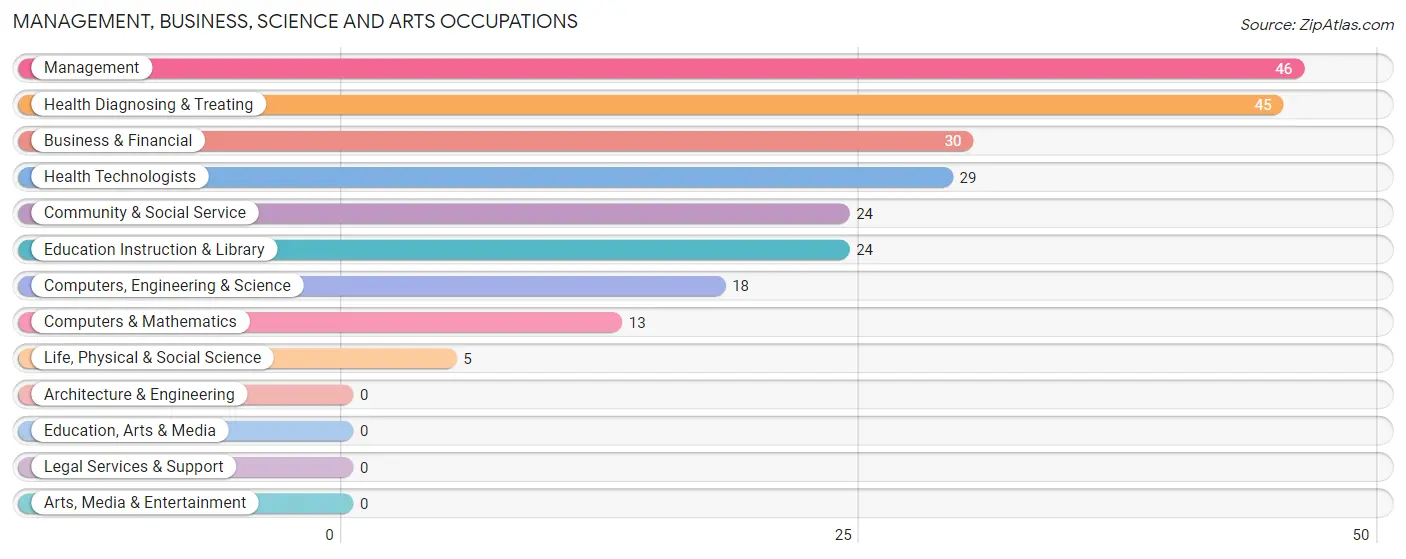
Management, Business, Science and Arts Occupations
The most common Management, Business, Science and Arts occupations in Jonesville are Management (46 | 4.5%), Health Diagnosing & Treating (45 | 4.4%), Business & Financial (30 | 2.9%), Health Technologists (29 | 2.9%), and Community & Social Service (24 | 2.4%).
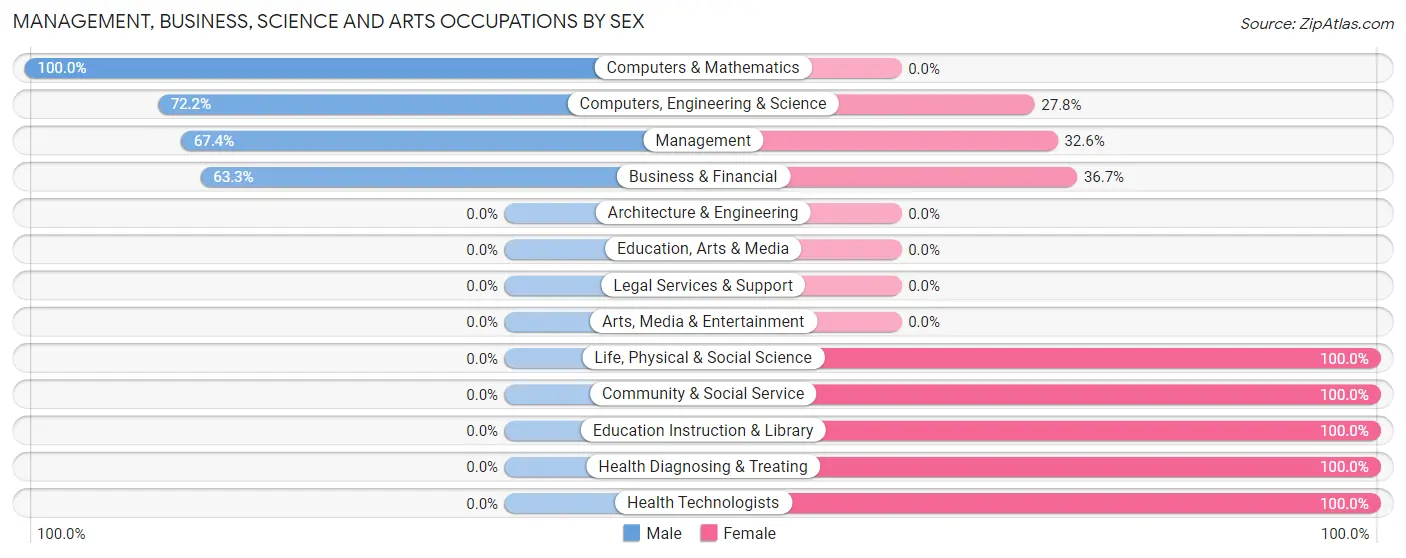
Management, Business, Science and Arts Occupations by Sex
Within the Management, Business, Science and Arts occupations in Jonesville, the most male-oriented occupations are Computers & Mathematics (100.0%), Computers, Engineering & Science (72.2%), and Management (67.4%), while the most female-oriented occupations are Life, Physical & Social Science (100.0%), Community & Social Service (100.0%), and Education Instruction & Library (100.0%).
| Occupation | Male | Female |
| Management | 31 (67.4%) | 15 (32.6%) |
| Business & Financial | 19 (63.3%) | 11 (36.7%) |
| Computers, Engineering & Science | 13 (72.2%) | 5 (27.8%) |
| Computers & Mathematics | 13 (100.0%) | 0 (0.0%) |
| Architecture & Engineering | 0 (0.0%) | 0 (0.0%) |
| Life, Physical & Social Science | 0 (0.0%) | 5 (100.0%) |
| Community & Social Service | 0 (0.0%) | 24 (100.0%) |
| Education, Arts & Media | 0 (0.0%) | 0 (0.0%) |
| Legal Services & Support | 0 (0.0%) | 0 (0.0%) |
| Education Instruction & Library | 0 (0.0%) | 24 (100.0%) |
| Arts, Media & Entertainment | 0 (0.0%) | 0 (0.0%) |
| Health Diagnosing & Treating | 0 (0.0%) | 45 (100.0%) |
| Health Technologists | 0 (0.0%) | 29 (100.0%) |
| Total (Category) | 63 (38.7%) | 100 (61.4%) |
| Total (Overall) | 485 (47.7%) | 532 (52.3%) |
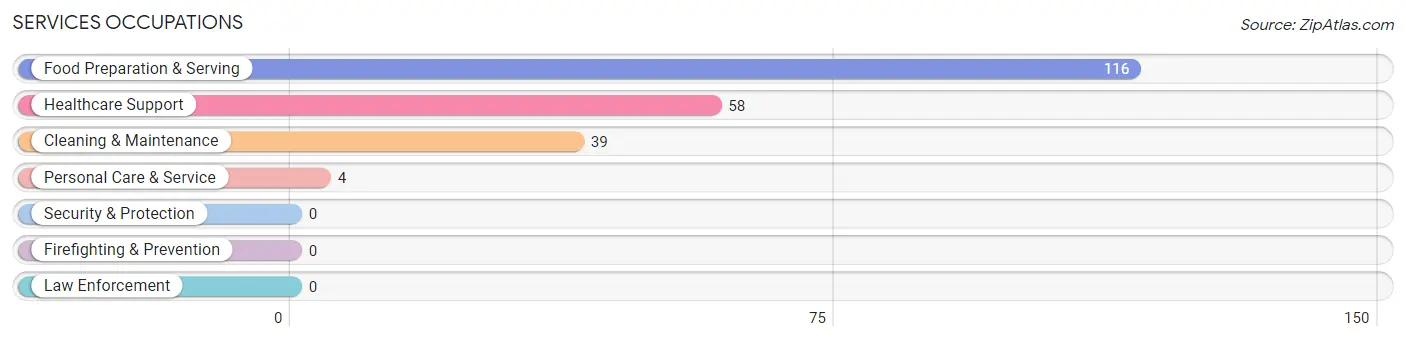
Services Occupations
The most common Services occupations in Jonesville are Food Preparation & Serving (116 | 11.4%), Healthcare Support (58 | 5.7%), Cleaning & Maintenance (39 | 3.8%), and Personal Care & Service (4 | 0.4%).
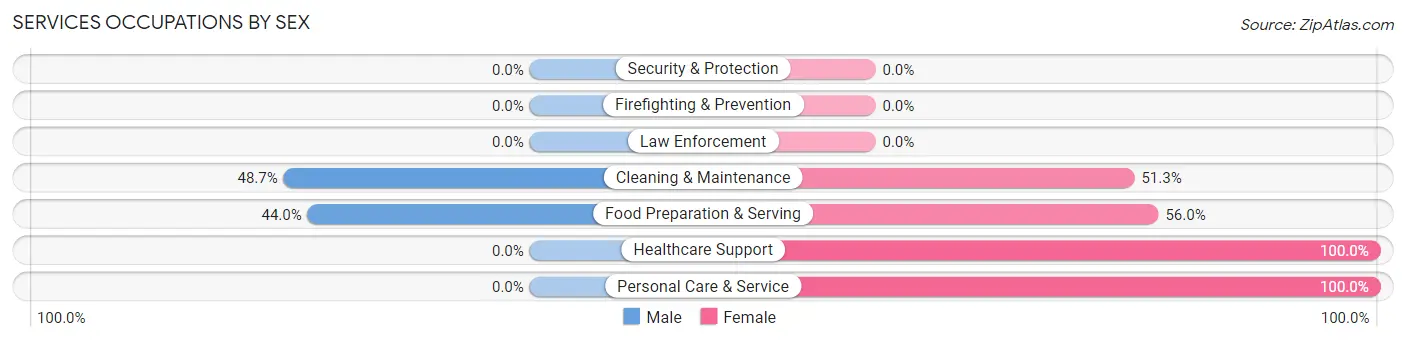
Services Occupations by Sex
Within the Services occupations in Jonesville, the most male-oriented occupations are Cleaning & Maintenance (48.7%), and Food Preparation & Serving (44.0%), while the most female-oriented occupations are Healthcare Support (100.0%), Personal Care & Service (100.0%), and Food Preparation & Serving (56.0%).
| Occupation | Male | Female |
| Healthcare Support | 0 (0.0%) | 58 (100.0%) |
| Security & Protection | 0 (0.0%) | 0 (0.0%) |
| Firefighting & Prevention | 0 (0.0%) | 0 (0.0%) |
| Law Enforcement | 0 (0.0%) | 0 (0.0%) |
| Food Preparation & Serving | 51 (44.0%) | 65 (56.0%) |
| Cleaning & Maintenance | 19 (48.7%) | 20 (51.3%) |
| Personal Care & Service | 0 (0.0%) | 4 (100.0%) |
| Total (Category) | 70 (32.3%) | 147 (67.7%) |
| Total (Overall) | 485 (47.7%) | 532 (52.3%) |
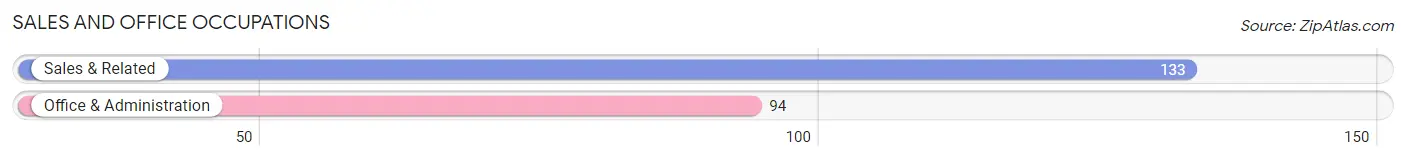
Sales and Office Occupations
The most common Sales and Office occupations in Jonesville are Sales & Related (133 | 13.1%), and Office & Administration (94 | 9.2%).
Sales and Office Occupations by Sex
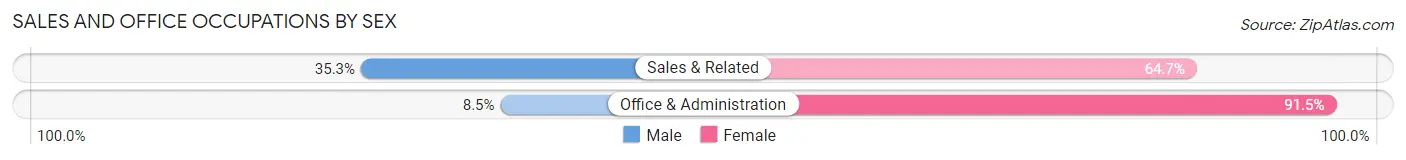
| Occupation | Male | Female |
| Sales & Related | 47 (35.3%) | 86 (64.7%) |
| Office & Administration | 8 (8.5%) | 86 (91.5%) |
| Total (Category) | 55 (24.2%) | 172 (75.8%) |
| Total (Overall) | 485 (47.7%) | 532 (52.3%) |
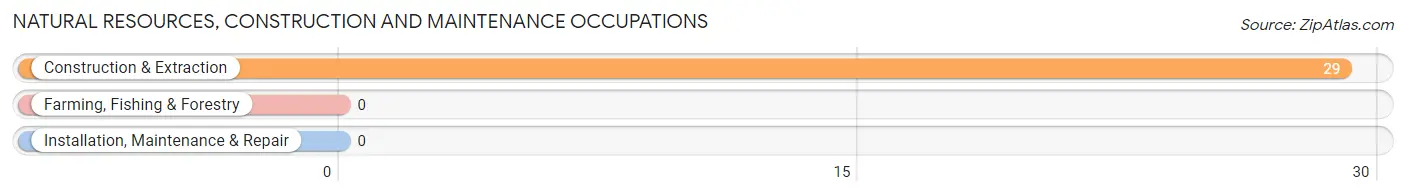
Natural Resources, Construction and Maintenance Occupations
The most common Natural Resources, Construction and Maintenance occupations in Jonesville are , and Construction & Extraction (29 | 2.9%).
Natural Resources, Construction and Maintenance Occupations by Sex

| Occupation | Male | Female |
| Farming, Fishing & Forestry | 0 (0.0%) | 0 (0.0%) |
| Construction & Extraction | 29 (100.0%) | 0 (0.0%) |
| Installation, Maintenance & Repair | 0 (0.0%) | 0 (0.0%) |
| Total (Category) | 29 (100.0%) | 0 (0.0%) |
| Total (Overall) | 485 (47.7%) | 532 (52.3%) |
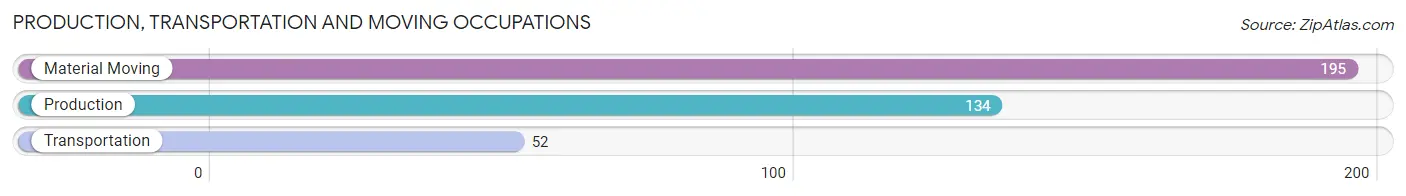
Production, Transportation and Moving Occupations
The most common Production, Transportation and Moving occupations in Jonesville are Material Moving (195 | 19.2%), Production (134 | 13.2%), and Transportation (52 | 5.1%).
Production, Transportation and Moving Occupations by Sex
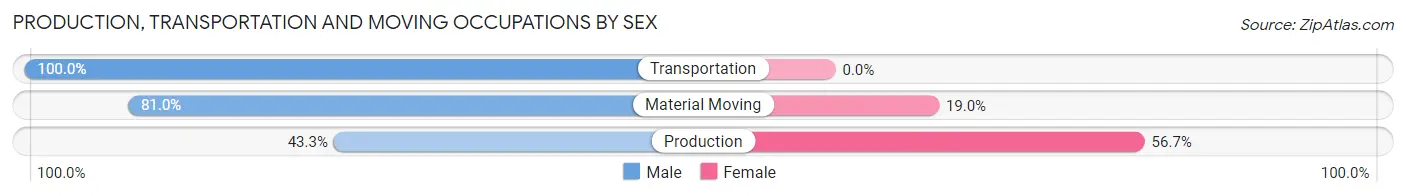
| Occupation | Male | Female |
| Production | 58 (43.3%) | 76 (56.7%) |
| Transportation | 52 (100.0%) | 0 (0.0%) |
| Material Moving | 158 (81.0%) | 37 (19.0%) |
| Total (Category) | 268 (70.3%) | 113 (29.7%) |
| Total (Overall) | 485 (47.7%) | 532 (52.3%) |
Employment Industries by Sex in Jonesville
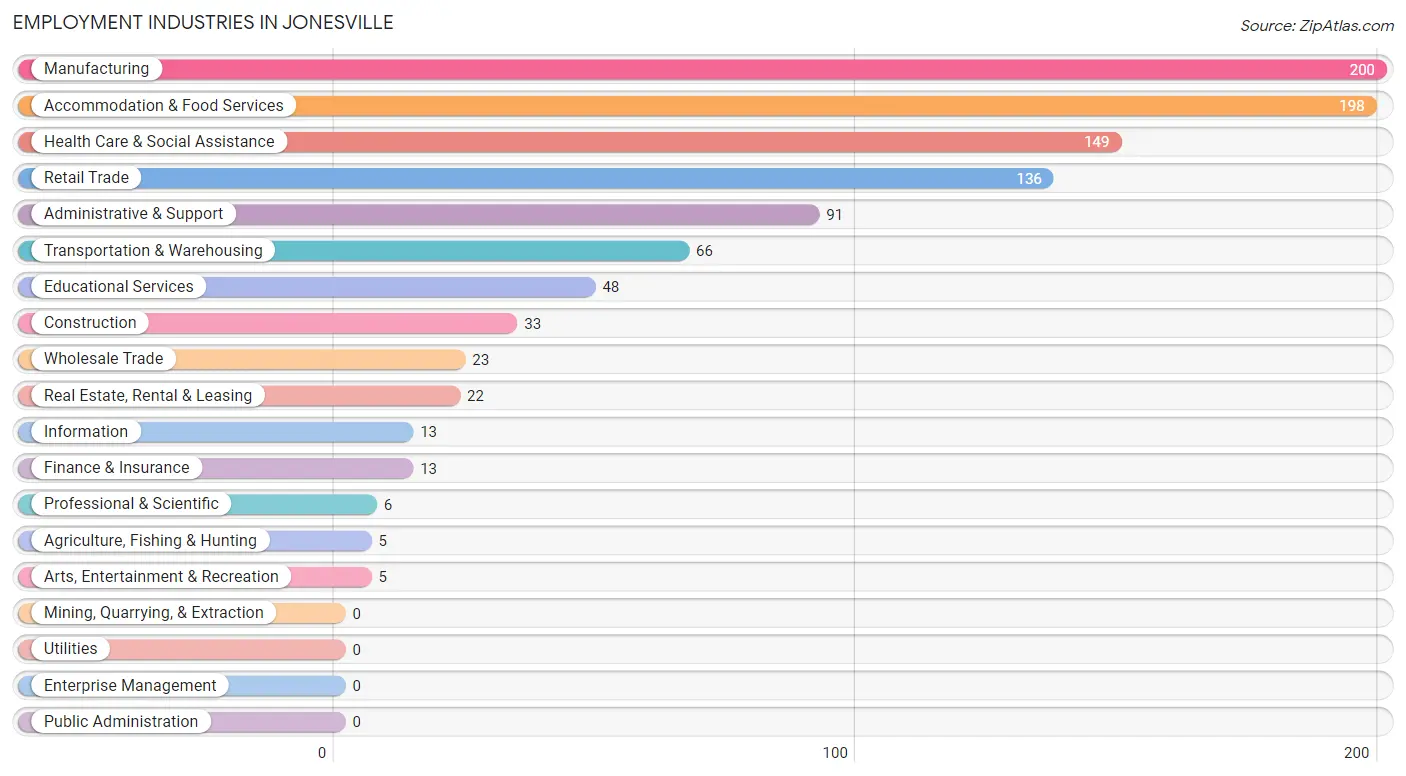
Employment Industries in Jonesville
The major employment industries in Jonesville include Manufacturing (200 | 19.7%), Accommodation & Food Services (198 | 19.5%), Health Care & Social Assistance (149 | 14.6%), Retail Trade (136 | 13.4%), and Administrative & Support (91 | 8.9%).
Employment Industries by Sex in Jonesville
The Jonesville industries that see more men than women are Agriculture, Fishing & Hunting (100.0%), Wholesale Trade (100.0%), and Information (100.0%), whereas the industries that tend to have a higher number of women are Real Estate, Rental & Leasing (100.0%), Professional & Scientific (100.0%), and Educational Services (100.0%).
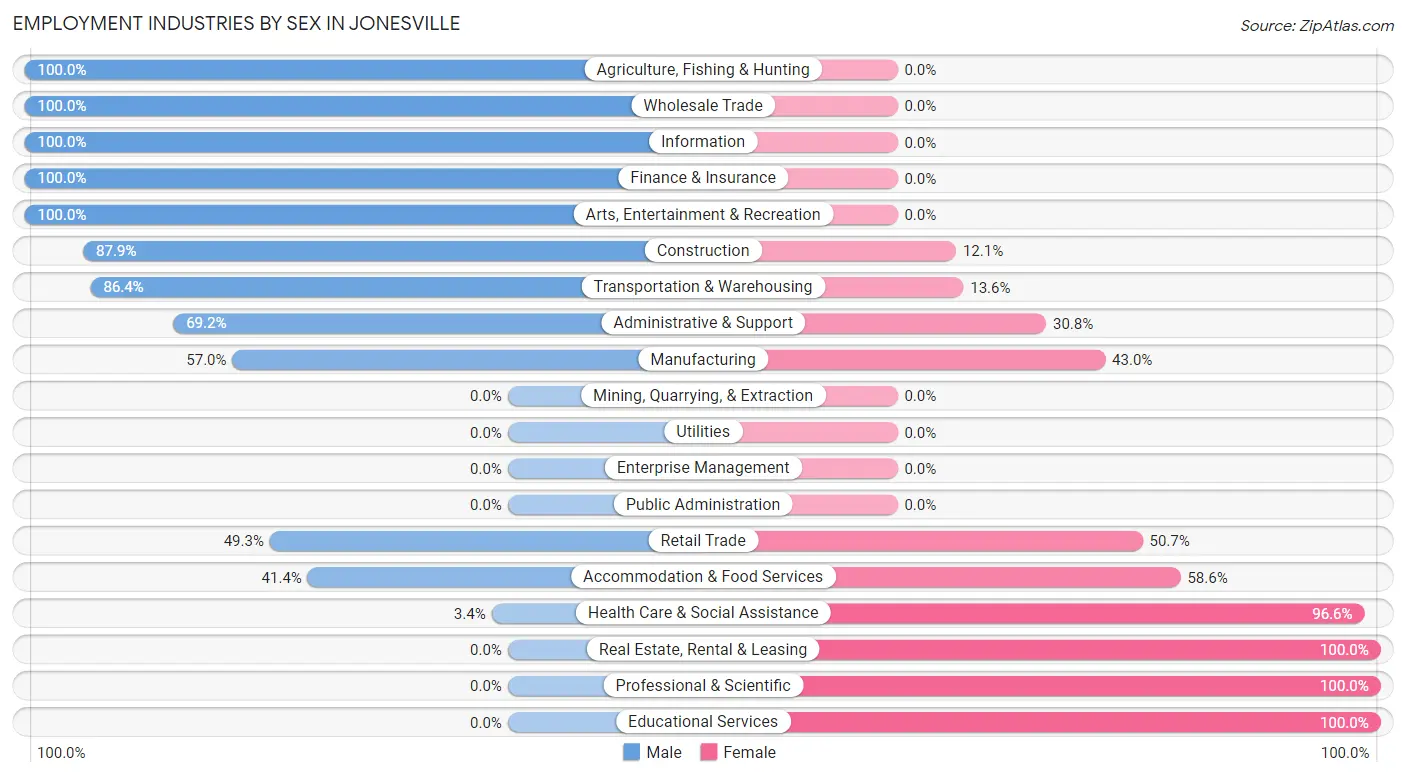
| Industry | Male | Female |
| Agriculture, Fishing & Hunting | 5 (100.0%) | 0 (0.0%) |
| Mining, Quarrying, & Extraction | 0 (0.0%) | 0 (0.0%) |
| Construction | 29 (87.9%) | 4 (12.1%) |
| Manufacturing | 114 (57.0%) | 86 (43.0%) |
| Wholesale Trade | 23 (100.0%) | 0 (0.0%) |
| Retail Trade | 67 (49.3%) | 69 (50.7%) |
| Transportation & Warehousing | 57 (86.4%) | 9 (13.6%) |
| Utilities | 0 (0.0%) | 0 (0.0%) |
| Information | 13 (100.0%) | 0 (0.0%) |
| Finance & Insurance | 13 (100.0%) | 0 (0.0%) |
| Real Estate, Rental & Leasing | 0 (0.0%) | 22 (100.0%) |
| Professional & Scientific | 0 (0.0%) | 6 (100.0%) |
| Enterprise Management | 0 (0.0%) | 0 (0.0%) |
| Administrative & Support | 63 (69.2%) | 28 (30.8%) |
| Educational Services | 0 (0.0%) | 48 (100.0%) |
| Health Care & Social Assistance | 5 (3.4%) | 144 (96.6%) |
| Arts, Entertainment & Recreation | 5 (100.0%) | 0 (0.0%) |
| Accommodation & Food Services | 82 (41.4%) | 116 (58.6%) |
| Public Administration | 0 (0.0%) | 0 (0.0%) |
| Total | 485 (47.7%) | 532 (52.3%) |
Education in Jonesville
School Enrollment in Jonesville
The most common levels of schooling among the 617 students in Jonesville are high school (191 | 31.0%), college / undergraduate (154 | 25.0%), and elementary school (126 | 20.4%).
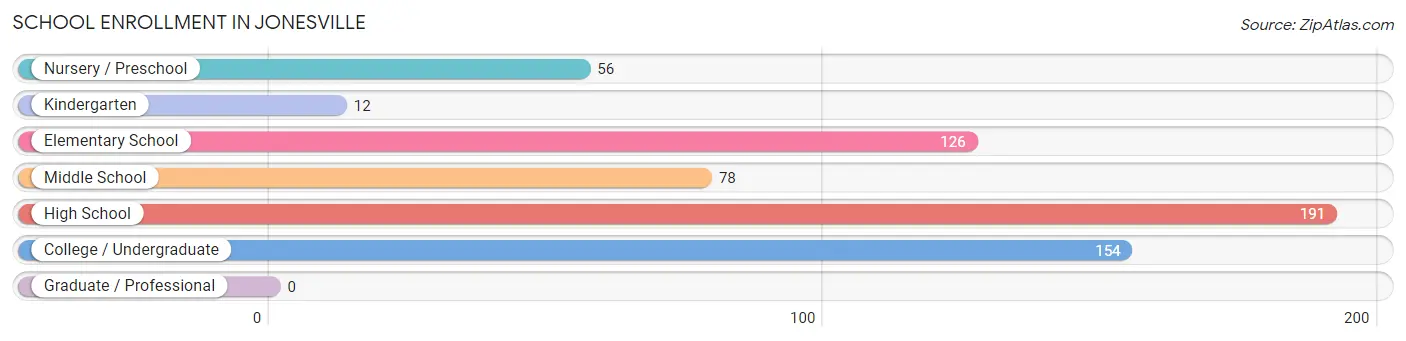
| School Level | # Students | % Students |
| Nursery / Preschool | 56 | 9.1% |
| Kindergarten | 12 | 1.9% |
| Elementary School | 126 | 20.4% |
| Middle School | 78 | 12.6% |
| High School | 191 | 31.0% |
| College / Undergraduate | 154 | 25.0% |
| Graduate / Professional | 0 | 0.0% |
| Total | 617 | 100.0% |
School Enrollment by Age by Funding Source in Jonesville
Out of a total of 617 students who are enrolled in schools in Jonesville, 72 (11.7%) attend a private institution, while the remaining 545 (88.3%) are enrolled in public schools. The age group of 35 years and over has the highest likelihood of being enrolled in private schools, with 15 (100.0% in the age bracket) enrolled. Conversely, the age group of 5 to 9 year old has the lowest likelihood of being enrolled in a private school, with 94 (100.0% in the age bracket) attending a public institution.
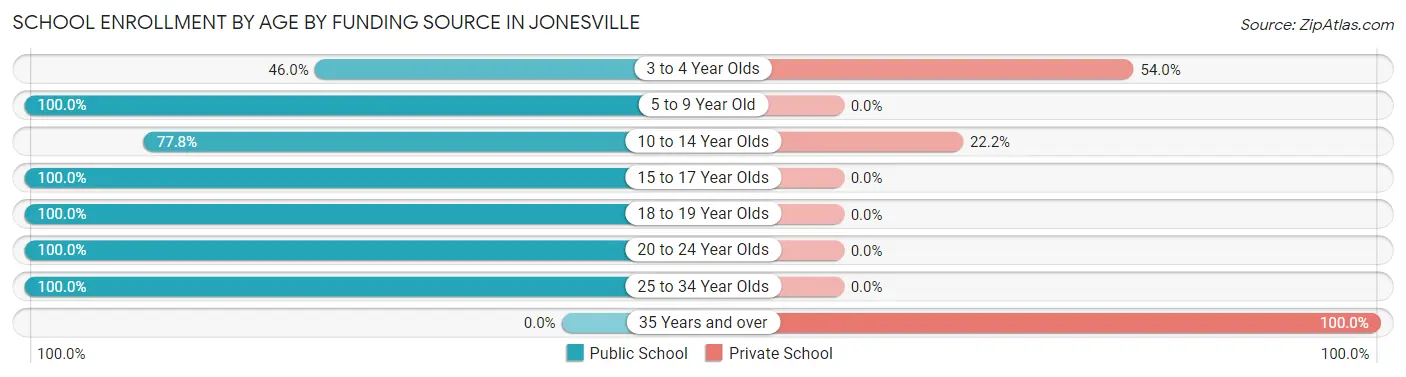
| Age Bracket | Public School | Private School |
| 3 to 4 Year Olds | 23 (46.0%) | 27 (54.0%) |
| 5 to 9 Year Old | 94 (100.0%) | 0 (0.0%) |
| 10 to 14 Year Olds | 105 (77.8%) | 30 (22.2%) |
| 15 to 17 Year Olds | 147 (100.0%) | 0 (0.0%) |
| 18 to 19 Year Olds | 48 (100.0%) | 0 (0.0%) |
| 20 to 24 Year Olds | 76 (100.0%) | 0 (0.0%) |
| 25 to 34 Year Olds | 52 (100.0%) | 0 (0.0%) |
| 35 Years and over | 0 (0.0%) | 15 (100.0%) |
| Total | 545 (88.3%) | 72 (11.7%) |
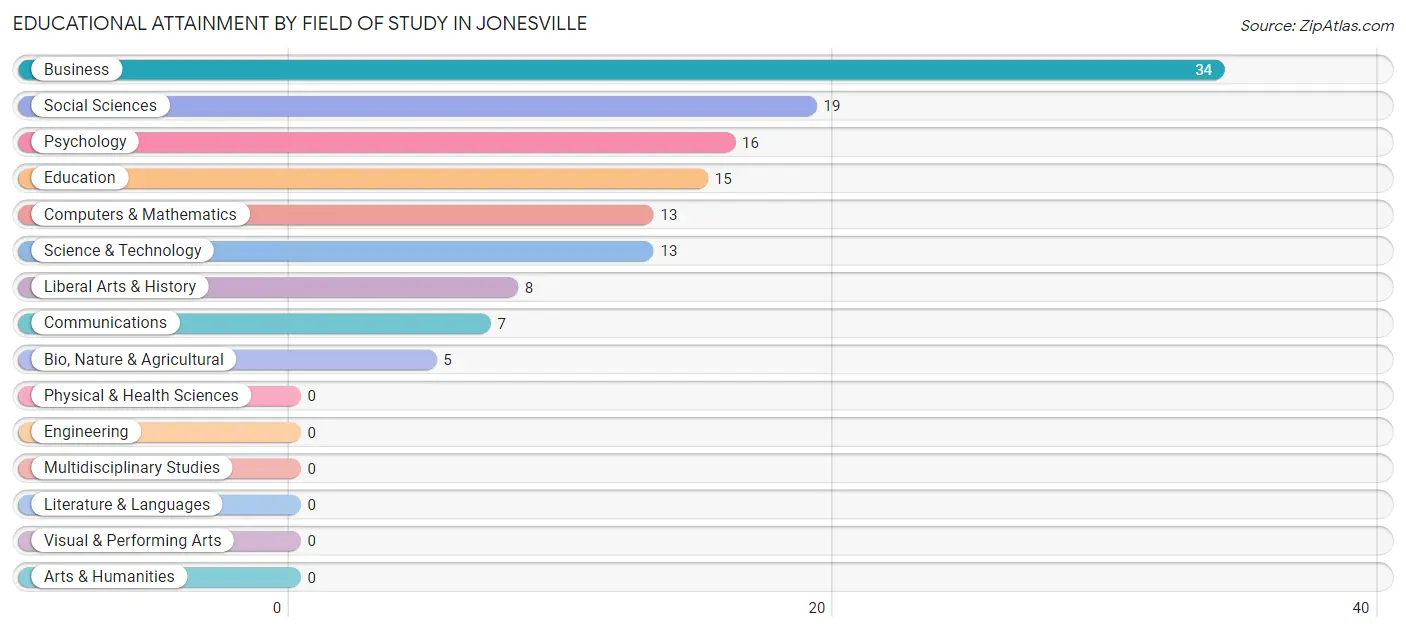
Educational Attainment by Field of Study in Jonesville
Business (34 | 26.2%), social sciences (19 | 14.6%), psychology (16 | 12.3%), education (15 | 11.5%), and computers & mathematics (13 | 10.0%) are the most common fields of study among 130 individuals in Jonesville who have obtained a bachelor's degree or higher.
| Field of Study | # Graduates | % Graduates |
| Computers & Mathematics | 13 | 10.0% |
| Bio, Nature & Agricultural | 5 | 3.8% |
| Physical & Health Sciences | 0 | 0.0% |
| Psychology | 16 | 12.3% |
| Social Sciences | 19 | 14.6% |
| Engineering | 0 | 0.0% |
| Multidisciplinary Studies | 0 | 0.0% |
| Science & Technology | 13 | 10.0% |
| Business | 34 | 26.2% |
| Education | 15 | 11.5% |
| Literature & Languages | 0 | 0.0% |
| Liberal Arts & History | 8 | 6.1% |
| Visual & Performing Arts | 0 | 0.0% |
| Communications | 7 | 5.4% |
| Arts & Humanities | 0 | 0.0% |
| Total | 130 | 100.0% |
Transportation & Commute in Jonesville
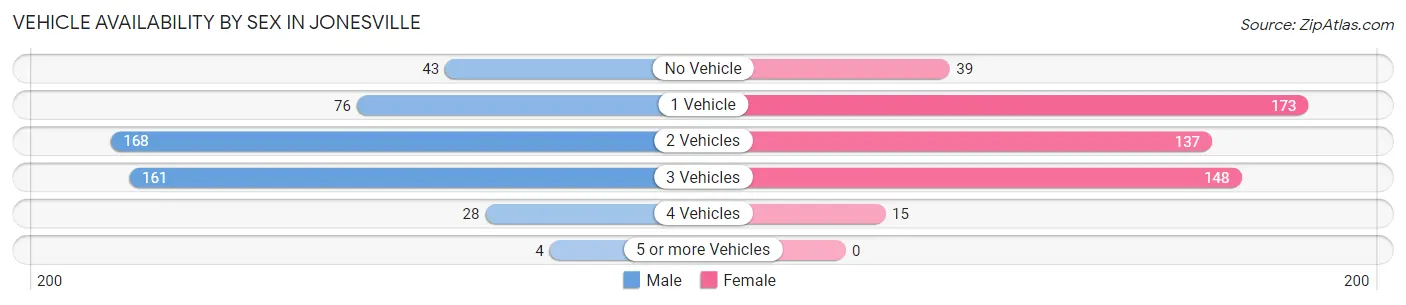
Vehicle Availability by Sex in Jonesville
The most prevalent vehicle ownership categories in Jonesville are males with 2 vehicles (168, accounting for 35.0%) and females with 2 vehicles (137, making up 32.8%).
| Vehicles Available | Male | Female |
| No Vehicle | 43 (9.0%) | 39 (7.6%) |
| 1 Vehicle | 76 (15.8%) | 173 (33.8%) |
| 2 Vehicles | 168 (35.0%) | 137 (26.8%) |
| 3 Vehicles | 161 (33.5%) | 148 (28.9%) |
| 4 Vehicles | 28 (5.8%) | 15 (2.9%) |
| 5 or more Vehicles | 4 (0.8%) | 0 (0.0%) |
| Total | 480 (100.0%) | 512 (100.0%) |
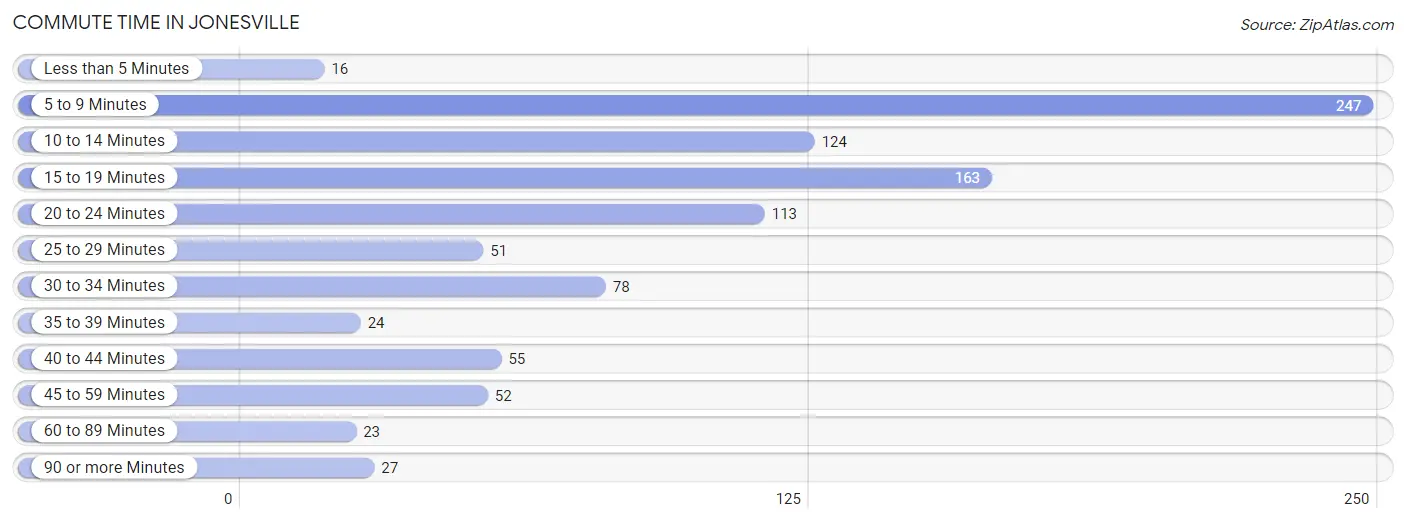
Commute Time in Jonesville
The most frequently occuring commute durations in Jonesville are 5 to 9 minutes (247 commuters, 25.4%), 15 to 19 minutes (163 commuters, 16.8%), and 10 to 14 minutes (124 commuters, 12.7%).
| Commute Time | # Commuters | % Commuters |
| Less than 5 Minutes | 16 | 1.6% |
| 5 to 9 Minutes | 247 | 25.4% |
| 10 to 14 Minutes | 124 | 12.7% |
| 15 to 19 Minutes | 163 | 16.8% |
| 20 to 24 Minutes | 113 | 11.6% |
| 25 to 29 Minutes | 51 | 5.2% |
| 30 to 34 Minutes | 78 | 8.0% |
| 35 to 39 Minutes | 24 | 2.5% |
| 40 to 44 Minutes | 55 | 5.7% |
| 45 to 59 Minutes | 52 | 5.3% |
| 60 to 89 Minutes | 23 | 2.4% |
| 90 or more Minutes | 27 | 2.8% |
Commute Time by Sex in Jonesville
The most common commute times in Jonesville are 5 to 9 minutes (117 commuters, 25.0%) for males and 5 to 9 minutes (130 commuters, 25.7%) for females.
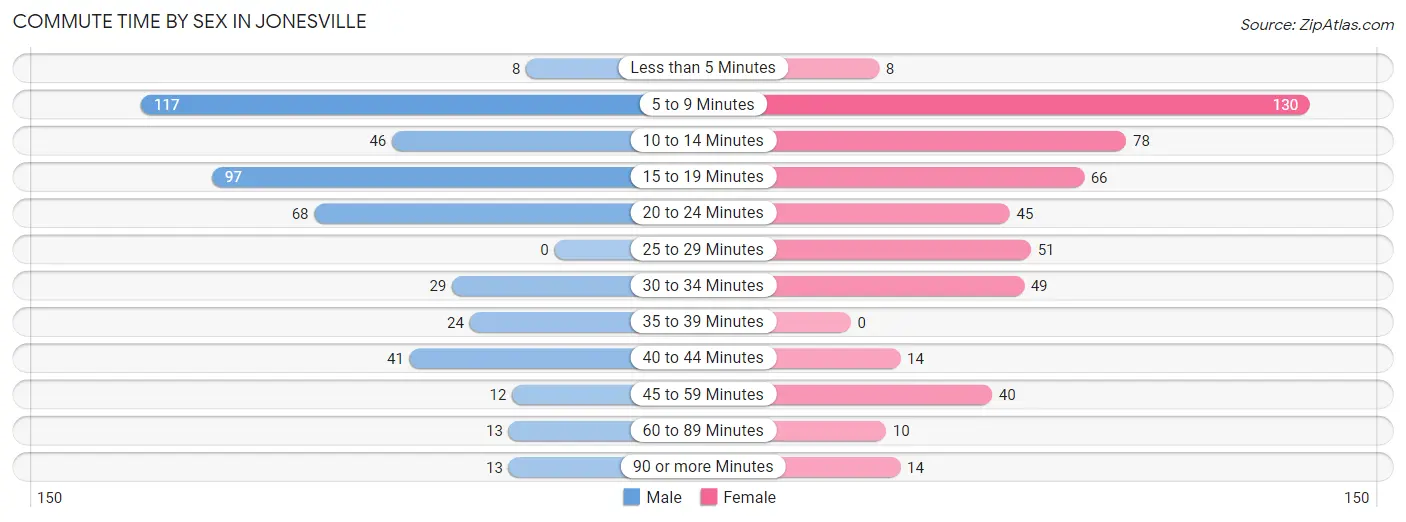
| Commute Time | Male | Female |
| Less than 5 Minutes | 8 (1.7%) | 8 (1.6%) |
| 5 to 9 Minutes | 117 (25.0%) | 130 (25.7%) |
| 10 to 14 Minutes | 46 (9.8%) | 78 (15.4%) |
| 15 to 19 Minutes | 97 (20.7%) | 66 (13.1%) |
| 20 to 24 Minutes | 68 (14.5%) | 45 (8.9%) |
| 25 to 29 Minutes | 0 (0.0%) | 51 (10.1%) |
| 30 to 34 Minutes | 29 (6.2%) | 49 (9.7%) |
| 35 to 39 Minutes | 24 (5.1%) | 0 (0.0%) |
| 40 to 44 Minutes | 41 (8.8%) | 14 (2.8%) |
| 45 to 59 Minutes | 12 (2.6%) | 40 (7.9%) |
| 60 to 89 Minutes | 13 (2.8%) | 10 (2.0%) |
| 90 or more Minutes | 13 (2.8%) | 14 (2.8%) |
Time of Departure to Work by Sex in Jonesville
The most frequent times of departure to work in Jonesville are 4:00 PM to 11:59 PM (161, 34.4%) for males and 4:00 PM to 11:59 PM (116, 23.0%) for females.
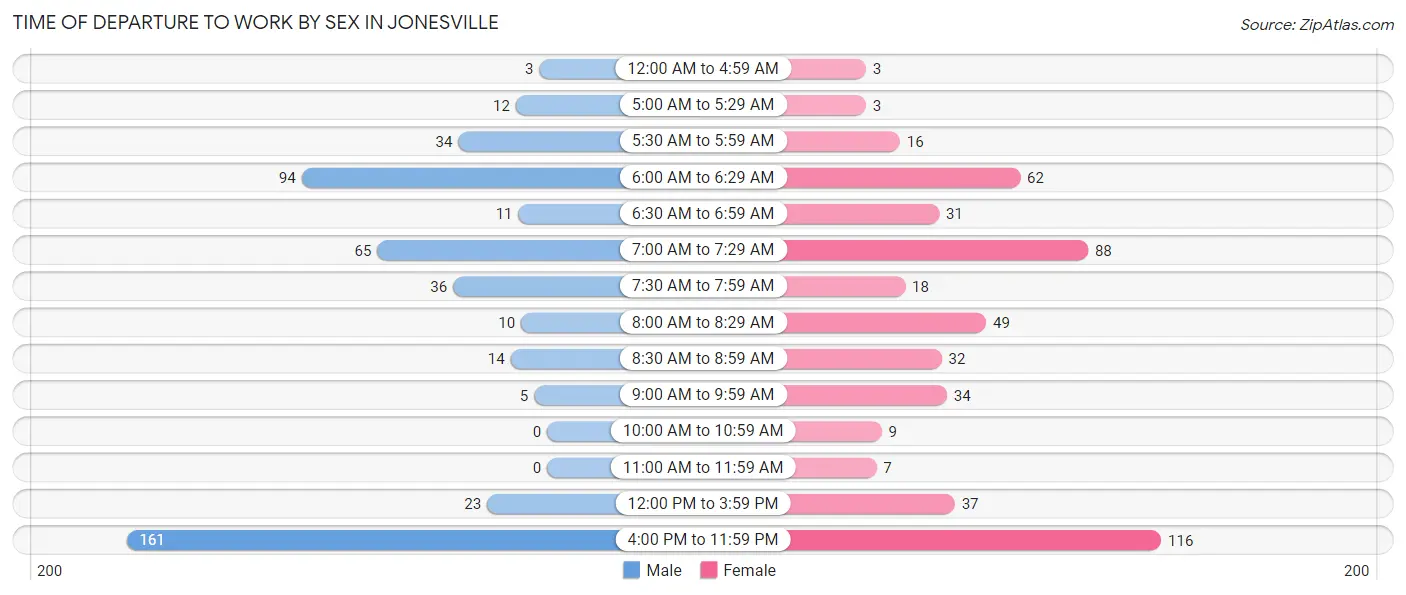
| Time of Departure | Male | Female |
| 12:00 AM to 4:59 AM | 3 (0.6%) | 3 (0.6%) |
| 5:00 AM to 5:29 AM | 12 (2.6%) | 3 (0.6%) |
| 5:30 AM to 5:59 AM | 34 (7.3%) | 16 (3.2%) |
| 6:00 AM to 6:29 AM | 94 (20.1%) | 62 (12.3%) |
| 6:30 AM to 6:59 AM | 11 (2.4%) | 31 (6.1%) |
| 7:00 AM to 7:29 AM | 65 (13.9%) | 88 (17.4%) |
| 7:30 AM to 7:59 AM | 36 (7.7%) | 18 (3.6%) |
| 8:00 AM to 8:29 AM | 10 (2.1%) | 49 (9.7%) |
| 8:30 AM to 8:59 AM | 14 (3.0%) | 32 (6.3%) |
| 9:00 AM to 9:59 AM | 5 (1.1%) | 34 (6.7%) |
| 10:00 AM to 10:59 AM | 0 (0.0%) | 9 (1.8%) |
| 11:00 AM to 11:59 AM | 0 (0.0%) | 7 (1.4%) |
| 12:00 PM to 3:59 PM | 23 (4.9%) | 37 (7.3%) |
| 4:00 PM to 11:59 PM | 161 (34.4%) | 116 (23.0%) |
| Total | 468 (100.0%) | 505 (100.0%) |
Housing Occupancy in Jonesville
Occupancy by Ownership in Jonesville
Of the total 1,250 dwellings in Jonesville, owner-occupied units account for 581 (46.5%), while renter-occupied units make up 669 (53.5%).
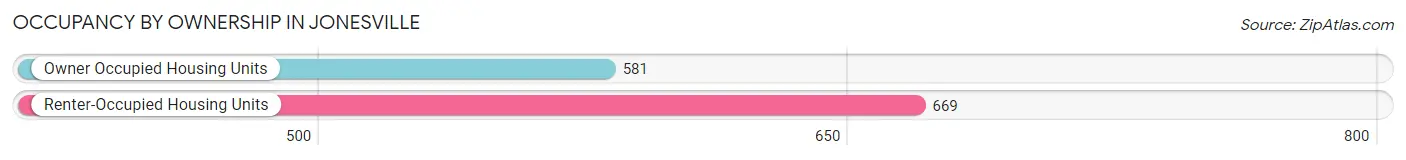
| Occupancy | # Housing Units | % Housing Units |
| Owner Occupied Housing Units | 581 | 46.5% |
| Renter-Occupied Housing Units | 669 | 53.5% |
| Total Occupied Housing Units | 1,250 | 100.0% |
Occupancy by Household Size in Jonesville
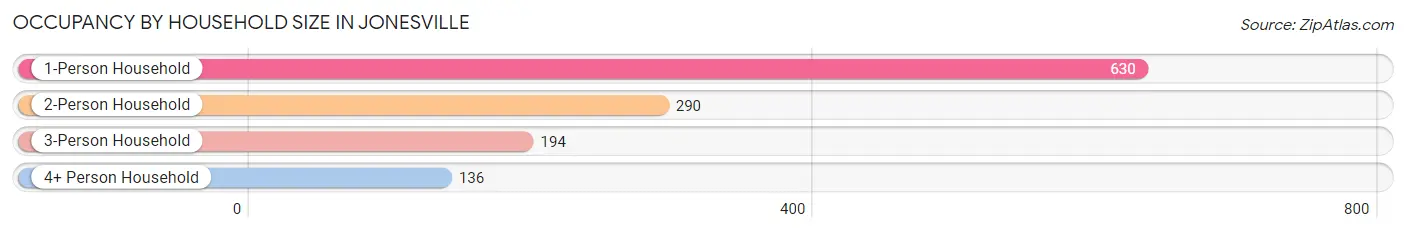
| Household Size | # Housing Units | % Housing Units |
| 1-Person Household | 630 | 50.4% |
| 2-Person Household | 290 | 23.2% |
| 3-Person Household | 194 | 15.5% |
| 4+ Person Household | 136 | 10.9% |
| Total Housing Units | 1,250 | 100.0% |
Occupancy by Ownership by Household Size in Jonesville
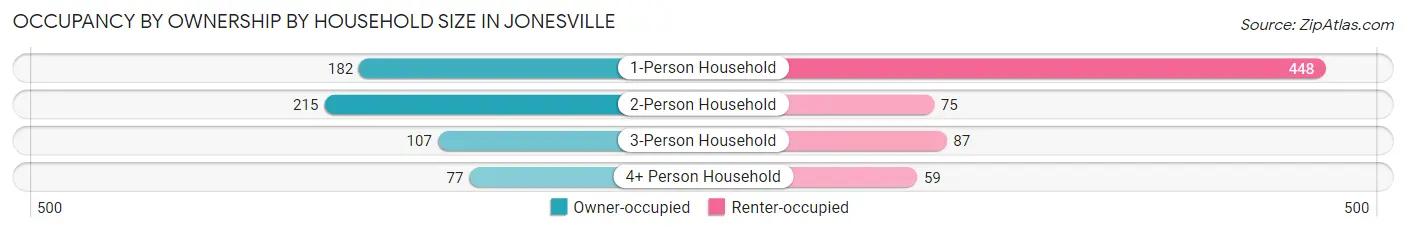
| Household Size | Owner-occupied | Renter-occupied |
| 1-Person Household | 182 (28.9%) | 448 (71.1%) |
| 2-Person Household | 215 (74.1%) | 75 (25.9%) |
| 3-Person Household | 107 (55.1%) | 87 (44.9%) |
| 4+ Person Household | 77 (56.6%) | 59 (43.4%) |
| Total Housing Units | 581 (46.5%) | 669 (53.5%) |
Occupancy by Educational Attainment in Jonesville
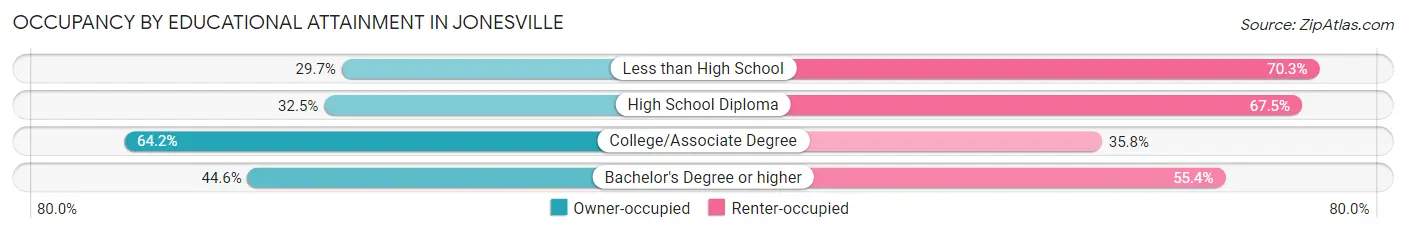
| Household Size | Owner-occupied | Renter-occupied |
| Less than High School | 41 (29.7%) | 97 (70.3%) |
| High School Diploma | 167 (32.5%) | 347 (67.5%) |
| College/Associate Degree | 348 (64.2%) | 194 (35.8%) |
| Bachelor's Degree or higher | 25 (44.6%) | 31 (55.4%) |
Occupancy by Age of Householder in Jonesville
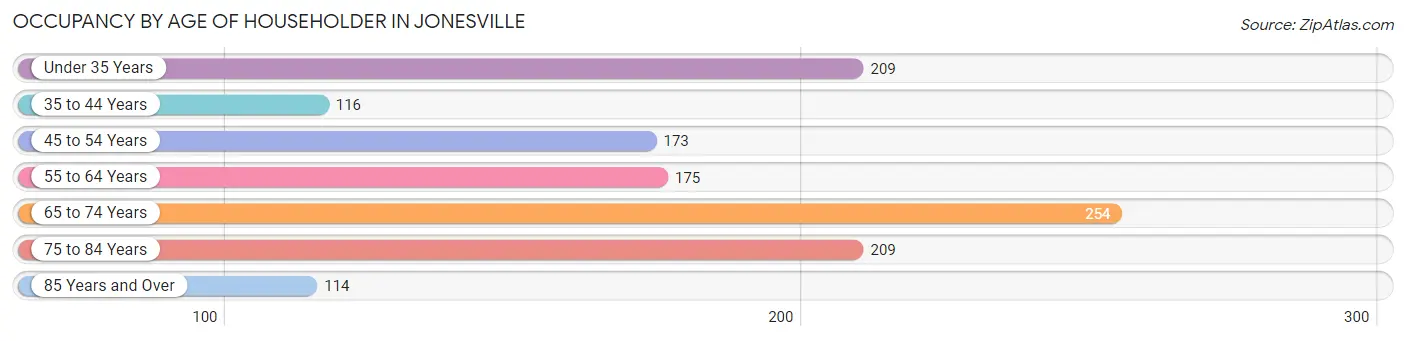
| Age Bracket | # Households | % Households |
| Under 35 Years | 209 | 16.7% |
| 35 to 44 Years | 116 | 9.3% |
| 45 to 54 Years | 173 | 13.8% |
| 55 to 64 Years | 175 | 14.0% |
| 65 to 74 Years | 254 | 20.3% |
| 75 to 84 Years | 209 | 16.7% |
| 85 Years and Over | 114 | 9.1% |
| Total | 1,250 | 100.0% |
Housing Finances in Jonesville
Median Income by Occupancy in Jonesville
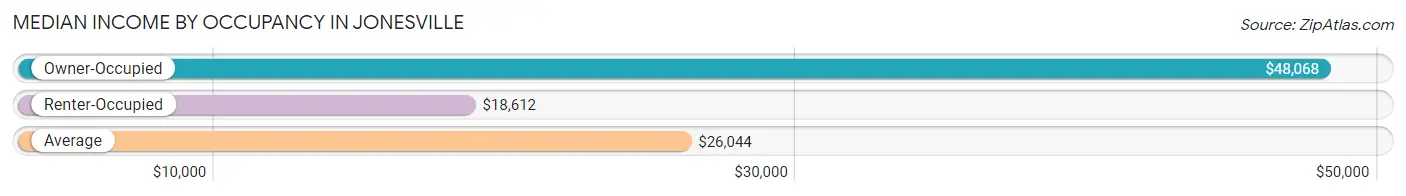
| Occupancy Type | # Households | Median Income |
| Owner-Occupied | 581 (46.5%) | $48,068 |
| Renter-Occupied | 669 (53.5%) | $18,612 |
| Average | 1,250 (100.0%) | $26,044 |
Occupancy by Householder Income Bracket in Jonesville
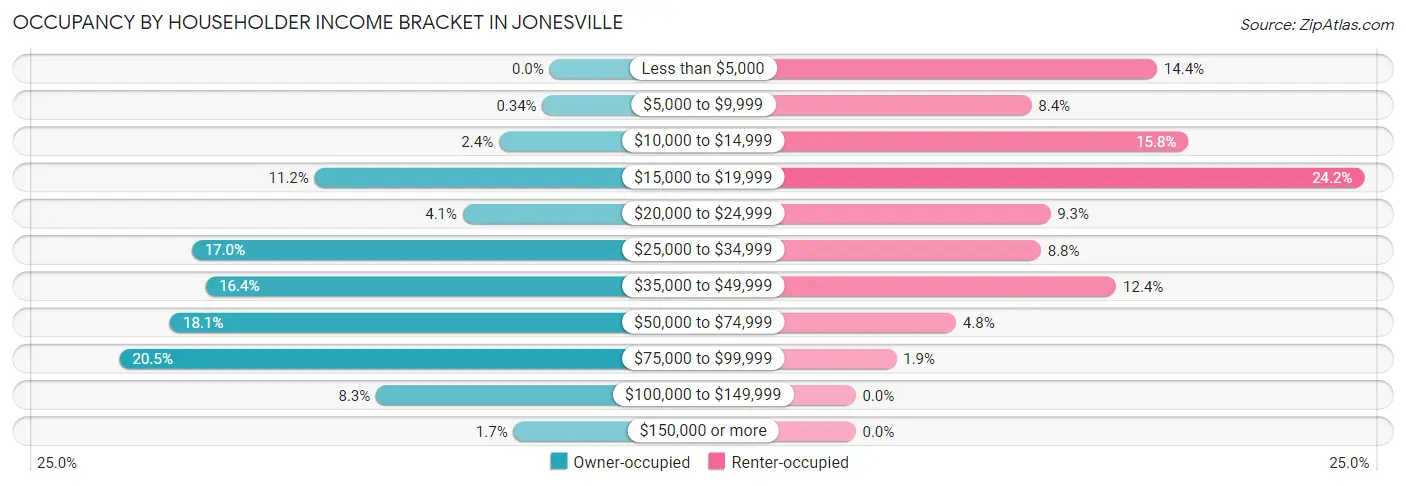
| Income Bracket | Owner-occupied | Renter-occupied |
| Less than $5,000 | 0 (0.0%) | 96 (14.3%) |
| $5,000 to $9,999 | 2 (0.3%) | 56 (8.4%) |
| $10,000 to $14,999 | 14 (2.4%) | 106 (15.8%) |
| $15,000 to $19,999 | 65 (11.2%) | 162 (24.2%) |
| $20,000 to $24,999 | 24 (4.1%) | 62 (9.3%) |
| $25,000 to $34,999 | 99 (17.0%) | 59 (8.8%) |
| $35,000 to $49,999 | 95 (16.4%) | 83 (12.4%) |
| $50,000 to $74,999 | 105 (18.1%) | 32 (4.8%) |
| $75,000 to $99,999 | 119 (20.5%) | 13 (1.9%) |
| $100,000 to $149,999 | 48 (8.3%) | 0 (0.0%) |
| $150,000 or more | 10 (1.7%) | 0 (0.0%) |
| Total | 581 (100.0%) | 669 (100.0%) |
Monthly Housing Cost Tiers in Jonesville
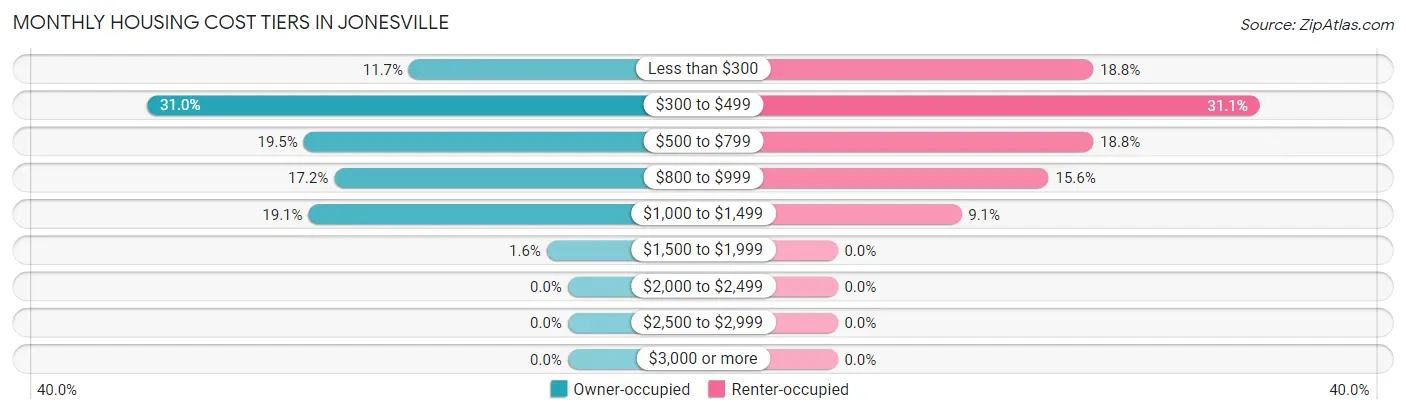
| Monthly Cost | Owner-occupied | Renter-occupied |
| Less than $300 | 68 (11.7%) | 126 (18.8%) |
| $300 to $499 | 180 (31.0%) | 208 (31.1%) |
| $500 to $799 | 113 (19.5%) | 126 (18.8%) |
| $800 to $999 | 100 (17.2%) | 104 (15.5%) |
| $1,000 to $1,499 | 111 (19.1%) | 61 (9.1%) |
| $1,500 to $1,999 | 9 (1.5%) | 0 (0.0%) |
| $2,000 to $2,499 | 0 (0.0%) | 0 (0.0%) |
| $2,500 to $2,999 | 0 (0.0%) | 0 (0.0%) |
| $3,000 or more | 0 (0.0%) | 0 (0.0%) |
| Total | 581 (100.0%) | 669 (100.0%) |
Physical Housing Characteristics in Jonesville
Housing Structures in Jonesville
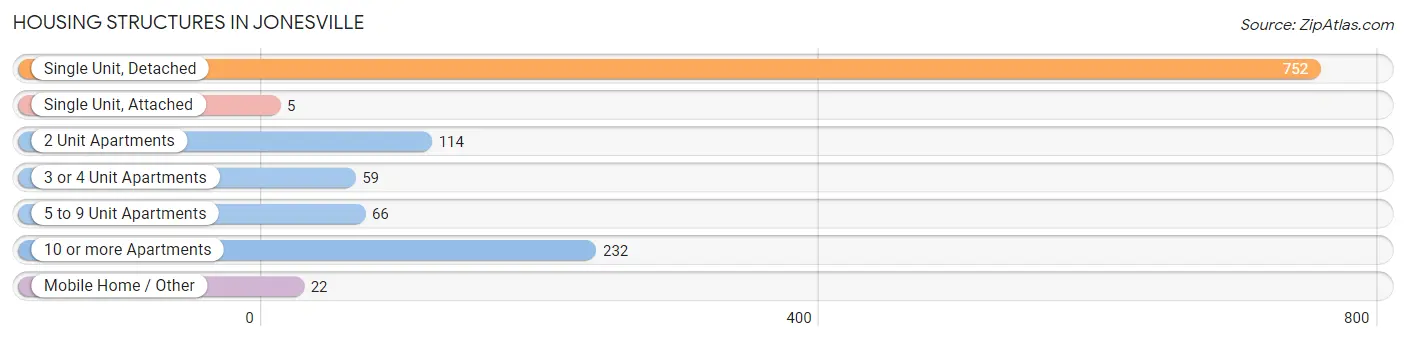
| Structure Type | # Housing Units | % Housing Units |
| Single Unit, Detached | 752 | 60.2% |
| Single Unit, Attached | 5 | 0.4% |
| 2 Unit Apartments | 114 | 9.1% |
| 3 or 4 Unit Apartments | 59 | 4.7% |
| 5 to 9 Unit Apartments | 66 | 5.3% |
| 10 or more Apartments | 232 | 18.6% |
| Mobile Home / Other | 22 | 1.8% |
| Total | 1,250 | 100.0% |
Housing Structures by Occupancy in Jonesville
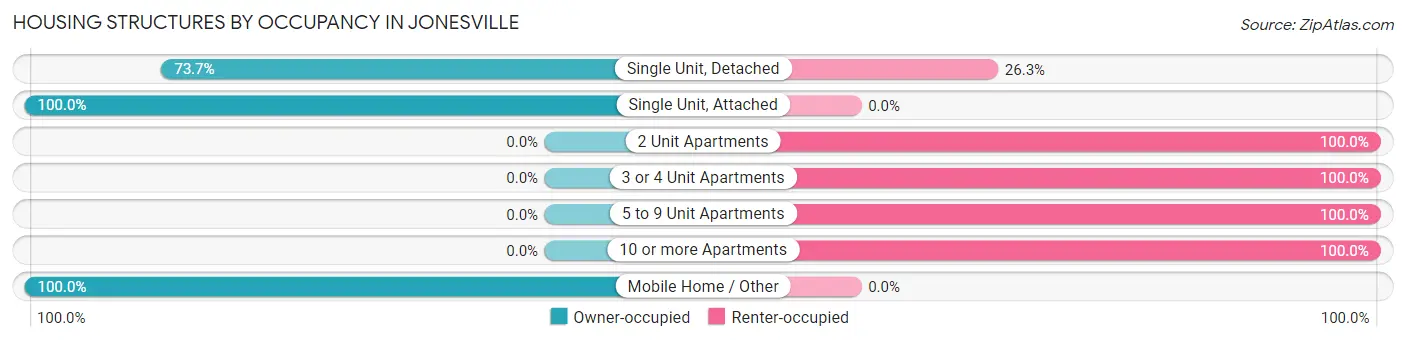
| Structure Type | Owner-occupied | Renter-occupied |
| Single Unit, Detached | 554 (73.7%) | 198 (26.3%) |
| Single Unit, Attached | 5 (100.0%) | 0 (0.0%) |
| 2 Unit Apartments | 0 (0.0%) | 114 (100.0%) |
| 3 or 4 Unit Apartments | 0 (0.0%) | 59 (100.0%) |
| 5 to 9 Unit Apartments | 0 (0.0%) | 66 (100.0%) |
| 10 or more Apartments | 0 (0.0%) | 232 (100.0%) |
| Mobile Home / Other | 22 (100.0%) | 0 (0.0%) |
| Total | 581 (46.5%) | 669 (53.5%) |
Housing Structures by Number of Rooms in Jonesville
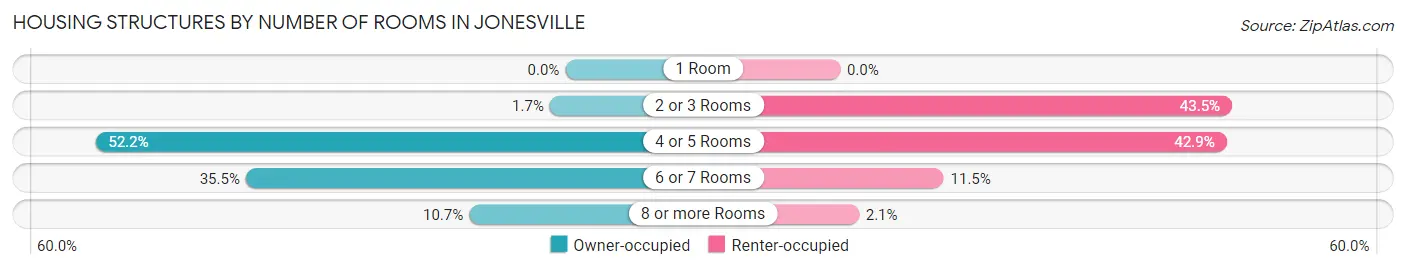
| Number of Rooms | Owner-occupied | Renter-occupied |
| 1 Room | 0 (0.0%) | 0 (0.0%) |
| 2 or 3 Rooms | 10 (1.7%) | 291 (43.5%) |
| 4 or 5 Rooms | 303 (52.1%) | 287 (42.9%) |
| 6 or 7 Rooms | 206 (35.5%) | 77 (11.5%) |
| 8 or more Rooms | 62 (10.7%) | 14 (2.1%) |
| Total | 581 (100.0%) | 669 (100.0%) |
Housing Structure by Heating Type in Jonesville
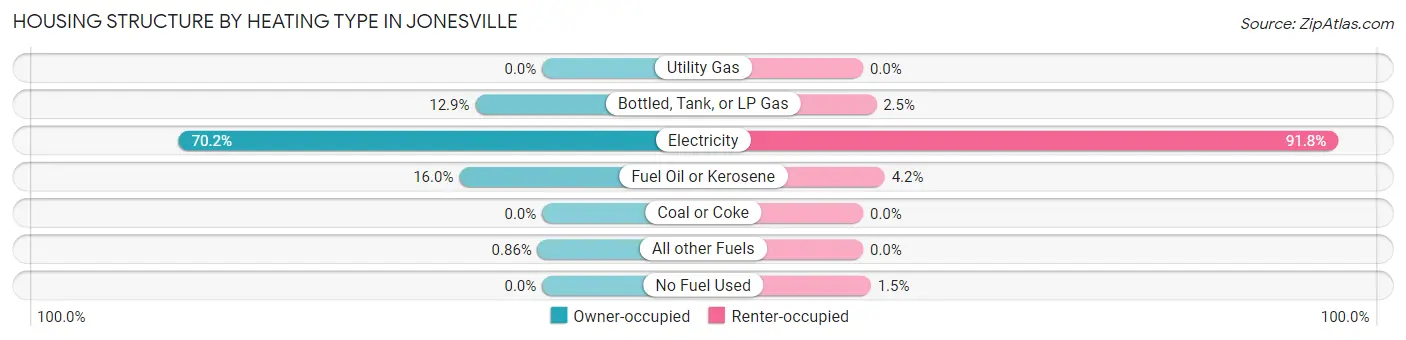
| Heating Type | Owner-occupied | Renter-occupied |
| Utility Gas | 0 (0.0%) | 0 (0.0%) |
| Bottled, Tank, or LP Gas | 75 (12.9%) | 17 (2.5%) |
| Electricity | 408 (70.2%) | 614 (91.8%) |
| Fuel Oil or Kerosene | 93 (16.0%) | 28 (4.2%) |
| Coal or Coke | 0 (0.0%) | 0 (0.0%) |
| All other Fuels | 5 (0.9%) | 0 (0.0%) |
| No Fuel Used | 0 (0.0%) | 10 (1.5%) |
| Total | 581 (100.0%) | 669 (100.0%) |
Household Vehicle Usage in Jonesville
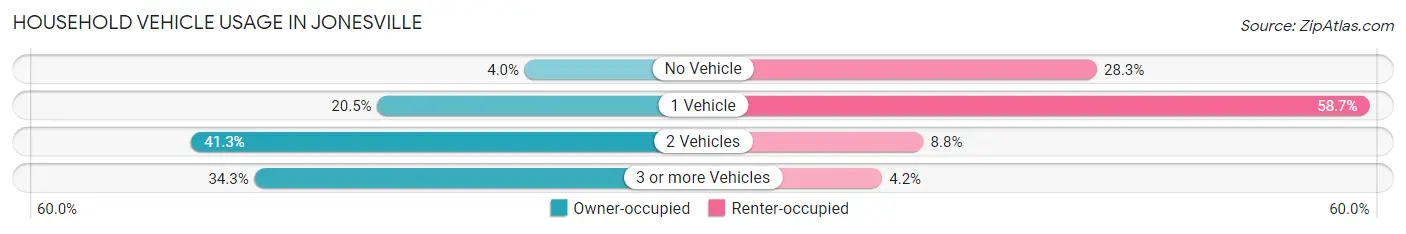
| Vehicles per Household | Owner-occupied | Renter-occupied |
| No Vehicle | 23 (4.0%) | 189 (28.2%) |
| 1 Vehicle | 119 (20.5%) | 393 (58.7%) |
| 2 Vehicles | 240 (41.3%) | 59 (8.8%) |
| 3 or more Vehicles | 199 (34.3%) | 28 (4.2%) |
| Total | 581 (100.0%) | 669 (100.0%) |
Real Estate & Mortgages in Jonesville
Real Estate and Mortgage Overview in Jonesville
| Characteristic | Without Mortgage | With Mortgage |
| Housing Units | 312 | 269 |
| Median Property Value | $111,500 | $122,400 |
| Median Household Income | $33,889 | $4 |
| Monthly Housing Costs | $375 | $0 |
| Real Estate Taxes | $1,164 | $53 |
Property Value by Mortgage Status in Jonesville
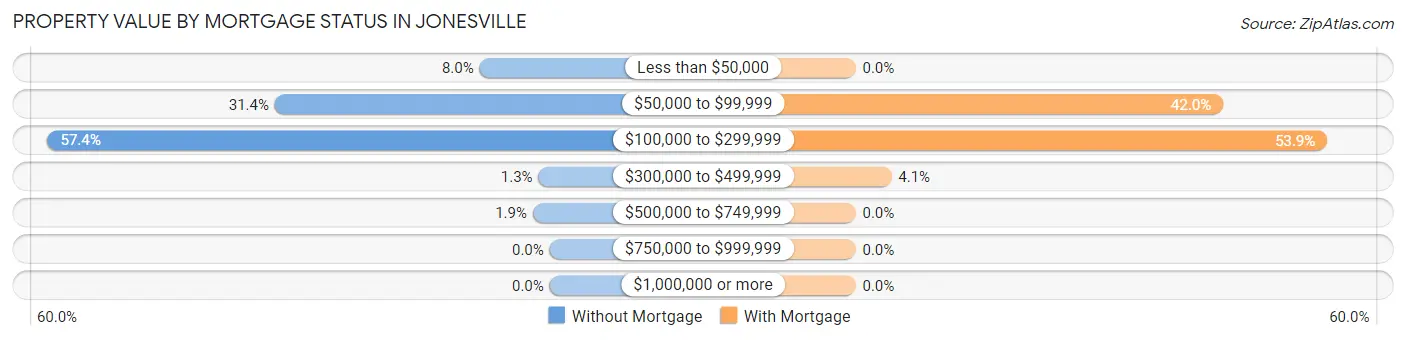
| Property Value | Without Mortgage | With Mortgage |
| Less than $50,000 | 25 (8.0%) | 0 (0.0%) |
| $50,000 to $99,999 | 98 (31.4%) | 113 (42.0%) |
| $100,000 to $299,999 | 179 (57.4%) | 145 (53.9%) |
| $300,000 to $499,999 | 4 (1.3%) | 11 (4.1%) |
| $500,000 to $749,999 | 6 (1.9%) | 0 (0.0%) |
| $750,000 to $999,999 | 0 (0.0%) | 0 (0.0%) |
| $1,000,000 or more | 0 (0.0%) | 0 (0.0%) |
| Total | 312 (100.0%) | 269 (100.0%) |
Household Income by Mortgage Status in Jonesville
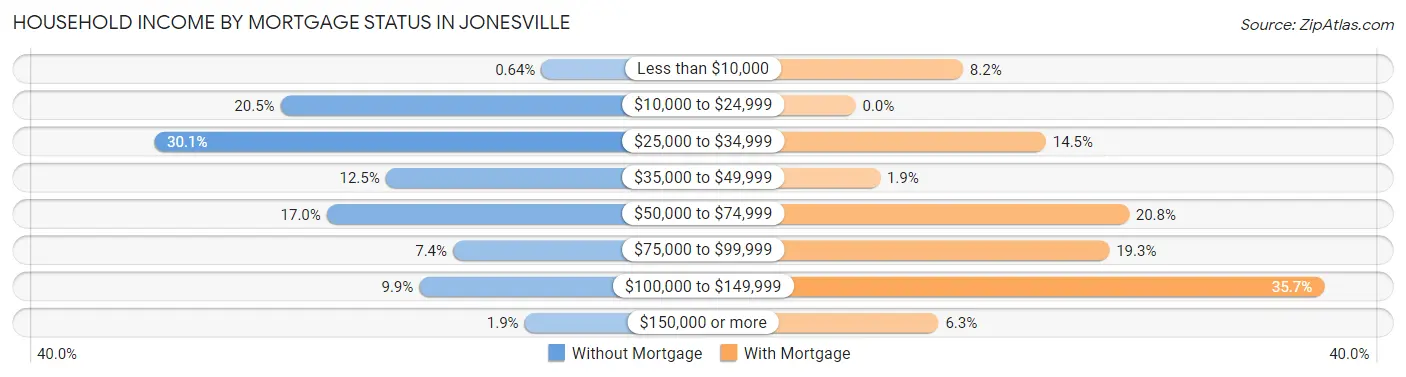
| Household Income | Without Mortgage | With Mortgage |
| Less than $10,000 | 2 (0.6%) | 22 (8.2%) |
| $10,000 to $24,999 | 64 (20.5%) | 0 (0.0%) |
| $25,000 to $34,999 | 94 (30.1%) | 39 (14.5%) |
| $35,000 to $49,999 | 39 (12.5%) | 5 (1.9%) |
| $50,000 to $74,999 | 53 (17.0%) | 56 (20.8%) |
| $75,000 to $99,999 | 23 (7.4%) | 52 (19.3%) |
| $100,000 to $149,999 | 31 (9.9%) | 96 (35.7%) |
| $150,000 or more | 6 (1.9%) | 17 (6.3%) |
| Total | 312 (100.0%) | 269 (100.0%) |
Property Value to Household Income Ratio in Jonesville
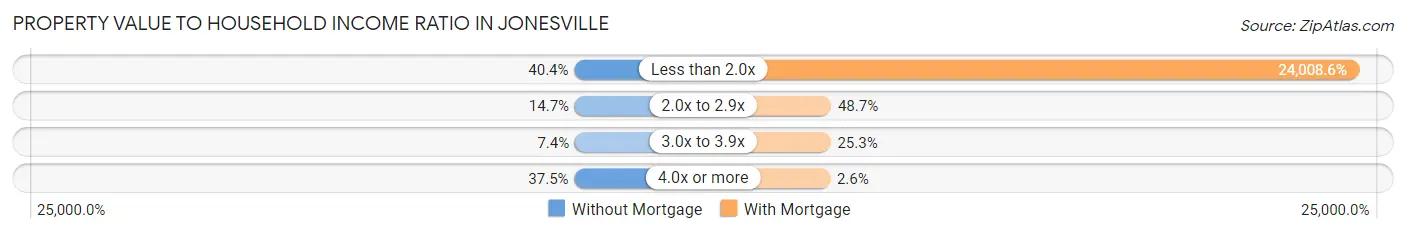
| Value-to-Income Ratio | Without Mortgage | With Mortgage |
| Less than 2.0x | 126 (40.4%) | 64,583 (24,008.5%) |
| 2.0x to 2.9x | 46 (14.7%) | 131 (48.7%) |
| 3.0x to 3.9x | 23 (7.4%) | 68 (25.3%) |
| 4.0x or more | 117 (37.5%) | 7 (2.6%) |
| Total | 312 (100.0%) | 269 (100.0%) |
Real Estate Taxes by Mortgage Status in Jonesville
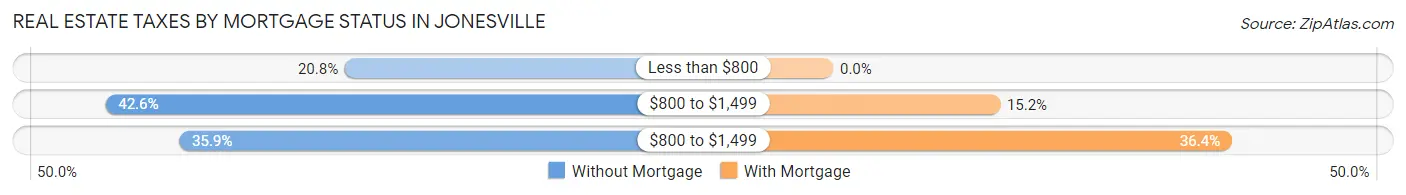
| Property Taxes | Without Mortgage | With Mortgage |
| Less than $800 | 65 (20.8%) | 0 (0.0%) |
| $800 to $1,499 | 133 (42.6%) | 41 (15.2%) |
| $800 to $1,499 | 112 (35.9%) | 98 (36.4%) |
| Total | 312 (100.0%) | 269 (100.0%) |
Health & Disability in Jonesville
Health Insurance Coverage by Age in Jonesville
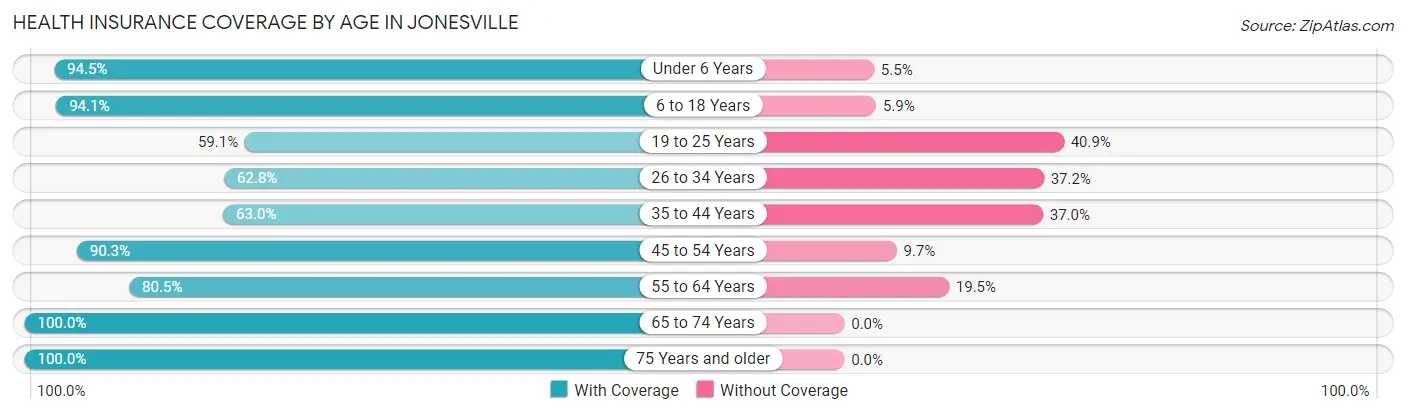
| Age Bracket | With Coverage | Without Coverage |
| Under 6 Years | 137 (94.5%) | 8 (5.5%) |
| 6 to 18 Years | 382 (94.1%) | 24 (5.9%) |
| 19 to 25 Years | 156 (59.1%) | 108 (40.9%) |
| 26 to 34 Years | 223 (62.8%) | 132 (37.2%) |
| 35 to 44 Years | 131 (63.0%) | 77 (37.0%) |
| 45 to 54 Years | 241 (90.3%) | 26 (9.7%) |
| 55 to 64 Years | 194 (80.5%) | 47 (19.5%) |
| 65 to 74 Years | 369 (100.0%) | 0 (0.0%) |
| 75 Years and older | 379 (100.0%) | 0 (0.0%) |
| Total | 2,212 (84.0%) | 422 (16.0%) |
Health Insurance Coverage by Citizenship Status in Jonesville
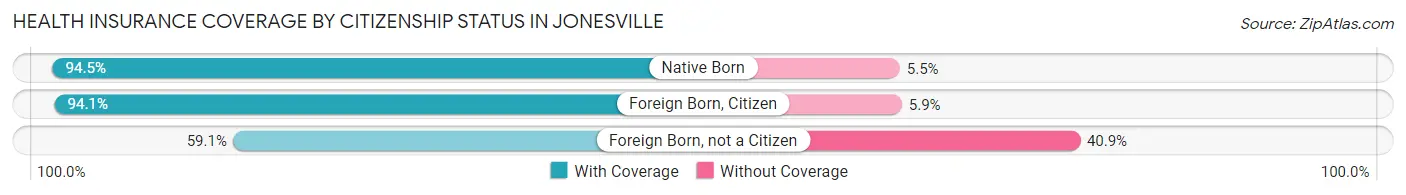
| Citizenship Status | With Coverage | Without Coverage |
| Native Born | 137 (94.5%) | 8 (5.5%) |
| Foreign Born, Citizen | 382 (94.1%) | 24 (5.9%) |
| Foreign Born, not a Citizen | 156 (59.1%) | 108 (40.9%) |
Health Insurance Coverage by Household Income in Jonesville
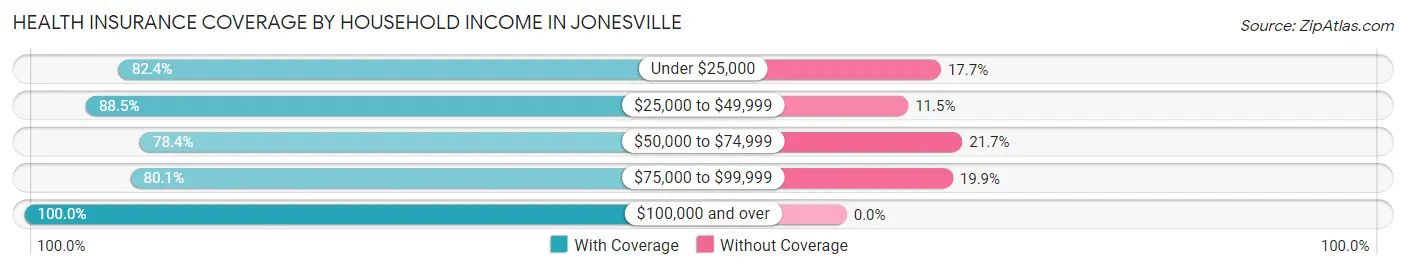
| Household Income | With Coverage | Without Coverage |
| Under $25,000 | 756 (82.4%) | 162 (17.6%) |
| $25,000 to $49,999 | 515 (88.5%) | 67 (11.5%) |
| $50,000 to $74,999 | 362 (78.3%) | 100 (21.6%) |
| $75,000 to $99,999 | 375 (80.1%) | 93 (19.9%) |
| $100,000 and over | 204 (100.0%) | 0 (0.0%) |
Public vs Private Health Insurance Coverage by Age in Jonesville
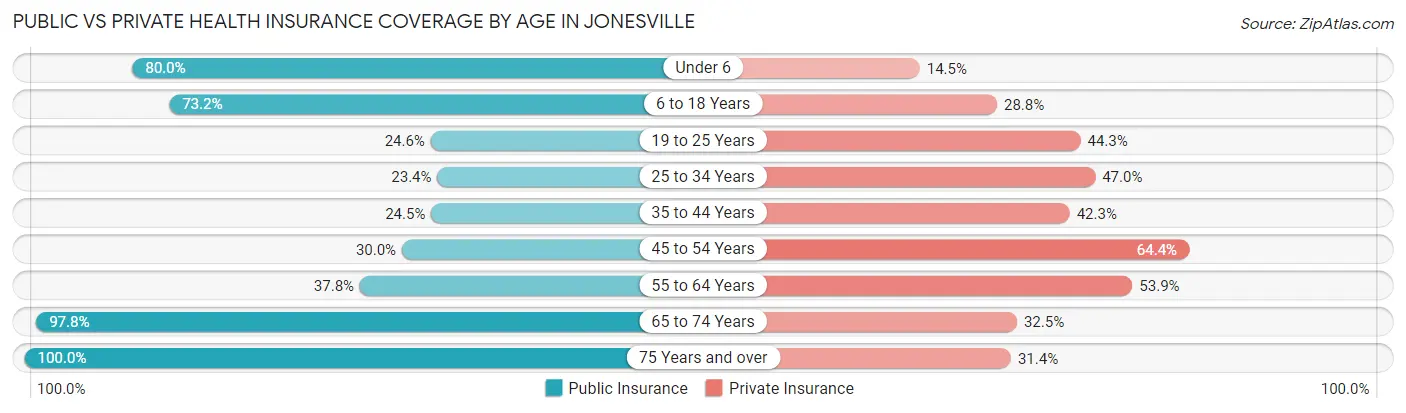
| Age Bracket | Public Insurance | Private Insurance |
| Under 6 | 116 (80.0%) | 21 (14.5%) |
| 6 to 18 Years | 297 (73.2%) | 117 (28.8%) |
| 19 to 25 Years | 65 (24.6%) | 117 (44.3%) |
| 25 to 34 Years | 83 (23.4%) | 167 (47.0%) |
| 35 to 44 Years | 51 (24.5%) | 88 (42.3%) |
| 45 to 54 Years | 80 (30.0%) | 172 (64.4%) |
| 55 to 64 Years | 91 (37.8%) | 130 (53.9%) |
| 65 to 74 Years | 361 (97.8%) | 120 (32.5%) |
| 75 Years and over | 379 (100.0%) | 119 (31.4%) |
| Total | 1,523 (57.8%) | 1,051 (39.9%) |
Disability Status by Sex by Age in Jonesville
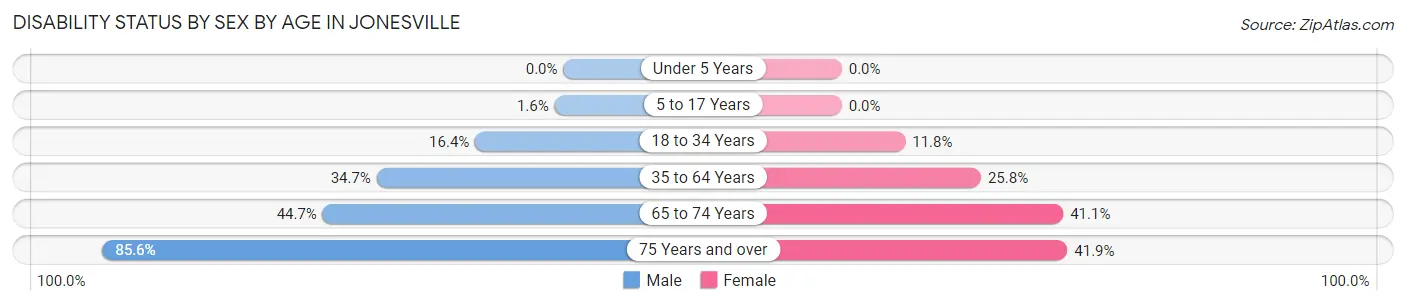
| Age Bracket | Male | Female |
| Under 5 Years | 0 (0.0%) | 0 (0.0%) |
| 5 to 17 Years | 3 (1.6%) | 0 (0.0%) |
| 18 to 34 Years | 55 (16.4%) | 39 (11.8%) |
| 35 to 64 Years | 114 (34.6%) | 100 (25.8%) |
| 65 to 74 Years | 67 (44.7%) | 90 (41.1%) |
| 75 Years and over | 77 (85.6%) | 121 (41.9%) |
Disability Class by Sex by Age in Jonesville
Disability Class: Hearing Difficulty
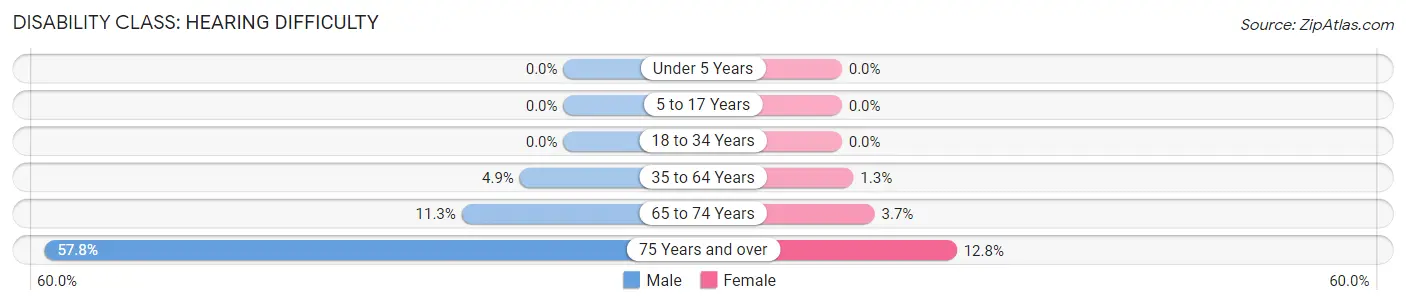
| Age Bracket | Male | Female |
| Under 5 Years | 0 (0.0%) | 0 (0.0%) |
| 5 to 17 Years | 0 (0.0%) | 0 (0.0%) |
| 18 to 34 Years | 0 (0.0%) | 0 (0.0%) |
| 35 to 64 Years | 16 (4.9%) | 5 (1.3%) |
| 65 to 74 Years | 17 (11.3%) | 8 (3.6%) |
| 75 Years and over | 52 (57.8%) | 37 (12.8%) |
Disability Class: Vision Difficulty
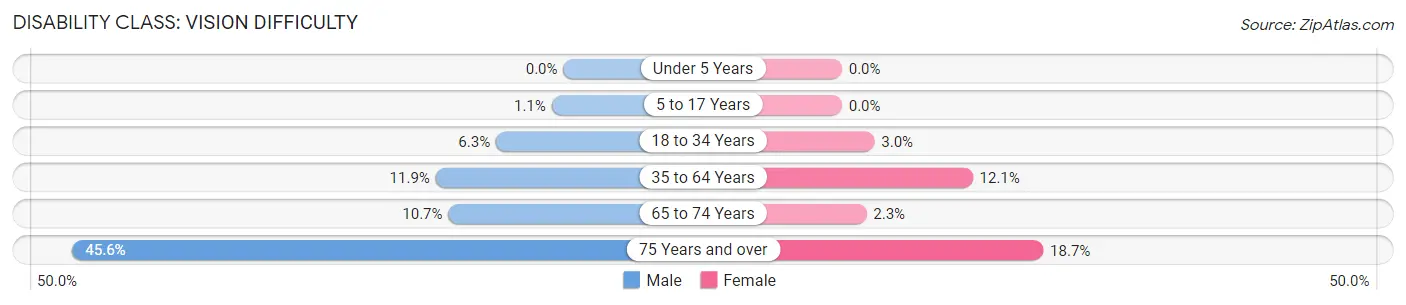
| Age Bracket | Male | Female |
| Under 5 Years | 0 (0.0%) | 0 (0.0%) |
| 5 to 17 Years | 2 (1.1%) | 0 (0.0%) |
| 18 to 34 Years | 21 (6.2%) | 10 (3.0%) |
| 35 to 64 Years | 39 (11.8%) | 47 (12.1%) |
| 65 to 74 Years | 16 (10.7%) | 5 (2.3%) |
| 75 Years and over | 41 (45.6%) | 54 (18.7%) |
Disability Class: Cognitive Difficulty
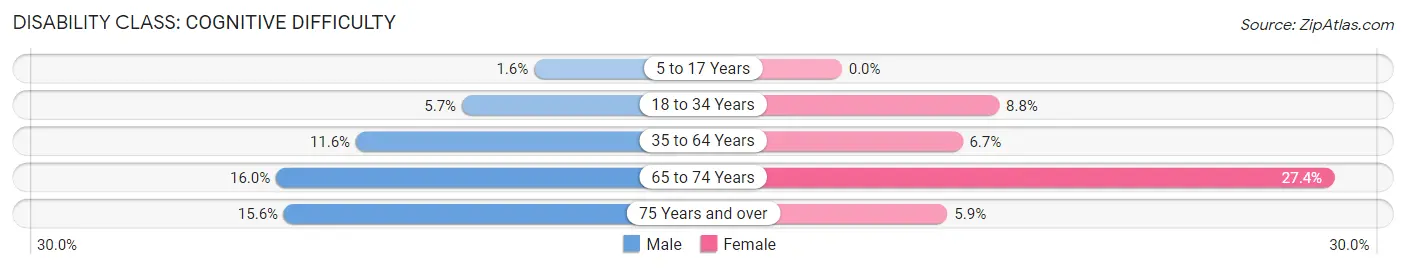
| Age Bracket | Male | Female |
| 5 to 17 Years | 3 (1.6%) | 0 (0.0%) |
| 18 to 34 Years | 19 (5.7%) | 29 (8.8%) |
| 35 to 64 Years | 38 (11.6%) | 26 (6.7%) |
| 65 to 74 Years | 24 (16.0%) | 60 (27.4%) |
| 75 Years and over | 14 (15.6%) | 17 (5.9%) |
Disability Class: Ambulatory Difficulty
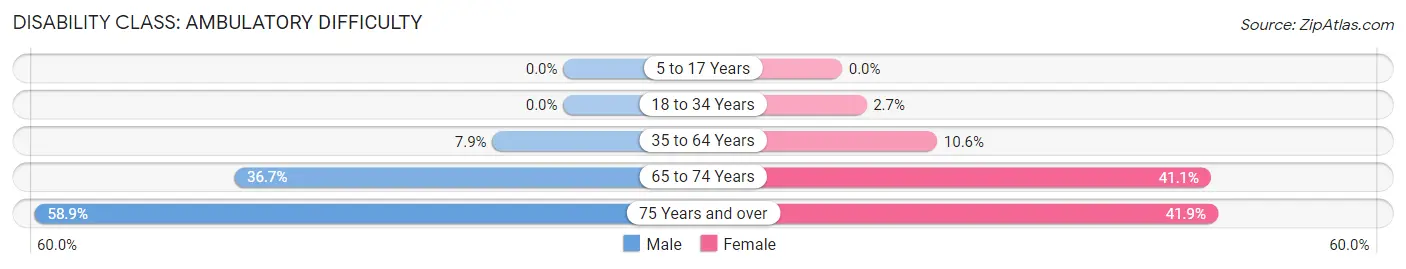
| Age Bracket | Male | Female |
| 5 to 17 Years | 0 (0.0%) | 0 (0.0%) |
| 18 to 34 Years | 0 (0.0%) | 9 (2.7%) |
| 35 to 64 Years | 26 (7.9%) | 41 (10.6%) |
| 65 to 74 Years | 55 (36.7%) | 90 (41.1%) |
| 75 Years and over | 53 (58.9%) | 121 (41.9%) |
Disability Class: Self-Care Difficulty
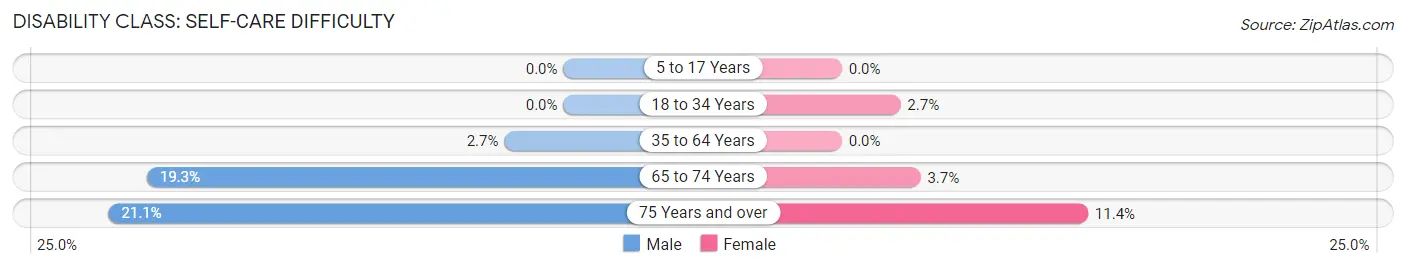
| Age Bracket | Male | Female |
| 5 to 17 Years | 0 (0.0%) | 0 (0.0%) |
| 18 to 34 Years | 0 (0.0%) | 9 (2.7%) |
| 35 to 64 Years | 9 (2.7%) | 0 (0.0%) |
| 65 to 74 Years | 29 (19.3%) | 8 (3.6%) |
| 75 Years and over | 19 (21.1%) | 33 (11.4%) |
Technology Access in Jonesville
Computing Device Access in Jonesville
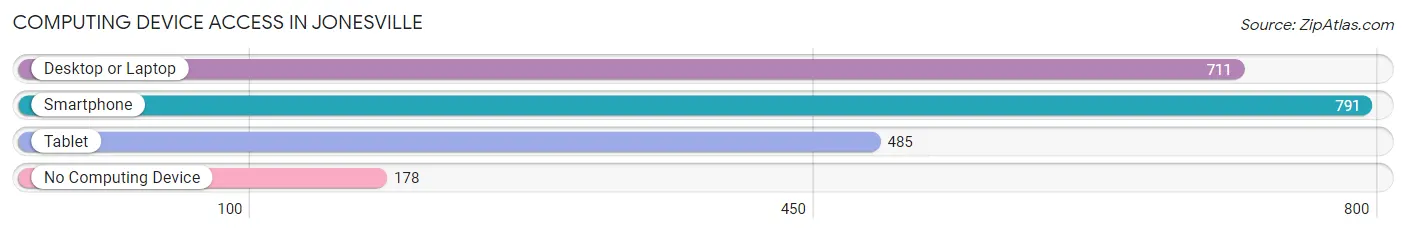
| Device Type | # Households | % Households |
| Desktop or Laptop | 711 | 56.9% |
| Smartphone | 791 | 63.3% |
| Tablet | 485 | 38.8% |
| No Computing Device | 178 | 14.2% |
| Total | 1,250 | 100.0% |
Internet Access in Jonesville
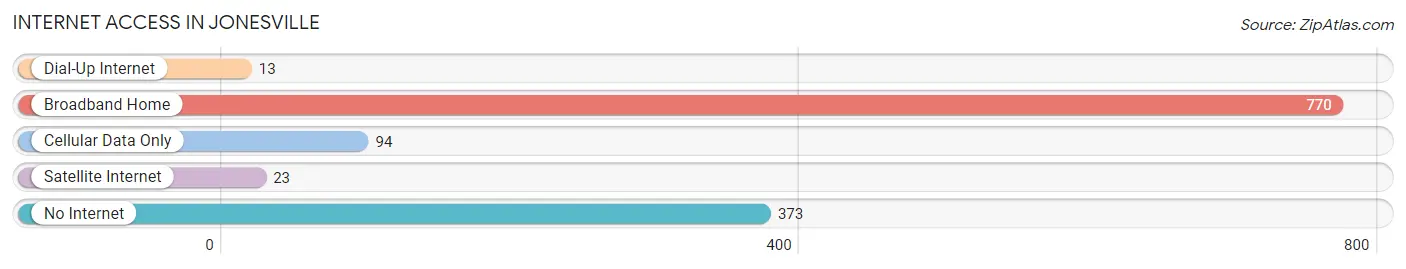
| Internet Type | # Households | % Households |
| Dial-Up Internet | 13 | 1.0% |
| Broadband Home | 770 | 61.6% |
| Cellular Data Only | 94 | 7.5% |
| Satellite Internet | 23 | 1.8% |
| No Internet | 373 | 29.8% |
| Total | 1,250 | 100.0% |
Jonesville Summary
Jonesville is a town located in Yadkin County, North Carolina. It is situated in the foothills of the Blue Ridge Mountains, and is part of the Piedmont Triad region. The town has a population of approximately 1,500 people, and is the county seat of Yadkin County.
History
Jonesville was founded in 1849 by William Jones, a local farmer and businessman. He named the town after himself, and it was incorporated in 1851. The town was originally a small farming community, but it soon grew to become a major center of commerce and industry. The town was home to several mills, including a cotton mill, a grist mill, and a sawmill. The town also had a railroad station, which connected it to other towns in the area.
In the late 19th century, Jonesville became a popular tourist destination. The town was home to several hotels, and it was a popular spot for fishing and hunting. The town also had a thriving music scene, and it was home to several popular bands.
Geography
Jonesville is located in the foothills of the Blue Ridge Mountains, and is part of the Piedmont Triad region. The town is situated at the intersection of US Highway 421 and NC Highway 67. The town is located approximately 25 miles north of Winston-Salem, and is about an hour and a half drive from Charlotte.
The town is situated on the banks of the Yadkin River, and is surrounded by rolling hills and forests. The town is home to several parks, including Jonesville Park, which features a playground, picnic areas, and a walking trail.
Economy
Jonesville’s economy is largely based on agriculture and tourism. The town is home to several farms, and it is a popular destination for fishing and hunting. The town is also home to several small businesses, including restaurants, shops, and a movie theater.
The town is also home to several manufacturing companies, including a furniture factory and a textile mill. The town is also home to several wineries, and it is a popular destination for wine tasting.
Demographics
As of the 2010 census, Jonesville had a population of 1,500 people. The town is predominantly white, with approximately 90% of the population being white. The town also has a small Hispanic population, with approximately 5% of the population being Hispanic. The town also has a small African American population, with approximately 2% of the population being African American.
The median household income in Jonesville is approximately $35,000, and the median home value is approximately $125,000. The town has a low unemployment rate, and the poverty rate is below the national average.
Conclusion
Jonesville is a small town located in Yadkin County, North Carolina. The town has a population of approximately 1,500 people, and is the county seat of Yadkin County. The town was founded in 1849, and it was originally a small farming community. Today, the town’s economy is largely based on agriculture and tourism, and it is a popular destination for fishing and hunting. The town is predominantly white, with approximately 90% of the population being white. The median household income in Jonesville is approximately $35,000, and the median home value is approximately $125,000.
Common Questions
What is Per Capita Income in Jonesville?
Per Capita income in Jonesville is $20,012.
What is the Median Family Income in Jonesville?
Median Family Income in Jonesville is $46,842.
What is the Median Household income in Jonesville?
Median Household Income in Jonesville is $26,044.
What is Income or Wage Gap in Jonesville?
Income or Wage Gap in Jonesville is 14.2%.
Women in Jonesville earn 85.8 cents for every dollar earned by a man.
What is Inequality or Gini Index in Jonesville?
Inequality or Gini Index in Jonesville is 0.45.
What is the Total Population of Jonesville?
Total Population of Jonesville is 2,634.
What is the Total Male Population of Jonesville?
Total Male Population of Jonesville is 1,127.
What is the Total Female Population of Jonesville?
Total Female Population of Jonesville is 1,507.
What is the Ratio of Males per 100 Females in Jonesville?
There are 74.78 Males per 100 Females in Jonesville.
What is the Ratio of Females per 100 Males in Jonesville?
There are 133.72 Females per 100 Males in Jonesville.
What is the Median Population Age in Jonesville?
Median Population Age in Jonesville is 42.7 Years.
What is the Average Family Size in Jonesville
Average Family Size in Jonesville is 3.1 People.
What is the Average Household Size in Jonesville
Average Household Size in Jonesville is 2.1 People.
How Large is the Labor Force in Jonesville?
There are 1,039 People in the Labor Forcein in Jonesville.
What is the Percentage of People in the Labor Force in Jonesville?
46.1% of People are in the Labor Force in Jonesville.
What is the Unemployment Rate in Jonesville?
Unemployment Rate in Jonesville is 2.1%.