Seaboard, NC Map & Demographics
Seaboard Map
Seaboard Overview
$26,075
PER CAPITA INCOME
$59,375
AVG FAMILY INCOME
$24,531
AVG HOUSEHOLD INCOME
25.0%
WAGE / INCOME GAP [ % ]
75.0¢/ $1
WAGE / INCOME GAP [ $ ]
0.57
INEQUALITY / GINI INDEX
603
TOTAL POPULATION
236
MALE POPULATION
367
FEMALE POPULATION
64.31
MALES / 100 FEMALES
155.51
FEMALES / 100 MALES
54.4
MEDIAN AGE
3.3
AVG FAMILY SIZE
2.1
AVG HOUSEHOLD SIZE
245
LABOR FORCE [ PEOPLE ]
48.1%
PERCENT IN LABOR FORCE
Seaboard Zip Codes
Seaboard Area Codes
Income in Seaboard
Income Overview in Seaboard
Per Capita Income in Seaboard is $26,075, while median incomes of families and households are $59,375 and $24,531 respectively.
| Characteristic | Number | Measure |
| Per Capita Income | 603 | $26,075 |
| Median Family Income | 121 | $59,375 |
| Mean Family Income | 121 | $88,302 |
| Median Household Income | 287 | $24,531 |
| Mean Household Income | 287 | $54,163 |
| Income Deficit | 121 | $0 |
| Wage / Income Gap (%) | 603 | 24.99% |
| Wage / Income Gap ($) | 603 | 75.01¢ per $1 |
| Gini / Inequality Index | 603 | 0.57 |
Earnings by Sex in Seaboard
Average Earnings in Seaboard are $28,583, $32,404 for men and $24,306 for women, a difference of 25.0%.
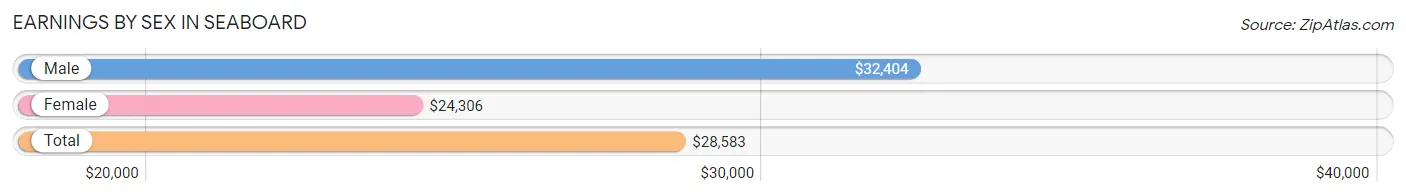
| Sex | Number | Average Earnings |
| Male | 81 (31.5%) | $32,404 |
| Female | 176 (68.5%) | $24,306 |
| Total | 257 (100.0%) | $28,583 |
Earnings by Sex by Income Bracket in Seaboard
The most common earnings brackets in Seaboard are $30,000 to $34,999 for men (16 | 19.8%) and $35,000 to $39,999 for women (30 | 17.1%).
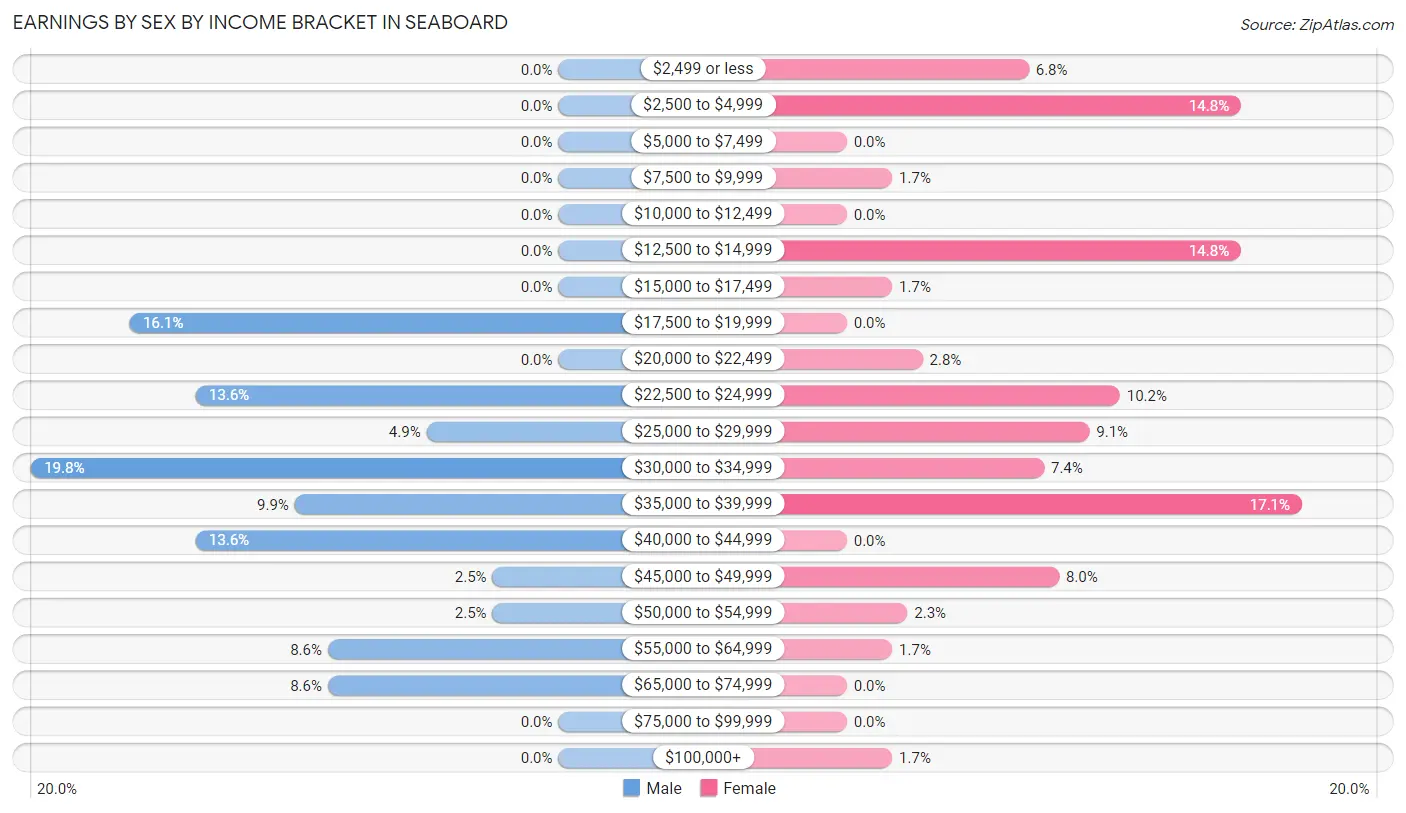
| Income | Male | Female |
| $2,499 or less | 0 (0.0%) | 12 (6.8%) |
| $2,500 to $4,999 | 0 (0.0%) | 26 (14.8%) |
| $5,000 to $7,499 | 0 (0.0%) | 0 (0.0%) |
| $7,500 to $9,999 | 0 (0.0%) | 3 (1.7%) |
| $10,000 to $12,499 | 0 (0.0%) | 0 (0.0%) |
| $12,500 to $14,999 | 0 (0.0%) | 26 (14.8%) |
| $15,000 to $17,499 | 0 (0.0%) | 3 (1.7%) |
| $17,500 to $19,999 | 13 (16.1%) | 0 (0.0%) |
| $20,000 to $22,499 | 0 (0.0%) | 5 (2.8%) |
| $22,500 to $24,999 | 11 (13.6%) | 18 (10.2%) |
| $25,000 to $29,999 | 4 (4.9%) | 16 (9.1%) |
| $30,000 to $34,999 | 16 (19.8%) | 13 (7.4%) |
| $35,000 to $39,999 | 8 (9.9%) | 30 (17.1%) |
| $40,000 to $44,999 | 11 (13.6%) | 0 (0.0%) |
| $45,000 to $49,999 | 2 (2.5%) | 14 (8.0%) |
| $50,000 to $54,999 | 2 (2.5%) | 4 (2.3%) |
| $55,000 to $64,999 | 7 (8.6%) | 3 (1.7%) |
| $65,000 to $74,999 | 7 (8.6%) | 0 (0.0%) |
| $75,000 to $99,999 | 0 (0.0%) | 0 (0.0%) |
| $100,000+ | 0 (0.0%) | 3 (1.7%) |
| Total | 81 (100.0%) | 176 (100.0%) |
Earnings by Sex by Educational Attainment in Seaboard
Average earnings in Seaboard are $39,063 for men and $25,750 for women, a difference of 34.1%. Men with an educational attainment of college or associate's degree enjoy the highest average annual earnings of $41,458, while those with high school diploma education earn the least with $41,250. Women with an educational attainment of college or associate's degree earn the most with the average annual earnings of $36,250, while those with less than high school education have the smallest earnings of $4,022.
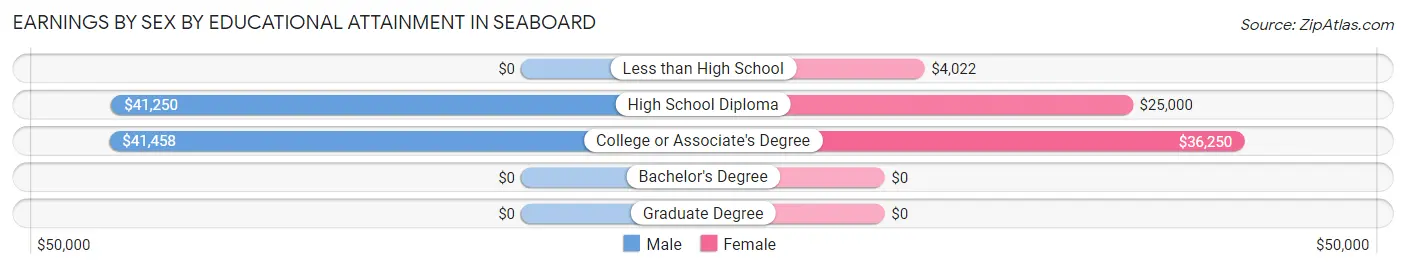
| Educational Attainment | Male Income | Female Income |
| Less than High School | - | - |
| High School Diploma | $41,250 | $25,000 |
| College or Associate's Degree | $41,458 | $36,250 |
| Bachelor's Degree | - | - |
| Graduate Degree | - | - |
| Total | $39,063 | $25,750 |
Family Income in Seaboard
Family Income Brackets in Seaboard
According to the Seaboard family income data, there are 28 families falling into the $75,000 to $99,999 income range, which is the most common income bracket and makes up 23.1% of all families. Conversely, the $150,000 to $199,999 income bracket is the least frequent group with only 3 families (2.5%) belonging to this category.
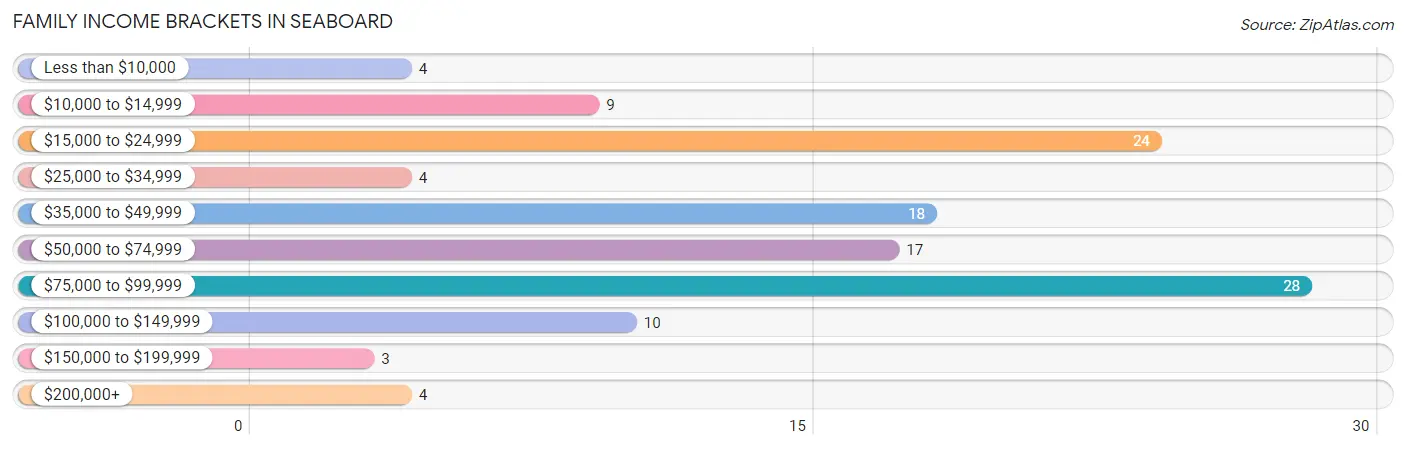
| Income Bracket | # Families | % Families |
| Less than $10,000 | 4 | 3.3% |
| $10,000 to $14,999 | 9 | 7.4% |
| $15,000 to $24,999 | 24 | 19.8% |
| $25,000 to $34,999 | 4 | 3.3% |
| $35,000 to $49,999 | 18 | 14.9% |
| $50,000 to $74,999 | 17 | 14.0% |
| $75,000 to $99,999 | 28 | 23.1% |
| $100,000 to $149,999 | 10 | 8.3% |
| $150,000 to $199,999 | 3 | 2.5% |
| $200,000+ | 4 | 3.3% |
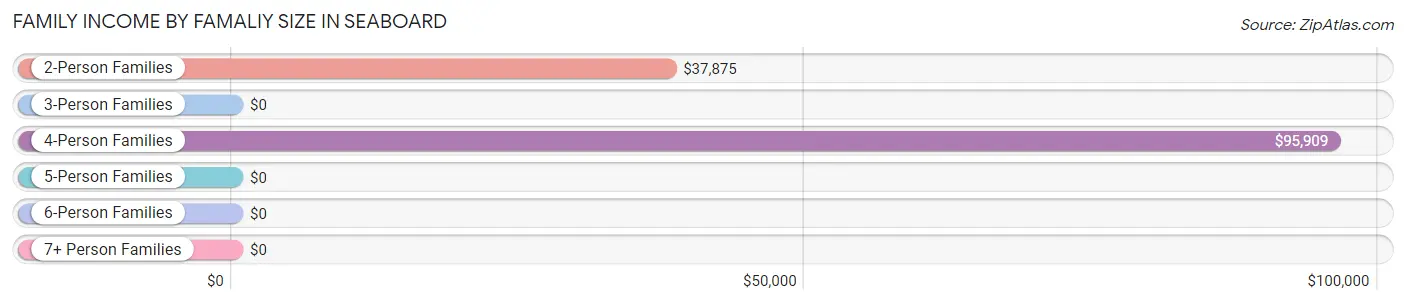
Family Income by Famaliy Size in Seaboard
4-person families (20 | 16.5%) account for the highest median family income in Seaboard with $95,909 per family, while 4-person families (20 | 16.5%) have the highest median income of $23,977 per family member.
| Income Bracket | # Families | Median Income |
| 2-Person Families | 59 (48.8%) | $37,875 |
| 3-Person Families | 20 (16.5%) | $0 |
| 4-Person Families | 20 (16.5%) | $95,909 |
| 5-Person Families | 10 (8.3%) | $0 |
| 6-Person Families | 12 (9.9%) | $0 |
| 7+ Person Families | 0 (0.0%) | $0 |
| Total | 121 (100.0%) | $59,375 |
Family Income by Number of Earners in Seaboard
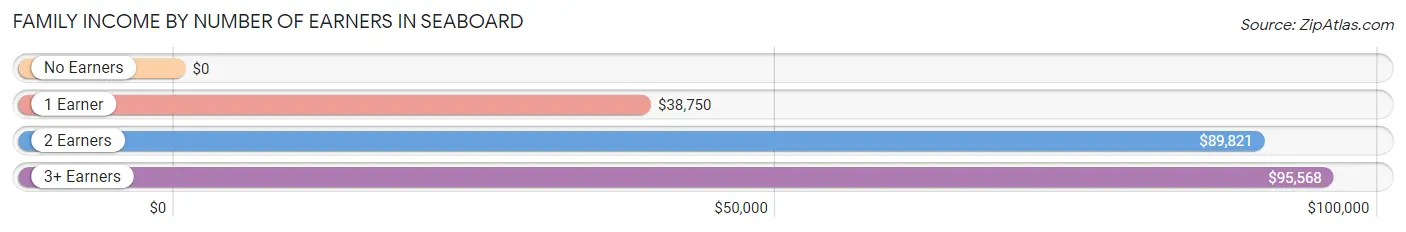
| Number of Earners | # Families | Median Income |
| No Earners | 25 (20.7%) | $0 |
| 1 Earner | 54 (44.6%) | $38,750 |
| 2 Earners | 25 (20.7%) | $89,821 |
| 3+ Earners | 17 (14.1%) | $95,568 |
| Total | 121 (100.0%) | $59,375 |
Household Income in Seaboard
Household Income Brackets in Seaboard
With 82 households falling in the category, the $15,000 to $24,999 income range is the most frequent in Seaboard, accounting for 28.6% of all households. In contrast, only 3 households (1.1%) fall into the $150,000 to $199,999 income bracket, making it the least populous group.
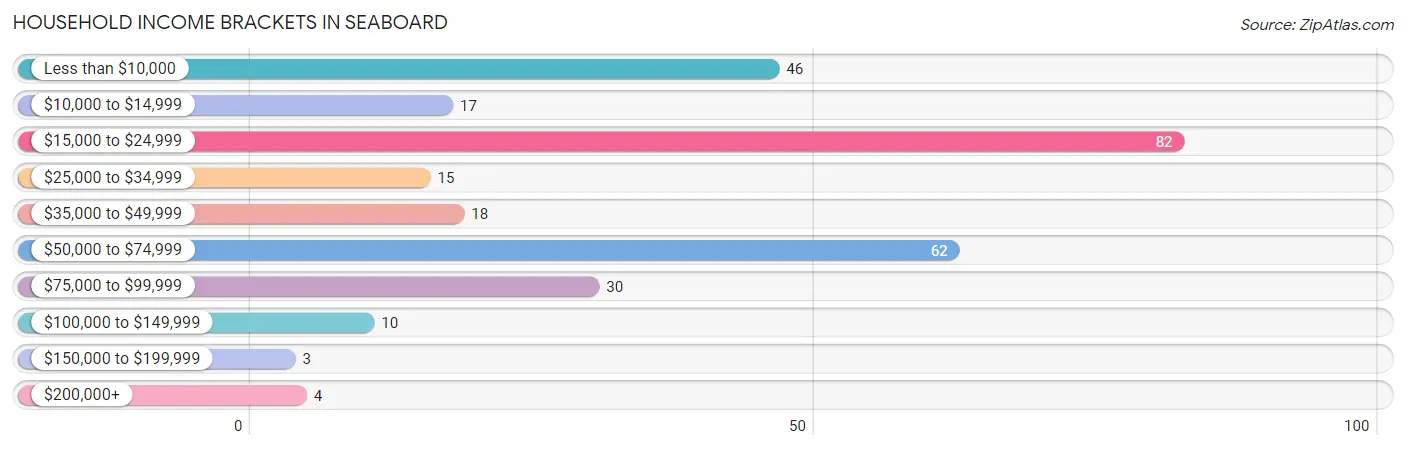
| Income Bracket | # Households | % Households |
| Less than $10,000 | 46 | 16.0% |
| $10,000 to $14,999 | 17 | 5.9% |
| $15,000 to $24,999 | 82 | 28.6% |
| $25,000 to $34,999 | 15 | 5.2% |
| $35,000 to $49,999 | 18 | 6.3% |
| $50,000 to $74,999 | 62 | 21.6% |
| $75,000 to $99,999 | 30 | 10.5% |
| $100,000 to $149,999 | 10 | 3.5% |
| $150,000 to $199,999 | 3 | 1.0% |
| $200,000+ | 4 | 1.4% |
Household Income by Householder Age in Seaboard
The median household income in Seaboard is $24,531, with the highest median household income of $68,304 found in the 45 to 64 years age bracket for the primary householder. A total of 81 households (28.2%) fall into this category.
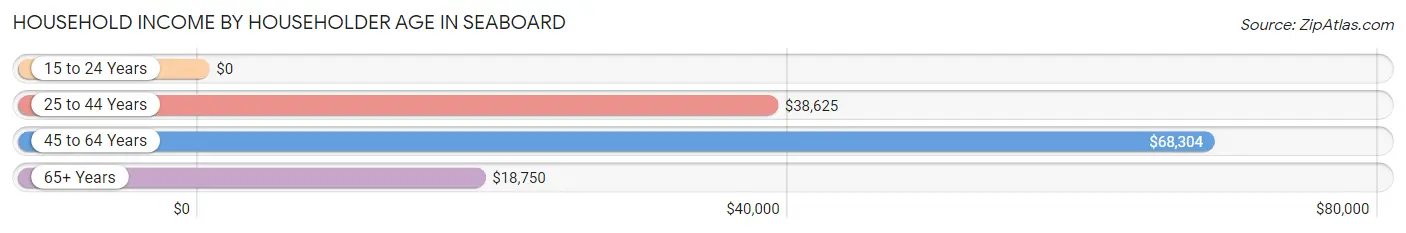
| Income Bracket | # Households | Median Income |
| 15 to 24 Years | 0 (0.0%) | $0 |
| 25 to 44 Years | 37 (12.9%) | $38,625 |
| 45 to 64 Years | 81 (28.2%) | $68,304 |
| 65+ Years | 169 (58.9%) | $18,750 |
| Total | 287 (100.0%) | $24,531 |
Poverty in Seaboard
Income Below Poverty by Sex and Age in Seaboard
With 23.3% poverty level for males and 23.2% for females among the residents of Seaboard, 6 to 11 year old males and 18 to 24 year old females are the most vulnerable to poverty, with 7 males (77.8%) and 10 females (71.4%) in their respective age groups living below the poverty level.
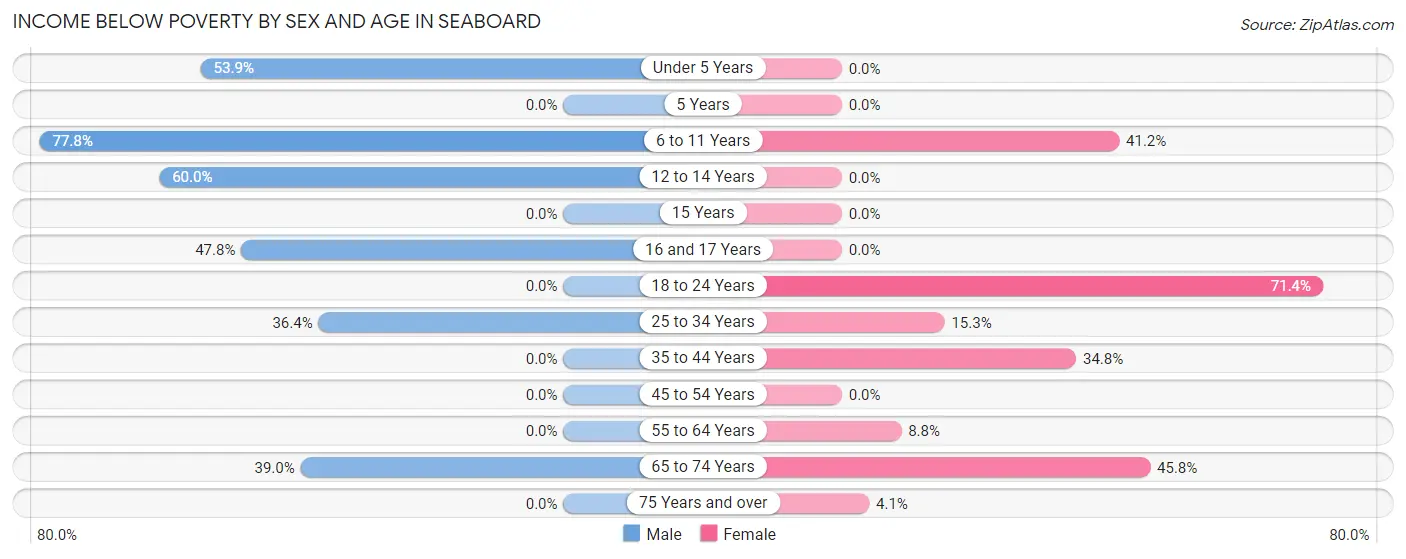
| Age Bracket | Male | Female |
| Under 5 Years | 14 (53.8%) | 0 (0.0%) |
| 5 Years | 0 (0.0%) | 0 (0.0%) |
| 6 to 11 Years | 7 (77.8%) | 14 (41.2%) |
| 12 to 14 Years | 3 (60.0%) | 0 (0.0%) |
| 15 Years | 0 (0.0%) | 0 (0.0%) |
| 16 and 17 Years | 11 (47.8%) | 0 (0.0%) |
| 18 to 24 Years | 0 (0.0%) | 10 (71.4%) |
| 25 to 34 Years | 4 (36.4%) | 9 (15.2%) |
| 35 to 44 Years | 0 (0.0%) | 8 (34.8%) |
| 45 to 54 Years | 0 (0.0%) | 0 (0.0%) |
| 55 to 64 Years | 0 (0.0%) | 3 (8.8%) |
| 65 to 74 Years | 16 (39.0%) | 38 (45.8%) |
| 75 Years and over | 0 (0.0%) | 3 (4.1%) |
| Total | 55 (23.3%) | 85 (23.2%) |
Income Above Poverty by Sex and Age in Seaboard
According to the poverty statistics in Seaboard, males aged 5 years and females aged under 5 years are the age groups that are most secure financially, with 100.0% of males and 100.0% of females in these age groups living above the poverty line.
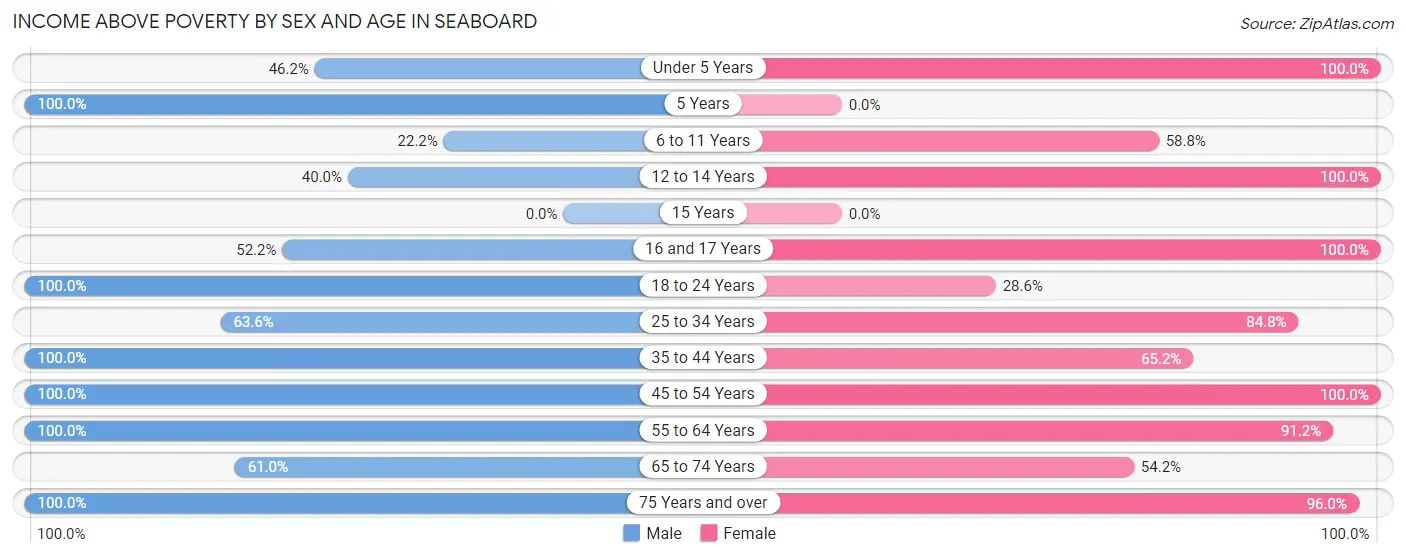
| Age Bracket | Male | Female |
| Under 5 Years | 12 (46.2%) | 12 (100.0%) |
| 5 Years | 3 (100.0%) | 0 (0.0%) |
| 6 to 11 Years | 2 (22.2%) | 20 (58.8%) |
| 12 to 14 Years | 2 (40.0%) | 5 (100.0%) |
| 15 Years | 0 (0.0%) | 0 (0.0%) |
| 16 and 17 Years | 12 (52.2%) | 3 (100.0%) |
| 18 to 24 Years | 19 (100.0%) | 4 (28.6%) |
| 25 to 34 Years | 7 (63.6%) | 50 (84.8%) |
| 35 to 44 Years | 24 (100.0%) | 15 (65.2%) |
| 45 to 54 Years | 9 (100.0%) | 26 (100.0%) |
| 55 to 64 Years | 47 (100.0%) | 31 (91.2%) |
| 65 to 74 Years | 25 (61.0%) | 45 (54.2%) |
| 75 Years and over | 19 (100.0%) | 71 (96.0%) |
| Total | 181 (76.7%) | 282 (76.8%) |
Income Below Poverty Among Married-Couple Families in Seaboard
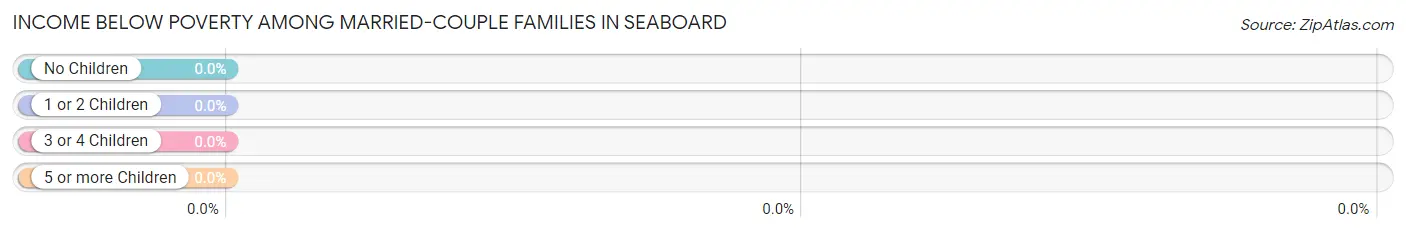
| Children | Above Poverty | Below Poverty |
| No Children | 30 (100.0%) | 0 (0.0%) |
| 1 or 2 Children | 19 (100.0%) | 0 (0.0%) |
| 3 or 4 Children | 0 (0.0%) | 0 (0.0%) |
| 5 or more Children | 0 (0.0%) | 0 (0.0%) |
| Total | 49 (100.0%) | 0 (0.0%) |
Income Below Poverty Among Single-Parent Households in Seaboard
According to the poverty data in Seaboard, 26.7% or 4 single-father households and 29.8% or 17 single-mother households are living below the poverty line. Among single-father households, those with 5 or more children have the highest poverty rate, with 4 households (100.0%) experiencing poverty. Likewise, among single-mother households, those with no children have the highest poverty rate, with 8 households (38.1%) falling below the poverty line.
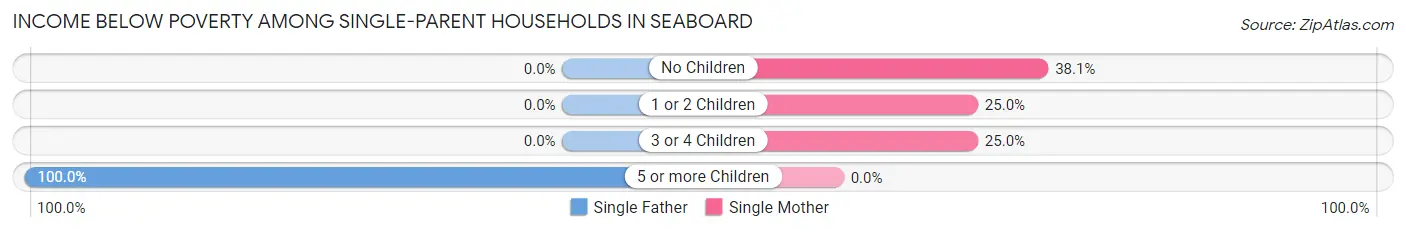
| Children | Single Father | Single Mother |
| No Children | 0 (0.0%) | 8 (38.1%) |
| 1 or 2 Children | 0 (0.0%) | 7 (25.0%) |
| 3 or 4 Children | 0 (0.0%) | 2 (25.0%) |
| 5 or more Children | 4 (100.0%) | 0 (0.0%) |
| Total | 4 (26.7%) | 17 (29.8%) |
Income Below Poverty Among Married-Couple vs Single-Parent Households in Seaboard
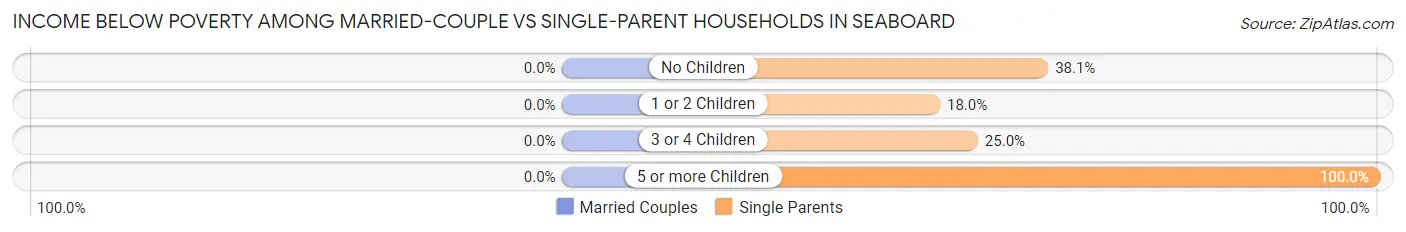
| Children | Married-Couple Families | Single-Parent Households |
| No Children | 0 (0.0%) | 8 (38.1%) |
| 1 or 2 Children | 0 (0.0%) | 7 (17.9%) |
| 3 or 4 Children | 0 (0.0%) | 2 (25.0%) |
| 5 or more Children | 0 (0.0%) | 4 (100.0%) |
| Total | 0 (0.0%) | 21 (29.2%) |
Race in Seaboard
The most populous races in Seaboard are Black / African American (506 | 83.9%), White / Caucasian (74 | 12.3%), and Two or more Races (23 | 3.8%).
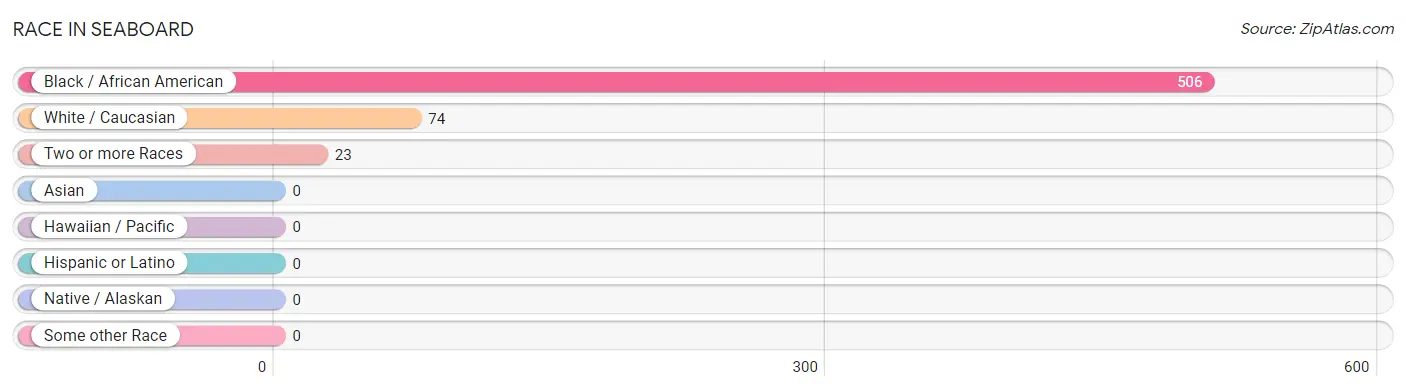
| Race | # Population | % Population |
| Asian | 0 | 0.0% |
| Black / African American | 506 | 83.9% |
| Hawaiian / Pacific | 0 | 0.0% |
| Hispanic or Latino | 0 | 0.0% |
| Native / Alaskan | 0 | 0.0% |
| White / Caucasian | 74 | 12.3% |
| Two or more Races | 23 | 3.8% |
| Some other Race | 0 | 0.0% |
| Total | 603 | 100.0% |
Ancestry in Seaboard
The most populous ancestries reported in Seaboard are American (97 | 16.1%), English (50 | 8.3%), French (4 | 0.7%), German (4 | 0.7%), and Scotch-Irish (4 | 0.7%), together accounting for 26.4% of all Seaboard residents.
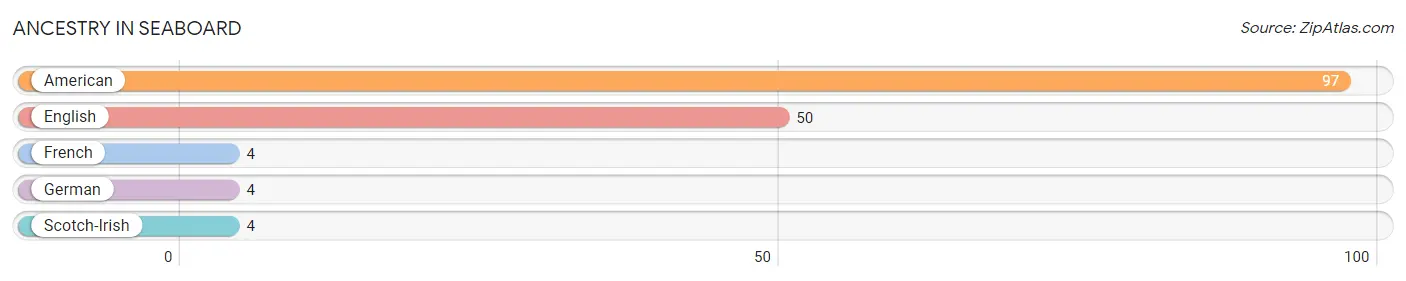
| Ancestry | # Population | % Population |
| American | 97 | 16.1% |
| English | 50 | 8.3% |
| French | 4 | 0.7% |
| German | 4 | 0.7% |
| Scotch-Irish | 4 | 0.7% | View All 5 Rows |
Immigrants in Seaboard
The most numerous immigrant groups reported in Seaboard came from Europe (14 | 2.3%), Northern Europe (14 | 2.3%), and England (11 | 1.8%), together accounting for 6.5% of all Seaboard residents.
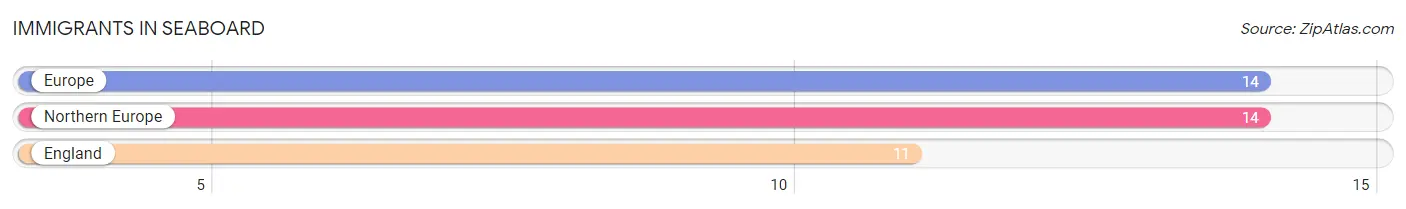
| Immigration Origin | # Population | % Population |
| England | 11 | 1.8% |
| Europe | 14 | 2.3% |
| Northern Europe | 14 | 2.3% | View All 3 Rows |
Sex and Age in Seaboard
Sex and Age in Seaboard
The most populous age groups in Seaboard are 70 to 74 Years (36 | 15.2%) for men and 65 to 69 Years (74 | 20.2%) for women.
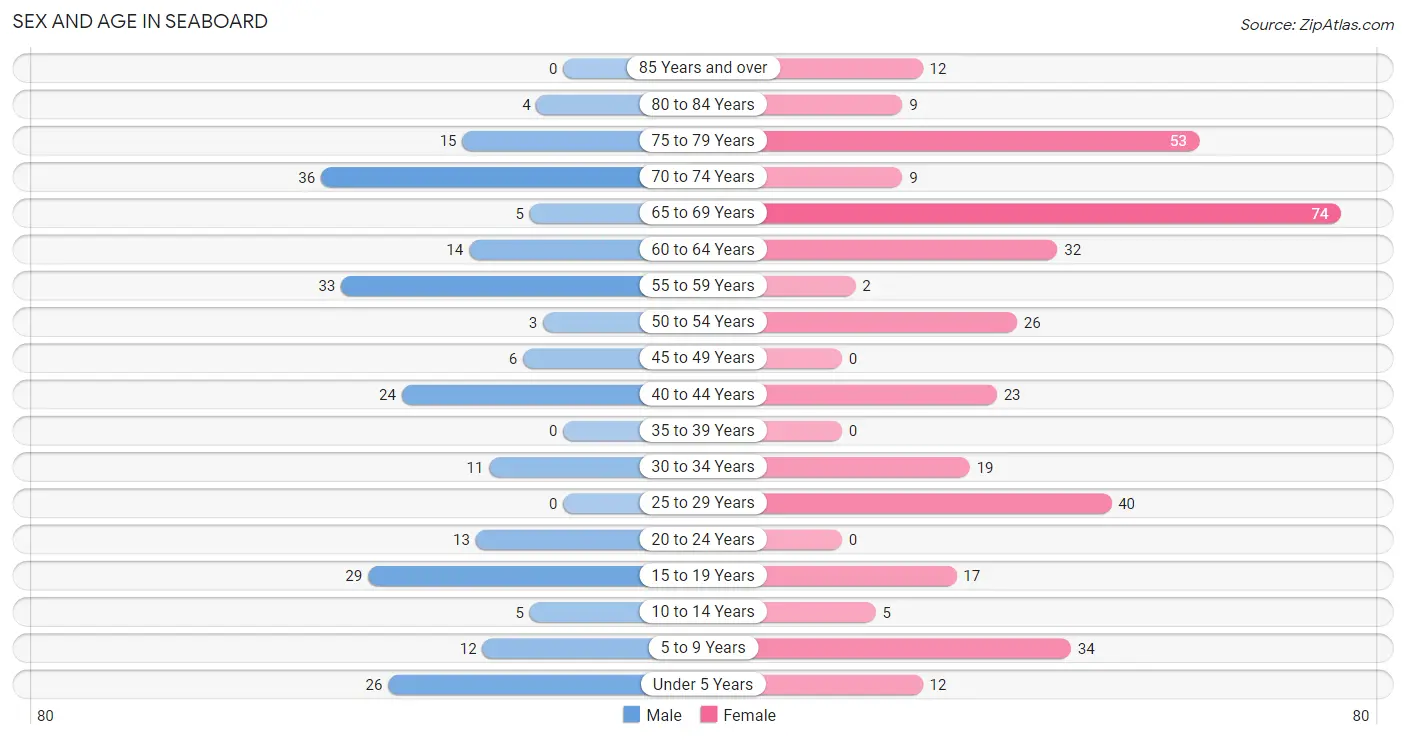
| Age Bracket | Male | Female |
| Under 5 Years | 26 (11.0%) | 12 (3.3%) |
| 5 to 9 Years | 12 (5.1%) | 34 (9.3%) |
| 10 to 14 Years | 5 (2.1%) | 5 (1.4%) |
| 15 to 19 Years | 29 (12.3%) | 17 (4.6%) |
| 20 to 24 Years | 13 (5.5%) | 0 (0.0%) |
| 25 to 29 Years | 0 (0.0%) | 40 (10.9%) |
| 30 to 34 Years | 11 (4.7%) | 19 (5.2%) |
| 35 to 39 Years | 0 (0.0%) | 0 (0.0%) |
| 40 to 44 Years | 24 (10.2%) | 23 (6.3%) |
| 45 to 49 Years | 6 (2.5%) | 0 (0.0%) |
| 50 to 54 Years | 3 (1.3%) | 26 (7.1%) |
| 55 to 59 Years | 33 (14.0%) | 2 (0.5%) |
| 60 to 64 Years | 14 (5.9%) | 32 (8.7%) |
| 65 to 69 Years | 5 (2.1%) | 74 (20.2%) |
| 70 to 74 Years | 36 (15.2%) | 9 (2.5%) |
| 75 to 79 Years | 15 (6.4%) | 53 (14.4%) |
| 80 to 84 Years | 4 (1.7%) | 9 (2.5%) |
| 85 Years and over | 0 (0.0%) | 12 (3.3%) |
| Total | 236 (100.0%) | 367 (100.0%) |
Families and Households in Seaboard
Median Family Size in Seaboard
The median family size in Seaboard is 3.32 persons per family, with single male/father families (15 | 12.4%) accounting for the largest median family size of 4.93 persons per family. On the other hand, single female/mother families (57 | 47.1%) represent the smallest median family size with 2.82 persons per family.
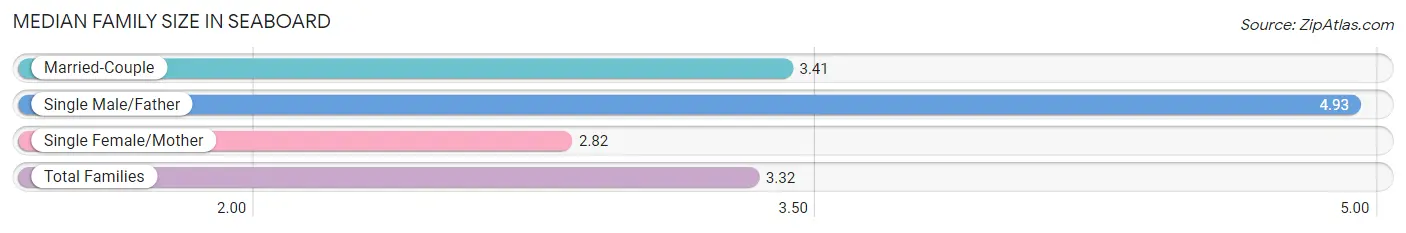
| Family Type | # Families | Family Size |
| Married-Couple | 49 (40.5%) | 3.41 |
| Single Male/Father | 15 (12.4%) | 4.93 |
| Single Female/Mother | 57 (47.1%) | 2.82 |
| Total Families | 121 (100.0%) | 3.32 |
Median Household Size in Seaboard
The median household size in Seaboard is 2.10 persons per household, with single male/father households (15 | 5.2%) accounting for the largest median household size of 4.93 persons per household. non-family households (166 | 57.8%) represent the smallest median household size with 1.16 persons per household.
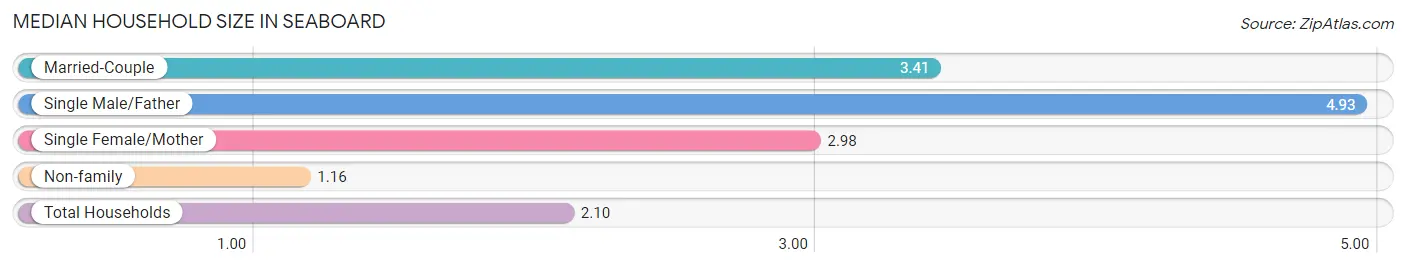
| Household Type | # Households | Household Size |
| Married-Couple | 49 (17.1%) | 3.41 |
| Single Male/Father | 15 (5.2%) | 4.93 |
| Single Female/Mother | 57 (19.9%) | 2.98 |
| Non-family | 166 (57.8%) | 1.16 |
| Total Households | 287 (100.0%) | 2.10 |
Household Size by Marriage Status in Seaboard
Out of a total of 287 households in Seaboard, 121 (42.2%) are family households, while 166 (57.8%) are nonfamily households. The most numerous type of family households are 2-person households, comprising 59, and the most common type of nonfamily households are 1-person households, comprising 145.
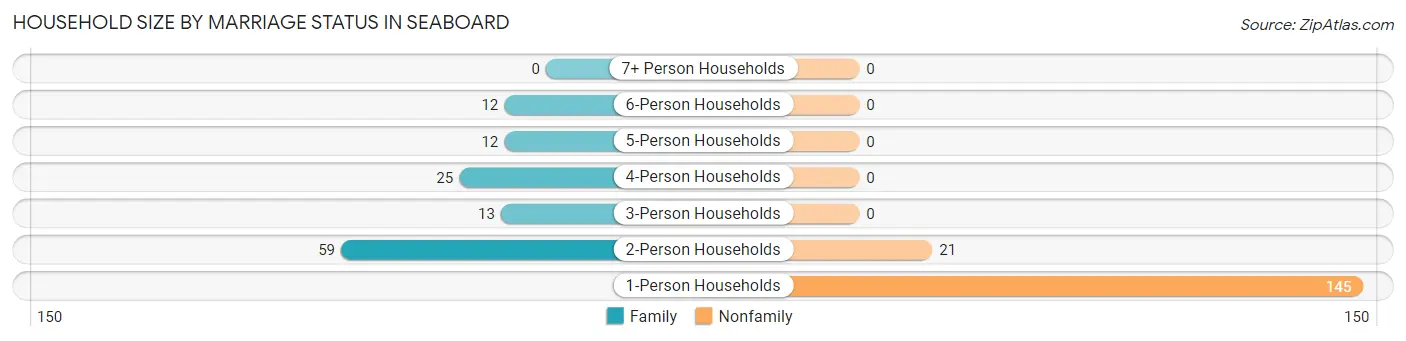
| Household Size | Family Households | Nonfamily Households |
| 1-Person Households | - | 145 (50.5%) |
| 2-Person Households | 59 (20.6%) | 21 (7.3%) |
| 3-Person Households | 13 (4.5%) | 0 (0.0%) |
| 4-Person Households | 25 (8.7%) | 0 (0.0%) |
| 5-Person Households | 12 (4.2%) | 0 (0.0%) |
| 6-Person Households | 12 (4.2%) | 0 (0.0%) |
| 7+ Person Households | 0 (0.0%) | 0 (0.0%) |
| Total | 121 (42.2%) | 166 (57.8%) |
Female Fertility in Seaboard
Fertility by Age in Seaboard
| Age Bracket | Women with Births | Births / 1,000 Women |
| 15 to 19 years | 0 (0.0%) | 0.0 |
| 20 to 34 years | 0 (0.0%) | 0.0 |
| 35 to 50 years | 0 (0.0%) | 0.0 |
| Total | 0 (0.0%) | 0.0 |
Fertility by Age by Marriage Status in Seaboard
| Age Bracket | Married | Unmarried |
| 15 to 19 years | 0 (0.0%) | 0 (0.0%) |
| 20 to 34 years | 0 (0.0%) | 0 (0.0%) |
| 35 to 50 years | 0 (0.0%) | 0 (0.0%) |
| Total | 0 (0.0%) | 0 (0.0%) |
Fertility by Education in Seaboard
| Educational Attainment | Women with Births | Births / 1,000 Women |
| Less than High School | 0 (0.0%) | 0.0 |
| High School Diploma | 0 (0.0%) | 0.0 |
| College or Associate's Degree | 0 (0.0%) | 0.0 |
| Bachelor's Degree | 0 (0.0%) | 0.0 |
| Graduate Degree | 0 (0.0%) | 0.0 |
| Total | 0 (0.0%) | 0.0 |
Fertility by Education by Marriage Status in Seaboard
| Educational Attainment | Married | Unmarried |
| Less than High School | 0 (0.0%) | 0 (0.0%) |
| High School Diploma | 0 (0.0%) | 0 (0.0%) |
| College or Associate's Degree | 0 (0.0%) | 0 (0.0%) |
| Bachelor's Degree | 0 (0.0%) | 0 (0.0%) |
| Graduate Degree | 0 (0.0%) | 0 (0.0%) |
| Total | 0 (0.0%) | 0 (0.0%) |
Employment Characteristics in Seaboard
Employment by Class of Employer in Seaboard
Among the 233 employed individuals in Seaboard, private company employees (168 | 72.1%), state government employees (47 | 20.2%), and local government employees (16 | 6.9%) make up the most common classes of employment.
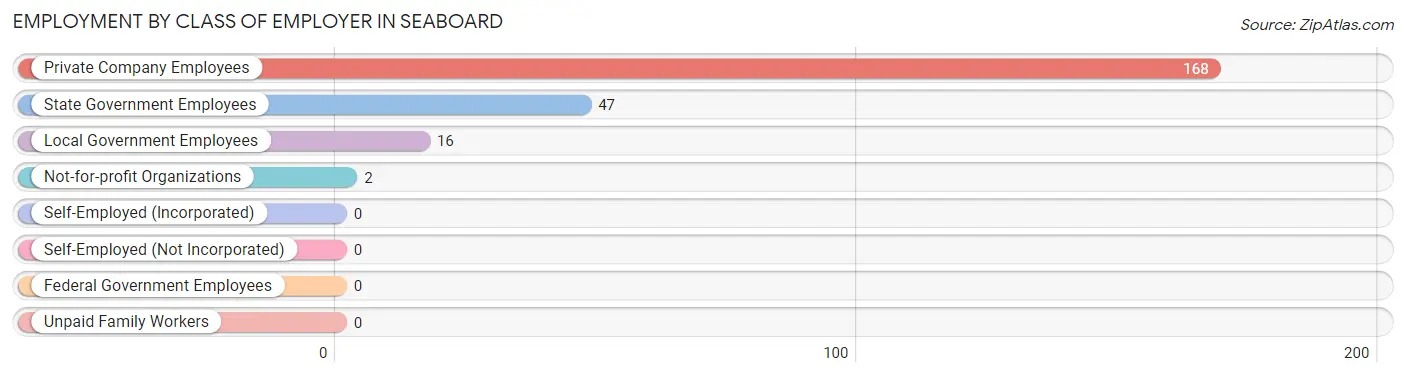
| Employer Class | # Employees | % Employees |
| Private Company Employees | 168 | 72.1% |
| Self-Employed (Incorporated) | 0 | 0.0% |
| Self-Employed (Not Incorporated) | 0 | 0.0% |
| Not-for-profit Organizations | 2 | 0.9% |
| Local Government Employees | 16 | 6.9% |
| State Government Employees | 47 | 20.2% |
| Federal Government Employees | 0 | 0.0% |
| Unpaid Family Workers | 0 | 0.0% |
| Total | 233 | 100.0% |
Employment Status by Age in Seaboard
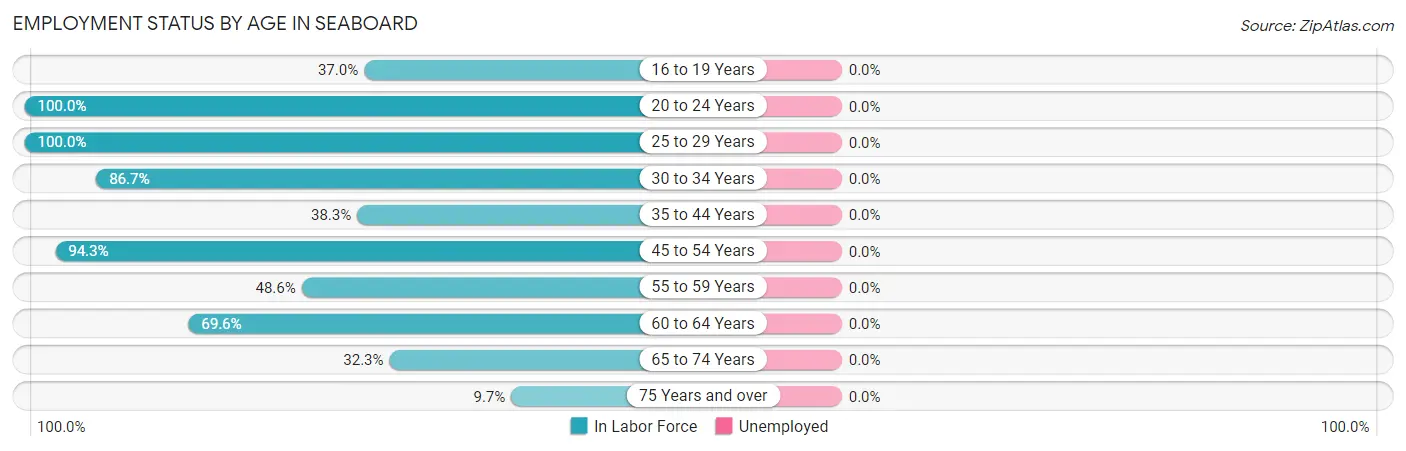
| Age Bracket | In Labor Force | Unemployed |
| 16 to 19 Years | 17 (37.0%) | 0 (0.0%) |
| 20 to 24 Years | 13 (100.0%) | 0 (0.0%) |
| 25 to 29 Years | 40 (100.0%) | 0 (0.0%) |
| 30 to 34 Years | 26 (86.7%) | 0 (0.0%) |
| 35 to 44 Years | 18 (38.3%) | 0 (0.0%) |
| 45 to 54 Years | 33 (94.3%) | 0 (0.0%) |
| 55 to 59 Years | 17 (48.6%) | 0 (0.0%) |
| 60 to 64 Years | 32 (69.6%) | 0 (0.0%) |
| 65 to 74 Years | 40 (32.3%) | 0 (0.0%) |
| 75 Years and over | 9 (9.7%) | 0 (0.0%) |
| Total | 245 (48.1%) | 0 (0.0%) |
Employment Status by Educational Attainment in Seaboard
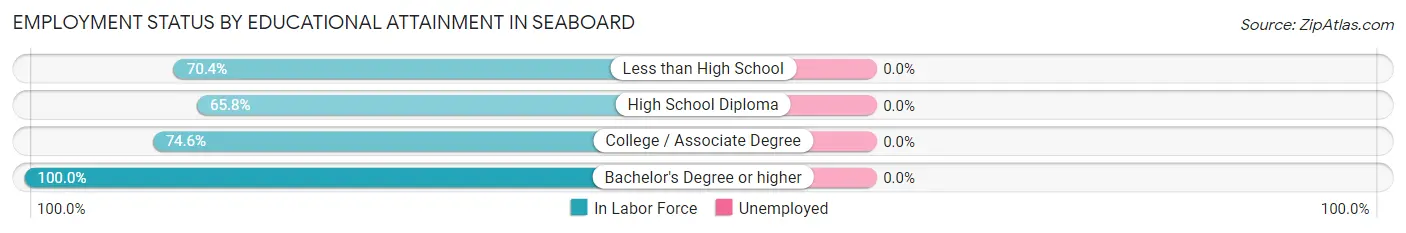
| Educational Attainment | In Labor Force | Unemployed |
| Less than High School | 19 (70.4%) | 0 (0.0%) |
| High School Diploma | 79 (65.8%) | 0 (0.0%) |
| College / Associate Degree | 53 (74.6%) | 0 (0.0%) |
| Bachelor's Degree or higher | 15 (100.0%) | 0 (0.0%) |
| Total | 166 (71.2%) | 0 (0.0%) |
Employment Occupations by Sex in Seaboard
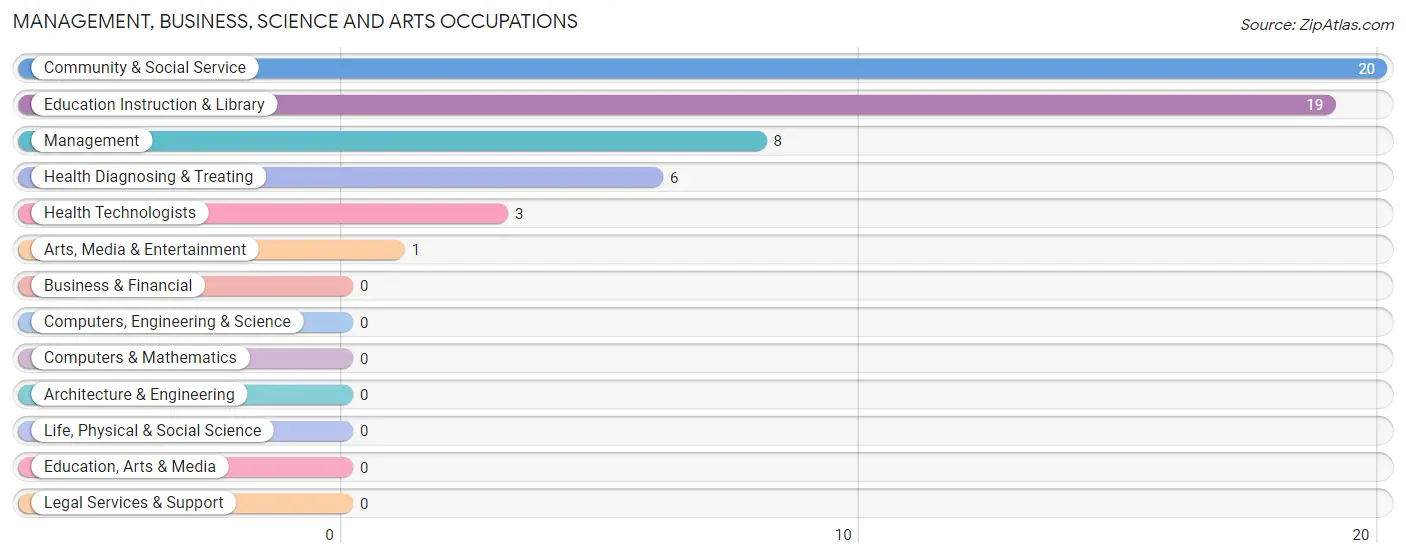
Management, Business, Science and Arts Occupations
The most common Management, Business, Science and Arts occupations in Seaboard are Community & Social Service (20 | 8.2%), Education Instruction & Library (19 | 7.8%), Management (8 | 3.3%), Health Diagnosing & Treating (6 | 2.5%), and Health Technologists (3 | 1.2%).
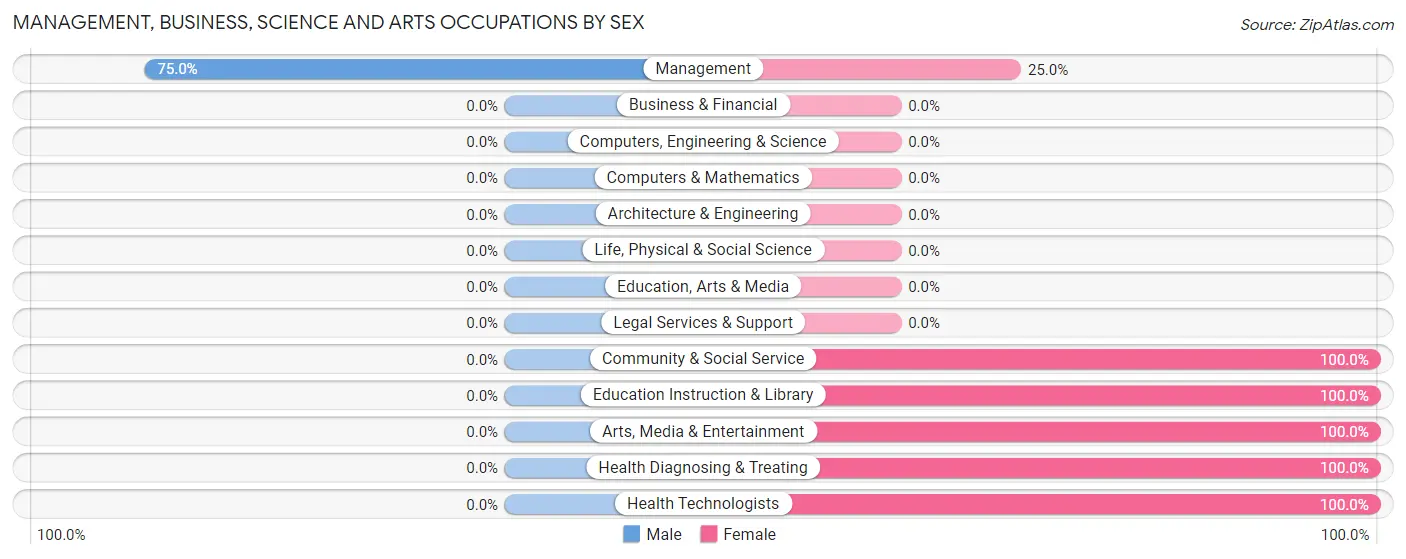
Management, Business, Science and Arts Occupations by Sex
| Occupation | Male | Female |
| Management | 6 (75.0%) | 2 (25.0%) |
| Business & Financial | 0 (0.0%) | 0 (0.0%) |
| Computers, Engineering & Science | 0 (0.0%) | 0 (0.0%) |
| Computers & Mathematics | 0 (0.0%) | 0 (0.0%) |
| Architecture & Engineering | 0 (0.0%) | 0 (0.0%) |
| Life, Physical & Social Science | 0 (0.0%) | 0 (0.0%) |
| Community & Social Service | 0 (0.0%) | 20 (100.0%) |
| Education, Arts & Media | 0 (0.0%) | 0 (0.0%) |
| Legal Services & Support | 0 (0.0%) | 0 (0.0%) |
| Education Instruction & Library | 0 (0.0%) | 19 (100.0%) |
| Arts, Media & Entertainment | 0 (0.0%) | 1 (100.0%) |
| Health Diagnosing & Treating | 0 (0.0%) | 6 (100.0%) |
| Health Technologists | 0 (0.0%) | 3 (100.0%) |
| Total (Category) | 6 (17.6%) | 28 (82.4%) |
| Total (Overall) | 81 (33.1%) | 164 (66.9%) |
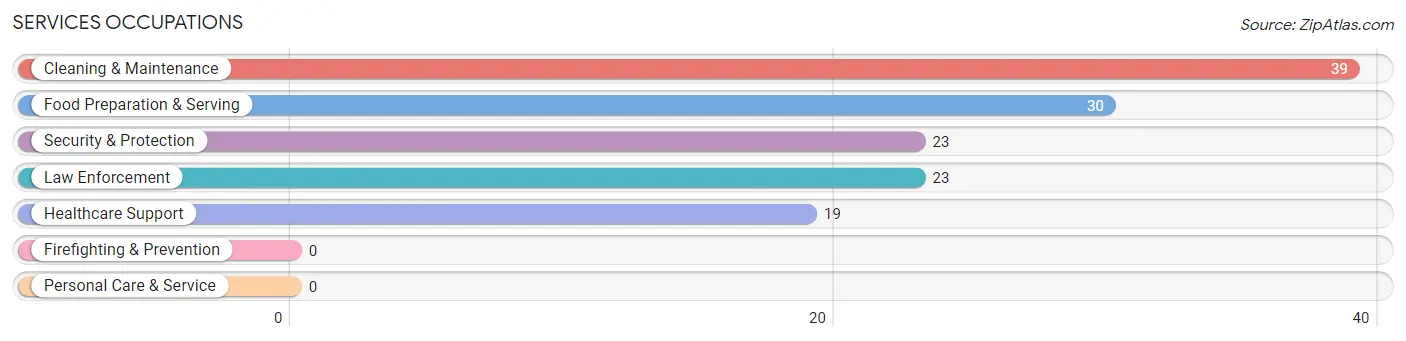
Services Occupations
The most common Services occupations in Seaboard are Cleaning & Maintenance (39 | 15.9%), Food Preparation & Serving (30 | 12.2%), Security & Protection (23 | 9.4%), Law Enforcement (23 | 9.4%), and Healthcare Support (19 | 7.8%).
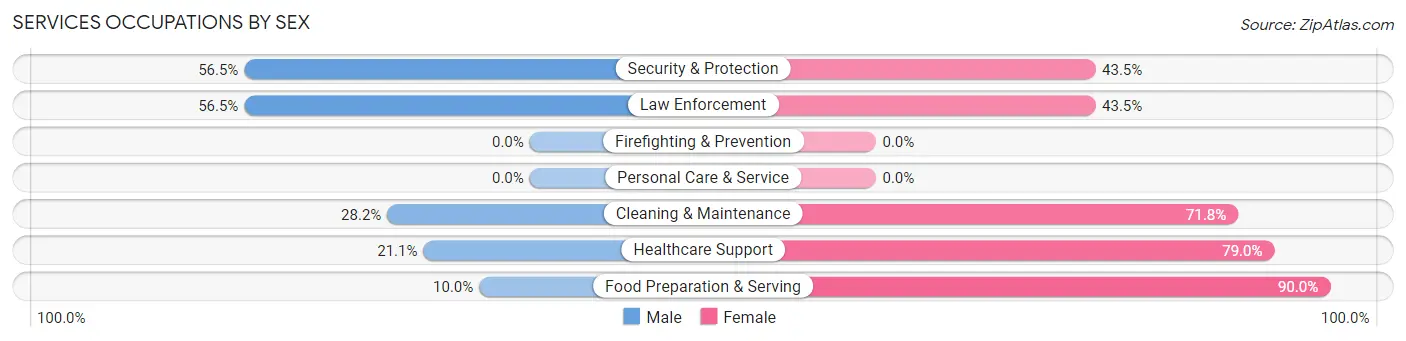
Services Occupations by Sex
Within the Services occupations in Seaboard, the most male-oriented occupations are Security & Protection (56.5%), Law Enforcement (56.5%), and Cleaning & Maintenance (28.2%), while the most female-oriented occupations are Food Preparation & Serving (90.0%), Healthcare Support (78.9%), and Cleaning & Maintenance (71.8%).
| Occupation | Male | Female |
| Healthcare Support | 4 (21.0%) | 15 (78.9%) |
| Security & Protection | 13 (56.5%) | 10 (43.5%) |
| Firefighting & Prevention | 0 (0.0%) | 0 (0.0%) |
| Law Enforcement | 13 (56.5%) | 10 (43.5%) |
| Food Preparation & Serving | 3 (10.0%) | 27 (90.0%) |
| Cleaning & Maintenance | 11 (28.2%) | 28 (71.8%) |
| Personal Care & Service | 0 (0.0%) | 0 (0.0%) |
| Total (Category) | 31 (27.9%) | 80 (72.1%) |
| Total (Overall) | 81 (33.1%) | 164 (66.9%) |
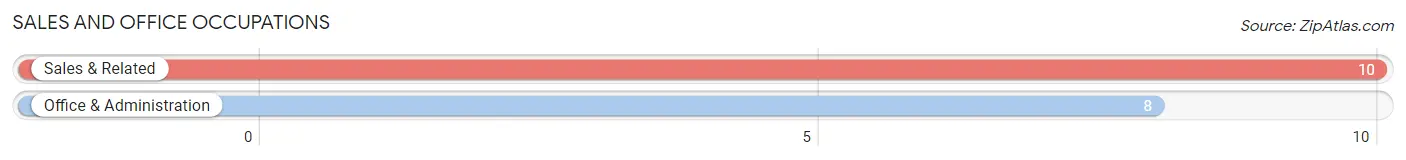
Sales and Office Occupations
The most common Sales and Office occupations in Seaboard are Sales & Related (10 | 4.1%), and Office & Administration (8 | 3.3%).
Sales and Office Occupations by Sex
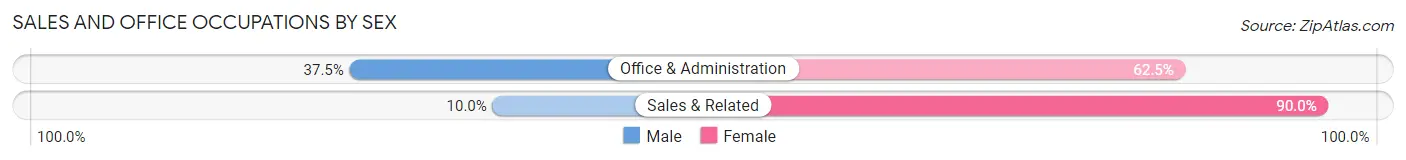
| Occupation | Male | Female |
| Sales & Related | 1 (10.0%) | 9 (90.0%) |
| Office & Administration | 3 (37.5%) | 5 (62.5%) |
| Total (Category) | 4 (22.2%) | 14 (77.8%) |
| Total (Overall) | 81 (33.1%) | 164 (66.9%) |
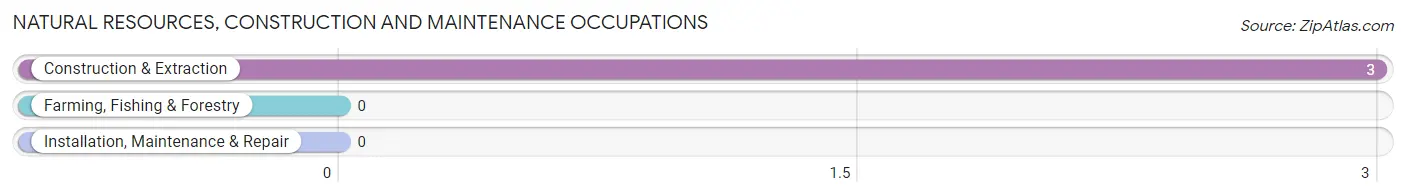
Natural Resources, Construction and Maintenance Occupations
The most common Natural Resources, Construction and Maintenance occupations in Seaboard are , and Construction & Extraction (3 | 1.2%).
Natural Resources, Construction and Maintenance Occupations by Sex
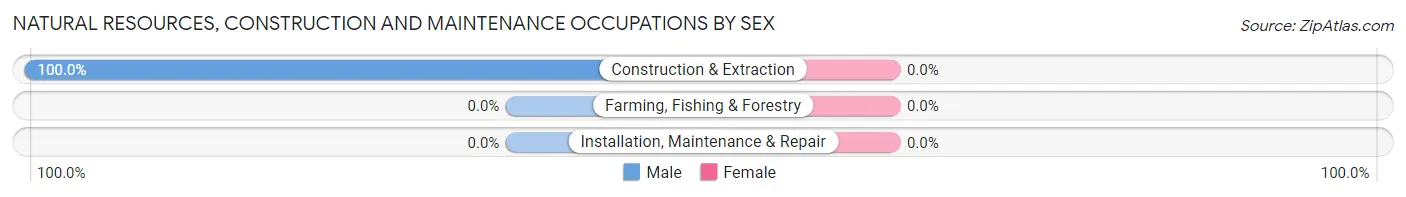
| Occupation | Male | Female |
| Farming, Fishing & Forestry | 0 (0.0%) | 0 (0.0%) |
| Construction & Extraction | 3 (100.0%) | 0 (0.0%) |
| Installation, Maintenance & Repair | 0 (0.0%) | 0 (0.0%) |
| Total (Category) | 3 (100.0%) | 0 (0.0%) |
| Total (Overall) | 81 (33.1%) | 164 (66.9%) |
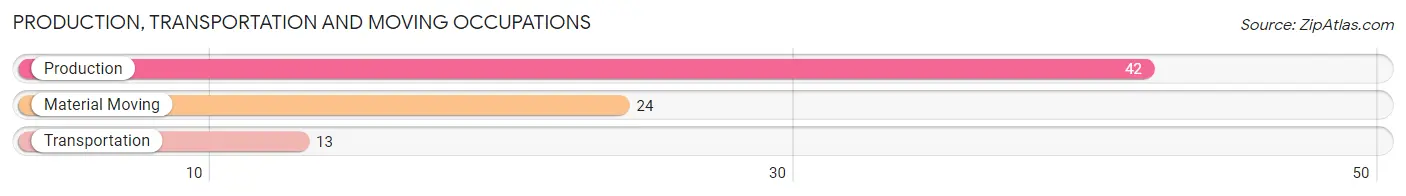
Production, Transportation and Moving Occupations
The most common Production, Transportation and Moving occupations in Seaboard are Production (42 | 17.1%), Material Moving (24 | 9.8%), and Transportation (13 | 5.3%).
Production, Transportation and Moving Occupations by Sex
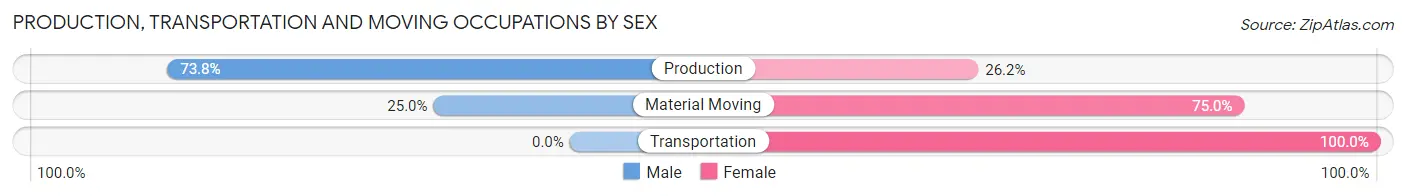
| Occupation | Male | Female |
| Production | 31 (73.8%) | 11 (26.2%) |
| Transportation | 0 (0.0%) | 13 (100.0%) |
| Material Moving | 6 (25.0%) | 18 (75.0%) |
| Total (Category) | 37 (46.8%) | 42 (53.2%) |
| Total (Overall) | 81 (33.1%) | 164 (66.9%) |
Employment Industries by Sex in Seaboard
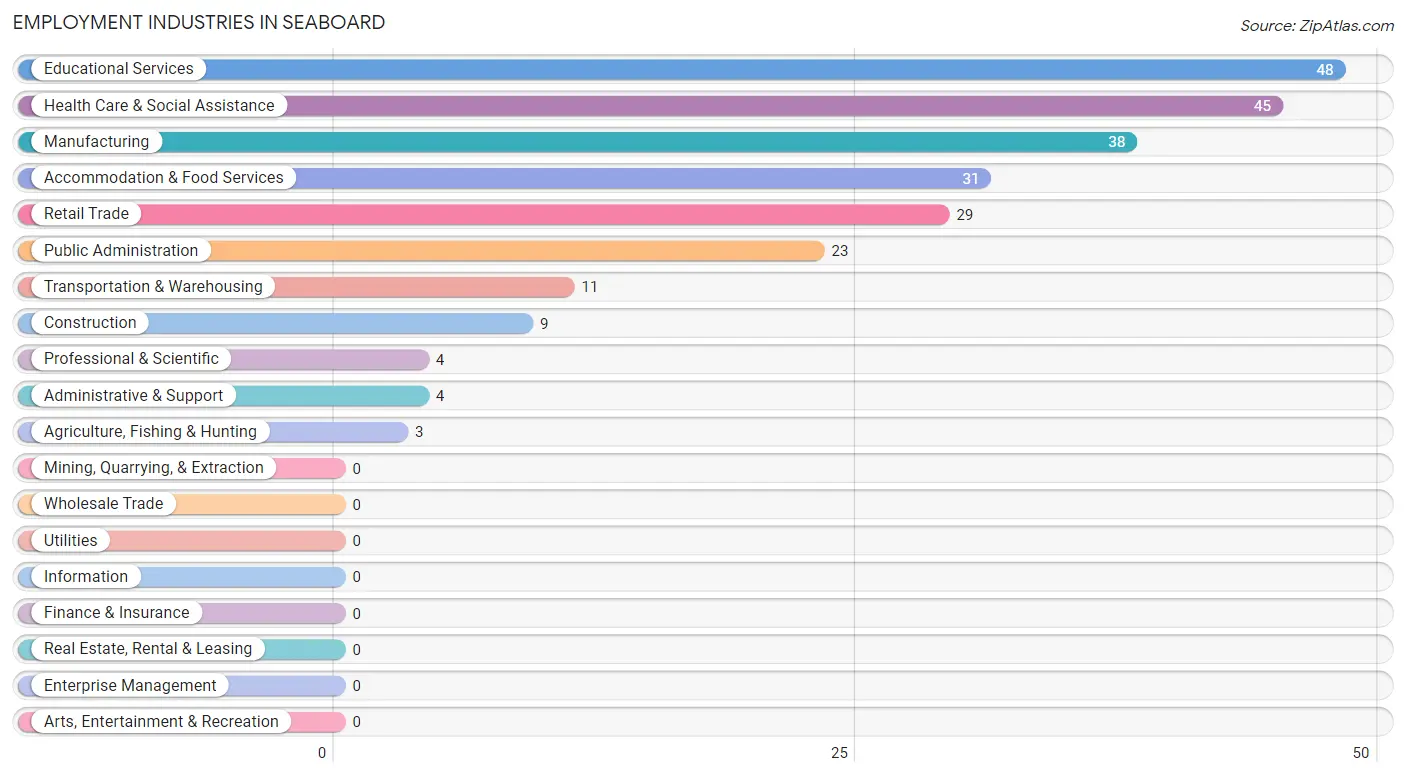
Employment Industries in Seaboard
The major employment industries in Seaboard include Educational Services (48 | 19.6%), Health Care & Social Assistance (45 | 18.4%), Manufacturing (38 | 15.5%), Accommodation & Food Services (31 | 12.7%), and Retail Trade (29 | 11.8%).
Employment Industries by Sex in Seaboard
The Seaboard industries that see more men than women are Transportation & Warehousing (100.0%), Administrative & Support (100.0%), and Manufacturing (65.8%), whereas the industries that tend to have a higher number of women are Agriculture, Fishing & Hunting (100.0%), Professional & Scientific (100.0%), and Retail Trade (96.6%).
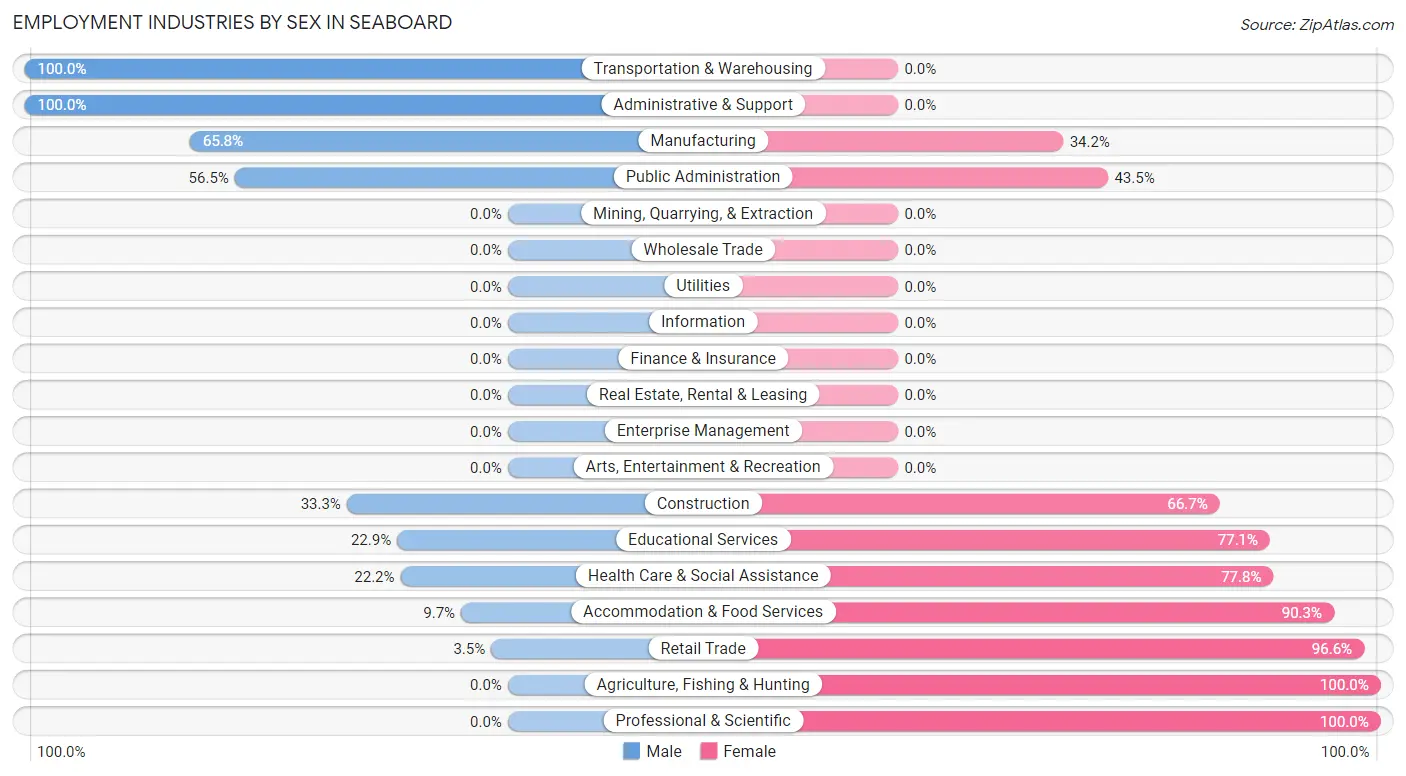
| Industry | Male | Female |
| Agriculture, Fishing & Hunting | 0 (0.0%) | 3 (100.0%) |
| Mining, Quarrying, & Extraction | 0 (0.0%) | 0 (0.0%) |
| Construction | 3 (33.3%) | 6 (66.7%) |
| Manufacturing | 25 (65.8%) | 13 (34.2%) |
| Wholesale Trade | 0 (0.0%) | 0 (0.0%) |
| Retail Trade | 1 (3.5%) | 28 (96.6%) |
| Transportation & Warehousing | 11 (100.0%) | 0 (0.0%) |
| Utilities | 0 (0.0%) | 0 (0.0%) |
| Information | 0 (0.0%) | 0 (0.0%) |
| Finance & Insurance | 0 (0.0%) | 0 (0.0%) |
| Real Estate, Rental & Leasing | 0 (0.0%) | 0 (0.0%) |
| Professional & Scientific | 0 (0.0%) | 4 (100.0%) |
| Enterprise Management | 0 (0.0%) | 0 (0.0%) |
| Administrative & Support | 4 (100.0%) | 0 (0.0%) |
| Educational Services | 11 (22.9%) | 37 (77.1%) |
| Health Care & Social Assistance | 10 (22.2%) | 35 (77.8%) |
| Arts, Entertainment & Recreation | 0 (0.0%) | 0 (0.0%) |
| Accommodation & Food Services | 3 (9.7%) | 28 (90.3%) |
| Public Administration | 13 (56.5%) | 10 (43.5%) |
| Total | 81 (33.1%) | 164 (66.9%) |
Education in Seaboard
School Enrollment in Seaboard
The most common levels of schooling among the 132 students in Seaboard are college / undergraduate (36 | 27.3%), elementary school (31 | 23.5%), and high school (30 | 22.7%).
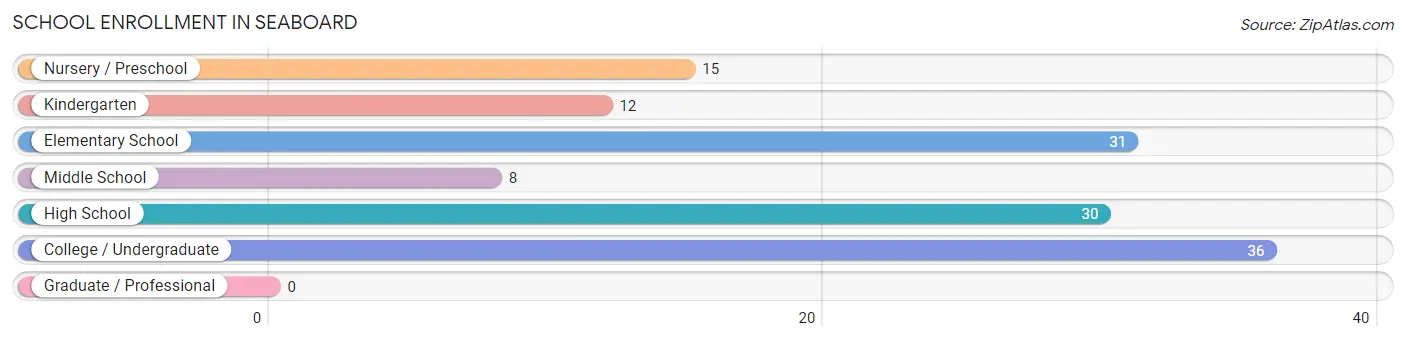
| School Level | # Students | % Students |
| Nursery / Preschool | 15 | 11.4% |
| Kindergarten | 12 | 9.1% |
| Elementary School | 31 | 23.5% |
| Middle School | 8 | 6.1% |
| High School | 30 | 22.7% |
| College / Undergraduate | 36 | 27.3% |
| Graduate / Professional | 0 | 0.0% |
| Total | 132 | 100.0% |
School Enrollment by Age by Funding Source in Seaboard
Out of a total of 132 students who are enrolled in schools in Seaboard, 20 (15.2%) attend a private institution, while the remaining 112 (84.8%) are enrolled in public schools. The age group of 25 to 34 year olds has the highest likelihood of being enrolled in private schools, with 10 (45.5% in the age bracket) enrolled. Conversely, the age group of 3 to 4 year olds has the lowest likelihood of being enrolled in a private school, with 12 (100.0% in the age bracket) attending a public institution.
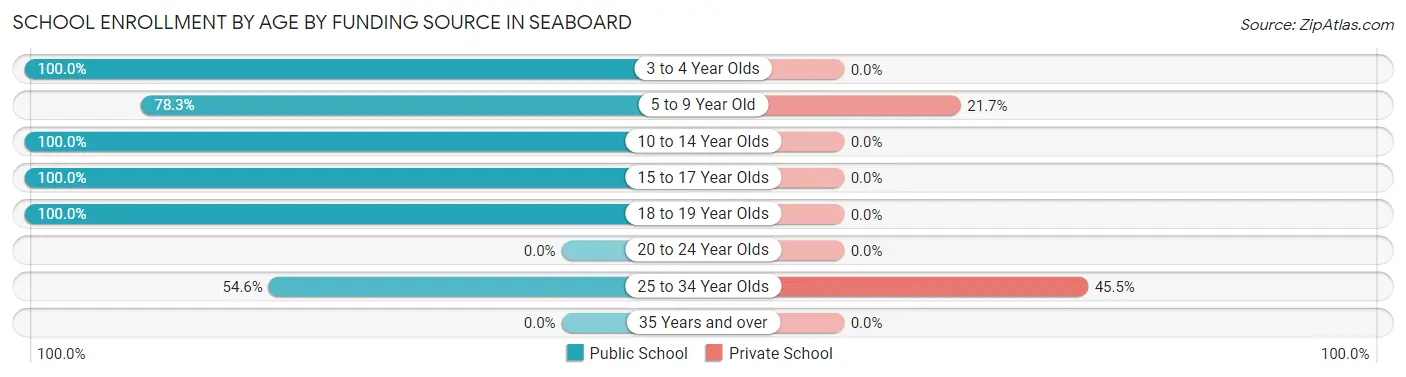
| Age Bracket | Public School | Private School |
| 3 to 4 Year Olds | 12 (100.0%) | 0 (0.0%) |
| 5 to 9 Year Old | 36 (78.3%) | 10 (21.7%) |
| 10 to 14 Year Olds | 10 (100.0%) | 0 (0.0%) |
| 15 to 17 Year Olds | 26 (100.0%) | 0 (0.0%) |
| 18 to 19 Year Olds | 16 (100.0%) | 0 (0.0%) |
| 20 to 24 Year Olds | 0 (0.0%) | 0 (0.0%) |
| 25 to 34 Year Olds | 12 (54.5%) | 10 (45.5%) |
| 35 Years and over | 0 (0.0%) | 0 (0.0%) |
| Total | 112 (84.8%) | 20 (15.2%) |
Educational Attainment by Field of Study in Seaboard
Education (21 | 75.0%), bio, nature & agricultural (3 | 10.7%), psychology (2 | 7.1%), and social sciences (2 | 7.1%) are the most common fields of study among 28 individuals in Seaboard who have obtained a bachelor's degree or higher.
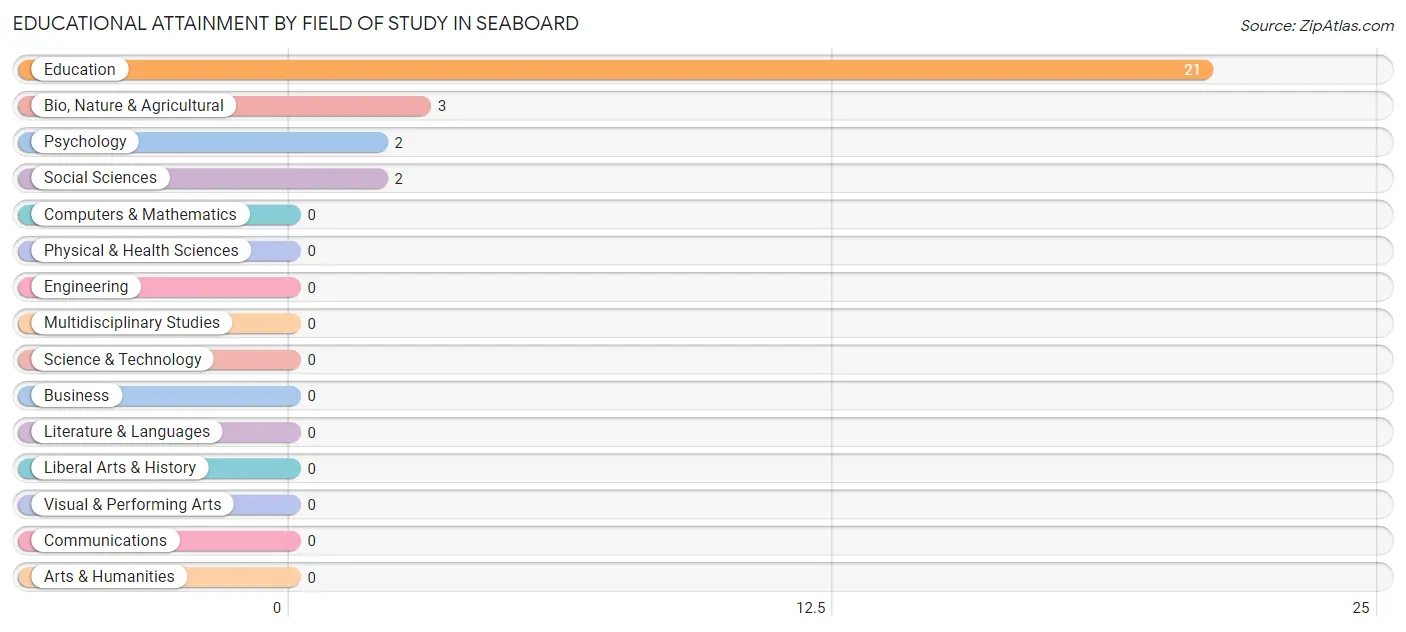
| Field of Study | # Graduates | % Graduates |
| Computers & Mathematics | 0 | 0.0% |
| Bio, Nature & Agricultural | 3 | 10.7% |
| Physical & Health Sciences | 0 | 0.0% |
| Psychology | 2 | 7.1% |
| Social Sciences | 2 | 7.1% |
| Engineering | 0 | 0.0% |
| Multidisciplinary Studies | 0 | 0.0% |
| Science & Technology | 0 | 0.0% |
| Business | 0 | 0.0% |
| Education | 21 | 75.0% |
| Literature & Languages | 0 | 0.0% |
| Liberal Arts & History | 0 | 0.0% |
| Visual & Performing Arts | 0 | 0.0% |
| Communications | 0 | 0.0% |
| Arts & Humanities | 0 | 0.0% |
| Total | 28 | 100.0% |
Transportation & Commute in Seaboard
Vehicle Availability by Sex in Seaboard
The most prevalent vehicle ownership categories in Seaboard are males with 2 vehicles (44, accounting for 54.3%) and females with 2 vehicles (45, making up 28.9%).
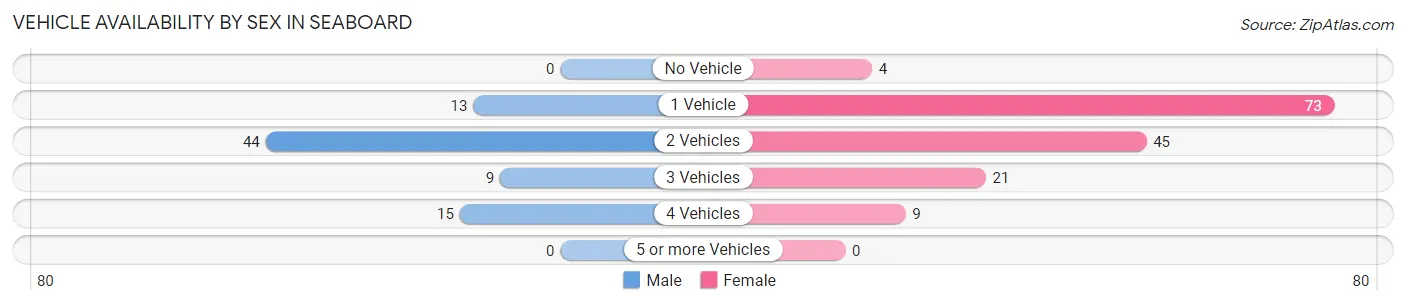
| Vehicles Available | Male | Female |
| No Vehicle | 0 (0.0%) | 4 (2.6%) |
| 1 Vehicle | 13 (16.1%) | 73 (48.0%) |
| 2 Vehicles | 44 (54.3%) | 45 (29.6%) |
| 3 Vehicles | 9 (11.1%) | 21 (13.8%) |
| 4 Vehicles | 15 (18.5%) | 9 (5.9%) |
| 5 or more Vehicles | 0 (0.0%) | 0 (0.0%) |
| Total | 81 (100.0%) | 152 (100.0%) |
Commute Time in Seaboard
The most frequently occuring commute durations in Seaboard are 30 to 34 minutes (70 commuters, 30.8%), 20 to 24 minutes (32 commuters, 14.1%), and 15 to 19 minutes (24 commuters, 10.6%).
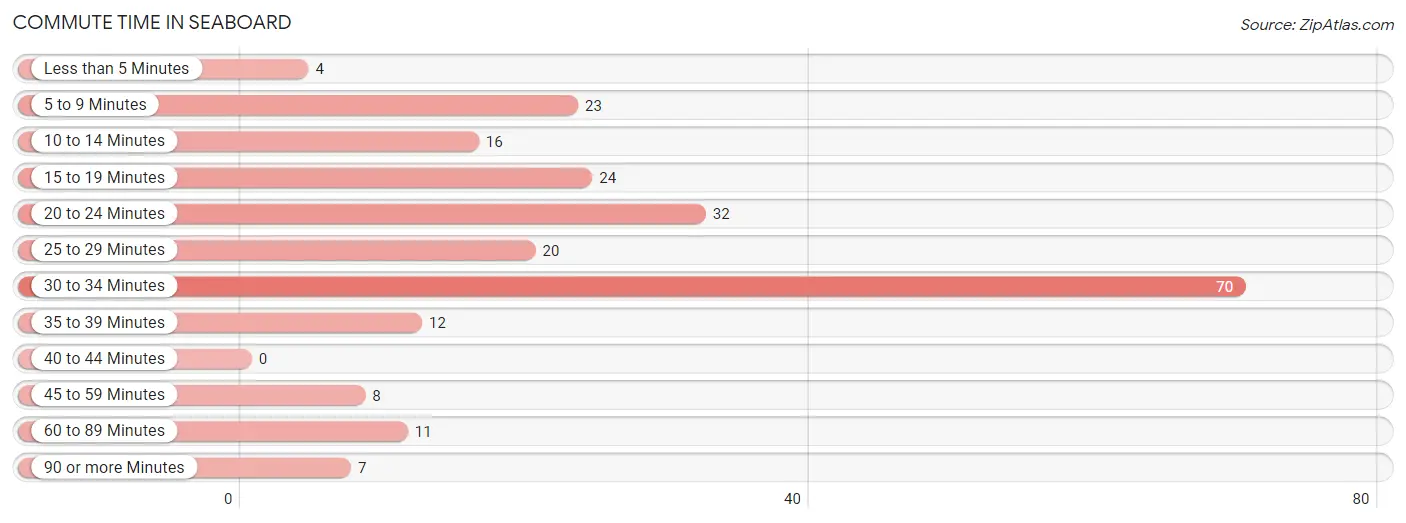
| Commute Time | # Commuters | % Commuters |
| Less than 5 Minutes | 4 | 1.8% |
| 5 to 9 Minutes | 23 | 10.1% |
| 10 to 14 Minutes | 16 | 7.0% |
| 15 to 19 Minutes | 24 | 10.6% |
| 20 to 24 Minutes | 32 | 14.1% |
| 25 to 29 Minutes | 20 | 8.8% |
| 30 to 34 Minutes | 70 | 30.8% |
| 35 to 39 Minutes | 12 | 5.3% |
| 40 to 44 Minutes | 0 | 0.0% |
| 45 to 59 Minutes | 8 | 3.5% |
| 60 to 89 Minutes | 11 | 4.9% |
| 90 or more Minutes | 7 | 3.1% |
Commute Time by Sex in Seaboard
The most common commute times in Seaboard are 20 to 24 minutes (17 commuters, 21.8%) for males and 30 to 34 minutes (56 commuters, 37.6%) for females.
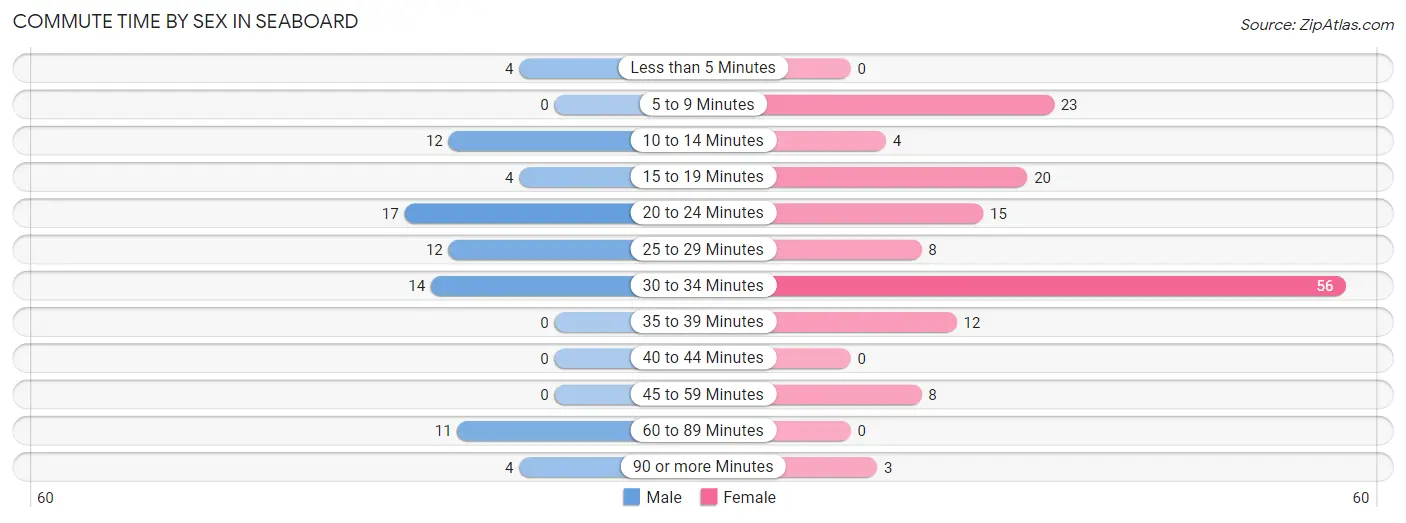
| Commute Time | Male | Female |
| Less than 5 Minutes | 4 (5.1%) | 0 (0.0%) |
| 5 to 9 Minutes | 0 (0.0%) | 23 (15.4%) |
| 10 to 14 Minutes | 12 (15.4%) | 4 (2.7%) |
| 15 to 19 Minutes | 4 (5.1%) | 20 (13.4%) |
| 20 to 24 Minutes | 17 (21.8%) | 15 (10.1%) |
| 25 to 29 Minutes | 12 (15.4%) | 8 (5.4%) |
| 30 to 34 Minutes | 14 (17.9%) | 56 (37.6%) |
| 35 to 39 Minutes | 0 (0.0%) | 12 (8.1%) |
| 40 to 44 Minutes | 0 (0.0%) | 0 (0.0%) |
| 45 to 59 Minutes | 0 (0.0%) | 8 (5.4%) |
| 60 to 89 Minutes | 11 (14.1%) | 0 (0.0%) |
| 90 or more Minutes | 4 (5.1%) | 3 (2.0%) |
Time of Departure to Work by Sex in Seaboard
The most frequent times of departure to work in Seaboard are 12:00 AM to 4:59 AM (24, 30.8%) for males and 7:00 AM to 7:29 AM (59, 39.6%) for females.
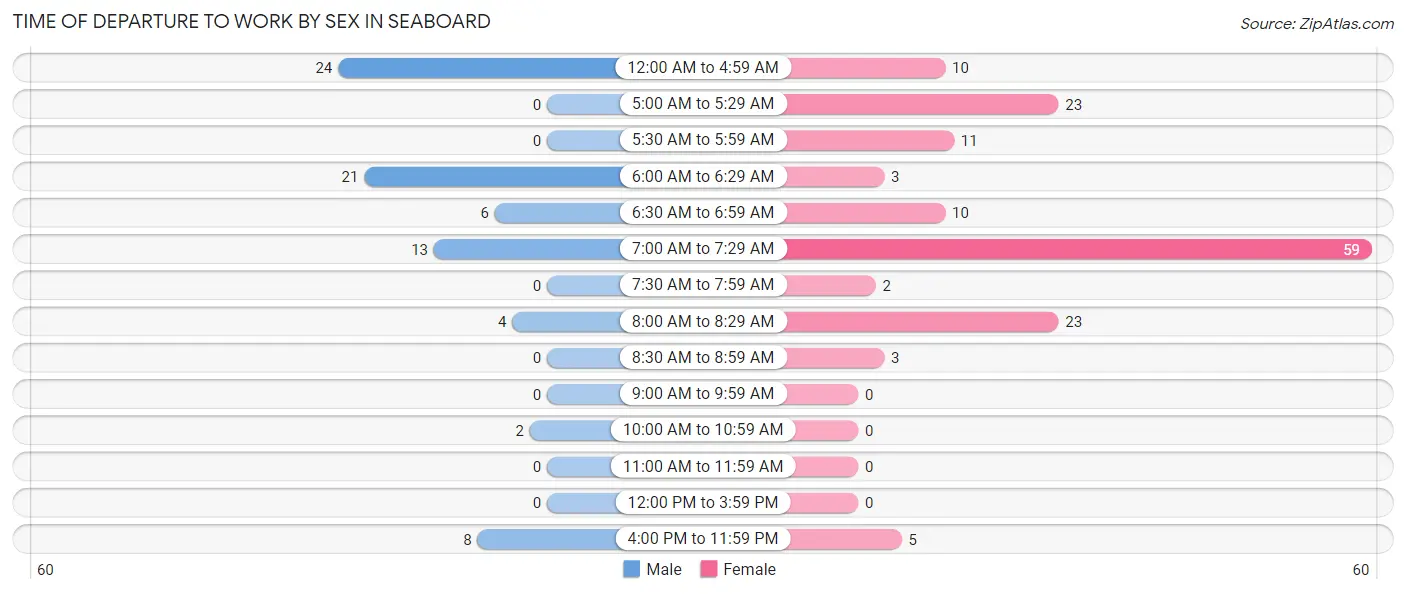
| Time of Departure | Male | Female |
| 12:00 AM to 4:59 AM | 24 (30.8%) | 10 (6.7%) |
| 5:00 AM to 5:29 AM | 0 (0.0%) | 23 (15.4%) |
| 5:30 AM to 5:59 AM | 0 (0.0%) | 11 (7.4%) |
| 6:00 AM to 6:29 AM | 21 (26.9%) | 3 (2.0%) |
| 6:30 AM to 6:59 AM | 6 (7.7%) | 10 (6.7%) |
| 7:00 AM to 7:29 AM | 13 (16.7%) | 59 (39.6%) |
| 7:30 AM to 7:59 AM | 0 (0.0%) | 2 (1.3%) |
| 8:00 AM to 8:29 AM | 4 (5.1%) | 23 (15.4%) |
| 8:30 AM to 8:59 AM | 0 (0.0%) | 3 (2.0%) |
| 9:00 AM to 9:59 AM | 0 (0.0%) | 0 (0.0%) |
| 10:00 AM to 10:59 AM | 2 (2.6%) | 0 (0.0%) |
| 11:00 AM to 11:59 AM | 0 (0.0%) | 0 (0.0%) |
| 12:00 PM to 3:59 PM | 0 (0.0%) | 0 (0.0%) |
| 4:00 PM to 11:59 PM | 8 (10.3%) | 5 (3.4%) |
| Total | 78 (100.0%) | 149 (100.0%) |
Housing Occupancy in Seaboard
Occupancy by Ownership in Seaboard
Of the total 287 dwellings in Seaboard, owner-occupied units account for 169 (58.9%), while renter-occupied units make up 118 (41.1%).
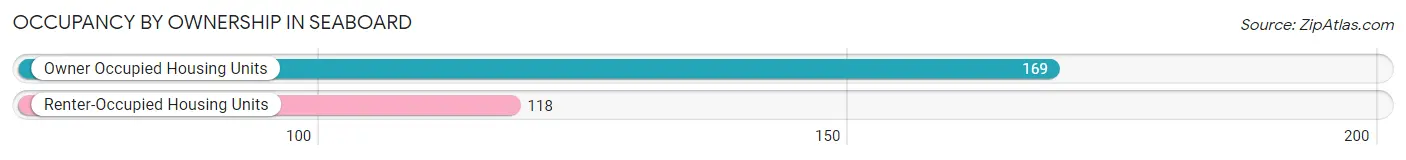
| Occupancy | # Housing Units | % Housing Units |
| Owner Occupied Housing Units | 169 | 58.9% |
| Renter-Occupied Housing Units | 118 | 41.1% |
| Total Occupied Housing Units | 287 | 100.0% |
Occupancy by Household Size in Seaboard
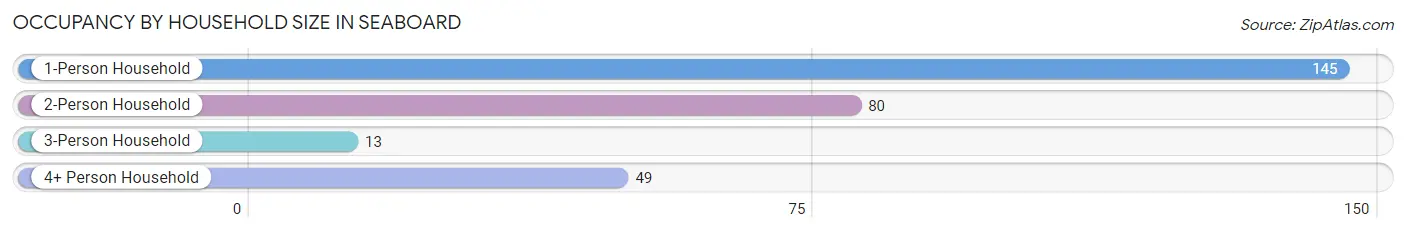
| Household Size | # Housing Units | % Housing Units |
| 1-Person Household | 145 | 50.5% |
| 2-Person Household | 80 | 27.9% |
| 3-Person Household | 13 | 4.5% |
| 4+ Person Household | 49 | 17.1% |
| Total Housing Units | 287 | 100.0% |
Occupancy by Ownership by Household Size in Seaboard
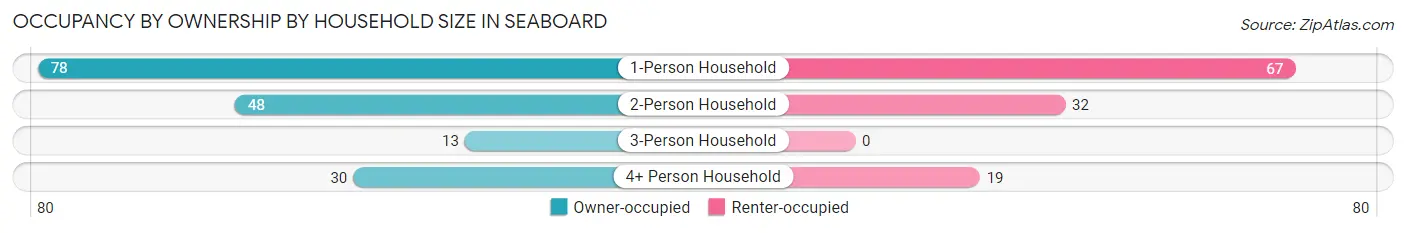
| Household Size | Owner-occupied | Renter-occupied |
| 1-Person Household | 78 (53.8%) | 67 (46.2%) |
| 2-Person Household | 48 (60.0%) | 32 (40.0%) |
| 3-Person Household | 13 (100.0%) | 0 (0.0%) |
| 4+ Person Household | 30 (61.2%) | 19 (38.8%) |
| Total Housing Units | 169 (58.9%) | 118 (41.1%) |
Occupancy by Educational Attainment in Seaboard
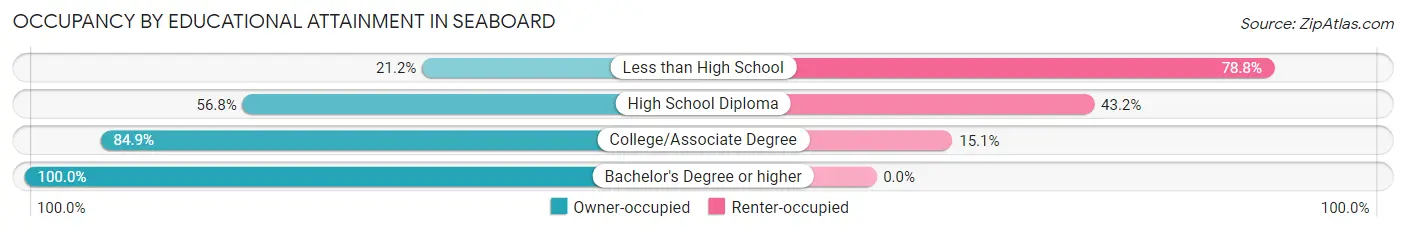
| Household Size | Owner-occupied | Renter-occupied |
| Less than High School | 18 (21.2%) | 67 (78.8%) |
| High School Diploma | 46 (56.8%) | 35 (43.2%) |
| College/Associate Degree | 90 (84.9%) | 16 (15.1%) |
| Bachelor's Degree or higher | 15 (100.0%) | 0 (0.0%) |
Occupancy by Age of Householder in Seaboard
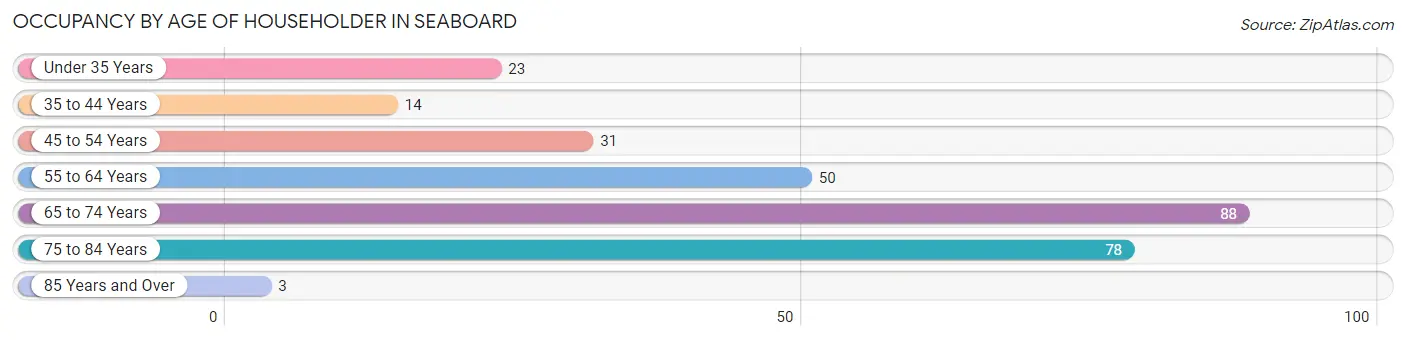
| Age Bracket | # Households | % Households |
| Under 35 Years | 23 | 8.0% |
| 35 to 44 Years | 14 | 4.9% |
| 45 to 54 Years | 31 | 10.8% |
| 55 to 64 Years | 50 | 17.4% |
| 65 to 74 Years | 88 | 30.7% |
| 75 to 84 Years | 78 | 27.2% |
| 85 Years and Over | 3 | 1.1% |
| Total | 287 | 100.0% |
Housing Finances in Seaboard
Median Income by Occupancy in Seaboard
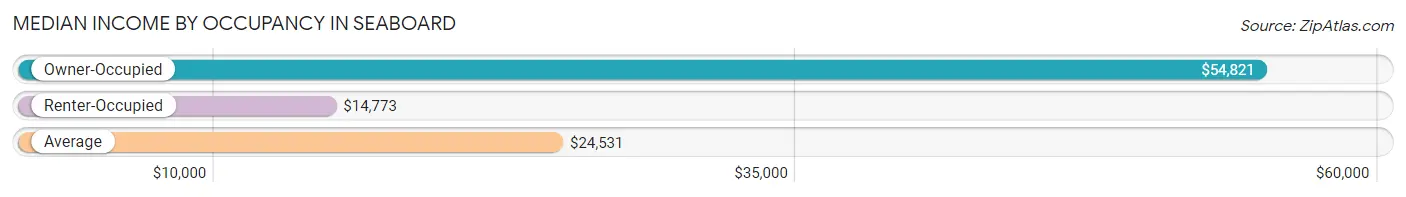
| Occupancy Type | # Households | Median Income |
| Owner-Occupied | 169 (58.9%) | $54,821 |
| Renter-Occupied | 118 (41.1%) | $14,773 |
| Average | 287 (100.0%) | $24,531 |
Occupancy by Householder Income Bracket in Seaboard
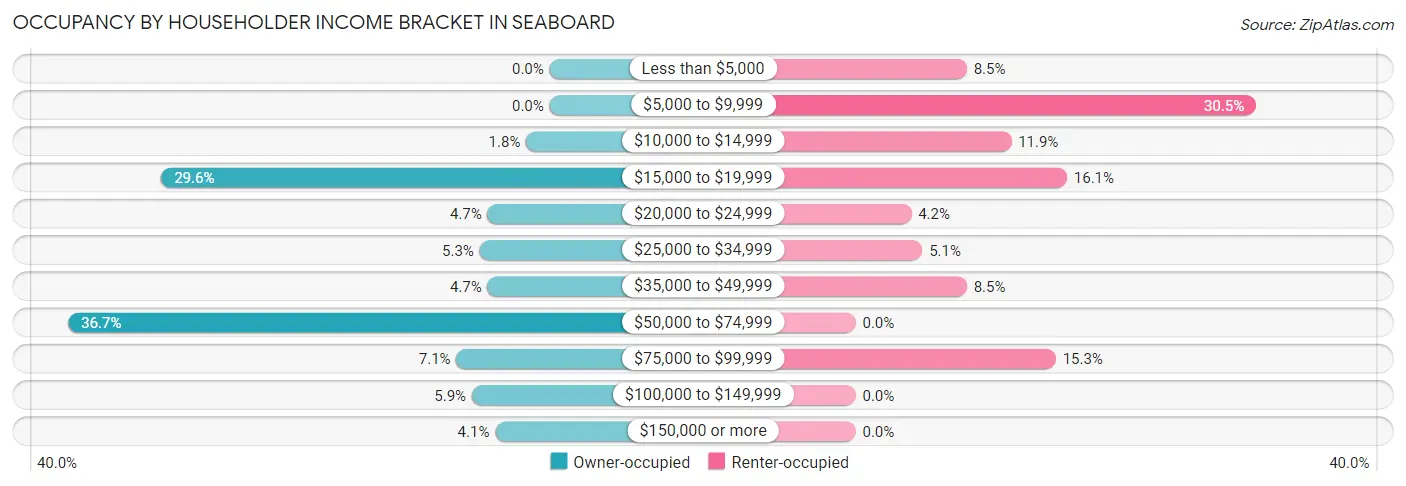
| Income Bracket | Owner-occupied | Renter-occupied |
| Less than $5,000 | 0 (0.0%) | 10 (8.5%) |
| $5,000 to $9,999 | 0 (0.0%) | 36 (30.5%) |
| $10,000 to $14,999 | 3 (1.8%) | 14 (11.9%) |
| $15,000 to $19,999 | 50 (29.6%) | 19 (16.1%) |
| $20,000 to $24,999 | 8 (4.7%) | 5 (4.2%) |
| $25,000 to $34,999 | 9 (5.3%) | 6 (5.1%) |
| $35,000 to $49,999 | 8 (4.7%) | 10 (8.5%) |
| $50,000 to $74,999 | 62 (36.7%) | 0 (0.0%) |
| $75,000 to $99,999 | 12 (7.1%) | 18 (15.2%) |
| $100,000 to $149,999 | 10 (5.9%) | 0 (0.0%) |
| $150,000 or more | 7 (4.1%) | 0 (0.0%) |
| Total | 169 (100.0%) | 118 (100.0%) |
Monthly Housing Cost Tiers in Seaboard
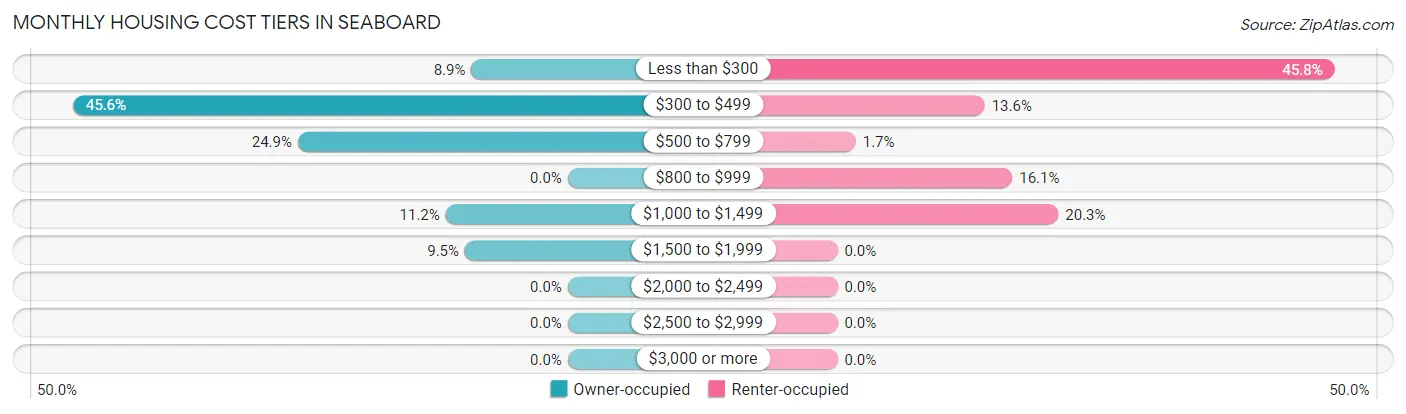
| Monthly Cost | Owner-occupied | Renter-occupied |
| Less than $300 | 15 (8.9%) | 54 (45.8%) |
| $300 to $499 | 77 (45.6%) | 16 (13.6%) |
| $500 to $799 | 42 (24.8%) | 2 (1.7%) |
| $800 to $999 | 0 (0.0%) | 19 (16.1%) |
| $1,000 to $1,499 | 19 (11.2%) | 24 (20.3%) |
| $1,500 to $1,999 | 16 (9.5%) | 0 (0.0%) |
| $2,000 to $2,499 | 0 (0.0%) | 0 (0.0%) |
| $2,500 to $2,999 | 0 (0.0%) | 0 (0.0%) |
| $3,000 or more | 0 (0.0%) | 0 (0.0%) |
| Total | 169 (100.0%) | 118 (100.0%) |
Physical Housing Characteristics in Seaboard
Housing Structures in Seaboard
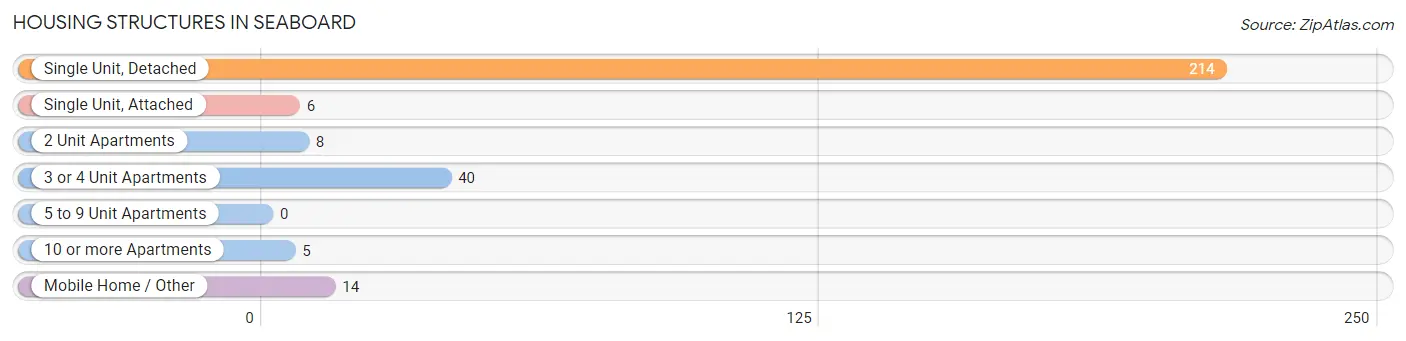
| Structure Type | # Housing Units | % Housing Units |
| Single Unit, Detached | 214 | 74.6% |
| Single Unit, Attached | 6 | 2.1% |
| 2 Unit Apartments | 8 | 2.8% |
| 3 or 4 Unit Apartments | 40 | 13.9% |
| 5 to 9 Unit Apartments | 0 | 0.0% |
| 10 or more Apartments | 5 | 1.7% |
| Mobile Home / Other | 14 | 4.9% |
| Total | 287 | 100.0% |
Housing Structures by Occupancy in Seaboard
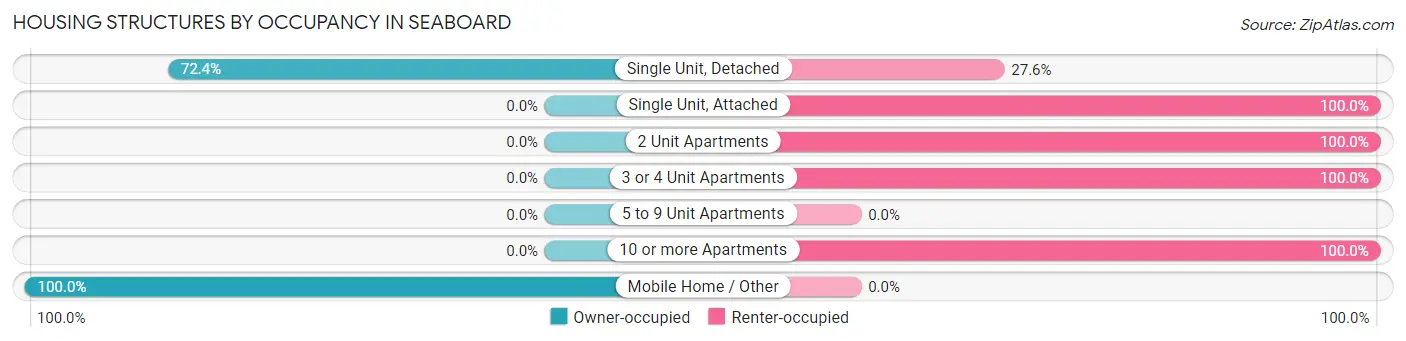
| Structure Type | Owner-occupied | Renter-occupied |
| Single Unit, Detached | 155 (72.4%) | 59 (27.6%) |
| Single Unit, Attached | 0 (0.0%) | 6 (100.0%) |
| 2 Unit Apartments | 0 (0.0%) | 8 (100.0%) |
| 3 or 4 Unit Apartments | 0 (0.0%) | 40 (100.0%) |
| 5 to 9 Unit Apartments | 0 (0.0%) | 0 (0.0%) |
| 10 or more Apartments | 0 (0.0%) | 5 (100.0%) |
| Mobile Home / Other | 14 (100.0%) | 0 (0.0%) |
| Total | 169 (58.9%) | 118 (41.1%) |
Housing Structures by Number of Rooms in Seaboard
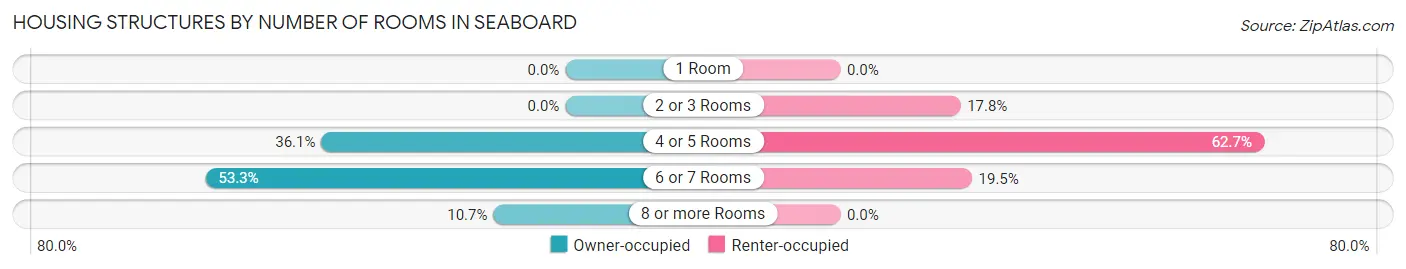
| Number of Rooms | Owner-occupied | Renter-occupied |
| 1 Room | 0 (0.0%) | 0 (0.0%) |
| 2 or 3 Rooms | 0 (0.0%) | 21 (17.8%) |
| 4 or 5 Rooms | 61 (36.1%) | 74 (62.7%) |
| 6 or 7 Rooms | 90 (53.2%) | 23 (19.5%) |
| 8 or more Rooms | 18 (10.6%) | 0 (0.0%) |
| Total | 169 (100.0%) | 118 (100.0%) |
Housing Structure by Heating Type in Seaboard
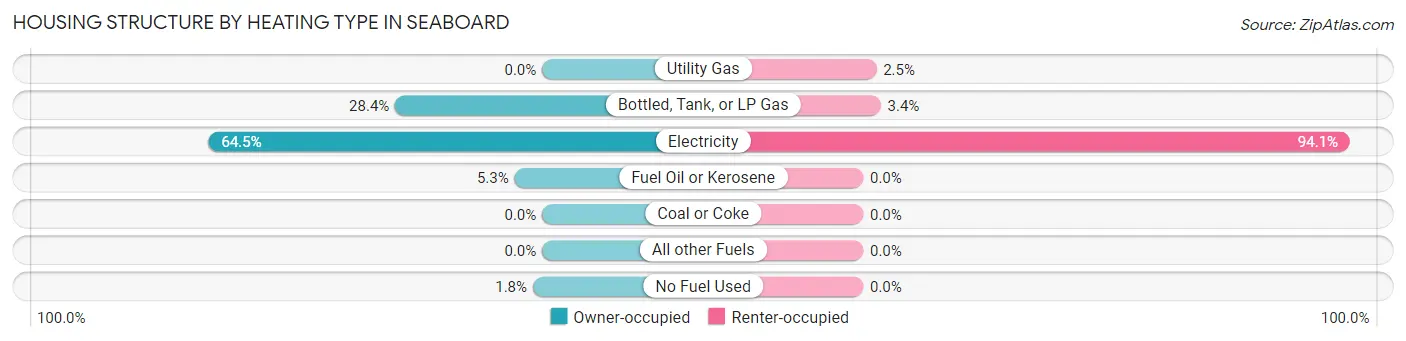
| Heating Type | Owner-occupied | Renter-occupied |
| Utility Gas | 0 (0.0%) | 3 (2.5%) |
| Bottled, Tank, or LP Gas | 48 (28.4%) | 4 (3.4%) |
| Electricity | 109 (64.5%) | 111 (94.1%) |
| Fuel Oil or Kerosene | 9 (5.3%) | 0 (0.0%) |
| Coal or Coke | 0 (0.0%) | 0 (0.0%) |
| All other Fuels | 0 (0.0%) | 0 (0.0%) |
| No Fuel Used | 3 (1.8%) | 0 (0.0%) |
| Total | 169 (100.0%) | 118 (100.0%) |
Household Vehicle Usage in Seaboard
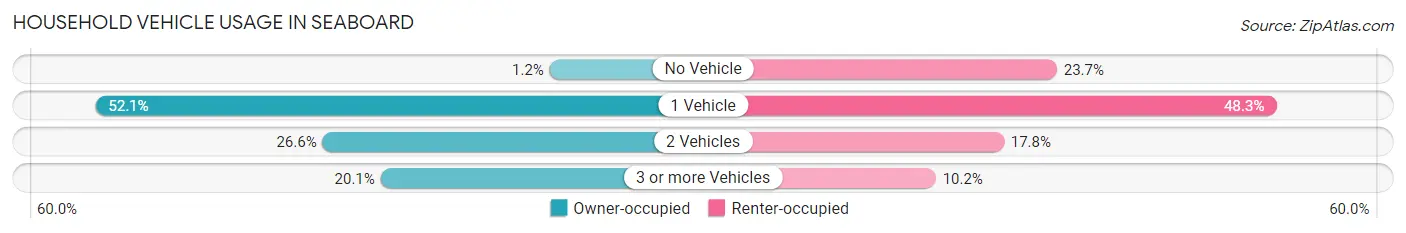
| Vehicles per Household | Owner-occupied | Renter-occupied |
| No Vehicle | 2 (1.2%) | 28 (23.7%) |
| 1 Vehicle | 88 (52.1%) | 57 (48.3%) |
| 2 Vehicles | 45 (26.6%) | 21 (17.8%) |
| 3 or more Vehicles | 34 (20.1%) | 12 (10.2%) |
| Total | 169 (100.0%) | 118 (100.0%) |
Real Estate & Mortgages in Seaboard
Real Estate and Mortgage Overview in Seaboard
| Characteristic | Without Mortgage | With Mortgage |
| Housing Units | 127 | 42 |
| Median Property Value | $62,500 | $103,100 |
| Median Household Income | - | - |
| Monthly Housing Costs | $389 | $0 |
| Real Estate Taxes | $1,331 | $0 |
Property Value by Mortgage Status in Seaboard
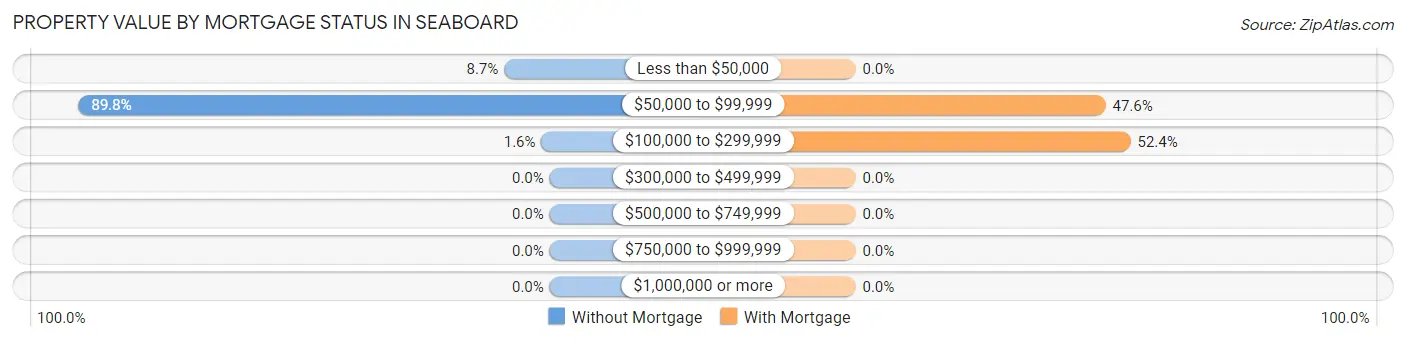
| Property Value | Without Mortgage | With Mortgage |
| Less than $50,000 | 11 (8.7%) | 0 (0.0%) |
| $50,000 to $99,999 | 114 (89.8%) | 20 (47.6%) |
| $100,000 to $299,999 | 2 (1.6%) | 22 (52.4%) |
| $300,000 to $499,999 | 0 (0.0%) | 0 (0.0%) |
| $500,000 to $749,999 | 0 (0.0%) | 0 (0.0%) |
| $750,000 to $999,999 | 0 (0.0%) | 0 (0.0%) |
| $1,000,000 or more | 0 (0.0%) | 0 (0.0%) |
| Total | 127 (100.0%) | 42 (100.0%) |
Household Income by Mortgage Status in Seaboard
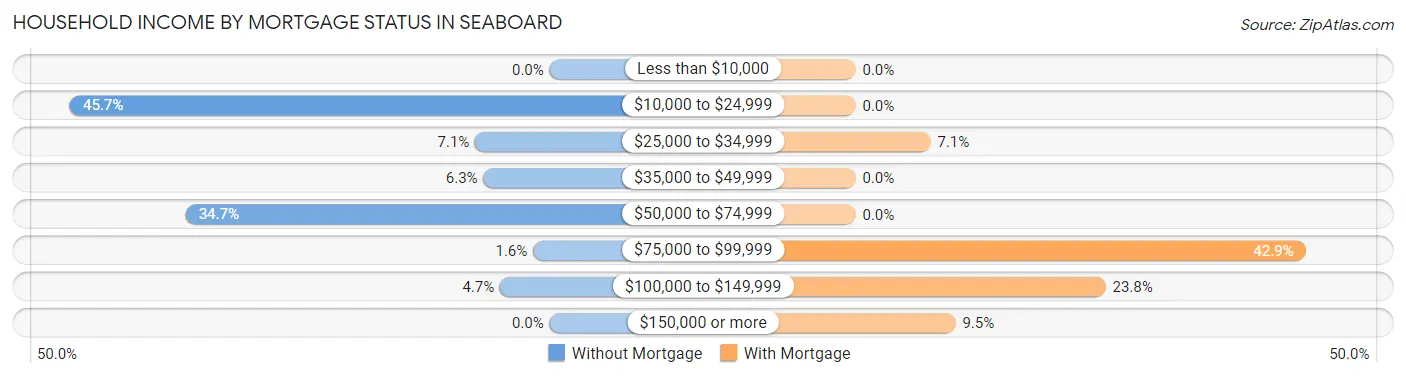
| Household Income | Without Mortgage | With Mortgage |
| Less than $10,000 | 0 (0.0%) | 0 (0.0%) |
| $10,000 to $24,999 | 58 (45.7%) | 0 (0.0%) |
| $25,000 to $34,999 | 9 (7.1%) | 3 (7.1%) |
| $35,000 to $49,999 | 8 (6.3%) | 0 (0.0%) |
| $50,000 to $74,999 | 44 (34.6%) | 0 (0.0%) |
| $75,000 to $99,999 | 2 (1.6%) | 18 (42.9%) |
| $100,000 to $149,999 | 6 (4.7%) | 10 (23.8%) |
| $150,000 or more | 0 (0.0%) | 4 (9.5%) |
| Total | 127 (100.0%) | 42 (100.0%) |
Property Value to Household Income Ratio in Seaboard
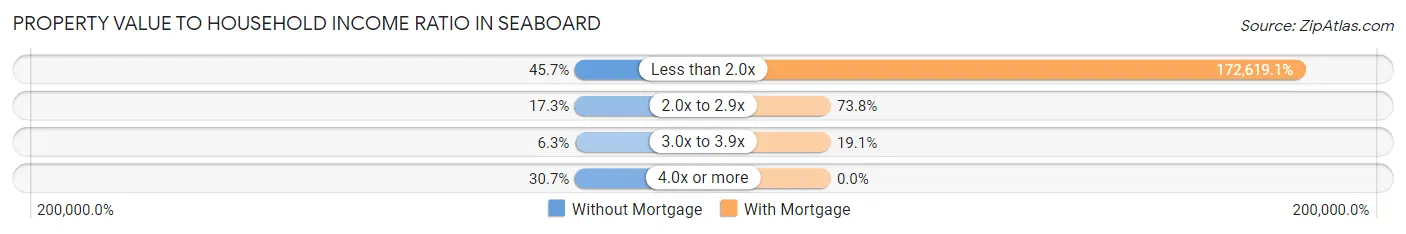
| Value-to-Income Ratio | Without Mortgage | With Mortgage |
| Less than 2.0x | 58 (45.7%) | 72,500 (172,619.0%) |
| 2.0x to 2.9x | 22 (17.3%) | 31 (73.8%) |
| 3.0x to 3.9x | 8 (6.3%) | 8 (19.1%) |
| 4.0x or more | 39 (30.7%) | 0 (0.0%) |
| Total | 127 (100.0%) | 42 (100.0%) |
Real Estate Taxes by Mortgage Status in Seaboard
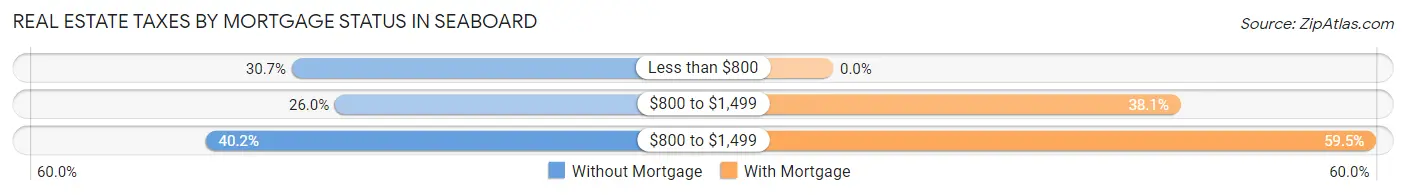
| Property Taxes | Without Mortgage | With Mortgage |
| Less than $800 | 39 (30.7%) | 0 (0.0%) |
| $800 to $1,499 | 33 (26.0%) | 16 (38.1%) |
| $800 to $1,499 | 51 (40.2%) | 25 (59.5%) |
| Total | 127 (100.0%) | 42 (100.0%) |
Health & Disability in Seaboard
Health Insurance Coverage by Age in Seaboard
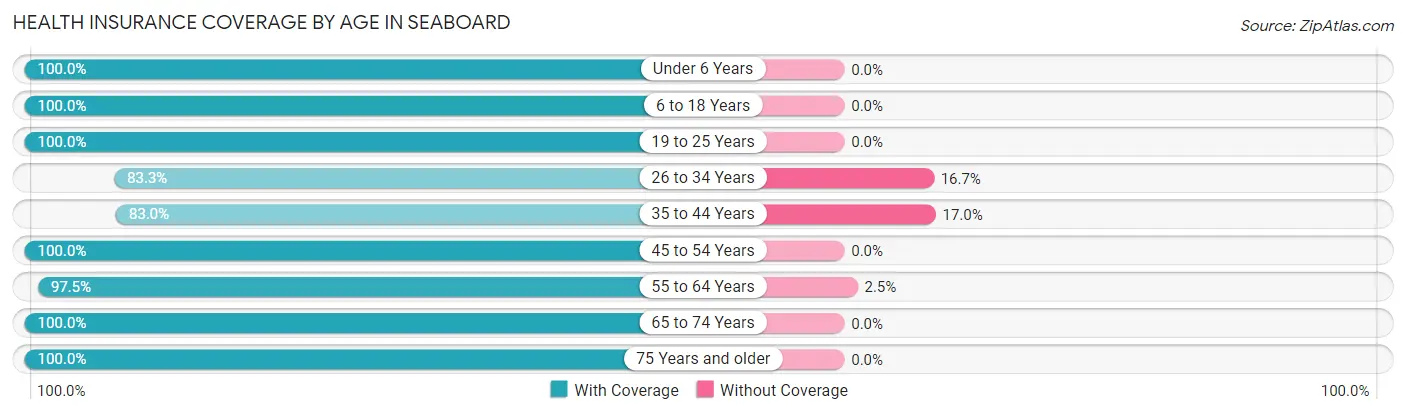
| Age Bracket | With Coverage | Without Coverage |
| Under 6 Years | 41 (100.0%) | 0 (0.0%) |
| 6 to 18 Years | 87 (100.0%) | 0 (0.0%) |
| 19 to 25 Years | 35 (100.0%) | 0 (0.0%) |
| 26 to 34 Years | 50 (83.3%) | 10 (16.7%) |
| 35 to 44 Years | 39 (83.0%) | 8 (17.0%) |
| 45 to 54 Years | 35 (100.0%) | 0 (0.0%) |
| 55 to 64 Years | 79 (97.5%) | 2 (2.5%) |
| 65 to 74 Years | 124 (100.0%) | 0 (0.0%) |
| 75 Years and older | 93 (100.0%) | 0 (0.0%) |
| Total | 583 (96.7%) | 20 (3.3%) |
Health Insurance Coverage by Citizenship Status in Seaboard

| Citizenship Status | With Coverage | Without Coverage |
| Native Born | 41 (100.0%) | 0 (0.0%) |
| Foreign Born, Citizen | 87 (100.0%) | 0 (0.0%) |
| Foreign Born, not a Citizen | 35 (100.0%) | 0 (0.0%) |
Health Insurance Coverage by Household Income in Seaboard
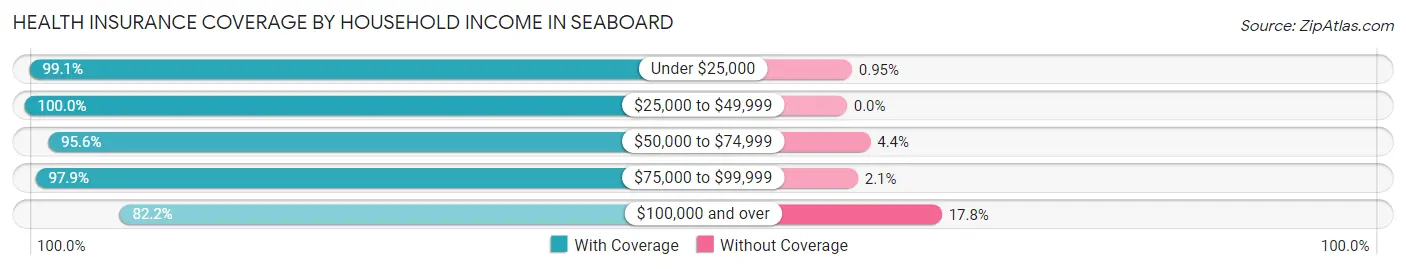
| Household Income | With Coverage | Without Coverage |
| Under $25,000 | 209 (99.1%) | 2 (0.9%) |
| $25,000 to $49,999 | 68 (100.0%) | 0 (0.0%) |
| $50,000 to $74,999 | 174 (95.6%) | 8 (4.4%) |
| $75,000 to $99,999 | 95 (97.9%) | 2 (2.1%) |
| $100,000 and over | 37 (82.2%) | 8 (17.8%) |
Public vs Private Health Insurance Coverage by Age in Seaboard
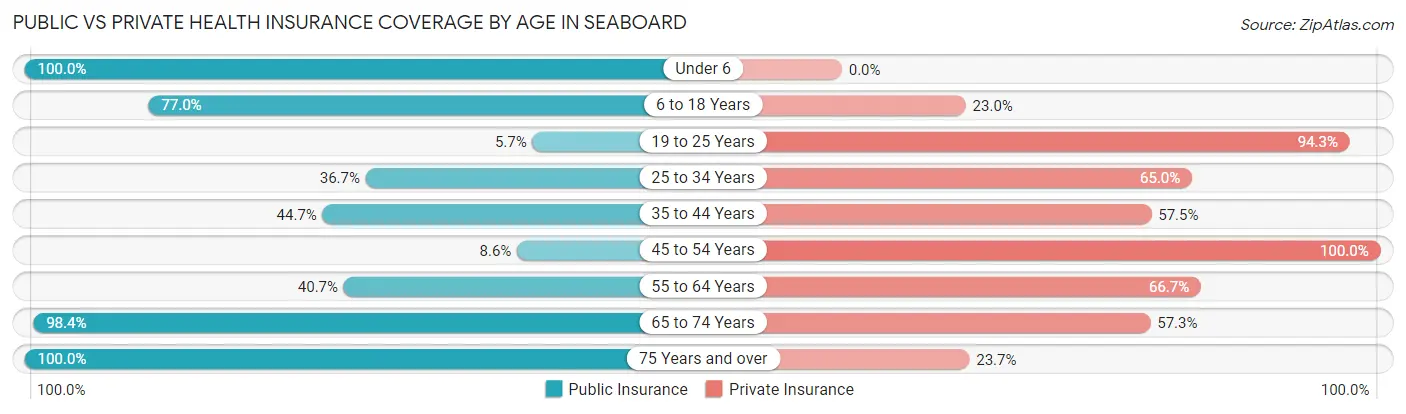
| Age Bracket | Public Insurance | Private Insurance |
| Under 6 | 41 (100.0%) | 0 (0.0%) |
| 6 to 18 Years | 67 (77.0%) | 20 (23.0%) |
| 19 to 25 Years | 2 (5.7%) | 33 (94.3%) |
| 25 to 34 Years | 22 (36.7%) | 39 (65.0%) |
| 35 to 44 Years | 21 (44.7%) | 27 (57.5%) |
| 45 to 54 Years | 3 (8.6%) | 35 (100.0%) |
| 55 to 64 Years | 33 (40.7%) | 54 (66.7%) |
| 65 to 74 Years | 122 (98.4%) | 71 (57.3%) |
| 75 Years and over | 93 (100.0%) | 22 (23.7%) |
| Total | 404 (67.0%) | 301 (49.9%) |
Disability Status by Sex by Age in Seaboard
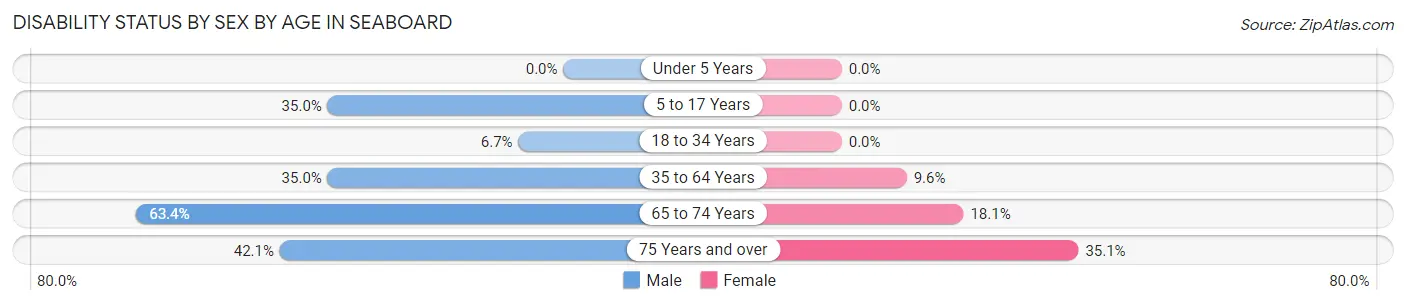
| Age Bracket | Male | Female |
| Under 5 Years | 0 (0.0%) | 0 (0.0%) |
| 5 to 17 Years | 14 (35.0%) | 0 (0.0%) |
| 18 to 34 Years | 2 (6.7%) | 0 (0.0%) |
| 35 to 64 Years | 28 (35.0%) | 8 (9.6%) |
| 65 to 74 Years | 26 (63.4%) | 15 (18.1%) |
| 75 Years and over | 8 (42.1%) | 26 (35.1%) |
Disability Class by Sex by Age in Seaboard
Disability Class: Hearing Difficulty
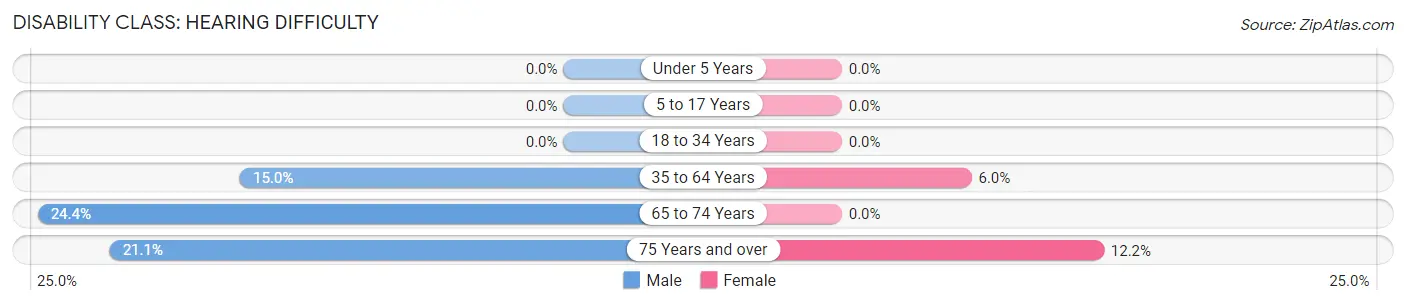
| Age Bracket | Male | Female |
| Under 5 Years | 0 (0.0%) | 0 (0.0%) |
| 5 to 17 Years | 0 (0.0%) | 0 (0.0%) |
| 18 to 34 Years | 0 (0.0%) | 0 (0.0%) |
| 35 to 64 Years | 12 (15.0%) | 5 (6.0%) |
| 65 to 74 Years | 10 (24.4%) | 0 (0.0%) |
| 75 Years and over | 4 (21.0%) | 9 (12.2%) |
Disability Class: Vision Difficulty
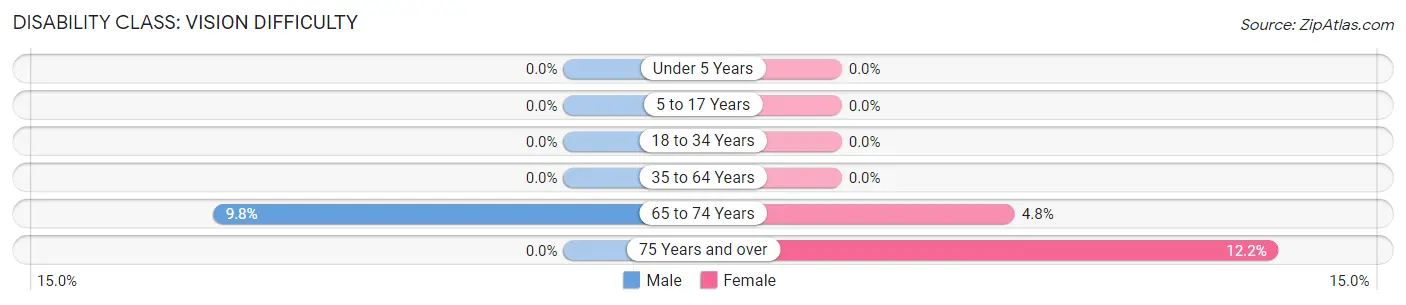
| Age Bracket | Male | Female |
| Under 5 Years | 0 (0.0%) | 0 (0.0%) |
| 5 to 17 Years | 0 (0.0%) | 0 (0.0%) |
| 18 to 34 Years | 0 (0.0%) | 0 (0.0%) |
| 35 to 64 Years | 0 (0.0%) | 0 (0.0%) |
| 65 to 74 Years | 4 (9.8%) | 4 (4.8%) |
| 75 Years and over | 0 (0.0%) | 9 (12.2%) |
Disability Class: Cognitive Difficulty
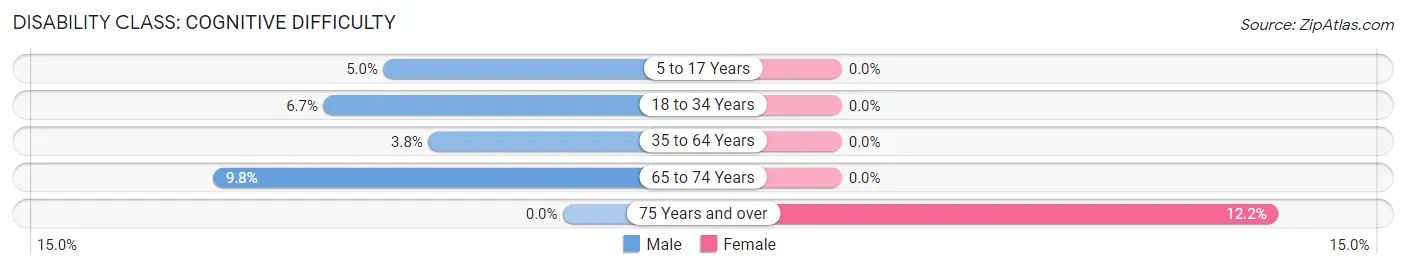
| Age Bracket | Male | Female |
| 5 to 17 Years | 2 (5.0%) | 0 (0.0%) |
| 18 to 34 Years | 2 (6.7%) | 0 (0.0%) |
| 35 to 64 Years | 3 (3.7%) | 0 (0.0%) |
| 65 to 74 Years | 4 (9.8%) | 0 (0.0%) |
| 75 Years and over | 0 (0.0%) | 9 (12.2%) |
Disability Class: Ambulatory Difficulty
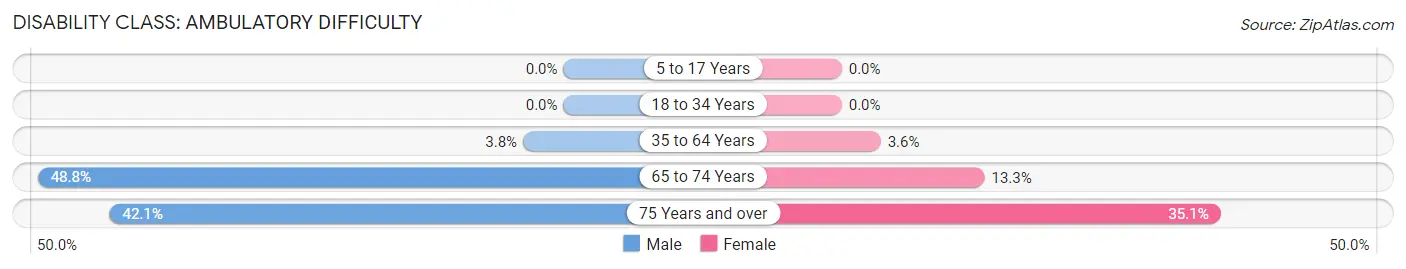
| Age Bracket | Male | Female |
| 5 to 17 Years | 0 (0.0%) | 0 (0.0%) |
| 18 to 34 Years | 0 (0.0%) | 0 (0.0%) |
| 35 to 64 Years | 3 (3.7%) | 3 (3.6%) |
| 65 to 74 Years | 20 (48.8%) | 11 (13.3%) |
| 75 Years and over | 8 (42.1%) | 26 (35.1%) |
Disability Class: Self-Care Difficulty
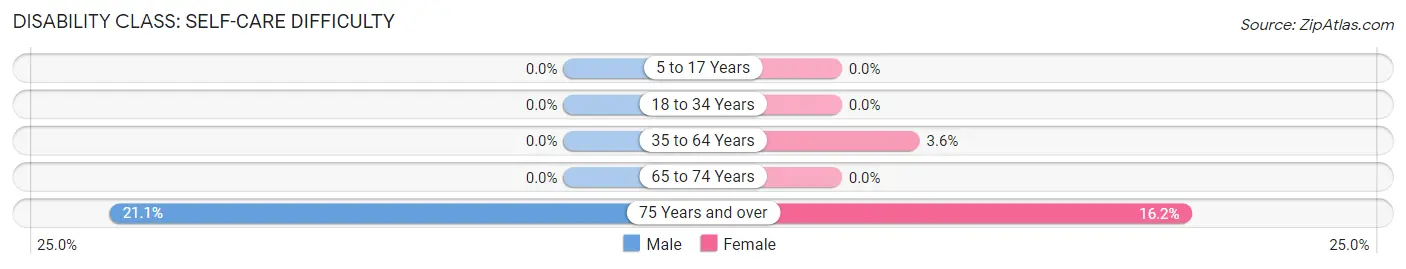
| Age Bracket | Male | Female |
| 5 to 17 Years | 0 (0.0%) | 0 (0.0%) |
| 18 to 34 Years | 0 (0.0%) | 0 (0.0%) |
| 35 to 64 Years | 0 (0.0%) | 3 (3.6%) |
| 65 to 74 Years | 0 (0.0%) | 0 (0.0%) |
| 75 Years and over | 4 (21.0%) | 12 (16.2%) |
Technology Access in Seaboard
Computing Device Access in Seaboard
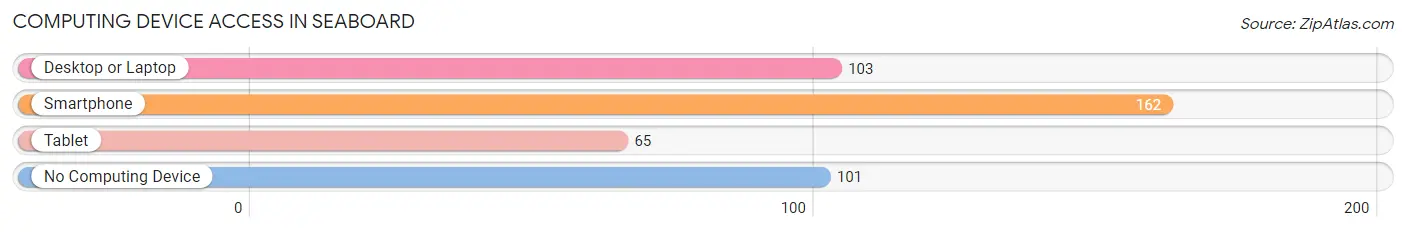
| Device Type | # Households | % Households |
| Desktop or Laptop | 103 | 35.9% |
| Smartphone | 162 | 56.5% |
| Tablet | 65 | 22.7% |
| No Computing Device | 101 | 35.2% |
| Total | 287 | 100.0% |
Internet Access in Seaboard
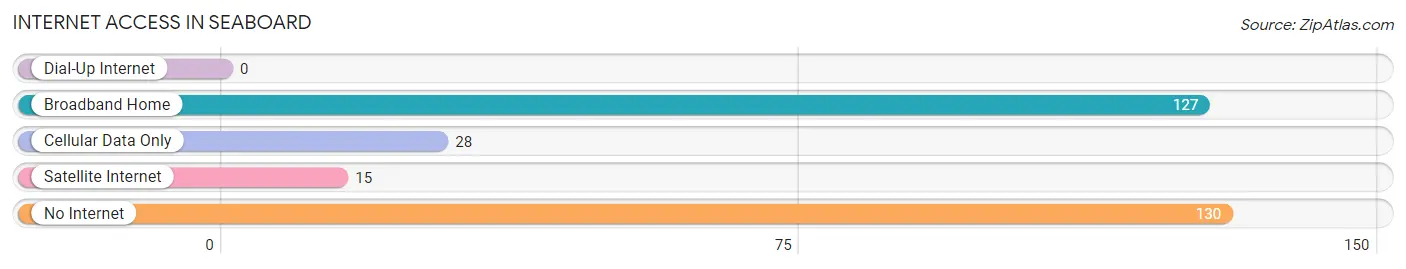
| Internet Type | # Households | % Households |
| Dial-Up Internet | 0 | 0.0% |
| Broadband Home | 127 | 44.3% |
| Cellular Data Only | 28 | 9.8% |
| Satellite Internet | 15 | 5.2% |
| No Internet | 130 | 45.3% |
| Total | 287 | 100.0% |
Seaboard Summary
Seaboard is a small town located in Northampton County, North Carolina. It is situated on the Roanoke River, approximately 30 miles east of the state capital, Raleigh. The town has a population of approximately 1,000 people and is part of the Roanoke Rapids Micropolitan Statistical Area.
History
The town of Seaboard was founded in 1887 by the Seaboard Air Line Railroad. The railroad was built to connect the towns of Weldon and Rocky Mount, and the town of Seaboard was established as a stop along the route. The town was named after the railroad, and the name was chosen to reflect the town’s proximity to the Atlantic Ocean.
The town grew rapidly in the early 20th century, and by the 1920s, it had become a thriving agricultural center. The town was home to several cotton mills, a lumber mill, and a cannery. The town also had a thriving business district, with several stores, restaurants, and other businesses.
In the 1950s, the town began to decline as the railroad industry began to decline. The town’s population decreased, and many of the businesses closed. In the late 1970s, the town began to experience a resurgence as new businesses began to move into the area.
Geography
Seaboard is located in Northampton County, North Carolina. The town is situated on the Roanoke River, approximately 30 miles east of the state capital, Raleigh. The town is located in the Roanoke Rapids Micropolitan Statistical Area.
The town is located in a rural area, and the surrounding landscape is mostly flat. The town is surrounded by farmland, and there are several small lakes in the area. The town is located near the Great Dismal Swamp National Wildlife Refuge, which is a popular destination for birdwatchers and nature lovers.
Economy
The economy of Seaboard is largely based on agriculture. The town is home to several farms, and the surrounding area is used for growing cotton, soybeans, corn, and other crops. The town also has several small businesses, including restaurants, stores, and other services.
The town is also home to several manufacturing companies, including a furniture factory and a textile mill. The town is also home to a small airport, which serves the surrounding area.
Demographics
As of the 2010 census, the population of Seaboard was 1,000 people. The town is predominantly white, with approximately 85% of the population being white. The town also has a small African American population, with approximately 10% of the population being African American. The town also has a small Hispanic population, with approximately 5% of the population being Hispanic.
The median household income in Seaboard is approximately $35,000, and the median home value is approximately $90,000. The town has a low unemployment rate, and the poverty rate is below the national average.
Conclusion
Seaboard is a small town located in Northampton County, North Carolina. The town was founded in 1887 by the Seaboard Air Line Railroad, and it has a population of approximately 1,000 people. The town’s economy is largely based on agriculture, and it also has several small businesses and manufacturing companies. The town is predominantly white, with a small African American and Hispanic population. The median household income in Seaboard is approximately $35,000, and the median home value is approximately $90,000.
Common Questions
What is Per Capita Income in Seaboard?
Per Capita income in Seaboard is $26,075.
What is the Median Family Income in Seaboard?
Median Family Income in Seaboard is $59,375.
What is the Median Household income in Seaboard?
Median Household Income in Seaboard is $24,531.
What is Income or Wage Gap in Seaboard?
Income or Wage Gap in Seaboard is 25.0%.
Women in Seaboard earn 75.0 cents for every dollar earned by a man.
What is Inequality or Gini Index in Seaboard?
Inequality or Gini Index in Seaboard is 0.57.
What is the Total Population of Seaboard?
Total Population of Seaboard is 603.
What is the Total Male Population of Seaboard?
Total Male Population of Seaboard is 236.
What is the Total Female Population of Seaboard?
Total Female Population of Seaboard is 367.
What is the Ratio of Males per 100 Females in Seaboard?
There are 64.31 Males per 100 Females in Seaboard.
What is the Ratio of Females per 100 Males in Seaboard?
There are 155.51 Females per 100 Males in Seaboard.
What is the Median Population Age in Seaboard?
Median Population Age in Seaboard is 54.4 Years.
What is the Average Family Size in Seaboard
Average Family Size in Seaboard is 3.3 People.
What is the Average Household Size in Seaboard
Average Household Size in Seaboard is 2.1 People.
How Large is the Labor Force in Seaboard?
There are 245 People in the Labor Forcein in Seaboard.
What is the Percentage of People in the Labor Force in Seaboard?
48.1% of People are in the Labor Force in Seaboard.