Williamston, NC Map & Demographics
Williamston Map
Williamston Overview
$24,717
PER CAPITA INCOME
$44,746
AVG FAMILY INCOME
$41,182
AVG HOUSEHOLD INCOME
13.5%
WAGE / INCOME GAP [ % ]
86.5¢/ $1
WAGE / INCOME GAP [ $ ]
0.47
INEQUALITY / GINI INDEX
5,224
TOTAL POPULATION
2,168
MALE POPULATION
3,056
FEMALE POPULATION
70.94
MALES / 100 FEMALES
140.96
FEMALES / 100 MALES
45.5
MEDIAN AGE
2.8
AVG FAMILY SIZE
2.1
AVG HOUSEHOLD SIZE
2,636
LABOR FORCE [ PEOPLE ]
61.6%
PERCENT IN LABOR FORCE
14.2%
UNEMPLOYMENT RATE
Williamston Zip Codes
Williamston Area Codes
Income in Williamston
Income Overview in Williamston
Per Capita Income in Williamston is $24,717, while median incomes of families and households are $44,746 and $41,182 respectively.
| Characteristic | Number | Measure |
| Per Capita Income | 5,224 | $24,717 |
| Median Family Income | 1,414 | $44,746 |
| Mean Family Income | 1,414 | $54,120 |
| Median Household Income | 2,461 | $41,182 |
| Mean Household Income | 2,461 | $50,109 |
| Income Deficit | 1,414 | $0 |
| Wage / Income Gap (%) | 5,224 | 13.53% |
| Wage / Income Gap ($) | 5,224 | 86.47¢ per $1 |
| Gini / Inequality Index | 5,224 | 0.47 |
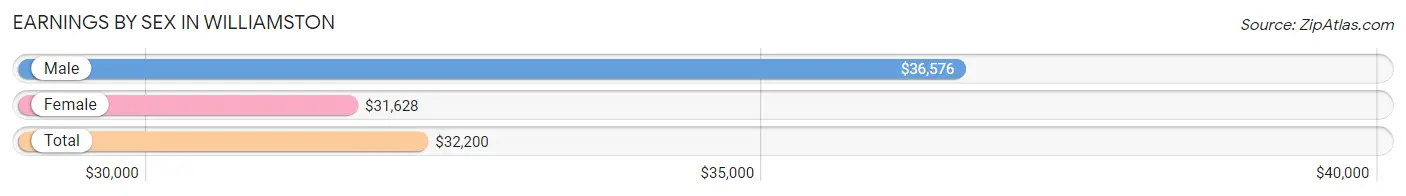
Earnings by Sex in Williamston
Average Earnings in Williamston are $32,200, $36,576 for men and $31,628 for women, a difference of 13.5%.
| Sex | Number | Average Earnings |
| Male | 943 (39.6%) | $36,576 |
| Female | 1,436 (60.4%) | $31,628 |
| Total | 2,379 (100.0%) | $32,200 |
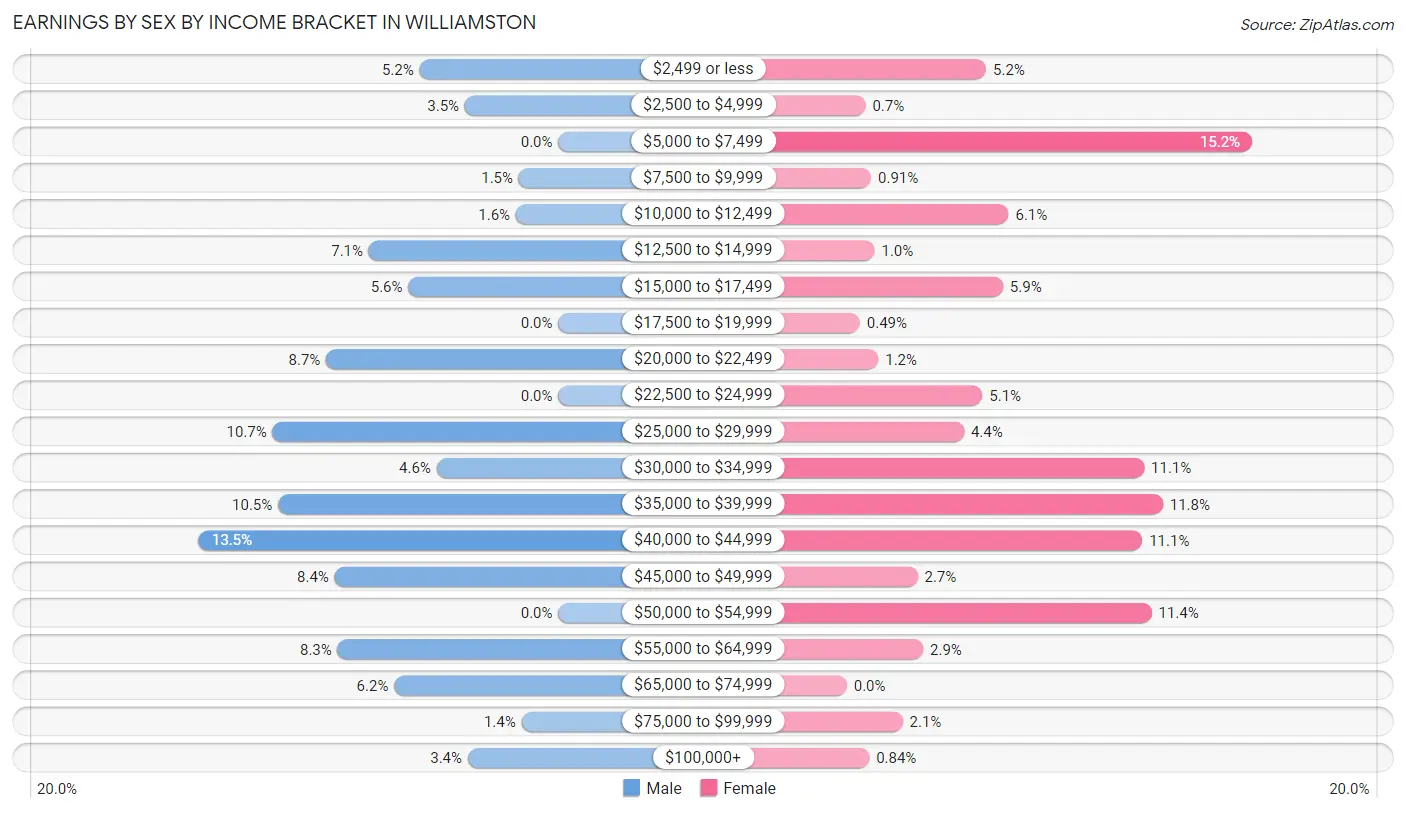
Earnings by Sex by Income Bracket in Williamston
The most common earnings brackets in Williamston are $40,000 to $44,999 for men (127 | 13.5%) and $5,000 to $7,499 for women (218 | 15.2%).
| Income | Male | Female |
| $2,499 or less | 49 (5.2%) | 75 (5.2%) |
| $2,500 to $4,999 | 33 (3.5%) | 10 (0.7%) |
| $5,000 to $7,499 | 0 (0.0%) | 218 (15.2%) |
| $7,500 to $9,999 | 14 (1.5%) | 13 (0.9%) |
| $10,000 to $12,499 | 15 (1.6%) | 87 (6.1%) |
| $12,500 to $14,999 | 67 (7.1%) | 15 (1.0%) |
| $15,000 to $17,499 | 53 (5.6%) | 84 (5.9%) |
| $17,500 to $19,999 | 0 (0.0%) | 7 (0.5%) |
| $20,000 to $22,499 | 82 (8.7%) | 17 (1.2%) |
| $22,500 to $24,999 | 0 (0.0%) | 73 (5.1%) |
| $25,000 to $29,999 | 101 (10.7%) | 63 (4.4%) |
| $30,000 to $34,999 | 43 (4.6%) | 160 (11.1%) |
| $35,000 to $39,999 | 99 (10.5%) | 170 (11.8%) |
| $40,000 to $44,999 | 127 (13.5%) | 159 (11.1%) |
| $45,000 to $49,999 | 79 (8.4%) | 38 (2.6%) |
| $50,000 to $54,999 | 0 (0.0%) | 164 (11.4%) |
| $55,000 to $64,999 | 78 (8.3%) | 41 (2.9%) |
| $65,000 to $74,999 | 58 (6.1%) | 0 (0.0%) |
| $75,000 to $99,999 | 13 (1.4%) | 30 (2.1%) |
| $100,000+ | 32 (3.4%) | 12 (0.8%) |
| Total | 943 (100.0%) | 1,436 (100.0%) |
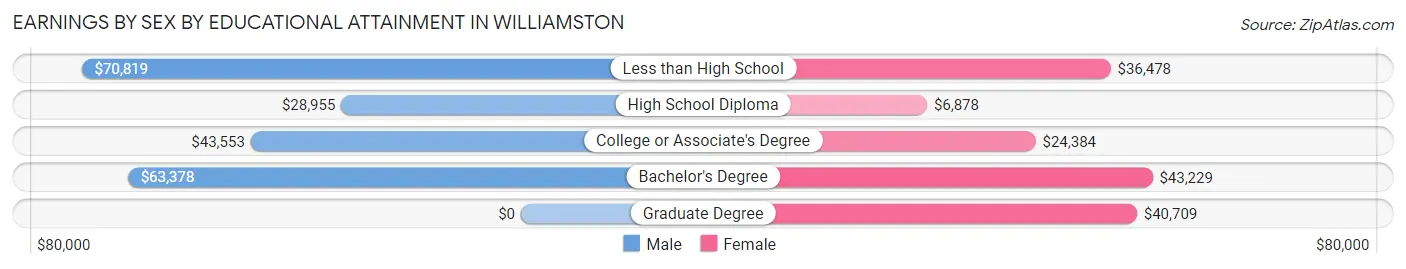
Earnings by Sex by Educational Attainment in Williamston
Average earnings in Williamston are $39,293 for men and $32,137 for women, a difference of 18.2%. Men with an educational attainment of less than high school enjoy the highest average annual earnings of $70,819, while those with high school diploma education earn the least with $28,955. Women with an educational attainment of bachelor's degree earn the most with the average annual earnings of $43,229, while those with high school diploma education have the smallest earnings of $6,878.
| Educational Attainment | Male Income | Female Income |
| Less than High School | $70,819 | $36,478 |
| High School Diploma | $28,955 | $6,878 |
| College or Associate's Degree | $43,553 | $24,384 |
| Bachelor's Degree | $63,378 | $43,229 |
| Graduate Degree | - | - |
| Total | $39,293 | $32,137 |
Family Income in Williamston
Family Income Brackets in Williamston
According to the Williamston family income data, there are 290 families falling into the $75,000 to $99,999 income range, which is the most common income bracket and makes up 20.5% of all families. Conversely, the $200,000+ income bracket is the least frequent group with only 8 families (0.6%) belonging to this category.
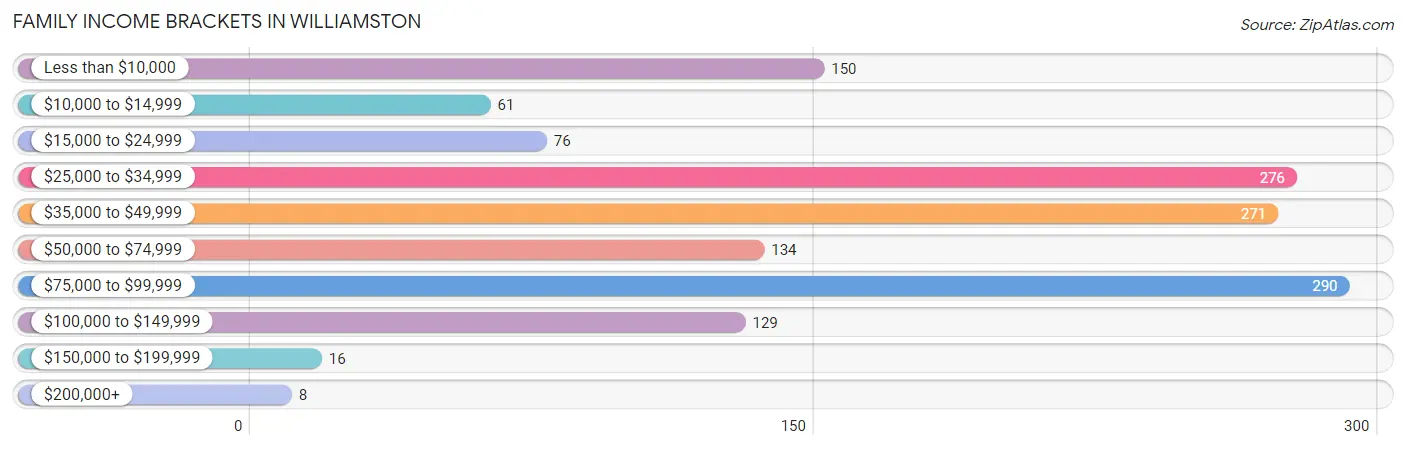
| Income Bracket | # Families | % Families |
| Less than $10,000 | 150 | 10.6% |
| $10,000 to $14,999 | 61 | 4.3% |
| $15,000 to $24,999 | 76 | 5.4% |
| $25,000 to $34,999 | 276 | 19.5% |
| $35,000 to $49,999 | 271 | 19.2% |
| $50,000 to $74,999 | 134 | 9.5% |
| $75,000 to $99,999 | 290 | 20.5% |
| $100,000 to $149,999 | 129 | 9.1% |
| $150,000 to $199,999 | 16 | 1.1% |
| $200,000+ | 8 | 0.6% |
Family Income by Famaliy Size in Williamston
2-person families (921 | 65.1%) account for the highest median family income in Williamston with $49,246 per family, while 2-person families (921 | 65.1%) have the highest median income of $24,623 per family member.
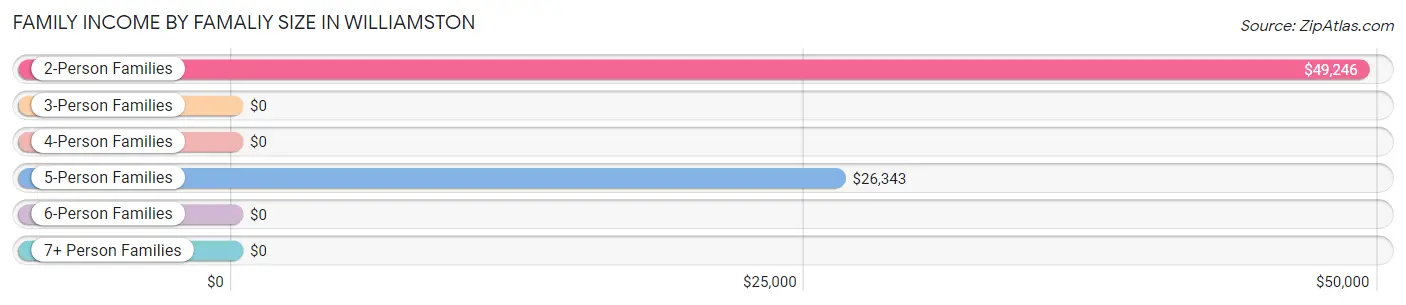
| Income Bracket | # Families | Median Income |
| 2-Person Families | 921 (65.1%) | $49,246 |
| 3-Person Families | 100 (7.1%) | $0 |
| 4-Person Families | 111 (7.9%) | $0 |
| 5-Person Families | 271 (19.2%) | $26,343 |
| 6-Person Families | 0 (0.0%) | $0 |
| 7+ Person Families | 11 (0.8%) | $0 |
| Total | 1,414 (100.0%) | $44,746 |
Family Income by Number of Earners in Williamston
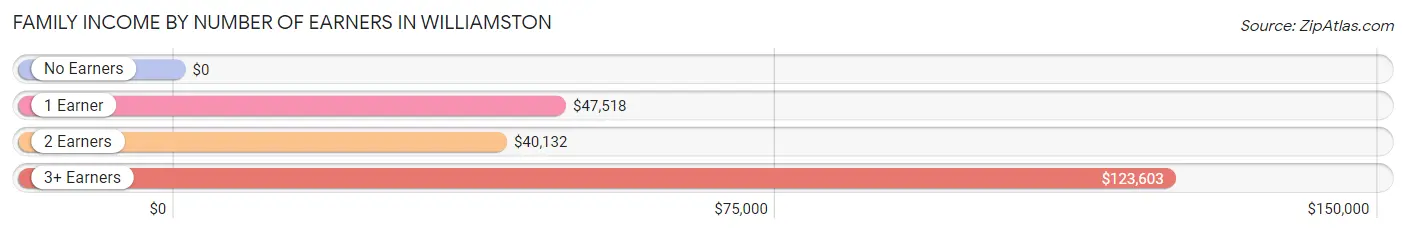
| Number of Earners | # Families | Median Income |
| No Earners | 184 (13.0%) | $0 |
| 1 Earner | 715 (50.6%) | $47,518 |
| 2 Earners | 478 (33.8%) | $40,132 |
| 3+ Earners | 37 (2.6%) | $123,603 |
| Total | 1,414 (100.0%) | $44,746 |
Household Income in Williamston
Household Income Brackets in Williamston
With 441 households falling in the category, the $35,000 to $49,999 income range is the most frequent in Williamston, accounting for 17.9% of all households. In contrast, only 17 households (0.7%) fall into the $150,000 to $199,999 income bracket, making it the least populous group.
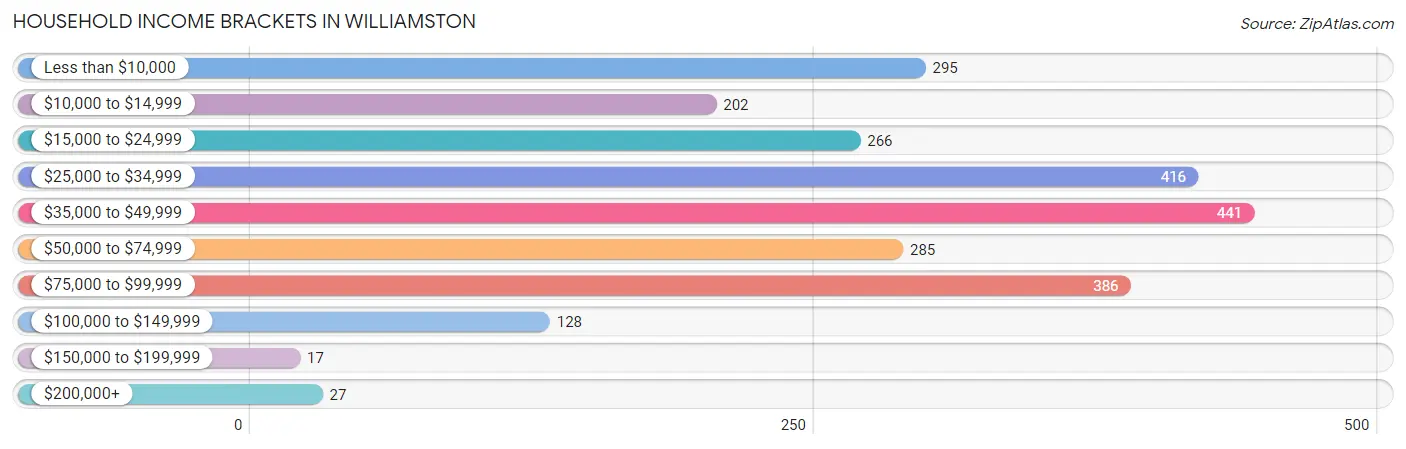
| Income Bracket | # Households | % Households |
| Less than $10,000 | 295 | 12.0% |
| $10,000 to $14,999 | 202 | 8.2% |
| $15,000 to $24,999 | 266 | 10.8% |
| $25,000 to $34,999 | 416 | 16.9% |
| $35,000 to $49,999 | 441 | 17.9% |
| $50,000 to $74,999 | 285 | 11.6% |
| $75,000 to $99,999 | 386 | 15.7% |
| $100,000 to $149,999 | 128 | 5.2% |
| $150,000 to $199,999 | 17 | 0.7% |
| $200,000+ | 27 | 1.1% |
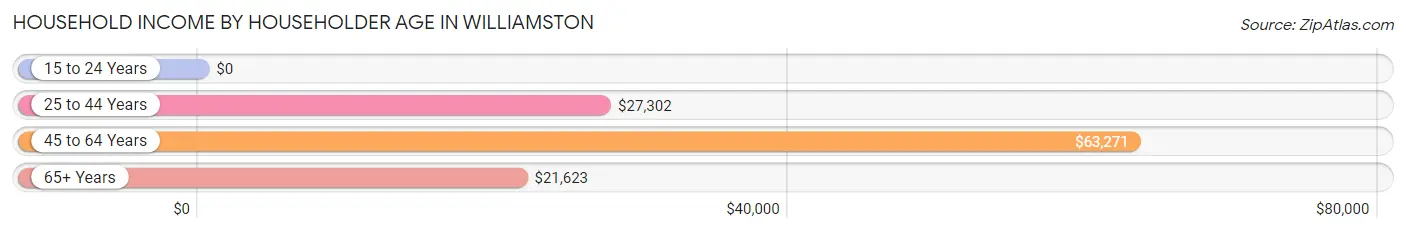
Household Income by Householder Age in Williamston
The median household income in Williamston is $41,182, with the highest median household income of $63,271 found in the 45 to 64 years age bracket for the primary householder. A total of 823 households (33.4%) fall into this category. Meanwhile, the 15 to 24 years age bracket for the primary householder has the lowest median household income of $0, with 61 households (2.5%) in this group.
| Income Bracket | # Households | Median Income |
| 15 to 24 Years | 61 (2.5%) | $0 |
| 25 to 44 Years | 726 (29.5%) | $27,302 |
| 45 to 64 Years | 823 (33.4%) | $63,271 |
| 65+ Years | 851 (34.6%) | $21,623 |
| Total | 2,461 (100.0%) | $41,182 |
Poverty in Williamston
Income Below Poverty by Sex and Age in Williamston
With 29.3% poverty level for males and 35.2% for females among the residents of Williamston, 12 to 14 year old males and 5 year old females are the most vulnerable to poverty, with 122 males (87.8%) and 67 females (87.0%) in their respective age groups living below the poverty level.
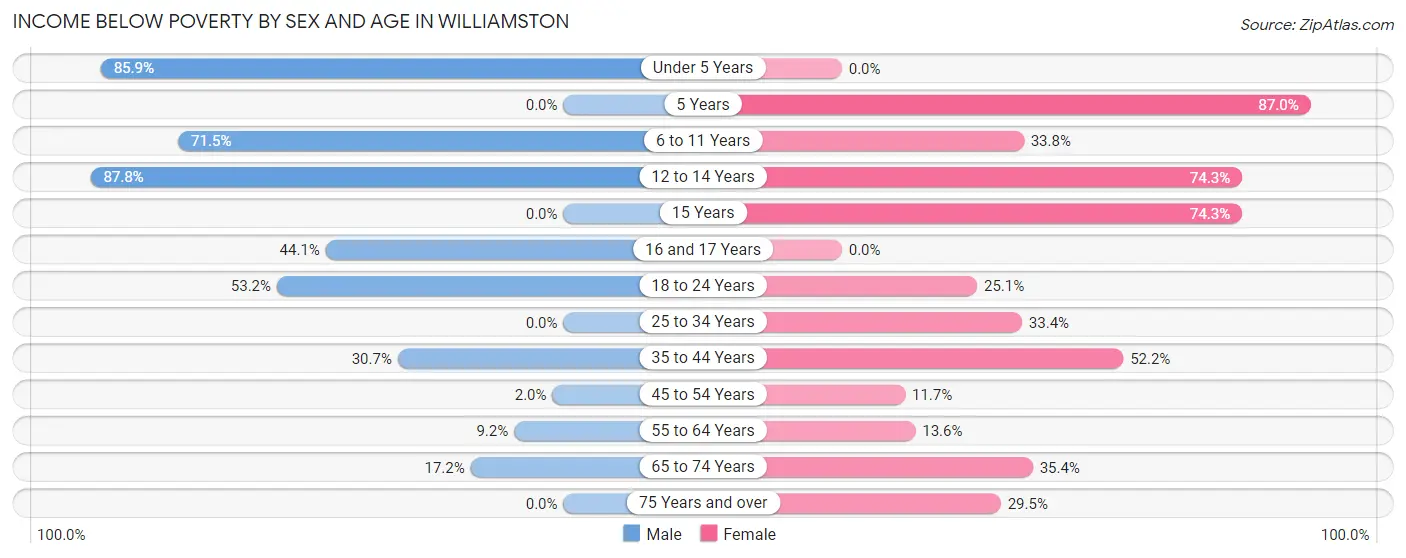
| Age Bracket | Male | Female |
| Under 5 Years | 85 (85.9%) | 0 (0.0%) |
| 5 Years | 0 (0.0%) | 67 (87.0%) |
| 6 to 11 Years | 123 (71.5%) | 26 (33.8%) |
| 12 to 14 Years | 122 (87.8%) | 133 (74.3%) |
| 15 Years | 0 (0.0%) | 52 (74.3%) |
| 16 and 17 Years | 15 (44.1%) | 0 (0.0%) |
| 18 to 24 Years | 92 (53.2%) | 59 (25.1%) |
| 25 to 34 Years | 0 (0.0%) | 121 (33.4%) |
| 35 to 44 Years | 71 (30.7%) | 269 (52.2%) |
| 45 to 54 Years | 4 (2.0%) | 31 (11.7%) |
| 55 to 64 Years | 46 (9.1%) | 60 (13.6%) |
| 65 to 74 Years | 51 (17.2%) | 163 (35.4%) |
| 75 Years and over | 0 (0.0%) | 82 (29.5%) |
| Total | 609 (29.3%) | 1,063 (35.2%) |
Income Above Poverty by Sex and Age in Williamston
According to the poverty statistics in Williamston, males aged 5 years and females aged under 5 years are the age groups that are most secure financially, with 100.0% of males and 100.0% of females in these age groups living above the poverty line.
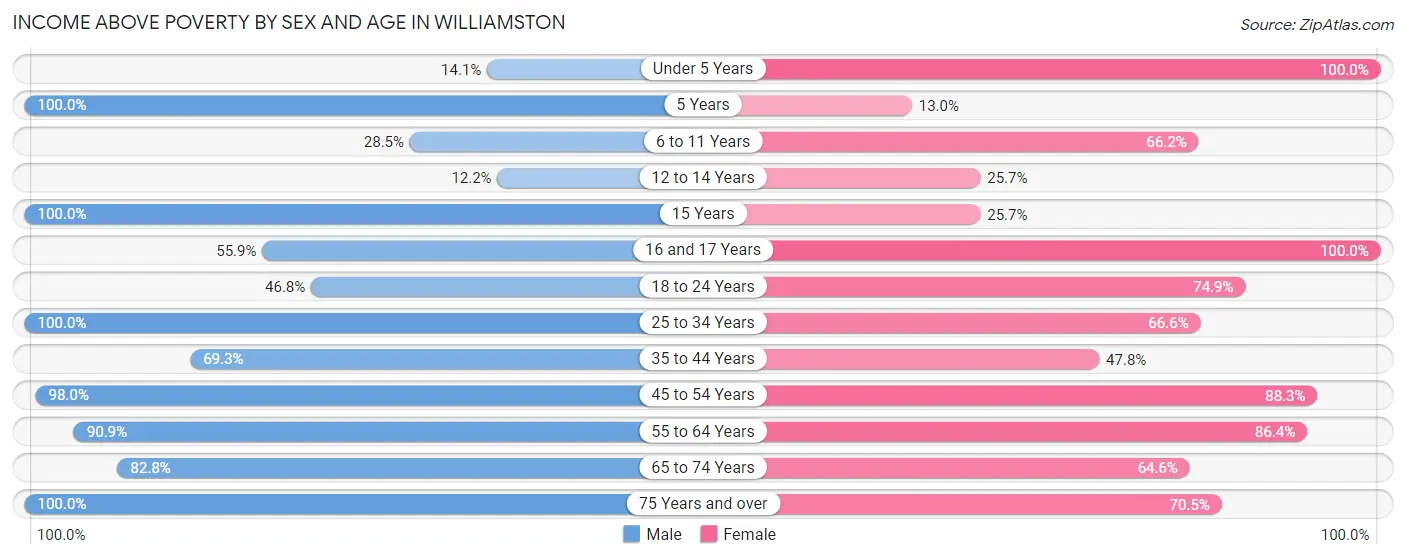
| Age Bracket | Male | Female |
| Under 5 Years | 14 (14.1%) | 46 (100.0%) |
| 5 Years | 66 (100.0%) | 10 (13.0%) |
| 6 to 11 Years | 49 (28.5%) | 51 (66.2%) |
| 12 to 14 Years | 17 (12.2%) | 46 (25.7%) |
| 15 Years | 17 (100.0%) | 18 (25.7%) |
| 16 and 17 Years | 19 (55.9%) | 16 (100.0%) |
| 18 to 24 Years | 81 (46.8%) | 176 (74.9%) |
| 25 to 34 Years | 74 (100.0%) | 241 (66.6%) |
| 35 to 44 Years | 160 (69.3%) | 246 (47.8%) |
| 45 to 54 Years | 192 (98.0%) | 233 (88.3%) |
| 55 to 64 Years | 457 (90.8%) | 380 (86.4%) |
| 65 to 74 Years | 245 (82.8%) | 297 (64.6%) |
| 75 Years and over | 77 (100.0%) | 196 (70.5%) |
| Total | 1,468 (70.7%) | 1,956 (64.8%) |
Income Below Poverty Among Married-Couple Families in Williamston
The poverty statistics for married-couple families in Williamston show that 29.1% or 237 of the total 815 families live below the poverty line. Families with 3 or 4 children have the highest poverty rate of 95.1%, comprising of 215 families. On the other hand, families with 1 or 2 children have the lowest poverty rate of 0.0%, which includes 0 families.
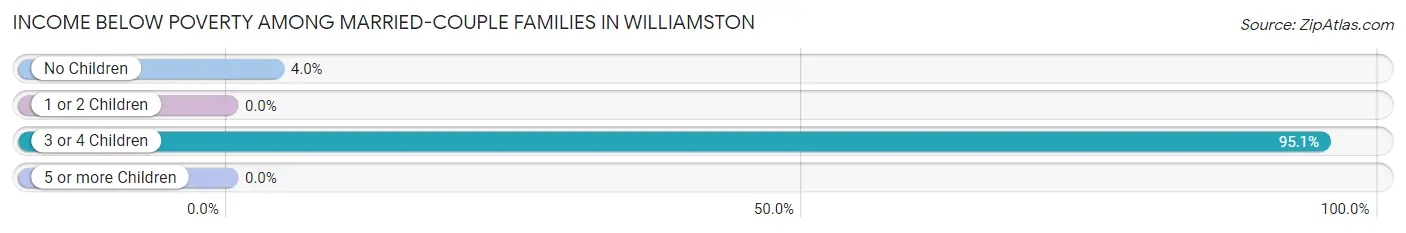
| Children | Above Poverty | Below Poverty |
| No Children | 529 (96.0%) | 22 (4.0%) |
| 1 or 2 Children | 38 (100.0%) | 0 (0.0%) |
| 3 or 4 Children | 11 (4.9%) | 215 (95.1%) |
| 5 or more Children | 0 (0.0%) | 0 (0.0%) |
| Total | 578 (70.9%) | 237 (29.1%) |
Income Below Poverty Among Single-Parent Households in Williamston
According to the poverty data in Williamston, 47.4% or 45 single-father households and 40.3% or 203 single-mother households are living below the poverty line. Among single-father households, those with 1 or 2 children have the highest poverty rate, with 45 households (100.0%) experiencing poverty. Likewise, among single-mother households, those with 3 or 4 children have the highest poverty rate, with 36 households (100.0%) falling below the poverty line.
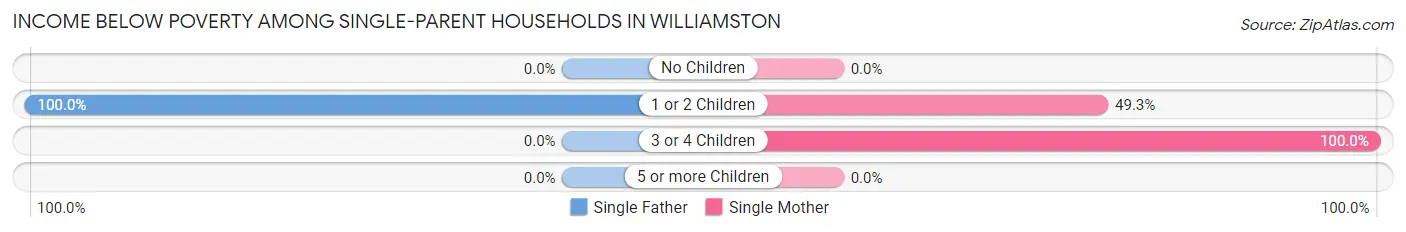
| Children | Single Father | Single Mother |
| No Children | 0 (0.0%) | 0 (0.0%) |
| 1 or 2 Children | 45 (100.0%) | 167 (49.3%) |
| 3 or 4 Children | 0 (0.0%) | 36 (100.0%) |
| 5 or more Children | 0 (0.0%) | 0 (0.0%) |
| Total | 45 (47.4%) | 203 (40.3%) |
Income Below Poverty Among Married-Couple vs Single-Parent Households in Williamston
The poverty data for Williamston shows that 237 of the married-couple family households (29.1%) and 248 of the single-parent households (41.4%) are living below the poverty level. Within the married-couple family households, those with 3 or 4 children have the highest poverty rate, with 215 households (95.1%) falling below the poverty line. Among the single-parent households, those with 3 or 4 children have the highest poverty rate, with 36 household (100.0%) living below poverty.
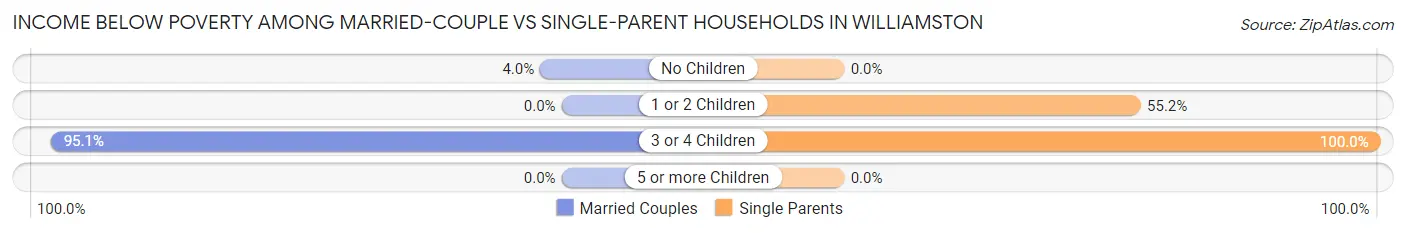
| Children | Married-Couple Families | Single-Parent Households |
| No Children | 22 (4.0%) | 0 (0.0%) |
| 1 or 2 Children | 0 (0.0%) | 212 (55.2%) |
| 3 or 4 Children | 215 (95.1%) | 36 (100.0%) |
| 5 or more Children | 0 (0.0%) | 0 (0.0%) |
| Total | 237 (29.1%) | 248 (41.4%) |
Race in Williamston
The most populous races in Williamston are Black / African American (2,753 | 52.7%), White / Caucasian (1,817 | 34.8%), and Two or more Races (525 | 10.1%).
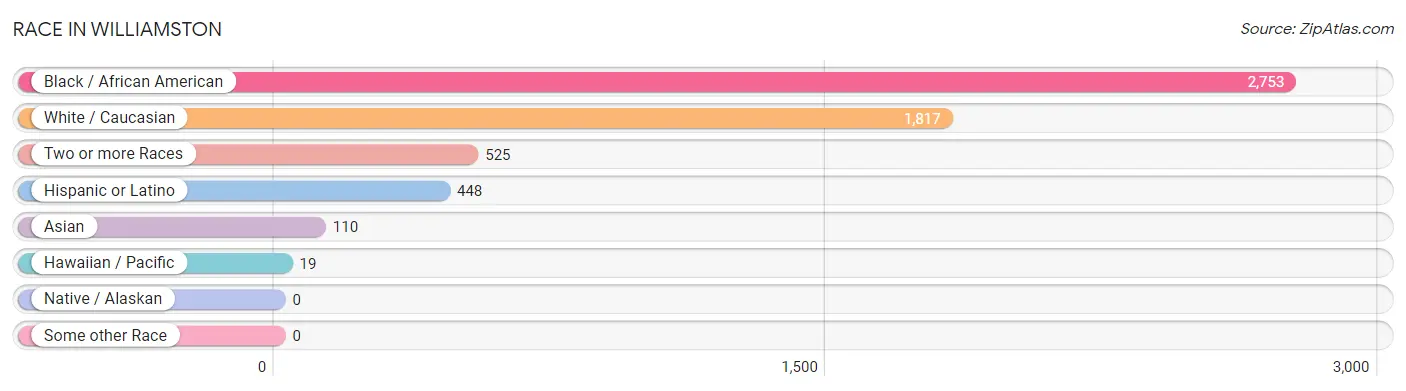
| Race | # Population | % Population |
| Asian | 110 | 2.1% |
| Black / African American | 2,753 | 52.7% |
| Hawaiian / Pacific | 19 | 0.4% |
| Hispanic or Latino | 448 | 8.6% |
| Native / Alaskan | 0 | 0.0% |
| White / Caucasian | 1,817 | 34.8% |
| Two or more Races | 525 | 10.1% |
| Some other Race | 0 | 0.0% |
| Total | 5,224 | 100.0% |
Ancestry in Williamston
The most populous ancestries reported in Williamston are Mexican (433 | 8.3%), English (336 | 6.4%), American (255 | 4.9%), Irish (159 | 3.0%), and German (114 | 2.2%), together accounting for 24.8% of all Williamston residents.
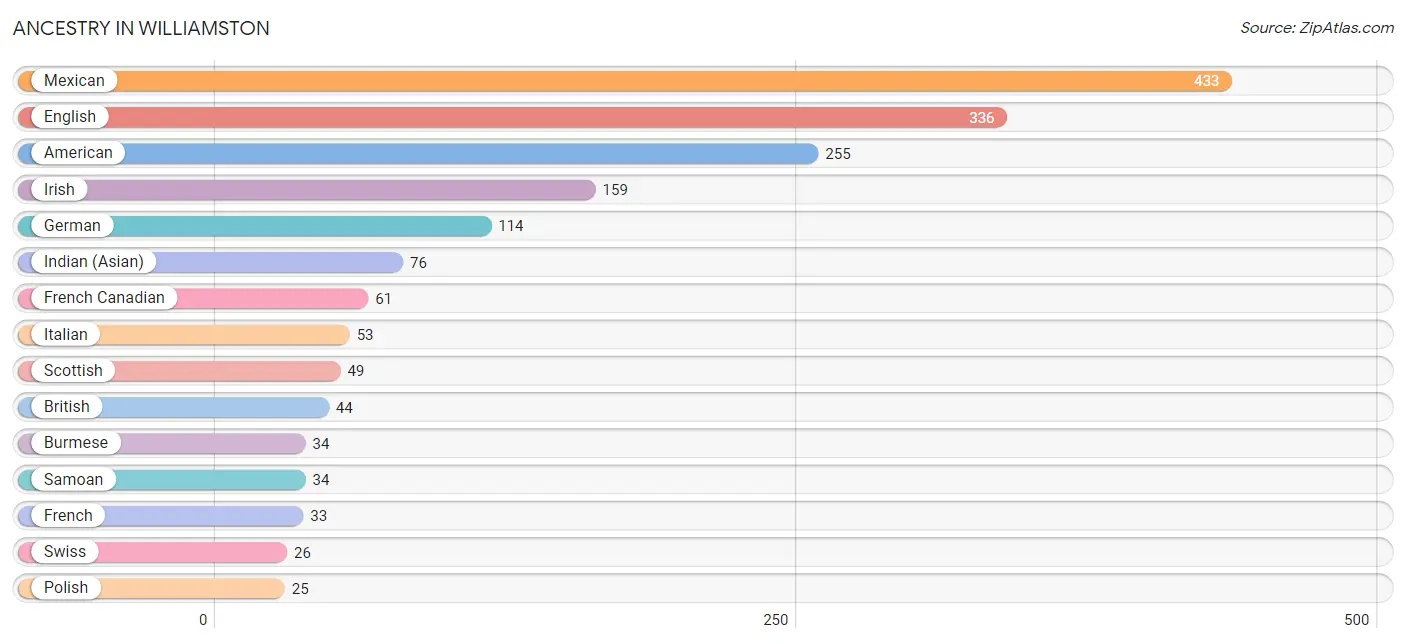
| Ancestry | # Population | % Population |
| African | 6 | 0.1% |
| American | 255 | 4.9% |
| Bermudan | 16 | 0.3% |
| British | 44 | 0.8% |
| Burmese | 34 | 0.6% |
| Dutch | 18 | 0.3% |
| English | 336 | 6.4% |
| French | 33 | 0.6% |
| French Canadian | 61 | 1.2% |
| German | 114 | 2.2% |
| Indian (Asian) | 76 | 1.5% |
| Irish | 159 | 3.0% |
| Italian | 53 | 1.0% |
| Korean | 19 | 0.4% |
| Mexican | 433 | 8.3% |
| Northern European | 15 | 0.3% |
| Polish | 25 | 0.5% |
| Puerto Rican | 15 | 0.3% |
| Samoan | 34 | 0.6% |
| Scotch-Irish | 15 | 0.3% |
| Scottish | 49 | 0.9% |
| Subsaharan African | 6 | 0.1% |
| Swiss | 26 | 0.5% |
| Welsh | 24 | 0.5% | View All 24 Rows |
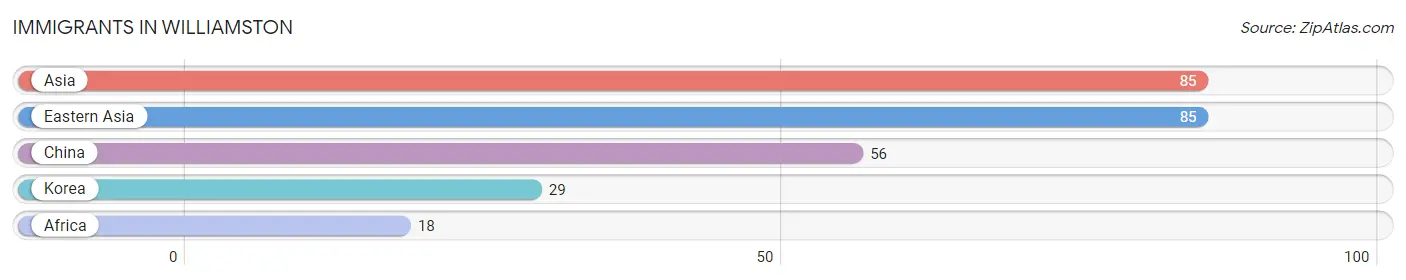
Immigrants in Williamston
The most numerous immigrant groups reported in Williamston came from Asia (85 | 1.6%), Eastern Asia (85 | 1.6%), China (56 | 1.1%), Korea (29 | 0.6%), and Africa (18 | 0.3%), together accounting for 5.2% of all Williamston residents.
| Immigration Origin | # Population | % Population |
| Africa | 18 | 0.3% |
| Asia | 85 | 1.6% |
| China | 56 | 1.1% |
| Eastern Asia | 85 | 1.6% |
| Korea | 29 | 0.6% | View All 5 Rows |
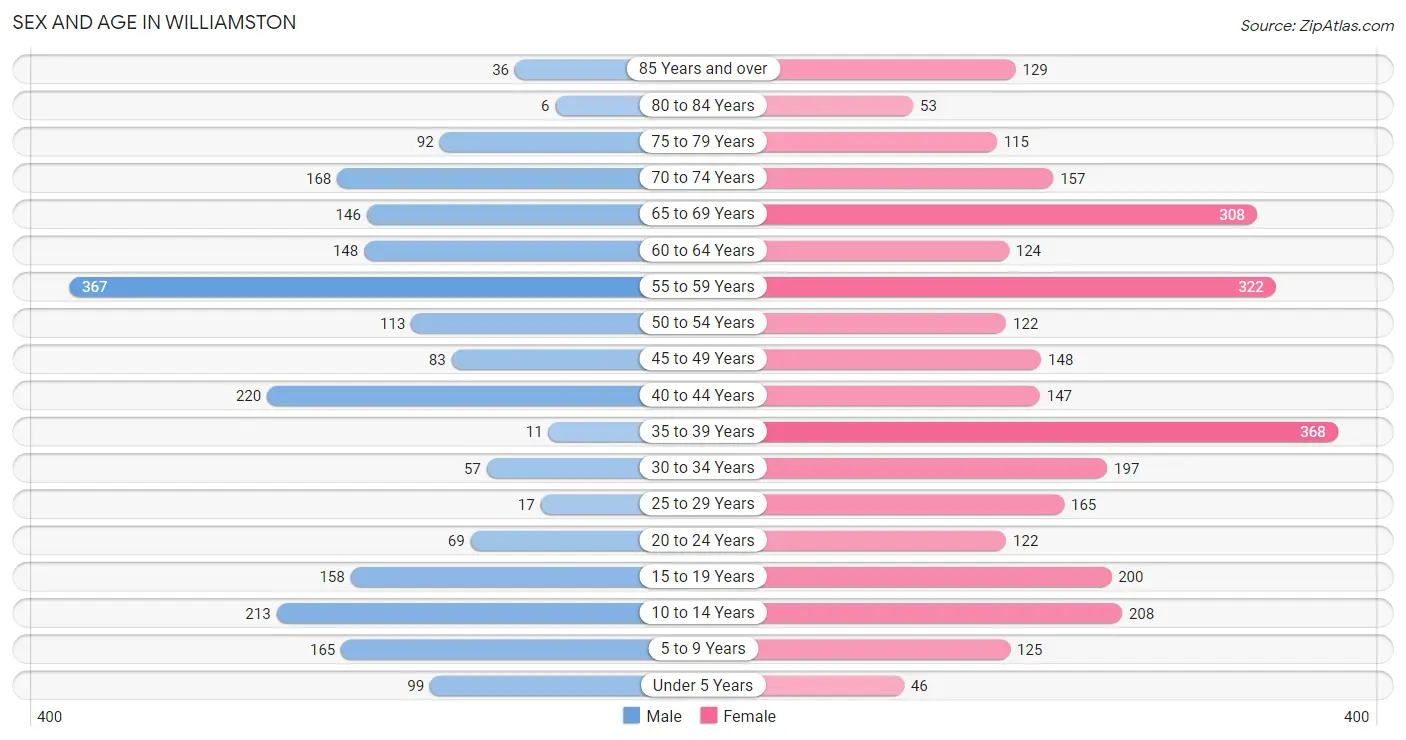
Sex and Age in Williamston
Sex and Age in Williamston
The most populous age groups in Williamston are 55 to 59 Years (367 | 16.9%) for men and 35 to 39 Years (368 | 12.0%) for women.
| Age Bracket | Male | Female |
| Under 5 Years | 99 (4.6%) | 46 (1.5%) |
| 5 to 9 Years | 165 (7.6%) | 125 (4.1%) |
| 10 to 14 Years | 213 (9.8%) | 208 (6.8%) |
| 15 to 19 Years | 158 (7.3%) | 200 (6.5%) |
| 20 to 24 Years | 69 (3.2%) | 122 (4.0%) |
| 25 to 29 Years | 17 (0.8%) | 165 (5.4%) |
| 30 to 34 Years | 57 (2.6%) | 197 (6.5%) |
| 35 to 39 Years | 11 (0.5%) | 368 (12.0%) |
| 40 to 44 Years | 220 (10.2%) | 147 (4.8%) |
| 45 to 49 Years | 83 (3.8%) | 148 (4.8%) |
| 50 to 54 Years | 113 (5.2%) | 122 (4.0%) |
| 55 to 59 Years | 367 (16.9%) | 322 (10.5%) |
| 60 to 64 Years | 148 (6.8%) | 124 (4.1%) |
| 65 to 69 Years | 146 (6.7%) | 308 (10.1%) |
| 70 to 74 Years | 168 (7.7%) | 157 (5.1%) |
| 75 to 79 Years | 92 (4.2%) | 115 (3.8%) |
| 80 to 84 Years | 6 (0.3%) | 53 (1.7%) |
| 85 Years and over | 36 (1.7%) | 129 (4.2%) |
| Total | 2,168 (100.0%) | 3,056 (100.0%) |
Families and Households in Williamston
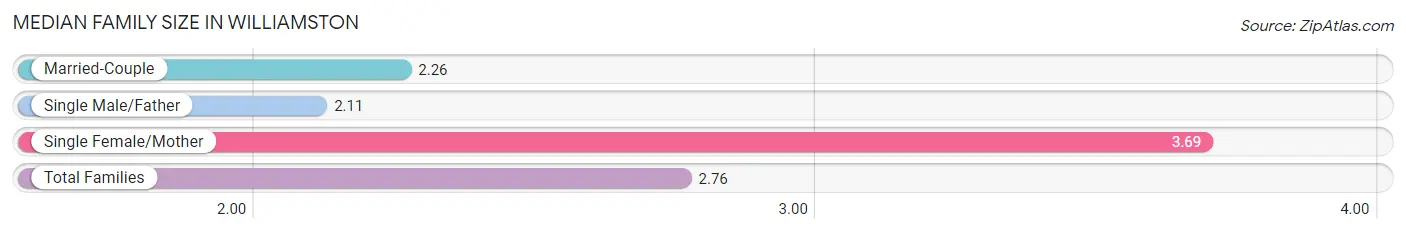
Median Family Size in Williamston
The median family size in Williamston is 2.76 persons per family, with single female/mother families (504 | 35.6%) accounting for the largest median family size of 3.69 persons per family. On the other hand, single male/father families (95 | 6.7%) represent the smallest median family size with 2.11 persons per family.
| Family Type | # Families | Family Size |
| Married-Couple | 815 (57.6%) | 2.26 |
| Single Male/Father | 95 (6.7%) | 2.11 |
| Single Female/Mother | 504 (35.6%) | 3.69 |
| Total Families | 1,414 (100.0%) | 2.76 |
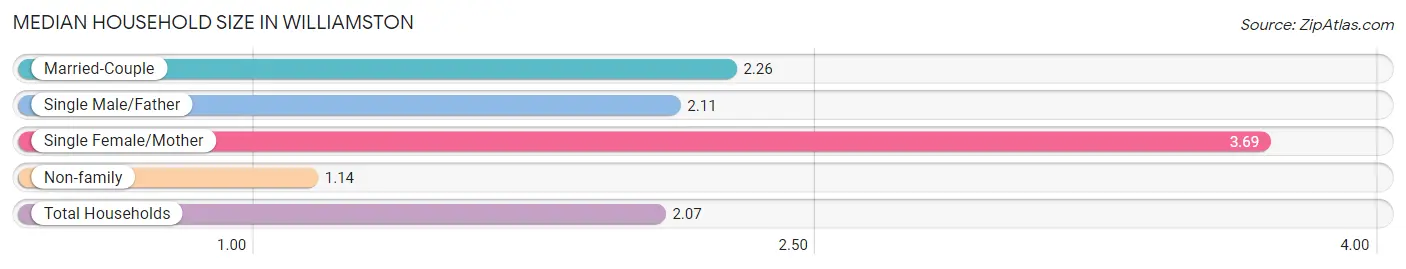
Median Household Size in Williamston
The median household size in Williamston is 2.07 persons per household, with single female/mother households (504 | 20.5%) accounting for the largest median household size of 3.69 persons per household. non-family households (1,047 | 42.5%) represent the smallest median household size with 1.14 persons per household.
| Household Type | # Households | Household Size |
| Married-Couple | 815 (33.1%) | 2.26 |
| Single Male/Father | 95 (3.9%) | 2.11 |
| Single Female/Mother | 504 (20.5%) | 3.69 |
| Non-family | 1,047 (42.5%) | 1.14 |
| Total Households | 2,461 (100.0%) | 2.07 |
Household Size by Marriage Status in Williamston
Out of a total of 2,461 households in Williamston, 1,414 (57.5%) are family households, while 1,047 (42.5%) are nonfamily households. The most numerous type of family households are 2-person households, comprising 921, and the most common type of nonfamily households are 1-person households, comprising 911.
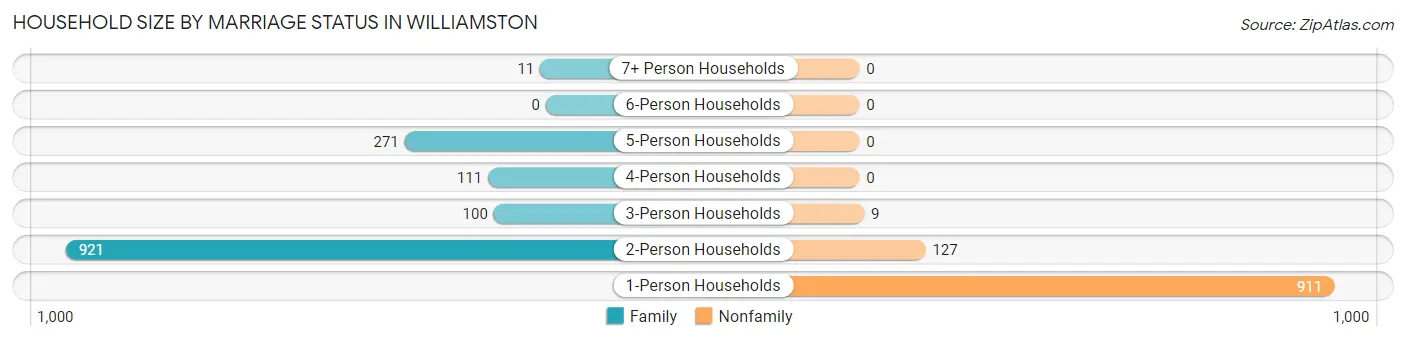
| Household Size | Family Households | Nonfamily Households |
| 1-Person Households | - | 911 (37.0%) |
| 2-Person Households | 921 (37.4%) | 127 (5.2%) |
| 3-Person Households | 100 (4.1%) | 9 (0.4%) |
| 4-Person Households | 111 (4.5%) | 0 (0.0%) |
| 5-Person Households | 271 (11.0%) | 0 (0.0%) |
| 6-Person Households | 0 (0.0%) | 0 (0.0%) |
| 7+ Person Households | 11 (0.4%) | 0 (0.0%) |
| Total | 1,414 (57.5%) | 1,047 (42.5%) |
Female Fertility in Williamston
Fertility by Age in Williamston
Average fertility rate in Williamston is 47.0 births per 1,000 women. Women in the age bracket of 20 to 34 years have the highest fertility rate with 134.0 births per 1,000 women. Women in the age bracket of 20 to 34 years acount for 100.0% of all women with births.
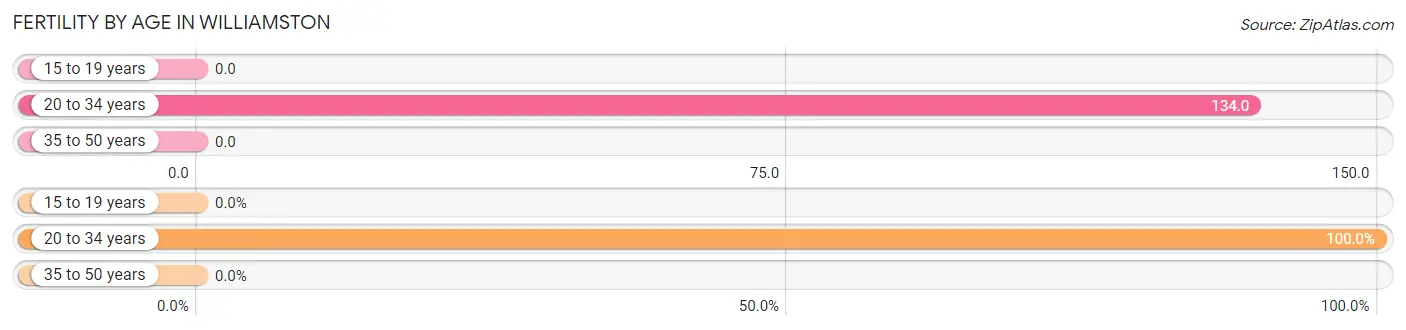
| Age Bracket | Women with Births | Births / 1,000 Women |
| 15 to 19 years | 0 (0.0%) | 0.0 |
| 20 to 34 years | 65 (100.0%) | 134.0 |
| 35 to 50 years | 0 (0.0%) | 0.0 |
| Total | 65 (100.0%) | 47.0 |
Fertility by Age by Marriage Status in Williamston
13.8% of women with births (65) in Williamston are married. The highest percentage of unmarried women with births falls into 20 to 34 years age bracket with 86.2% of them unmarried at the time of birth, while the lowest percentage of unmarried women with births belong to 20 to 34 years age bracket with 86.1% of them unmarried.
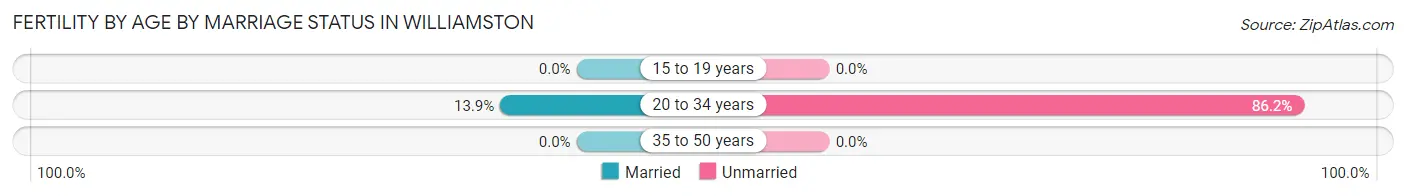
| Age Bracket | Married | Unmarried |
| 15 to 19 years | 0 (0.0%) | 0 (0.0%) |
| 20 to 34 years | 9 (13.9%) | 56 (86.2%) |
| 35 to 50 years | 0 (0.0%) | 0 (0.0%) |
| Total | 9 (13.9%) | 56 (86.2%) |
Fertility by Education in Williamston
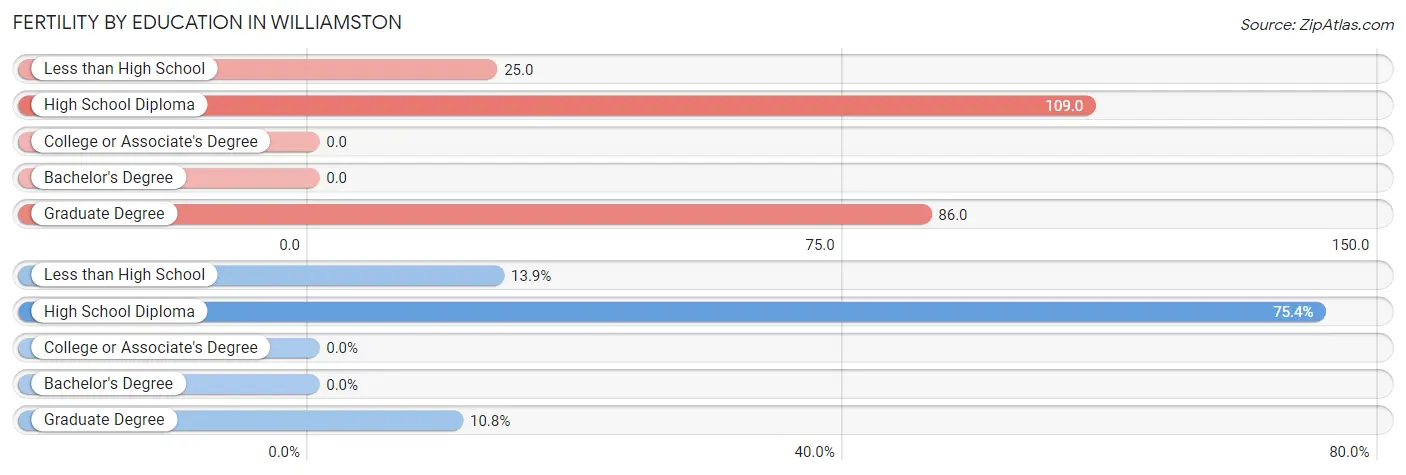
| Educational Attainment | Women with Births | Births / 1,000 Women |
| Less than High School | 9 (13.9%) | 25.0 |
| High School Diploma | 49 (75.4%) | 109.0 |
| College or Associate's Degree | 0 (0.0%) | 0.0 |
| Bachelor's Degree | 0 (0.0%) | 0.0 |
| Graduate Degree | 7 (10.8%) | 86.0 |
| Total | 65 (100.0%) | 47.0 |
Fertility by Education by Marriage Status in Williamston
86.2% of women with births in Williamston are unmarried. Women with the educational attainment of less than high school are most likely to be married with 100.0% of them married at childbirth, while women with the educational attainment of high school diploma are least likely to be married with 100.0% of them unmarried at childbirth.
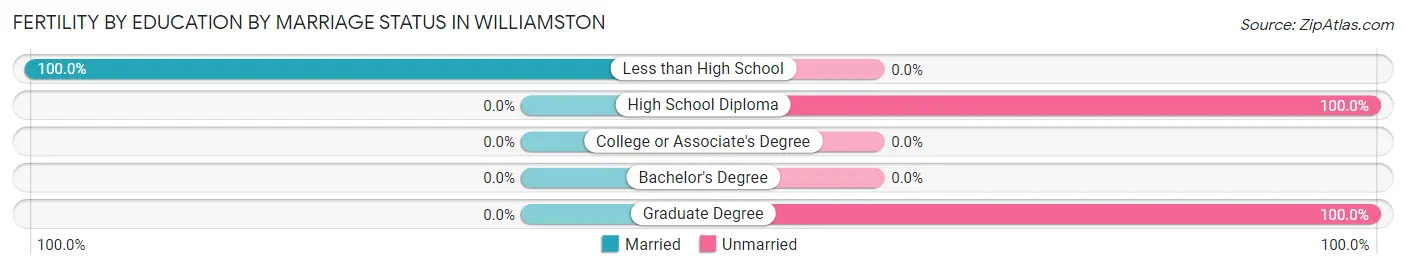
| Educational Attainment | Married | Unmarried |
| Less than High School | 9 (100.0%) | 0 (0.0%) |
| High School Diploma | 0 (0.0%) | 49 (100.0%) |
| College or Associate's Degree | 0 (0.0%) | 0 (0.0%) |
| Bachelor's Degree | 0 (0.0%) | 0 (0.0%) |
| Graduate Degree | 0 (0.0%) | 7 (100.0%) |
| Total | 9 (13.9%) | 56 (86.2%) |
Employment Characteristics in Williamston
Employment by Class of Employer in Williamston
Among the 2,236 employed individuals in Williamston, private company employees (1,609 | 72.0%), local government employees (250 | 11.2%), and self-employed (not incorporated) (212 | 9.5%) make up the most common classes of employment.
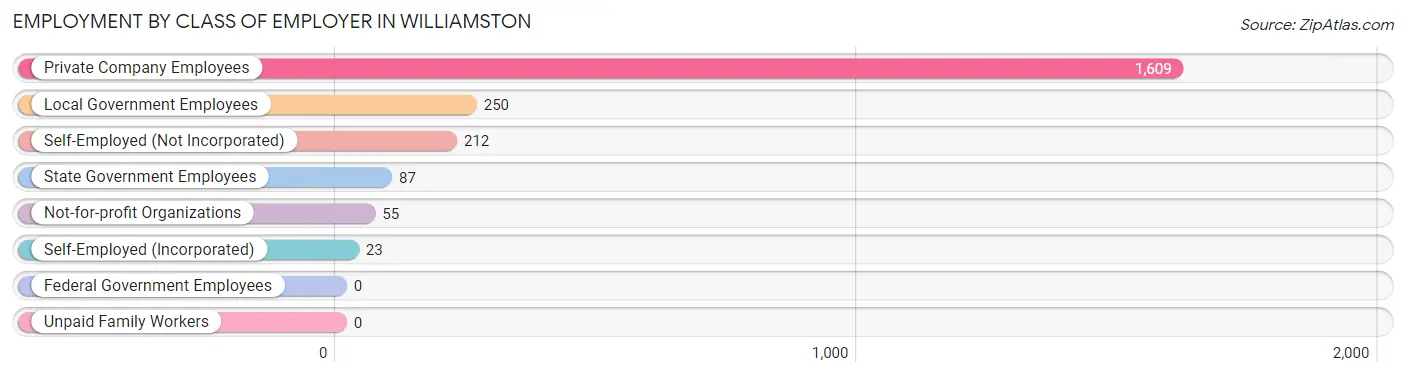
| Employer Class | # Employees | % Employees |
| Private Company Employees | 1,609 | 72.0% |
| Self-Employed (Incorporated) | 23 | 1.0% |
| Self-Employed (Not Incorporated) | 212 | 9.5% |
| Not-for-profit Organizations | 55 | 2.5% |
| Local Government Employees | 250 | 11.2% |
| State Government Employees | 87 | 3.9% |
| Federal Government Employees | 0 | 0.0% |
| Unpaid Family Workers | 0 | 0.0% |
| Total | 2,236 | 100.0% |
Employment Status by Age in Williamston
According to the labor force statistics for Williamston, out of the total population over 16 years of age (4,280), 61.6% or 2,636 individuals are in the labor force, with 14.2% or 374 of them unemployed. The age group with the highest labor force participation rate is 25 to 29 years, with 100.0% or 182 individuals in the labor force. Within the labor force, the 16 to 19 years age range has the highest percentage of unemployed individuals, with 67.4% or 118 of them being unemployed.
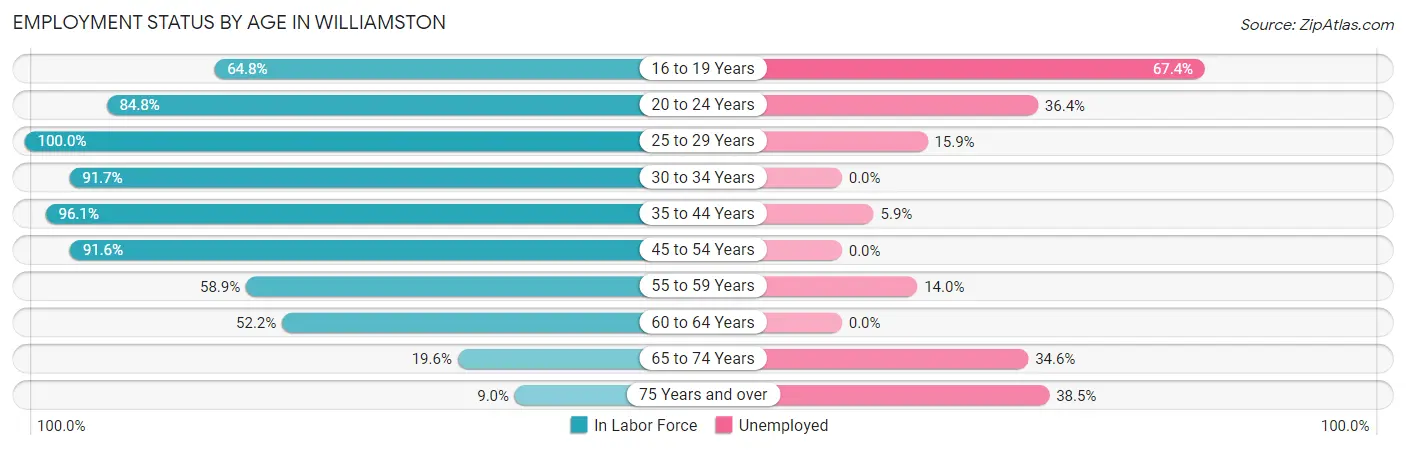
| Age Bracket | In Labor Force | Unemployed |
| 16 to 19 Years | 175 (64.8%) | 118 (67.4%) |
| 20 to 24 Years | 162 (84.8%) | 59 (36.4%) |
| 25 to 29 Years | 182 (100.0%) | 29 (15.9%) |
| 30 to 34 Years | 233 (91.7%) | 0 (0.0%) |
| 35 to 44 Years | 717 (96.1%) | 42 (5.9%) |
| 45 to 54 Years | 427 (91.6%) | 0 (0.0%) |
| 55 to 59 Years | 406 (58.9%) | 57 (14.0%) |
| 60 to 64 Years | 142 (52.2%) | 0 (0.0%) |
| 65 to 74 Years | 153 (19.6%) | 53 (34.6%) |
| 75 Years and over | 39 (9.0%) | 15 (38.5%) |
| Total | 2,636 (61.6%) | 374 (14.2%) |
Employment Status by Educational Attainment in Williamston
According to labor force statistics for Williamston, 80.8% of individuals (2,108) out of the total population between 25 and 64 years of age (2,609) are in the labor force, with 6.1% or 129 of them being unemployed. The group with the highest labor force participation rate are those with the educational attainment of less than high school, with 92.8% or 411 individuals in the labor force. Within the labor force, individuals with high school diploma education have the highest percentage of unemployment, with 14.1% or 86 of them being unemployed.
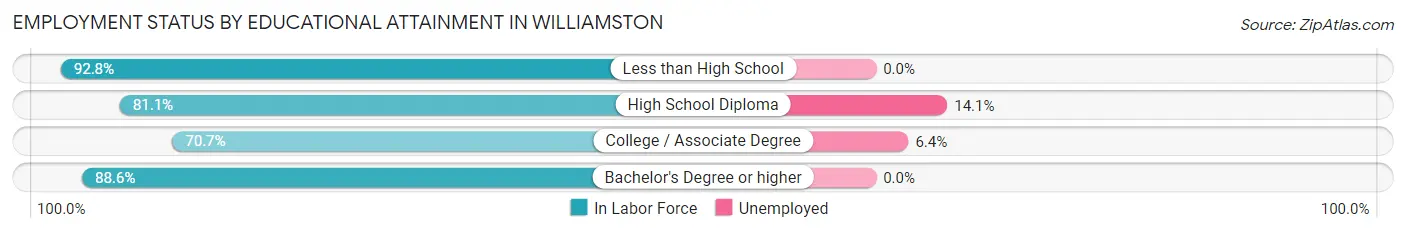
| Educational Attainment | In Labor Force | Unemployed |
| Less than High School | 411 (92.8%) | 0 (0.0%) |
| High School Diploma | 610 (81.1%) | 106 (14.1%) |
| College / Associate Degree | 660 (70.7%) | 60 (6.4%) |
| Bachelor's Degree or higher | 426 (88.6%) | 0 (0.0%) |
| Total | 2,108 (80.8%) | 159 (6.1%) |
Employment Occupations by Sex in Williamston
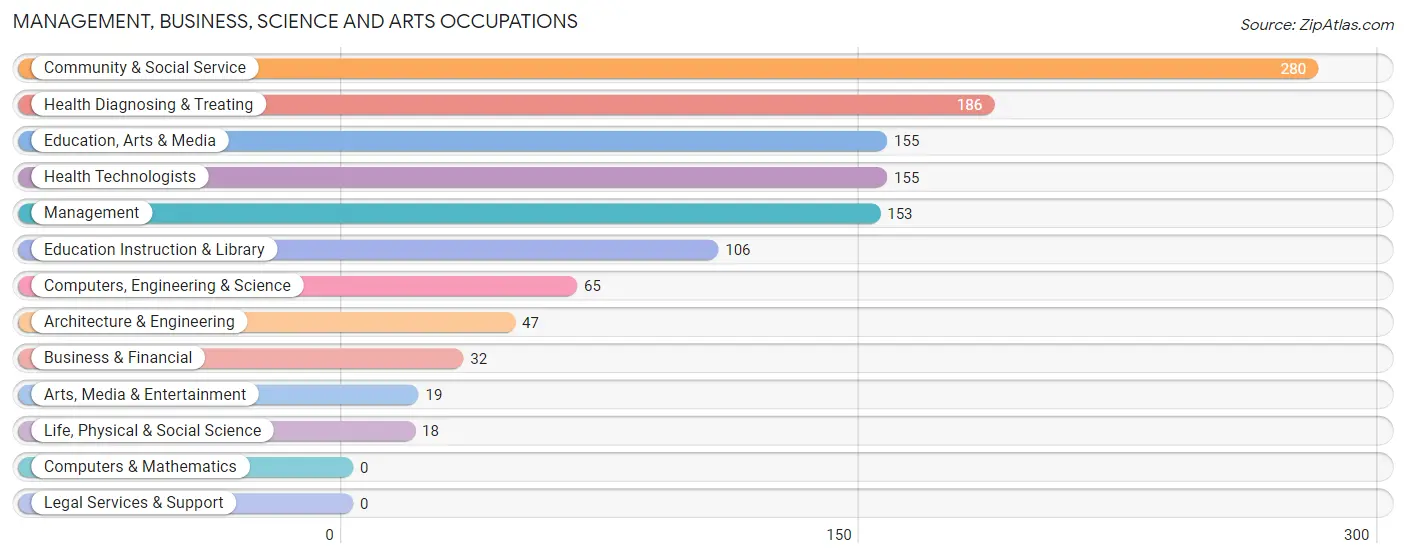
Management, Business, Science and Arts Occupations
The most common Management, Business, Science and Arts occupations in Williamston are Community & Social Service (280 | 12.4%), Health Diagnosing & Treating (186 | 8.2%), Education, Arts & Media (155 | 6.9%), Health Technologists (155 | 6.9%), and Management (153 | 6.8%).
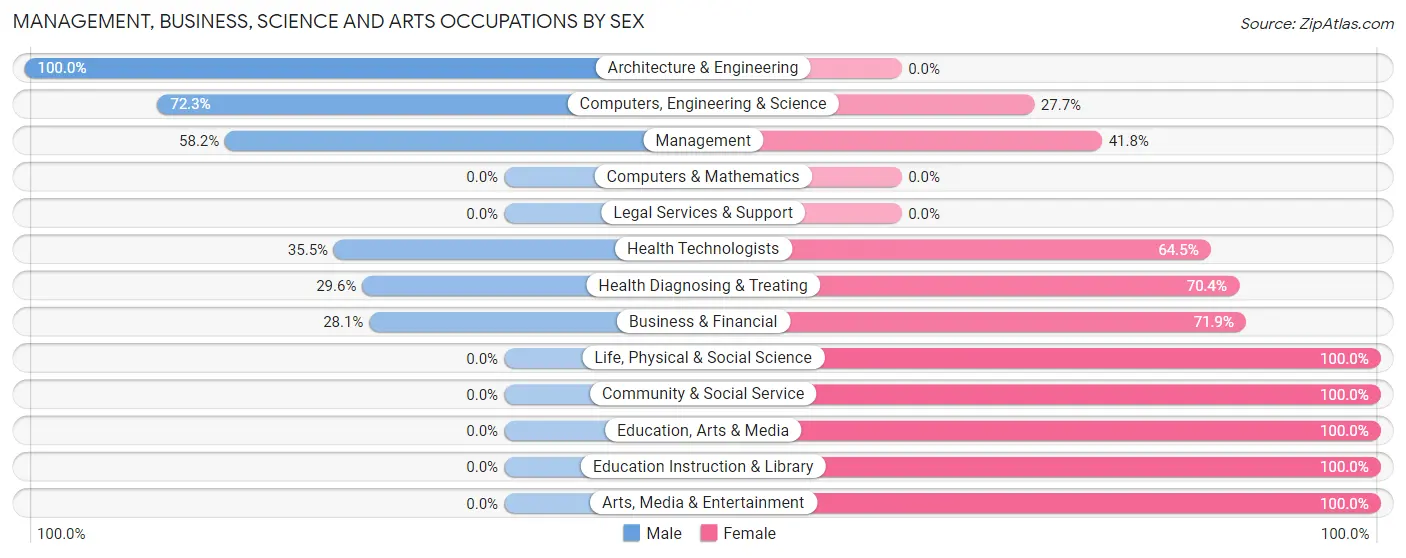
Management, Business, Science and Arts Occupations by Sex
Within the Management, Business, Science and Arts occupations in Williamston, the most male-oriented occupations are Architecture & Engineering (100.0%), Computers, Engineering & Science (72.3%), and Management (58.2%), while the most female-oriented occupations are Life, Physical & Social Science (100.0%), Community & Social Service (100.0%), and Education, Arts & Media (100.0%).
| Occupation | Male | Female |
| Management | 89 (58.2%) | 64 (41.8%) |
| Business & Financial | 9 (28.1%) | 23 (71.9%) |
| Computers, Engineering & Science | 47 (72.3%) | 18 (27.7%) |
| Computers & Mathematics | 0 (0.0%) | 0 (0.0%) |
| Architecture & Engineering | 47 (100.0%) | 0 (0.0%) |
| Life, Physical & Social Science | 0 (0.0%) | 18 (100.0%) |
| Community & Social Service | 0 (0.0%) | 280 (100.0%) |
| Education, Arts & Media | 0 (0.0%) | 155 (100.0%) |
| Legal Services & Support | 0 (0.0%) | 0 (0.0%) |
| Education Instruction & Library | 0 (0.0%) | 106 (100.0%) |
| Arts, Media & Entertainment | 0 (0.0%) | 19 (100.0%) |
| Health Diagnosing & Treating | 55 (29.6%) | 131 (70.4%) |
| Health Technologists | 55 (35.5%) | 100 (64.5%) |
| Total (Category) | 200 (27.9%) | 516 (72.1%) |
| Total (Overall) | 862 (38.1%) | 1,401 (61.9%) |
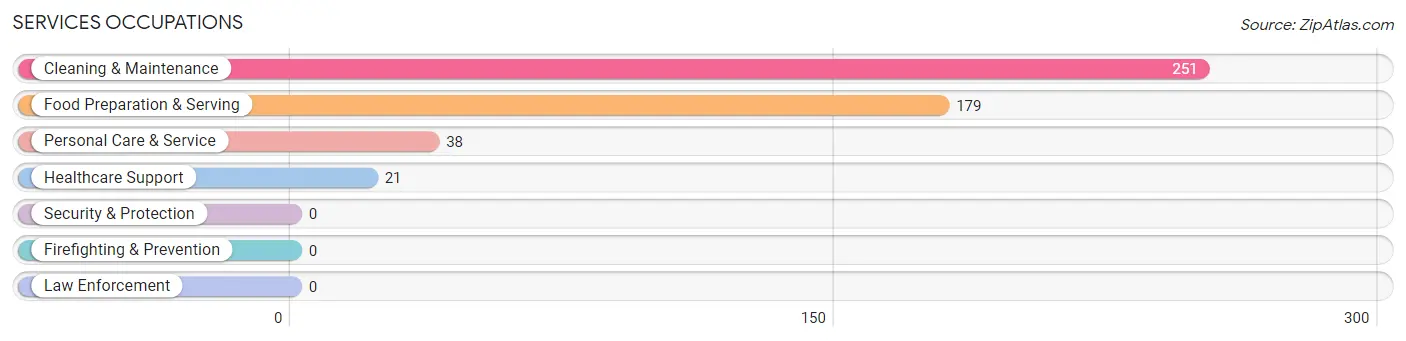
Services Occupations
The most common Services occupations in Williamston are Cleaning & Maintenance (251 | 11.1%), Food Preparation & Serving (179 | 7.9%), Personal Care & Service (38 | 1.7%), and Healthcare Support (21 | 0.9%).
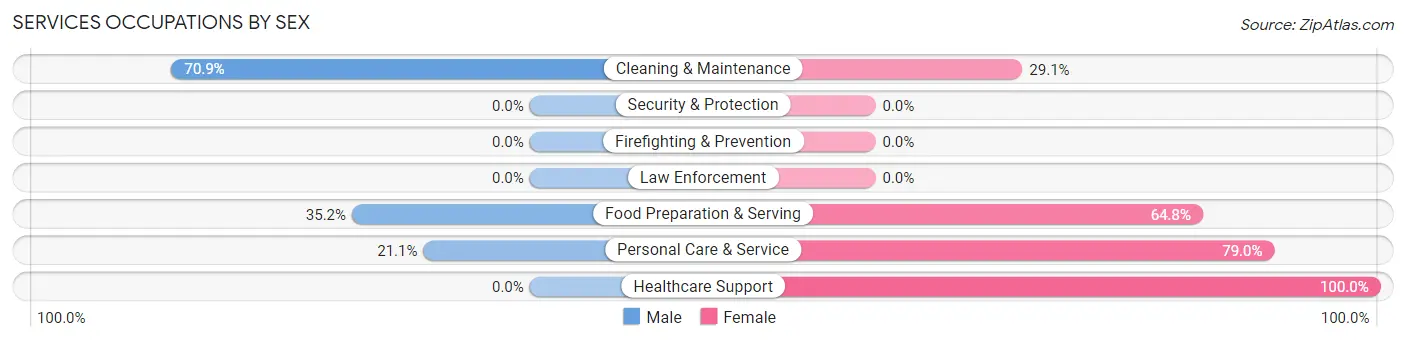
Services Occupations by Sex
Within the Services occupations in Williamston, the most male-oriented occupations are Cleaning & Maintenance (70.9%), Food Preparation & Serving (35.2%), and Personal Care & Service (21.0%), while the most female-oriented occupations are Healthcare Support (100.0%), Personal Care & Service (78.9%), and Food Preparation & Serving (64.8%).
| Occupation | Male | Female |
| Healthcare Support | 0 (0.0%) | 21 (100.0%) |
| Security & Protection | 0 (0.0%) | 0 (0.0%) |
| Firefighting & Prevention | 0 (0.0%) | 0 (0.0%) |
| Law Enforcement | 0 (0.0%) | 0 (0.0%) |
| Food Preparation & Serving | 63 (35.2%) | 116 (64.8%) |
| Cleaning & Maintenance | 178 (70.9%) | 73 (29.1%) |
| Personal Care & Service | 8 (21.0%) | 30 (78.9%) |
| Total (Category) | 249 (50.9%) | 240 (49.1%) |
| Total (Overall) | 862 (38.1%) | 1,401 (61.9%) |
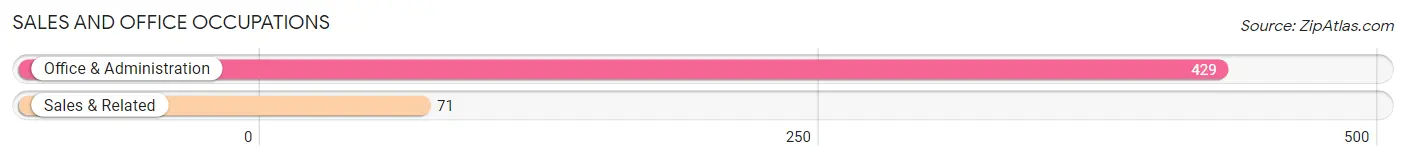
Sales and Office Occupations
The most common Sales and Office occupations in Williamston are Office & Administration (429 | 19.0%), and Sales & Related (71 | 3.1%).
Sales and Office Occupations by Sex
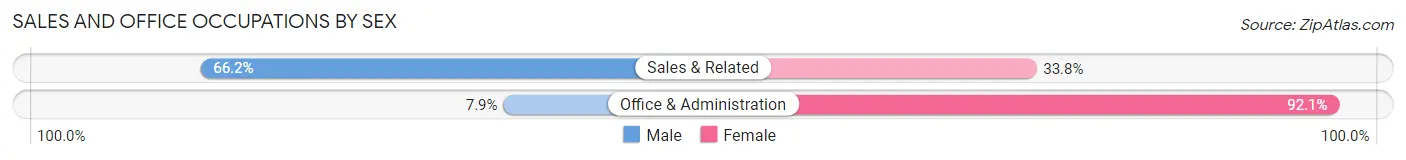
| Occupation | Male | Female |
| Sales & Related | 47 (66.2%) | 24 (33.8%) |
| Office & Administration | 34 (7.9%) | 395 (92.1%) |
| Total (Category) | 81 (16.2%) | 419 (83.8%) |
| Total (Overall) | 862 (38.1%) | 1,401 (61.9%) |
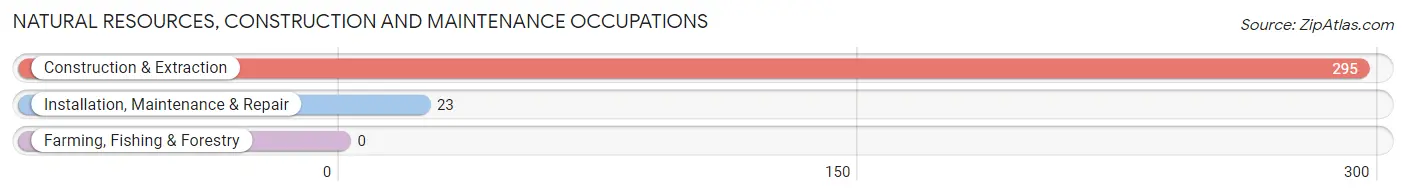
Natural Resources, Construction and Maintenance Occupations
The most common Natural Resources, Construction and Maintenance occupations in Williamston are Construction & Extraction (295 | 13.0%), and Installation, Maintenance & Repair (23 | 1.0%).
Natural Resources, Construction and Maintenance Occupations by Sex
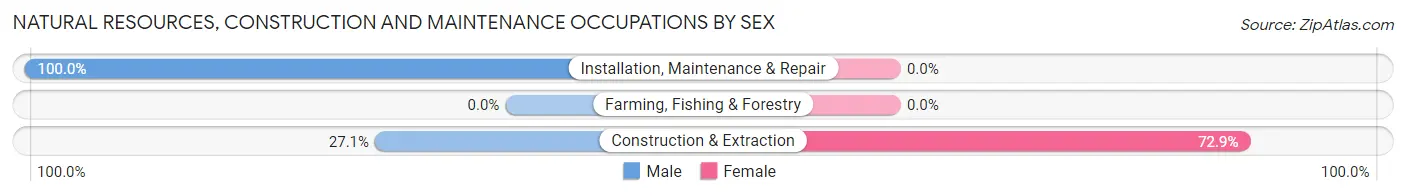
| Occupation | Male | Female |
| Farming, Fishing & Forestry | 0 (0.0%) | 0 (0.0%) |
| Construction & Extraction | 80 (27.1%) | 215 (72.9%) |
| Installation, Maintenance & Repair | 23 (100.0%) | 0 (0.0%) |
| Total (Category) | 103 (32.4%) | 215 (67.6%) |
| Total (Overall) | 862 (38.1%) | 1,401 (61.9%) |
Production, Transportation and Moving Occupations
The most common Production, Transportation and Moving occupations in Williamston are Material Moving (118 | 5.2%), Transportation (63 | 2.8%), and Production (59 | 2.6%).
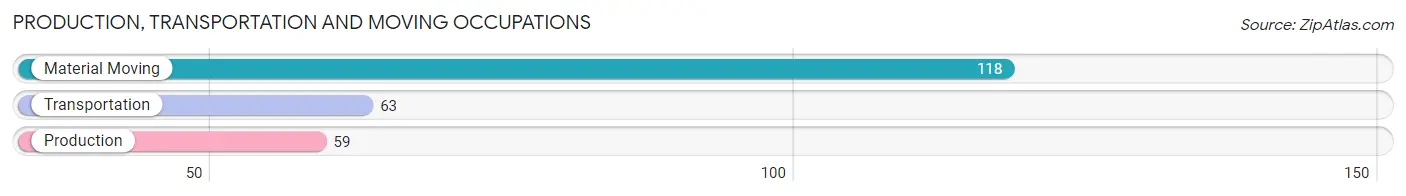
Production, Transportation and Moving Occupations by Sex
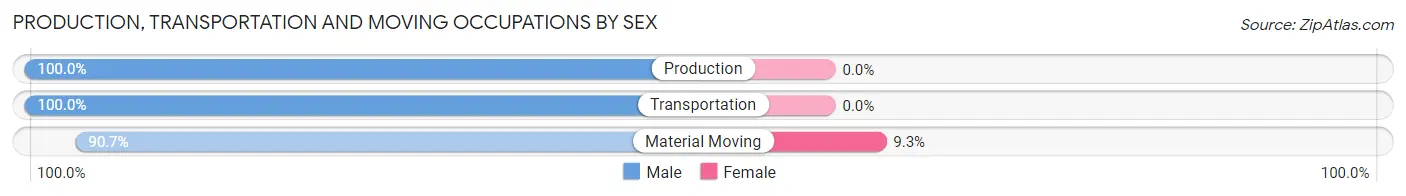
| Occupation | Male | Female |
| Production | 59 (100.0%) | 0 (0.0%) |
| Transportation | 63 (100.0%) | 0 (0.0%) |
| Material Moving | 107 (90.7%) | 11 (9.3%) |
| Total (Category) | 229 (95.4%) | 11 (4.6%) |
| Total (Overall) | 862 (38.1%) | 1,401 (61.9%) |
Employment Industries by Sex in Williamston
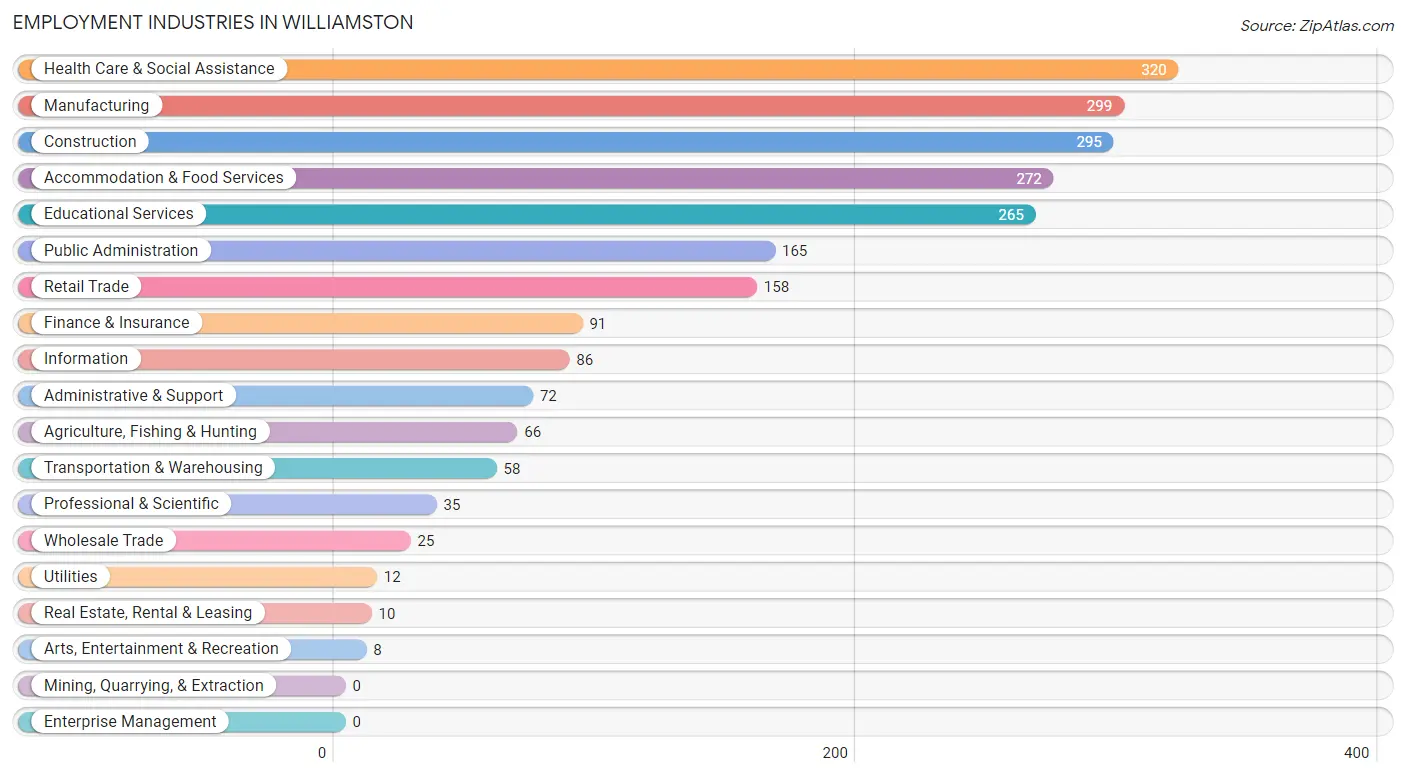
Employment Industries in Williamston
The major employment industries in Williamston include Health Care & Social Assistance (320 | 14.1%), Manufacturing (299 | 13.2%), Construction (295 | 13.0%), Accommodation & Food Services (272 | 12.0%), and Educational Services (265 | 11.7%).
Employment Industries by Sex in Williamston
The Williamston industries that see more men than women are Agriculture, Fishing & Hunting (100.0%), Wholesale Trade (100.0%), and Transportation & Warehousing (100.0%), whereas the industries that tend to have a higher number of women are Professional & Scientific (100.0%), Public Administration (100.0%), and Health Care & Social Assistance (82.8%).
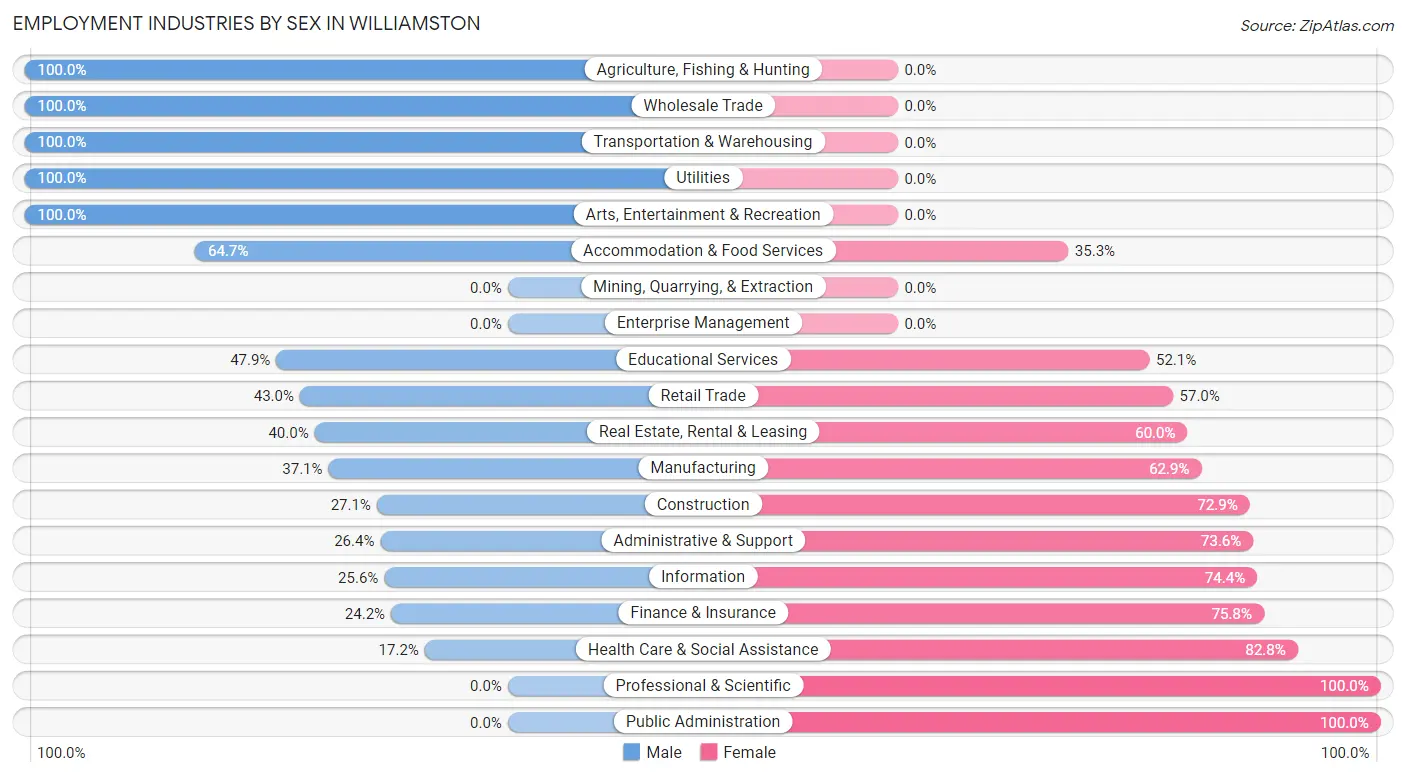
| Industry | Male | Female |
| Agriculture, Fishing & Hunting | 66 (100.0%) | 0 (0.0%) |
| Mining, Quarrying, & Extraction | 0 (0.0%) | 0 (0.0%) |
| Construction | 80 (27.1%) | 215 (72.9%) |
| Manufacturing | 111 (37.1%) | 188 (62.9%) |
| Wholesale Trade | 25 (100.0%) | 0 (0.0%) |
| Retail Trade | 68 (43.0%) | 90 (57.0%) |
| Transportation & Warehousing | 58 (100.0%) | 0 (0.0%) |
| Utilities | 12 (100.0%) | 0 (0.0%) |
| Information | 22 (25.6%) | 64 (74.4%) |
| Finance & Insurance | 22 (24.2%) | 69 (75.8%) |
| Real Estate, Rental & Leasing | 4 (40.0%) | 6 (60.0%) |
| Professional & Scientific | 0 (0.0%) | 35 (100.0%) |
| Enterprise Management | 0 (0.0%) | 0 (0.0%) |
| Administrative & Support | 19 (26.4%) | 53 (73.6%) |
| Educational Services | 127 (47.9%) | 138 (52.1%) |
| Health Care & Social Assistance | 55 (17.2%) | 265 (82.8%) |
| Arts, Entertainment & Recreation | 8 (100.0%) | 0 (0.0%) |
| Accommodation & Food Services | 176 (64.7%) | 96 (35.3%) |
| Public Administration | 0 (0.0%) | 165 (100.0%) |
| Total | 862 (38.1%) | 1,401 (61.9%) |
Education in Williamston
School Enrollment in Williamston
The most common levels of schooling among the 1,148 students in Williamston are high school (486 | 42.3%), middle school (288 | 25.1%), and elementary school (193 | 16.8%).
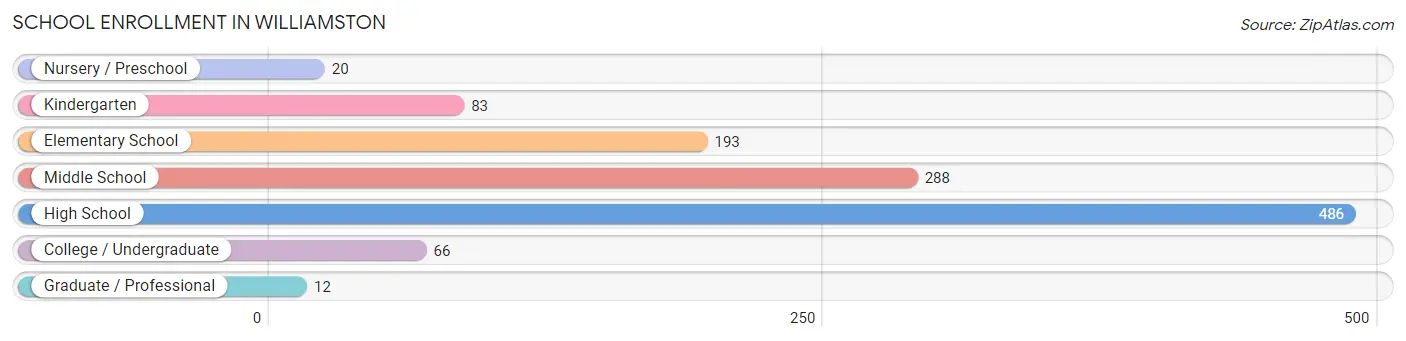
| School Level | # Students | % Students |
| Nursery / Preschool | 20 | 1.7% |
| Kindergarten | 83 | 7.2% |
| Elementary School | 193 | 16.8% |
| Middle School | 288 | 25.1% |
| High School | 486 | 42.3% |
| College / Undergraduate | 66 | 5.8% |
| Graduate / Professional | 12 | 1.1% |
| Total | 1,148 | 100.0% |
School Enrollment by Age by Funding Source in Williamston
Out of a total of 1,148 students who are enrolled in schools in Williamston, 139 (12.1%) attend a private institution, while the remaining 1,009 (87.9%) are enrolled in public schools. The age group of 3 to 4 year olds has the highest likelihood of being enrolled in private schools, with 20 (100.0% in the age bracket) enrolled. Conversely, the age group of 20 to 24 year olds has the lowest likelihood of being enrolled in a private school, with 47 (100.0% in the age bracket) attending a public institution.
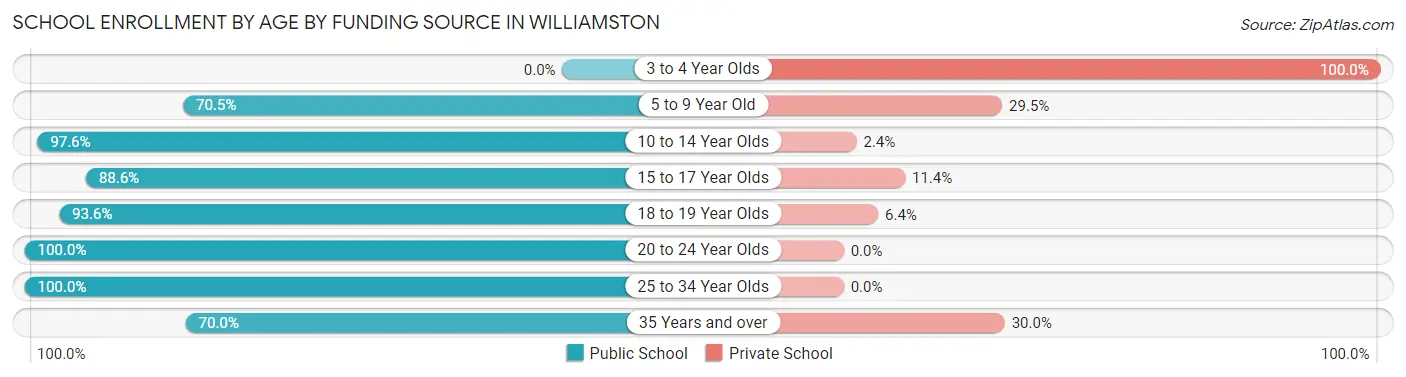
| Age Bracket | Public School | Private School |
| 3 to 4 Year Olds | 0 (0.0%) | 20 (100.0%) |
| 5 to 9 Year Old | 160 (70.5%) | 67 (29.5%) |
| 10 to 14 Year Olds | 411 (97.6%) | 10 (2.4%) |
| 15 to 17 Year Olds | 124 (88.6%) | 16 (11.4%) |
| 18 to 19 Year Olds | 204 (93.6%) | 14 (6.4%) |
| 20 to 24 Year Olds | 47 (100.0%) | 0 (0.0%) |
| 25 to 34 Year Olds | 35 (100.0%) | 0 (0.0%) |
| 35 Years and over | 28 (70.0%) | 12 (30.0%) |
| Total | 1,009 (87.9%) | 139 (12.1%) |
Educational Attainment by Field of Study in Williamston
Education (176 | 26.1%), business (121 | 17.9%), science & technology (109 | 16.2%), psychology (82 | 12.1%), and visual & performing arts (72 | 10.7%) are the most common fields of study among 675 individuals in Williamston who have obtained a bachelor's degree or higher.
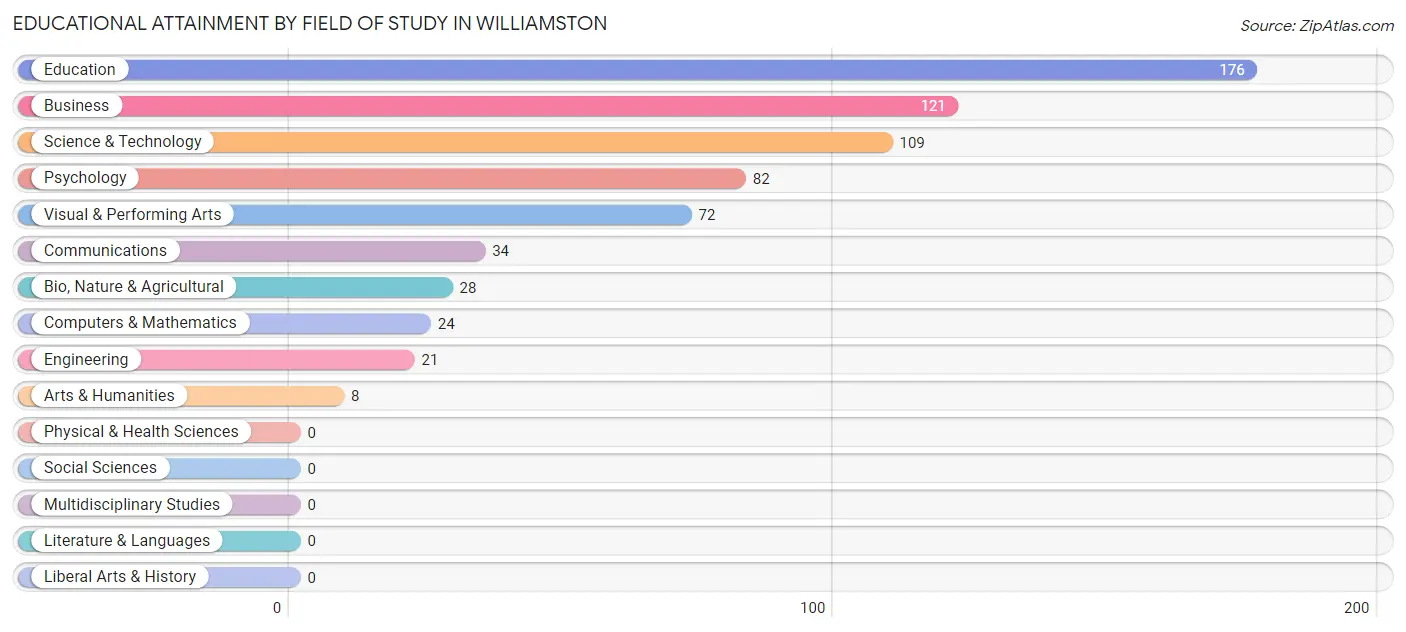
| Field of Study | # Graduates | % Graduates |
| Computers & Mathematics | 24 | 3.6% |
| Bio, Nature & Agricultural | 28 | 4.2% |
| Physical & Health Sciences | 0 | 0.0% |
| Psychology | 82 | 12.1% |
| Social Sciences | 0 | 0.0% |
| Engineering | 21 | 3.1% |
| Multidisciplinary Studies | 0 | 0.0% |
| Science & Technology | 109 | 16.2% |
| Business | 121 | 17.9% |
| Education | 176 | 26.1% |
| Literature & Languages | 0 | 0.0% |
| Liberal Arts & History | 0 | 0.0% |
| Visual & Performing Arts | 72 | 10.7% |
| Communications | 34 | 5.0% |
| Arts & Humanities | 8 | 1.2% |
| Total | 675 | 100.0% |
Transportation & Commute in Williamston
Vehicle Availability by Sex in Williamston
The most prevalent vehicle ownership categories in Williamston are males with 2 vehicles (331, accounting for 39.0%) and females with 2 vehicles (418, making up 23.8%).
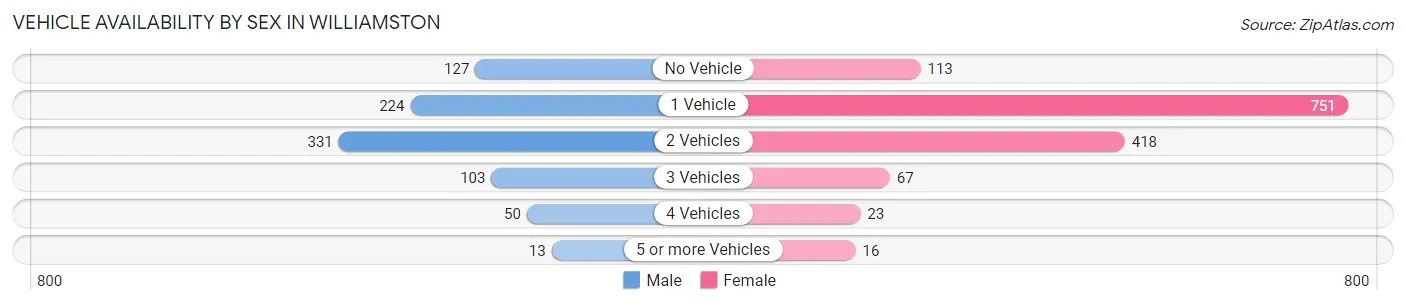
| Vehicles Available | Male | Female |
| No Vehicle | 127 (15.0%) | 113 (8.1%) |
| 1 Vehicle | 224 (26.4%) | 751 (54.1%) |
| 2 Vehicles | 331 (39.0%) | 418 (30.1%) |
| 3 Vehicles | 103 (12.1%) | 67 (4.8%) |
| 4 Vehicles | 50 (5.9%) | 23 (1.7%) |
| 5 or more Vehicles | 13 (1.5%) | 16 (1.1%) |
| Total | 848 (100.0%) | 1,388 (100.0%) |
Commute Time in Williamston
The most frequently occuring commute durations in Williamston are less than 5 minutes (462 commuters, 22.8%), 5 to 9 minutes (377 commuters, 18.6%), and 45 to 59 minutes (364 commuters, 18.0%).
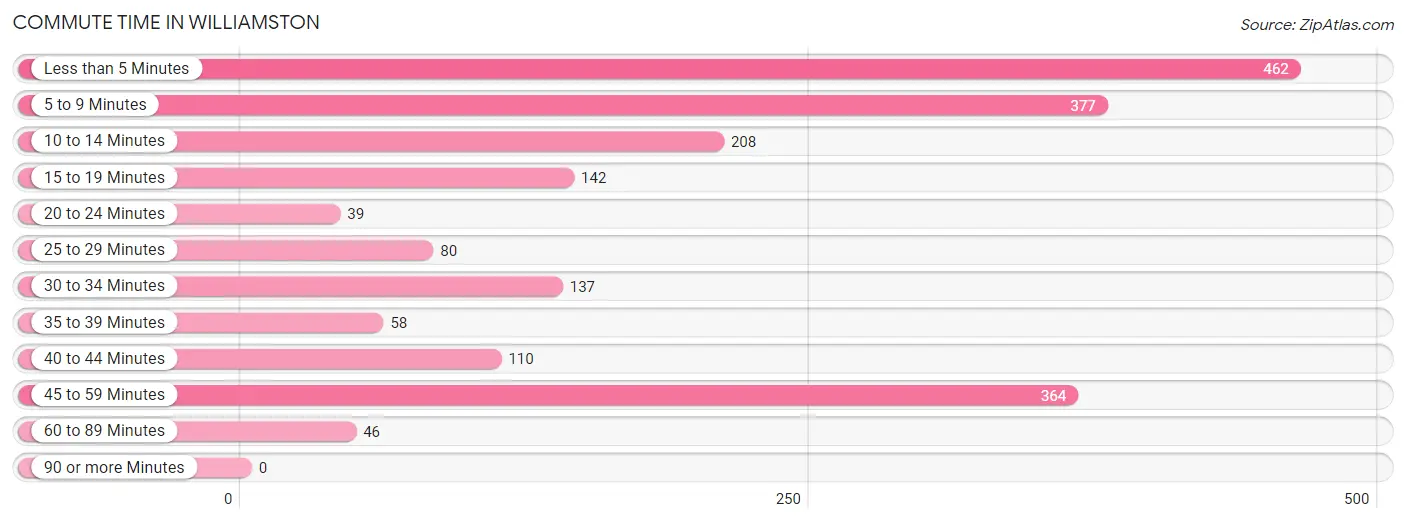
| Commute Time | # Commuters | % Commuters |
| Less than 5 Minutes | 462 | 22.8% |
| 5 to 9 Minutes | 377 | 18.6% |
| 10 to 14 Minutes | 208 | 10.3% |
| 15 to 19 Minutes | 142 | 7.0% |
| 20 to 24 Minutes | 39 | 1.9% |
| 25 to 29 Minutes | 80 | 4.0% |
| 30 to 34 Minutes | 137 | 6.8% |
| 35 to 39 Minutes | 58 | 2.9% |
| 40 to 44 Minutes | 110 | 5.4% |
| 45 to 59 Minutes | 364 | 18.0% |
| 60 to 89 Minutes | 46 | 2.3% |
| 90 or more Minutes | 0 | 0.0% |
Commute Time by Sex in Williamston
The most common commute times in Williamston are 5 to 9 minutes (198 commuters, 28.1%) for males and less than 5 minutes (385 commuters, 29.2%) for females.
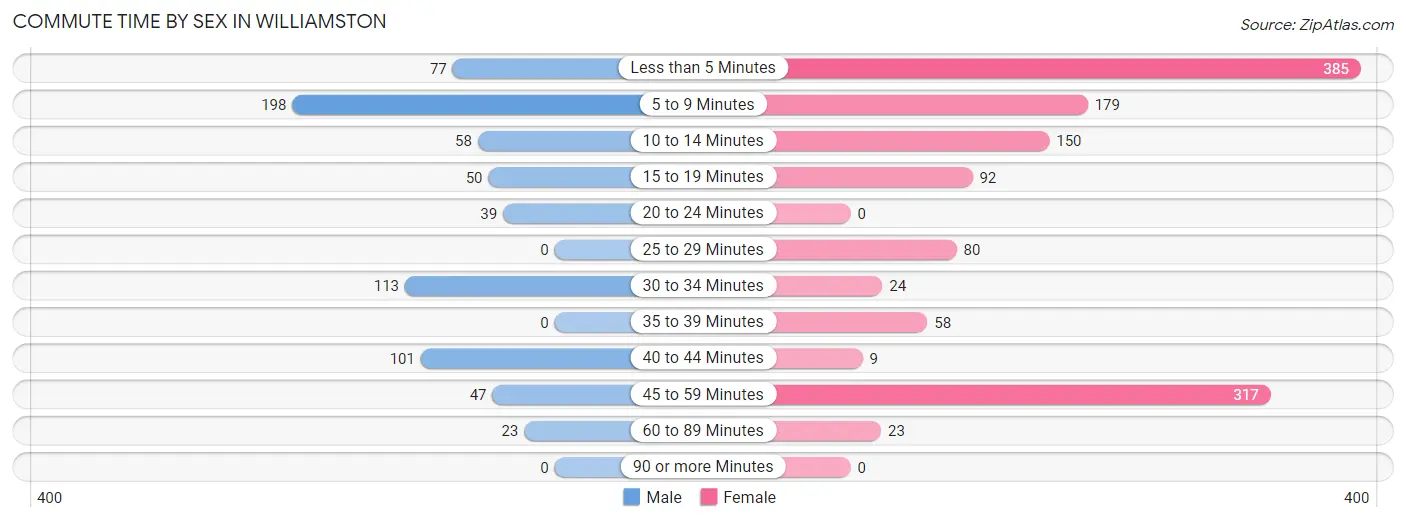
| Commute Time | Male | Female |
| Less than 5 Minutes | 77 (10.9%) | 385 (29.2%) |
| 5 to 9 Minutes | 198 (28.1%) | 179 (13.6%) |
| 10 to 14 Minutes | 58 (8.2%) | 150 (11.4%) |
| 15 to 19 Minutes | 50 (7.1%) | 92 (7.0%) |
| 20 to 24 Minutes | 39 (5.5%) | 0 (0.0%) |
| 25 to 29 Minutes | 0 (0.0%) | 80 (6.1%) |
| 30 to 34 Minutes | 113 (16.0%) | 24 (1.8%) |
| 35 to 39 Minutes | 0 (0.0%) | 58 (4.4%) |
| 40 to 44 Minutes | 101 (14.3%) | 9 (0.7%) |
| 45 to 59 Minutes | 47 (6.7%) | 317 (24.1%) |
| 60 to 89 Minutes | 23 (3.3%) | 23 (1.8%) |
| 90 or more Minutes | 0 (0.0%) | 0 (0.0%) |
Time of Departure to Work by Sex in Williamston
The most frequent times of departure to work in Williamston are 7:30 AM to 7:59 AM (149, 21.1%) for males and 12:00 PM to 3:59 PM (331, 25.1%) for females.
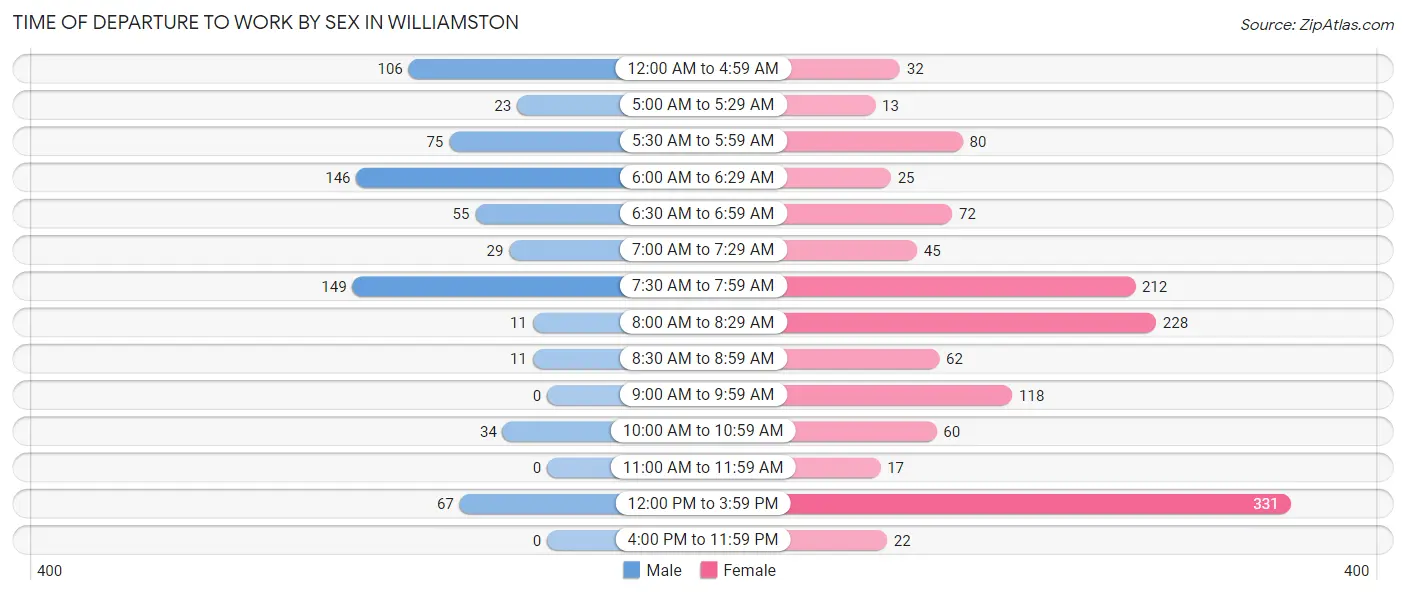
| Time of Departure | Male | Female |
| 12:00 AM to 4:59 AM | 106 (15.0%) | 32 (2.4%) |
| 5:00 AM to 5:29 AM | 23 (3.3%) | 13 (1.0%) |
| 5:30 AM to 5:59 AM | 75 (10.6%) | 80 (6.1%) |
| 6:00 AM to 6:29 AM | 146 (20.7%) | 25 (1.9%) |
| 6:30 AM to 6:59 AM | 55 (7.8%) | 72 (5.5%) |
| 7:00 AM to 7:29 AM | 29 (4.1%) | 45 (3.4%) |
| 7:30 AM to 7:59 AM | 149 (21.1%) | 212 (16.1%) |
| 8:00 AM to 8:29 AM | 11 (1.6%) | 228 (17.3%) |
| 8:30 AM to 8:59 AM | 11 (1.6%) | 62 (4.7%) |
| 9:00 AM to 9:59 AM | 0 (0.0%) | 118 (9.0%) |
| 10:00 AM to 10:59 AM | 34 (4.8%) | 60 (4.6%) |
| 11:00 AM to 11:59 AM | 0 (0.0%) | 17 (1.3%) |
| 12:00 PM to 3:59 PM | 67 (9.5%) | 331 (25.1%) |
| 4:00 PM to 11:59 PM | 0 (0.0%) | 22 (1.7%) |
| Total | 706 (100.0%) | 1,317 (100.0%) |
Housing Occupancy in Williamston
Occupancy by Ownership in Williamston
Of the total 2,461 dwellings in Williamston, owner-occupied units account for 1,231 (50.0%), while renter-occupied units make up 1,230 (50.0%).
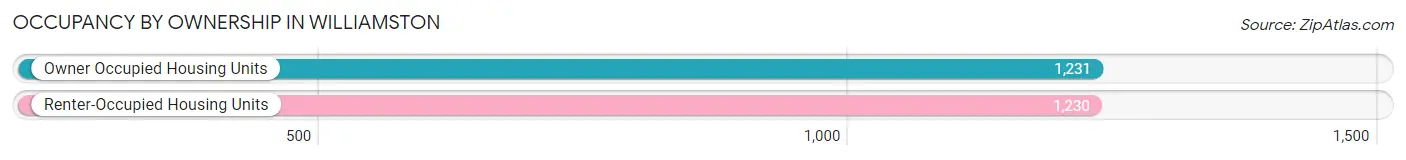
| Occupancy | # Housing Units | % Housing Units |
| Owner Occupied Housing Units | 1,231 | 50.0% |
| Renter-Occupied Housing Units | 1,230 | 50.0% |
| Total Occupied Housing Units | 2,461 | 100.0% |
Occupancy by Household Size in Williamston
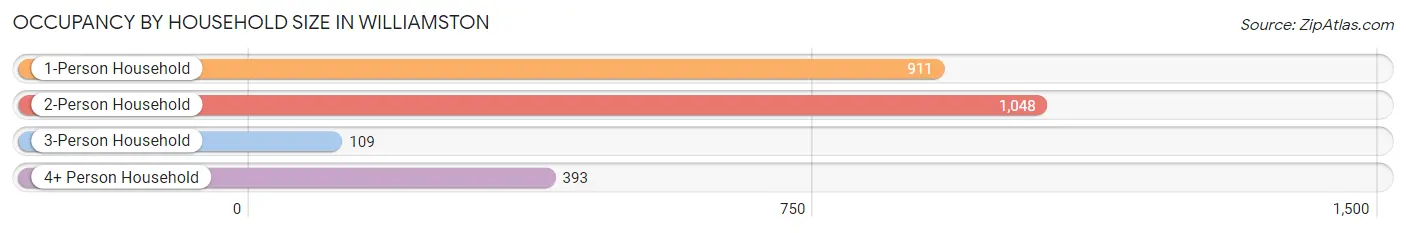
| Household Size | # Housing Units | % Housing Units |
| 1-Person Household | 911 | 37.0% |
| 2-Person Household | 1,048 | 42.6% |
| 3-Person Household | 109 | 4.4% |
| 4+ Person Household | 393 | 16.0% |
| Total Housing Units | 2,461 | 100.0% |
Occupancy by Ownership by Household Size in Williamston
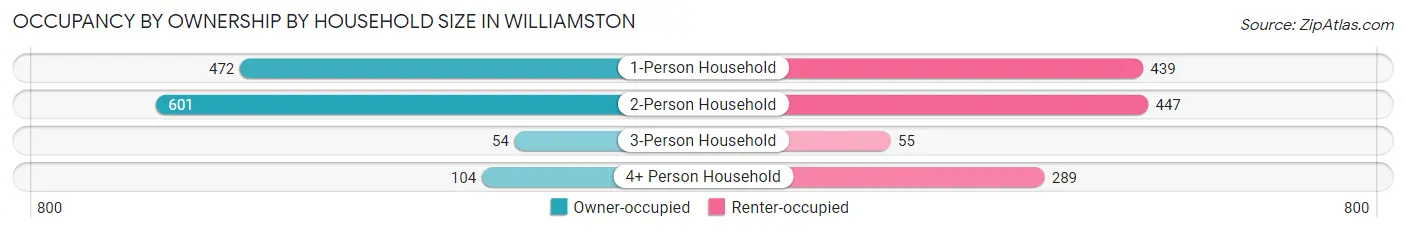
| Household Size | Owner-occupied | Renter-occupied |
| 1-Person Household | 472 (51.8%) | 439 (48.2%) |
| 2-Person Household | 601 (57.4%) | 447 (42.6%) |
| 3-Person Household | 54 (49.5%) | 55 (50.5%) |
| 4+ Person Household | 104 (26.5%) | 289 (73.5%) |
| Total Housing Units | 1,231 (50.0%) | 1,230 (50.0%) |
Occupancy by Educational Attainment in Williamston
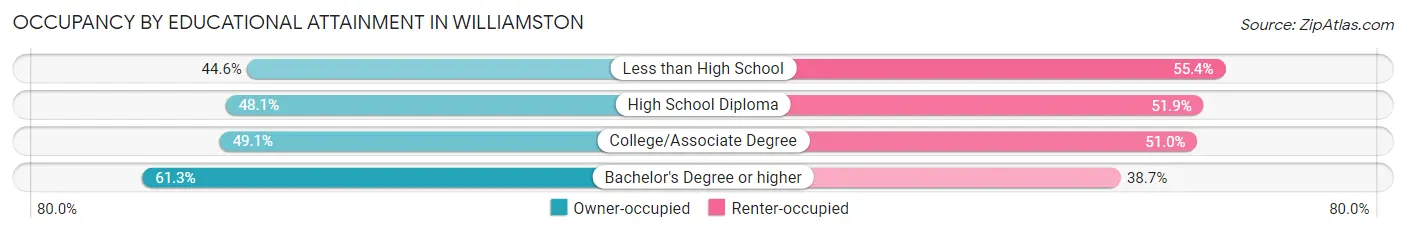
| Household Size | Owner-occupied | Renter-occupied |
| Less than High School | 224 (44.6%) | 278 (55.4%) |
| High School Diploma | 378 (48.1%) | 408 (51.9%) |
| College/Associate Degree | 361 (49.0%) | 375 (50.9%) |
| Bachelor's Degree or higher | 268 (61.3%) | 169 (38.7%) |
Occupancy by Age of Householder in Williamston
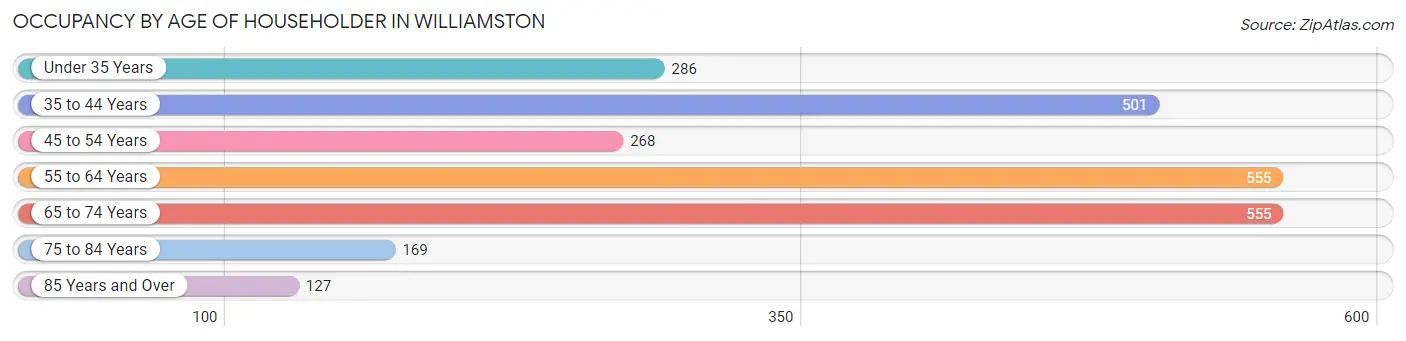
| Age Bracket | # Households | % Households |
| Under 35 Years | 286 | 11.6% |
| 35 to 44 Years | 501 | 20.4% |
| 45 to 54 Years | 268 | 10.9% |
| 55 to 64 Years | 555 | 22.6% |
| 65 to 74 Years | 555 | 22.6% |
| 75 to 84 Years | 169 | 6.9% |
| 85 Years and Over | 127 | 5.2% |
| Total | 2,461 | 100.0% |
Housing Finances in Williamston
Median Income by Occupancy in Williamston
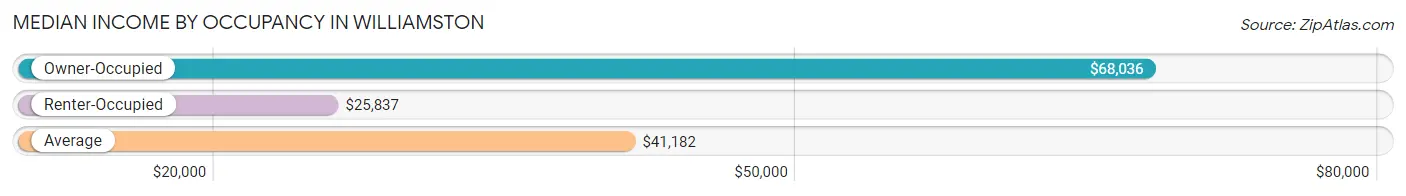
| Occupancy Type | # Households | Median Income |
| Owner-Occupied | 1,231 (50.0%) | $68,036 |
| Renter-Occupied | 1,230 (50.0%) | $25,837 |
| Average | 2,461 (100.0%) | $41,182 |
Occupancy by Householder Income Bracket in Williamston
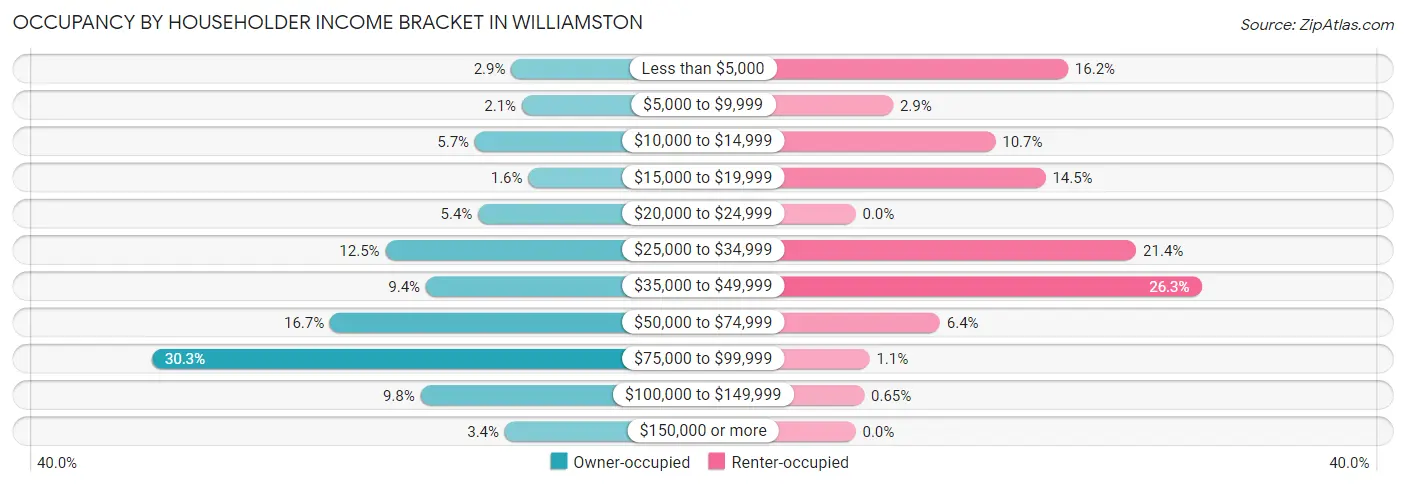
| Income Bracket | Owner-occupied | Renter-occupied |
| Less than $5,000 | 36 (2.9%) | 199 (16.2%) |
| $5,000 to $9,999 | 26 (2.1%) | 35 (2.9%) |
| $10,000 to $14,999 | 70 (5.7%) | 131 (10.6%) |
| $15,000 to $19,999 | 20 (1.6%) | 178 (14.5%) |
| $20,000 to $24,999 | 67 (5.4%) | 0 (0.0%) |
| $25,000 to $34,999 | 154 (12.5%) | 263 (21.4%) |
| $35,000 to $49,999 | 116 (9.4%) | 324 (26.3%) |
| $50,000 to $74,999 | 206 (16.7%) | 79 (6.4%) |
| $75,000 to $99,999 | 373 (30.3%) | 13 (1.1%) |
| $100,000 to $149,999 | 121 (9.8%) | 8 (0.6%) |
| $150,000 or more | 42 (3.4%) | 0 (0.0%) |
| Total | 1,231 (100.0%) | 1,230 (100.0%) |
Monthly Housing Cost Tiers in Williamston
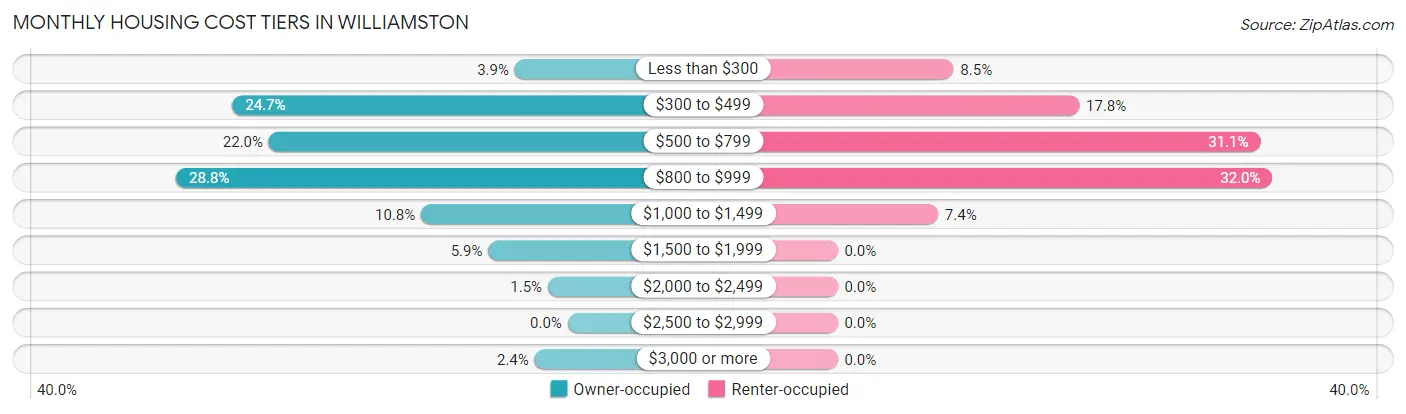
| Monthly Cost | Owner-occupied | Renter-occupied |
| Less than $300 | 48 (3.9%) | 105 (8.5%) |
| $300 to $499 | 304 (24.7%) | 219 (17.8%) |
| $500 to $799 | 271 (22.0%) | 383 (31.1%) |
| $800 to $999 | 355 (28.8%) | 394 (32.0%) |
| $1,000 to $1,499 | 133 (10.8%) | 91 (7.4%) |
| $1,500 to $1,999 | 72 (5.9%) | 0 (0.0%) |
| $2,000 to $2,499 | 18 (1.5%) | 0 (0.0%) |
| $2,500 to $2,999 | 0 (0.0%) | 0 (0.0%) |
| $3,000 or more | 30 (2.4%) | 0 (0.0%) |
| Total | 1,231 (100.0%) | 1,230 (100.0%) |
Physical Housing Characteristics in Williamston
Housing Structures in Williamston
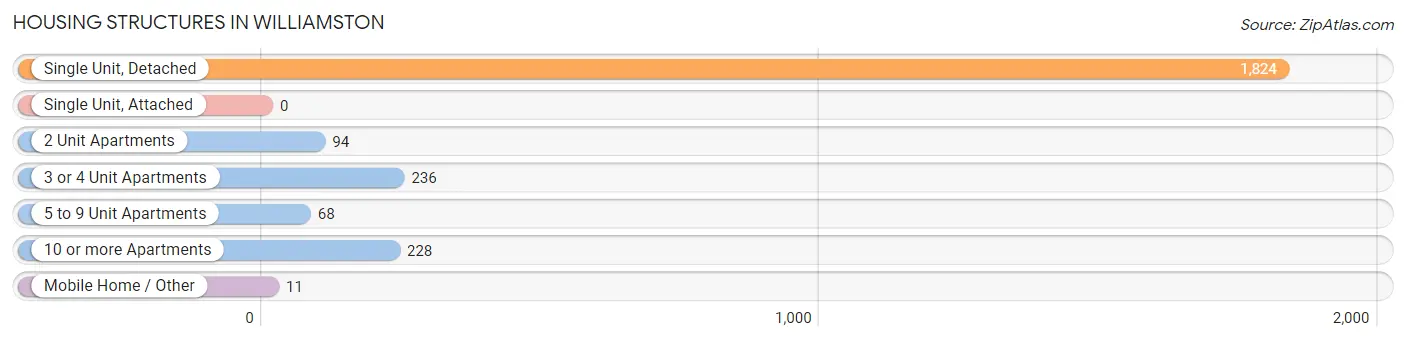
| Structure Type | # Housing Units | % Housing Units |
| Single Unit, Detached | 1,824 | 74.1% |
| Single Unit, Attached | 0 | 0.0% |
| 2 Unit Apartments | 94 | 3.8% |
| 3 or 4 Unit Apartments | 236 | 9.6% |
| 5 to 9 Unit Apartments | 68 | 2.8% |
| 10 or more Apartments | 228 | 9.3% |
| Mobile Home / Other | 11 | 0.4% |
| Total | 2,461 | 100.0% |
Housing Structures by Occupancy in Williamston
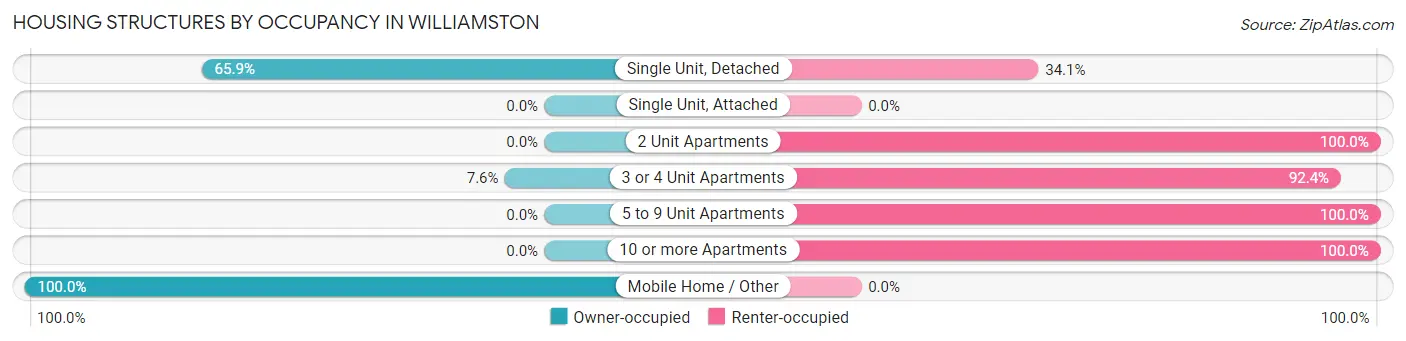
| Structure Type | Owner-occupied | Renter-occupied |
| Single Unit, Detached | 1,202 (65.9%) | 622 (34.1%) |
| Single Unit, Attached | 0 (0.0%) | 0 (0.0%) |
| 2 Unit Apartments | 0 (0.0%) | 94 (100.0%) |
| 3 or 4 Unit Apartments | 18 (7.6%) | 218 (92.4%) |
| 5 to 9 Unit Apartments | 0 (0.0%) | 68 (100.0%) |
| 10 or more Apartments | 0 (0.0%) | 228 (100.0%) |
| Mobile Home / Other | 11 (100.0%) | 0 (0.0%) |
| Total | 1,231 (50.0%) | 1,230 (50.0%) |
Housing Structures by Number of Rooms in Williamston
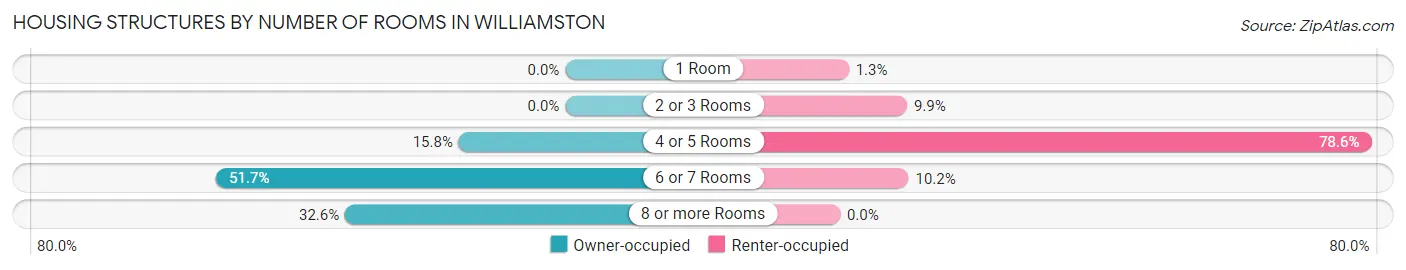
| Number of Rooms | Owner-occupied | Renter-occupied |
| 1 Room | 0 (0.0%) | 16 (1.3%) |
| 2 or 3 Rooms | 0 (0.0%) | 122 (9.9%) |
| 4 or 5 Rooms | 194 (15.8%) | 967 (78.6%) |
| 6 or 7 Rooms | 636 (51.7%) | 125 (10.2%) |
| 8 or more Rooms | 401 (32.6%) | 0 (0.0%) |
| Total | 1,231 (100.0%) | 1,230 (100.0%) |
Housing Structure by Heating Type in Williamston
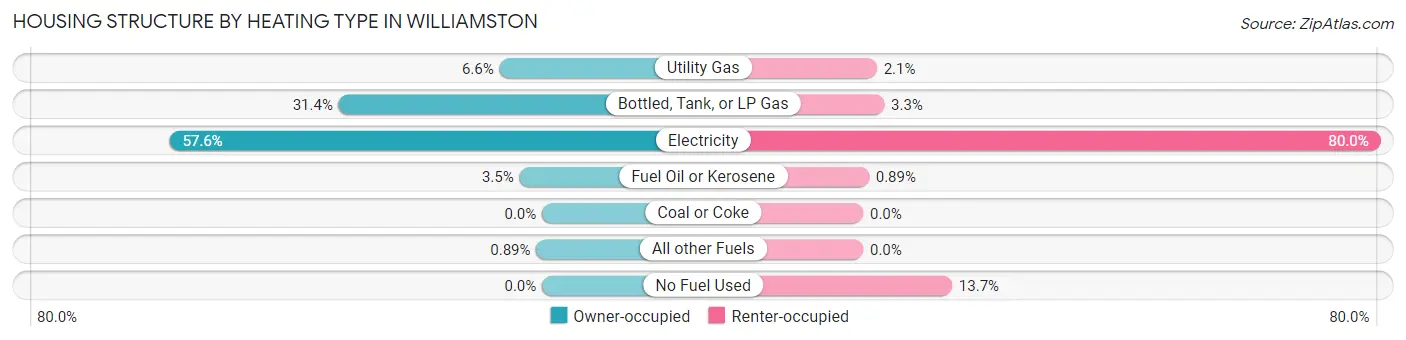
| Heating Type | Owner-occupied | Renter-occupied |
| Utility Gas | 81 (6.6%) | 26 (2.1%) |
| Bottled, Tank, or LP Gas | 387 (31.4%) | 40 (3.3%) |
| Electricity | 709 (57.6%) | 984 (80.0%) |
| Fuel Oil or Kerosene | 43 (3.5%) | 11 (0.9%) |
| Coal or Coke | 0 (0.0%) | 0 (0.0%) |
| All other Fuels | 11 (0.9%) | 0 (0.0%) |
| No Fuel Used | 0 (0.0%) | 169 (13.7%) |
| Total | 1,231 (100.0%) | 1,230 (100.0%) |
Household Vehicle Usage in Williamston
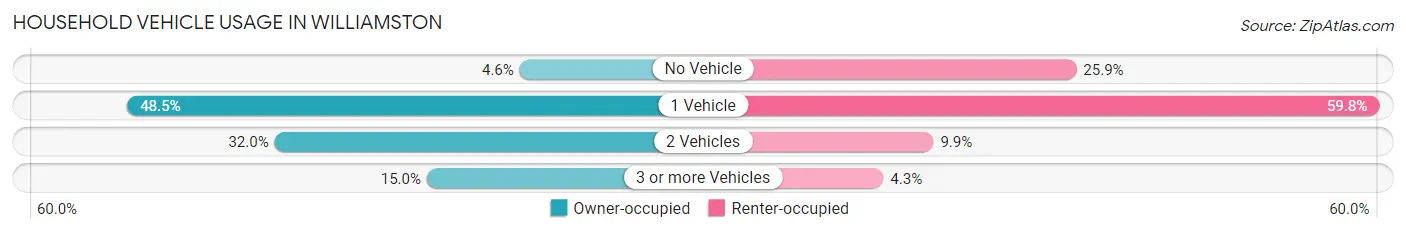
| Vehicles per Household | Owner-occupied | Renter-occupied |
| No Vehicle | 56 (4.5%) | 319 (25.9%) |
| 1 Vehicle | 597 (48.5%) | 736 (59.8%) |
| 2 Vehicles | 394 (32.0%) | 122 (9.9%) |
| 3 or more Vehicles | 184 (14.9%) | 53 (4.3%) |
| Total | 1,231 (100.0%) | 1,230 (100.0%) |
Real Estate & Mortgages in Williamston
Real Estate and Mortgage Overview in Williamston
| Characteristic | Without Mortgage | With Mortgage |
| Housing Units | 492 | 739 |
| Median Property Value | $117,600 | $96,200 |
| Median Household Income | $68,190 | $16 |
| Monthly Housing Costs | $438 | $30 |
| Real Estate Taxes | $1,597 | $0 |
Property Value by Mortgage Status in Williamston
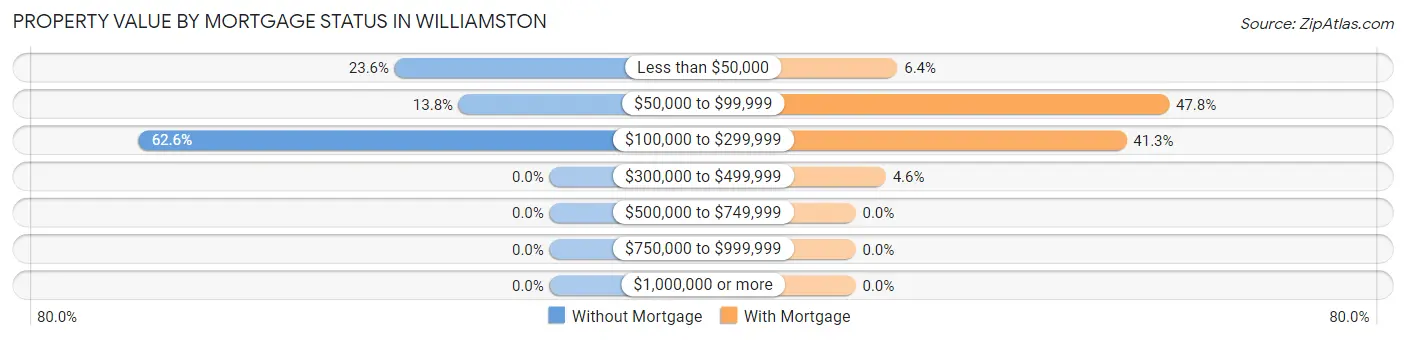
| Property Value | Without Mortgage | With Mortgage |
| Less than $50,000 | 116 (23.6%) | 47 (6.4%) |
| $50,000 to $99,999 | 68 (13.8%) | 353 (47.8%) |
| $100,000 to $299,999 | 308 (62.6%) | 305 (41.3%) |
| $300,000 to $499,999 | 0 (0.0%) | 34 (4.6%) |
| $500,000 to $749,999 | 0 (0.0%) | 0 (0.0%) |
| $750,000 to $999,999 | 0 (0.0%) | 0 (0.0%) |
| $1,000,000 or more | 0 (0.0%) | 0 (0.0%) |
| Total | 492 (100.0%) | 739 (100.0%) |
Household Income by Mortgage Status in Williamston
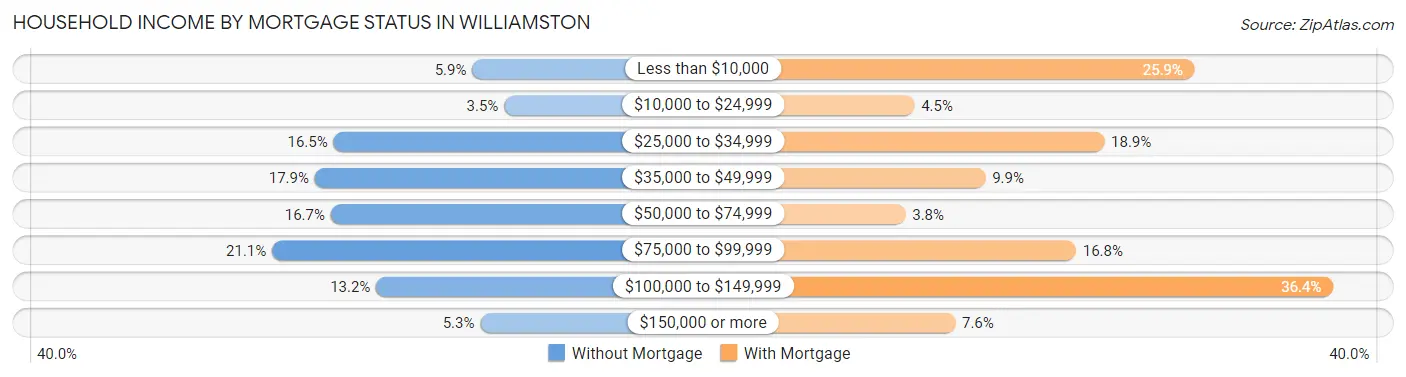
| Household Income | Without Mortgage | With Mortgage |
| Less than $10,000 | 29 (5.9%) | 191 (25.9%) |
| $10,000 to $24,999 | 17 (3.5%) | 33 (4.5%) |
| $25,000 to $34,999 | 81 (16.5%) | 140 (18.9%) |
| $35,000 to $49,999 | 88 (17.9%) | 73 (9.9%) |
| $50,000 to $74,999 | 82 (16.7%) | 28 (3.8%) |
| $75,000 to $99,999 | 104 (21.1%) | 124 (16.8%) |
| $100,000 to $149,999 | 65 (13.2%) | 269 (36.4%) |
| $150,000 or more | 26 (5.3%) | 56 (7.6%) |
| Total | 492 (100.0%) | 739 (100.0%) |
Property Value to Household Income Ratio in Williamston
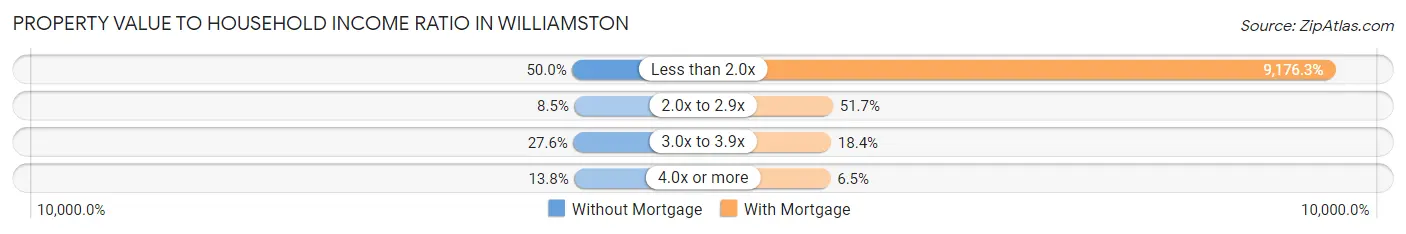
| Value-to-Income Ratio | Without Mortgage | With Mortgage |
| Less than 2.0x | 246 (50.0%) | 67,813 (9,176.3%) |
| 2.0x to 2.9x | 42 (8.5%) | 382 (51.7%) |
| 3.0x to 3.9x | 136 (27.6%) | 136 (18.4%) |
| 4.0x or more | 68 (13.8%) | 48 (6.5%) |
| Total | 492 (100.0%) | 739 (100.0%) |
Real Estate Taxes by Mortgage Status in Williamston
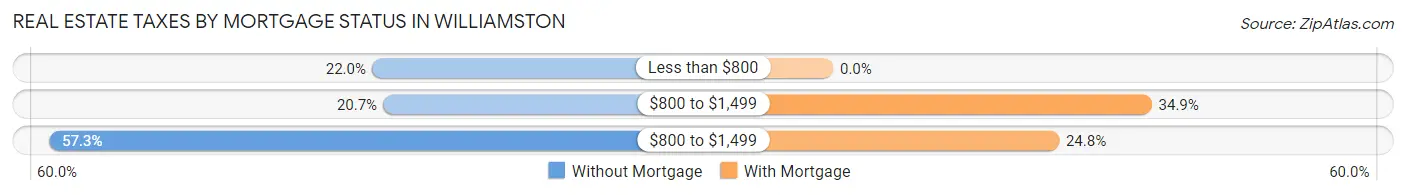
| Property Taxes | Without Mortgage | With Mortgage |
| Less than $800 | 108 (22.0%) | 0 (0.0%) |
| $800 to $1,499 | 102 (20.7%) | 258 (34.9%) |
| $800 to $1,499 | 282 (57.3%) | 183 (24.8%) |
| Total | 492 (100.0%) | 739 (100.0%) |
Health & Disability in Williamston
Health Insurance Coverage by Age in Williamston
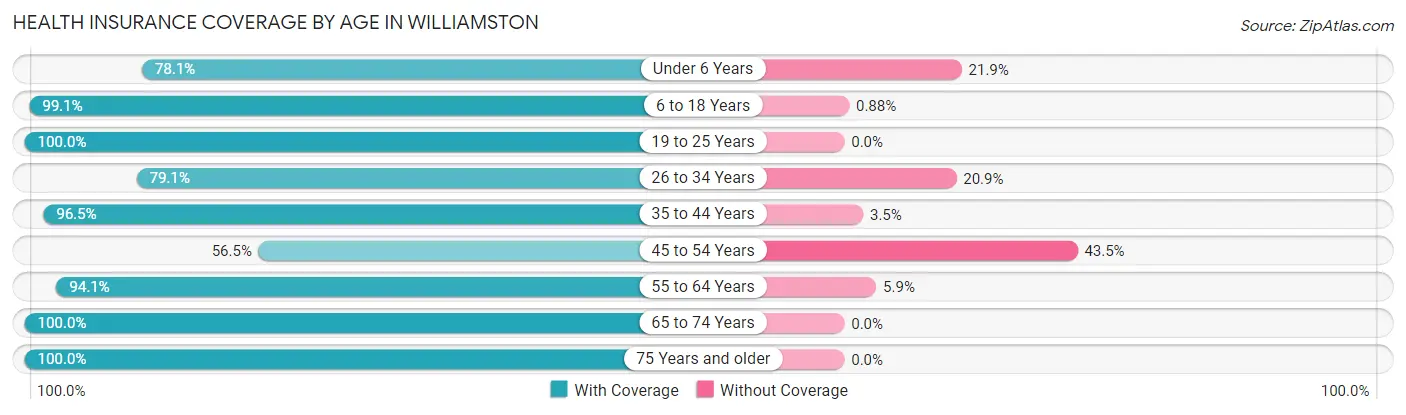
| Age Bracket | With Coverage | Without Coverage |
| Under 6 Years | 225 (78.1%) | 63 (21.9%) |
| 6 to 18 Years | 901 (99.1%) | 8 (0.9%) |
| 19 to 25 Years | 251 (100.0%) | 0 (0.0%) |
| 26 to 34 Years | 307 (79.1%) | 81 (20.9%) |
| 35 to 44 Years | 720 (96.5%) | 26 (3.5%) |
| 45 to 54 Years | 260 (56.5%) | 200 (43.5%) |
| 55 to 64 Years | 887 (94.1%) | 56 (5.9%) |
| 65 to 74 Years | 756 (100.0%) | 0 (0.0%) |
| 75 Years and older | 355 (100.0%) | 0 (0.0%) |
| Total | 4,662 (91.5%) | 434 (8.5%) |
Health Insurance Coverage by Citizenship Status in Williamston
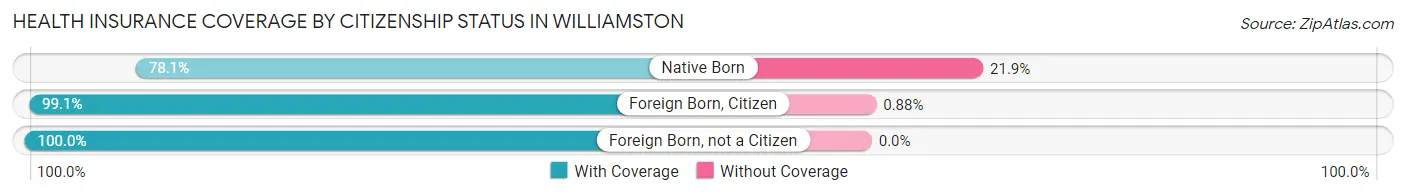
| Citizenship Status | With Coverage | Without Coverage |
| Native Born | 225 (78.1%) | 63 (21.9%) |
| Foreign Born, Citizen | 901 (99.1%) | 8 (0.9%) |
| Foreign Born, not a Citizen | 251 (100.0%) | 0 (0.0%) |
Health Insurance Coverage by Household Income in Williamston
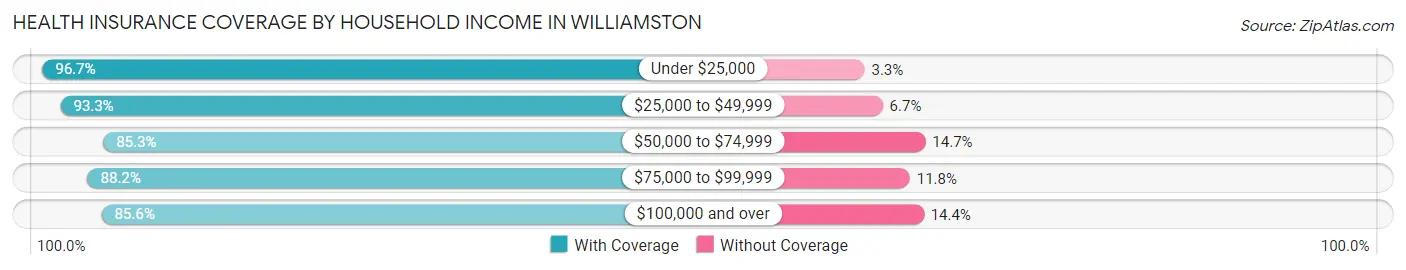
| Household Income | With Coverage | Without Coverage |
| Under $25,000 | 1,281 (96.7%) | 44 (3.3%) |
| $25,000 to $49,999 | 1,624 (93.3%) | 117 (6.7%) |
| $50,000 to $74,999 | 637 (85.3%) | 110 (14.7%) |
| $75,000 to $99,999 | 732 (88.2%) | 98 (11.8%) |
| $100,000 and over | 386 (85.6%) | 65 (14.4%) |
Public vs Private Health Insurance Coverage by Age in Williamston
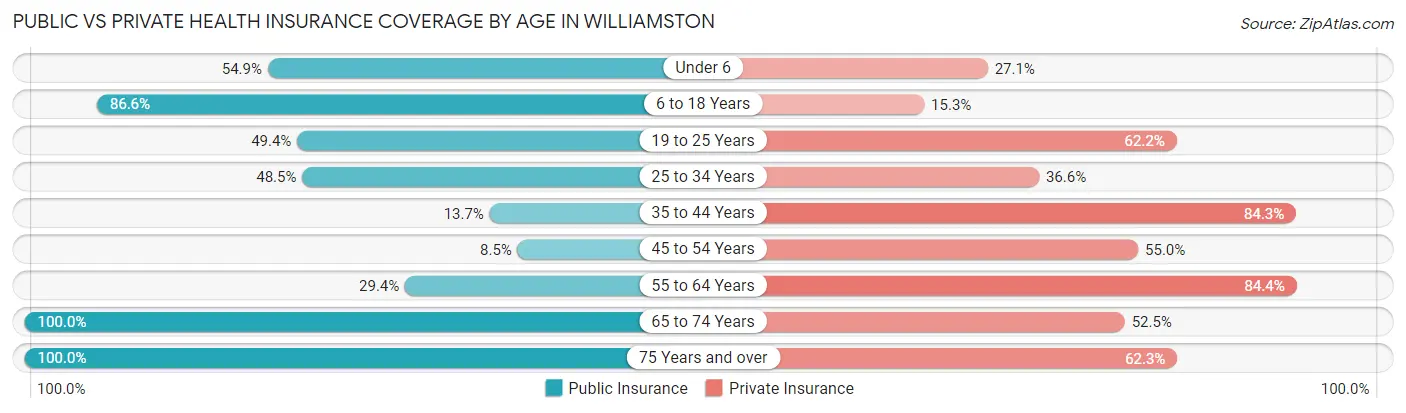
| Age Bracket | Public Insurance | Private Insurance |
| Under 6 | 158 (54.9%) | 78 (27.1%) |
| 6 to 18 Years | 787 (86.6%) | 139 (15.3%) |
| 19 to 25 Years | 124 (49.4%) | 156 (62.2%) |
| 25 to 34 Years | 188 (48.4%) | 142 (36.6%) |
| 35 to 44 Years | 102 (13.7%) | 629 (84.3%) |
| 45 to 54 Years | 39 (8.5%) | 253 (55.0%) |
| 55 to 64 Years | 277 (29.4%) | 796 (84.4%) |
| 65 to 74 Years | 756 (100.0%) | 397 (52.5%) |
| 75 Years and over | 355 (100.0%) | 221 (62.3%) |
| Total | 2,786 (54.7%) | 2,811 (55.2%) |
Disability Status by Sex by Age in Williamston
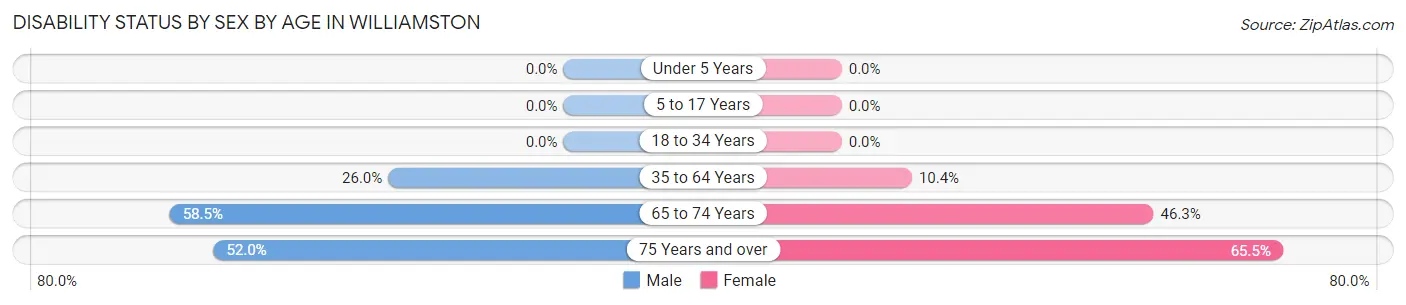
| Age Bracket | Male | Female |
| Under 5 Years | 0 (0.0%) | 0 (0.0%) |
| 5 to 17 Years | 0 (0.0%) | 0 (0.0%) |
| 18 to 34 Years | 0 (0.0%) | 0 (0.0%) |
| 35 to 64 Years | 242 (26.0%) | 127 (10.4%) |
| 65 to 74 Years | 173 (58.5%) | 213 (46.3%) |
| 75 Years and over | 40 (51.9%) | 182 (65.5%) |
Disability Class by Sex by Age in Williamston
Disability Class: Hearing Difficulty
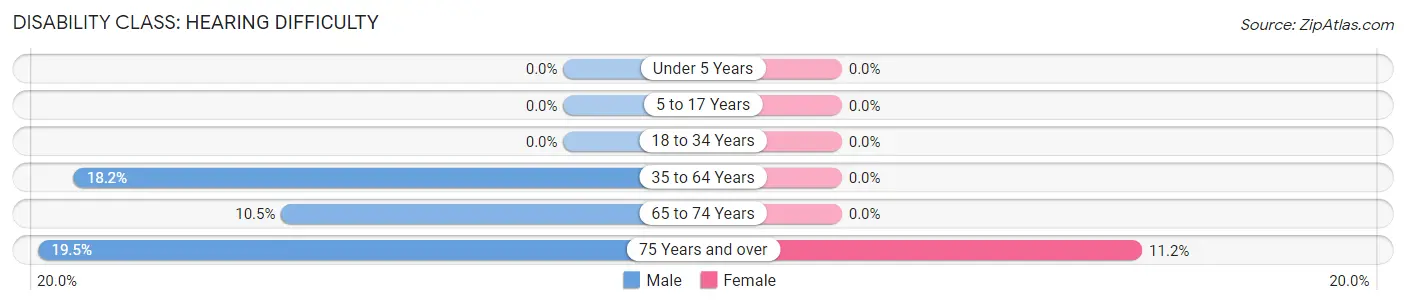
| Age Bracket | Male | Female |
| Under 5 Years | 0 (0.0%) | 0 (0.0%) |
| 5 to 17 Years | 0 (0.0%) | 0 (0.0%) |
| 18 to 34 Years | 0 (0.0%) | 0 (0.0%) |
| 35 to 64 Years | 169 (18.2%) | 0 (0.0%) |
| 65 to 74 Years | 31 (10.5%) | 0 (0.0%) |
| 75 Years and over | 15 (19.5%) | 31 (11.2%) |
Disability Class: Vision Difficulty
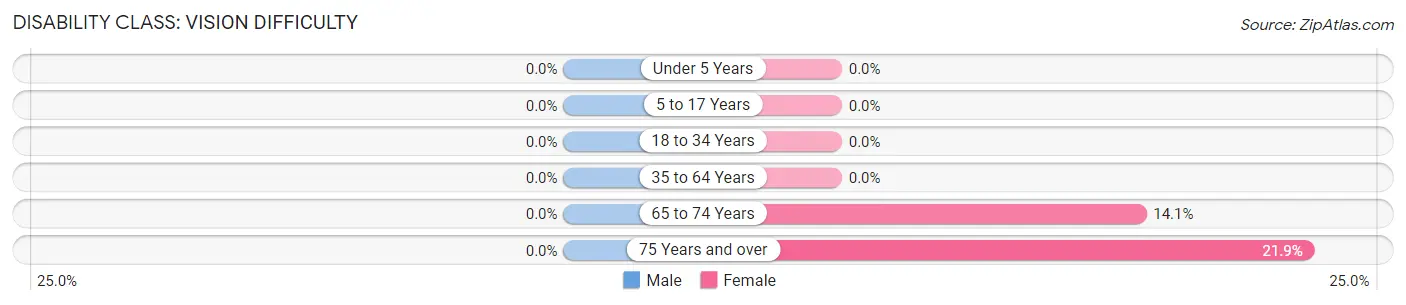
| Age Bracket | Male | Female |
| Under 5 Years | 0 (0.0%) | 0 (0.0%) |
| 5 to 17 Years | 0 (0.0%) | 0 (0.0%) |
| 18 to 34 Years | 0 (0.0%) | 0 (0.0%) |
| 35 to 64 Years | 0 (0.0%) | 0 (0.0%) |
| 65 to 74 Years | 0 (0.0%) | 65 (14.1%) |
| 75 Years and over | 0 (0.0%) | 61 (21.9%) |
Disability Class: Cognitive Difficulty
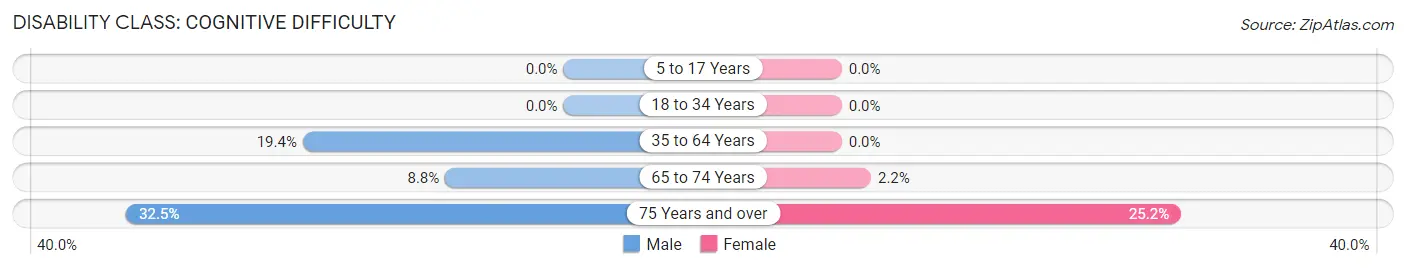
| Age Bracket | Male | Female |
| 5 to 17 Years | 0 (0.0%) | 0 (0.0%) |
| 18 to 34 Years | 0 (0.0%) | 0 (0.0%) |
| 35 to 64 Years | 180 (19.4%) | 0 (0.0%) |
| 65 to 74 Years | 26 (8.8%) | 10 (2.2%) |
| 75 Years and over | 25 (32.5%) | 70 (25.2%) |
Disability Class: Ambulatory Difficulty
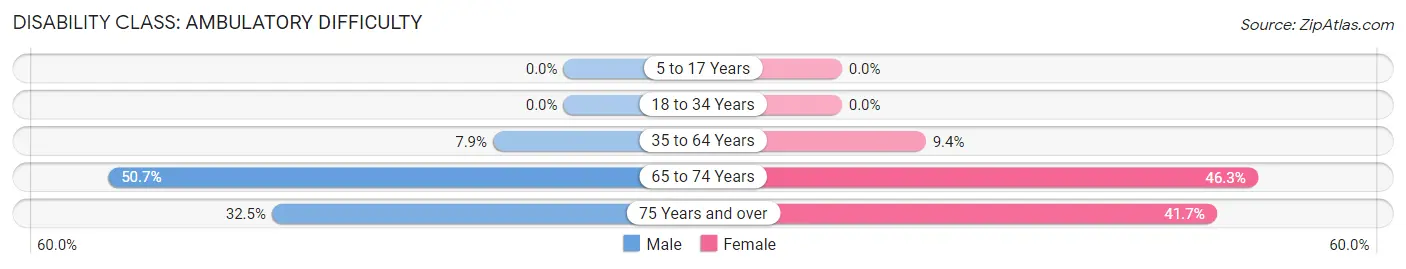
| Age Bracket | Male | Female |
| 5 to 17 Years | 0 (0.0%) | 0 (0.0%) |
| 18 to 34 Years | 0 (0.0%) | 0 (0.0%) |
| 35 to 64 Years | 73 (7.9%) | 114 (9.3%) |
| 65 to 74 Years | 150 (50.7%) | 213 (46.3%) |
| 75 Years and over | 25 (32.5%) | 116 (41.7%) |
Disability Class: Self-Care Difficulty
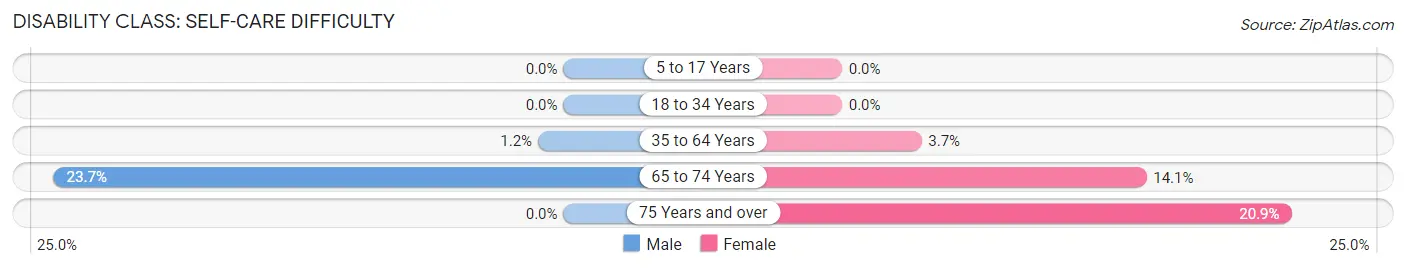
| Age Bracket | Male | Female |
| 5 to 17 Years | 0 (0.0%) | 0 (0.0%) |
| 18 to 34 Years | 0 (0.0%) | 0 (0.0%) |
| 35 to 64 Years | 11 (1.2%) | 45 (3.7%) |
| 65 to 74 Years | 70 (23.6%) | 65 (14.1%) |
| 75 Years and over | 0 (0.0%) | 58 (20.9%) |
Technology Access in Williamston
Computing Device Access in Williamston
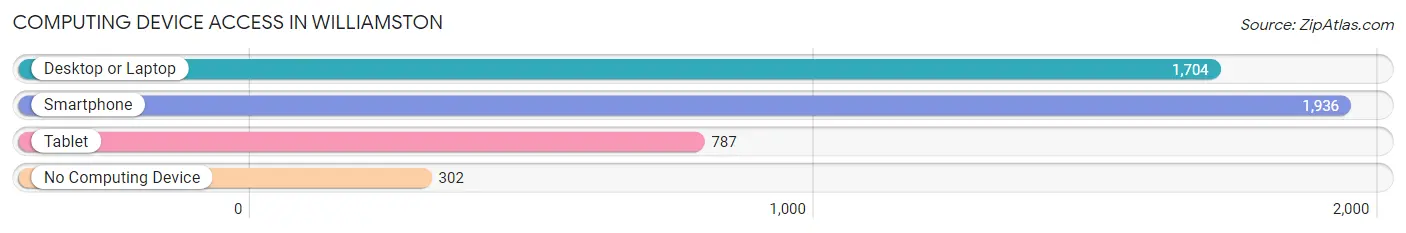
| Device Type | # Households | % Households |
| Desktop or Laptop | 1,704 | 69.2% |
| Smartphone | 1,936 | 78.7% |
| Tablet | 787 | 32.0% |
| No Computing Device | 302 | 12.3% |
| Total | 2,461 | 100.0% |
Internet Access in Williamston
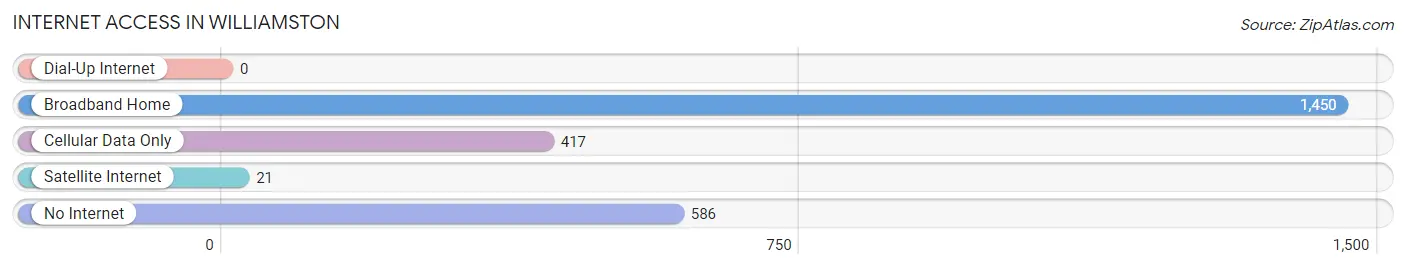
| Internet Type | # Households | % Households |
| Dial-Up Internet | 0 | 0.0% |
| Broadband Home | 1,450 | 58.9% |
| Cellular Data Only | 417 | 16.9% |
| Satellite Internet | 21 | 0.9% |
| No Internet | 586 | 23.8% |
| Total | 2,461 | 100.0% |
Williamston Summary
Williamston, North Carolina is a small town located in Martin County, North Carolina. It is situated on the Roanoke River, approximately 30 miles east of Greenville, North Carolina. The town has a population of approximately 5,000 people and is the county seat of Martin County.
History
Williamston was founded in 1779 by William Williams, a Revolutionary War veteran. The town was named after him and was originally known as Williams Town. The town was incorporated in 1833 and has been the county seat of Martin County since 1836.
The town was an important trading center in the 19th century and was home to several cotton mills. The town was also home to a large tobacco market and was a major producer of tobacco products.
The town was also home to a large African-American population in the 19th century. The town was home to several African-American churches and schools.
Geography
Williamston is located in the Coastal Plain region of North Carolina. The town is situated on the Roanoke River and is approximately 30 miles east of Greenville, North Carolina. The town is located in the eastern part of Martin County and is bordered by the towns of Hamilton, Robersonville, and Jamesville.
The town has a total area of 4.2 square miles, all of which is land. The town has a humid subtropical climate with hot, humid summers and mild winters.
Economy
Williamston’s economy is largely based on agriculture and manufacturing. The town is home to several large agricultural operations, including poultry farms, hog farms, and cotton farms. The town is also home to several manufacturing companies, including a furniture factory, a textile mill, and a plastics factory.
The town is also home to several retail stores, restaurants, and other businesses. The town is home to several banks, a hospital, and a post office.
Demographics
As of the 2010 census, the town had a population of 5,039 people. The racial makeup of the town was 73.3% White, 22.2% African American, 0.4% Native American, 0.7% Asian, 0.1% Pacific Islander, and 2.3% from other races. Hispanic or Latino of any race were 3.2% of the population.
The median household income in the town was $30,938 and the median family income was $37,813. The per capita income in the town was $17,845. About 18.2% of the population was below the poverty line.
Conclusion
Williamston, North Carolina is a small town located in Martin County, North Carolina. It is situated on the Roanoke River, approximately 30 miles east of Greenville, North Carolina. The town has a population of approximately 5,000 people and is the county seat of Martin County. The town was founded in 1779 by William Williams and was originally known as Williams Town. The town has a humid subtropical climate with hot, humid summers and mild winters. The town’s economy is largely based on agriculture and manufacturing. The town is home to several large agricultural operations, including poultry farms, hog farms, and cotton farms. The town is also home to several manufacturing companies, including a furniture factory, a textile mill, and a plastics factory. The racial makeup of the town was 73.3% White, 22.2% African American, 0.4% Native American, 0.7% Asian, 0.1% Pacific Islander, and 2.3% from other races. The median household income in the town was $30,938 and the median family income was $37,813.
Common Questions
What is Per Capita Income in Williamston?
Per Capita income in Williamston is $24,717.
What is the Median Family Income in Williamston?
Median Family Income in Williamston is $44,746.
What is the Median Household income in Williamston?
Median Household Income in Williamston is $41,182.
What is Income or Wage Gap in Williamston?
Income or Wage Gap in Williamston is 13.5%.
Women in Williamston earn 86.5 cents for every dollar earned by a man.
What is Inequality or Gini Index in Williamston?
Inequality or Gini Index in Williamston is 0.47.
What is the Total Population of Williamston?
Total Population of Williamston is 5,224.
What is the Total Male Population of Williamston?
Total Male Population of Williamston is 2,168.
What is the Total Female Population of Williamston?
Total Female Population of Williamston is 3,056.
What is the Ratio of Males per 100 Females in Williamston?
There are 70.94 Males per 100 Females in Williamston.
What is the Ratio of Females per 100 Males in Williamston?
There are 140.96 Females per 100 Males in Williamston.
What is the Median Population Age in Williamston?
Median Population Age in Williamston is 45.5 Years.
What is the Average Family Size in Williamston
Average Family Size in Williamston is 2.8 People.
What is the Average Household Size in Williamston
Average Household Size in Williamston is 2.1 People.
How Large is the Labor Force in Williamston?
There are 2,636 People in the Labor Forcein in Williamston.
What is the Percentage of People in the Labor Force in Williamston?
61.6% of People are in the Labor Force in Williamston.
What is the Unemployment Rate in Williamston?
Unemployment Rate in Williamston is 14.2%.