Haw River, NC Map & Demographics
Haw River Map
Haw River Overview
$22,774
PER CAPITA INCOME
$72,632
AVG FAMILY INCOME
$57,404
AVG HOUSEHOLD INCOME
28.1%
WAGE / INCOME GAP [ % ]
71.9¢/ $1
WAGE / INCOME GAP [ $ ]
0.44
INEQUALITY / GINI INDEX
2,894
TOTAL POPULATION
1,547
MALE POPULATION
1,347
FEMALE POPULATION
114.85
MALES / 100 FEMALES
87.07
FEMALES / 100 MALES
29.1
MEDIAN AGE
3.6
AVG FAMILY SIZE
2.9
AVG HOUSEHOLD SIZE
1,504
LABOR FORCE [ PEOPLE ]
68.5%
PERCENT IN LABOR FORCE
4.4%
UNEMPLOYMENT RATE
Haw River Zip Codes
Haw River Area Codes
Income in Haw River
Income Overview in Haw River
Per Capita Income in Haw River is $22,774, while median incomes of families and households are $72,632 and $57,404 respectively.
| Characteristic | Number | Measure |
| Per Capita Income | 2,894 | $22,774 |
| Median Family Income | 710 | $72,632 |
| Mean Family Income | 710 | $75,363 |
| Median Household Income | 981 | $57,404 |
| Mean Household Income | 981 | $62,901 |
| Income Deficit | 710 | $0 |
| Wage / Income Gap (%) | 2,894 | 28.15% |
| Wage / Income Gap ($) | 2,894 | 71.85¢ per $1 |
| Gini / Inequality Index | 2,894 | 0.44 |
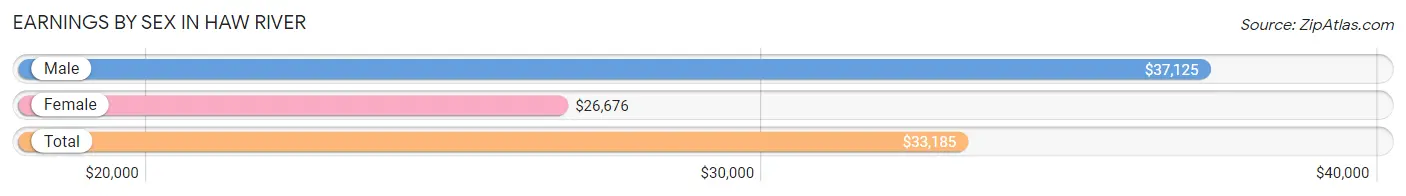
Earnings by Sex in Haw River
Average Earnings in Haw River are $33,185, $37,125 for men and $26,676 for women, a difference of 28.1%.
| Sex | Number | Average Earnings |
| Male | 849 (55.7%) | $37,125 |
| Female | 676 (44.3%) | $26,676 |
| Total | 1,525 (100.0%) | $33,185 |
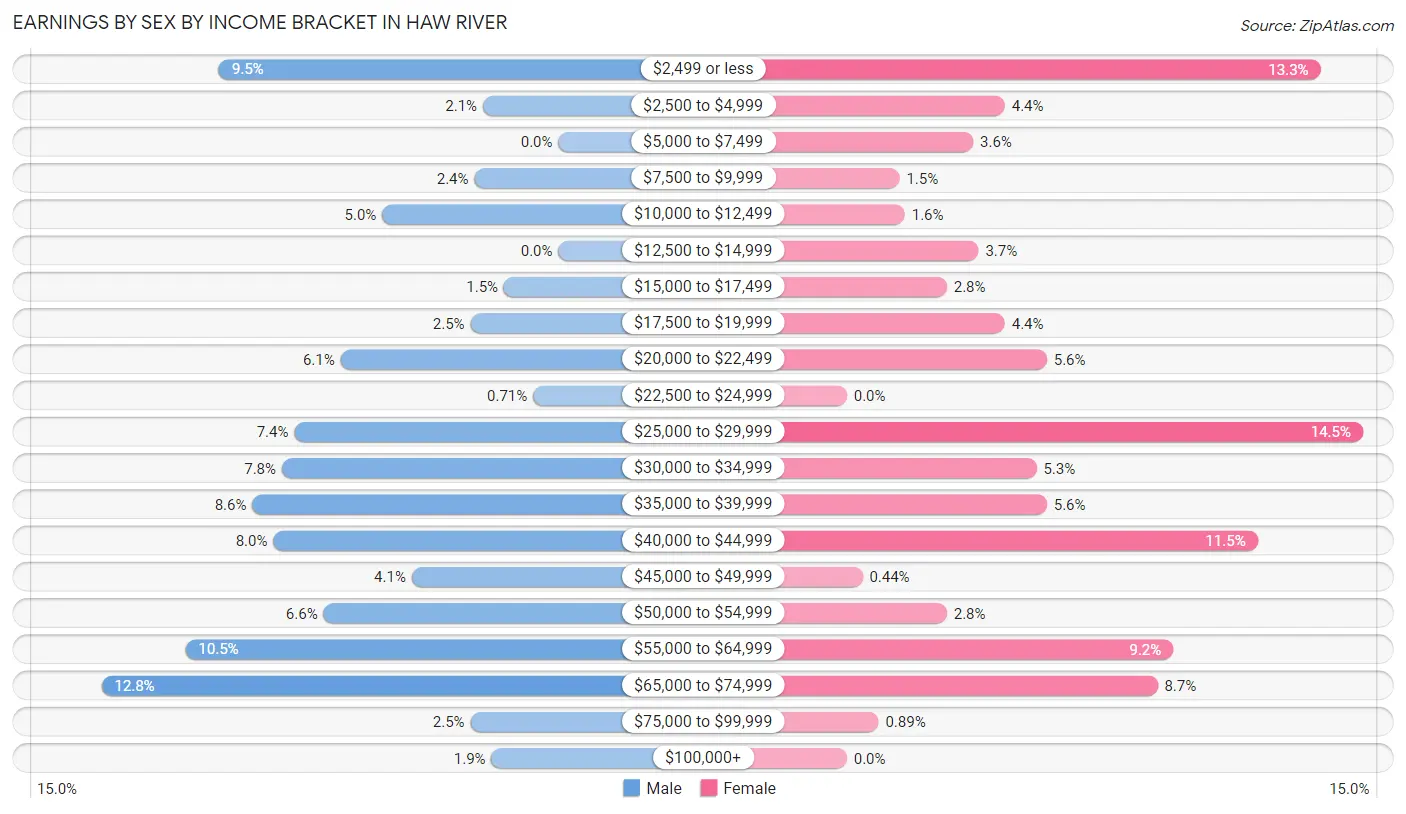
Earnings by Sex by Income Bracket in Haw River
The most common earnings brackets in Haw River are $65,000 to $74,999 for men (109 | 12.8%) and $25,000 to $29,999 for women (98 | 14.5%).
| Income | Male | Female |
| $2,499 or less | 81 (9.5%) | 90 (13.3%) |
| $2,500 to $4,999 | 18 (2.1%) | 30 (4.4%) |
| $5,000 to $7,499 | 0 (0.0%) | 24 (3.5%) |
| $7,500 to $9,999 | 20 (2.4%) | 10 (1.5%) |
| $10,000 to $12,499 | 42 (5.0%) | 11 (1.6%) |
| $12,500 to $14,999 | 0 (0.0%) | 25 (3.7%) |
| $15,000 to $17,499 | 13 (1.5%) | 19 (2.8%) |
| $17,500 to $19,999 | 21 (2.5%) | 30 (4.4%) |
| $20,000 to $22,499 | 52 (6.1%) | 38 (5.6%) |
| $22,500 to $24,999 | 6 (0.7%) | 0 (0.0%) |
| $25,000 to $29,999 | 63 (7.4%) | 98 (14.5%) |
| $30,000 to $34,999 | 66 (7.8%) | 36 (5.3%) |
| $35,000 to $39,999 | 73 (8.6%) | 38 (5.6%) |
| $40,000 to $44,999 | 68 (8.0%) | 78 (11.5%) |
| $45,000 to $49,999 | 35 (4.1%) | 3 (0.4%) |
| $50,000 to $54,999 | 56 (6.6%) | 19 (2.8%) |
| $55,000 to $64,999 | 89 (10.5%) | 62 (9.2%) |
| $65,000 to $74,999 | 109 (12.8%) | 59 (8.7%) |
| $75,000 to $99,999 | 21 (2.5%) | 6 (0.9%) |
| $100,000+ | 16 (1.9%) | 0 (0.0%) |
| Total | 849 (100.0%) | 676 (100.0%) |
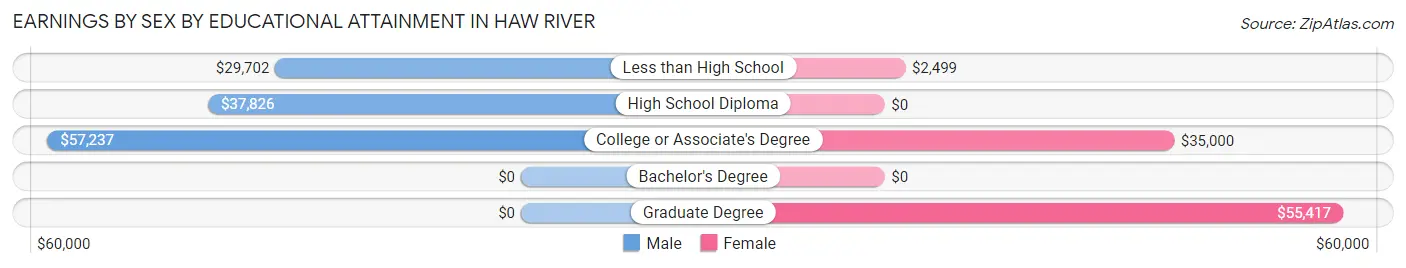
Earnings by Sex by Educational Attainment in Haw River
Average earnings in Haw River are $38,533 for men and $31,950 for women, a difference of 17.1%. Men with an educational attainment of college or associate's degree enjoy the highest average annual earnings of $57,237, while those with less than high school education earn the least with $29,702. Women with an educational attainment of graduate degree earn the most with the average annual earnings of $55,417, while those with less than high school education have the smallest earnings of $2,499.
| Educational Attainment | Male Income | Female Income |
| Less than High School | $29,702 | $2,499 |
| High School Diploma | $37,826 | $0 |
| College or Associate's Degree | $57,237 | $35,000 |
| Bachelor's Degree | - | - |
| Graduate Degree | - | - |
| Total | $38,533 | $31,950 |
Family Income in Haw River
Family Income Brackets in Haw River
According to the Haw River family income data, there are 221 families falling into the $100,000 to $149,999 income range, which is the most common income bracket and makes up 31.1% of all families. Conversely, the $10,000 to $14,999 income bracket is the least frequent group with only 5 families (0.7%) belonging to this category.
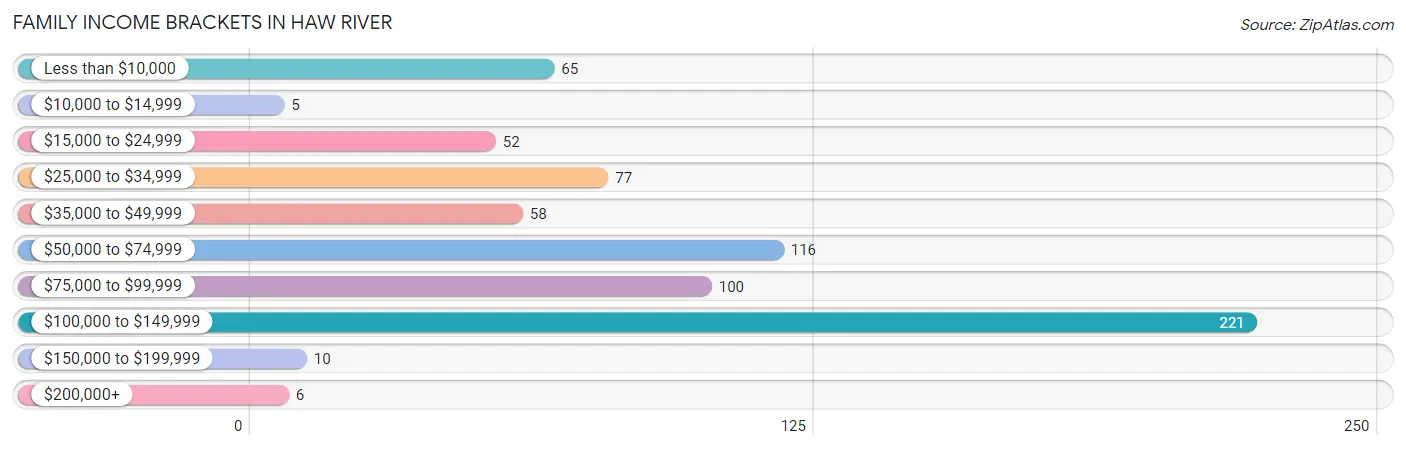
| Income Bracket | # Families | % Families |
| Less than $10,000 | 65 | 9.2% |
| $10,000 to $14,999 | 5 | 0.7% |
| $15,000 to $24,999 | 52 | 7.3% |
| $25,000 to $34,999 | 77 | 10.8% |
| $35,000 to $49,999 | 58 | 8.2% |
| $50,000 to $74,999 | 116 | 16.3% |
| $75,000 to $99,999 | 100 | 14.1% |
| $100,000 to $149,999 | 221 | 31.1% |
| $150,000 to $199,999 | 10 | 1.4% |
| $200,000+ | 6 | 0.8% |
Family Income by Famaliy Size in Haw River
3-person families (177 | 24.9%) account for the highest median family income in Haw River with $106,375 per family, while 3-person families (177 | 24.9%) have the highest median income of $35,458 per family member.
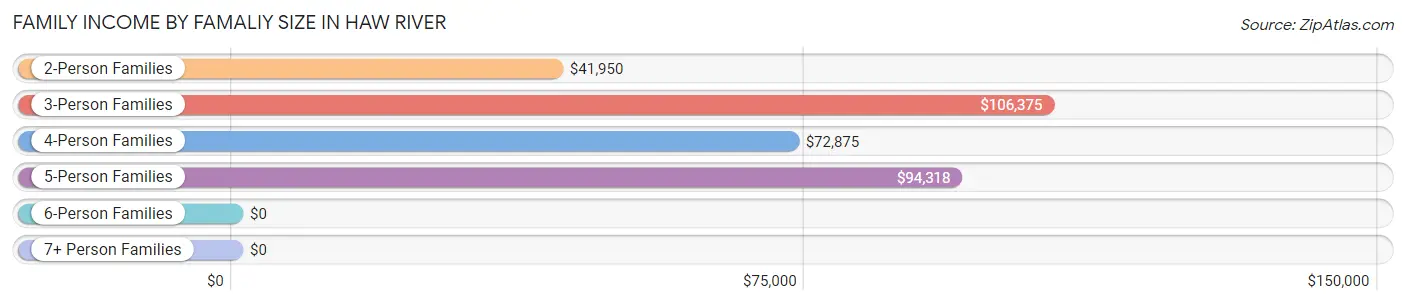
| Income Bracket | # Families | Median Income |
| 2-Person Families | 253 (35.6%) | $41,950 |
| 3-Person Families | 177 (24.9%) | $106,375 |
| 4-Person Families | 137 (19.3%) | $72,875 |
| 5-Person Families | 56 (7.9%) | $94,318 |
| 6-Person Families | 24 (3.4%) | $0 |
| 7+ Person Families | 63 (8.9%) | $0 |
| Total | 710 (100.0%) | $72,632 |
Family Income by Number of Earners in Haw River
The median family income in Haw River is $72,632, with families comprising 2 earners (365) having the highest median family income of $85,625, while families with 1 earner (85) have the lowest median family income of $25,054, accounting for 51.4% and 12.0% of families, respectively.
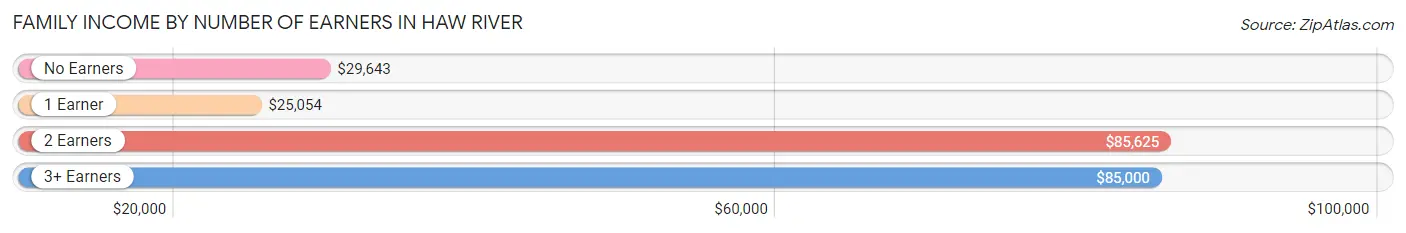
| Number of Earners | # Families | Median Income |
| No Earners | 120 (16.9%) | $29,643 |
| 1 Earner | 85 (12.0%) | $25,054 |
| 2 Earners | 365 (51.4%) | $85,625 |
| 3+ Earners | 140 (19.7%) | $85,000 |
| Total | 710 (100.0%) | $72,632 |
Household Income in Haw River
Household Income Brackets in Haw River
With 226 households falling in the category, the $100,000 to $149,999 income range is the most frequent in Haw River, accounting for 23.0% of all households. In contrast, only 6 households (0.6%) fall into the $200,000+ income bracket, making it the least populous group.
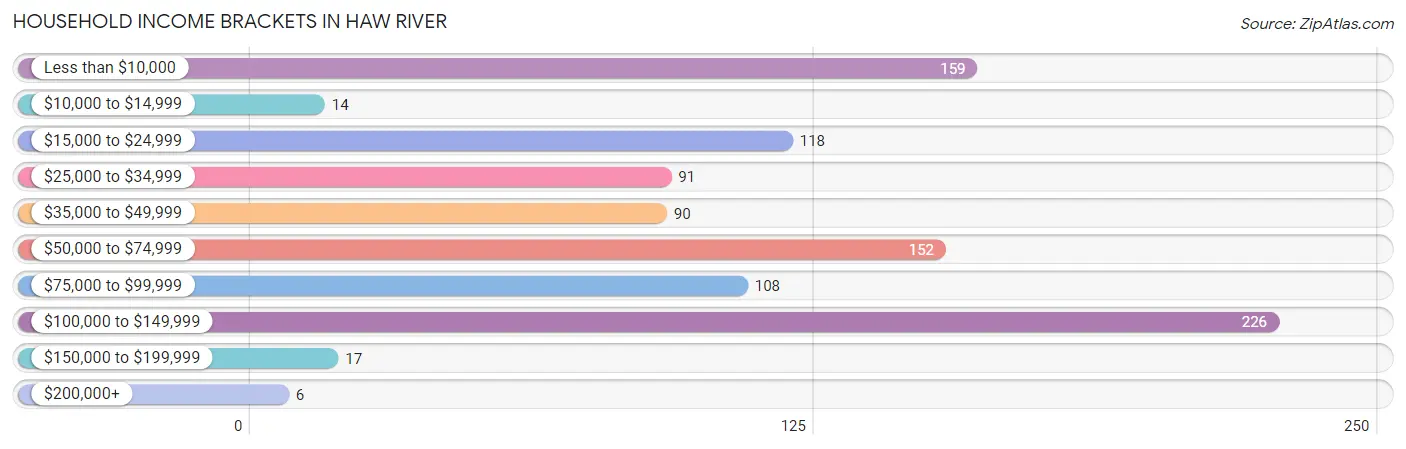
| Income Bracket | # Households | % Households |
| Less than $10,000 | 159 | 16.2% |
| $10,000 to $14,999 | 14 | 1.4% |
| $15,000 to $24,999 | 118 | 12.0% |
| $25,000 to $34,999 | 91 | 9.3% |
| $35,000 to $49,999 | 90 | 9.2% |
| $50,000 to $74,999 | 152 | 15.5% |
| $75,000 to $99,999 | 108 | 11.0% |
| $100,000 to $149,999 | 226 | 23.0% |
| $150,000 to $199,999 | 17 | 1.7% |
| $200,000+ | 6 | 0.6% |
Household Income by Householder Age in Haw River
The median household income in Haw River is $57,404, with the highest median household income of $69,856 found in the 45 to 64 years age bracket for the primary householder. A total of 433 households (44.1%) fall into this category. Meanwhile, the 65+ years age bracket for the primary householder has the lowest median household income of $27,344, with 218 households (22.2%) in this group.
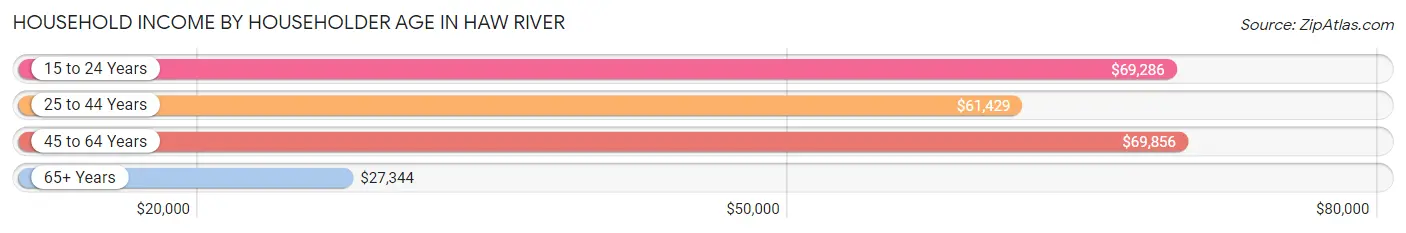
| Income Bracket | # Households | Median Income |
| 15 to 24 Years | 30 (3.1%) | $69,286 |
| 25 to 44 Years | 300 (30.6%) | $61,429 |
| 45 to 64 Years | 433 (44.1%) | $69,856 |
| 65+ Years | 218 (22.2%) | $27,344 |
| Total | 981 (100.0%) | $57,404 |
Poverty in Haw River
Income Below Poverty by Sex and Age in Haw River
With 10.3% poverty level for males and 24.7% for females among the residents of Haw River, 15 year old males and under 5 year old females are the most vulnerable to poverty, with 16 males (47.1%) and 147 females (94.8%) in their respective age groups living below the poverty level.
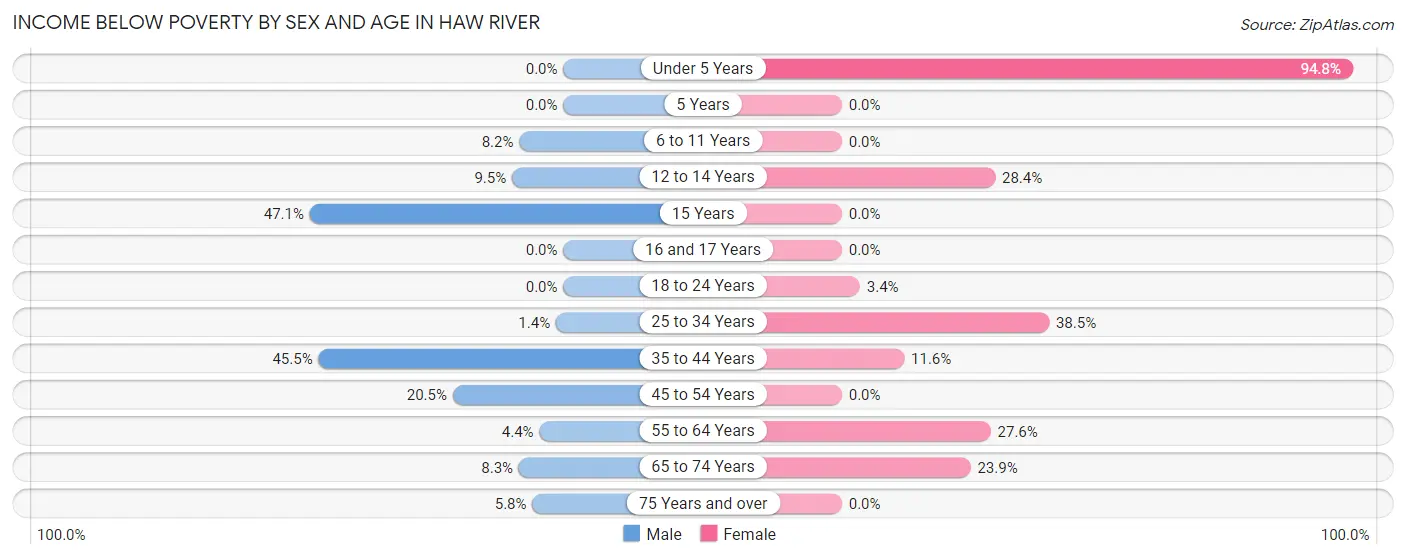
| Age Bracket | Male | Female |
| Under 5 Years | 0 (0.0%) | 147 (94.8%) |
| 5 Years | 0 (0.0%) | 0 (0.0%) |
| 6 to 11 Years | 9 (8.2%) | 0 (0.0%) |
| 12 to 14 Years | 6 (9.5%) | 31 (28.4%) |
| 15 Years | 16 (47.1%) | 0 (0.0%) |
| 16 and 17 Years | 0 (0.0%) | 0 (0.0%) |
| 18 to 24 Years | 0 (0.0%) | 6 (3.4%) |
| 25 to 34 Years | 2 (1.4%) | 65 (38.5%) |
| 35 to 44 Years | 60 (45.5%) | 28 (11.6%) |
| 45 to 54 Years | 47 (20.5%) | 0 (0.0%) |
| 55 to 64 Years | 6 (4.4%) | 29 (27.6%) |
| 65 to 74 Years | 8 (8.3%) | 27 (23.9%) |
| 75 Years and over | 5 (5.8%) | 0 (0.0%) |
| Total | 159 (10.3%) | 333 (24.7%) |
Income Above Poverty by Sex and Age in Haw River
According to the poverty statistics in Haw River, males aged under 5 years and females aged 5 years are the age groups that are most secure financially, with 100.0% of males and 100.0% of females in these age groups living above the poverty line.
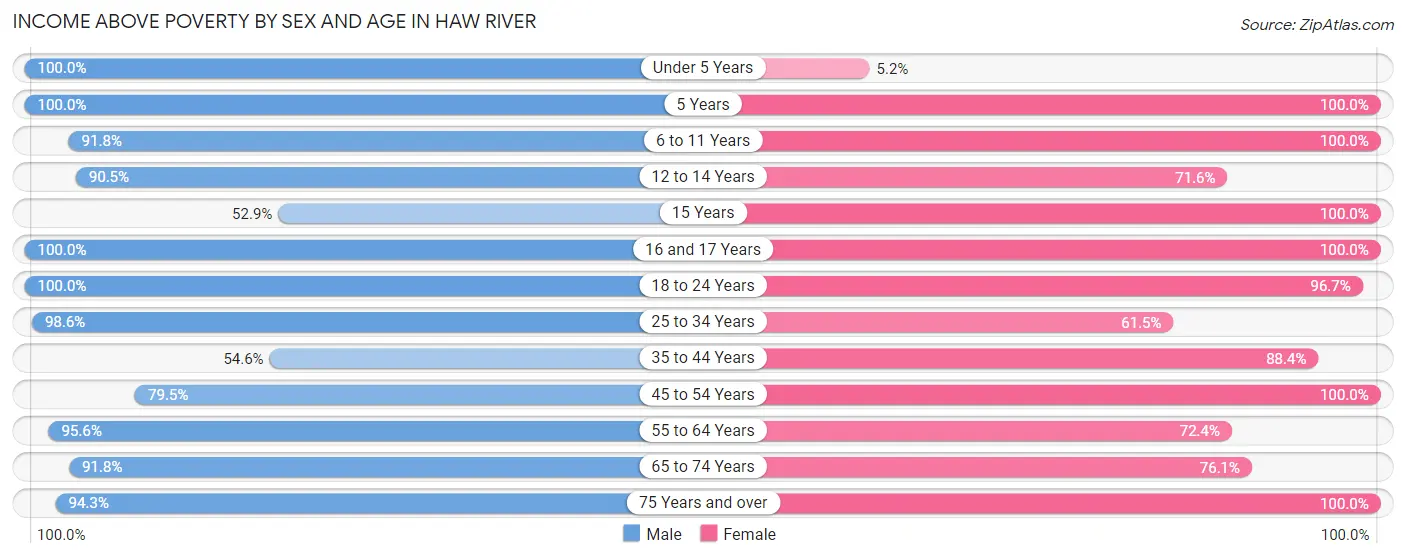
| Age Bracket | Male | Female |
| Under 5 Years | 103 (100.0%) | 8 (5.2%) |
| 5 Years | 30 (100.0%) | 9 (100.0%) |
| 6 to 11 Years | 101 (91.8%) | 64 (100.0%) |
| 12 to 14 Years | 57 (90.5%) | 78 (71.6%) |
| 15 Years | 18 (52.9%) | 22 (100.0%) |
| 16 and 17 Years | 52 (100.0%) | 19 (100.0%) |
| 18 to 24 Years | 329 (100.0%) | 173 (96.7%) |
| 25 to 34 Years | 144 (98.6%) | 104 (61.5%) |
| 35 to 44 Years | 72 (54.5%) | 214 (88.4%) |
| 45 to 54 Years | 182 (79.5%) | 115 (100.0%) |
| 55 to 64 Years | 129 (95.6%) | 76 (72.4%) |
| 65 to 74 Years | 89 (91.7%) | 86 (76.1%) |
| 75 Years and over | 82 (94.3%) | 46 (100.0%) |
| Total | 1,388 (89.7%) | 1,014 (75.3%) |
Income Below Poverty Among Married-Couple Families in Haw River
The poverty statistics for married-couple families in Haw River show that 10.0% or 51 of the total 510 families live below the poverty line. Families with 1 or 2 children have the highest poverty rate of 26.0%, comprising of 51 families. On the other hand, families with no children have the lowest poverty rate of 0.0%, which includes 0 families.
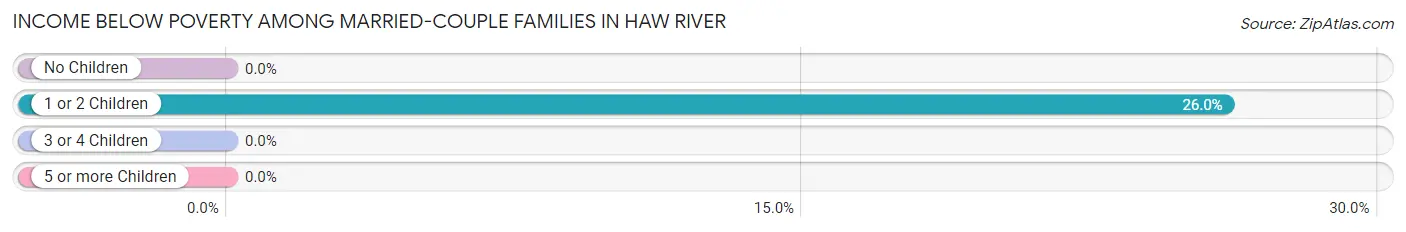
| Children | Above Poverty | Below Poverty |
| No Children | 251 (100.0%) | 0 (0.0%) |
| 1 or 2 Children | 145 (74.0%) | 51 (26.0%) |
| 3 or 4 Children | 63 (100.0%) | 0 (0.0%) |
| 5 or more Children | 0 (0.0%) | 0 (0.0%) |
| Total | 459 (90.0%) | 51 (10.0%) |
Income Below Poverty Among Single-Parent Households in Haw River
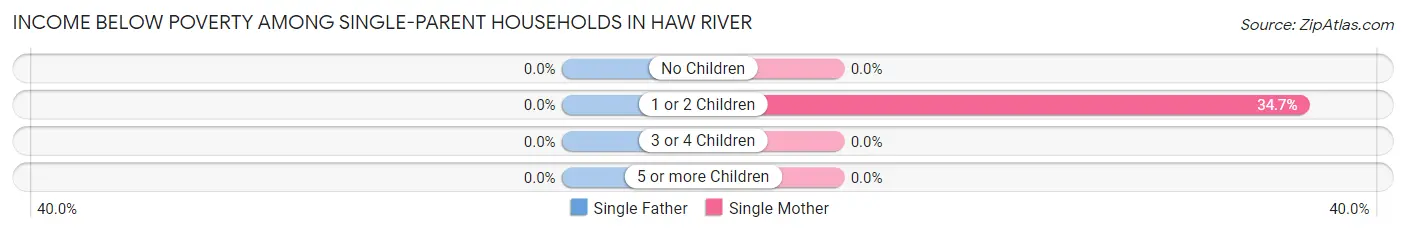
| Children | Single Father | Single Mother |
| No Children | 0 (0.0%) | 0 (0.0%) |
| 1 or 2 Children | 0 (0.0%) | 51 (34.7%) |
| 3 or 4 Children | 0 (0.0%) | 0 (0.0%) |
| 5 or more Children | 0 (0.0%) | 0 (0.0%) |
| Total | 0 (0.0%) | 51 (29.6%) |
Income Below Poverty Among Married-Couple vs Single-Parent Households in Haw River
The poverty data for Haw River shows that 51 of the married-couple family households (10.0%) and 51 of the single-parent households (25.5%) are living below the poverty level. Within the married-couple family households, those with 1 or 2 children have the highest poverty rate, with 51 households (26.0%) falling below the poverty line. Among the single-parent households, those with 1 or 2 children have the highest poverty rate, with 51 household (34.7%) living below poverty.

| Children | Married-Couple Families | Single-Parent Households |
| No Children | 0 (0.0%) | 0 (0.0%) |
| 1 or 2 Children | 51 (26.0%) | 51 (34.7%) |
| 3 or 4 Children | 0 (0.0%) | 0 (0.0%) |
| 5 or more Children | 0 (0.0%) | 0 (0.0%) |
| Total | 51 (10.0%) | 51 (25.5%) |
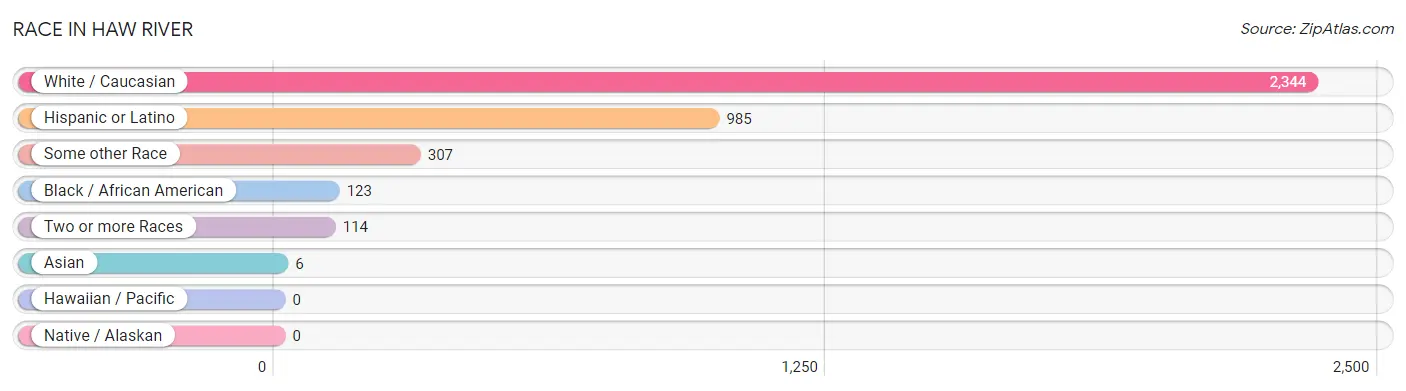
Race in Haw River
The most populous races in Haw River are White / Caucasian (2,344 | 81.0%), Hispanic or Latino (985 | 34.0%), and Some other Race (307 | 10.6%).
| Race | # Population | % Population |
| Asian | 6 | 0.2% |
| Black / African American | 123 | 4.3% |
| Hawaiian / Pacific | 0 | 0.0% |
| Hispanic or Latino | 985 | 34.0% |
| Native / Alaskan | 0 | 0.0% |
| White / Caucasian | 2,344 | 81.0% |
| Two or more Races | 114 | 3.9% |
| Some other Race | 307 | 10.6% |
| Total | 2,894 | 100.0% |
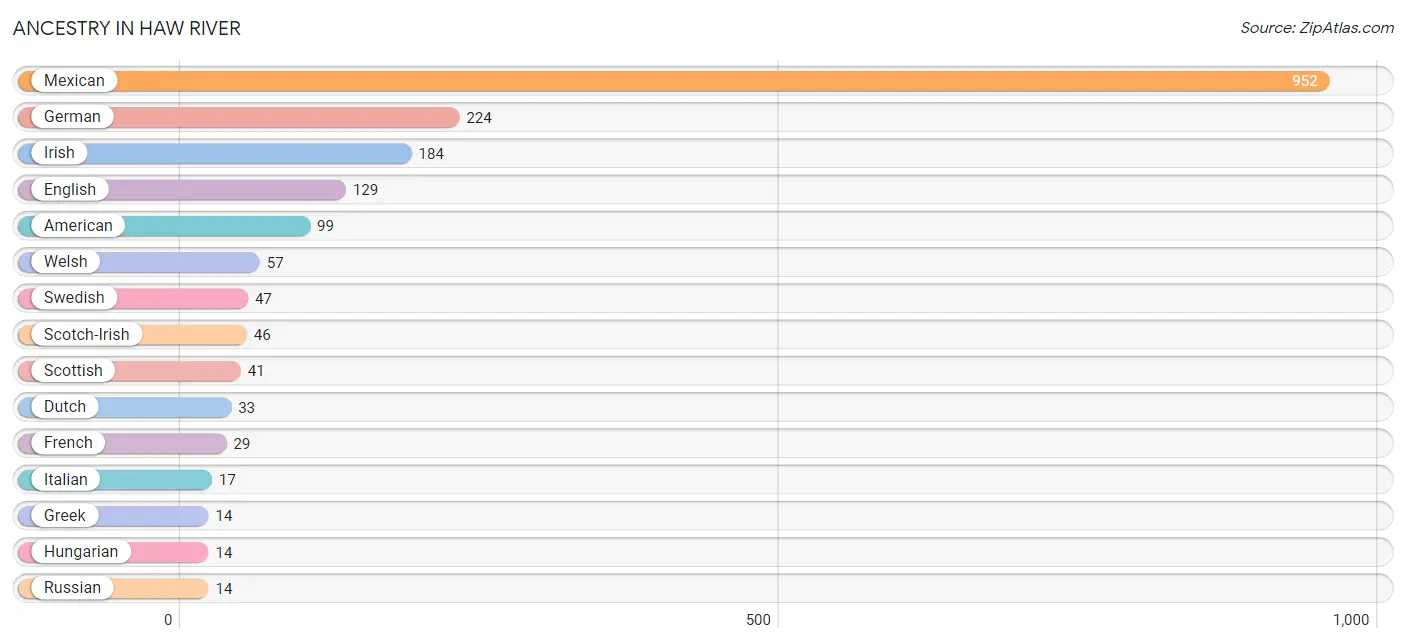
Ancestry in Haw River
The most populous ancestries reported in Haw River are Mexican (952 | 32.9%), German (224 | 7.7%), Irish (184 | 6.4%), English (129 | 4.5%), and American (99 | 3.4%), together accounting for 54.9% of all Haw River residents.
| Ancestry | # Population | % Population |
| American | 99 | 3.4% |
| British | 4 | 0.1% |
| Dutch | 33 | 1.1% |
| English | 129 | 4.5% |
| French | 29 | 1.0% |
| German | 224 | 7.7% |
| Greek | 14 | 0.5% |
| Guyanese | 11 | 0.4% |
| Hungarian | 14 | 0.5% |
| Indian (Asian) | 6 | 0.2% |
| Irish | 184 | 6.4% |
| Italian | 17 | 0.6% |
| Latvian | 9 | 0.3% |
| Mexican | 952 | 32.9% |
| Polish | 13 | 0.4% |
| Russian | 14 | 0.5% |
| Scotch-Irish | 46 | 1.6% |
| Scottish | 41 | 1.4% |
| Spaniard | 6 | 0.2% |
| Swedish | 47 | 1.6% |
| Welsh | 57 | 2.0% | View All 21 Rows |
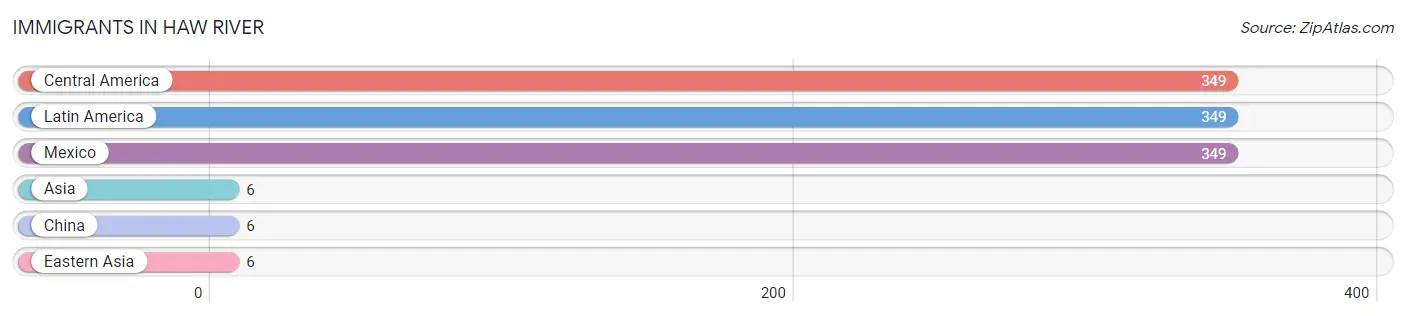
Immigrants in Haw River
The most numerous immigrant groups reported in Haw River came from Central America (349 | 12.1%), Latin America (349 | 12.1%), Mexico (349 | 12.1%), Asia (6 | 0.2%), and China (6 | 0.2%), together accounting for 36.6% of all Haw River residents.
| Immigration Origin | # Population | % Population |
| Asia | 6 | 0.2% |
| Central America | 349 | 12.1% |
| China | 6 | 0.2% |
| Eastern Asia | 6 | 0.2% |
| Latin America | 349 | 12.1% |
| Mexico | 349 | 12.1% | View All 6 Rows |
Sex and Age in Haw River
Sex and Age in Haw River
The most populous age groups in Haw River are 20 to 24 Years (298 | 19.3%) for men and 40 to 44 Years (188 | 14.0%) for women.
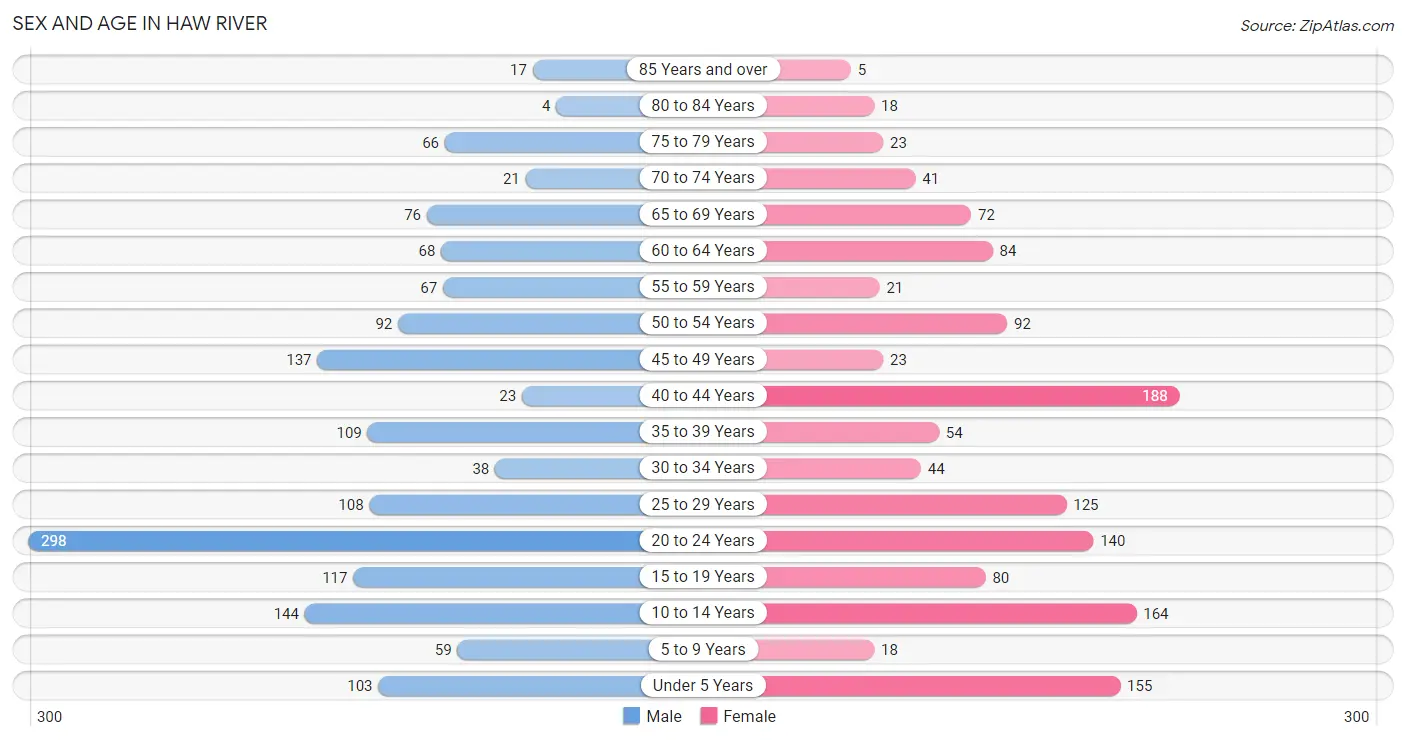
| Age Bracket | Male | Female |
| Under 5 Years | 103 (6.7%) | 155 (11.5%) |
| 5 to 9 Years | 59 (3.8%) | 18 (1.3%) |
| 10 to 14 Years | 144 (9.3%) | 164 (12.2%) |
| 15 to 19 Years | 117 (7.6%) | 80 (5.9%) |
| 20 to 24 Years | 298 (19.3%) | 140 (10.4%) |
| 25 to 29 Years | 108 (7.0%) | 125 (9.3%) |
| 30 to 34 Years | 38 (2.5%) | 44 (3.3%) |
| 35 to 39 Years | 109 (7.0%) | 54 (4.0%) |
| 40 to 44 Years | 23 (1.5%) | 188 (14.0%) |
| 45 to 49 Years | 137 (8.9%) | 23 (1.7%) |
| 50 to 54 Years | 92 (5.9%) | 92 (6.8%) |
| 55 to 59 Years | 67 (4.3%) | 21 (1.6%) |
| 60 to 64 Years | 68 (4.4%) | 84 (6.2%) |
| 65 to 69 Years | 76 (4.9%) | 72 (5.3%) |
| 70 to 74 Years | 21 (1.4%) | 41 (3.0%) |
| 75 to 79 Years | 66 (4.3%) | 23 (1.7%) |
| 80 to 84 Years | 4 (0.3%) | 18 (1.3%) |
| 85 Years and over | 17 (1.1%) | 5 (0.4%) |
| Total | 1,547 (100.0%) | 1,347 (100.0%) |
Families and Households in Haw River
Median Family Size in Haw River
The median family size in Haw River is 3.60 persons per family, with single female/mother families (172 | 24.2%) accounting for the largest median family size of 3.84 persons per family. On the other hand, single male/father families (28 | 3.9%) represent the smallest median family size with 2.14 persons per family.
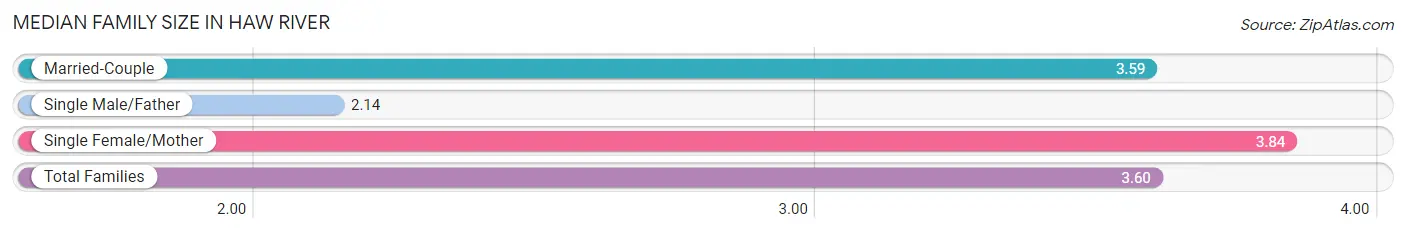
| Family Type | # Families | Family Size |
| Married-Couple | 510 (71.8%) | 3.59 |
| Single Male/Father | 28 (3.9%) | 2.14 |
| Single Female/Mother | 172 (24.2%) | 3.84 |
| Total Families | 710 (100.0%) | 3.60 |
Median Household Size in Haw River
The median household size in Haw River is 2.94 persons per household, with single female/mother households (172 | 17.5%) accounting for the largest median household size of 3.98 persons per household. non-family households (271 | 27.6%) represent the smallest median household size with 1.15 persons per household.
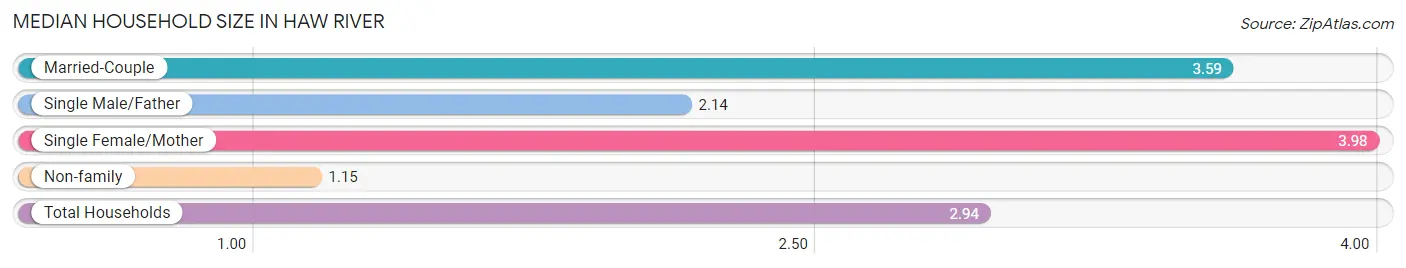
| Household Type | # Households | Household Size |
| Married-Couple | 510 (52.0%) | 3.59 |
| Single Male/Father | 28 (2.9%) | 2.14 |
| Single Female/Mother | 172 (17.5%) | 3.98 |
| Non-family | 271 (27.6%) | 1.15 |
| Total Households | 981 (100.0%) | 2.94 |
Household Size by Marriage Status in Haw River
Out of a total of 981 households in Haw River, 710 (72.4%) are family households, while 271 (27.6%) are nonfamily households. The most numerous type of family households are 2-person households, comprising 253, and the most common type of nonfamily households are 1-person households, comprising 236.
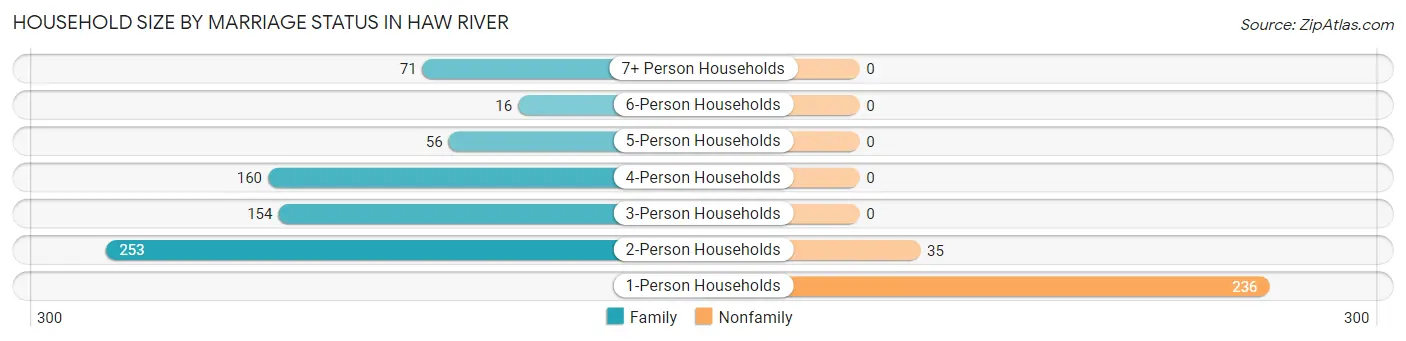
| Household Size | Family Households | Nonfamily Households |
| 1-Person Households | - | 236 (24.1%) |
| 2-Person Households | 253 (25.8%) | 35 (3.6%) |
| 3-Person Households | 154 (15.7%) | 0 (0.0%) |
| 4-Person Households | 160 (16.3%) | 0 (0.0%) |
| 5-Person Households | 56 (5.7%) | 0 (0.0%) |
| 6-Person Households | 16 (1.6%) | 0 (0.0%) |
| 7+ Person Households | 71 (7.2%) | 0 (0.0%) |
| Total | 710 (72.4%) | 271 (27.6%) |
Female Fertility in Haw River
Fertility by Age in Haw River
Average fertility rate in Haw River is 40.0 births per 1,000 women. Women in the age bracket of 20 to 34 years have the highest fertility rate with 91.0 births per 1,000 women. Women in the age bracket of 20 to 34 years acount for 100.0% of all women with births.
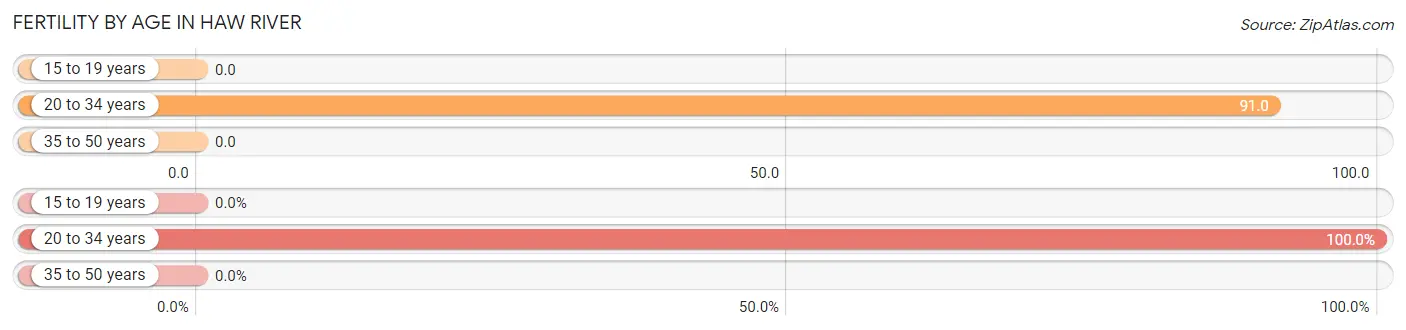
| Age Bracket | Women with Births | Births / 1,000 Women |
| 15 to 19 years | 0 (0.0%) | 0.0 |
| 20 to 34 years | 28 (100.0%) | 91.0 |
| 35 to 50 years | 0 (0.0%) | 0.0 |
| Total | 28 (100.0%) | 40.0 |
Fertility by Age by Marriage Status in Haw River
25.0% of women with births (28) in Haw River are married. The highest percentage of unmarried women with births falls into 20 to 34 years age bracket with 75.0% of them unmarried at the time of birth, while the lowest percentage of unmarried women with births belong to 20 to 34 years age bracket with 75.0% of them unmarried.
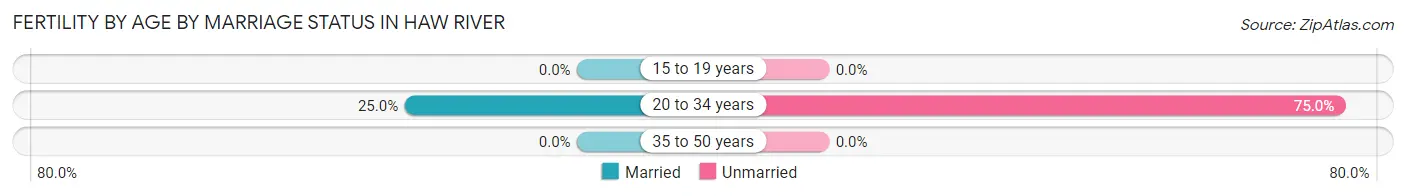
| Age Bracket | Married | Unmarried |
| 15 to 19 years | 0 (0.0%) | 0 (0.0%) |
| 20 to 34 years | 7 (25.0%) | 21 (75.0%) |
| 35 to 50 years | 0 (0.0%) | 0 (0.0%) |
| Total | 7 (25.0%) | 21 (75.0%) |
Fertility by Education in Haw River
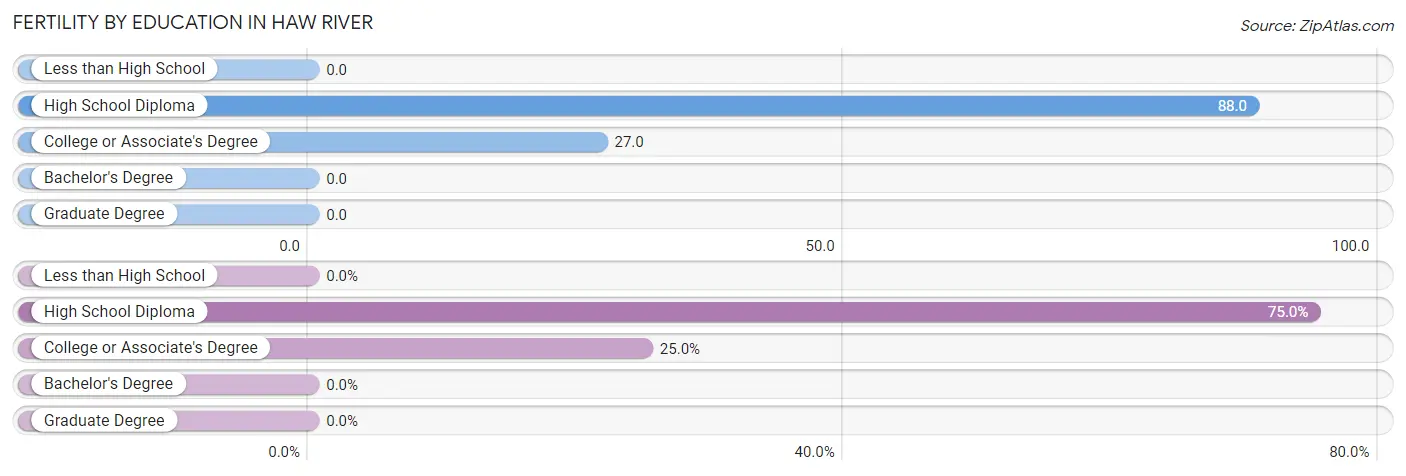
| Educational Attainment | Women with Births | Births / 1,000 Women |
| Less than High School | 0 (0.0%) | 0.0 |
| High School Diploma | 21 (75.0%) | 88.0 |
| College or Associate's Degree | 7 (25.0%) | 27.0 |
| Bachelor's Degree | 0 (0.0%) | 0.0 |
| Graduate Degree | 0 (0.0%) | 0.0 |
| Total | 28 (100.0%) | 40.0 |
Fertility by Education by Marriage Status in Haw River
75.0% of women with births in Haw River are unmarried. Women with the educational attainment of college or associate's degree are most likely to be married with 100.0% of them married at childbirth, while women with the educational attainment of high school diploma are least likely to be married with 100.0% of them unmarried at childbirth.
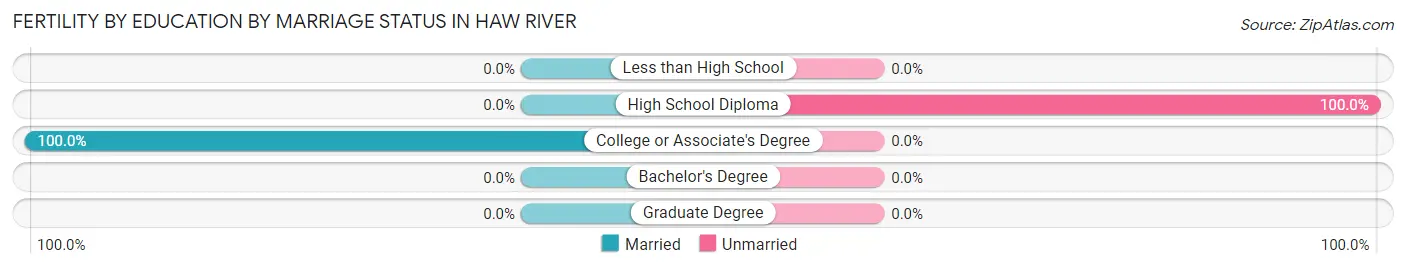
| Educational Attainment | Married | Unmarried |
| Less than High School | 0 (0.0%) | 0 (0.0%) |
| High School Diploma | 0 (0.0%) | 21 (100.0%) |
| College or Associate's Degree | 7 (100.0%) | 0 (0.0%) |
| Bachelor's Degree | 0 (0.0%) | 0 (0.0%) |
| Graduate Degree | 0 (0.0%) | 0 (0.0%) |
| Total | 7 (25.0%) | 21 (75.0%) |
Employment Characteristics in Haw River
Employment by Class of Employer in Haw River
Among the 1,396 employed individuals in Haw River, private company employees (908 | 65.0%), self-employed (incorporated) (276 | 19.8%), and self-employed (not incorporated) (63 | 4.5%) make up the most common classes of employment.
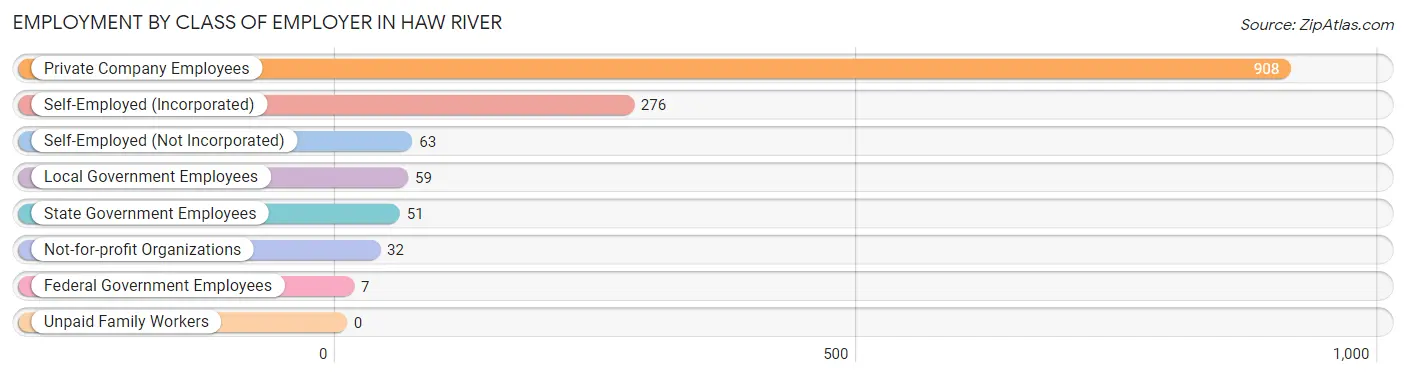
| Employer Class | # Employees | % Employees |
| Private Company Employees | 908 | 65.0% |
| Self-Employed (Incorporated) | 276 | 19.8% |
| Self-Employed (Not Incorporated) | 63 | 4.5% |
| Not-for-profit Organizations | 32 | 2.3% |
| Local Government Employees | 59 | 4.2% |
| State Government Employees | 51 | 3.6% |
| Federal Government Employees | 7 | 0.5% |
| Unpaid Family Workers | 0 | 0.0% |
| Total | 1,396 | 100.0% |
Employment Status by Age in Haw River
According to the labor force statistics for Haw River, out of the total population over 16 years of age (2,195), 68.5% or 1,504 individuals are in the labor force, with 4.4% or 66 of them unemployed. The age group with the highest labor force participation rate is 30 to 34 years, with 97.6% or 80 individuals in the labor force. Within the labor force, the 35 to 44 years age range has the highest percentage of unemployed individuals, with 16.8% or 56 of them being unemployed.
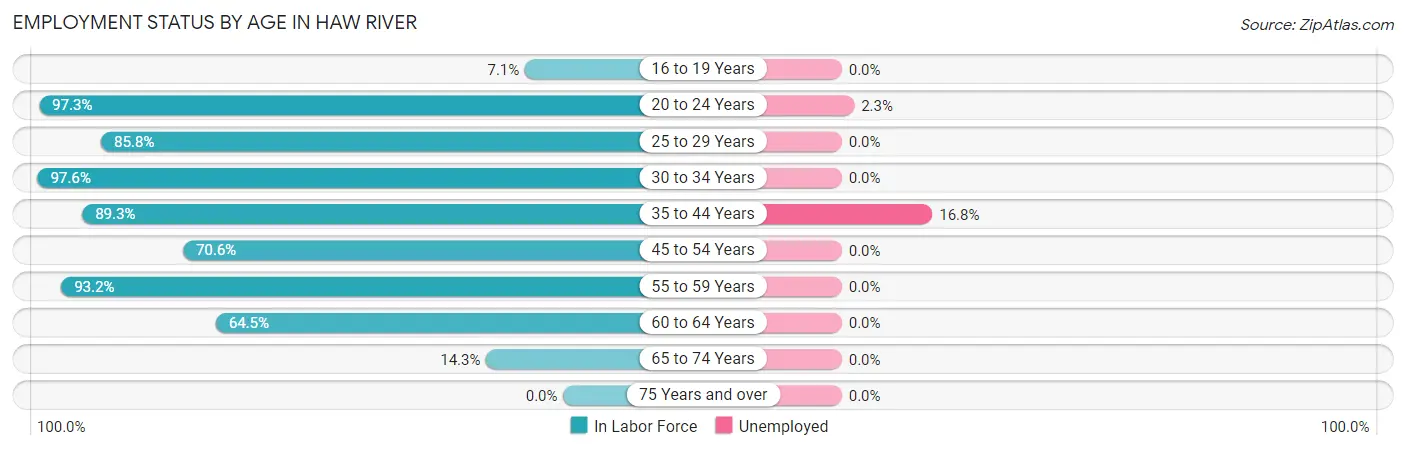
| Age Bracket | In Labor Force | Unemployed |
| 16 to 19 Years | 10 (7.1%) | 0 (0.0%) |
| 20 to 24 Years | 426 (97.3%) | 10 (2.3%) |
| 25 to 29 Years | 200 (85.8%) | 0 (0.0%) |
| 30 to 34 Years | 80 (97.6%) | 0 (0.0%) |
| 35 to 44 Years | 334 (89.3%) | 56 (16.8%) |
| 45 to 54 Years | 243 (70.6%) | 0 (0.0%) |
| 55 to 59 Years | 82 (93.2%) | 0 (0.0%) |
| 60 to 64 Years | 98 (64.5%) | 0 (0.0%) |
| 65 to 74 Years | 30 (14.3%) | 0 (0.0%) |
| 75 Years and over | 0 (0.0%) | 0 (0.0%) |
| Total | 1,504 (68.5%) | 66 (4.4%) |
Employment Status by Educational Attainment in Haw River
According to labor force statistics for Haw River, 81.5% of individuals (1,037) out of the total population between 25 and 64 years of age (1,273) are in the labor force, with 5.4% or 56 of them being unemployed. The group with the highest labor force participation rate are those with the educational attainment of bachelor's degree or higher, with 96.9% or 216 individuals in the labor force. Within the labor force, individuals with less than high school education have the highest percentage of unemployment, with 20.6% or 42 of them being unemployed.
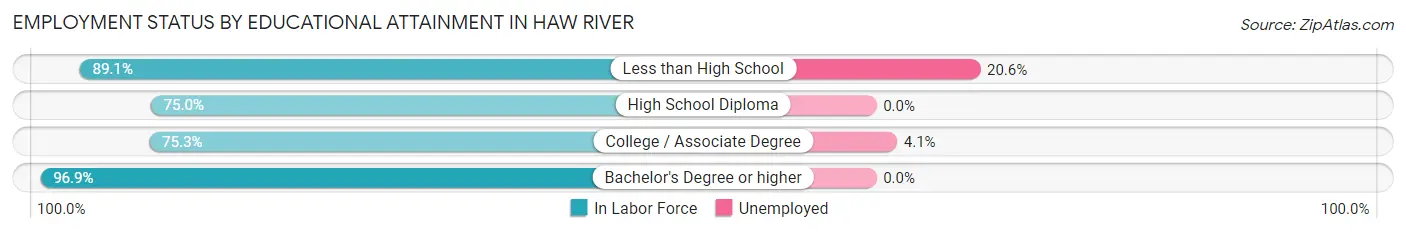
| Educational Attainment | In Labor Force | Unemployed |
| Less than High School | 204 (89.1%) | 47 (20.6%) |
| High School Diploma | 273 (75.0%) | 0 (0.0%) |
| College / Associate Degree | 344 (75.3%) | 19 (4.1%) |
| Bachelor's Degree or higher | 216 (96.9%) | 0 (0.0%) |
| Total | 1,037 (81.5%) | 69 (5.4%) |
Employment Occupations by Sex in Haw River
Management, Business, Science and Arts Occupations
The most common Management, Business, Science and Arts occupations in Haw River are Management (123 | 8.6%), Community & Social Service (57 | 4.0%), Business & Financial (39 | 2.7%), Computers, Engineering & Science (35 | 2.4%), and Computers & Mathematics (35 | 2.4%).
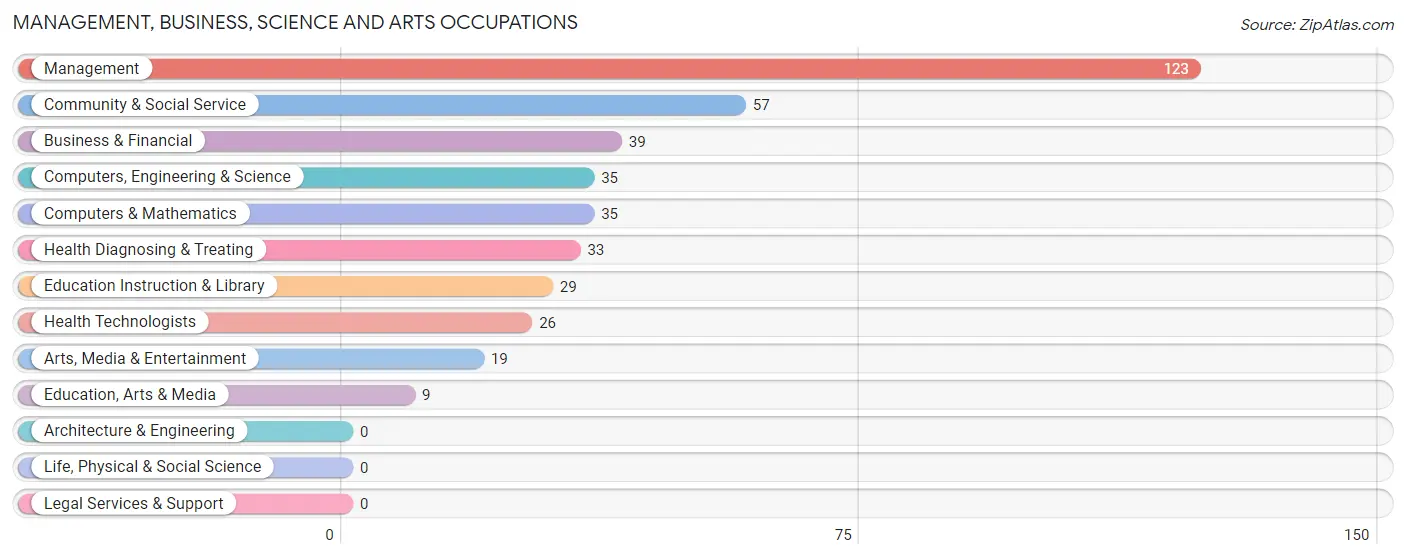
Management, Business, Science and Arts Occupations by Sex
Within the Management, Business, Science and Arts occupations in Haw River, the most male-oriented occupations are Management (83.7%), Arts, Media & Entertainment (73.7%), and Computers, Engineering & Science (51.4%), while the most female-oriented occupations are Education, Arts & Media (100.0%), Education Instruction & Library (100.0%), and Health Diagnosing & Treating (100.0%).
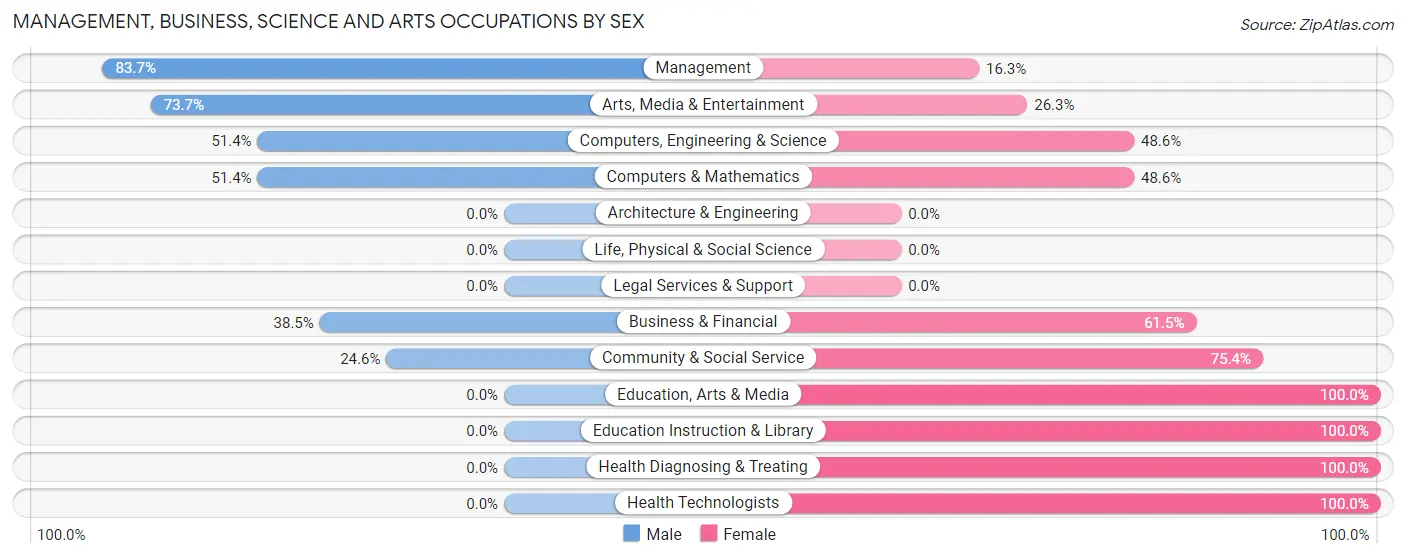
| Occupation | Male | Female |
| Management | 103 (83.7%) | 20 (16.3%) |
| Business & Financial | 15 (38.5%) | 24 (61.5%) |
| Computers, Engineering & Science | 18 (51.4%) | 17 (48.6%) |
| Computers & Mathematics | 18 (51.4%) | 17 (48.6%) |
| Architecture & Engineering | 0 (0.0%) | 0 (0.0%) |
| Life, Physical & Social Science | 0 (0.0%) | 0 (0.0%) |
| Community & Social Service | 14 (24.6%) | 43 (75.4%) |
| Education, Arts & Media | 0 (0.0%) | 9 (100.0%) |
| Legal Services & Support | 0 (0.0%) | 0 (0.0%) |
| Education Instruction & Library | 0 (0.0%) | 29 (100.0%) |
| Arts, Media & Entertainment | 14 (73.7%) | 5 (26.3%) |
| Health Diagnosing & Treating | 0 (0.0%) | 33 (100.0%) |
| Health Technologists | 0 (0.0%) | 26 (100.0%) |
| Total (Category) | 150 (52.3%) | 137 (47.7%) |
| Total (Overall) | 829 (57.7%) | 608 (42.3%) |
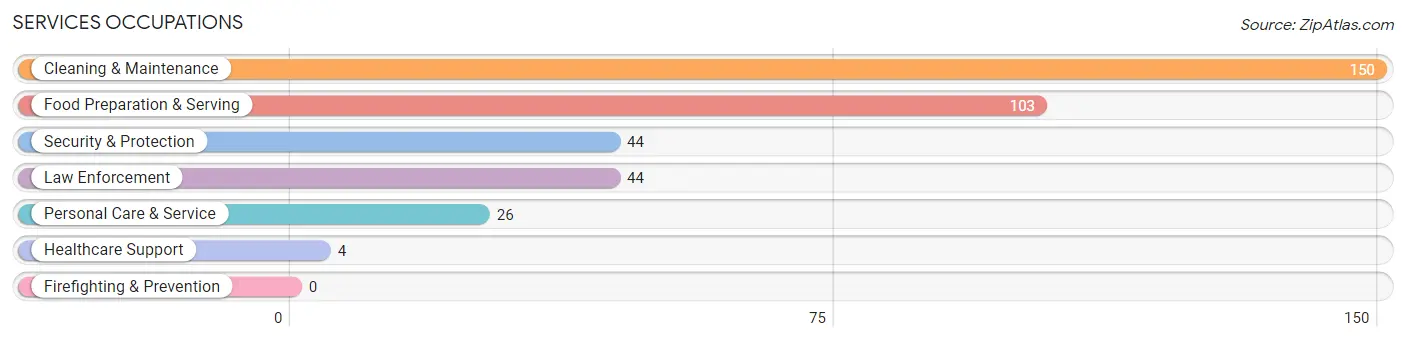
Services Occupations
The most common Services occupations in Haw River are Cleaning & Maintenance (150 | 10.4%), Food Preparation & Serving (103 | 7.2%), Security & Protection (44 | 3.1%), Law Enforcement (44 | 3.1%), and Personal Care & Service (26 | 1.8%).
Services Occupations by Sex
Within the Services occupations in Haw River, the most male-oriented occupations are Security & Protection (100.0%), Law Enforcement (100.0%), and Cleaning & Maintenance (92.7%), while the most female-oriented occupations are Healthcare Support (100.0%), Personal Care & Service (80.8%), and Food Preparation & Serving (73.8%).
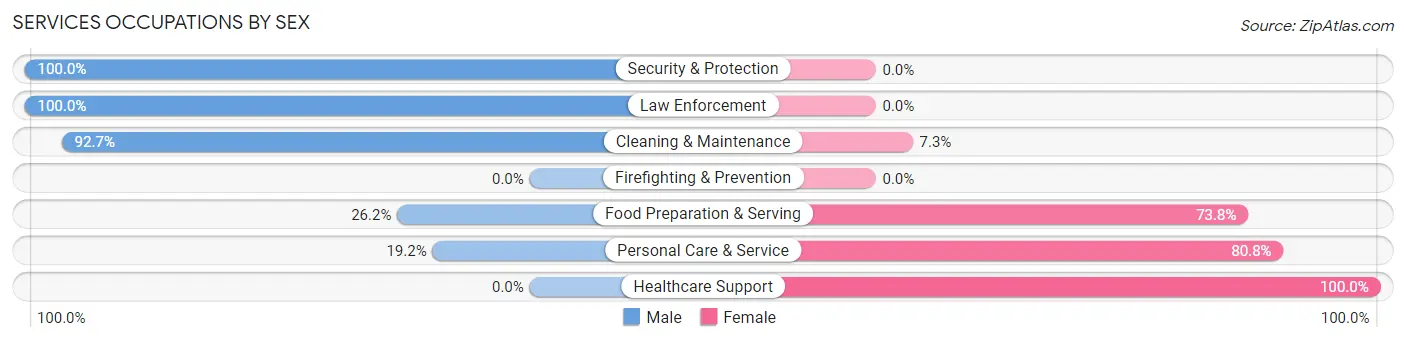
| Occupation | Male | Female |
| Healthcare Support | 0 (0.0%) | 4 (100.0%) |
| Security & Protection | 44 (100.0%) | 0 (0.0%) |
| Firefighting & Prevention | 0 (0.0%) | 0 (0.0%) |
| Law Enforcement | 44 (100.0%) | 0 (0.0%) |
| Food Preparation & Serving | 27 (26.2%) | 76 (73.8%) |
| Cleaning & Maintenance | 139 (92.7%) | 11 (7.3%) |
| Personal Care & Service | 5 (19.2%) | 21 (80.8%) |
| Total (Category) | 215 (65.7%) | 112 (34.3%) |
| Total (Overall) | 829 (57.7%) | 608 (42.3%) |
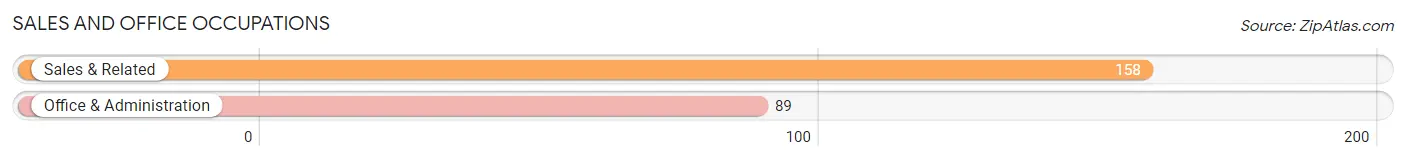
Sales and Office Occupations
The most common Sales and Office occupations in Haw River are Sales & Related (158 | 11.0%), and Office & Administration (89 | 6.2%).
Sales and Office Occupations by Sex
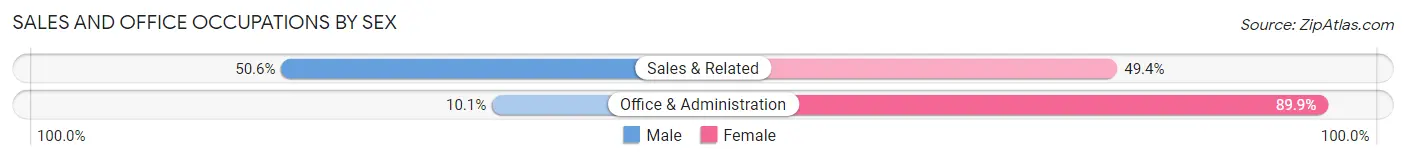
| Occupation | Male | Female |
| Sales & Related | 80 (50.6%) | 78 (49.4%) |
| Office & Administration | 9 (10.1%) | 80 (89.9%) |
| Total (Category) | 89 (36.0%) | 158 (64.0%) |
| Total (Overall) | 829 (57.7%) | 608 (42.3%) |
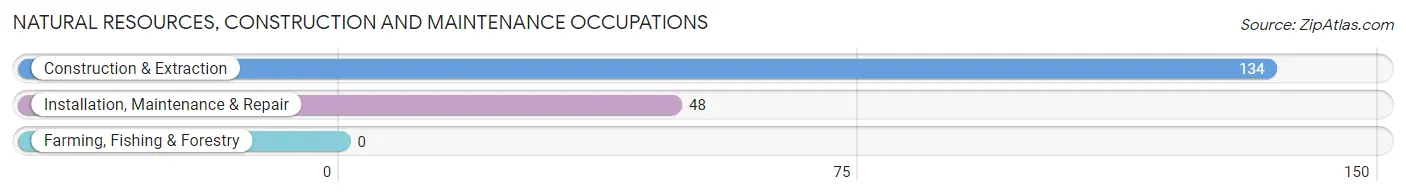
Natural Resources, Construction and Maintenance Occupations
The most common Natural Resources, Construction and Maintenance occupations in Haw River are Construction & Extraction (134 | 9.3%), and Installation, Maintenance & Repair (48 | 3.3%).
Natural Resources, Construction and Maintenance Occupations by Sex
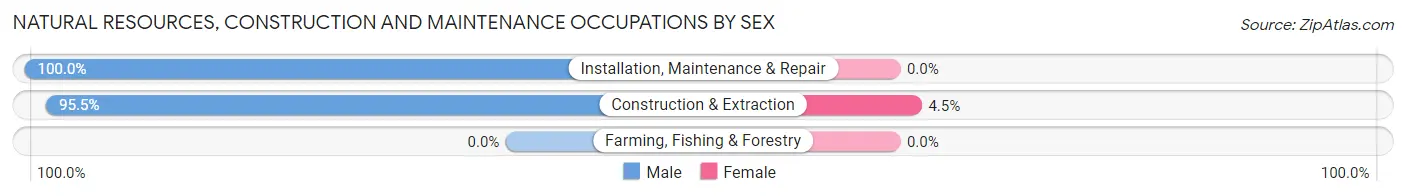
| Occupation | Male | Female |
| Farming, Fishing & Forestry | 0 (0.0%) | 0 (0.0%) |
| Construction & Extraction | 128 (95.5%) | 6 (4.5%) |
| Installation, Maintenance & Repair | 48 (100.0%) | 0 (0.0%) |
| Total (Category) | 176 (96.7%) | 6 (3.3%) |
| Total (Overall) | 829 (57.7%) | 608 (42.3%) |
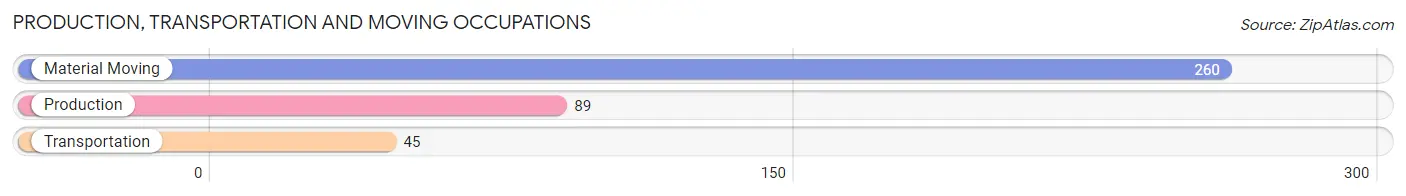
Production, Transportation and Moving Occupations
The most common Production, Transportation and Moving occupations in Haw River are Material Moving (260 | 18.1%), Production (89 | 6.2%), and Transportation (45 | 3.1%).
Production, Transportation and Moving Occupations by Sex
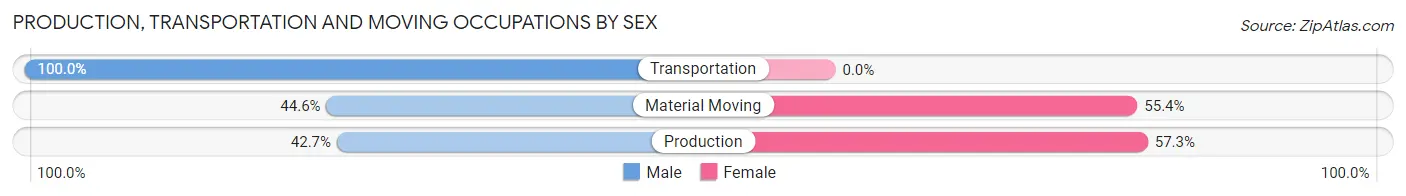
| Occupation | Male | Female |
| Production | 38 (42.7%) | 51 (57.3%) |
| Transportation | 45 (100.0%) | 0 (0.0%) |
| Material Moving | 116 (44.6%) | 144 (55.4%) |
| Total (Category) | 199 (50.5%) | 195 (49.5%) |
| Total (Overall) | 829 (57.7%) | 608 (42.3%) |
Employment Industries by Sex in Haw River
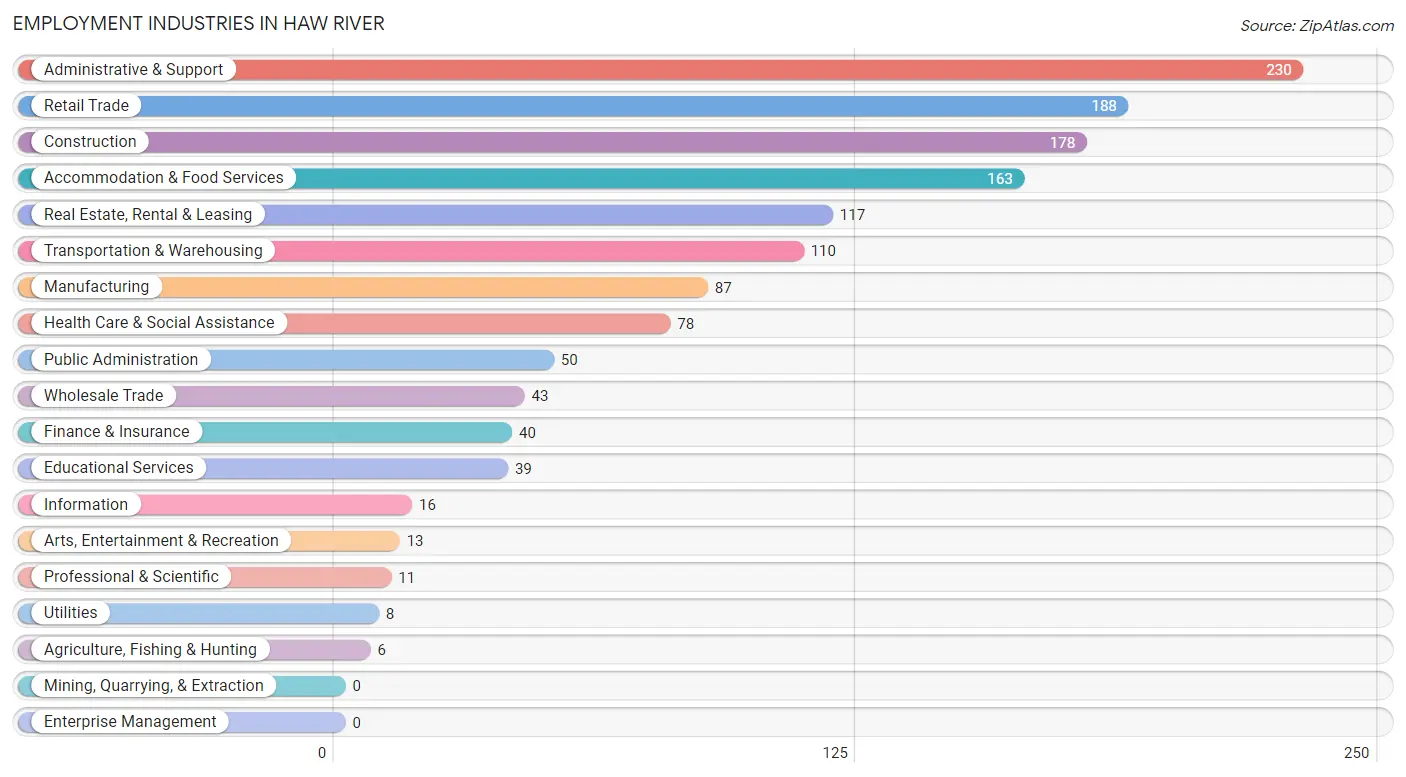
Employment Industries in Haw River
The major employment industries in Haw River include Administrative & Support (230 | 16.0%), Retail Trade (188 | 13.1%), Construction (178 | 12.4%), Accommodation & Food Services (163 | 11.3%), and Real Estate, Rental & Leasing (117 | 8.1%).
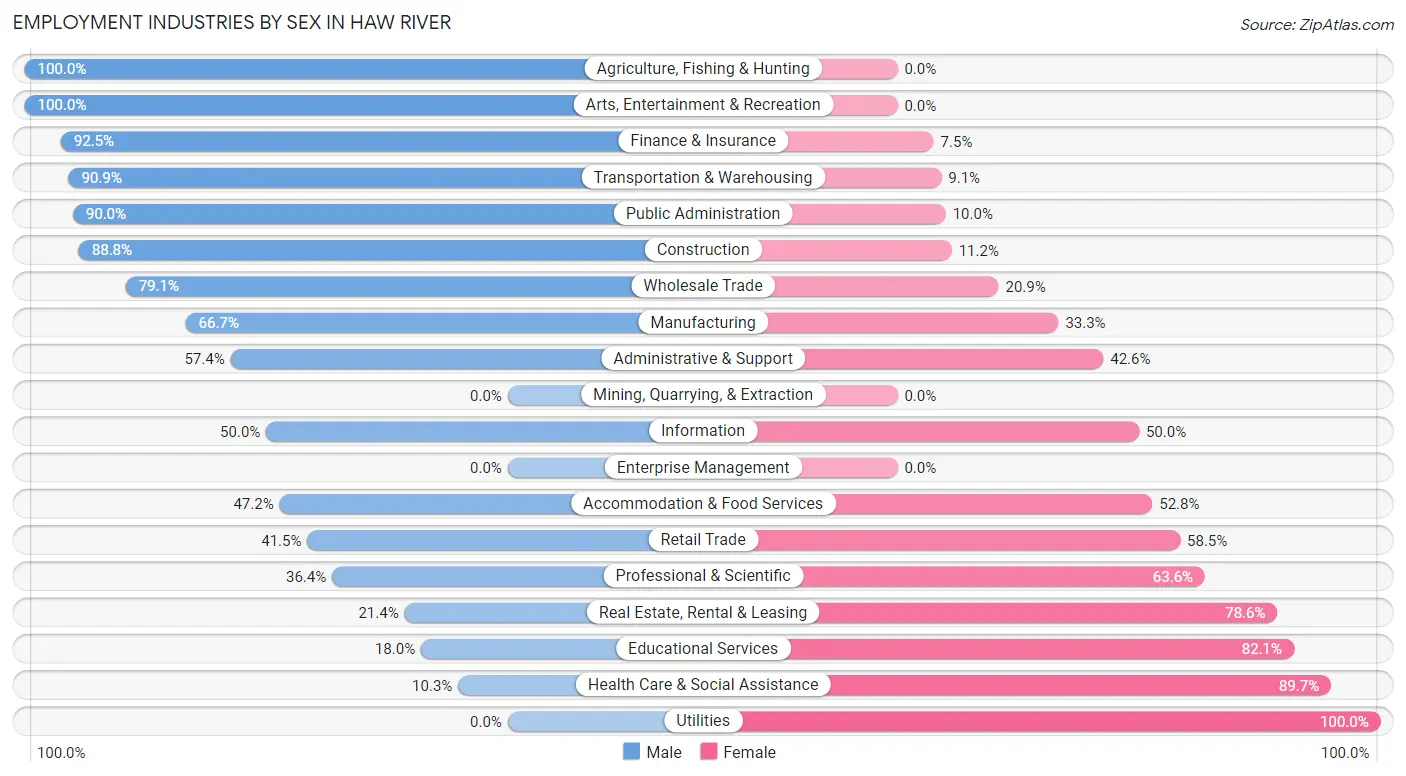
Employment Industries by Sex in Haw River
The Haw River industries that see more men than women are Agriculture, Fishing & Hunting (100.0%), Arts, Entertainment & Recreation (100.0%), and Finance & Insurance (92.5%), whereas the industries that tend to have a higher number of women are Utilities (100.0%), Health Care & Social Assistance (89.7%), and Educational Services (82.1%).
| Industry | Male | Female |
| Agriculture, Fishing & Hunting | 6 (100.0%) | 0 (0.0%) |
| Mining, Quarrying, & Extraction | 0 (0.0%) | 0 (0.0%) |
| Construction | 158 (88.8%) | 20 (11.2%) |
| Manufacturing | 58 (66.7%) | 29 (33.3%) |
| Wholesale Trade | 34 (79.1%) | 9 (20.9%) |
| Retail Trade | 78 (41.5%) | 110 (58.5%) |
| Transportation & Warehousing | 100 (90.9%) | 10 (9.1%) |
| Utilities | 0 (0.0%) | 8 (100.0%) |
| Information | 8 (50.0%) | 8 (50.0%) |
| Finance & Insurance | 37 (92.5%) | 3 (7.5%) |
| Real Estate, Rental & Leasing | 25 (21.4%) | 92 (78.6%) |
| Professional & Scientific | 4 (36.4%) | 7 (63.6%) |
| Enterprise Management | 0 (0.0%) | 0 (0.0%) |
| Administrative & Support | 132 (57.4%) | 98 (42.6%) |
| Educational Services | 7 (17.9%) | 32 (82.1%) |
| Health Care & Social Assistance | 8 (10.3%) | 70 (89.7%) |
| Arts, Entertainment & Recreation | 13 (100.0%) | 0 (0.0%) |
| Accommodation & Food Services | 77 (47.2%) | 86 (52.8%) |
| Public Administration | 45 (90.0%) | 5 (10.0%) |
| Total | 829 (57.7%) | 608 (42.3%) |
Education in Haw River
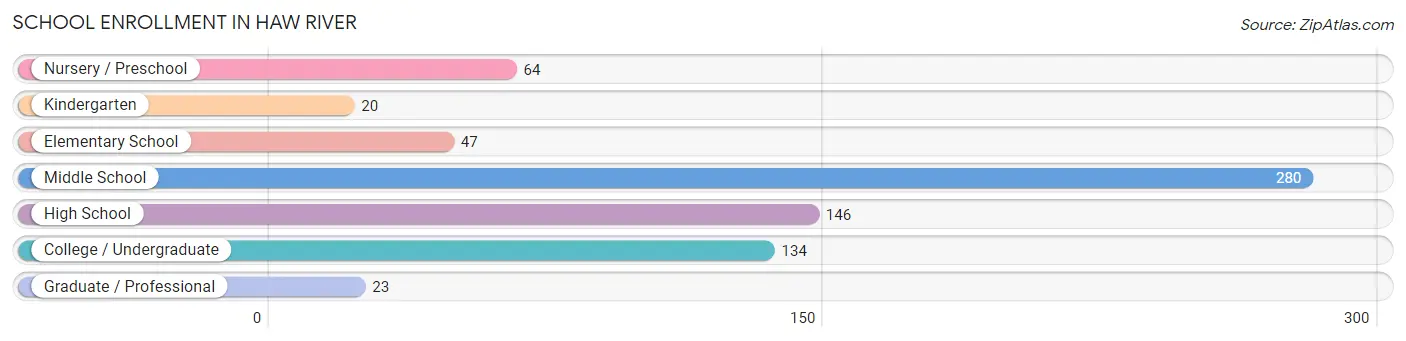
School Enrollment in Haw River
The most common levels of schooling among the 714 students in Haw River are middle school (280 | 39.2%), high school (146 | 20.4%), and college / undergraduate (134 | 18.8%).
| School Level | # Students | % Students |
| Nursery / Preschool | 64 | 9.0% |
| Kindergarten | 20 | 2.8% |
| Elementary School | 47 | 6.6% |
| Middle School | 280 | 39.2% |
| High School | 146 | 20.4% |
| College / Undergraduate | 134 | 18.8% |
| Graduate / Professional | 23 | 3.2% |
| Total | 714 | 100.0% |
School Enrollment by Age by Funding Source in Haw River
Out of a total of 714 students who are enrolled in schools in Haw River, 49 (6.9%) attend a private institution, while the remaining 665 (93.1%) are enrolled in public schools. The age group of 5 to 9 year old has the highest likelihood of being enrolled in private schools, with 18 (26.9% in the age bracket) enrolled. Conversely, the age group of 3 to 4 year olds has the lowest likelihood of being enrolled in a private school, with 55 (100.0% in the age bracket) attending a public institution.
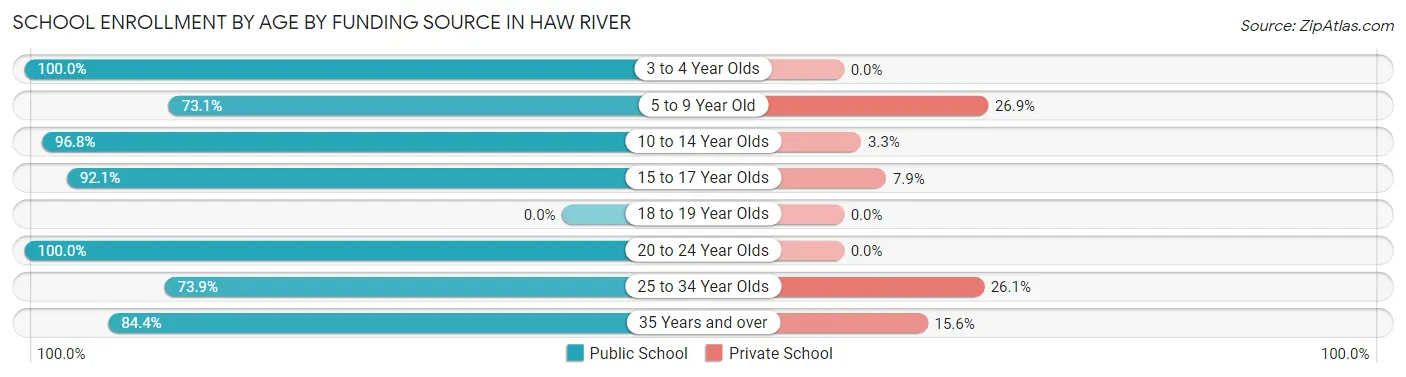
| Age Bracket | Public School | Private School |
| 3 to 4 Year Olds | 55 (100.0%) | 0 (0.0%) |
| 5 to 9 Year Old | 49 (73.1%) | 18 (26.9%) |
| 10 to 14 Year Olds | 298 (96.8%) | 10 (3.3%) |
| 15 to 17 Year Olds | 117 (92.1%) | 10 (7.9%) |
| 18 to 19 Year Olds | 0 (0.0%) | 0 (0.0%) |
| 20 to 24 Year Olds | 102 (100.0%) | 0 (0.0%) |
| 25 to 34 Year Olds | 17 (73.9%) | 6 (26.1%) |
| 35 Years and over | 27 (84.4%) | 5 (15.6%) |
| Total | 665 (93.1%) | 49 (6.9%) |
Educational Attainment by Field of Study in Haw River
Liberal arts & history (55 | 20.9%), business (50 | 19.0%), literature & languages (50 | 19.0%), psychology (29 | 11.0%), and computers & mathematics (19 | 7.2%) are the most common fields of study among 263 individuals in Haw River who have obtained a bachelor's degree or higher.
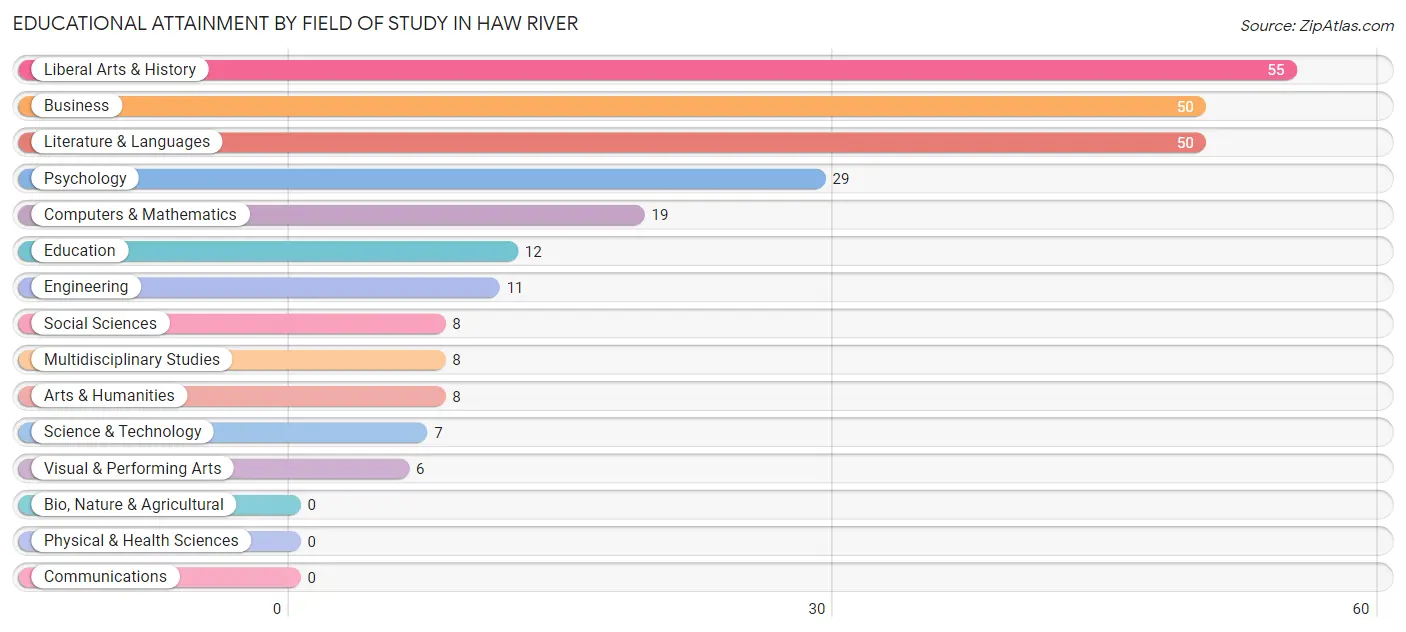
| Field of Study | # Graduates | % Graduates |
| Computers & Mathematics | 19 | 7.2% |
| Bio, Nature & Agricultural | 0 | 0.0% |
| Physical & Health Sciences | 0 | 0.0% |
| Psychology | 29 | 11.0% |
| Social Sciences | 8 | 3.0% |
| Engineering | 11 | 4.2% |
| Multidisciplinary Studies | 8 | 3.0% |
| Science & Technology | 7 | 2.7% |
| Business | 50 | 19.0% |
| Education | 12 | 4.6% |
| Literature & Languages | 50 | 19.0% |
| Liberal Arts & History | 55 | 20.9% |
| Visual & Performing Arts | 6 | 2.3% |
| Communications | 0 | 0.0% |
| Arts & Humanities | 8 | 3.0% |
| Total | 263 | 100.0% |
Transportation & Commute in Haw River
Vehicle Availability by Sex in Haw River
The most prevalent vehicle ownership categories in Haw River are males with 2 vehicles (454, accounting for 56.0%) and females with 2 vehicles (272, making up 77.6%).
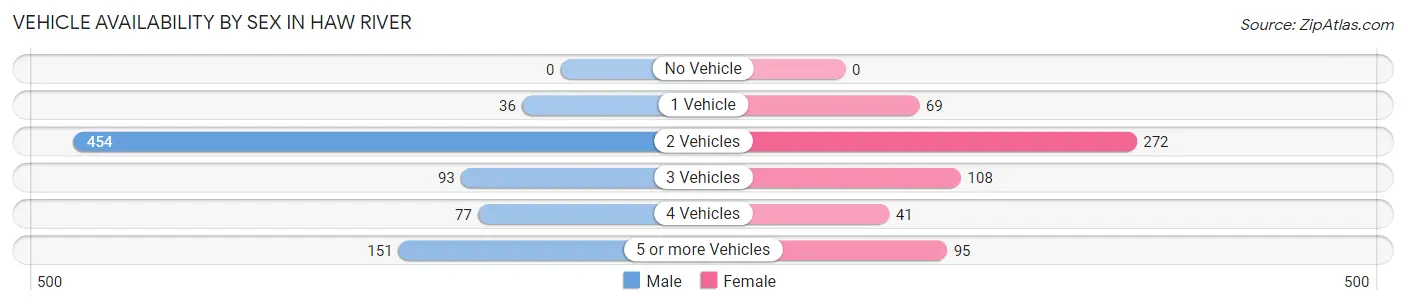
| Vehicles Available | Male | Female |
| No Vehicle | 0 (0.0%) | 0 (0.0%) |
| 1 Vehicle | 36 (4.4%) | 69 (11.8%) |
| 2 Vehicles | 454 (56.0%) | 272 (46.5%) |
| 3 Vehicles | 93 (11.5%) | 108 (18.5%) |
| 4 Vehicles | 77 (9.5%) | 41 (7.0%) |
| 5 or more Vehicles | 151 (18.6%) | 95 (16.2%) |
| Total | 811 (100.0%) | 585 (100.0%) |
Commute Time in Haw River
The most frequently occuring commute durations in Haw River are 20 to 24 minutes (286 commuters, 20.9%), 15 to 19 minutes (257 commuters, 18.8%), and 30 to 34 minutes (135 commuters, 9.9%).
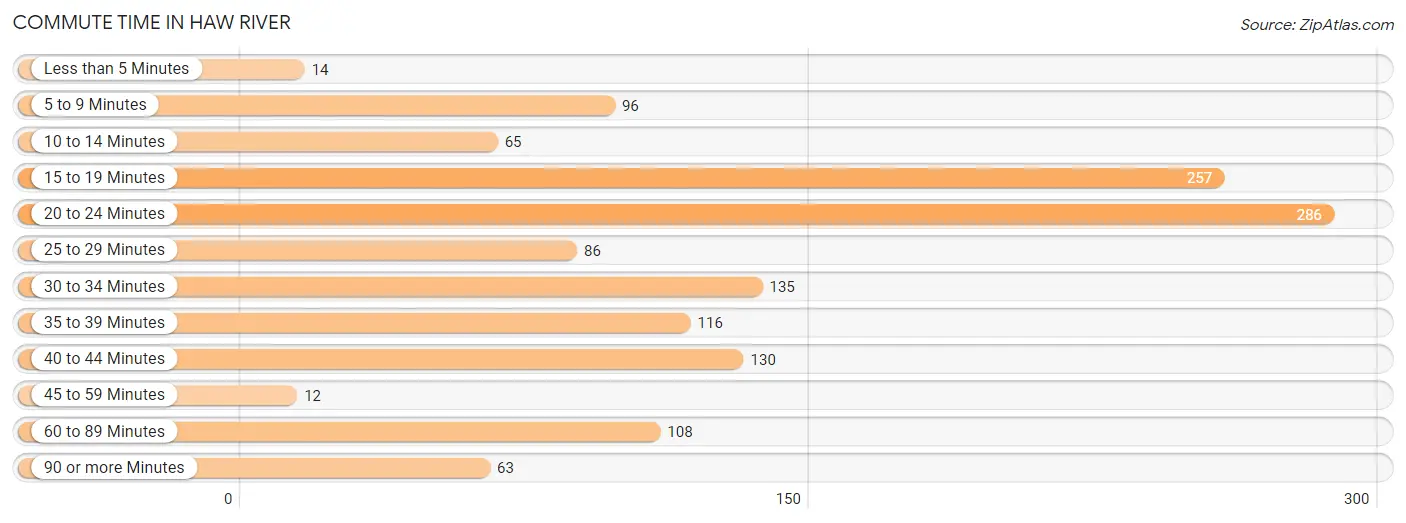
| Commute Time | # Commuters | % Commuters |
| Less than 5 Minutes | 14 | 1.0% |
| 5 to 9 Minutes | 96 | 7.0% |
| 10 to 14 Minutes | 65 | 4.8% |
| 15 to 19 Minutes | 257 | 18.8% |
| 20 to 24 Minutes | 286 | 20.9% |
| 25 to 29 Minutes | 86 | 6.3% |
| 30 to 34 Minutes | 135 | 9.9% |
| 35 to 39 Minutes | 116 | 8.5% |
| 40 to 44 Minutes | 130 | 9.5% |
| 45 to 59 Minutes | 12 | 0.9% |
| 60 to 89 Minutes | 108 | 7.9% |
| 90 or more Minutes | 63 | 4.6% |
Commute Time by Sex in Haw River
The most common commute times in Haw River are 15 to 19 minutes (134 commuters, 17.0%) for males and 20 to 24 minutes (179 commuters, 30.8%) for females.
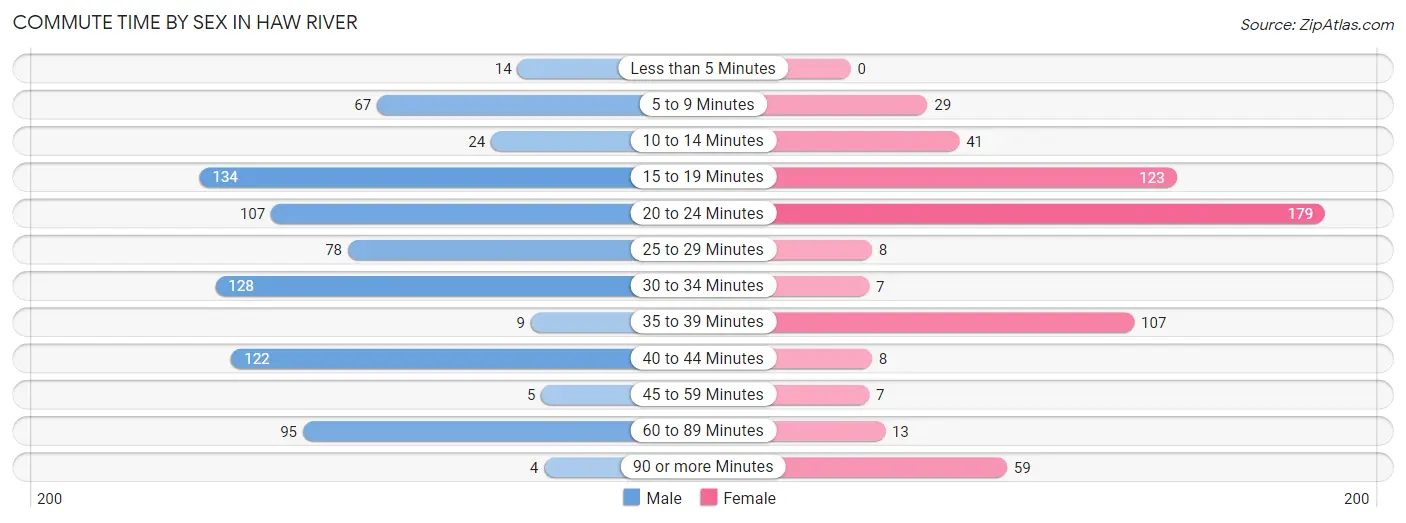
| Commute Time | Male | Female |
| Less than 5 Minutes | 14 (1.8%) | 0 (0.0%) |
| 5 to 9 Minutes | 67 (8.5%) | 29 (5.0%) |
| 10 to 14 Minutes | 24 (3.0%) | 41 (7.1%) |
| 15 to 19 Minutes | 134 (17.0%) | 123 (21.2%) |
| 20 to 24 Minutes | 107 (13.6%) | 179 (30.8%) |
| 25 to 29 Minutes | 78 (9.9%) | 8 (1.4%) |
| 30 to 34 Minutes | 128 (16.3%) | 7 (1.2%) |
| 35 to 39 Minutes | 9 (1.1%) | 107 (18.4%) |
| 40 to 44 Minutes | 122 (15.5%) | 8 (1.4%) |
| 45 to 59 Minutes | 5 (0.6%) | 7 (1.2%) |
| 60 to 89 Minutes | 95 (12.1%) | 13 (2.2%) |
| 90 or more Minutes | 4 (0.5%) | 59 (10.2%) |
Time of Departure to Work by Sex in Haw River
The most frequent times of departure to work in Haw River are 9:00 AM to 9:59 AM (110, 14.0%) for males and 7:30 AM to 7:59 AM (114, 19.6%) for females.
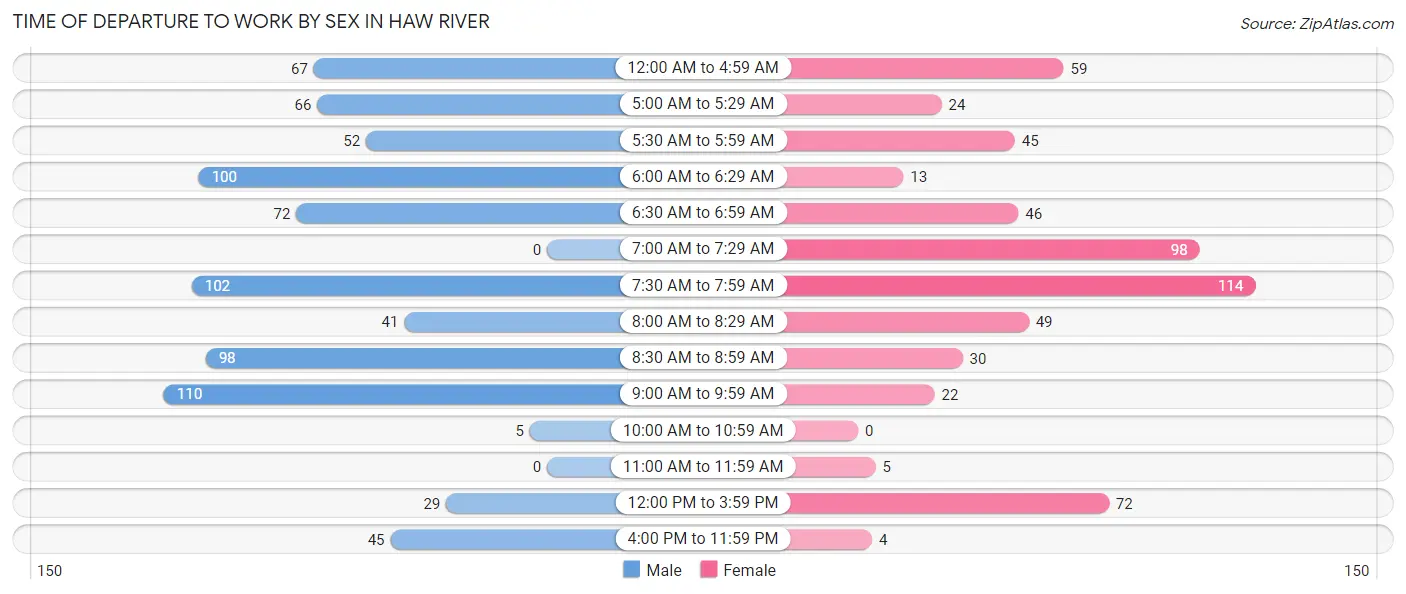
| Time of Departure | Male | Female |
| 12:00 AM to 4:59 AM | 67 (8.5%) | 59 (10.2%) |
| 5:00 AM to 5:29 AM | 66 (8.4%) | 24 (4.1%) |
| 5:30 AM to 5:59 AM | 52 (6.6%) | 45 (7.7%) |
| 6:00 AM to 6:29 AM | 100 (12.7%) | 13 (2.2%) |
| 6:30 AM to 6:59 AM | 72 (9.1%) | 46 (7.9%) |
| 7:00 AM to 7:29 AM | 0 (0.0%) | 98 (16.9%) |
| 7:30 AM to 7:59 AM | 102 (13.0%) | 114 (19.6%) |
| 8:00 AM to 8:29 AM | 41 (5.2%) | 49 (8.4%) |
| 8:30 AM to 8:59 AM | 98 (12.4%) | 30 (5.2%) |
| 9:00 AM to 9:59 AM | 110 (14.0%) | 22 (3.8%) |
| 10:00 AM to 10:59 AM | 5 (0.6%) | 0 (0.0%) |
| 11:00 AM to 11:59 AM | 0 (0.0%) | 5 (0.9%) |
| 12:00 PM to 3:59 PM | 29 (3.7%) | 72 (12.4%) |
| 4:00 PM to 11:59 PM | 45 (5.7%) | 4 (0.7%) |
| Total | 787 (100.0%) | 581 (100.0%) |
Housing Occupancy in Haw River
Occupancy by Ownership in Haw River
Of the total 981 dwellings in Haw River, owner-occupied units account for 720 (73.4%), while renter-occupied units make up 261 (26.6%).
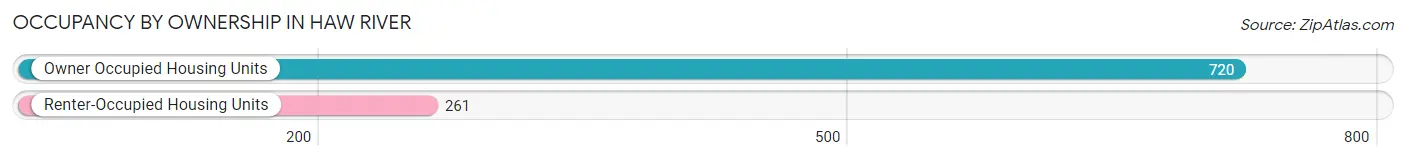
| Occupancy | # Housing Units | % Housing Units |
| Owner Occupied Housing Units | 720 | 73.4% |
| Renter-Occupied Housing Units | 261 | 26.6% |
| Total Occupied Housing Units | 981 | 100.0% |
Occupancy by Household Size in Haw River
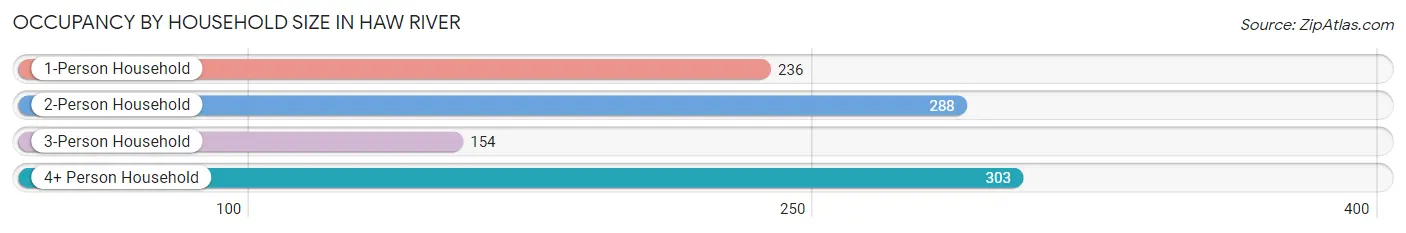
| Household Size | # Housing Units | % Housing Units |
| 1-Person Household | 236 | 24.1% |
| 2-Person Household | 288 | 29.4% |
| 3-Person Household | 154 | 15.7% |
| 4+ Person Household | 303 | 30.9% |
| Total Housing Units | 981 | 100.0% |
Occupancy by Ownership by Household Size in Haw River
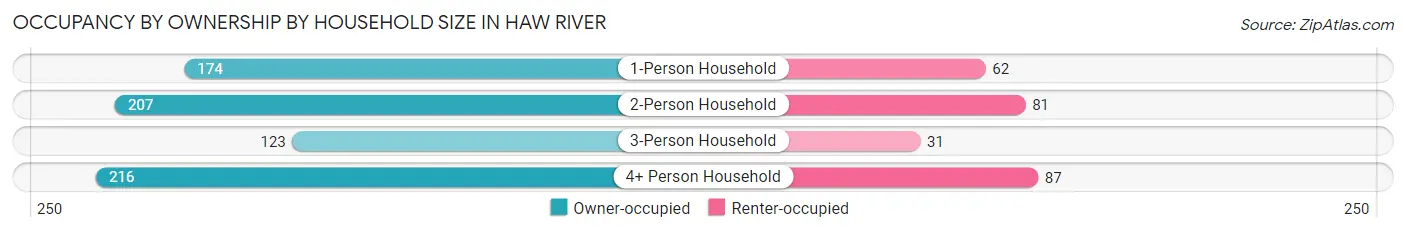
| Household Size | Owner-occupied | Renter-occupied |
| 1-Person Household | 174 (73.7%) | 62 (26.3%) |
| 2-Person Household | 207 (71.9%) | 81 (28.1%) |
| 3-Person Household | 123 (79.9%) | 31 (20.1%) |
| 4+ Person Household | 216 (71.3%) | 87 (28.7%) |
| Total Housing Units | 720 (73.4%) | 261 (26.6%) |
Occupancy by Educational Attainment in Haw River
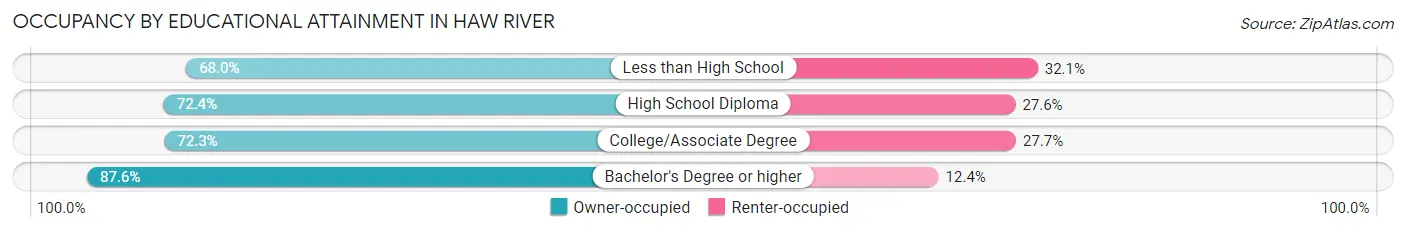
| Household Size | Owner-occupied | Renter-occupied |
| Less than High School | 106 (67.9%) | 50 (32.1%) |
| High School Diploma | 257 (72.4%) | 98 (27.6%) |
| College/Associate Degree | 258 (72.3%) | 99 (27.7%) |
| Bachelor's Degree or higher | 99 (87.6%) | 14 (12.4%) |
Occupancy by Age of Householder in Haw River
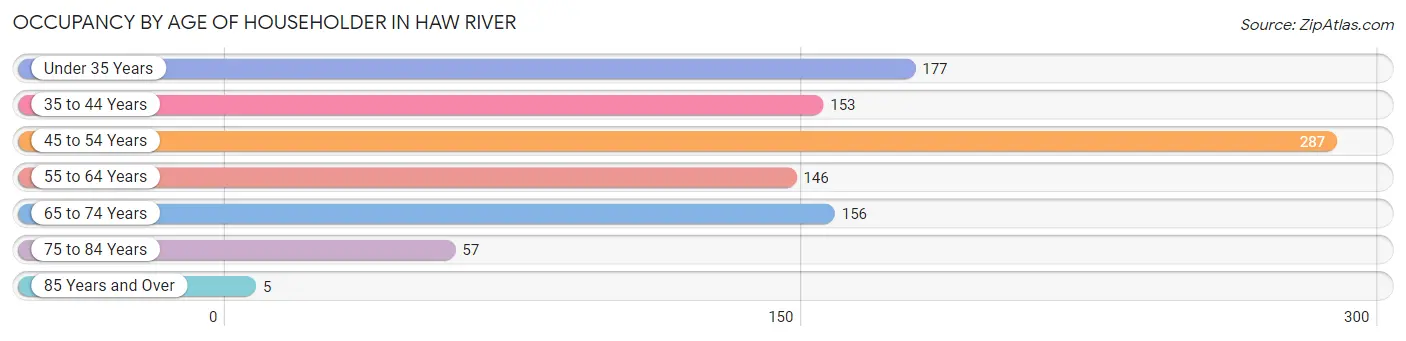
| Age Bracket | # Households | % Households |
| Under 35 Years | 177 | 18.0% |
| 35 to 44 Years | 153 | 15.6% |
| 45 to 54 Years | 287 | 29.3% |
| 55 to 64 Years | 146 | 14.9% |
| 65 to 74 Years | 156 | 15.9% |
| 75 to 84 Years | 57 | 5.8% |
| 85 Years and Over | 5 | 0.5% |
| Total | 981 | 100.0% |
Housing Finances in Haw River
Median Income by Occupancy in Haw River
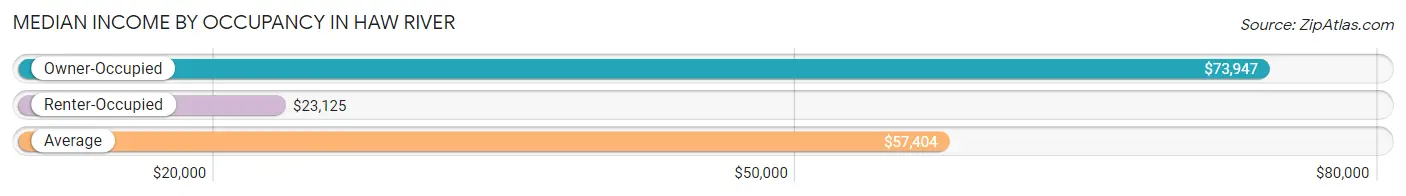
| Occupancy Type | # Households | Median Income |
| Owner-Occupied | 720 (73.4%) | $73,947 |
| Renter-Occupied | 261 (26.6%) | $23,125 |
| Average | 981 (100.0%) | $57,404 |
Occupancy by Householder Income Bracket in Haw River
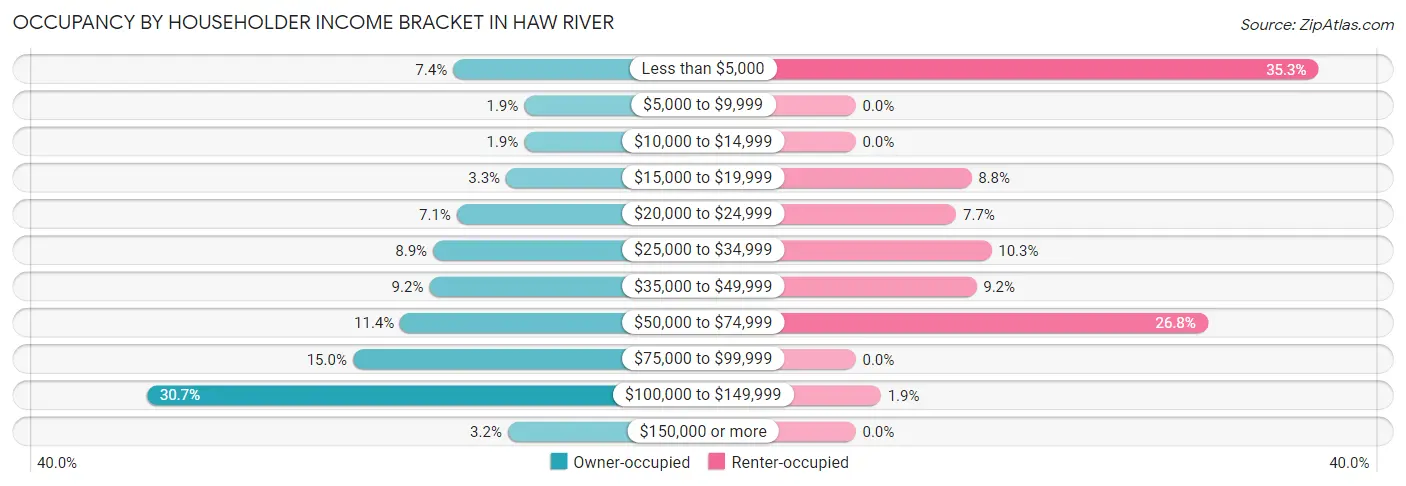
| Income Bracket | Owner-occupied | Renter-occupied |
| Less than $5,000 | 53 (7.4%) | 92 (35.2%) |
| $5,000 to $9,999 | 14 (1.9%) | 0 (0.0%) |
| $10,000 to $14,999 | 14 (1.9%) | 0 (0.0%) |
| $15,000 to $19,999 | 24 (3.3%) | 23 (8.8%) |
| $20,000 to $24,999 | 51 (7.1%) | 20 (7.7%) |
| $25,000 to $34,999 | 64 (8.9%) | 27 (10.3%) |
| $35,000 to $49,999 | 66 (9.2%) | 24 (9.2%) |
| $50,000 to $74,999 | 82 (11.4%) | 70 (26.8%) |
| $75,000 to $99,999 | 108 (15.0%) | 0 (0.0%) |
| $100,000 to $149,999 | 221 (30.7%) | 5 (1.9%) |
| $150,000 or more | 23 (3.2%) | 0 (0.0%) |
| Total | 720 (100.0%) | 261 (100.0%) |
Monthly Housing Cost Tiers in Haw River
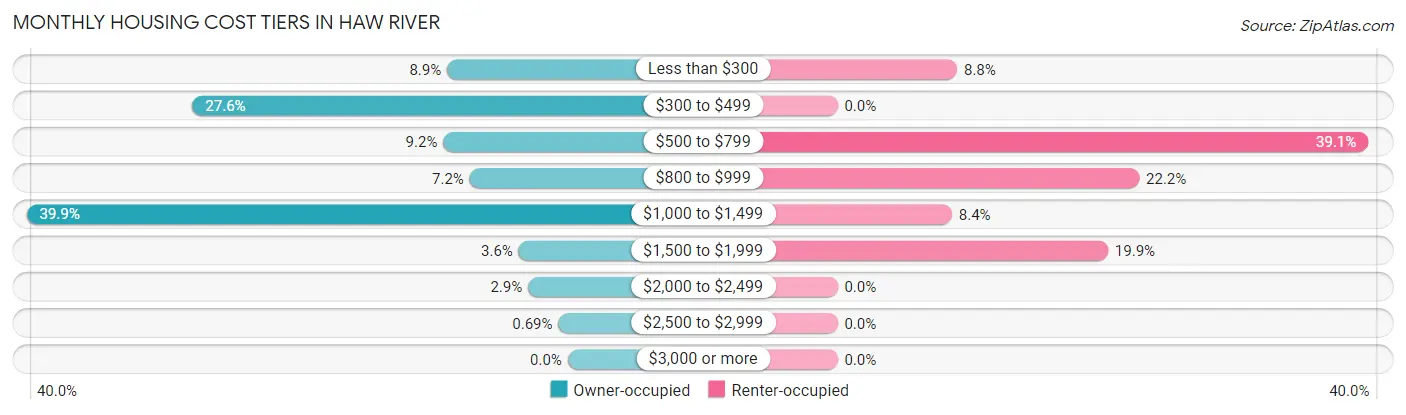
| Monthly Cost | Owner-occupied | Renter-occupied |
| Less than $300 | 64 (8.9%) | 23 (8.8%) |
| $300 to $499 | 199 (27.6%) | 0 (0.0%) |
| $500 to $799 | 66 (9.2%) | 102 (39.1%) |
| $800 to $999 | 52 (7.2%) | 58 (22.2%) |
| $1,000 to $1,499 | 287 (39.9%) | 22 (8.4%) |
| $1,500 to $1,999 | 26 (3.6%) | 52 (19.9%) |
| $2,000 to $2,499 | 21 (2.9%) | 0 (0.0%) |
| $2,500 to $2,999 | 5 (0.7%) | 0 (0.0%) |
| $3,000 or more | 0 (0.0%) | 0 (0.0%) |
| Total | 720 (100.0%) | 261 (100.0%) |
Physical Housing Characteristics in Haw River
Housing Structures in Haw River
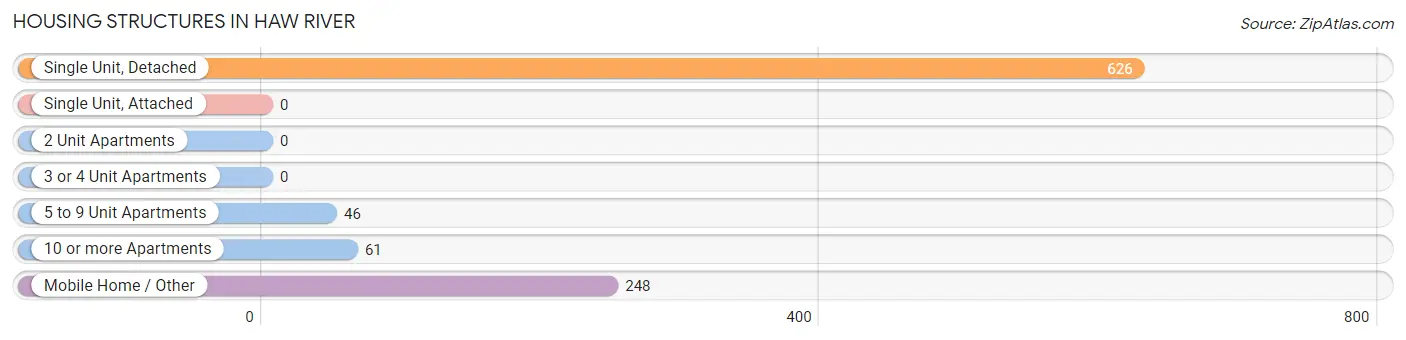
| Structure Type | # Housing Units | % Housing Units |
| Single Unit, Detached | 626 | 63.8% |
| Single Unit, Attached | 0 | 0.0% |
| 2 Unit Apartments | 0 | 0.0% |
| 3 or 4 Unit Apartments | 0 | 0.0% |
| 5 to 9 Unit Apartments | 46 | 4.7% |
| 10 or more Apartments | 61 | 6.2% |
| Mobile Home / Other | 248 | 25.3% |
| Total | 981 | 100.0% |
Housing Structures by Occupancy in Haw River
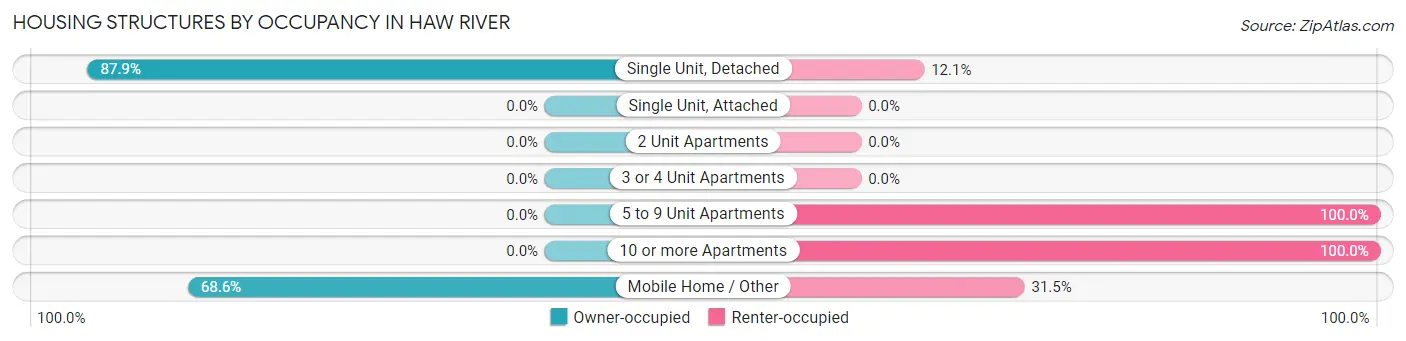
| Structure Type | Owner-occupied | Renter-occupied |
| Single Unit, Detached | 550 (87.9%) | 76 (12.1%) |
| Single Unit, Attached | 0 (0.0%) | 0 (0.0%) |
| 2 Unit Apartments | 0 (0.0%) | 0 (0.0%) |
| 3 or 4 Unit Apartments | 0 (0.0%) | 0 (0.0%) |
| 5 to 9 Unit Apartments | 0 (0.0%) | 46 (100.0%) |
| 10 or more Apartments | 0 (0.0%) | 61 (100.0%) |
| Mobile Home / Other | 170 (68.5%) | 78 (31.5%) |
| Total | 720 (73.4%) | 261 (26.6%) |
Housing Structures by Number of Rooms in Haw River
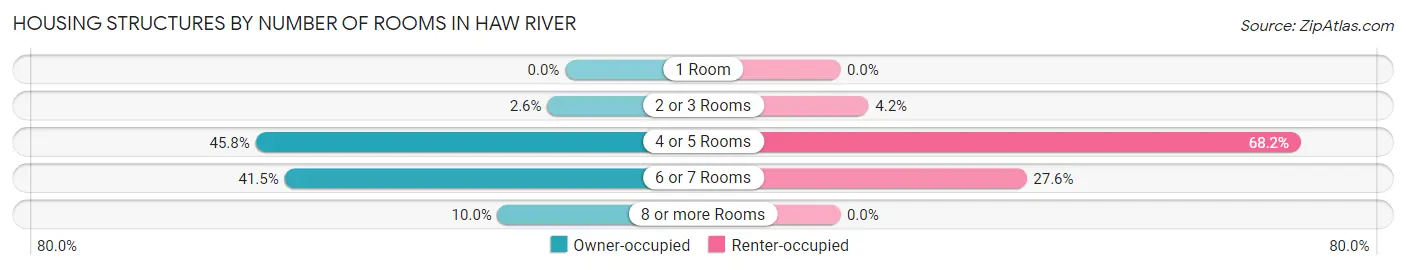
| Number of Rooms | Owner-occupied | Renter-occupied |
| 1 Room | 0 (0.0%) | 0 (0.0%) |
| 2 or 3 Rooms | 19 (2.6%) | 11 (4.2%) |
| 4 or 5 Rooms | 330 (45.8%) | 178 (68.2%) |
| 6 or 7 Rooms | 299 (41.5%) | 72 (27.6%) |
| 8 or more Rooms | 72 (10.0%) | 0 (0.0%) |
| Total | 720 (100.0%) | 261 (100.0%) |
Housing Structure by Heating Type in Haw River
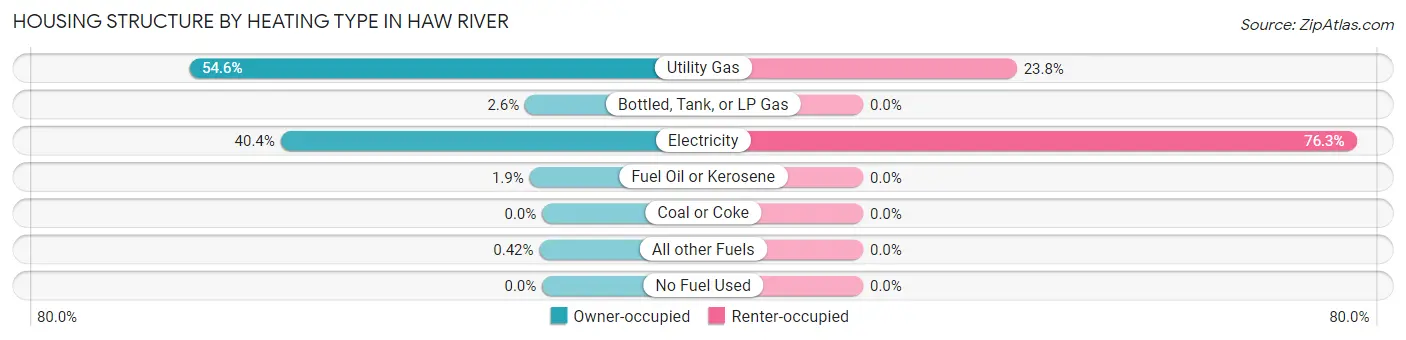
| Heating Type | Owner-occupied | Renter-occupied |
| Utility Gas | 393 (54.6%) | 62 (23.7%) |
| Bottled, Tank, or LP Gas | 19 (2.6%) | 0 (0.0%) |
| Electricity | 291 (40.4%) | 199 (76.2%) |
| Fuel Oil or Kerosene | 14 (1.9%) | 0 (0.0%) |
| Coal or Coke | 0 (0.0%) | 0 (0.0%) |
| All other Fuels | 3 (0.4%) | 0 (0.0%) |
| No Fuel Used | 0 (0.0%) | 0 (0.0%) |
| Total | 720 (100.0%) | 261 (100.0%) |
Household Vehicle Usage in Haw River
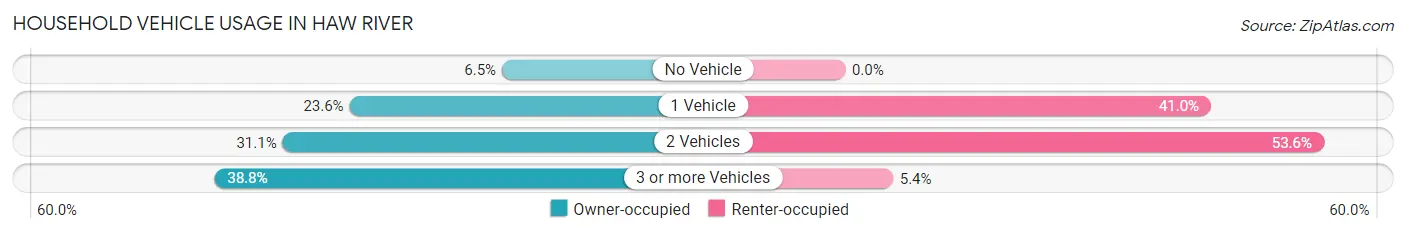
| Vehicles per Household | Owner-occupied | Renter-occupied |
| No Vehicle | 47 (6.5%) | 0 (0.0%) |
| 1 Vehicle | 170 (23.6%) | 107 (41.0%) |
| 2 Vehicles | 224 (31.1%) | 140 (53.6%) |
| 3 or more Vehicles | 279 (38.8%) | 14 (5.4%) |
| Total | 720 (100.0%) | 261 (100.0%) |
Real Estate & Mortgages in Haw River
Real Estate and Mortgage Overview in Haw River
| Characteristic | Without Mortgage | With Mortgage |
| Housing Units | 285 | 435 |
| Median Property Value | $80,100 | $142,100 |
| Median Household Income | $42,813 | $23 |
| Monthly Housing Costs | $377 | $0 |
| Real Estate Taxes | $724 | $14 |
Property Value by Mortgage Status in Haw River
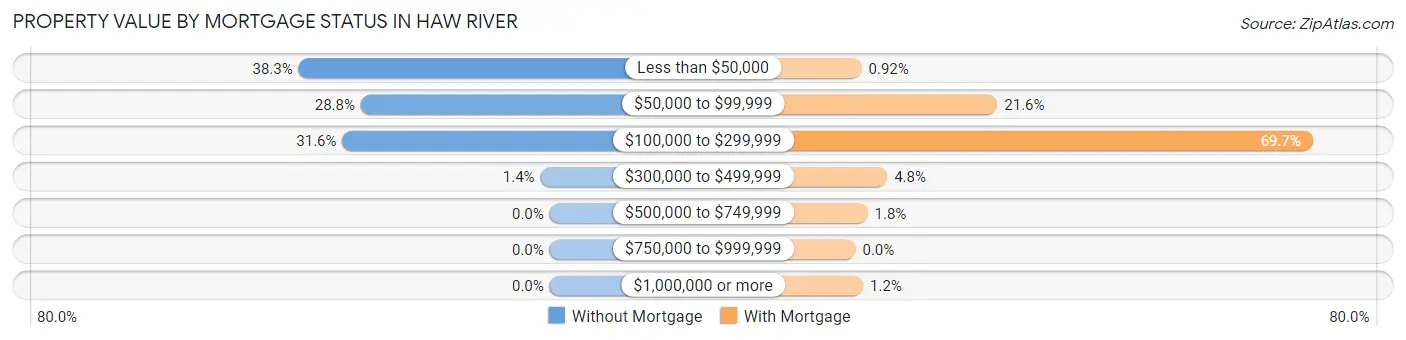
| Property Value | Without Mortgage | With Mortgage |
| Less than $50,000 | 109 (38.3%) | 4 (0.9%) |
| $50,000 to $99,999 | 82 (28.8%) | 94 (21.6%) |
| $100,000 to $299,999 | 90 (31.6%) | 303 (69.7%) |
| $300,000 to $499,999 | 4 (1.4%) | 21 (4.8%) |
| $500,000 to $749,999 | 0 (0.0%) | 8 (1.8%) |
| $750,000 to $999,999 | 0 (0.0%) | 0 (0.0%) |
| $1,000,000 or more | 0 (0.0%) | 5 (1.1%) |
| Total | 285 (100.0%) | 435 (100.0%) |
Household Income by Mortgage Status in Haw River
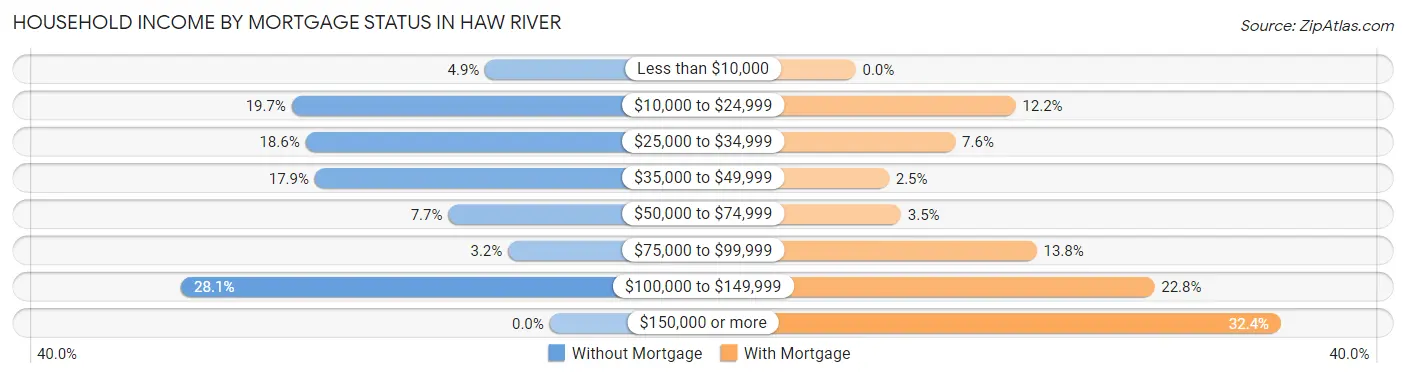
| Household Income | Without Mortgage | With Mortgage |
| Less than $10,000 | 14 (4.9%) | 0 (0.0%) |
| $10,000 to $24,999 | 56 (19.7%) | 53 (12.2%) |
| $25,000 to $34,999 | 53 (18.6%) | 33 (7.6%) |
| $35,000 to $49,999 | 51 (17.9%) | 11 (2.5%) |
| $50,000 to $74,999 | 22 (7.7%) | 15 (3.5%) |
| $75,000 to $99,999 | 9 (3.2%) | 60 (13.8%) |
| $100,000 to $149,999 | 80 (28.1%) | 99 (22.8%) |
| $150,000 or more | 0 (0.0%) | 141 (32.4%) |
| Total | 285 (100.0%) | 435 (100.0%) |
Property Value to Household Income Ratio in Haw River
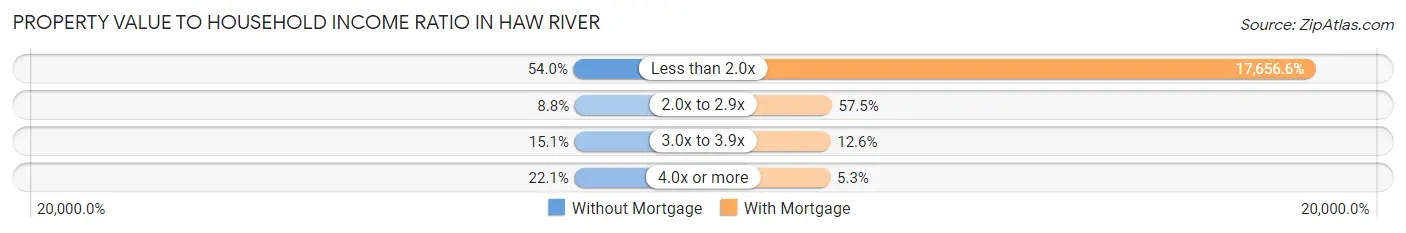
| Value-to-Income Ratio | Without Mortgage | With Mortgage |
| Less than 2.0x | 154 (54.0%) | 76,806 (17,656.5%) |
| 2.0x to 2.9x | 25 (8.8%) | 250 (57.5%) |
| 3.0x to 3.9x | 43 (15.1%) | 55 (12.6%) |
| 4.0x or more | 63 (22.1%) | 23 (5.3%) |
| Total | 285 (100.0%) | 435 (100.0%) |
Real Estate Taxes by Mortgage Status in Haw River
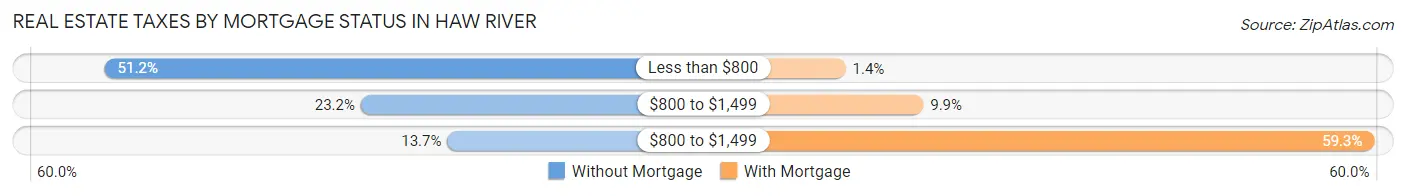
| Property Taxes | Without Mortgage | With Mortgage |
| Less than $800 | 146 (51.2%) | 6 (1.4%) |
| $800 to $1,499 | 66 (23.2%) | 43 (9.9%) |
| $800 to $1,499 | 39 (13.7%) | 258 (59.3%) |
| Total | 285 (100.0%) | 435 (100.0%) |
Health & Disability in Haw River
Health Insurance Coverage by Age in Haw River
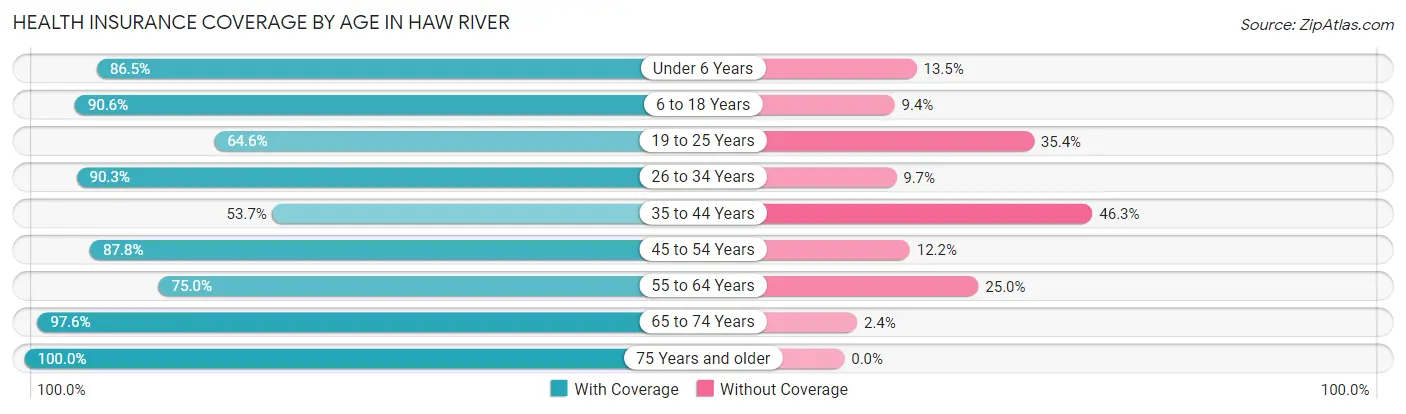
| Age Bracket | With Coverage | Without Coverage |
| Under 6 Years | 257 (86.5%) | 40 (13.5%) |
| 6 to 18 Years | 464 (90.6%) | 48 (9.4%) |
| 19 to 25 Years | 340 (64.6%) | 186 (35.4%) |
| 26 to 34 Years | 233 (90.3%) | 25 (9.7%) |
| 35 to 44 Years | 201 (53.7%) | 173 (46.3%) |
| 45 to 54 Years | 302 (87.8%) | 42 (12.2%) |
| 55 to 64 Years | 180 (75.0%) | 60 (25.0%) |
| 65 to 74 Years | 205 (97.6%) | 5 (2.4%) |
| 75 Years and older | 133 (100.0%) | 0 (0.0%) |
| Total | 2,315 (80.0%) | 579 (20.0%) |
Health Insurance Coverage by Citizenship Status in Haw River
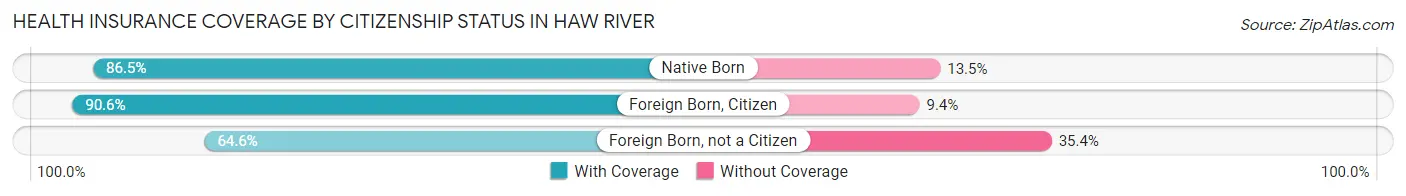
| Citizenship Status | With Coverage | Without Coverage |
| Native Born | 257 (86.5%) | 40 (13.5%) |
| Foreign Born, Citizen | 464 (90.6%) | 48 (9.4%) |
| Foreign Born, not a Citizen | 340 (64.6%) | 186 (35.4%) |
Health Insurance Coverage by Household Income in Haw River
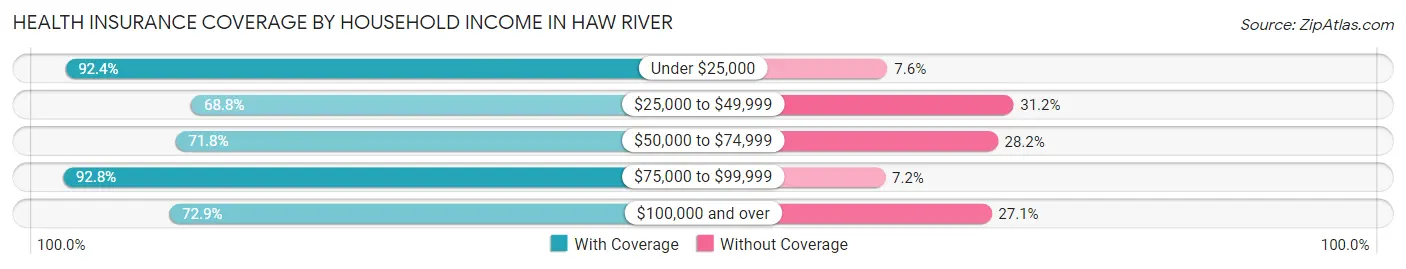
| Household Income | With Coverage | Without Coverage |
| Under $25,000 | 534 (92.4%) | 44 (7.6%) |
| $25,000 to $49,999 | 344 (68.8%) | 156 (31.2%) |
| $50,000 to $74,999 | 305 (71.8%) | 120 (28.2%) |
| $75,000 to $99,999 | 543 (92.8%) | 42 (7.2%) |
| $100,000 and over | 584 (72.9%) | 217 (27.1%) |
Public vs Private Health Insurance Coverage by Age in Haw River
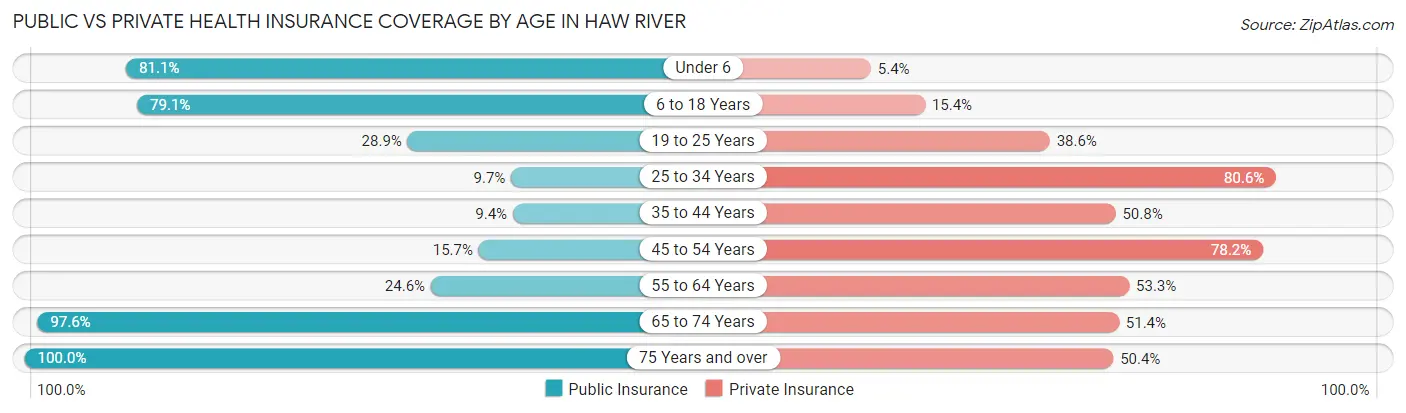
| Age Bracket | Public Insurance | Private Insurance |
| Under 6 | 241 (81.1%) | 16 (5.4%) |
| 6 to 18 Years | 405 (79.1%) | 79 (15.4%) |
| 19 to 25 Years | 152 (28.9%) | 203 (38.6%) |
| 25 to 34 Years | 25 (9.7%) | 208 (80.6%) |
| 35 to 44 Years | 35 (9.4%) | 190 (50.8%) |
| 45 to 54 Years | 54 (15.7%) | 269 (78.2%) |
| 55 to 64 Years | 59 (24.6%) | 128 (53.3%) |
| 65 to 74 Years | 205 (97.6%) | 108 (51.4%) |
| 75 Years and over | 133 (100.0%) | 67 (50.4%) |
| Total | 1,309 (45.2%) | 1,268 (43.8%) |
Disability Status by Sex by Age in Haw River
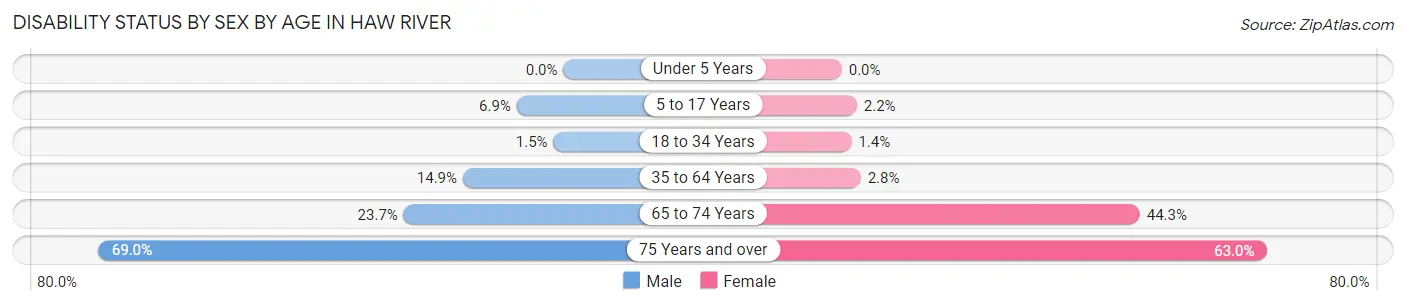
| Age Bracket | Male | Female |
| Under 5 Years | 0 (0.0%) | 0 (0.0%) |
| 5 to 17 Years | 20 (6.9%) | 5 (2.2%) |
| 18 to 34 Years | 7 (1.5%) | 5 (1.4%) |
| 35 to 64 Years | 74 (14.9%) | 13 (2.8%) |
| 65 to 74 Years | 23 (23.7%) | 50 (44.3%) |
| 75 Years and over | 60 (69.0%) | 29 (63.0%) |
Disability Class by Sex by Age in Haw River
Disability Class: Hearing Difficulty
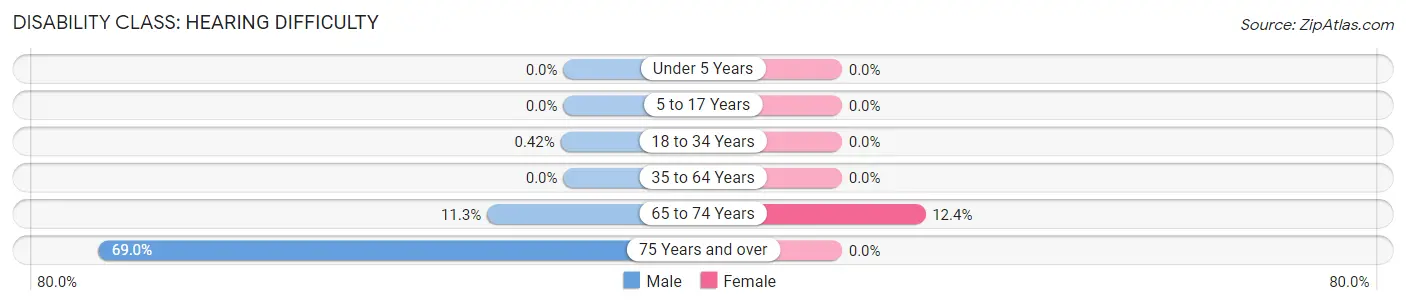
| Age Bracket | Male | Female |
| Under 5 Years | 0 (0.0%) | 0 (0.0%) |
| 5 to 17 Years | 0 (0.0%) | 0 (0.0%) |
| 18 to 34 Years | 2 (0.4%) | 0 (0.0%) |
| 35 to 64 Years | 0 (0.0%) | 0 (0.0%) |
| 65 to 74 Years | 11 (11.3%) | 14 (12.4%) |
| 75 Years and over | 60 (69.0%) | 0 (0.0%) |
Disability Class: Vision Difficulty
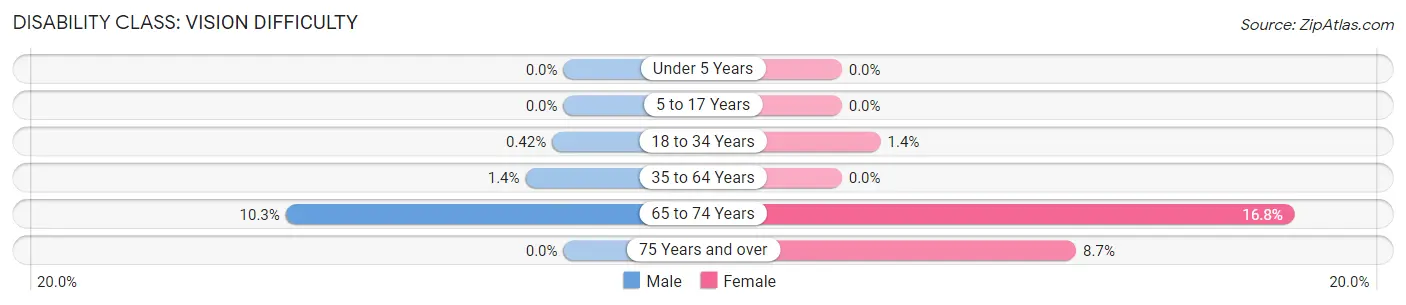
| Age Bracket | Male | Female |
| Under 5 Years | 0 (0.0%) | 0 (0.0%) |
| 5 to 17 Years | 0 (0.0%) | 0 (0.0%) |
| 18 to 34 Years | 2 (0.4%) | 5 (1.4%) |
| 35 to 64 Years | 7 (1.4%) | 0 (0.0%) |
| 65 to 74 Years | 10 (10.3%) | 19 (16.8%) |
| 75 Years and over | 0 (0.0%) | 4 (8.7%) |
Disability Class: Cognitive Difficulty
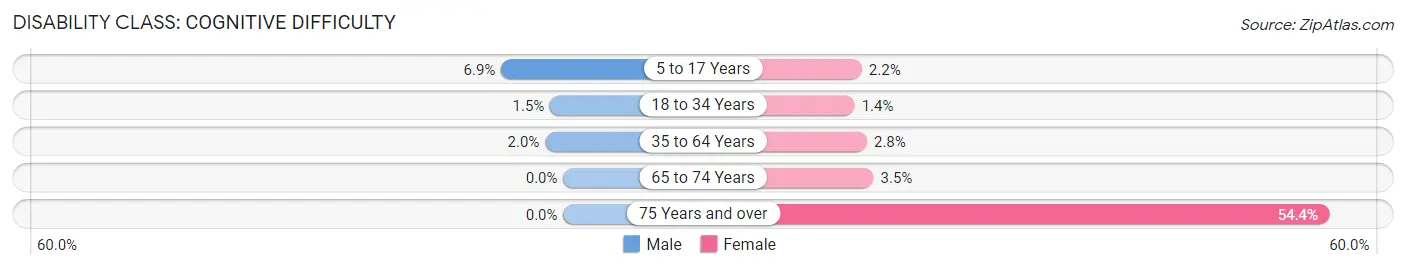
| Age Bracket | Male | Female |
| 5 to 17 Years | 20 (6.9%) | 5 (2.2%) |
| 18 to 34 Years | 7 (1.5%) | 5 (1.4%) |
| 35 to 64 Years | 10 (2.0%) | 13 (2.8%) |
| 65 to 74 Years | 0 (0.0%) | 4 (3.5%) |
| 75 Years and over | 0 (0.0%) | 25 (54.3%) |
Disability Class: Ambulatory Difficulty
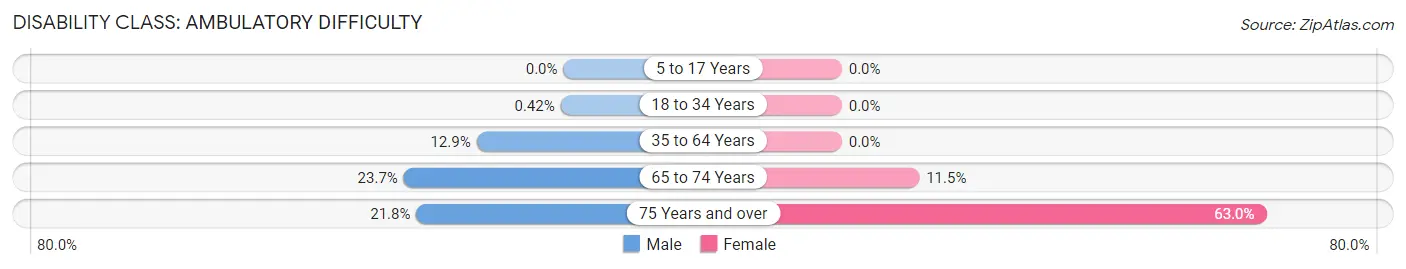
| Age Bracket | Male | Female |
| 5 to 17 Years | 0 (0.0%) | 0 (0.0%) |
| 18 to 34 Years | 2 (0.4%) | 0 (0.0%) |
| 35 to 64 Years | 64 (12.9%) | 0 (0.0%) |
| 65 to 74 Years | 23 (23.7%) | 13 (11.5%) |
| 75 Years and over | 19 (21.8%) | 29 (63.0%) |
Disability Class: Self-Care Difficulty
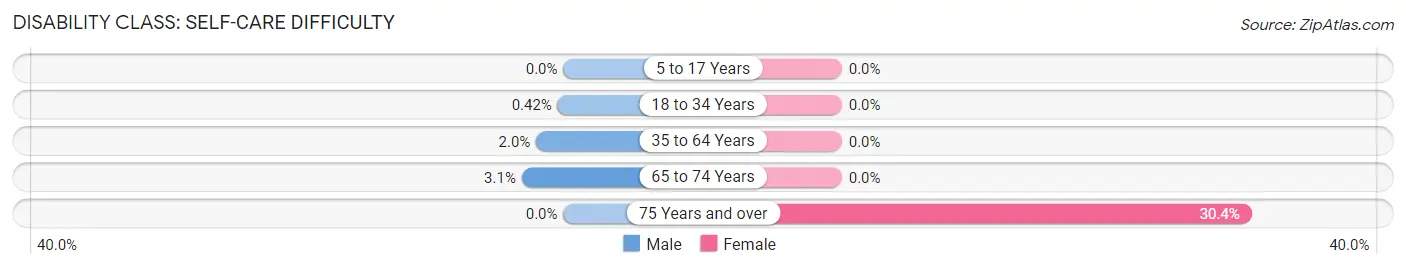
| Age Bracket | Male | Female |
| 5 to 17 Years | 0 (0.0%) | 0 (0.0%) |
| 18 to 34 Years | 2 (0.4%) | 0 (0.0%) |
| 35 to 64 Years | 10 (2.0%) | 0 (0.0%) |
| 65 to 74 Years | 3 (3.1%) | 0 (0.0%) |
| 75 Years and over | 0 (0.0%) | 14 (30.4%) |
Technology Access in Haw River
Computing Device Access in Haw River
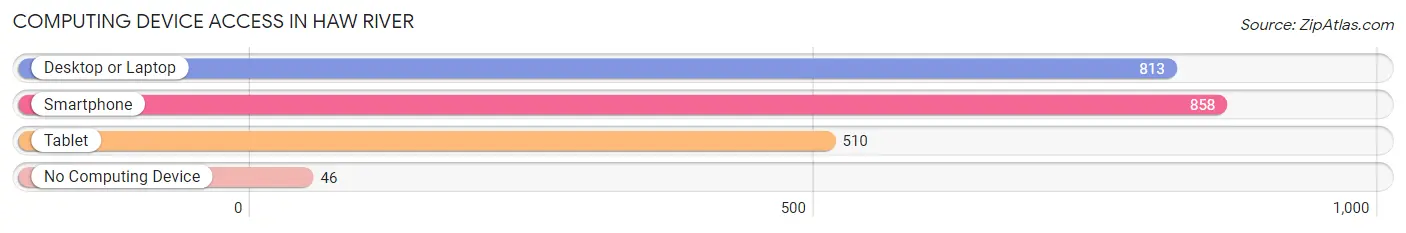
| Device Type | # Households | % Households |
| Desktop or Laptop | 813 | 82.9% |
| Smartphone | 858 | 87.5% |
| Tablet | 510 | 52.0% |
| No Computing Device | 46 | 4.7% |
| Total | 981 | 100.0% |
Internet Access in Haw River
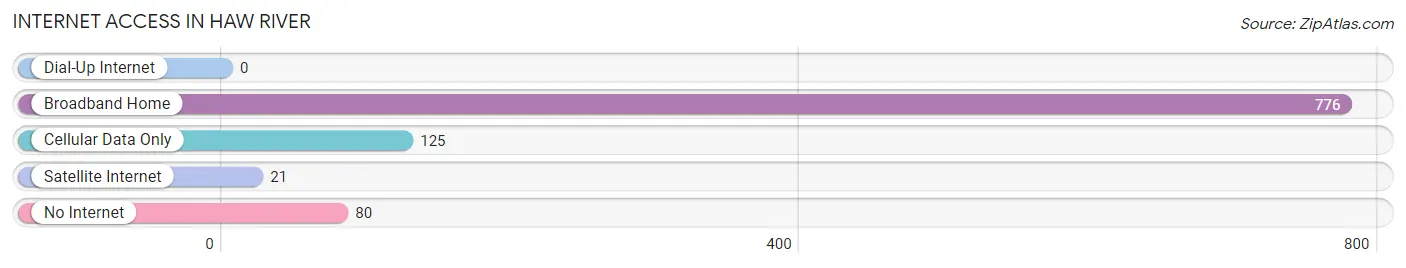
| Internet Type | # Households | % Households |
| Dial-Up Internet | 0 | 0.0% |
| Broadband Home | 776 | 79.1% |
| Cellular Data Only | 125 | 12.7% |
| Satellite Internet | 21 | 2.1% |
| No Internet | 80 | 8.2% |
| Total | 981 | 100.0% |
Haw River Summary
The town of Haw River, North Carolina is located in Alamance County, in the Piedmont region of the state. It is situated along the banks of the Haw River, which is a tributary of the Cape Fear River. The town was founded in 1881 and was named after the river. The population of Haw River was estimated to be 2,845 in 2019.
Geography
Haw River is located in the Piedmont region of North Carolina, which is characterized by rolling hills and valleys. The town is situated along the banks of the Haw River, which is a tributary of the Cape Fear River. The town is located approximately 20 miles east of Greensboro and 40 miles west of Raleigh. The town is also located near the cities of Burlington and Graham.
The climate in Haw River is humid subtropical, with hot, humid summers and mild winters. The average annual temperature is around 60 degrees Fahrenheit. The average annual precipitation is around 45 inches.
Economy
The economy of Haw River is largely based on manufacturing and agriculture. The town is home to several manufacturing companies, including Haw River Furniture, Haw River Textiles, and Haw River Mills. The town is also home to several agricultural businesses, including dairy farms, poultry farms, and vegetable farms.
The town is also home to several retail businesses, including grocery stores, restaurants, and clothing stores. The town is also home to several medical facilities, including a hospital and several clinics.
Demographics
The population of Haw River was estimated to be 2,845 in 2019. The population is predominantly white, with African Americans making up the second largest racial group. The median household income in Haw River is $45,000, and the median home value is $150,000.
The town is served by the Alamance-Burlington School System, which includes several elementary, middle, and high schools. The town is also home to several churches, including the Haw River United Methodist Church and the Haw River Baptist Church.
History
The town of Haw River was founded in 1881 and was named after the river. The town was originally a small farming community, but it began to grow in the early 20th century when several manufacturing companies moved to the area. The town was also home to several mills, which provided employment for many of the town’s residents.
The town experienced a period of growth in the 1950s and 1960s, when several new businesses opened in the area. The town also experienced a period of decline in the 1970s and 1980s, when several of the town’s manufacturing companies closed.
The town has experienced a period of revitalization in recent years, with several new businesses opening in the area. The town is also home to several parks and recreational facilities, including the Haw River State Park. The town is also home to several historic sites, including the Haw River Historic District.
Common Questions
What is Per Capita Income in Haw River?
Per Capita income in Haw River is $22,774.
What is the Median Family Income in Haw River?
Median Family Income in Haw River is $72,632.
What is the Median Household income in Haw River?
Median Household Income in Haw River is $57,404.
What is Income or Wage Gap in Haw River?
Income or Wage Gap in Haw River is 28.1%.
Women in Haw River earn 71.9 cents for every dollar earned by a man.
What is Inequality or Gini Index in Haw River?
Inequality or Gini Index in Haw River is 0.44.
What is the Total Population of Haw River?
Total Population of Haw River is 2,894.
What is the Total Male Population of Haw River?
Total Male Population of Haw River is 1,547.
What is the Total Female Population of Haw River?
Total Female Population of Haw River is 1,347.
What is the Ratio of Males per 100 Females in Haw River?
There are 114.85 Males per 100 Females in Haw River.
What is the Ratio of Females per 100 Males in Haw River?
There are 87.07 Females per 100 Males in Haw River.
What is the Median Population Age in Haw River?
Median Population Age in Haw River is 29.1 Years.
What is the Average Family Size in Haw River
Average Family Size in Haw River is 3.6 People.
What is the Average Household Size in Haw River
Average Household Size in Haw River is 2.9 People.
How Large is the Labor Force in Haw River?
There are 1,504 People in the Labor Forcein in Haw River.
What is the Percentage of People in the Labor Force in Haw River?
68.5% of People are in the Labor Force in Haw River.
What is the Unemployment Rate in Haw River?
Unemployment Rate in Haw River is 4.4%.