Robbinsville, NC Map & Demographics
Robbinsville Map
Robbinsville Overview
$14,606
PER CAPITA INCOME
$28,750
AVG FAMILY INCOME
$17,222
AVG HOUSEHOLD INCOME
36.3%
WAGE / INCOME GAP [ % ]
63.7¢/ $1
WAGE / INCOME GAP [ $ ]
0.46
INEQUALITY / GINI INDEX
705
TOTAL POPULATION
303
MALE POPULATION
402
FEMALE POPULATION
75.37
MALES / 100 FEMALES
132.67
FEMALES / 100 MALES
54.9
MEDIAN AGE
2.8
AVG FAMILY SIZE
1.8
AVG HOUSEHOLD SIZE
201
LABOR FORCE [ PEOPLE ]
32.6%
PERCENT IN LABOR FORCE
2.5%
UNEMPLOYMENT RATE
Robbinsville Zip Codes
Robbinsville Area Codes
Income in Robbinsville
Income Overview in Robbinsville
Per Capita Income in Robbinsville is $14,606, while median incomes of families and households are $28,750 and $17,222 respectively.
| Characteristic | Number | Measure |
| Per Capita Income | 705 | $14,606 |
| Median Family Income | 124 | $28,750 |
| Mean Family Income | 124 | $35,323 |
| Median Household Income | 336 | $17,222 |
| Mean Household Income | 336 | $25,117 |
| Income Deficit | 124 | $0 |
| Wage / Income Gap (%) | 705 | 36.29% |
| Wage / Income Gap ($) | 705 | 63.71¢ per $1 |
| Gini / Inequality Index | 705 | 0.46 |
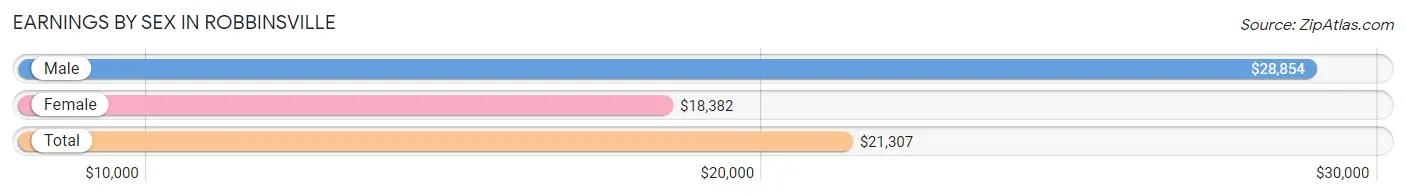
Earnings by Sex in Robbinsville
Average Earnings in Robbinsville are $21,307, $28,854 for men and $18,382 for women, a difference of 36.3%.
| Sex | Number | Average Earnings |
| Male | 97 (46.4%) | $28,854 |
| Female | 112 (53.6%) | $18,382 |
| Total | 209 (100.0%) | $21,307 |
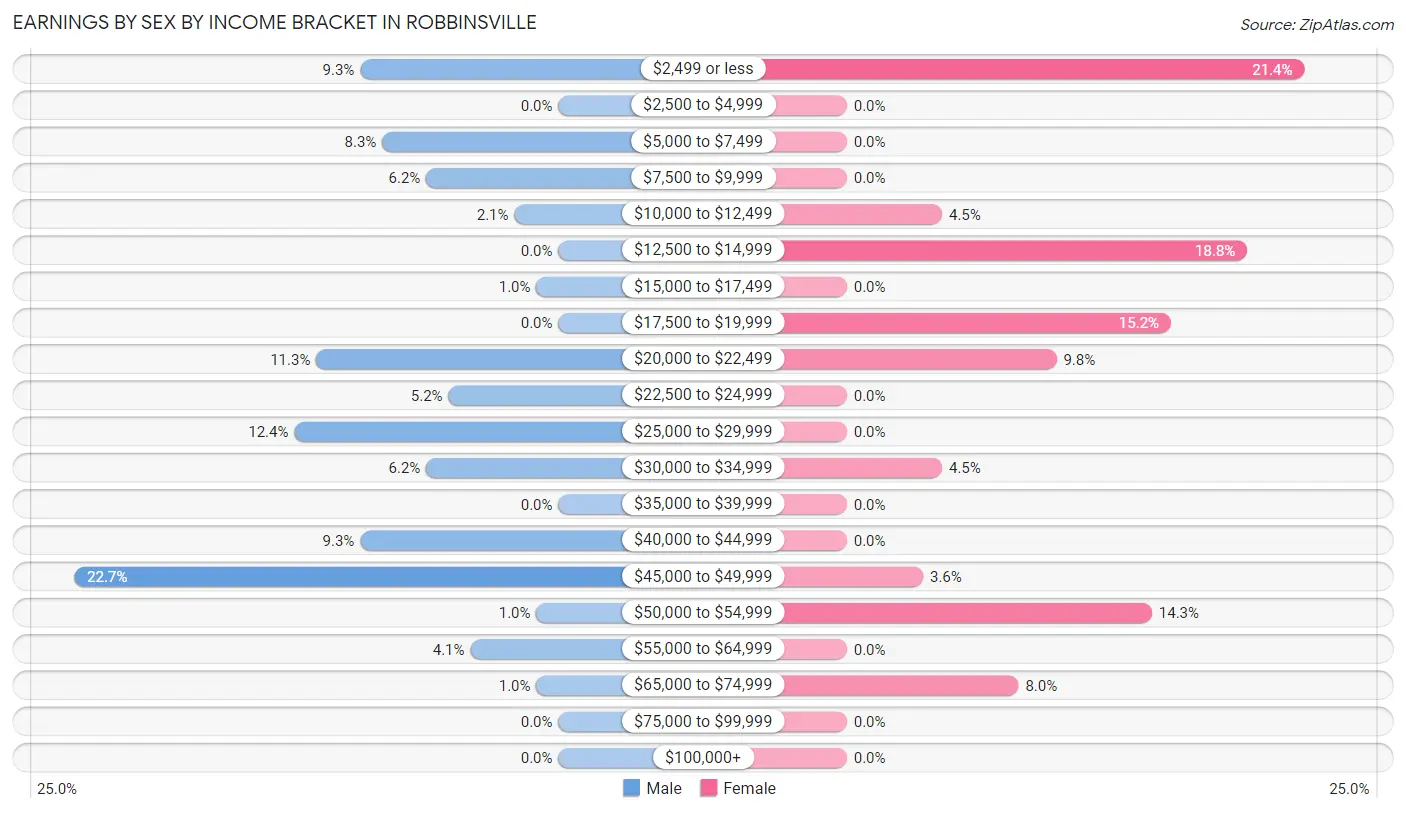
Earnings by Sex by Income Bracket in Robbinsville
The most common earnings brackets in Robbinsville are $45,000 to $49,999 for men (22 | 22.7%) and $2,499 or less for women (24 | 21.4%).
| Income | Male | Female |
| $2,499 or less | 9 (9.3%) | 24 (21.4%) |
| $2,500 to $4,999 | 0 (0.0%) | 0 (0.0%) |
| $5,000 to $7,499 | 8 (8.3%) | 0 (0.0%) |
| $7,500 to $9,999 | 6 (6.2%) | 0 (0.0%) |
| $10,000 to $12,499 | 2 (2.1%) | 5 (4.5%) |
| $12,500 to $14,999 | 0 (0.0%) | 21 (18.8%) |
| $15,000 to $17,499 | 1 (1.0%) | 0 (0.0%) |
| $17,500 to $19,999 | 0 (0.0%) | 17 (15.2%) |
| $20,000 to $22,499 | 11 (11.3%) | 11 (9.8%) |
| $22,500 to $24,999 | 5 (5.1%) | 0 (0.0%) |
| $25,000 to $29,999 | 12 (12.4%) | 0 (0.0%) |
| $30,000 to $34,999 | 6 (6.2%) | 5 (4.5%) |
| $35,000 to $39,999 | 0 (0.0%) | 0 (0.0%) |
| $40,000 to $44,999 | 9 (9.3%) | 0 (0.0%) |
| $45,000 to $49,999 | 22 (22.7%) | 4 (3.6%) |
| $50,000 to $54,999 | 1 (1.0%) | 16 (14.3%) |
| $55,000 to $64,999 | 4 (4.1%) | 0 (0.0%) |
| $65,000 to $74,999 | 1 (1.0%) | 9 (8.0%) |
| $75,000 to $99,999 | 0 (0.0%) | 0 (0.0%) |
| $100,000+ | 0 (0.0%) | 0 (0.0%) |
| Total | 97 (100.0%) | 112 (100.0%) |
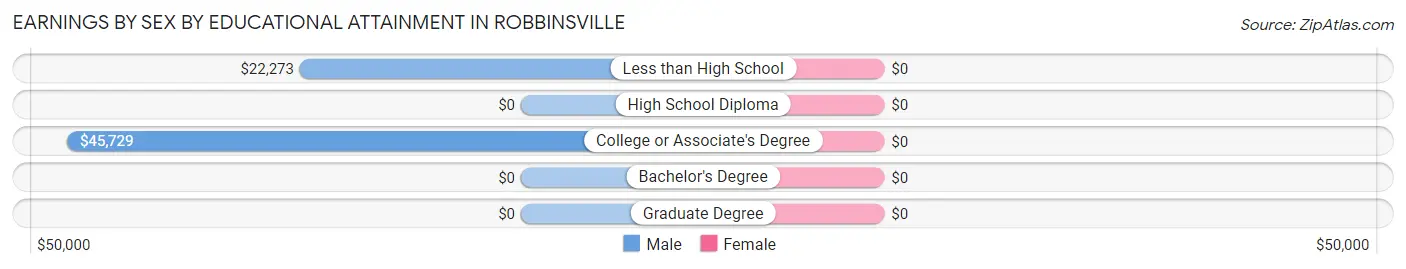
Earnings by Sex by Educational Attainment in Robbinsville
| Educational Attainment | Male Income | Female Income |
| Less than High School | $22,273 | $0 |
| High School Diploma | - | - |
| College or Associate's Degree | $45,729 | $0 |
| Bachelor's Degree | - | - |
| Graduate Degree | - | - |
| Total | $27,813 | $0 |
Family Income in Robbinsville
Family Income Brackets in Robbinsville
According to the Robbinsville family income data, there are 37 families falling into the $15,000 to $24,999 income range, which is the most common income bracket and makes up 29.8% of all families.

| Income Bracket | # Families | % Families |
| Less than $10,000 | 15 | 12.1% |
| $10,000 to $14,999 | 2 | 1.6% |
| $15,000 to $24,999 | 37 | 29.8% |
| $25,000 to $34,999 | 20 | 16.1% |
| $35,000 to $49,999 | 19 | 15.3% |
| $50,000 to $74,999 | 18 | 14.5% |
| $75,000 to $99,999 | 9 | 7.3% |
| $100,000 to $149,999 | 4 | 3.2% |
| $150,000 to $199,999 | 0 | 0.0% |
| $200,000+ | 0 | 0.0% |
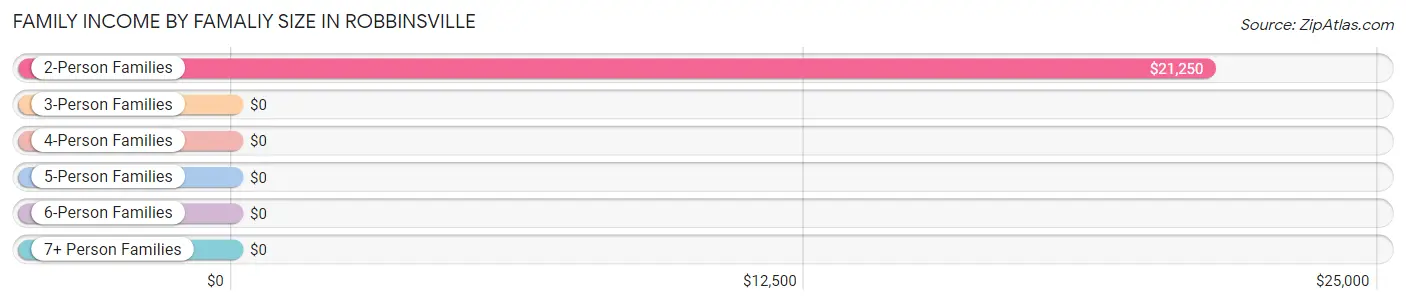
Family Income by Famaliy Size in Robbinsville
2-person families (67 | 54.0%) account for the highest median family income in Robbinsville with $21,250 per family, while 2-person families (67 | 54.0%) have the highest median income of $10,625 per family member.
| Income Bracket | # Families | Median Income |
| 2-Person Families | 67 (54.0%) | $21,250 |
| 3-Person Families | 45 (36.3%) | $0 |
| 4-Person Families | 12 (9.7%) | $0 |
| 5-Person Families | 0 (0.0%) | $0 |
| 6-Person Families | 0 (0.0%) | $0 |
| 7+ Person Families | 0 (0.0%) | $0 |
| Total | 124 (100.0%) | $28,750 |
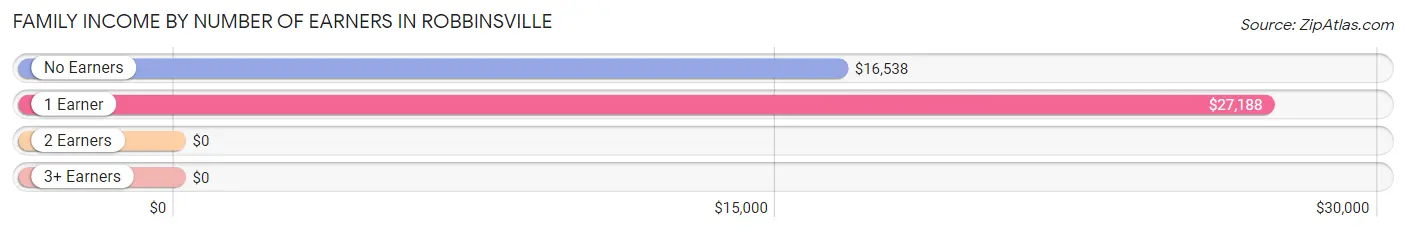
Family Income by Number of Earners in Robbinsville
| Number of Earners | # Families | Median Income |
| No Earners | 50 (40.3%) | $16,538 |
| 1 Earner | 52 (41.9%) | $27,188 |
| 2 Earners | 22 (17.7%) | $0 |
| 3+ Earners | 0 (0.0%) | $0 |
| Total | 124 (100.0%) | $28,750 |
Household Income in Robbinsville
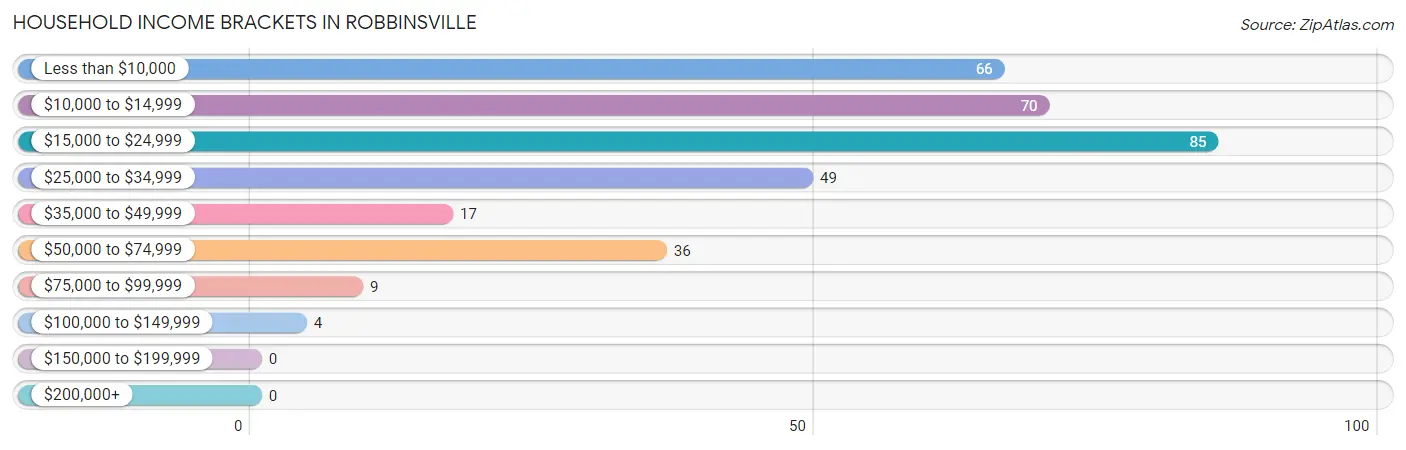
Household Income Brackets in Robbinsville
With 85 households falling in the category, the $15,000 to $24,999 income range is the most frequent in Robbinsville, accounting for 25.3% of all households.
| Income Bracket | # Households | % Households |
| Less than $10,000 | 66 | 19.6% |
| $10,000 to $14,999 | 70 | 20.8% |
| $15,000 to $24,999 | 85 | 25.3% |
| $25,000 to $34,999 | 49 | 14.6% |
| $35,000 to $49,999 | 17 | 5.1% |
| $50,000 to $74,999 | 36 | 10.7% |
| $75,000 to $99,999 | 9 | 2.7% |
| $100,000 to $149,999 | 4 | 1.2% |
| $150,000 to $199,999 | 0 | 0.0% |
| $200,000+ | 0 | 0.0% |
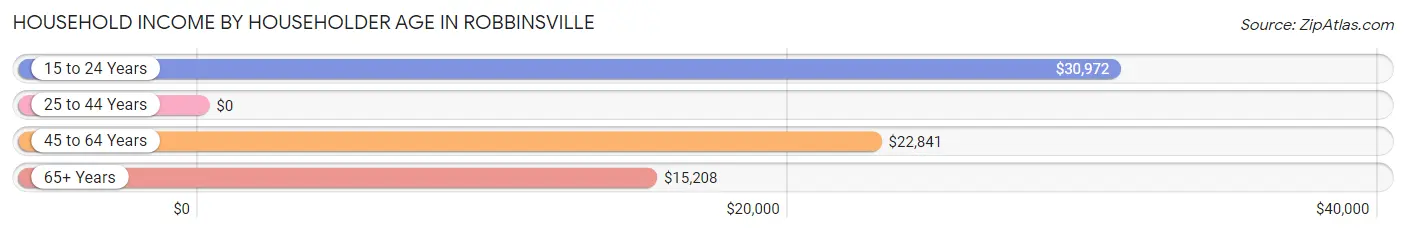
Household Income by Householder Age in Robbinsville
The median household income in Robbinsville is $17,222, with the highest median household income of $30,972 found in the 15 to 24 years age bracket for the primary householder. A total of 29 households (8.6%) fall into this category. Meanwhile, the 25 to 44 years age bracket for the primary householder has the lowest median household income of $0, with 69 households (20.5%) in this group.
| Income Bracket | # Households | Median Income |
| 15 to 24 Years | 29 (8.6%) | $30,972 |
| 25 to 44 Years | 69 (20.5%) | $0 |
| 45 to 64 Years | 130 (38.7%) | $22,841 |
| 65+ Years | 108 (32.1%) | $15,208 |
| Total | 336 (100.0%) | $17,222 |
Poverty in Robbinsville
Income Below Poverty by Sex and Age in Robbinsville
With 27.6% poverty level for males and 50.6% for females among the residents of Robbinsville, 35 to 44 year old males and 45 to 54 year old females are the most vulnerable to poverty, with 13 males (52.0%) and 33 females (68.8%) in their respective age groups living below the poverty level.
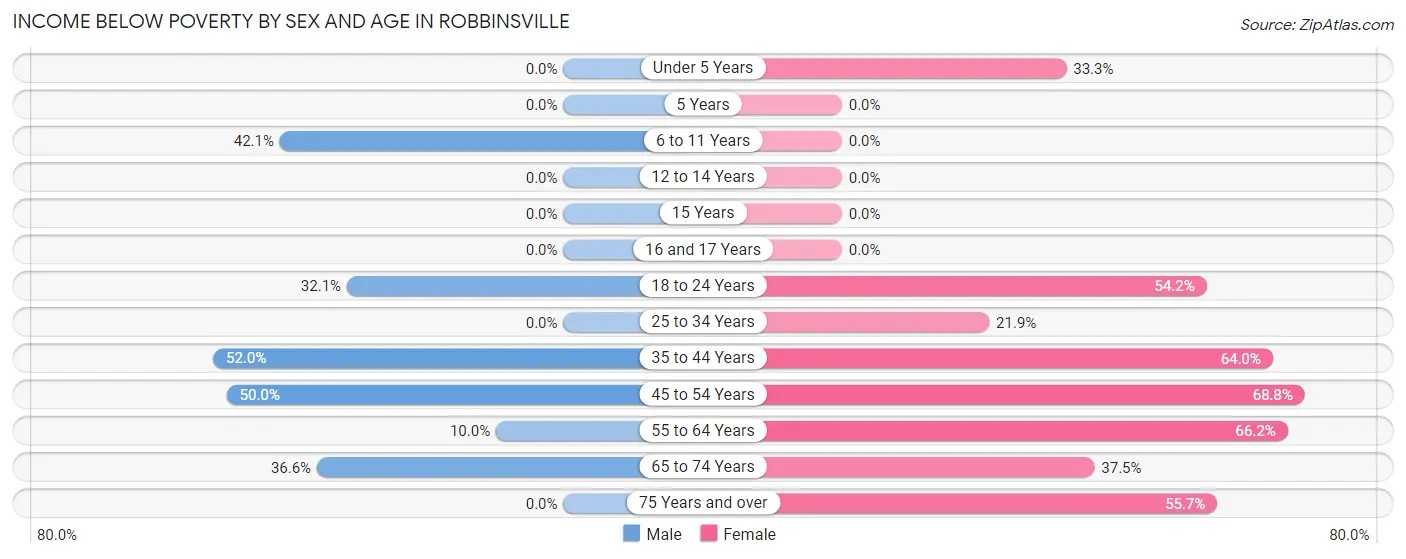
| Age Bracket | Male | Female |
| Under 5 Years | 0 (0.0%) | 11 (33.3%) |
| 5 Years | 0 (0.0%) | 0 (0.0%) |
| 6 to 11 Years | 16 (42.1%) | 0 (0.0%) |
| 12 to 14 Years | 0 (0.0%) | 0 (0.0%) |
| 15 Years | 0 (0.0%) | 0 (0.0%) |
| 16 and 17 Years | 0 (0.0%) | 0 (0.0%) |
| 18 to 24 Years | 9 (32.1%) | 13 (54.2%) |
| 25 to 34 Years | 0 (0.0%) | 7 (21.9%) |
| 35 to 44 Years | 13 (52.0%) | 16 (64.0%) |
| 45 to 54 Years | 11 (50.0%) | 33 (68.8%) |
| 55 to 64 Years | 6 (10.0%) | 47 (66.2%) |
| 65 to 74 Years | 15 (36.6%) | 12 (37.5%) |
| 75 Years and over | 0 (0.0%) | 34 (55.7%) |
| Total | 70 (27.6%) | 173 (50.6%) |
Income Above Poverty by Sex and Age in Robbinsville
According to the poverty statistics in Robbinsville, males aged under 5 years and females aged 6 to 11 years are the age groups that are most secure financially, with 100.0% of males and 100.0% of females in these age groups living above the poverty line.
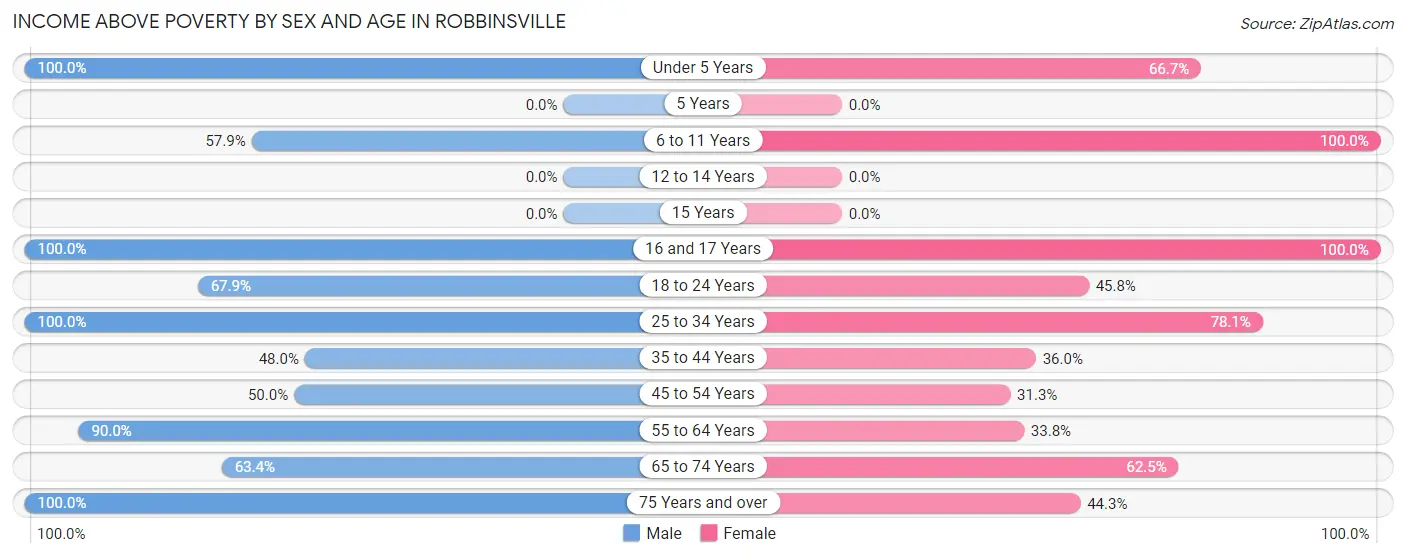
| Age Bracket | Male | Female |
| Under 5 Years | 10 (100.0%) | 22 (66.7%) |
| 5 Years | 0 (0.0%) | 0 (0.0%) |
| 6 to 11 Years | 22 (57.9%) | 8 (100.0%) |
| 12 to 14 Years | 0 (0.0%) | 0 (0.0%) |
| 15 Years | 0 (0.0%) | 0 (0.0%) |
| 16 and 17 Years | 9 (100.0%) | 8 (100.0%) |
| 18 to 24 Years | 19 (67.9%) | 11 (45.8%) |
| 25 to 34 Years | 18 (100.0%) | 25 (78.1%) |
| 35 to 44 Years | 12 (48.0%) | 9 (36.0%) |
| 45 to 54 Years | 11 (50.0%) | 15 (31.2%) |
| 55 to 64 Years | 54 (90.0%) | 24 (33.8%) |
| 65 to 74 Years | 26 (63.4%) | 20 (62.5%) |
| 75 Years and over | 3 (100.0%) | 27 (44.3%) |
| Total | 184 (72.4%) | 169 (49.4%) |
Income Below Poverty Among Married-Couple Families in Robbinsville
The poverty statistics for married-couple families in Robbinsville show that 17.5% or 10 of the total 57 families live below the poverty line. Families with 1 or 2 children have the highest poverty rate of 20.0%, comprising of 8 families. On the other hand, families with no children have the lowest poverty rate of 11.8%, which includes 2 families.
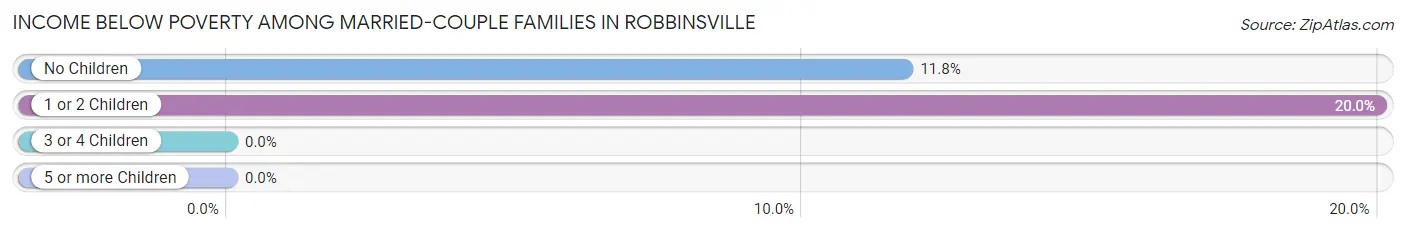
| Children | Above Poverty | Below Poverty |
| No Children | 15 (88.2%) | 2 (11.8%) |
| 1 or 2 Children | 32 (80.0%) | 8 (20.0%) |
| 3 or 4 Children | 0 (0.0%) | 0 (0.0%) |
| 5 or more Children | 0 (0.0%) | 0 (0.0%) |
| Total | 47 (82.5%) | 10 (17.5%) |
Income Below Poverty Among Single-Parent Households in Robbinsville
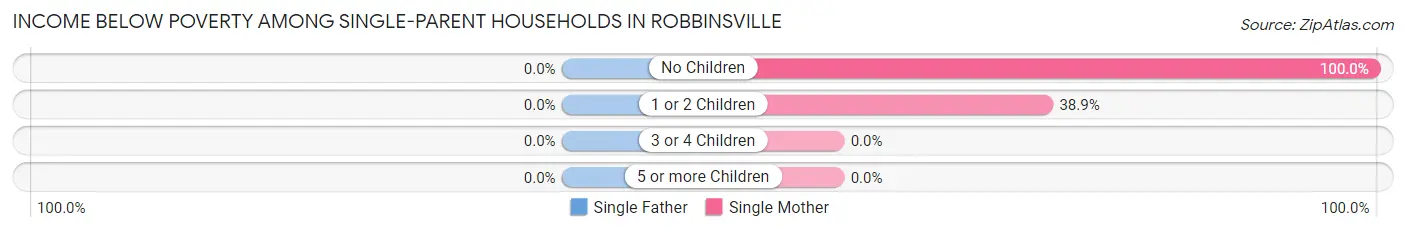
| Children | Single Father | Single Mother |
| No Children | 0 (0.0%) | 26 (100.0%) |
| 1 or 2 Children | 0 (0.0%) | 7 (38.9%) |
| 3 or 4 Children | 0 (0.0%) | 0 (0.0%) |
| 5 or more Children | 0 (0.0%) | 0 (0.0%) |
| Total | 0 (0.0%) | 33 (75.0%) |
Income Below Poverty Among Married-Couple vs Single-Parent Households in Robbinsville
The poverty data for Robbinsville shows that 10 of the married-couple family households (17.5%) and 33 of the single-parent households (49.2%) are living below the poverty level. Within the married-couple family households, those with 1 or 2 children have the highest poverty rate, with 8 households (20.0%) falling below the poverty line. Among the single-parent households, those with no children have the highest poverty rate, with 26 household (81.2%) living below poverty.
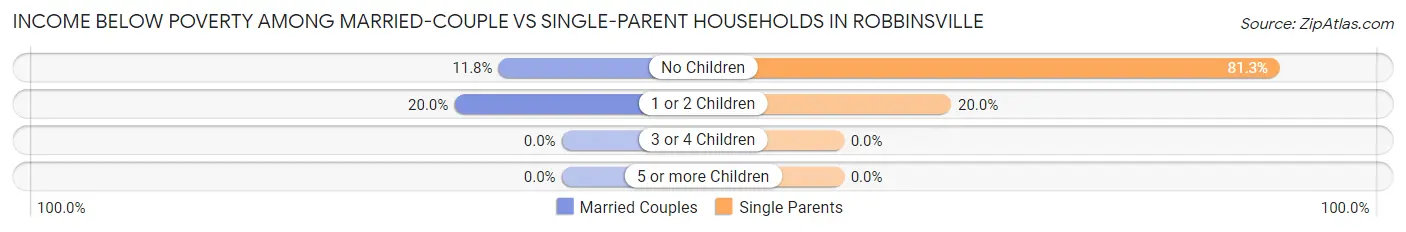
| Children | Married-Couple Families | Single-Parent Households |
| No Children | 2 (11.8%) | 26 (81.2%) |
| 1 or 2 Children | 8 (20.0%) | 7 (20.0%) |
| 3 or 4 Children | 0 (0.0%) | 0 (0.0%) |
| 5 or more Children | 0 (0.0%) | 0 (0.0%) |
| Total | 10 (17.5%) | 33 (49.2%) |
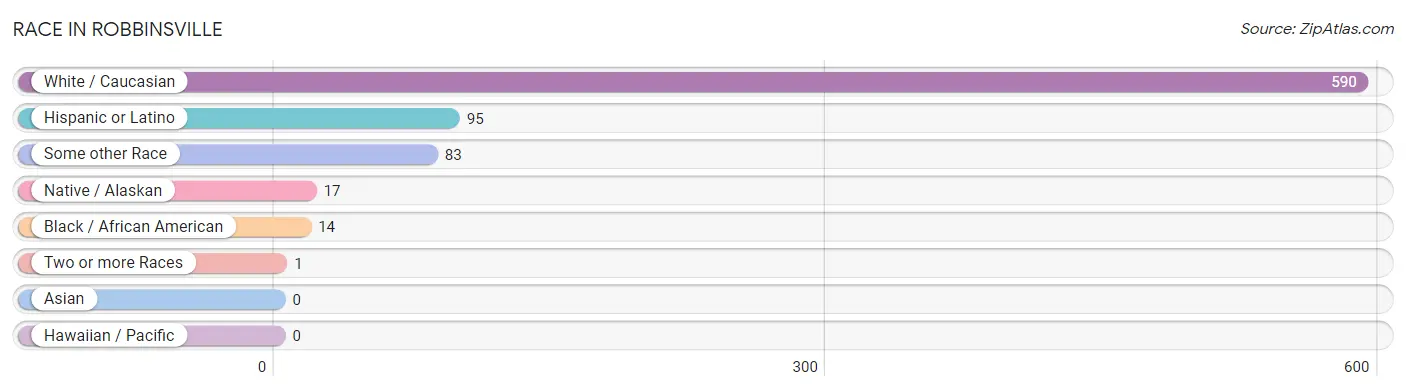
Race in Robbinsville
The most populous races in Robbinsville are White / Caucasian (590 | 83.7%), Hispanic or Latino (95 | 13.5%), and Some other Race (83 | 11.8%).
| Race | # Population | % Population |
| Asian | 0 | 0.0% |
| Black / African American | 14 | 2.0% |
| Hawaiian / Pacific | 0 | 0.0% |
| Hispanic or Latino | 95 | 13.5% |
| Native / Alaskan | 17 | 2.4% |
| White / Caucasian | 590 | 83.7% |
| Two or more Races | 1 | 0.1% |
| Some other Race | 83 | 11.8% |
| Total | 705 | 100.0% |
Ancestry in Robbinsville
The most populous ancestries reported in Robbinsville are American (431 | 61.1%), Mexican (57 | 8.1%), Irish (44 | 6.2%), Central American (37 | 5.2%), and Honduran (37 | 5.2%), together accounting for 86.0% of all Robbinsville residents.
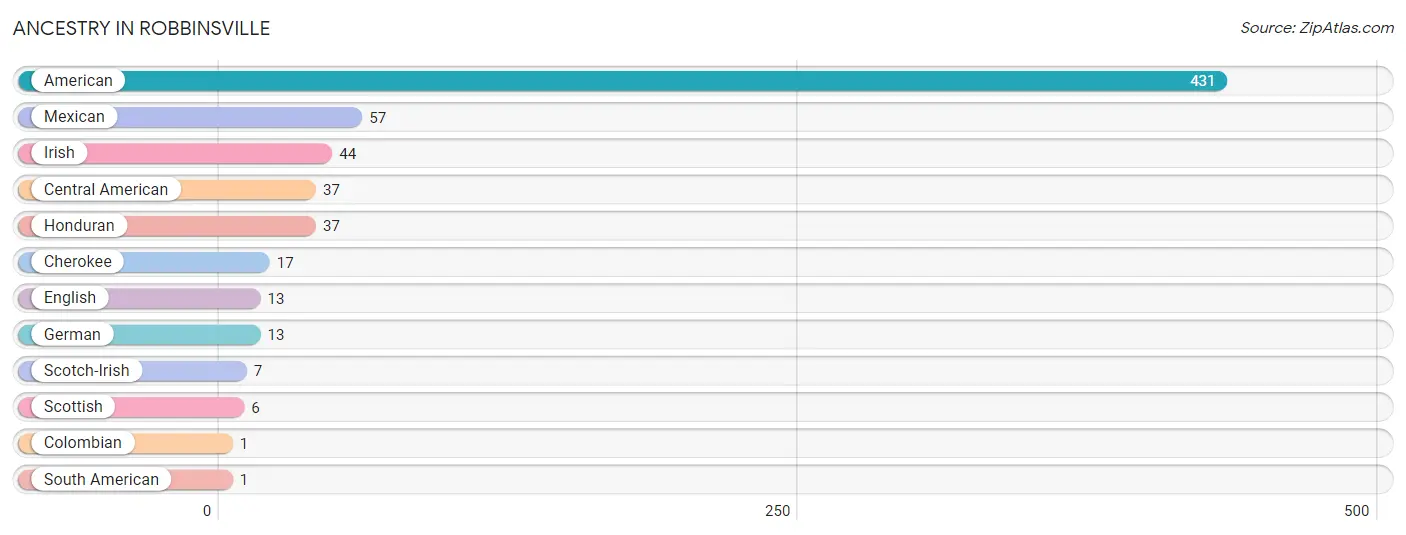
| Ancestry | # Population | % Population |
| American | 431 | 61.1% |
| Central American | 37 | 5.2% |
| Cherokee | 17 | 2.4% |
| Colombian | 1 | 0.1% |
| English | 13 | 1.8% |
| German | 13 | 1.8% |
| Honduran | 37 | 5.2% |
| Irish | 44 | 6.2% |
| Mexican | 57 | 8.1% |
| Scotch-Irish | 7 | 1.0% |
| Scottish | 6 | 0.9% |
| South American | 1 | 0.1% | View All 12 Rows |
Immigrants in Robbinsville
The most numerous immigrant groups reported in Robbinsville came from Central America (59 | 8.4%), Latin America (59 | 8.4%), Mexico (46 | 6.5%), and Honduras (13 | 1.8%), together accounting for 25.1% of all Robbinsville residents.
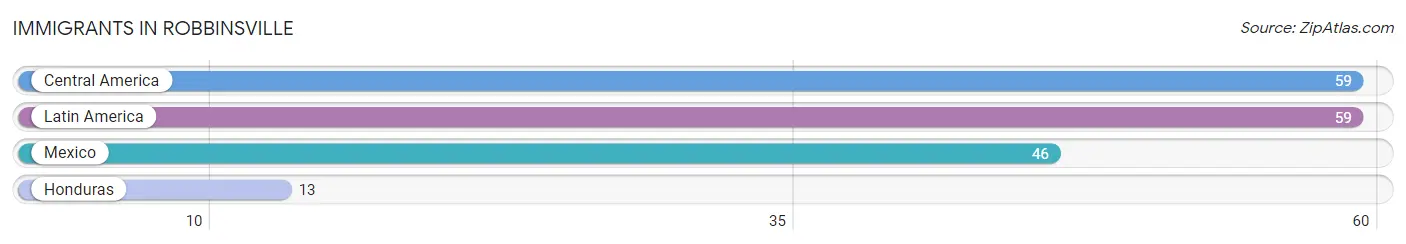
| Immigration Origin | # Population | % Population |
| Central America | 59 | 8.4% |
| Honduras | 13 | 1.8% |
| Latin America | 59 | 8.4% |
| Mexico | 46 | 6.5% | View All 4 Rows |
Sex and Age in Robbinsville
Sex and Age in Robbinsville
The most populous age groups in Robbinsville are 55 to 59 Years (42 | 13.9%) for men and 60 to 64 Years (68 | 16.9%) for women.
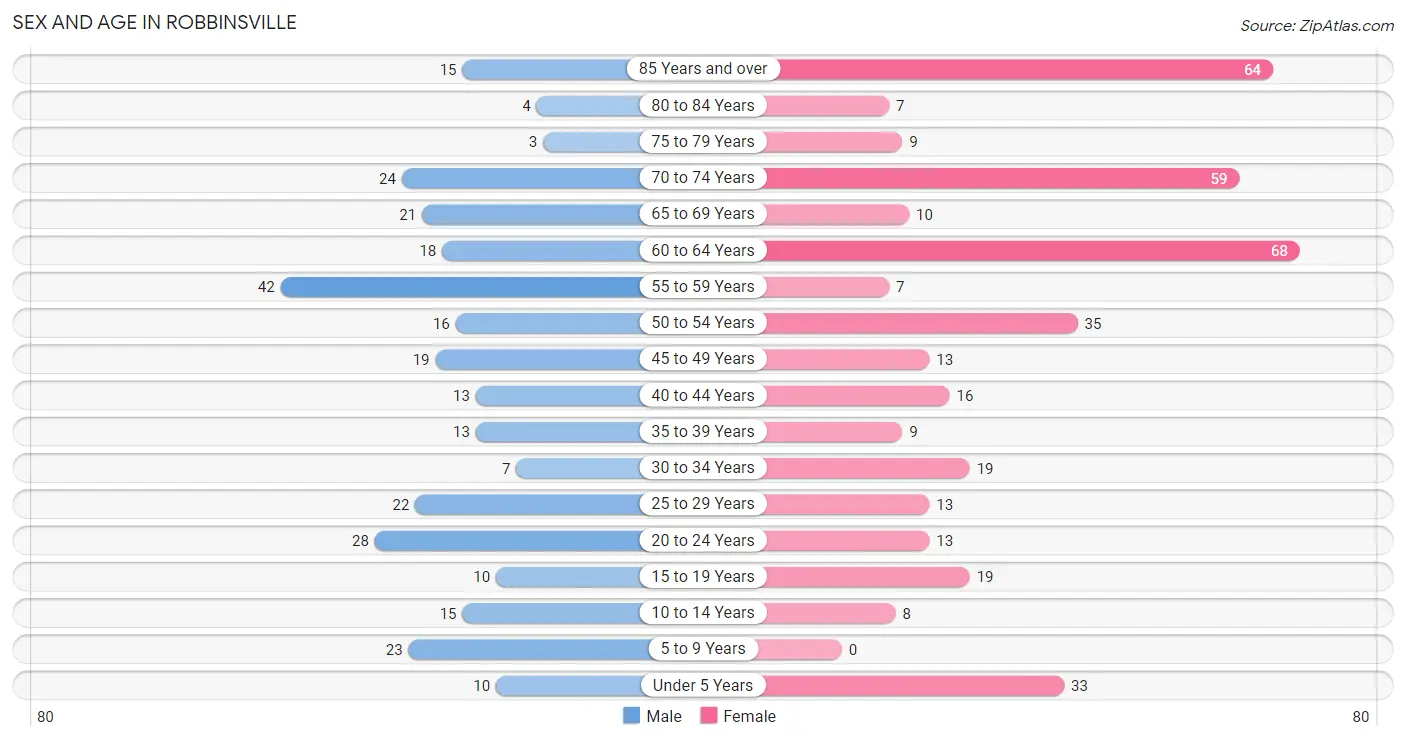
| Age Bracket | Male | Female |
| Under 5 Years | 10 (3.3%) | 33 (8.2%) |
| 5 to 9 Years | 23 (7.6%) | 0 (0.0%) |
| 10 to 14 Years | 15 (5.0%) | 8 (2.0%) |
| 15 to 19 Years | 10 (3.3%) | 19 (4.7%) |
| 20 to 24 Years | 28 (9.2%) | 13 (3.2%) |
| 25 to 29 Years | 22 (7.3%) | 13 (3.2%) |
| 30 to 34 Years | 7 (2.3%) | 19 (4.7%) |
| 35 to 39 Years | 13 (4.3%) | 9 (2.2%) |
| 40 to 44 Years | 13 (4.3%) | 16 (4.0%) |
| 45 to 49 Years | 19 (6.3%) | 13 (3.2%) |
| 50 to 54 Years | 16 (5.3%) | 35 (8.7%) |
| 55 to 59 Years | 42 (13.9%) | 7 (1.7%) |
| 60 to 64 Years | 18 (5.9%) | 68 (16.9%) |
| 65 to 69 Years | 21 (6.9%) | 10 (2.5%) |
| 70 to 74 Years | 24 (7.9%) | 59 (14.7%) |
| 75 to 79 Years | 3 (1.0%) | 9 (2.2%) |
| 80 to 84 Years | 4 (1.3%) | 7 (1.7%) |
| 85 Years and over | 15 (5.0%) | 64 (15.9%) |
| Total | 303 (100.0%) | 402 (100.0%) |
Families and Households in Robbinsville
Median Family Size in Robbinsville
The median family size in Robbinsville is 2.81 persons per family, with married-couple families (57 | 46.0%) accounting for the largest median family size of 3.19 persons per family. On the other hand, single female/mother families (44 | 35.5%) represent the smallest median family size with 2.32 persons per family.
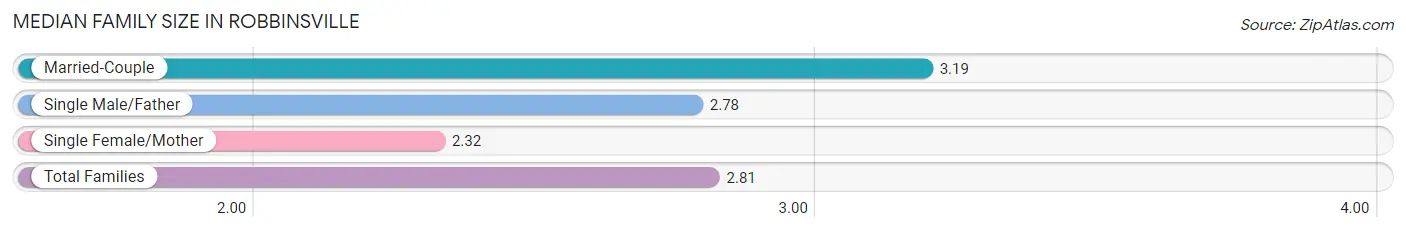
| Family Type | # Families | Family Size |
| Married-Couple | 57 (46.0%) | 3.19 |
| Single Male/Father | 23 (18.5%) | 2.78 |
| Single Female/Mother | 44 (35.5%) | 2.32 |
| Total Families | 124 (100.0%) | 2.81 |
Median Household Size in Robbinsville
The median household size in Robbinsville is 1.77 persons per household, with single male/father households (23 | 6.9%) accounting for the largest median household size of 3.52 persons per household. non-family households (212 | 63.1%) represent the smallest median household size with 1.09 persons per household.
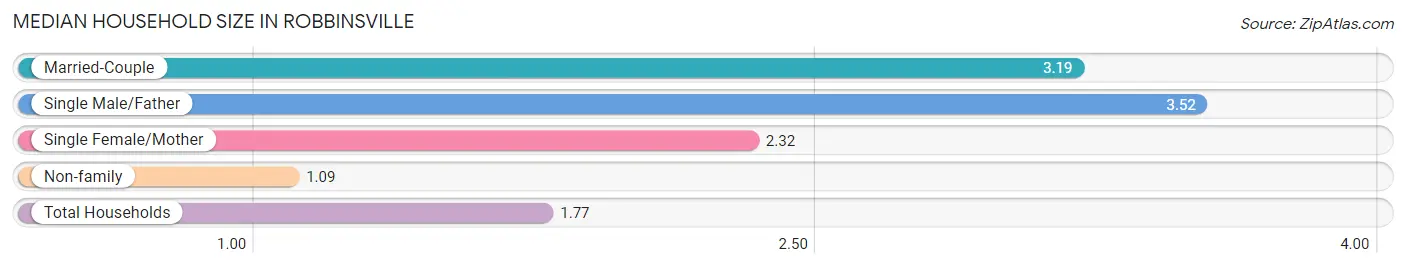
| Household Type | # Households | Household Size |
| Married-Couple | 57 (17.0%) | 3.19 |
| Single Male/Father | 23 (6.9%) | 3.52 |
| Single Female/Mother | 44 (13.1%) | 2.32 |
| Non-family | 212 (63.1%) | 1.09 |
| Total Households | 336 (100.0%) | 1.77 |
Household Size by Marriage Status in Robbinsville
Out of a total of 336 households in Robbinsville, 124 (36.9%) are family households, while 212 (63.1%) are nonfamily households. The most numerous type of family households are 3-person households, comprising 58, and the most common type of nonfamily households are 1-person households, comprising 197.
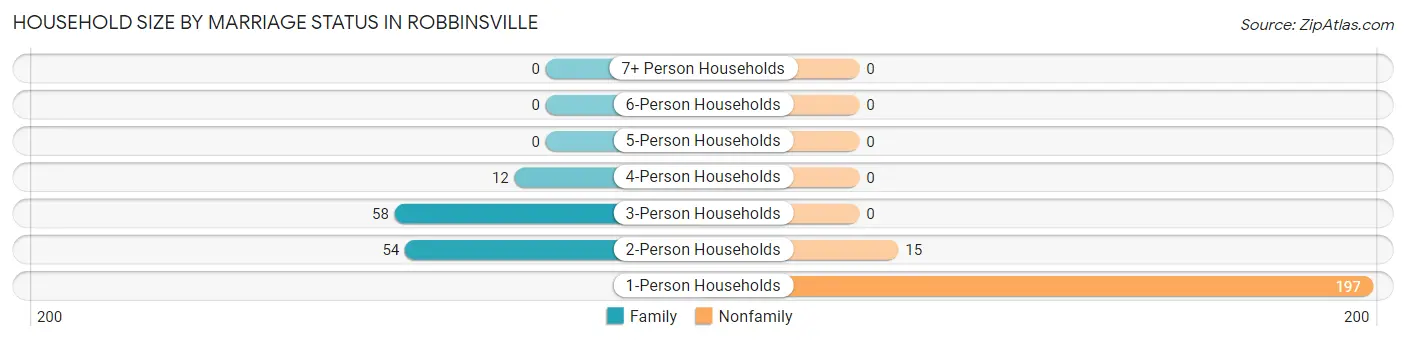
| Household Size | Family Households | Nonfamily Households |
| 1-Person Households | - | 197 (58.6%) |
| 2-Person Households | 54 (16.1%) | 15 (4.5%) |
| 3-Person Households | 58 (17.3%) | 0 (0.0%) |
| 4-Person Households | 12 (3.6%) | 0 (0.0%) |
| 5-Person Households | 0 (0.0%) | 0 (0.0%) |
| 6-Person Households | 0 (0.0%) | 0 (0.0%) |
| 7+ Person Households | 0 (0.0%) | 0 (0.0%) |
| Total | 124 (36.9%) | 212 (63.1%) |
Female Fertility in Robbinsville
Fertility by Age in Robbinsville
Average fertility rate in Robbinsville is 127.0 births per 1,000 women. Women in the age bracket of 20 to 34 years have the highest fertility rate with 289.0 births per 1,000 women. Women in the age bracket of 20 to 34 years acount for 100.0% of all women with births.
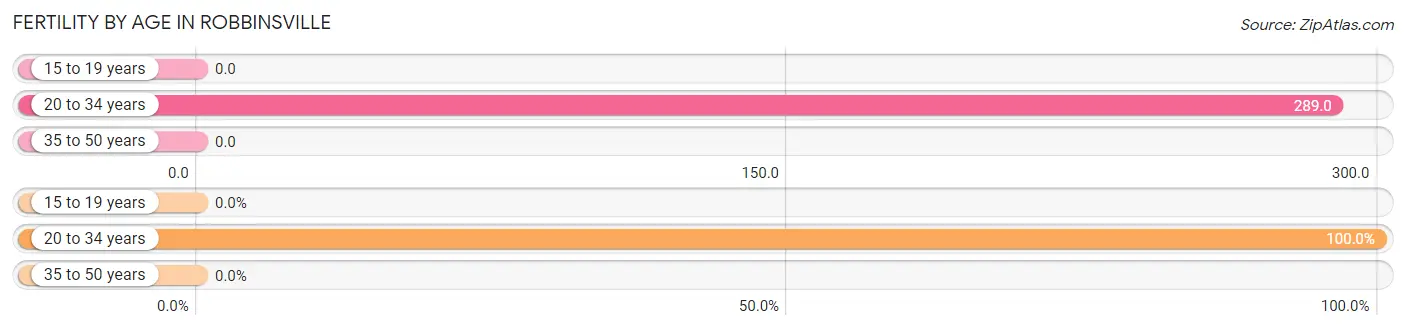
| Age Bracket | Women with Births | Births / 1,000 Women |
| 15 to 19 years | 0 (0.0%) | 0.0 |
| 20 to 34 years | 13 (100.0%) | 289.0 |
| 35 to 50 years | 0 (0.0%) | 0.0 |
| Total | 13 (100.0%) | 127.0 |
Fertility by Age by Marriage Status in Robbinsville
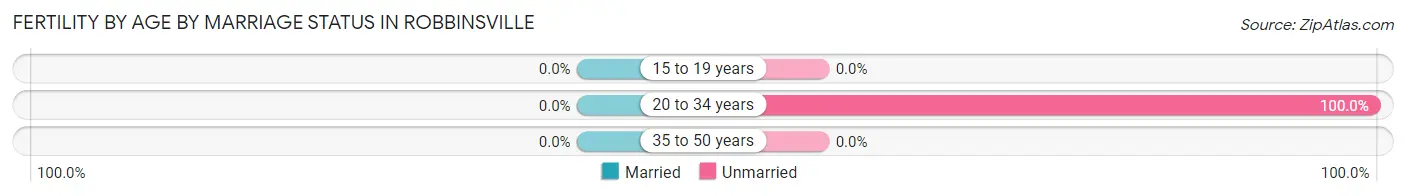
| Age Bracket | Married | Unmarried |
| 15 to 19 years | 0 (0.0%) | 0 (0.0%) |
| 20 to 34 years | 0 (0.0%) | 13 (100.0%) |
| 35 to 50 years | 0 (0.0%) | 0 (0.0%) |
| Total | 0 (0.0%) | 13 (100.0%) |
Fertility by Education in Robbinsville
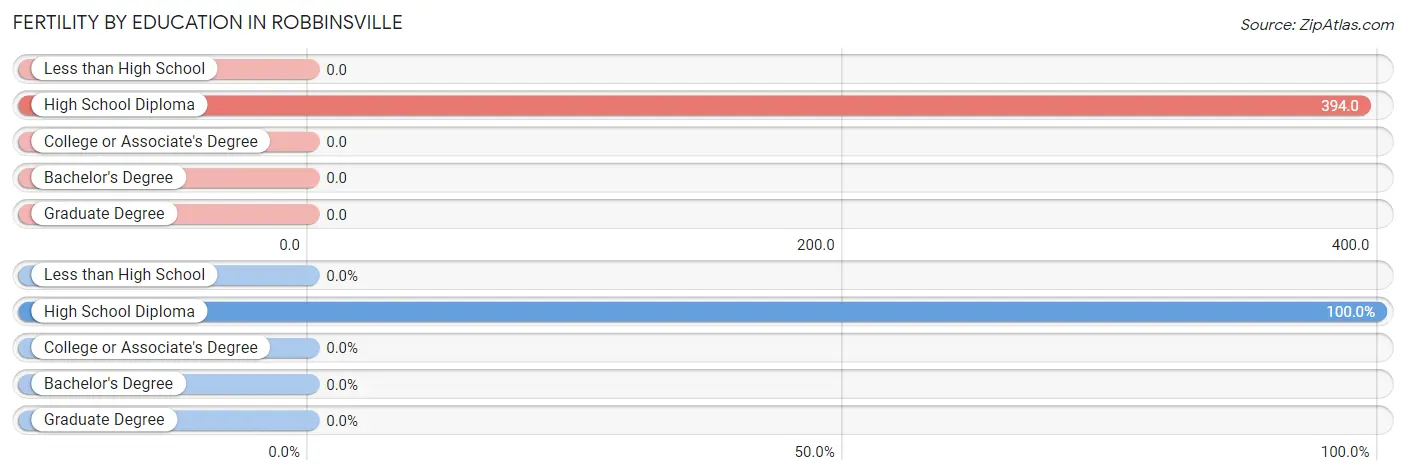
| Educational Attainment | Women with Births | Births / 1,000 Women |
| Less than High School | 0 (0.0%) | 0.0 |
| High School Diploma | 13 (100.0%) | 394.0 |
| College or Associate's Degree | 0 (0.0%) | 0.0 |
| Bachelor's Degree | 0 (0.0%) | 0.0 |
| Graduate Degree | 0 (0.0%) | 0.0 |
| Total | 13 (100.0%) | 127.0 |
Fertility by Education by Marriage Status in Robbinsville
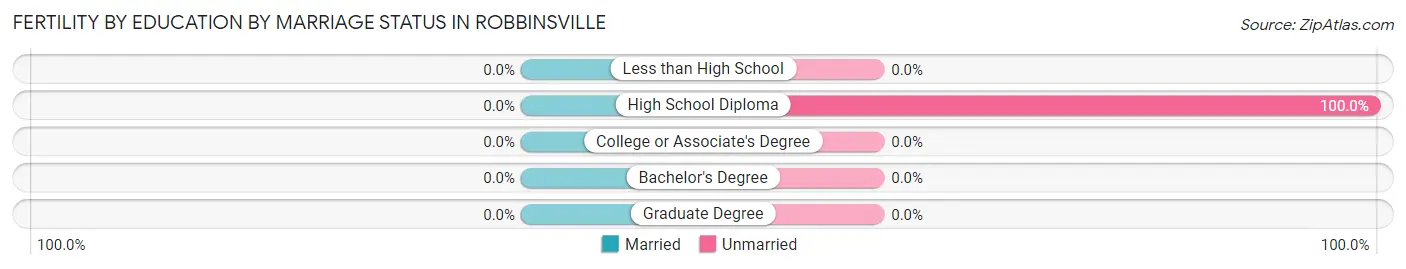
| Educational Attainment | Married | Unmarried |
| Less than High School | 0 (0.0%) | 0 (0.0%) |
| High School Diploma | 0 (0.0%) | 13 (100.0%) |
| College or Associate's Degree | 0 (0.0%) | 0 (0.0%) |
| Bachelor's Degree | 0 (0.0%) | 0 (0.0%) |
| Graduate Degree | 0 (0.0%) | 0 (0.0%) |
| Total | 0 (0.0%) | 13 (100.0%) |
Employment Characteristics in Robbinsville
Employment by Class of Employer in Robbinsville
Among the 196 employed individuals in Robbinsville, private company employees (160 | 81.6%), local government employees (20 | 10.2%), and state government employees (16 | 8.2%) make up the most common classes of employment.
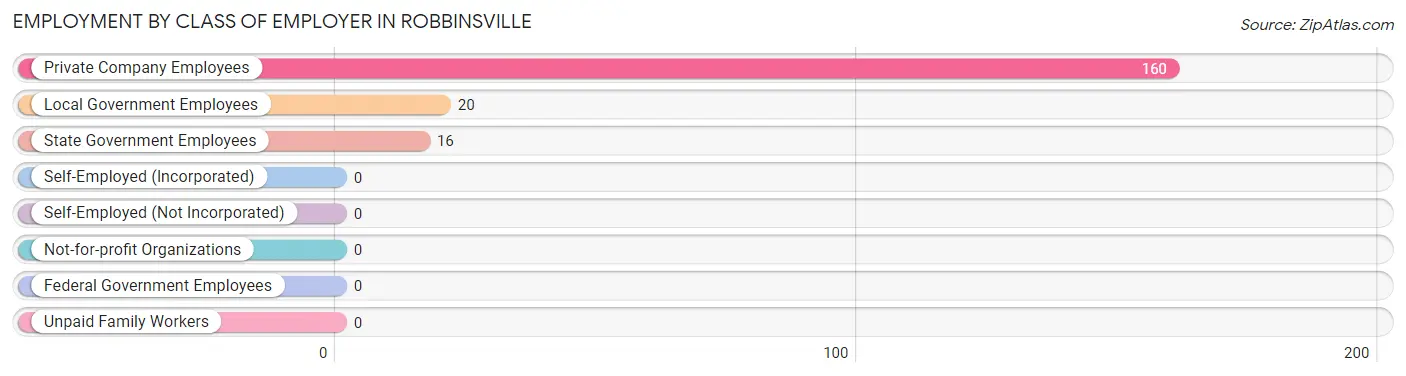
| Employer Class | # Employees | % Employees |
| Private Company Employees | 160 | 81.6% |
| Self-Employed (Incorporated) | 0 | 0.0% |
| Self-Employed (Not Incorporated) | 0 | 0.0% |
| Not-for-profit Organizations | 0 | 0.0% |
| Local Government Employees | 20 | 10.2% |
| State Government Employees | 16 | 8.2% |
| Federal Government Employees | 0 | 0.0% |
| Unpaid Family Workers | 0 | 0.0% |
| Total | 196 | 100.0% |
Employment Status by Age in Robbinsville
According to the labor force statistics for Robbinsville, out of the total population over 16 years of age (616), 32.6% or 201 individuals are in the labor force, with 2.5% or 5 of them unemployed. The age group with the highest labor force participation rate is 20 to 24 years, with 100.0% or 41 individuals in the labor force. Within the labor force, the 65 to 74 years age range has the highest percentage of unemployed individuals, with 33.3% or 5 of them being unemployed.
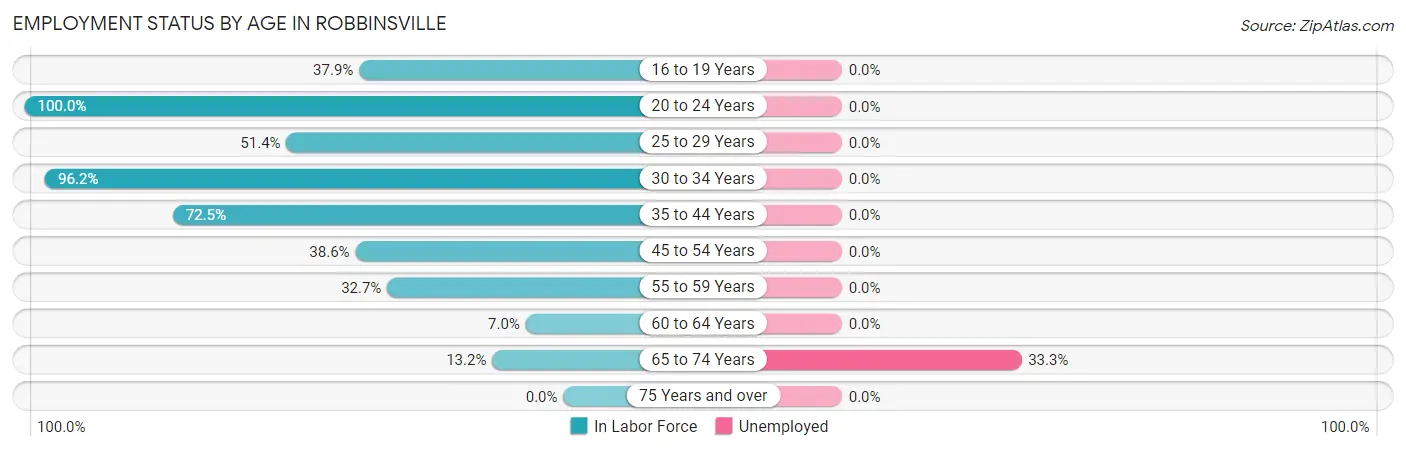
| Age Bracket | In Labor Force | Unemployed |
| 16 to 19 Years | 11 (37.9%) | 0 (0.0%) |
| 20 to 24 Years | 41 (100.0%) | 0 (0.0%) |
| 25 to 29 Years | 18 (51.4%) | 0 (0.0%) |
| 30 to 34 Years | 25 (96.2%) | 0 (0.0%) |
| 35 to 44 Years | 37 (72.5%) | 0 (0.0%) |
| 45 to 54 Years | 32 (38.6%) | 0 (0.0%) |
| 55 to 59 Years | 16 (32.7%) | 0 (0.0%) |
| 60 to 64 Years | 6 (7.0%) | 0 (0.0%) |
| 65 to 74 Years | 15 (13.2%) | 5 (33.3%) |
| 75 Years and over | 0 (0.0%) | 0 (0.0%) |
| Total | 201 (32.6%) | 5 (2.5%) |
Employment Status by Educational Attainment in Robbinsville
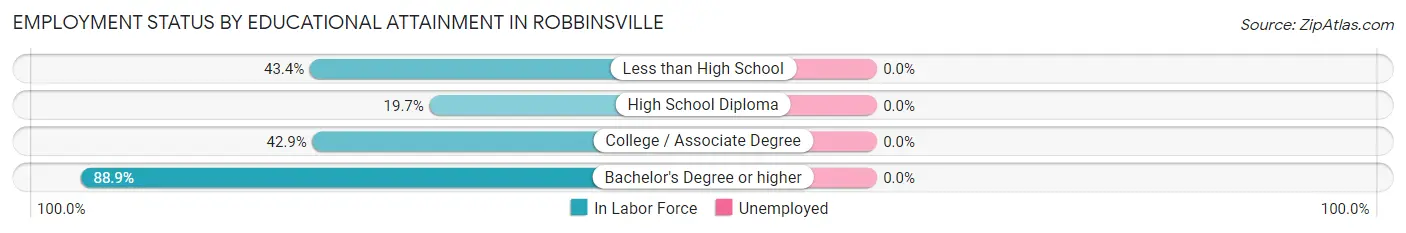
| Educational Attainment | In Labor Force | Unemployed |
| Less than High School | 56 (43.4%) | 0 (0.0%) |
| High School Diploma | 14 (19.7%) | 0 (0.0%) |
| College / Associate Degree | 48 (42.9%) | 0 (0.0%) |
| Bachelor's Degree or higher | 16 (88.9%) | 0 (0.0%) |
| Total | 134 (40.6%) | 0 (0.0%) |
Employment Occupations by Sex in Robbinsville
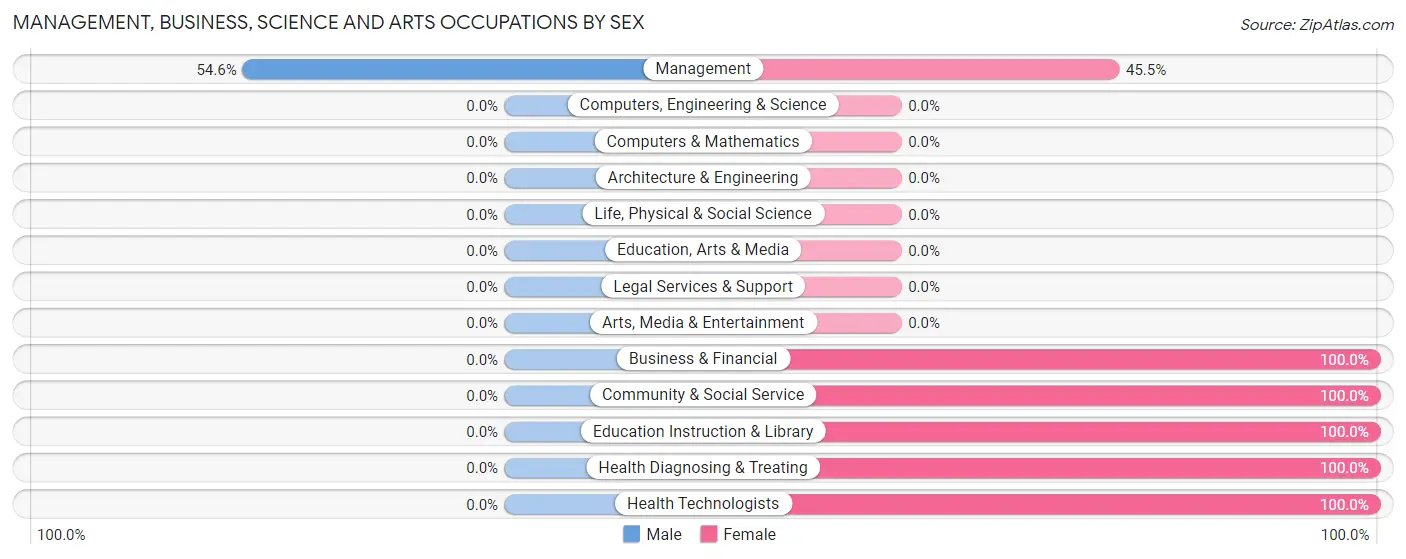
Management, Business, Science and Arts Occupations
The most common Management, Business, Science and Arts occupations in Robbinsville are Community & Social Service (16 | 8.2%), Education Instruction & Library (16 | 8.2%), Health Diagnosing & Treating (14 | 7.1%), Management (11 | 5.6%), and Health Technologists (9 | 4.6%).
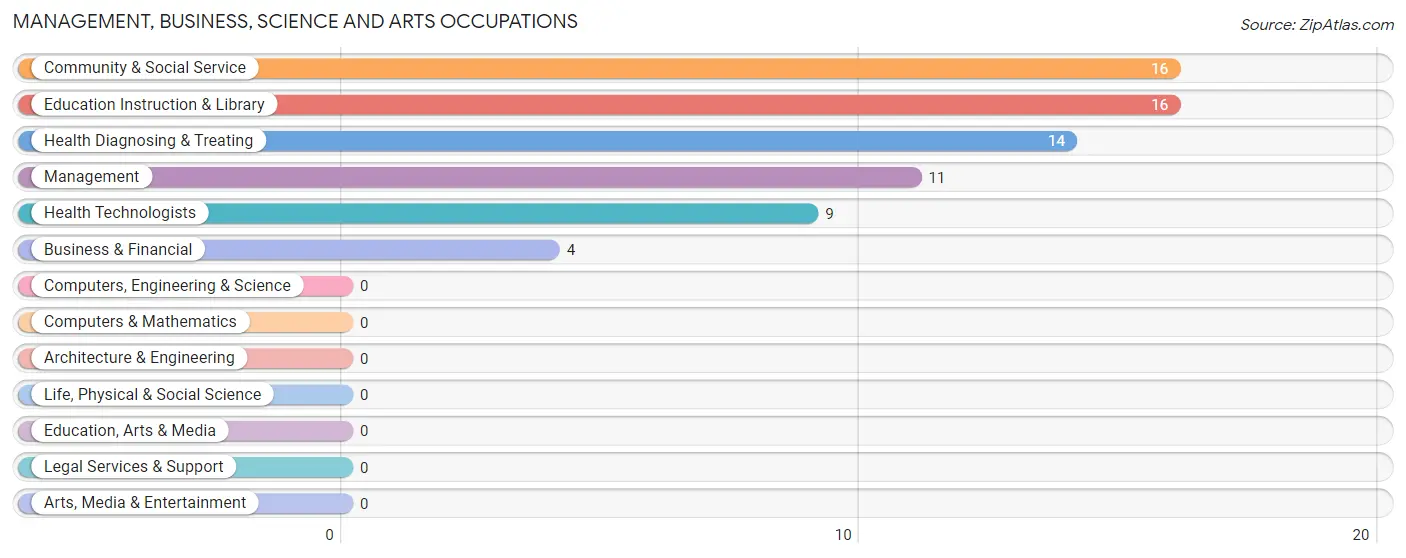
Management, Business, Science and Arts Occupations by Sex
| Occupation | Male | Female |
| Management | 6 (54.5%) | 5 (45.5%) |
| Business & Financial | 0 (0.0%) | 4 (100.0%) |
| Computers, Engineering & Science | 0 (0.0%) | 0 (0.0%) |
| Computers & Mathematics | 0 (0.0%) | 0 (0.0%) |
| Architecture & Engineering | 0 (0.0%) | 0 (0.0%) |
| Life, Physical & Social Science | 0 (0.0%) | 0 (0.0%) |
| Community & Social Service | 0 (0.0%) | 16 (100.0%) |
| Education, Arts & Media | 0 (0.0%) | 0 (0.0%) |
| Legal Services & Support | 0 (0.0%) | 0 (0.0%) |
| Education Instruction & Library | 0 (0.0%) | 16 (100.0%) |
| Arts, Media & Entertainment | 0 (0.0%) | 0 (0.0%) |
| Health Diagnosing & Treating | 0 (0.0%) | 14 (100.0%) |
| Health Technologists | 0 (0.0%) | 9 (100.0%) |
| Total (Category) | 6 (13.3%) | 39 (86.7%) |
| Total (Overall) | 84 (42.9%) | 112 (57.1%) |
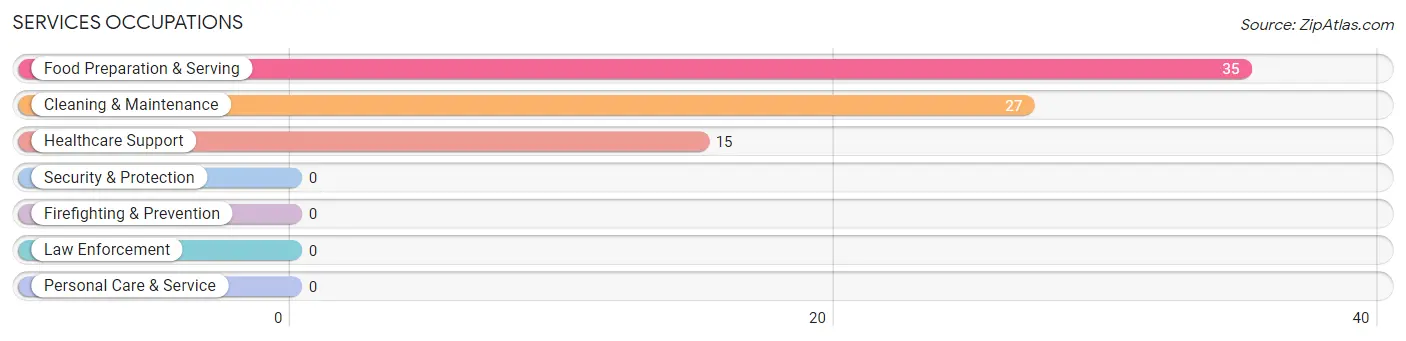
Services Occupations
The most common Services occupations in Robbinsville are Food Preparation & Serving (35 | 17.9%), Cleaning & Maintenance (27 | 13.8%), and Healthcare Support (15 | 7.6%).
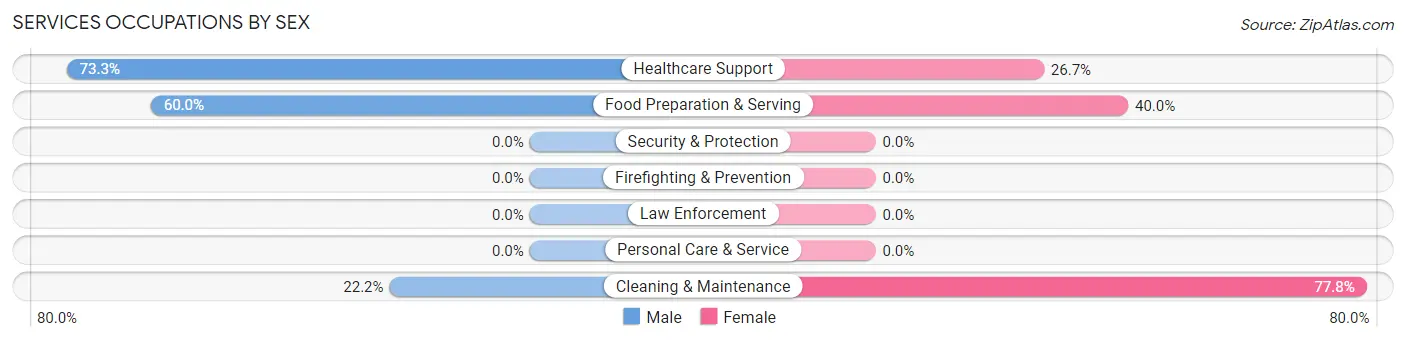
Services Occupations by Sex
Within the Services occupations in Robbinsville, the most male-oriented occupations are Healthcare Support (73.3%), Food Preparation & Serving (60.0%), and Cleaning & Maintenance (22.2%), while the most female-oriented occupations are Cleaning & Maintenance (77.8%), Food Preparation & Serving (40.0%), and Healthcare Support (26.7%).
| Occupation | Male | Female |
| Healthcare Support | 11 (73.3%) | 4 (26.7%) |
| Security & Protection | 0 (0.0%) | 0 (0.0%) |
| Firefighting & Prevention | 0 (0.0%) | 0 (0.0%) |
| Law Enforcement | 0 (0.0%) | 0 (0.0%) |
| Food Preparation & Serving | 21 (60.0%) | 14 (40.0%) |
| Cleaning & Maintenance | 6 (22.2%) | 21 (77.8%) |
| Personal Care & Service | 0 (0.0%) | 0 (0.0%) |
| Total (Category) | 38 (49.3%) | 39 (50.6%) |
| Total (Overall) | 84 (42.9%) | 112 (57.1%) |
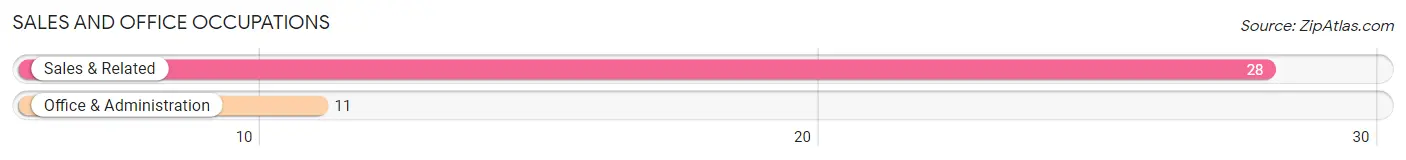
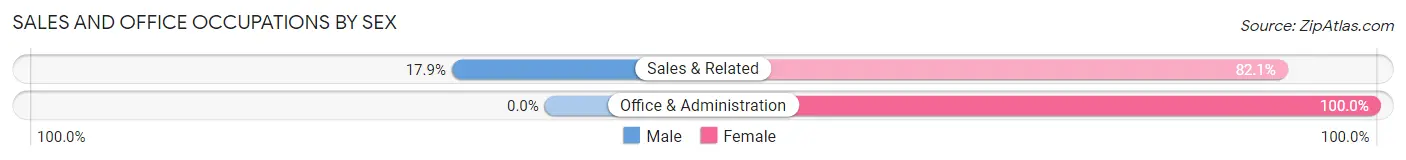
Sales and Office Occupations
The most common Sales and Office occupations in Robbinsville are Sales & Related (28 | 14.3%), and Office & Administration (11 | 5.6%).
Sales and Office Occupations by Sex
| Occupation | Male | Female |
| Sales & Related | 5 (17.9%) | 23 (82.1%) |
| Office & Administration | 0 (0.0%) | 11 (100.0%) |
| Total (Category) | 5 (12.8%) | 34 (87.2%) |
| Total (Overall) | 84 (42.9%) | 112 (57.1%) |
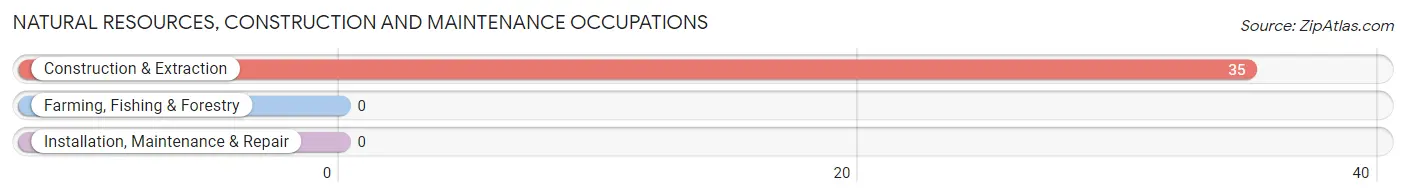
Natural Resources, Construction and Maintenance Occupations
The most common Natural Resources, Construction and Maintenance occupations in Robbinsville are , and Construction & Extraction (35 | 17.9%).
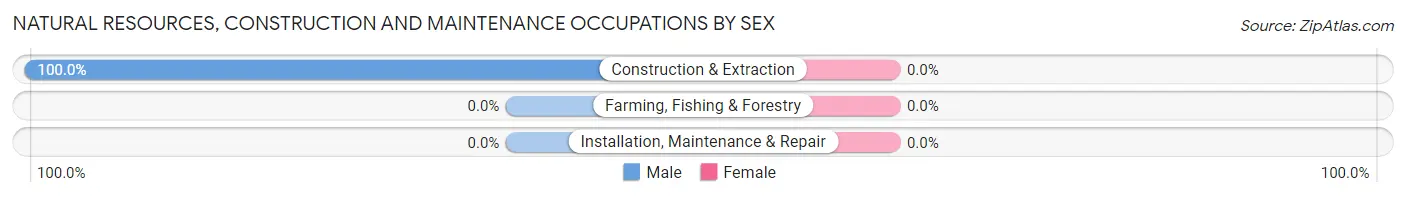
Natural Resources, Construction and Maintenance Occupations by Sex
| Occupation | Male | Female |
| Farming, Fishing & Forestry | 0 (0.0%) | 0 (0.0%) |
| Construction & Extraction | 35 (100.0%) | 0 (0.0%) |
| Installation, Maintenance & Repair | 0 (0.0%) | 0 (0.0%) |
| Total (Category) | 35 (100.0%) | 0 (0.0%) |
| Total (Overall) | 84 (42.9%) | 112 (57.1%) |
Production, Transportation and Moving Occupations
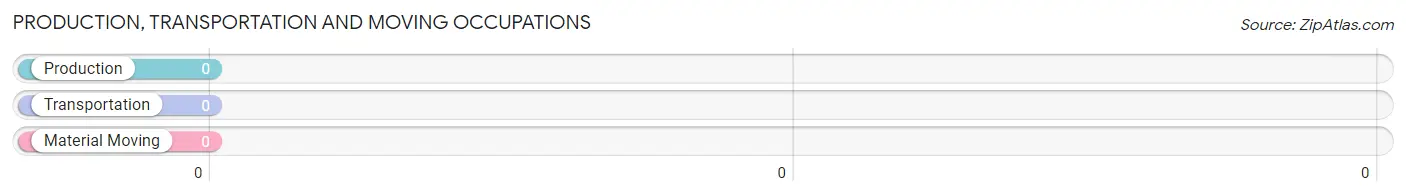
Production, Transportation and Moving Occupations by Sex
| Occupation | Male | Female |
| Production | 0 (0.0%) | 0 (0.0%) |
| Transportation | 0 (0.0%) | 0 (0.0%) |
| Material Moving | 0 (0.0%) | 0 (0.0%) |
| Total (Category) | 0 (0.0%) | 0 (0.0%) |
| Total (Overall) | 84 (42.9%) | 112 (57.1%) |
Employment Industries by Sex in Robbinsville
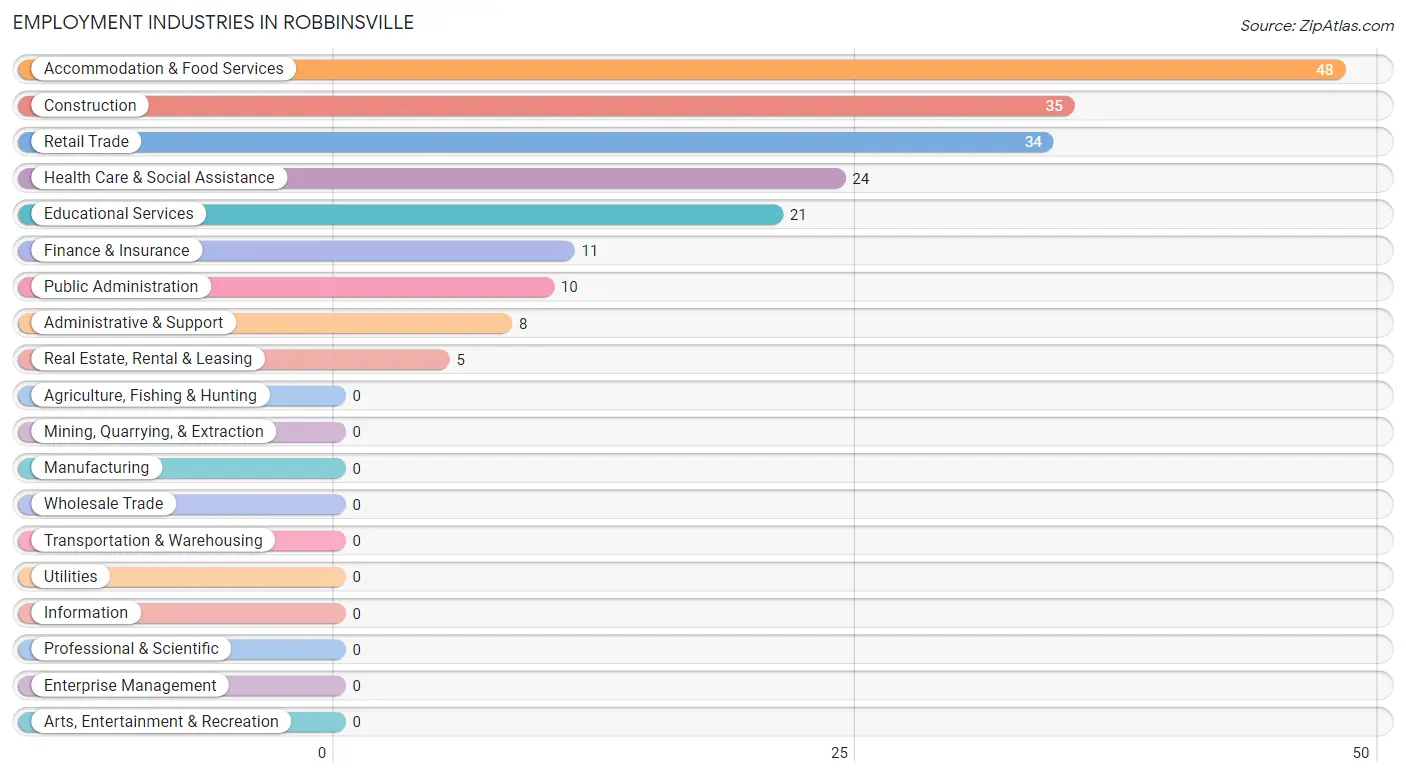
Employment Industries in Robbinsville
The major employment industries in Robbinsville include Accommodation & Food Services (48 | 24.5%), Construction (35 | 17.9%), Retail Trade (34 | 17.3%), Health Care & Social Assistance (24 | 12.2%), and Educational Services (21 | 10.7%).
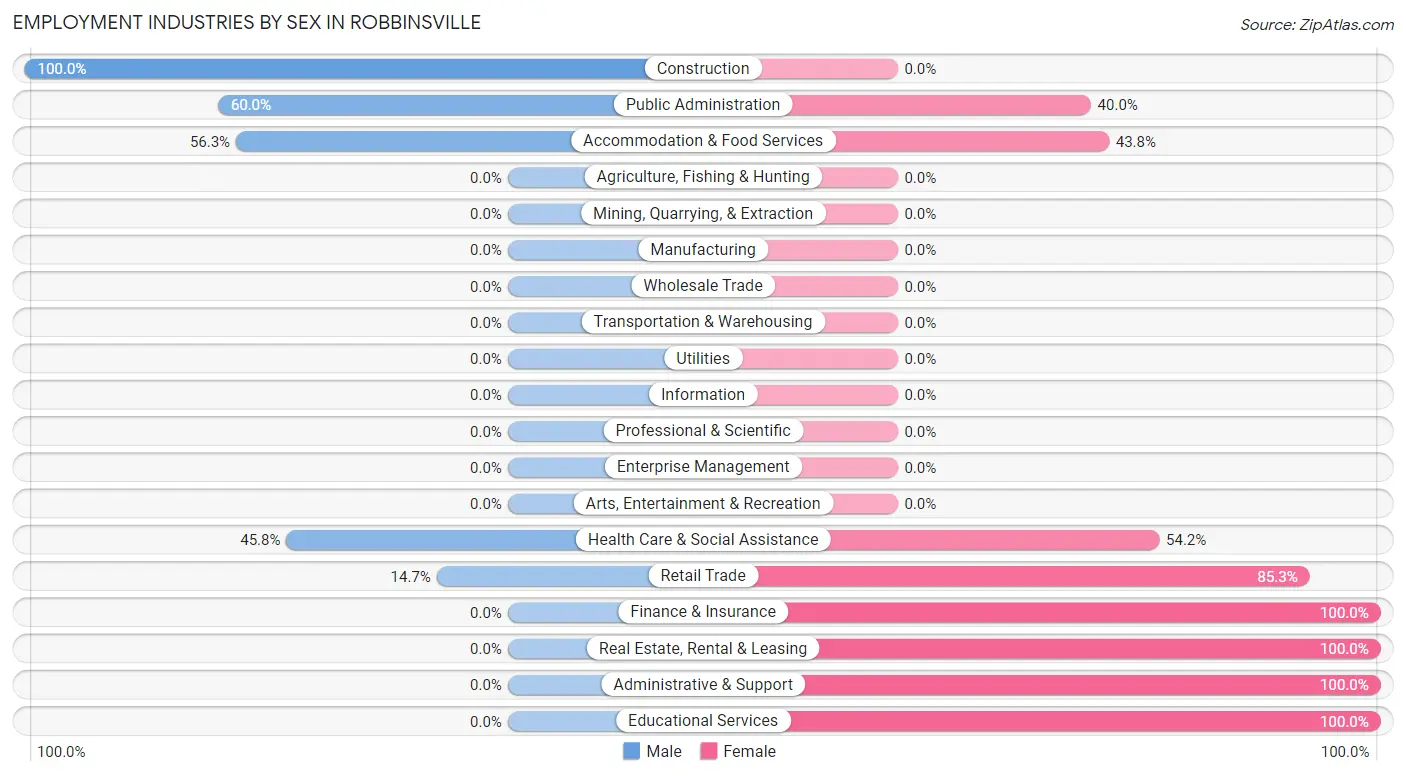
Employment Industries by Sex in Robbinsville
The Robbinsville industries that see more men than women are Construction (100.0%), Public Administration (60.0%), and Accommodation & Food Services (56.2%), whereas the industries that tend to have a higher number of women are Finance & Insurance (100.0%), Real Estate, Rental & Leasing (100.0%), and Administrative & Support (100.0%).
| Industry | Male | Female |
| Agriculture, Fishing & Hunting | 0 (0.0%) | 0 (0.0%) |
| Mining, Quarrying, & Extraction | 0 (0.0%) | 0 (0.0%) |
| Construction | 35 (100.0%) | 0 (0.0%) |
| Manufacturing | 0 (0.0%) | 0 (0.0%) |
| Wholesale Trade | 0 (0.0%) | 0 (0.0%) |
| Retail Trade | 5 (14.7%) | 29 (85.3%) |
| Transportation & Warehousing | 0 (0.0%) | 0 (0.0%) |
| Utilities | 0 (0.0%) | 0 (0.0%) |
| Information | 0 (0.0%) | 0 (0.0%) |
| Finance & Insurance | 0 (0.0%) | 11 (100.0%) |
| Real Estate, Rental & Leasing | 0 (0.0%) | 5 (100.0%) |
| Professional & Scientific | 0 (0.0%) | 0 (0.0%) |
| Enterprise Management | 0 (0.0%) | 0 (0.0%) |
| Administrative & Support | 0 (0.0%) | 8 (100.0%) |
| Educational Services | 0 (0.0%) | 21 (100.0%) |
| Health Care & Social Assistance | 11 (45.8%) | 13 (54.2%) |
| Arts, Entertainment & Recreation | 0 (0.0%) | 0 (0.0%) |
| Accommodation & Food Services | 27 (56.2%) | 21 (43.8%) |
| Public Administration | 6 (60.0%) | 4 (40.0%) |
| Total | 84 (42.9%) | 112 (57.1%) |
Education in Robbinsville
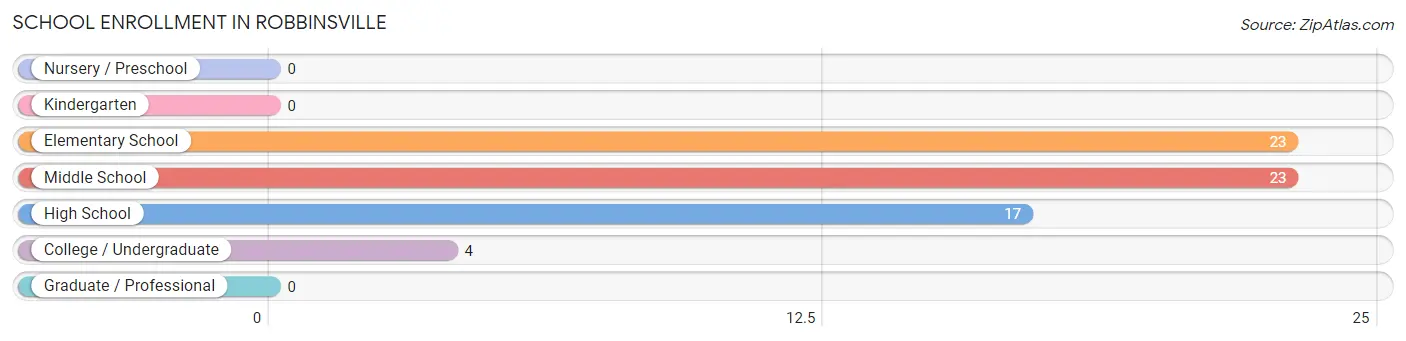
School Enrollment in Robbinsville
The most common levels of schooling among the 67 students in Robbinsville are elementary school (23 | 34.3%), middle school (23 | 34.3%), and high school (17 | 25.4%).
| School Level | # Students | % Students |
| Nursery / Preschool | 0 | 0.0% |
| Kindergarten | 0 | 0.0% |
| Elementary School | 23 | 34.3% |
| Middle School | 23 | 34.3% |
| High School | 17 | 25.4% |
| College / Undergraduate | 4 | 6.0% |
| Graduate / Professional | 0 | 0.0% |
| Total | 67 | 100.0% |
School Enrollment by Age by Funding Source in Robbinsville
Out of a total of 67 students who are enrolled in schools in Robbinsville, 9 (13.4%) attend a private institution, while the remaining 58 (86.6%) are enrolled in public schools. The age group of 15 to 17 year olds has the highest likelihood of being enrolled in private schools, with 9 (52.9% in the age bracket) enrolled. Conversely, the age group of 5 to 9 year old has the lowest likelihood of being enrolled in a private school, with 23 (100.0% in the age bracket) attending a public institution.
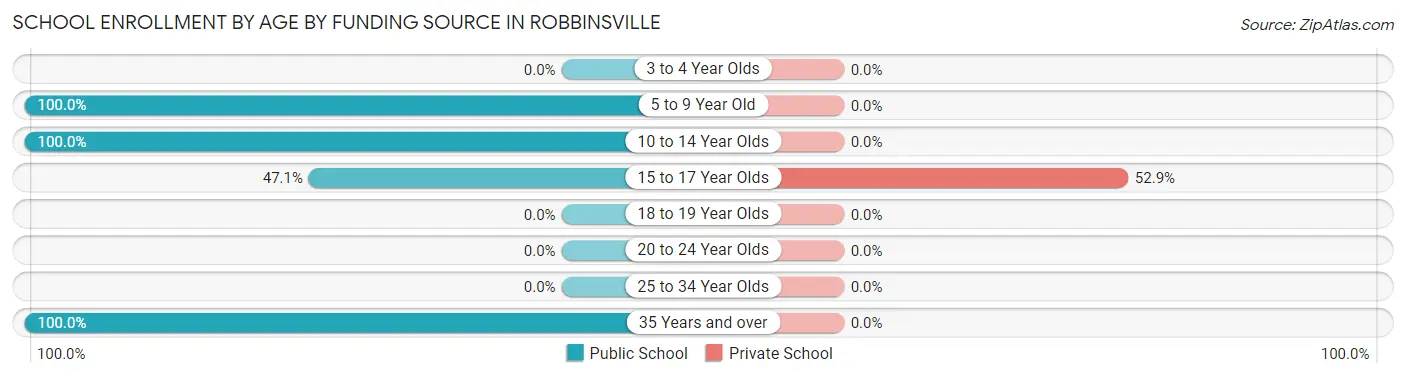
| Age Bracket | Public School | Private School |
| 3 to 4 Year Olds | 0 (0.0%) | 0 (0.0%) |
| 5 to 9 Year Old | 23 (100.0%) | 0 (0.0%) |
| 10 to 14 Year Olds | 23 (100.0%) | 0 (0.0%) |
| 15 to 17 Year Olds | 8 (47.1%) | 9 (52.9%) |
| 18 to 19 Year Olds | 0 (0.0%) | 0 (0.0%) |
| 20 to 24 Year Olds | 0 (0.0%) | 0 (0.0%) |
| 25 to 34 Year Olds | 0 (0.0%) | 0 (0.0%) |
| 35 Years and over | 4 (100.0%) | 0 (0.0%) |
| Total | 58 (86.6%) | 9 (13.4%) |
Educational Attainment by Field of Study in Robbinsville
Literature & languages (14 | 58.3%), education (8 | 33.3%), and science & technology (2 | 8.3%) are the most common fields of study among 24 individuals in Robbinsville who have obtained a bachelor's degree or higher.
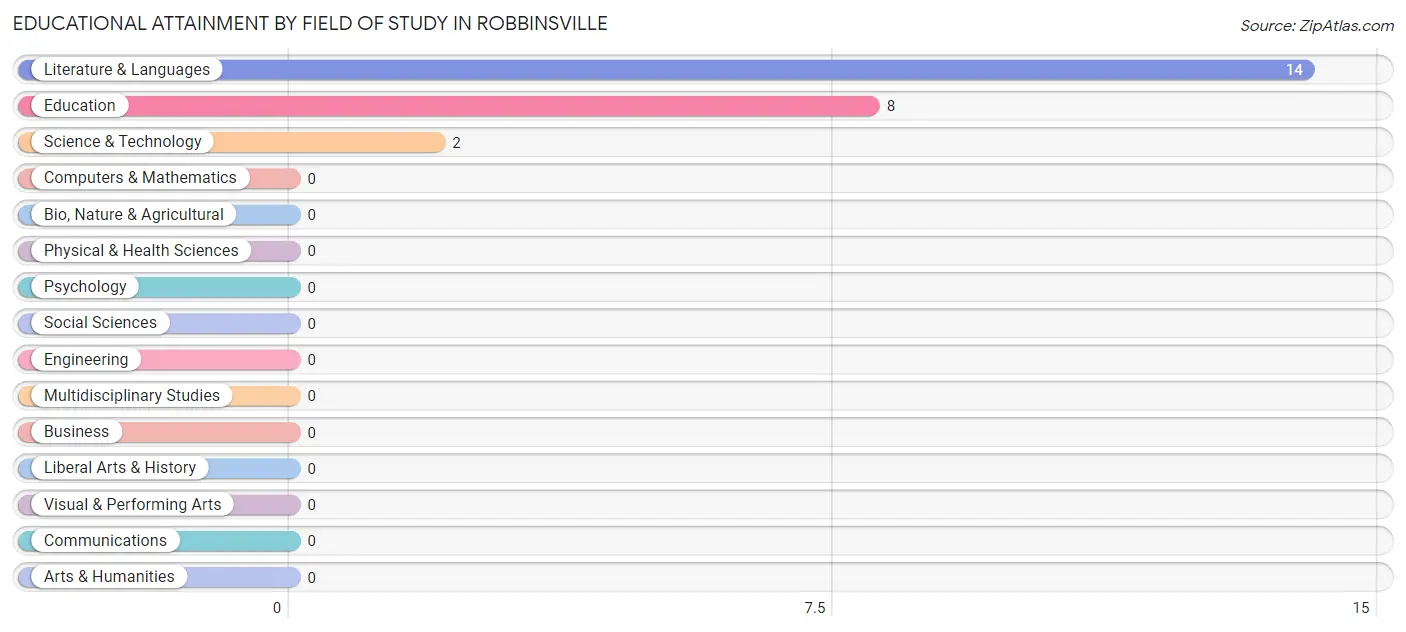
| Field of Study | # Graduates | % Graduates |
| Computers & Mathematics | 0 | 0.0% |
| Bio, Nature & Agricultural | 0 | 0.0% |
| Physical & Health Sciences | 0 | 0.0% |
| Psychology | 0 | 0.0% |
| Social Sciences | 0 | 0.0% |
| Engineering | 0 | 0.0% |
| Multidisciplinary Studies | 0 | 0.0% |
| Science & Technology | 2 | 8.3% |
| Business | 0 | 0.0% |
| Education | 8 | 33.3% |
| Literature & Languages | 14 | 58.3% |
| Liberal Arts & History | 0 | 0.0% |
| Visual & Performing Arts | 0 | 0.0% |
| Communications | 0 | 0.0% |
| Arts & Humanities | 0 | 0.0% |
| Total | 24 | 100.0% |
Transportation & Commute in Robbinsville
Vehicle Availability by Sex in Robbinsville
The most prevalent vehicle ownership categories in Robbinsville are males with 3 vehicles (32, accounting for 38.1%) and females with 3 vehicles (19, making up 28.6%).
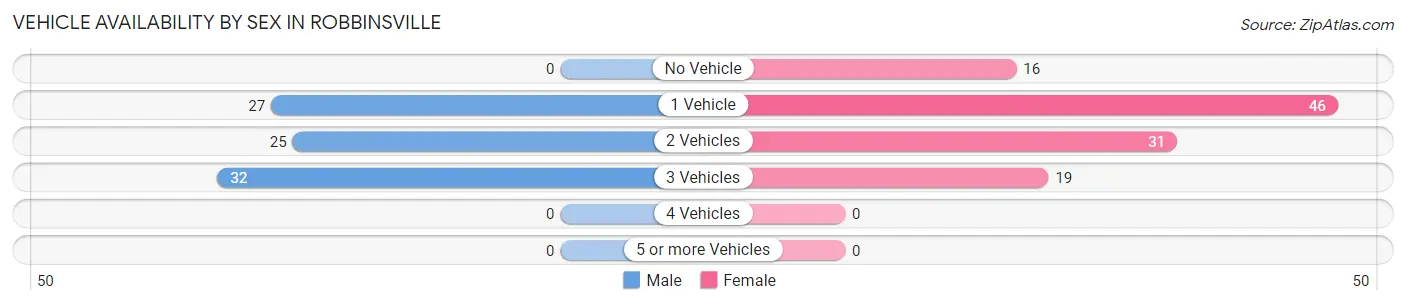
| Vehicles Available | Male | Female |
| No Vehicle | 0 (0.0%) | 16 (14.3%) |
| 1 Vehicle | 27 (32.1%) | 46 (41.1%) |
| 2 Vehicles | 25 (29.8%) | 31 (27.7%) |
| 3 Vehicles | 32 (38.1%) | 19 (17.0%) |
| 4 Vehicles | 0 (0.0%) | 0 (0.0%) |
| 5 or more Vehicles | 0 (0.0%) | 0 (0.0%) |
| Total | 84 (100.0%) | 112 (100.0%) |
Commute Time in Robbinsville
The most frequently occuring commute durations in Robbinsville are 5 to 9 minutes (91 commuters, 46.4%), 20 to 24 minutes (25 commuters, 12.8%), and 10 to 14 minutes (21 commuters, 10.7%).
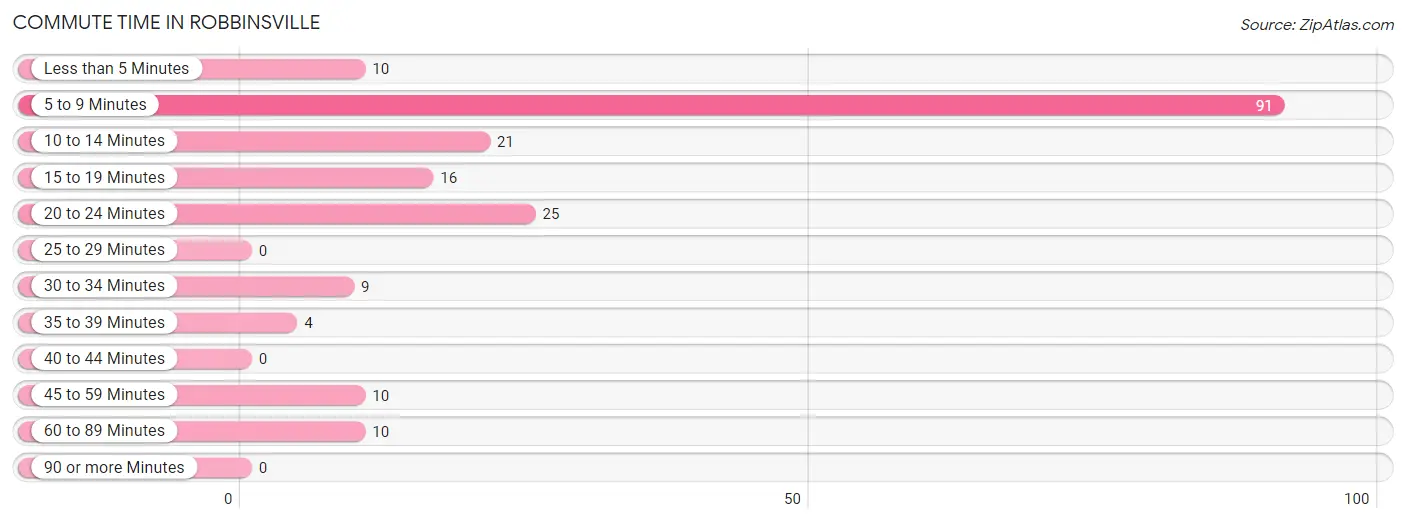
| Commute Time | # Commuters | % Commuters |
| Less than 5 Minutes | 10 | 5.1% |
| 5 to 9 Minutes | 91 | 46.4% |
| 10 to 14 Minutes | 21 | 10.7% |
| 15 to 19 Minutes | 16 | 8.2% |
| 20 to 24 Minutes | 25 | 12.8% |
| 25 to 29 Minutes | 0 | 0.0% |
| 30 to 34 Minutes | 9 | 4.6% |
| 35 to 39 Minutes | 4 | 2.0% |
| 40 to 44 Minutes | 0 | 0.0% |
| 45 to 59 Minutes | 10 | 5.1% |
| 60 to 89 Minutes | 10 | 5.1% |
| 90 or more Minutes | 0 | 0.0% |
Commute Time by Sex in Robbinsville
The most common commute times in Robbinsville are 5 to 9 minutes (38 commuters, 45.2%) for males and 5 to 9 minutes (53 commuters, 47.3%) for females.
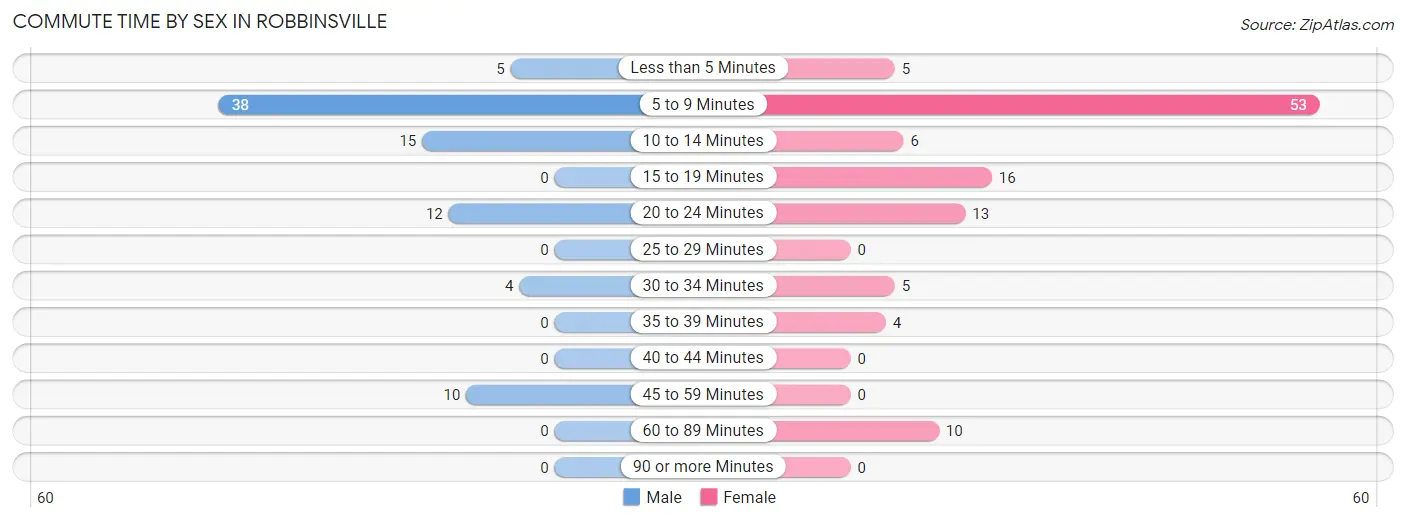
| Commute Time | Male | Female |
| Less than 5 Minutes | 5 (5.9%) | 5 (4.5%) |
| 5 to 9 Minutes | 38 (45.2%) | 53 (47.3%) |
| 10 to 14 Minutes | 15 (17.9%) | 6 (5.4%) |
| 15 to 19 Minutes | 0 (0.0%) | 16 (14.3%) |
| 20 to 24 Minutes | 12 (14.3%) | 13 (11.6%) |
| 25 to 29 Minutes | 0 (0.0%) | 0 (0.0%) |
| 30 to 34 Minutes | 4 (4.8%) | 5 (4.5%) |
| 35 to 39 Minutes | 0 (0.0%) | 4 (3.6%) |
| 40 to 44 Minutes | 0 (0.0%) | 0 (0.0%) |
| 45 to 59 Minutes | 10 (11.9%) | 0 (0.0%) |
| 60 to 89 Minutes | 0 (0.0%) | 10 (8.9%) |
| 90 or more Minutes | 0 (0.0%) | 0 (0.0%) |
Time of Departure to Work by Sex in Robbinsville
The most frequent times of departure to work in Robbinsville are 9:00 AM to 9:59 AM (21, 25.0%) for males and 8:00 AM to 8:29 AM (29, 25.9%) for females.
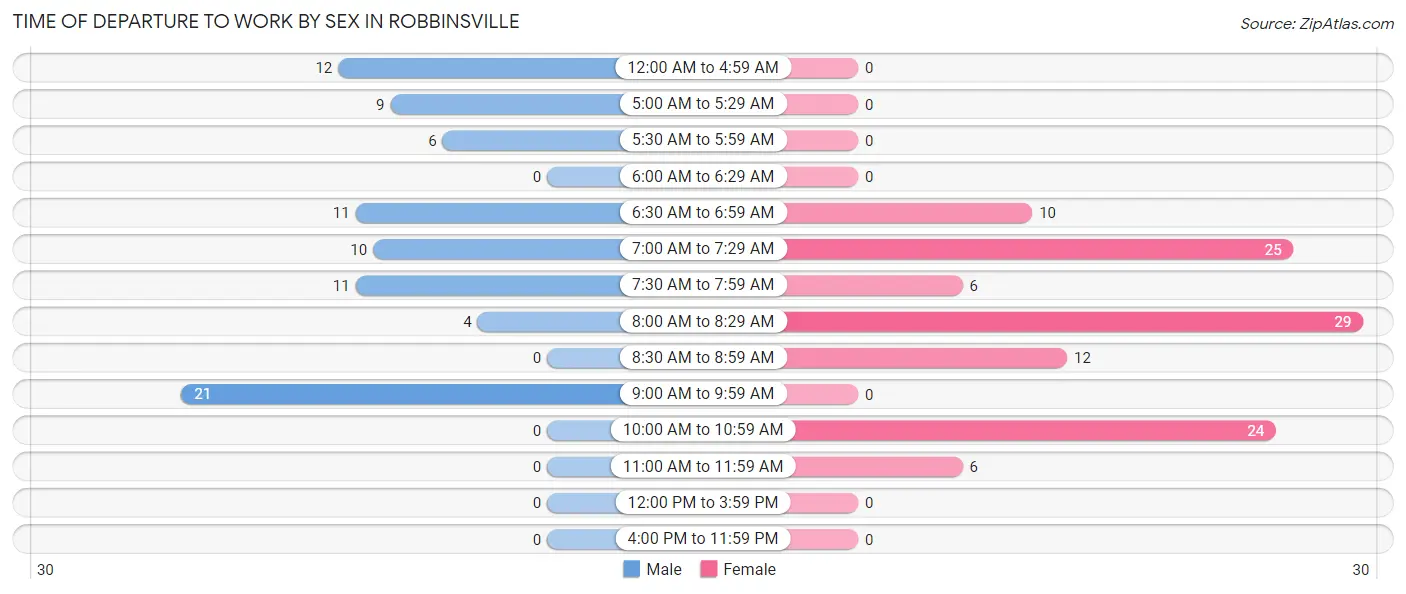
| Time of Departure | Male | Female |
| 12:00 AM to 4:59 AM | 12 (14.3%) | 0 (0.0%) |
| 5:00 AM to 5:29 AM | 9 (10.7%) | 0 (0.0%) |
| 5:30 AM to 5:59 AM | 6 (7.1%) | 0 (0.0%) |
| 6:00 AM to 6:29 AM | 0 (0.0%) | 0 (0.0%) |
| 6:30 AM to 6:59 AM | 11 (13.1%) | 10 (8.9%) |
| 7:00 AM to 7:29 AM | 10 (11.9%) | 25 (22.3%) |
| 7:30 AM to 7:59 AM | 11 (13.1%) | 6 (5.4%) |
| 8:00 AM to 8:29 AM | 4 (4.8%) | 29 (25.9%) |
| 8:30 AM to 8:59 AM | 0 (0.0%) | 12 (10.7%) |
| 9:00 AM to 9:59 AM | 21 (25.0%) | 0 (0.0%) |
| 10:00 AM to 10:59 AM | 0 (0.0%) | 24 (21.4%) |
| 11:00 AM to 11:59 AM | 0 (0.0%) | 6 (5.4%) |
| 12:00 PM to 3:59 PM | 0 (0.0%) | 0 (0.0%) |
| 4:00 PM to 11:59 PM | 0 (0.0%) | 0 (0.0%) |
| Total | 84 (100.0%) | 112 (100.0%) |
Housing Occupancy in Robbinsville
Occupancy by Ownership in Robbinsville
Of the total 336 dwellings in Robbinsville, owner-occupied units account for 112 (33.3%), while renter-occupied units make up 224 (66.7%).
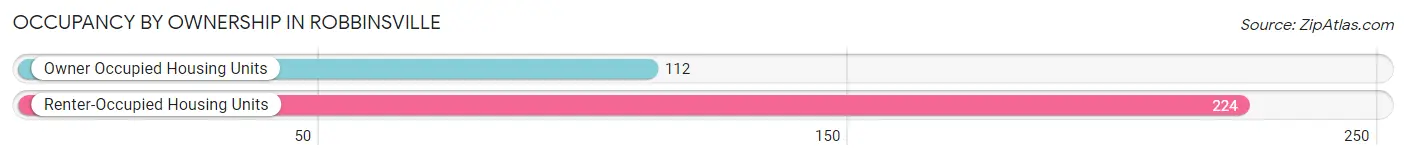
| Occupancy | # Housing Units | % Housing Units |
| Owner Occupied Housing Units | 112 | 33.3% |
| Renter-Occupied Housing Units | 224 | 66.7% |
| Total Occupied Housing Units | 336 | 100.0% |
Occupancy by Household Size in Robbinsville
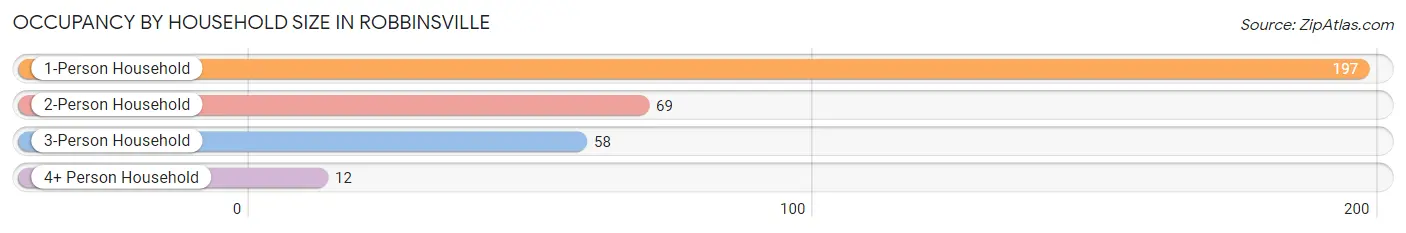
| Household Size | # Housing Units | % Housing Units |
| 1-Person Household | 197 | 58.6% |
| 2-Person Household | 69 | 20.5% |
| 3-Person Household | 58 | 17.3% |
| 4+ Person Household | 12 | 3.6% |
| Total Housing Units | 336 | 100.0% |
Occupancy by Ownership by Household Size in Robbinsville
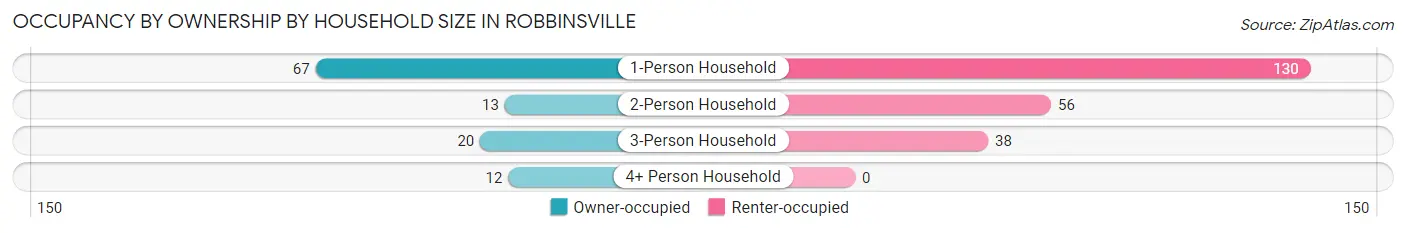
| Household Size | Owner-occupied | Renter-occupied |
| 1-Person Household | 67 (34.0%) | 130 (66.0%) |
| 2-Person Household | 13 (18.8%) | 56 (81.2%) |
| 3-Person Household | 20 (34.5%) | 38 (65.5%) |
| 4+ Person Household | 12 (100.0%) | 0 (0.0%) |
| Total Housing Units | 112 (33.3%) | 224 (66.7%) |
Occupancy by Educational Attainment in Robbinsville
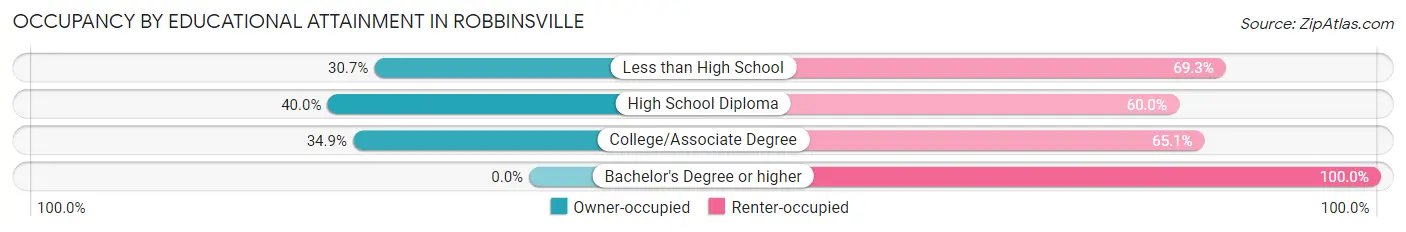
| Household Size | Owner-occupied | Renter-occupied |
| Less than High School | 47 (30.7%) | 106 (69.3%) |
| High School Diploma | 36 (40.0%) | 54 (60.0%) |
| College/Associate Degree | 29 (34.9%) | 54 (65.1%) |
| Bachelor's Degree or higher | 0 (0.0%) | 10 (100.0%) |
Occupancy by Age of Householder in Robbinsville
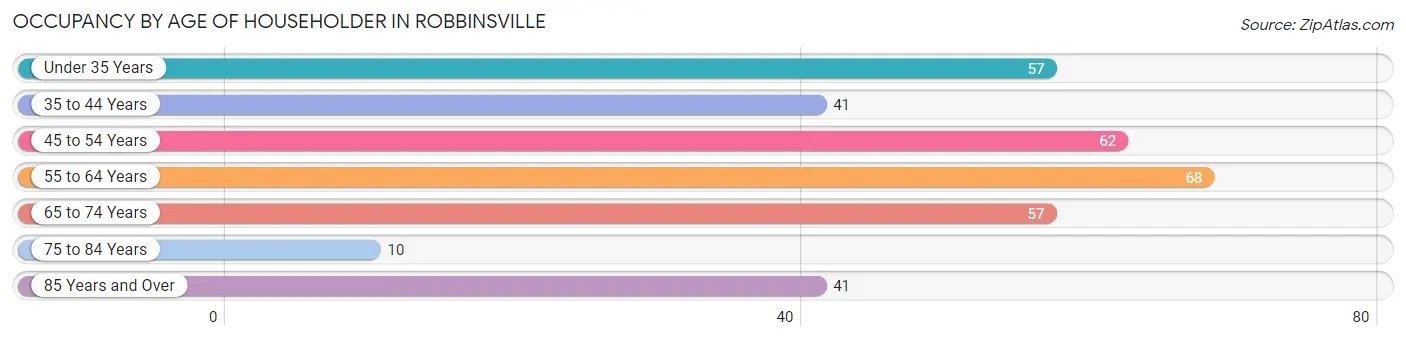
| Age Bracket | # Households | % Households |
| Under 35 Years | 57 | 17.0% |
| 35 to 44 Years | 41 | 12.2% |
| 45 to 54 Years | 62 | 18.4% |
| 55 to 64 Years | 68 | 20.2% |
| 65 to 74 Years | 57 | 17.0% |
| 75 to 84 Years | 10 | 3.0% |
| 85 Years and Over | 41 | 12.2% |
| Total | 336 | 100.0% |
Housing Finances in Robbinsville
Median Income by Occupancy in Robbinsville
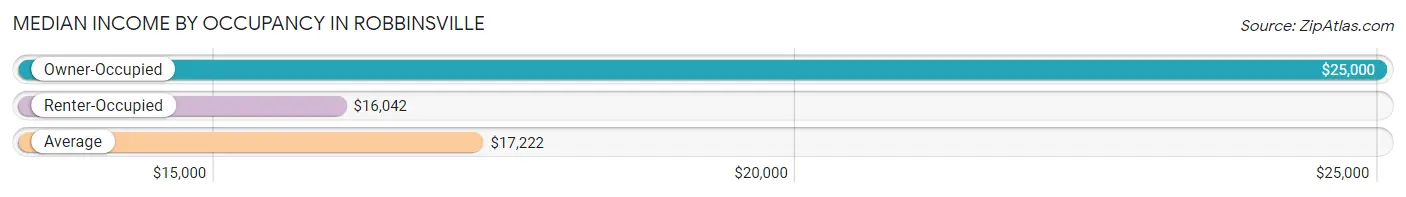
| Occupancy Type | # Households | Median Income |
| Owner-Occupied | 112 (33.3%) | $25,000 |
| Renter-Occupied | 224 (66.7%) | $16,042 |
| Average | 336 (100.0%) | $17,222 |
Occupancy by Householder Income Bracket in Robbinsville
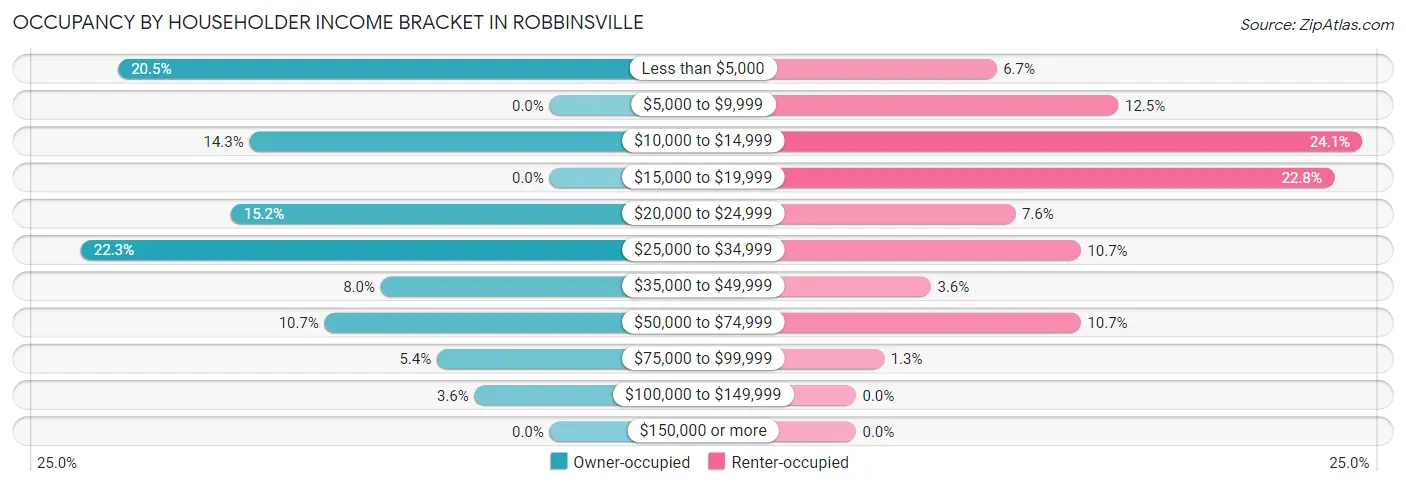
| Income Bracket | Owner-occupied | Renter-occupied |
| Less than $5,000 | 23 (20.5%) | 15 (6.7%) |
| $5,000 to $9,999 | 0 (0.0%) | 28 (12.5%) |
| $10,000 to $14,999 | 16 (14.3%) | 54 (24.1%) |
| $15,000 to $19,999 | 0 (0.0%) | 51 (22.8%) |
| $20,000 to $24,999 | 17 (15.2%) | 17 (7.6%) |
| $25,000 to $34,999 | 25 (22.3%) | 24 (10.7%) |
| $35,000 to $49,999 | 9 (8.0%) | 8 (3.6%) |
| $50,000 to $74,999 | 12 (10.7%) | 24 (10.7%) |
| $75,000 to $99,999 | 6 (5.4%) | 3 (1.3%) |
| $100,000 to $149,999 | 4 (3.6%) | 0 (0.0%) |
| $150,000 or more | 0 (0.0%) | 0 (0.0%) |
| Total | 112 (100.0%) | 224 (100.0%) |
Monthly Housing Cost Tiers in Robbinsville
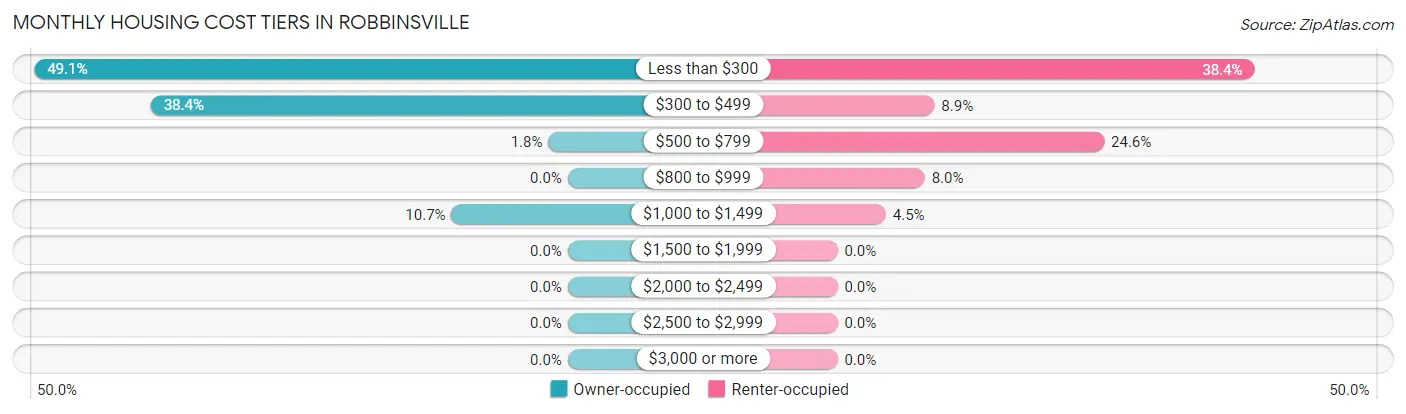
| Monthly Cost | Owner-occupied | Renter-occupied |
| Less than $300 | 55 (49.1%) | 86 (38.4%) |
| $300 to $499 | 43 (38.4%) | 20 (8.9%) |
| $500 to $799 | 2 (1.8%) | 55 (24.5%) |
| $800 to $999 | 0 (0.0%) | 18 (8.0%) |
| $1,000 to $1,499 | 12 (10.7%) | 10 (4.5%) |
| $1,500 to $1,999 | 0 (0.0%) | 0 (0.0%) |
| $2,000 to $2,499 | 0 (0.0%) | 0 (0.0%) |
| $2,500 to $2,999 | 0 (0.0%) | 0 (0.0%) |
| $3,000 or more | 0 (0.0%) | 0 (0.0%) |
| Total | 112 (100.0%) | 224 (100.0%) |
Physical Housing Characteristics in Robbinsville
Housing Structures in Robbinsville
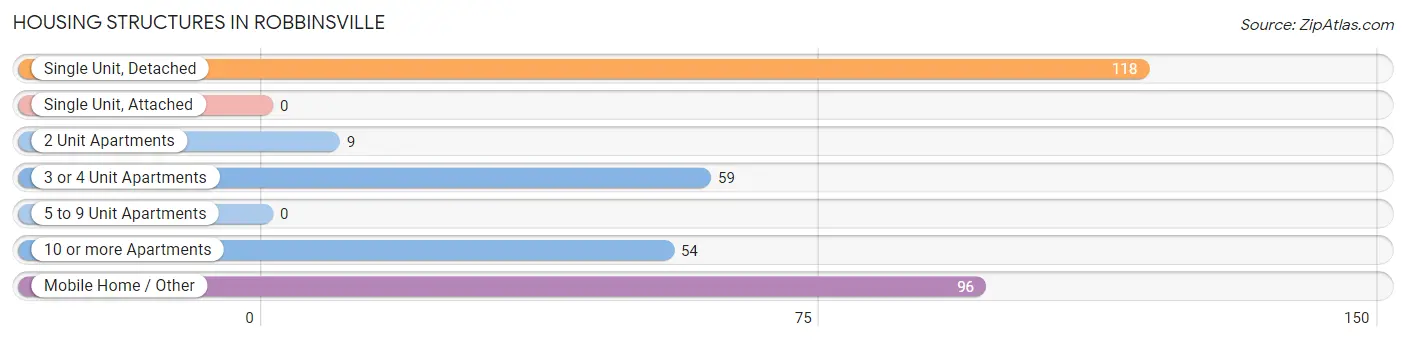
| Structure Type | # Housing Units | % Housing Units |
| Single Unit, Detached | 118 | 35.1% |
| Single Unit, Attached | 0 | 0.0% |
| 2 Unit Apartments | 9 | 2.7% |
| 3 or 4 Unit Apartments | 59 | 17.6% |
| 5 to 9 Unit Apartments | 0 | 0.0% |
| 10 or more Apartments | 54 | 16.1% |
| Mobile Home / Other | 96 | 28.6% |
| Total | 336 | 100.0% |
Housing Structures by Occupancy in Robbinsville
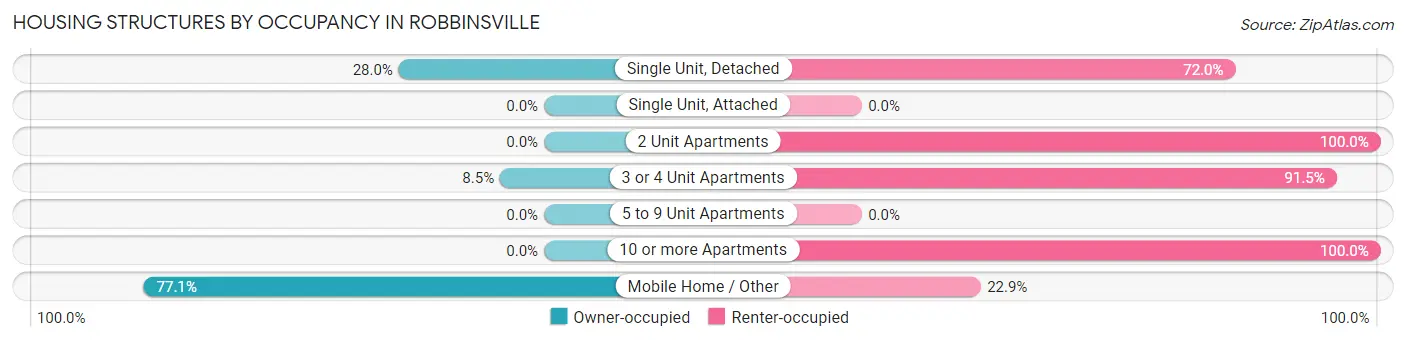
| Structure Type | Owner-occupied | Renter-occupied |
| Single Unit, Detached | 33 (28.0%) | 85 (72.0%) |
| Single Unit, Attached | 0 (0.0%) | 0 (0.0%) |
| 2 Unit Apartments | 0 (0.0%) | 9 (100.0%) |
| 3 or 4 Unit Apartments | 5 (8.5%) | 54 (91.5%) |
| 5 to 9 Unit Apartments | 0 (0.0%) | 0 (0.0%) |
| 10 or more Apartments | 0 (0.0%) | 54 (100.0%) |
| Mobile Home / Other | 74 (77.1%) | 22 (22.9%) |
| Total | 112 (33.3%) | 224 (66.7%) |
Housing Structures by Number of Rooms in Robbinsville
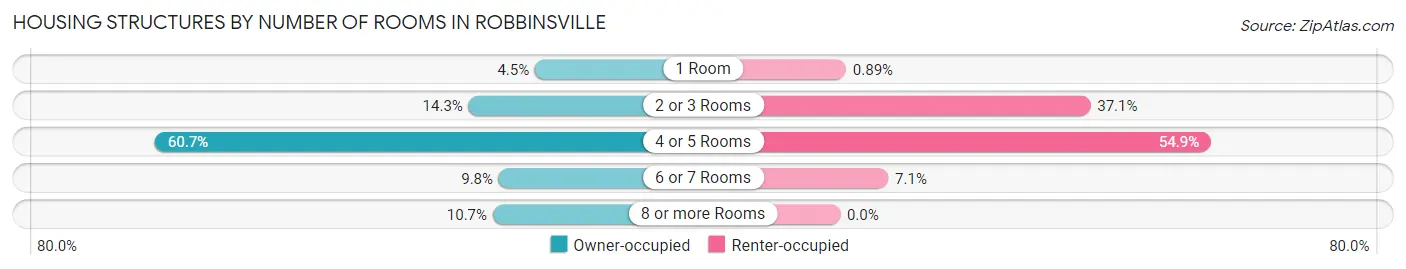
| Number of Rooms | Owner-occupied | Renter-occupied |
| 1 Room | 5 (4.5%) | 2 (0.9%) |
| 2 or 3 Rooms | 16 (14.3%) | 83 (37.0%) |
| 4 or 5 Rooms | 68 (60.7%) | 123 (54.9%) |
| 6 or 7 Rooms | 11 (9.8%) | 16 (7.1%) |
| 8 or more Rooms | 12 (10.7%) | 0 (0.0%) |
| Total | 112 (100.0%) | 224 (100.0%) |
Housing Structure by Heating Type in Robbinsville
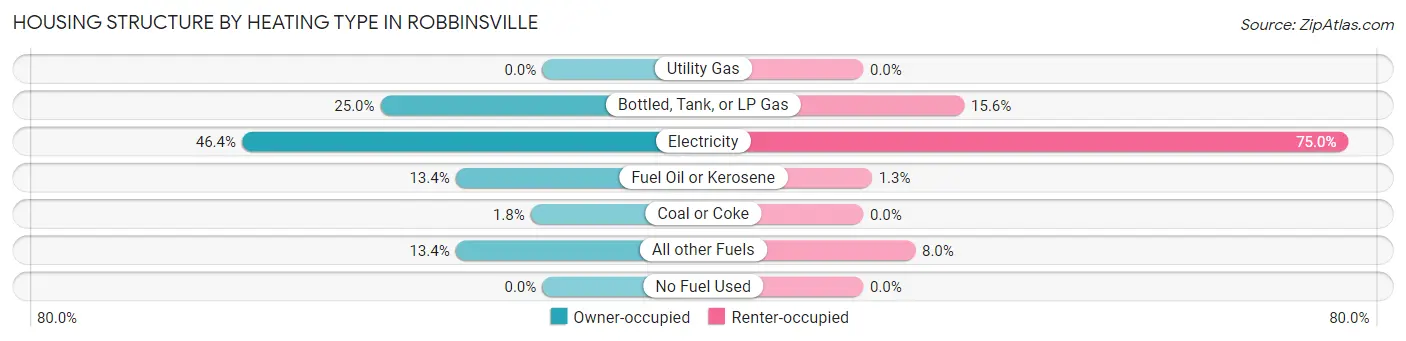
| Heating Type | Owner-occupied | Renter-occupied |
| Utility Gas | 0 (0.0%) | 0 (0.0%) |
| Bottled, Tank, or LP Gas | 28 (25.0%) | 35 (15.6%) |
| Electricity | 52 (46.4%) | 168 (75.0%) |
| Fuel Oil or Kerosene | 15 (13.4%) | 3 (1.3%) |
| Coal or Coke | 2 (1.8%) | 0 (0.0%) |
| All other Fuels | 15 (13.4%) | 18 (8.0%) |
| No Fuel Used | 0 (0.0%) | 0 (0.0%) |
| Total | 112 (100.0%) | 224 (100.0%) |
Household Vehicle Usage in Robbinsville
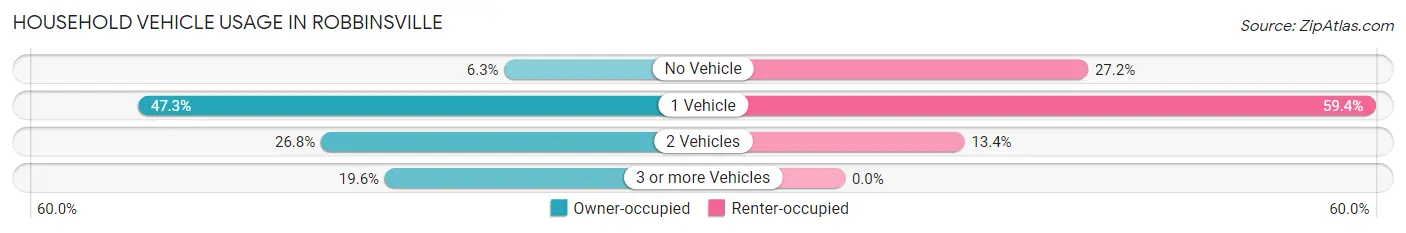
| Vehicles per Household | Owner-occupied | Renter-occupied |
| No Vehicle | 7 (6.2%) | 61 (27.2%) |
| 1 Vehicle | 53 (47.3%) | 133 (59.4%) |
| 2 Vehicles | 30 (26.8%) | 30 (13.4%) |
| 3 or more Vehicles | 22 (19.6%) | 0 (0.0%) |
| Total | 112 (100.0%) | 224 (100.0%) |
Real Estate & Mortgages in Robbinsville
Real Estate and Mortgage Overview in Robbinsville
| Characteristic | Without Mortgage | With Mortgage |
| Housing Units | 110 | 2 |
| Median Property Value | - | - |
| Median Household Income | $24,853 | $0 |
| Monthly Housing Costs | $300 | $0 |
| Real Estate Taxes | $819 | $0 |
Property Value by Mortgage Status in Robbinsville
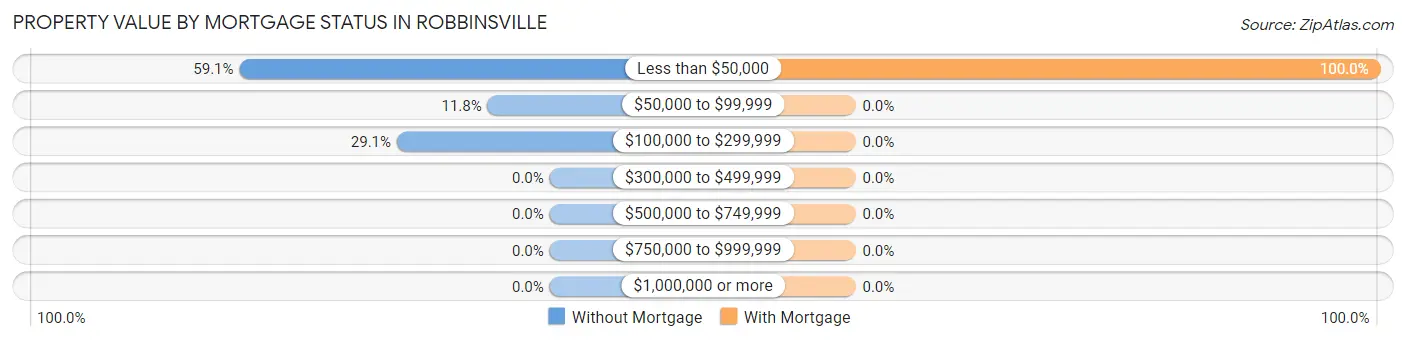
| Property Value | Without Mortgage | With Mortgage |
| Less than $50,000 | 65 (59.1%) | 2 (100.0%) |
| $50,000 to $99,999 | 13 (11.8%) | 0 (0.0%) |
| $100,000 to $299,999 | 32 (29.1%) | 0 (0.0%) |
| $300,000 to $499,999 | 0 (0.0%) | 0 (0.0%) |
| $500,000 to $749,999 | 0 (0.0%) | 0 (0.0%) |
| $750,000 to $999,999 | 0 (0.0%) | 0 (0.0%) |
| $1,000,000 or more | 0 (0.0%) | 0 (0.0%) |
| Total | 110 (100.0%) | 2 (100.0%) |
Household Income by Mortgage Status in Robbinsville
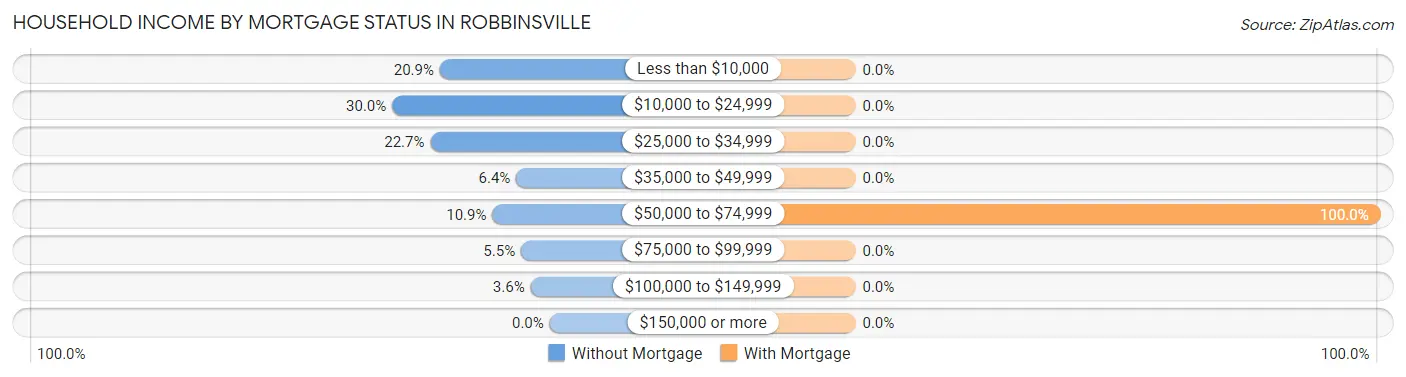
| Household Income | Without Mortgage | With Mortgage |
| Less than $10,000 | 23 (20.9%) | 0 (0.0%) |
| $10,000 to $24,999 | 33 (30.0%) | 0 (0.0%) |
| $25,000 to $34,999 | 25 (22.7%) | 0 (0.0%) |
| $35,000 to $49,999 | 7 (6.4%) | 0 (0.0%) |
| $50,000 to $74,999 | 12 (10.9%) | 2 (100.0%) |
| $75,000 to $99,999 | 6 (5.4%) | 0 (0.0%) |
| $100,000 to $149,999 | 4 (3.6%) | 0 (0.0%) |
| $150,000 or more | 0 (0.0%) | 0 (0.0%) |
| Total | 110 (100.0%) | 2 (100.0%) |
Property Value to Household Income Ratio in Robbinsville
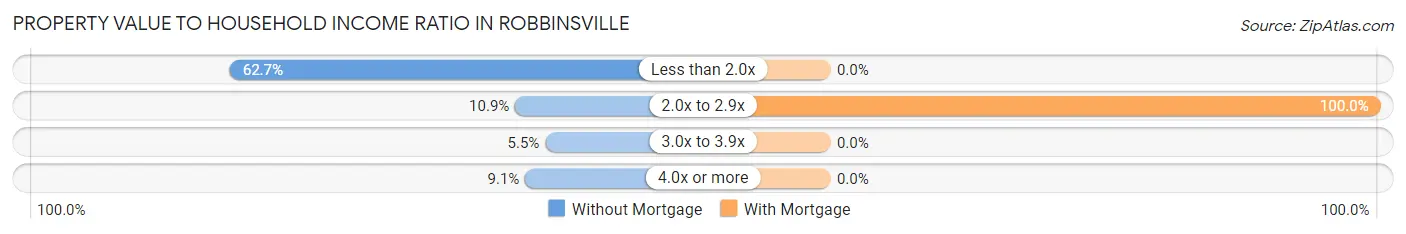
| Value-to-Income Ratio | Without Mortgage | With Mortgage |
| Less than 2.0x | 69 (62.7%) | 0 (0.0%) |
| 2.0x to 2.9x | 12 (10.9%) | 2 (100.0%) |
| 3.0x to 3.9x | 6 (5.4%) | 0 (0.0%) |
| 4.0x or more | 10 (9.1%) | 0 (0.0%) |
| Total | 110 (100.0%) | 2 (100.0%) |
Real Estate Taxes by Mortgage Status in Robbinsville
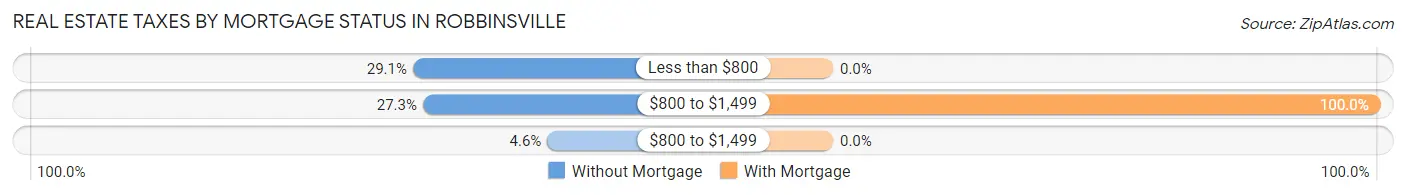
| Property Taxes | Without Mortgage | With Mortgage |
| Less than $800 | 32 (29.1%) | 0 (0.0%) |
| $800 to $1,499 | 30 (27.3%) | 2 (100.0%) |
| $800 to $1,499 | 5 (4.5%) | 0 (0.0%) |
| Total | 110 (100.0%) | 2 (100.0%) |
Health & Disability in Robbinsville
Health Insurance Coverage by Age in Robbinsville
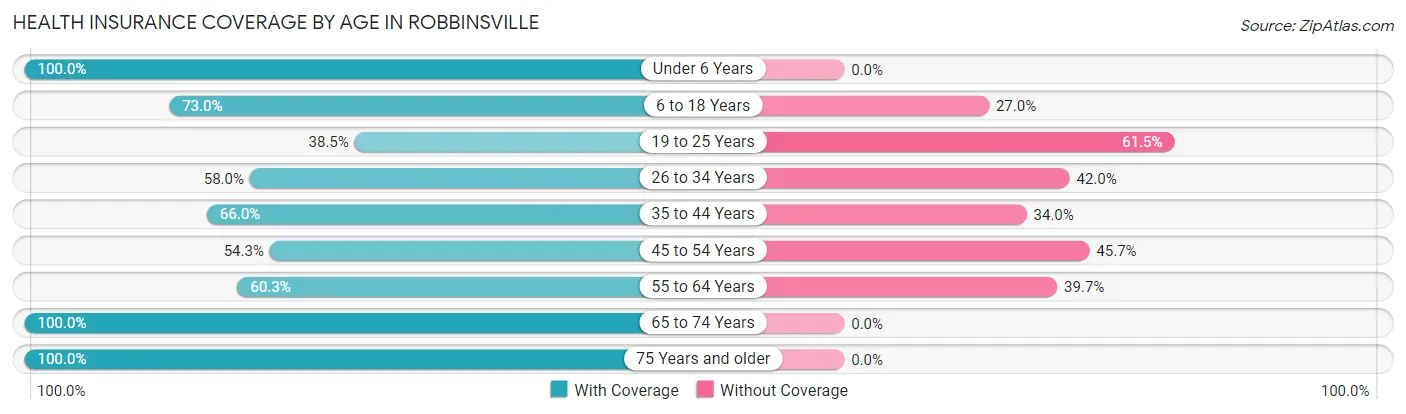
| Age Bracket | With Coverage | Without Coverage |
| Under 6 Years | 43 (100.0%) | 0 (0.0%) |
| 6 to 18 Years | 46 (73.0%) | 17 (27.0%) |
| 19 to 25 Years | 20 (38.5%) | 32 (61.5%) |
| 26 to 34 Years | 29 (58.0%) | 21 (42.0%) |
| 35 to 44 Years | 33 (66.0%) | 17 (34.0%) |
| 45 to 54 Years | 38 (54.3%) | 32 (45.7%) |
| 55 to 64 Years | 79 (60.3%) | 52 (39.7%) |
| 65 to 74 Years | 73 (100.0%) | 0 (0.0%) |
| 75 Years and older | 64 (100.0%) | 0 (0.0%) |
| Total | 425 (71.3%) | 171 (28.7%) |
Health Insurance Coverage by Citizenship Status in Robbinsville
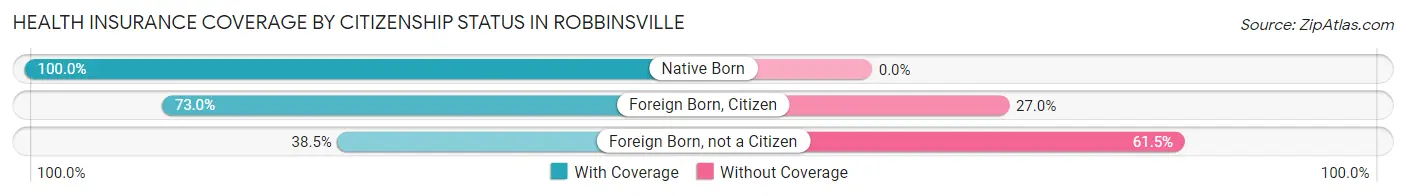
| Citizenship Status | With Coverage | Without Coverage |
| Native Born | 43 (100.0%) | 0 (0.0%) |
| Foreign Born, Citizen | 46 (73.0%) | 17 (27.0%) |
| Foreign Born, not a Citizen | 20 (38.5%) | 32 (61.5%) |
Health Insurance Coverage by Household Income in Robbinsville
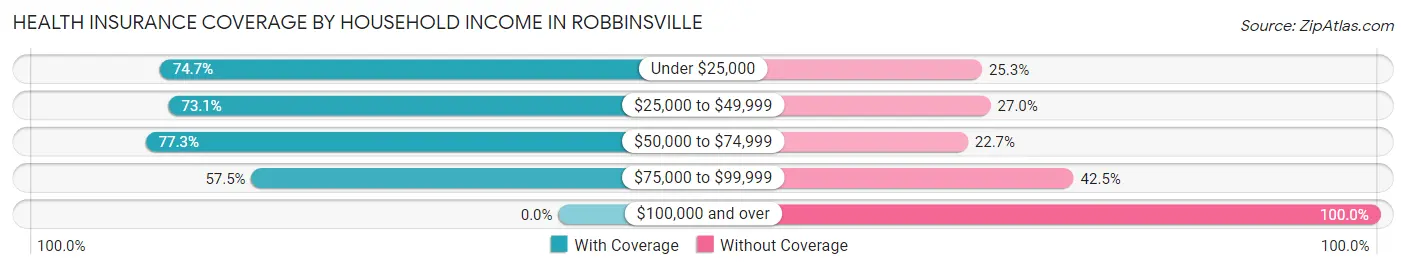
| Household Income | With Coverage | Without Coverage |
| Under $25,000 | 224 (74.7%) | 76 (25.3%) |
| $25,000 to $49,999 | 103 (73.1%) | 38 (27.0%) |
| $50,000 to $74,999 | 75 (77.3%) | 22 (22.7%) |
| $75,000 to $99,999 | 23 (57.5%) | 17 (42.5%) |
| $100,000 and over | 0 (0.0%) | 18 (100.0%) |
Public vs Private Health Insurance Coverage by Age in Robbinsville
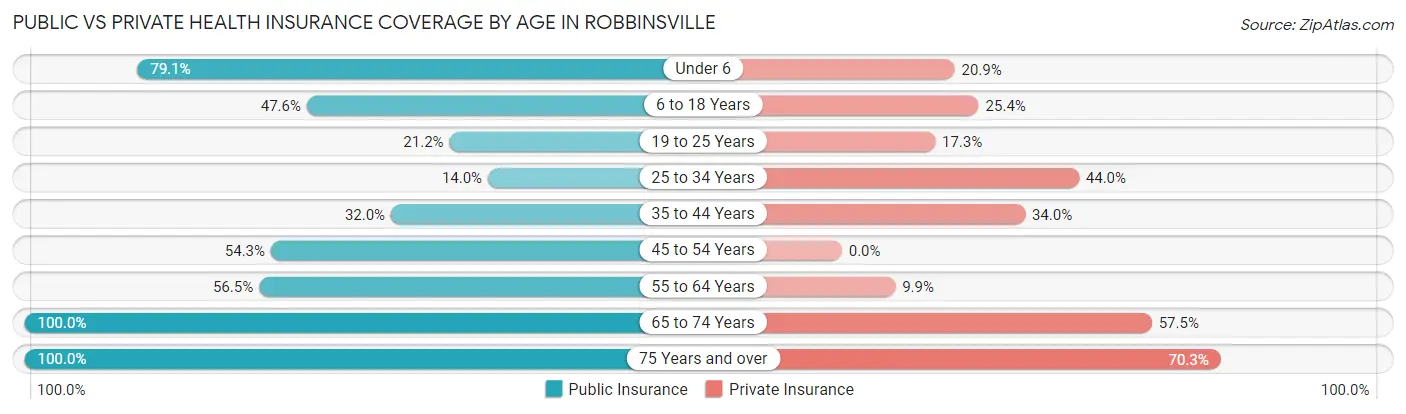
| Age Bracket | Public Insurance | Private Insurance |
| Under 6 | 34 (79.1%) | 9 (20.9%) |
| 6 to 18 Years | 30 (47.6%) | 16 (25.4%) |
| 19 to 25 Years | 11 (21.1%) | 9 (17.3%) |
| 25 to 34 Years | 7 (14.0%) | 22 (44.0%) |
| 35 to 44 Years | 16 (32.0%) | 17 (34.0%) |
| 45 to 54 Years | 38 (54.3%) | 0 (0.0%) |
| 55 to 64 Years | 74 (56.5%) | 13 (9.9%) |
| 65 to 74 Years | 73 (100.0%) | 42 (57.5%) |
| 75 Years and over | 64 (100.0%) | 45 (70.3%) |
| Total | 347 (58.2%) | 173 (29.0%) |
Disability Status by Sex by Age in Robbinsville
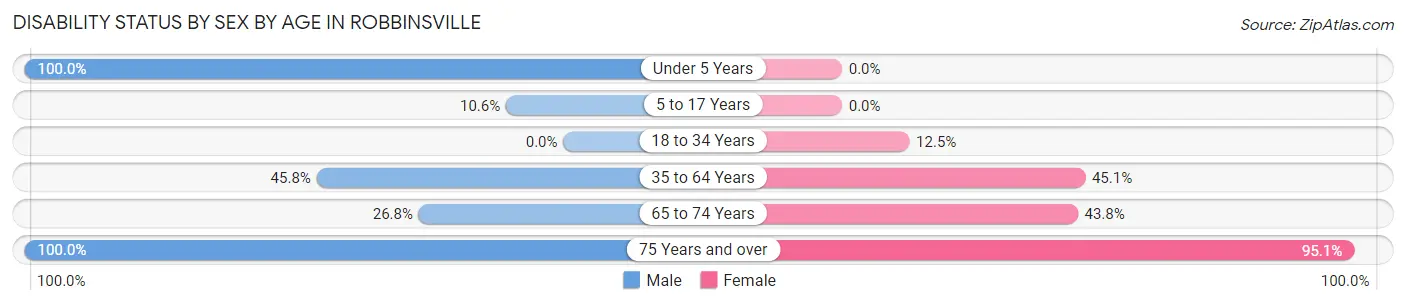
| Age Bracket | Male | Female |
| Under 5 Years | 10 (100.0%) | 0 (0.0%) |
| 5 to 17 Years | 5 (10.6%) | 0 (0.0%) |
| 18 to 34 Years | 0 (0.0%) | 7 (12.5%) |
| 35 to 64 Years | 49 (45.8%) | 65 (45.1%) |
| 65 to 74 Years | 11 (26.8%) | 14 (43.8%) |
| 75 Years and over | 3 (100.0%) | 58 (95.1%) |
Disability Class by Sex by Age in Robbinsville
Disability Class: Hearing Difficulty
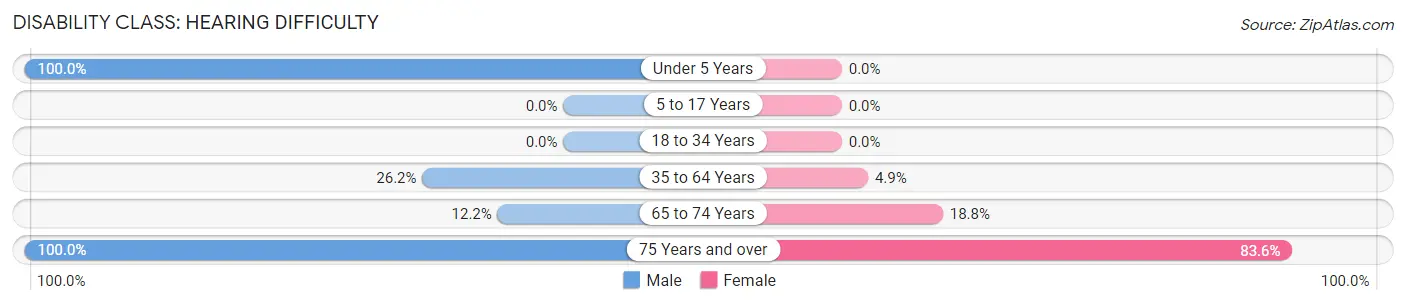
| Age Bracket | Male | Female |
| Under 5 Years | 10 (100.0%) | 0 (0.0%) |
| 5 to 17 Years | 0 (0.0%) | 0 (0.0%) |
| 18 to 34 Years | 0 (0.0%) | 0 (0.0%) |
| 35 to 64 Years | 28 (26.2%) | 7 (4.9%) |
| 65 to 74 Years | 5 (12.2%) | 6 (18.8%) |
| 75 Years and over | 3 (100.0%) | 51 (83.6%) |
Disability Class: Vision Difficulty
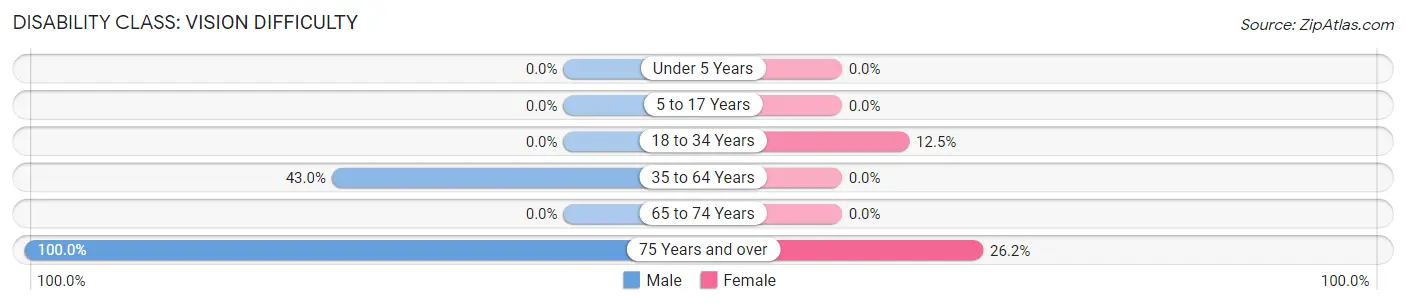
| Age Bracket | Male | Female |
| Under 5 Years | 0 (0.0%) | 0 (0.0%) |
| 5 to 17 Years | 0 (0.0%) | 0 (0.0%) |
| 18 to 34 Years | 0 (0.0%) | 7 (12.5%) |
| 35 to 64 Years | 46 (43.0%) | 0 (0.0%) |
| 65 to 74 Years | 0 (0.0%) | 0 (0.0%) |
| 75 Years and over | 3 (100.0%) | 16 (26.2%) |
Disability Class: Cognitive Difficulty
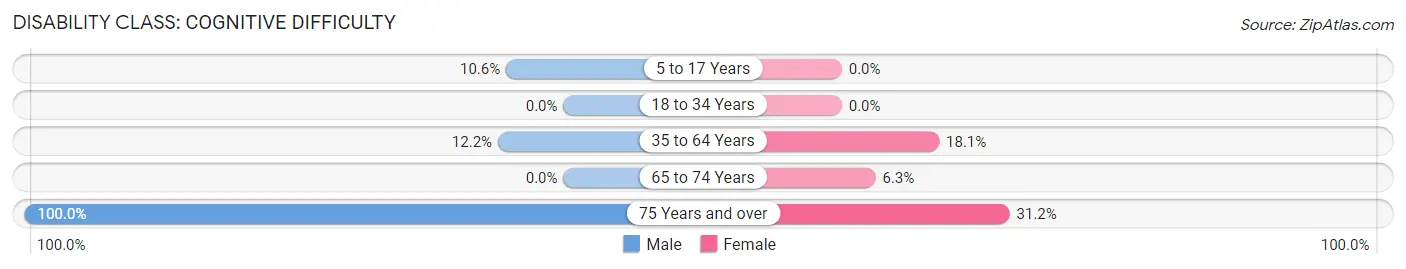
| Age Bracket | Male | Female |
| 5 to 17 Years | 5 (10.6%) | 0 (0.0%) |
| 18 to 34 Years | 0 (0.0%) | 0 (0.0%) |
| 35 to 64 Years | 13 (12.1%) | 26 (18.1%) |
| 65 to 74 Years | 0 (0.0%) | 2 (6.2%) |
| 75 Years and over | 3 (100.0%) | 19 (31.1%) |
Disability Class: Ambulatory Difficulty
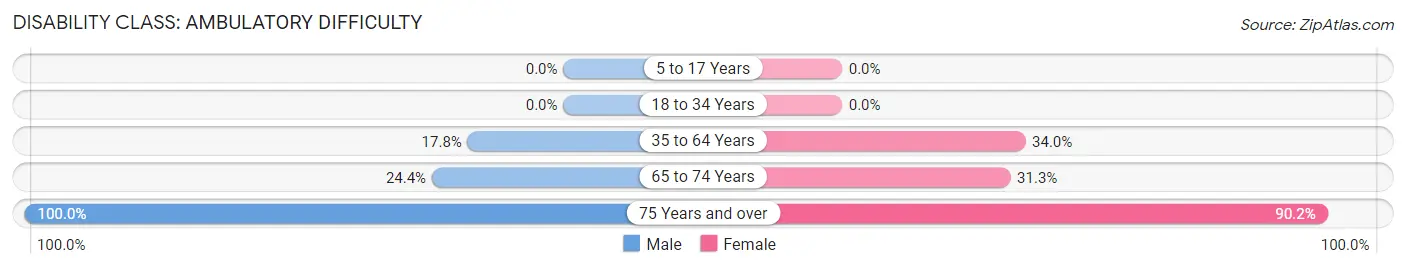
| Age Bracket | Male | Female |
| 5 to 17 Years | 0 (0.0%) | 0 (0.0%) |
| 18 to 34 Years | 0 (0.0%) | 0 (0.0%) |
| 35 to 64 Years | 19 (17.8%) | 49 (34.0%) |
| 65 to 74 Years | 10 (24.4%) | 10 (31.2%) |
| 75 Years and over | 3 (100.0%) | 55 (90.2%) |
Disability Class: Self-Care Difficulty
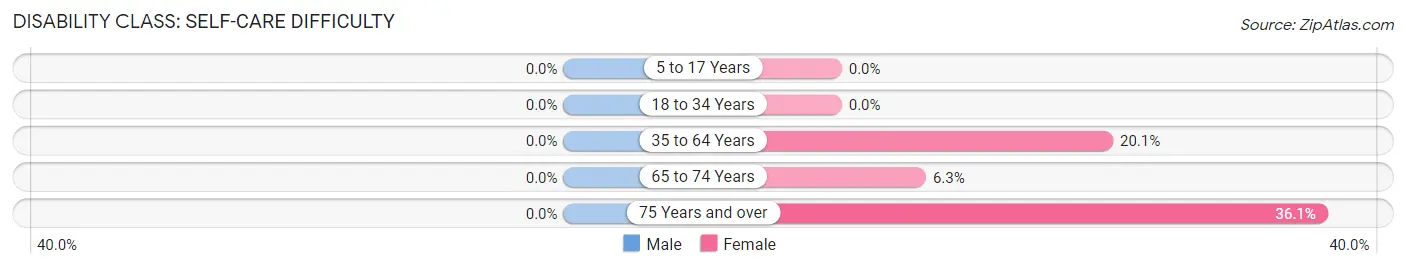
| Age Bracket | Male | Female |
| 5 to 17 Years | 0 (0.0%) | 0 (0.0%) |
| 18 to 34 Years | 0 (0.0%) | 0 (0.0%) |
| 35 to 64 Years | 0 (0.0%) | 29 (20.1%) |
| 65 to 74 Years | 0 (0.0%) | 2 (6.2%) |
| 75 Years and over | 0 (0.0%) | 22 (36.1%) |
Technology Access in Robbinsville
Computing Device Access in Robbinsville
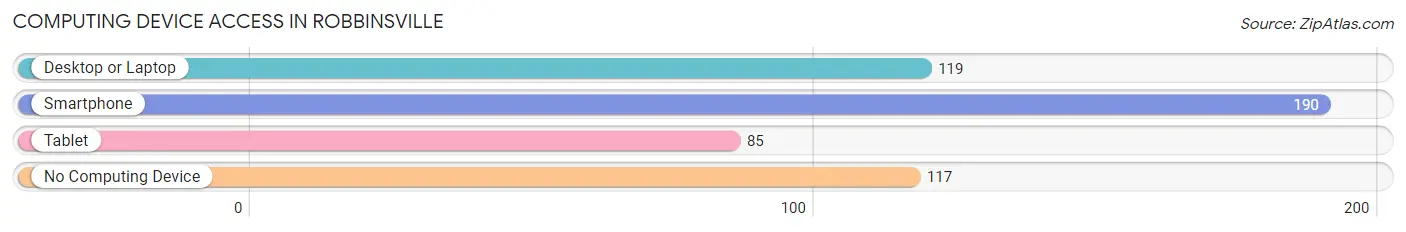
| Device Type | # Households | % Households |
| Desktop or Laptop | 119 | 35.4% |
| Smartphone | 190 | 56.6% |
| Tablet | 85 | 25.3% |
| No Computing Device | 117 | 34.8% |
| Total | 336 | 100.0% |
Internet Access in Robbinsville
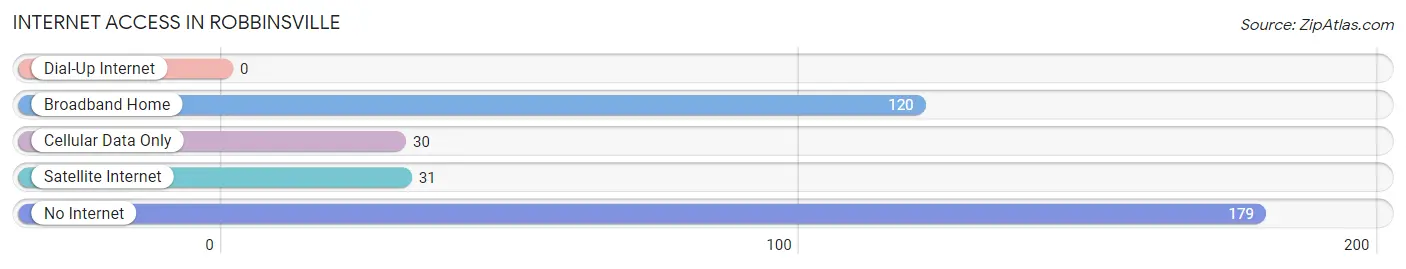
| Internet Type | # Households | % Households |
| Dial-Up Internet | 0 | 0.0% |
| Broadband Home | 120 | 35.7% |
| Cellular Data Only | 30 | 8.9% |
| Satellite Internet | 31 | 9.2% |
| No Internet | 179 | 53.3% |
| Total | 336 | 100.0% |
Robbinsville Summary
Robbinsville, North Carolina is a small town located in the western part of the state, in Graham County. It is situated in the Nantahala National Forest, and is surrounded by the Great Smoky Mountains. The town is home to a population of approximately 1,400 people, and is the county seat of Graham County.
History
Robbinsville was founded in 1872, when the town was incorporated. The town was named after the Robbins family, who were among the first settlers in the area. The town was originally a farming community, and the main crops grown were corn, wheat, and tobacco. In the early 1900s, the town began to grow and develop, and the first bank was established in 1908.
In the 1920s, the town began to experience a period of growth and development, and the first school was built in 1925. The town also saw the construction of a new courthouse in 1929. During the Great Depression, the town experienced a period of decline, but the economy began to recover in the 1940s.
In the 1950s, the town began to experience a period of growth and development, and the first hospital was built in 1954. The town also saw the construction of a new library in 1957. In the 1960s, the town experienced a period of growth and development, and the first shopping center was built in 1965.
Geography
Robbinsville is located in the western part of North Carolina, in Graham County. The town is situated in the Nantahala National Forest, and is surrounded by the Great Smoky Mountains. The town is located at an elevation of 1,890 feet, and has a total area of 1.3 square miles.
The town is located near the Nantahala River, and is home to several small lakes, including Lake Santeetlah and Lake Fontana. The town is also home to several small creeks, including the Cheoah River and the Little Tennessee River.
Economy
Robbinsville is a small town, and the economy is largely based on tourism. The town is home to several small businesses, including restaurants, shops, and hotels. The town is also home to several small manufacturing companies, including a furniture factory and a textile mill.
The town is also home to several small farms, and the main crops grown are corn, wheat, and tobacco. The town is also home to several small logging companies, and the timber industry is an important part of the local economy.
Demographics
As of the 2010 census, the population of Robbinsville was 1,400 people. The racial makeup of the town was 95.3% White, 0.7% African American, 0.7% Native American, 0.7% Asian, 0.3% from other races, and 2.0% from two or more races. Hispanic or Latino of any race were 1.3% of the population.
The median income for a household in the town was $30,000, and the median income for a family was $35,000. The per capita income for the town was $15,000. About 15.7% of families and 19.3% of the population were below the poverty line, including 25.0% of those under age 18 and 10.0% of those age 65 or over.
Common Questions
What is Per Capita Income in Robbinsville?
Per Capita income in Robbinsville is $14,606.
What is the Median Family Income in Robbinsville?
Median Family Income in Robbinsville is $28,750.
What is the Median Household income in Robbinsville?
Median Household Income in Robbinsville is $17,222.
What is Income or Wage Gap in Robbinsville?
Income or Wage Gap in Robbinsville is 36.3%.
Women in Robbinsville earn 63.7 cents for every dollar earned by a man.
What is Inequality or Gini Index in Robbinsville?
Inequality or Gini Index in Robbinsville is 0.46.
What is the Total Population of Robbinsville?
Total Population of Robbinsville is 705.
What is the Total Male Population of Robbinsville?
Total Male Population of Robbinsville is 303.
What is the Total Female Population of Robbinsville?
Total Female Population of Robbinsville is 402.
What is the Ratio of Males per 100 Females in Robbinsville?
There are 75.37 Males per 100 Females in Robbinsville.
What is the Ratio of Females per 100 Males in Robbinsville?
There are 132.67 Females per 100 Males in Robbinsville.
What is the Median Population Age in Robbinsville?
Median Population Age in Robbinsville is 54.9 Years.
What is the Average Family Size in Robbinsville
Average Family Size in Robbinsville is 2.8 People.
What is the Average Household Size in Robbinsville
Average Household Size in Robbinsville is 1.8 People.
How Large is the Labor Force in Robbinsville?
There are 201 People in the Labor Forcein in Robbinsville.
What is the Percentage of People in the Labor Force in Robbinsville?
32.6% of People are in the Labor Force in Robbinsville.
What is the Unemployment Rate in Robbinsville?
Unemployment Rate in Robbinsville is 2.5%.