Tarboro, NC Map & Demographics
Tarboro Map
Tarboro Overview
$30,196
PER CAPITA INCOME
$68,194
AVG FAMILY INCOME
$43,523
AVG HOUSEHOLD INCOME
0.3%
WAGE / INCOME GAP [ % ]
99.7¢/ $1
WAGE / INCOME GAP [ $ ]
0.53
INEQUALITY / GINI INDEX
10,696
TOTAL POPULATION
4,608
MALE POPULATION
6,088
FEMALE POPULATION
75.69
MALES / 100 FEMALES
132.12
FEMALES / 100 MALES
48.2
MEDIAN AGE
2.7
AVG FAMILY SIZE
2.1
AVG HOUSEHOLD SIZE
4,290
LABOR FORCE [ PEOPLE ]
50.3%
PERCENT IN LABOR FORCE
3.3%
UNEMPLOYMENT RATE
Tarboro Zip Codes
Tarboro Area Codes
Income in Tarboro
Income Overview in Tarboro
Per Capita Income in Tarboro is $30,196, while median incomes of families and households are $68,194 and $43,523 respectively.
| Characteristic | Number | Measure |
| Per Capita Income | 10,696 | $30,196 |
| Median Family Income | 2,911 | $68,194 |
| Mean Family Income | 2,911 | $83,318 |
| Median Household Income | 4,776 | $43,523 |
| Mean Household Income | 4,776 | $66,667 |
| Income Deficit | 2,911 | $0 |
| Wage / Income Gap (%) | 10,696 | 0.30% |
| Wage / Income Gap ($) | 10,696 | 99.70¢ per $1 |
| Gini / Inequality Index | 10,696 | 0.53 |
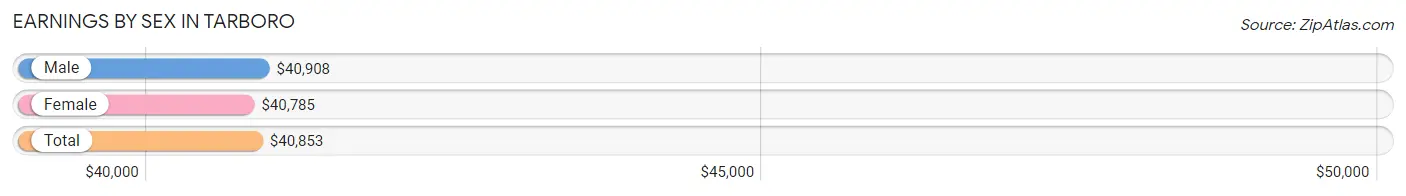
Earnings by Sex in Tarboro
Average Earnings in Tarboro are $40,853, $40,908 for men and $40,785 for women, a difference of 0.3%.
| Sex | Number | Average Earnings |
| Male | 1,891 (42.3%) | $40,908 |
| Female | 2,577 (57.7%) | $40,785 |
| Total | 4,468 (100.0%) | $40,853 |
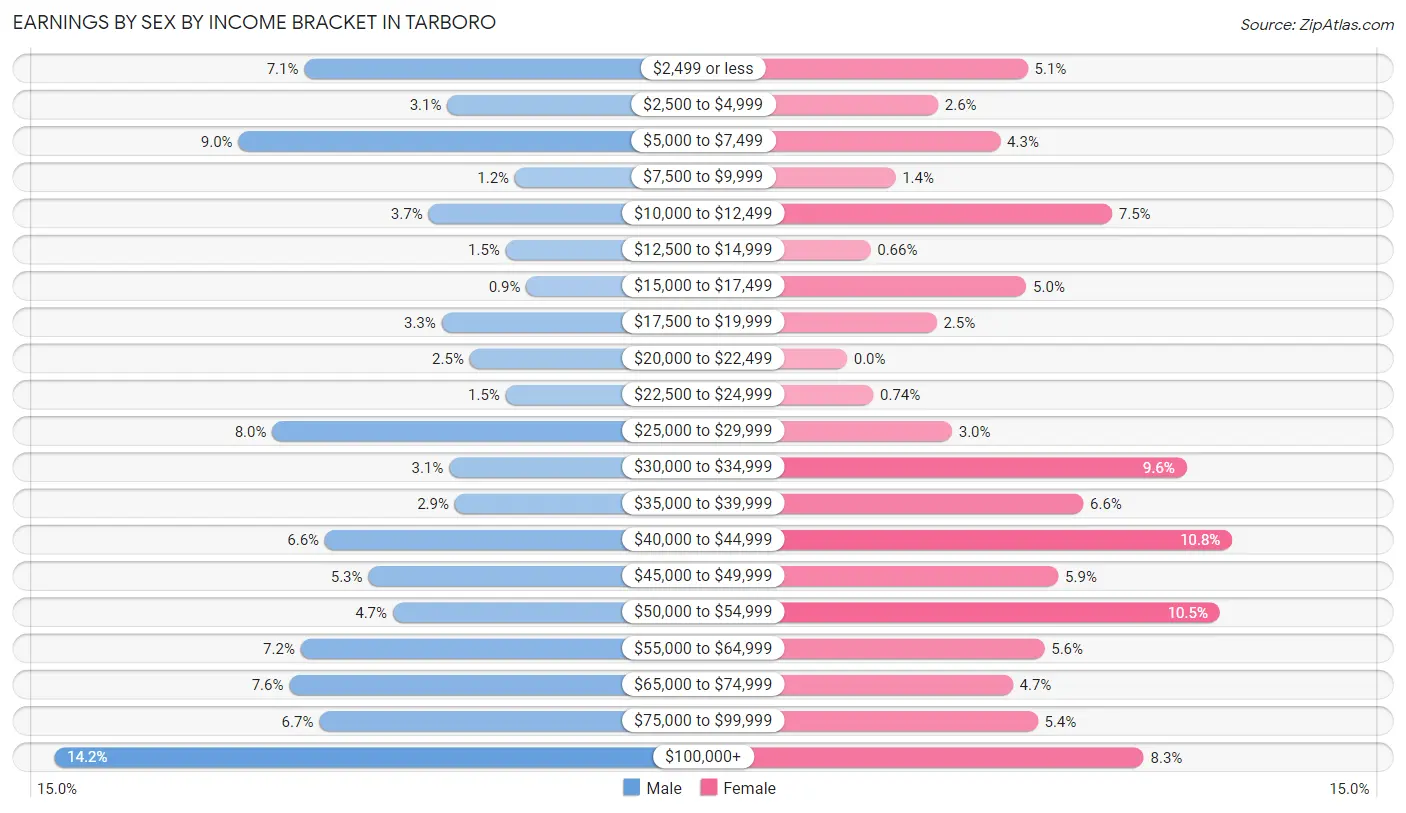
Earnings by Sex by Income Bracket in Tarboro
The most common earnings brackets in Tarboro are $100,000+ for men (268 | 14.2%) and $40,000 to $44,999 for women (279 | 10.8%).
| Income | Male | Female |
| $2,499 or less | 135 (7.1%) | 131 (5.1%) |
| $2,500 to $4,999 | 59 (3.1%) | 66 (2.6%) |
| $5,000 to $7,499 | 170 (9.0%) | 111 (4.3%) |
| $7,500 to $9,999 | 23 (1.2%) | 35 (1.4%) |
| $10,000 to $12,499 | 69 (3.6%) | 192 (7.4%) |
| $12,500 to $14,999 | 28 (1.5%) | 17 (0.7%) |
| $15,000 to $17,499 | 17 (0.9%) | 130 (5.0%) |
| $17,500 to $19,999 | 62 (3.3%) | 65 (2.5%) |
| $20,000 to $22,499 | 47 (2.5%) | 0 (0.0%) |
| $22,500 to $24,999 | 28 (1.5%) | 19 (0.7%) |
| $25,000 to $29,999 | 152 (8.0%) | 76 (2.9%) |
| $30,000 to $34,999 | 58 (3.1%) | 246 (9.6%) |
| $35,000 to $39,999 | 55 (2.9%) | 171 (6.6%) |
| $40,000 to $44,999 | 124 (6.6%) | 279 (10.8%) |
| $45,000 to $49,999 | 101 (5.3%) | 153 (5.9%) |
| $50,000 to $54,999 | 88 (4.6%) | 270 (10.5%) |
| $55,000 to $64,999 | 137 (7.2%) | 143 (5.6%) |
| $65,000 to $74,999 | 143 (7.6%) | 120 (4.7%) |
| $75,000 to $99,999 | 127 (6.7%) | 138 (5.4%) |
| $100,000+ | 268 (14.2%) | 215 (8.3%) |
| Total | 1,891 (100.0%) | 2,577 (100.0%) |
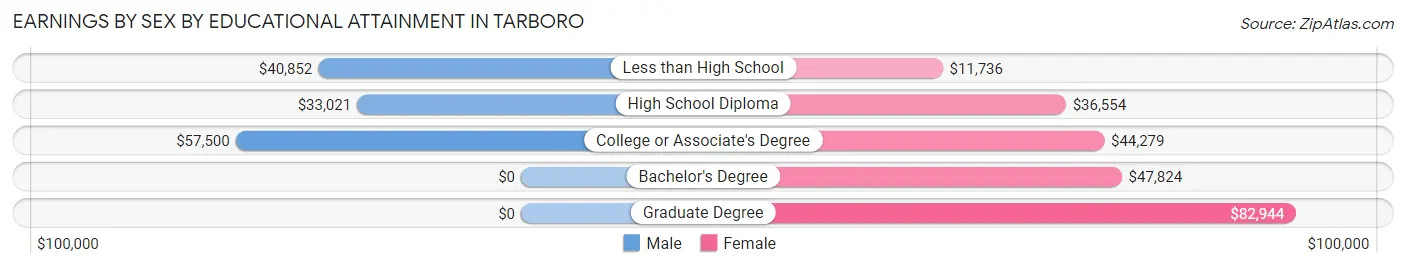
Earnings by Sex by Educational Attainment in Tarboro
Average earnings in Tarboro are $42,126 for men and $42,561 for women, a difference of 1.0%. Men with an educational attainment of college or associate's degree enjoy the highest average annual earnings of $57,500, while those with high school diploma education earn the least with $33,021. Women with an educational attainment of graduate degree earn the most with the average annual earnings of $82,944, while those with less than high school education have the smallest earnings of $11,736.
| Educational Attainment | Male Income | Female Income |
| Less than High School | $40,852 | $11,736 |
| High School Diploma | $33,021 | $36,554 |
| College or Associate's Degree | $57,500 | $44,279 |
| Bachelor's Degree | - | - |
| Graduate Degree | - | - |
| Total | $42,126 | $42,561 |
Family Income in Tarboro
Family Income Brackets in Tarboro
According to the Tarboro family income data, there are 533 families falling into the $100,000 to $149,999 income range, which is the most common income bracket and makes up 18.3% of all families. Conversely, the $10,000 to $14,999 income bracket is the least frequent group with only 175 families (6.0%) belonging to this category.
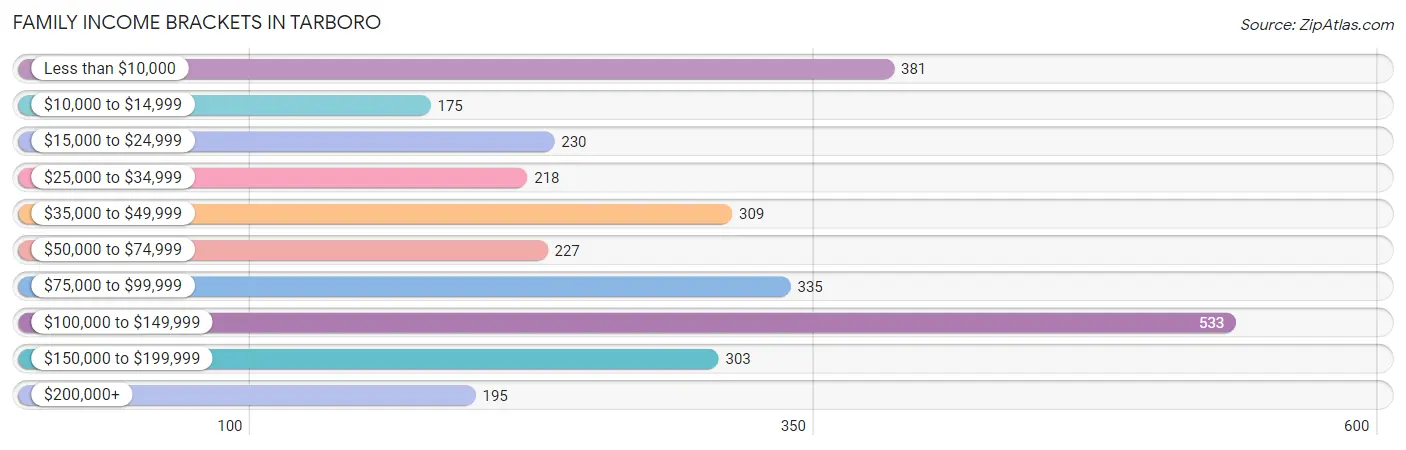
| Income Bracket | # Families | % Families |
| Less than $10,000 | 381 | 13.1% |
| $10,000 to $14,999 | 175 | 6.0% |
| $15,000 to $24,999 | 230 | 7.9% |
| $25,000 to $34,999 | 218 | 7.5% |
| $35,000 to $49,999 | 309 | 10.6% |
| $50,000 to $74,999 | 227 | 7.8% |
| $75,000 to $99,999 | 335 | 11.5% |
| $100,000 to $149,999 | 533 | 18.3% |
| $150,000 to $199,999 | 303 | 10.4% |
| $200,000+ | 195 | 6.7% |
Family Income by Famaliy Size in Tarboro
4-person families (302 | 10.4%) account for the highest median family income in Tarboro with $130,208 per family, while 4-person families (302 | 10.4%) have the highest median income of $32,552 per family member.
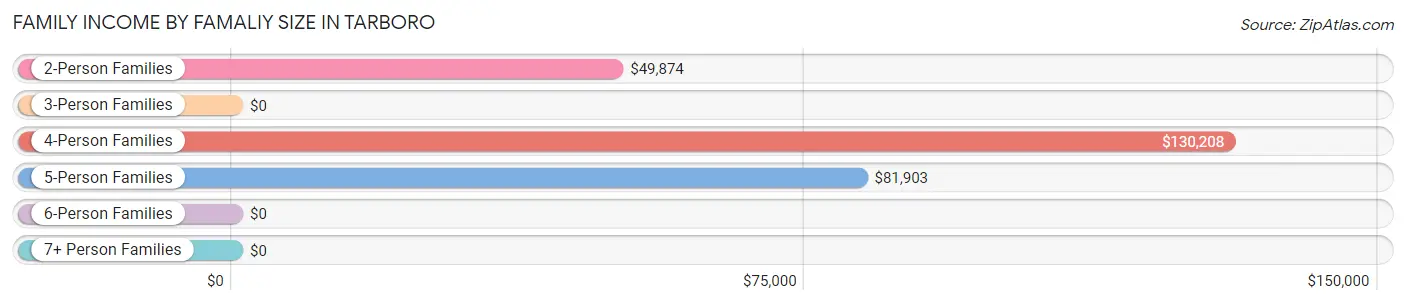
| Income Bracket | # Families | Median Income |
| 2-Person Families | 1,950 (67.0%) | $49,874 |
| 3-Person Families | 504 (17.3%) | $0 |
| 4-Person Families | 302 (10.4%) | $130,208 |
| 5-Person Families | 89 (3.1%) | $81,903 |
| 6-Person Families | 36 (1.2%) | $0 |
| 7+ Person Families | 30 (1.0%) | $0 |
| Total | 2,911 (100.0%) | $68,194 |
Family Income by Number of Earners in Tarboro
The median family income in Tarboro is $68,194, with families comprising 2 earners (756) having the highest median family income of $139,271, while families with no earners (959) have the lowest median family income of $25,446, accounting for 26.0% and 32.9% of families, respectively.
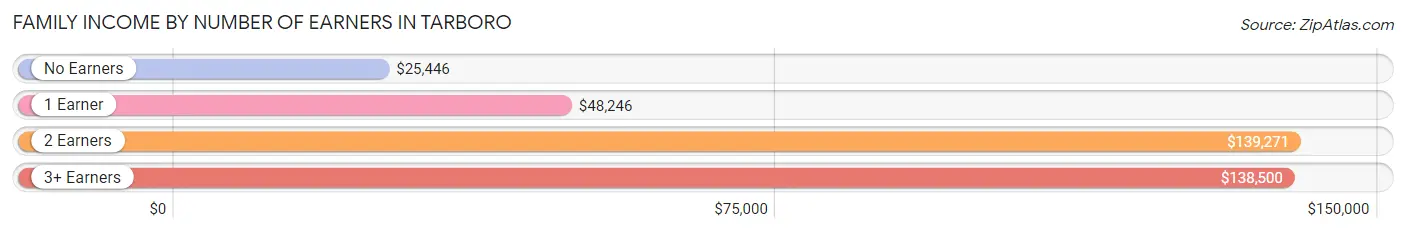
| Number of Earners | # Families | Median Income |
| No Earners | 959 (32.9%) | $25,446 |
| 1 Earner | 872 (30.0%) | $48,246 |
| 2 Earners | 756 (26.0%) | $139,271 |
| 3+ Earners | 324 (11.1%) | $138,500 |
| Total | 2,911 (100.0%) | $68,194 |
Household Income in Tarboro
Household Income Brackets in Tarboro
With 750 households falling in the category, the $15,000 to $24,999 income range is the most frequent in Tarboro, accounting for 15.7% of all households. In contrast, only 253 households (5.3%) fall into the $200,000+ income bracket, making it the least populous group.
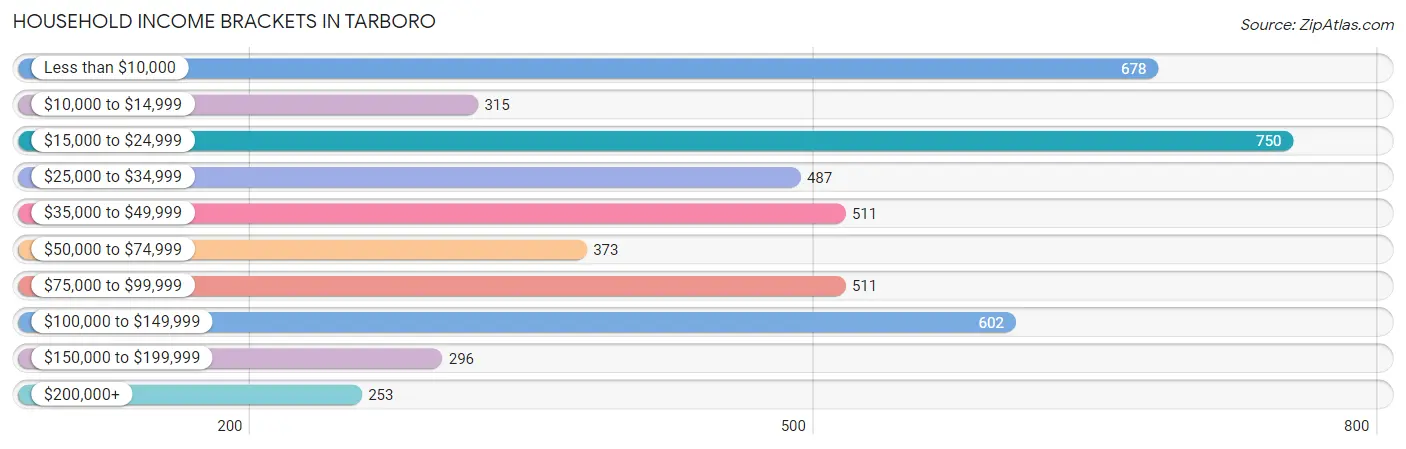
| Income Bracket | # Households | % Households |
| Less than $10,000 | 678 | 14.2% |
| $10,000 to $14,999 | 315 | 6.6% |
| $15,000 to $24,999 | 750 | 15.7% |
| $25,000 to $34,999 | 487 | 10.2% |
| $35,000 to $49,999 | 511 | 10.7% |
| $50,000 to $74,999 | 373 | 7.8% |
| $75,000 to $99,999 | 511 | 10.7% |
| $100,000 to $149,999 | 602 | 12.6% |
| $150,000 to $199,999 | 296 | 6.2% |
| $200,000+ | 253 | 5.3% |
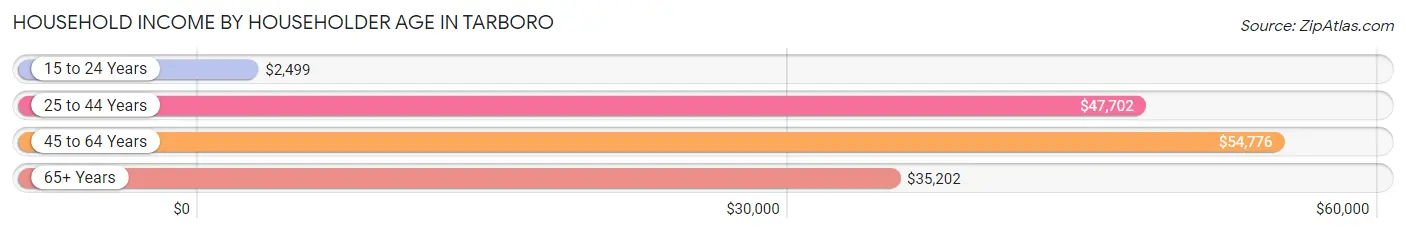
Household Income by Householder Age in Tarboro
The median household income in Tarboro is $43,523, with the highest median household income of $54,776 found in the 45 to 64 years age bracket for the primary householder. A total of 1,530 households (32.0%) fall into this category. Meanwhile, the 15 to 24 years age bracket for the primary householder has the lowest median household income of $2,499, with 260 households (5.4%) in this group.
| Income Bracket | # Households | Median Income |
| 15 to 24 Years | 260 (5.4%) | $2,499 |
| 25 to 44 Years | 1,054 (22.1%) | $47,702 |
| 45 to 64 Years | 1,530 (32.0%) | $54,776 |
| 65+ Years | 1,932 (40.5%) | $35,202 |
| Total | 4,776 (100.0%) | $43,523 |
Poverty in Tarboro
Income Below Poverty by Sex and Age in Tarboro
With 21.7% poverty level for males and 25.7% for females among the residents of Tarboro, 5 year old males and under 5 year old females are the most vulnerable to poverty, with 141 males (57.3%) and 185 females (81.9%) in their respective age groups living below the poverty level.
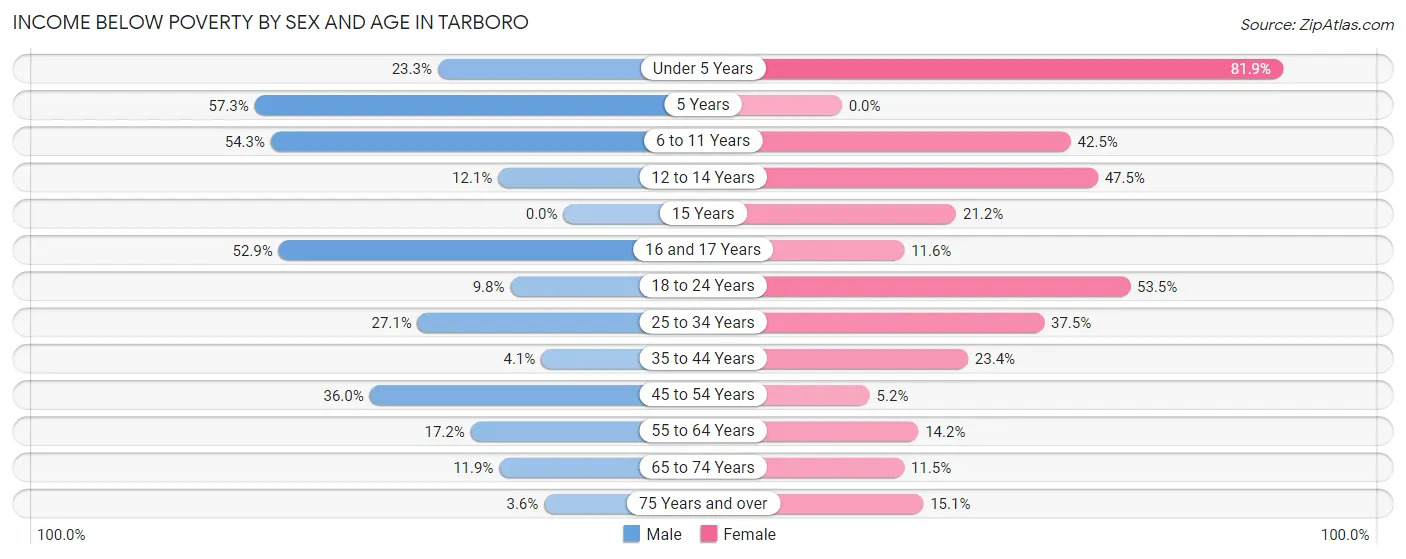
| Age Bracket | Male | Female |
| Under 5 Years | 73 (23.3%) | 185 (81.9%) |
| 5 Years | 141 (57.3%) | 0 (0.0%) |
| 6 to 11 Years | 145 (54.3%) | 226 (42.5%) |
| 12 to 14 Years | 23 (12.1%) | 76 (47.5%) |
| 15 Years | 0 (0.0%) | 14 (21.2%) |
| 16 and 17 Years | 46 (52.9%) | 11 (11.6%) |
| 18 to 24 Years | 18 (9.8%) | 205 (53.5%) |
| 25 to 34 Years | 111 (27.1%) | 235 (37.5%) |
| 35 to 44 Years | 16 (4.1%) | 144 (23.4%) |
| 45 to 54 Years | 154 (36.0%) | 18 (5.2%) |
| 55 to 64 Years | 165 (17.2%) | 123 (14.2%) |
| 65 to 74 Years | 61 (11.9%) | 114 (11.5%) |
| 75 Years and over | 14 (3.6%) | 109 (15.1%) |
| Total | 967 (21.7%) | 1,460 (25.7%) |
Income Above Poverty by Sex and Age in Tarboro
According to the poverty statistics in Tarboro, males aged 15 years and females aged 5 years are the age groups that are most secure financially, with 100.0% of males and 100.0% of females in these age groups living above the poverty line.
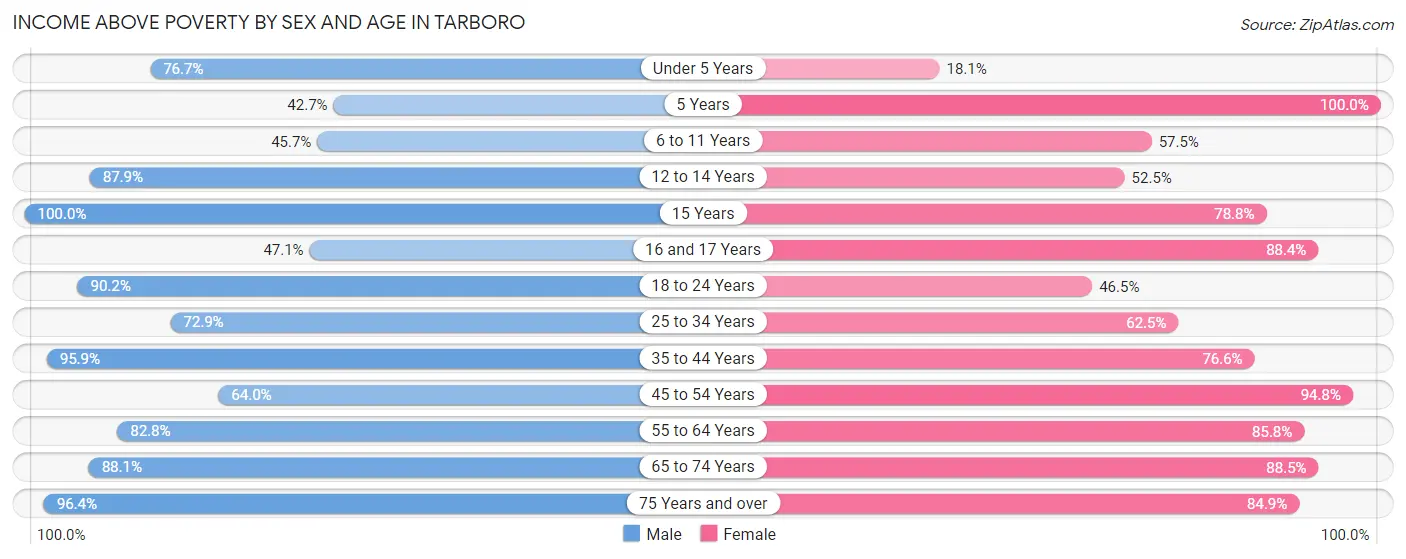
| Age Bracket | Male | Female |
| Under 5 Years | 240 (76.7%) | 41 (18.1%) |
| 5 Years | 105 (42.7%) | 52 (100.0%) |
| 6 to 11 Years | 122 (45.7%) | 306 (57.5%) |
| 12 to 14 Years | 167 (87.9%) | 84 (52.5%) |
| 15 Years | 75 (100.0%) | 52 (78.8%) |
| 16 and 17 Years | 41 (47.1%) | 84 (88.4%) |
| 18 to 24 Years | 165 (90.2%) | 178 (46.5%) |
| 25 to 34 Years | 299 (72.9%) | 391 (62.5%) |
| 35 to 44 Years | 371 (95.9%) | 471 (76.6%) |
| 45 to 54 Years | 274 (64.0%) | 330 (94.8%) |
| 55 to 64 Years | 793 (82.8%) | 744 (85.8%) |
| 65 to 74 Years | 451 (88.1%) | 874 (88.5%) |
| 75 Years and over | 378 (96.4%) | 612 (84.9%) |
| Total | 3,481 (78.3%) | 4,219 (74.3%) |
Income Below Poverty Among Married-Couple Families in Tarboro
The poverty statistics for married-couple families in Tarboro show that 1.6% or 26 of the total 1,627 families live below the poverty line. Families with no children have the highest poverty rate of 2.1%, comprising of 26 families. On the other hand, families with 1 or 2 children have the lowest poverty rate of 0.0%, which includes 0 families.
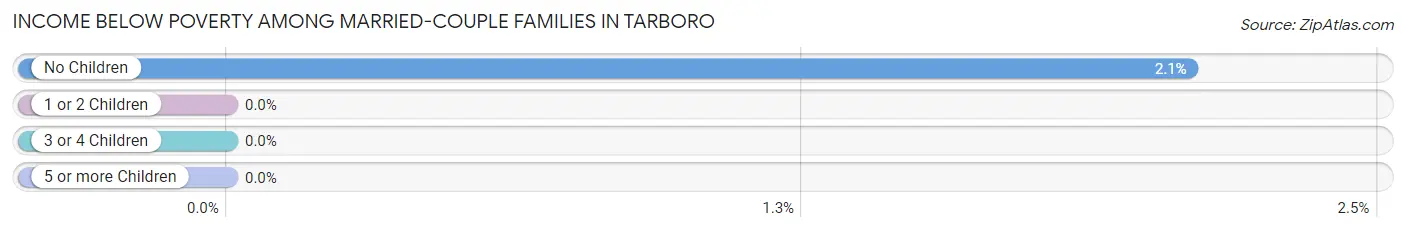
| Children | Above Poverty | Below Poverty |
| No Children | 1,216 (97.9%) | 26 (2.1%) |
| 1 or 2 Children | 327 (100.0%) | 0 (0.0%) |
| 3 or 4 Children | 58 (100.0%) | 0 (0.0%) |
| 5 or more Children | 0 (0.0%) | 0 (0.0%) |
| Total | 1,601 (98.4%) | 26 (1.6%) |
Income Below Poverty Among Single-Parent Households in Tarboro
According to the poverty data in Tarboro, 55.5% or 141 single-father households and 52.4% or 540 single-mother households are living below the poverty line. Among single-father households, those with 3 or 4 children have the highest poverty rate, with 7 households (100.0%) experiencing poverty. Likewise, among single-mother households, those with 3 or 4 children have the highest poverty rate, with 63 households (100.0%) falling below the poverty line.
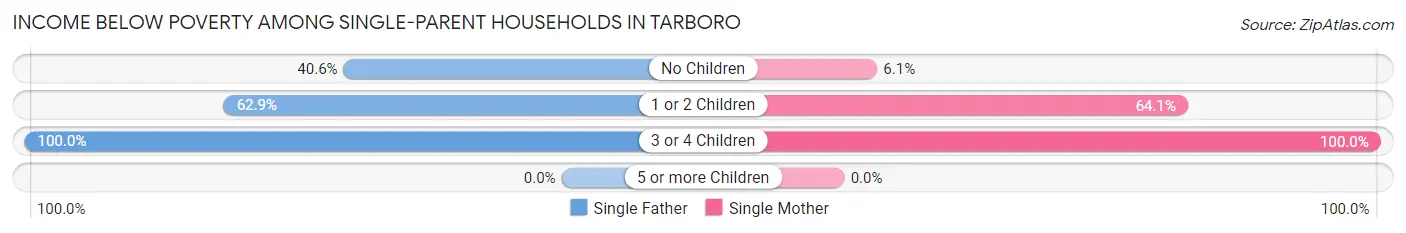
| Children | Single Father | Single Mother |
| No Children | 39 (40.6%) | 15 (6.1%) |
| 1 or 2 Children | 95 (62.9%) | 462 (64.1%) |
| 3 or 4 Children | 7 (100.0%) | 63 (100.0%) |
| 5 or more Children | 0 (0.0%) | 0 (0.0%) |
| Total | 141 (55.5%) | 540 (52.4%) |
Income Below Poverty Among Married-Couple vs Single-Parent Households in Tarboro
The poverty data for Tarboro shows that 26 of the married-couple family households (1.6%) and 681 of the single-parent households (53.0%) are living below the poverty level. Within the married-couple family households, those with no children have the highest poverty rate, with 26 households (2.1%) falling below the poverty line. Among the single-parent households, those with 3 or 4 children have the highest poverty rate, with 70 household (100.0%) living below poverty.
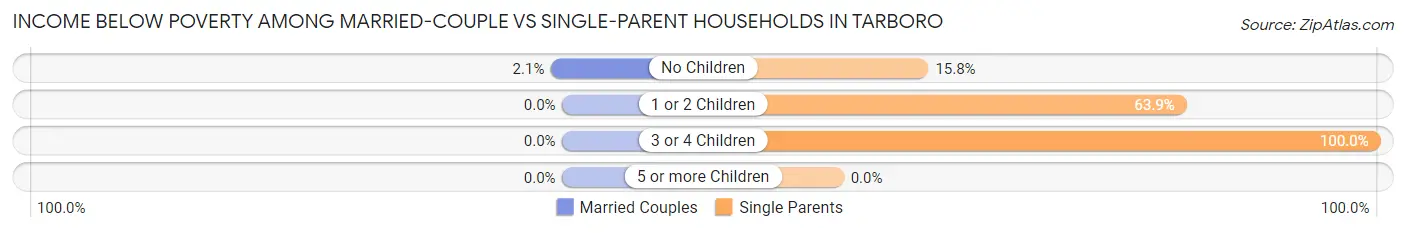
| Children | Married-Couple Families | Single-Parent Households |
| No Children | 26 (2.1%) | 54 (15.8%) |
| 1 or 2 Children | 0 (0.0%) | 557 (63.9%) |
| 3 or 4 Children | 0 (0.0%) | 70 (100.0%) |
| 5 or more Children | 0 (0.0%) | 0 (0.0%) |
| Total | 26 (1.6%) | 681 (53.0%) |
Race in Tarboro
The most populous races in Tarboro are Black / African American (5,316 | 49.7%), White / Caucasian (4,946 | 46.2%), and Hispanic or Latino (650 | 6.1%).
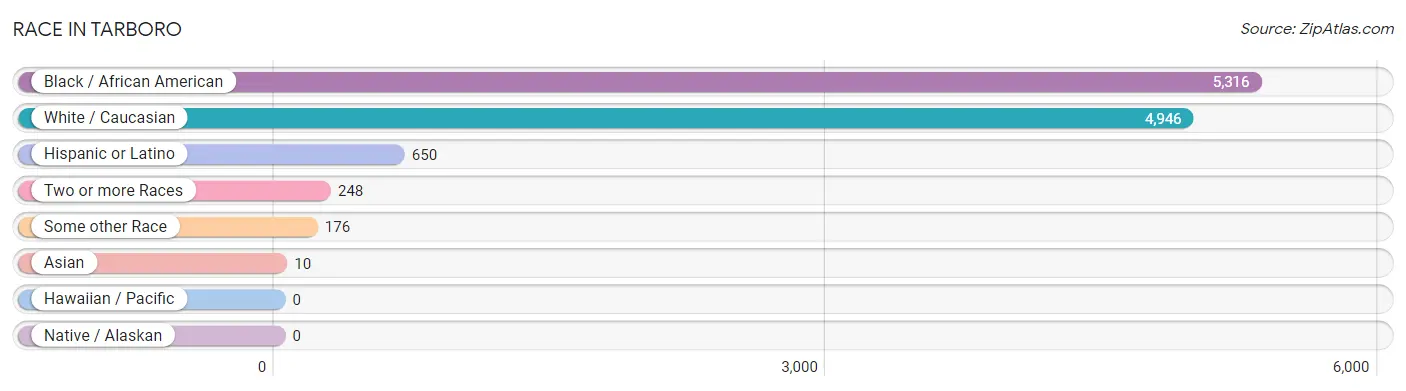
| Race | # Population | % Population |
| Asian | 10 | 0.1% |
| Black / African American | 5,316 | 49.7% |
| Hawaiian / Pacific | 0 | 0.0% |
| Hispanic or Latino | 650 | 6.1% |
| Native / Alaskan | 0 | 0.0% |
| White / Caucasian | 4,946 | 46.2% |
| Two or more Races | 248 | 2.3% |
| Some other Race | 176 | 1.7% |
| Total | 10,696 | 100.0% |
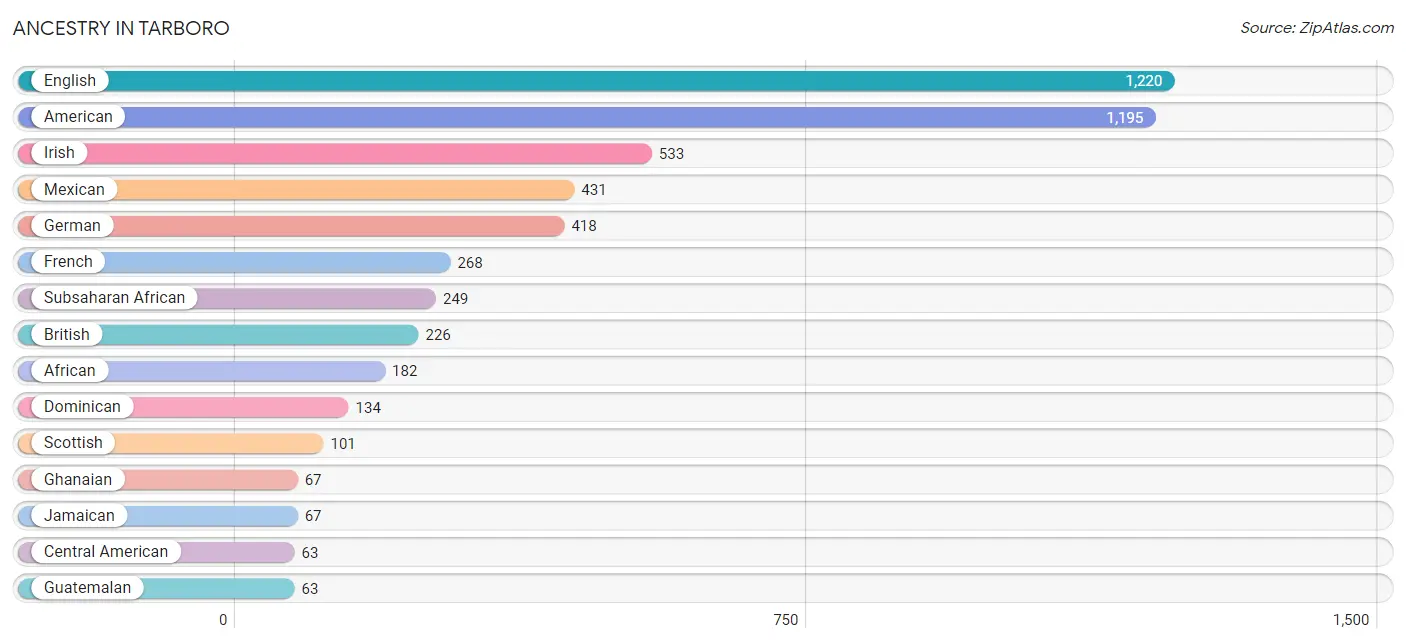
Ancestry in Tarboro
The most populous ancestries reported in Tarboro are English (1,220 | 11.4%), American (1,195 | 11.2%), Irish (533 | 5.0%), Mexican (431 | 4.0%), and German (418 | 3.9%), together accounting for 35.5% of all Tarboro residents.
| Ancestry | # Population | % Population |
| African | 182 | 1.7% |
| American | 1,195 | 11.2% |
| Arab | 35 | 0.3% |
| Bhutanese | 7 | 0.1% |
| British | 226 | 2.1% |
| Burmese | 1 | 0.0% |
| Central American | 63 | 0.6% |
| Dominican | 134 | 1.3% |
| Dutch | 37 | 0.4% |
| English | 1,220 | 11.4% |
| European | 44 | 0.4% |
| French | 268 | 2.5% |
| French Canadian | 3 | 0.0% |
| German | 418 | 3.9% |
| Ghanaian | 67 | 0.6% |
| Guatemalan | 63 | 0.6% |
| Indian (Asian) | 9 | 0.1% |
| Irish | 533 | 5.0% |
| Italian | 40 | 0.4% |
| Jamaican | 67 | 0.6% |
| Lebanese | 35 | 0.3% |
| Mexican | 431 | 4.0% |
| Peruvian | 22 | 0.2% |
| Scotch-Irish | 16 | 0.2% |
| Scottish | 101 | 0.9% |
| South American | 22 | 0.2% |
| Subsaharan African | 249 | 2.3% |
| Swedish | 3 | 0.0% |
| Ukrainian | 7 | 0.1% |
| Welsh | 39 | 0.4% |
| Yugoslavian | 12 | 0.1% | View All 31 Rows |
Immigrants in Tarboro
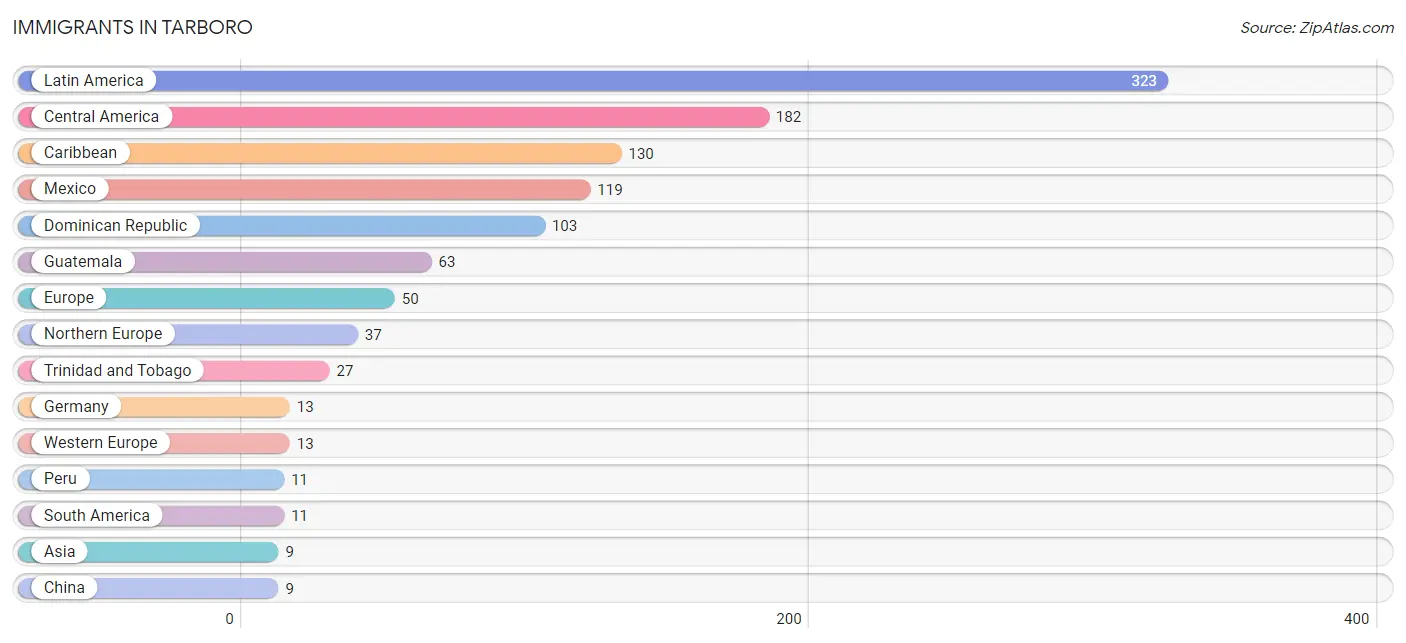
The most numerous immigrant groups reported in Tarboro came from Latin America (323 | 3.0%), Central America (182 | 1.7%), Caribbean (130 | 1.2%), Mexico (119 | 1.1%), and Dominican Republic (103 | 1.0%), together accounting for 8.0% of all Tarboro residents.
| Immigration Origin | # Population | % Population |
| Asia | 9 | 0.1% |
| Caribbean | 130 | 1.2% |
| Central America | 182 | 1.7% |
| China | 9 | 0.1% |
| Dominican Republic | 103 | 1.0% |
| Eastern Asia | 9 | 0.1% |
| Europe | 50 | 0.5% |
| Germany | 13 | 0.1% |
| Guatemala | 63 | 0.6% |
| Latin America | 323 | 3.0% |
| Mexico | 119 | 1.1% |
| Northern Europe | 37 | 0.4% |
| Peru | 11 | 0.1% |
| Scotland | 9 | 0.1% |
| South America | 11 | 0.1% |
| Taiwan | 9 | 0.1% |
| Trinidad and Tobago | 27 | 0.3% |
| Western Europe | 13 | 0.1% | View All 18 Rows |
Sex and Age in Tarboro
Sex and Age in Tarboro
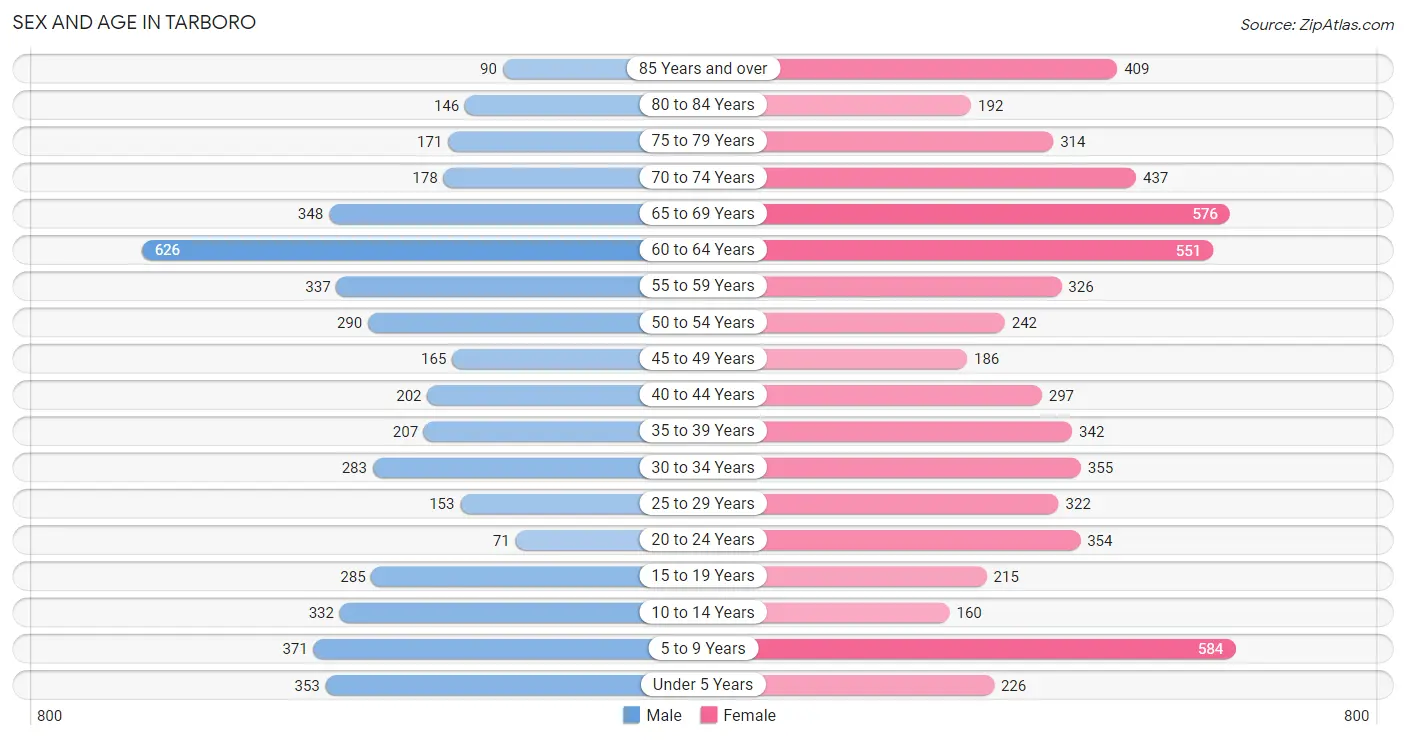
The most populous age groups in Tarboro are 60 to 64 Years (626 | 13.6%) for men and 5 to 9 Years (584 | 9.6%) for women.
| Age Bracket | Male | Female |
| Under 5 Years | 353 (7.7%) | 226 (3.7%) |
| 5 to 9 Years | 371 (8.1%) | 584 (9.6%) |
| 10 to 14 Years | 332 (7.2%) | 160 (2.6%) |
| 15 to 19 Years | 285 (6.2%) | 215 (3.5%) |
| 20 to 24 Years | 71 (1.5%) | 354 (5.8%) |
| 25 to 29 Years | 153 (3.3%) | 322 (5.3%) |
| 30 to 34 Years | 283 (6.1%) | 355 (5.8%) |
| 35 to 39 Years | 207 (4.5%) | 342 (5.6%) |
| 40 to 44 Years | 202 (4.4%) | 297 (4.9%) |
| 45 to 49 Years | 165 (3.6%) | 186 (3.1%) |
| 50 to 54 Years | 290 (6.3%) | 242 (4.0%) |
| 55 to 59 Years | 337 (7.3%) | 326 (5.3%) |
| 60 to 64 Years | 626 (13.6%) | 551 (9.0%) |
| 65 to 69 Years | 348 (7.5%) | 576 (9.5%) |
| 70 to 74 Years | 178 (3.9%) | 437 (7.2%) |
| 75 to 79 Years | 171 (3.7%) | 314 (5.2%) |
| 80 to 84 Years | 146 (3.2%) | 192 (3.2%) |
| 85 Years and over | 90 (1.9%) | 409 (6.7%) |
| Total | 4,608 (100.0%) | 6,088 (100.0%) |
Families and Households in Tarboro
Median Family Size in Tarboro
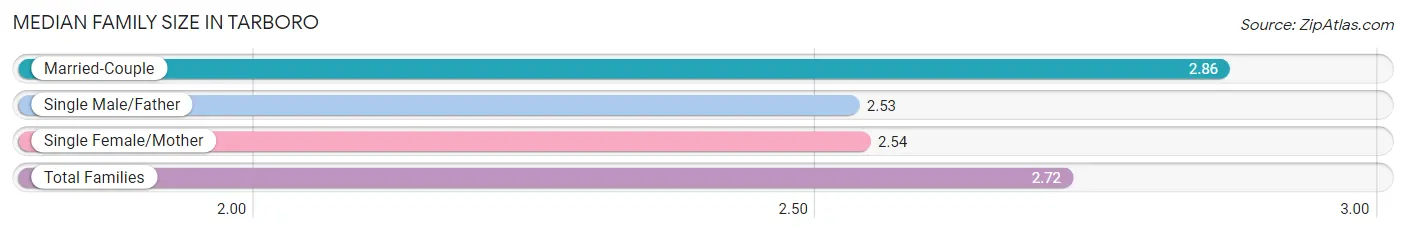
The median family size in Tarboro is 2.72 persons per family, with married-couple families (1,627 | 55.9%) accounting for the largest median family size of 2.86 persons per family. On the other hand, single male/father families (254 | 8.7%) represent the smallest median family size with 2.53 persons per family.
| Family Type | # Families | Family Size |
| Married-Couple | 1,627 (55.9%) | 2.86 |
| Single Male/Father | 254 (8.7%) | 2.53 |
| Single Female/Mother | 1,030 (35.4%) | 2.54 |
| Total Families | 2,911 (100.0%) | 2.72 |
Median Household Size in Tarboro
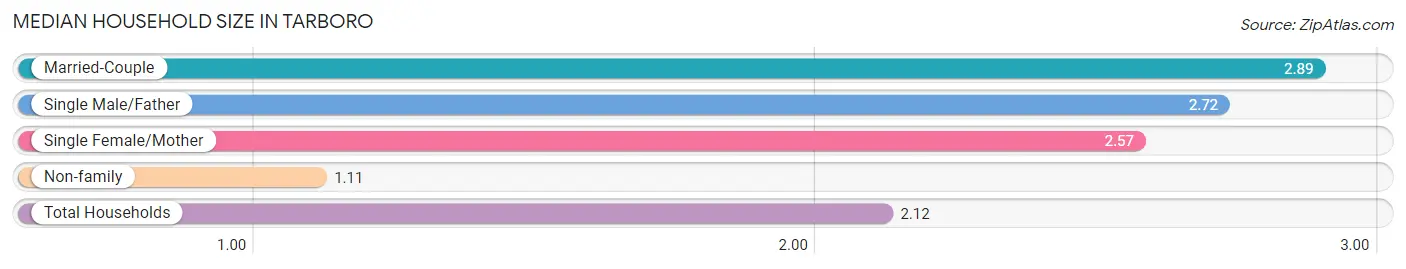
The median household size in Tarboro is 2.12 persons per household, with married-couple households (1,627 | 34.1%) accounting for the largest median household size of 2.89 persons per household. non-family households (1,865 | 39.1%) represent the smallest median household size with 1.11 persons per household.
| Household Type | # Households | Household Size |
| Married-Couple | 1,627 (34.1%) | 2.89 |
| Single Male/Father | 254 (5.3%) | 2.72 |
| Single Female/Mother | 1,030 (21.6%) | 2.57 |
| Non-family | 1,865 (39.1%) | 1.11 |
| Total Households | 4,776 (100.0%) | 2.12 |
Household Size by Marriage Status in Tarboro
Out of a total of 4,776 households in Tarboro, 2,911 (61.0%) are family households, while 1,865 (39.1%) are nonfamily households. The most numerous type of family households are 2-person households, comprising 1,909, and the most common type of nonfamily households are 1-person households, comprising 1,672.
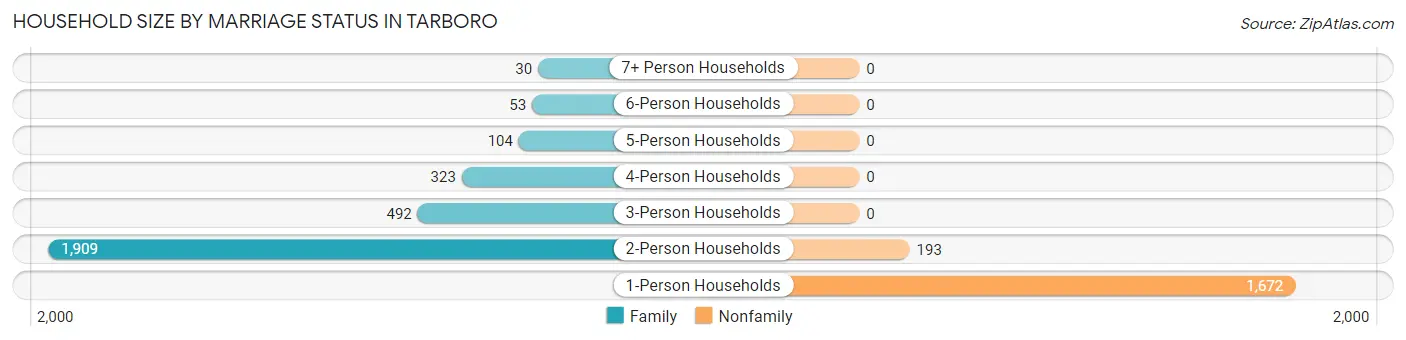
| Household Size | Family Households | Nonfamily Households |
| 1-Person Households | - | 1,672 (35.0%) |
| 2-Person Households | 1,909 (40.0%) | 193 (4.0%) |
| 3-Person Households | 492 (10.3%) | 0 (0.0%) |
| 4-Person Households | 323 (6.8%) | 0 (0.0%) |
| 5-Person Households | 104 (2.2%) | 0 (0.0%) |
| 6-Person Households | 53 (1.1%) | 0 (0.0%) |
| 7+ Person Households | 30 (0.6%) | 0 (0.0%) |
| Total | 2,911 (61.0%) | 1,865 (39.1%) |
Female Fertility in Tarboro
Fertility by Age in Tarboro
Average fertility rate in Tarboro is 21.0 births per 1,000 women. Women in the age bracket of 20 to 34 years have the highest fertility rate with 33.0 births per 1,000 women. Women in the age bracket of 20 to 34 years acount for 77.3% of all women with births.
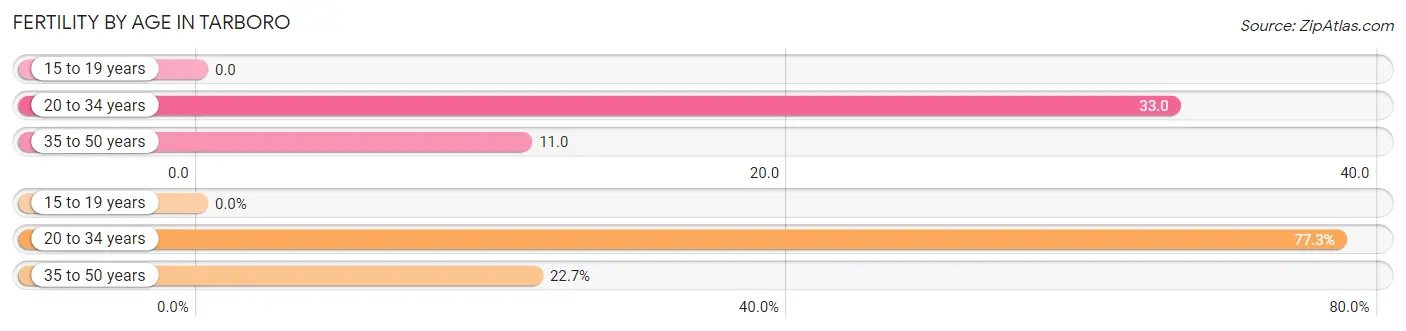
| Age Bracket | Women with Births | Births / 1,000 Women |
| 15 to 19 years | 0 (0.0%) | 0.0 |
| 20 to 34 years | 34 (77.3%) | 33.0 |
| 35 to 50 years | 10 (22.7%) | 11.0 |
| Total | 44 (100.0%) | 21.0 |
Fertility by Age by Marriage Status in Tarboro
15.9% of women with births (44) in Tarboro are married. The highest percentage of unmarried women with births falls into 35 to 50 years age bracket with 100.0% of them unmarried at the time of birth, while the lowest percentage of unmarried women with births belong to 20 to 34 years age bracket with 79.4% of them unmarried.
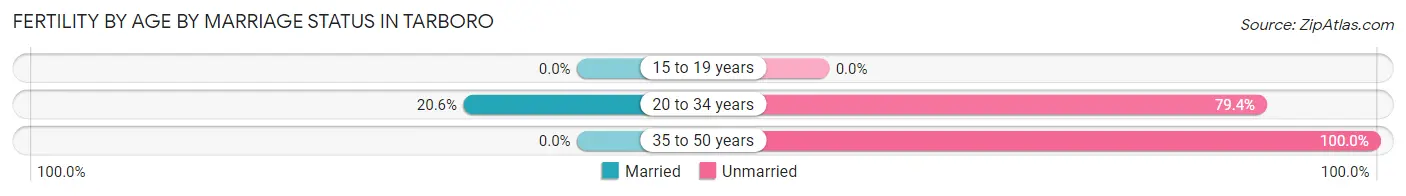
| Age Bracket | Married | Unmarried |
| 15 to 19 years | 0 (0.0%) | 0 (0.0%) |
| 20 to 34 years | 7 (20.6%) | 27 (79.4%) |
| 35 to 50 years | 0 (0.0%) | 10 (100.0%) |
| Total | 7 (15.9%) | 37 (84.1%) |
Fertility by Education in Tarboro
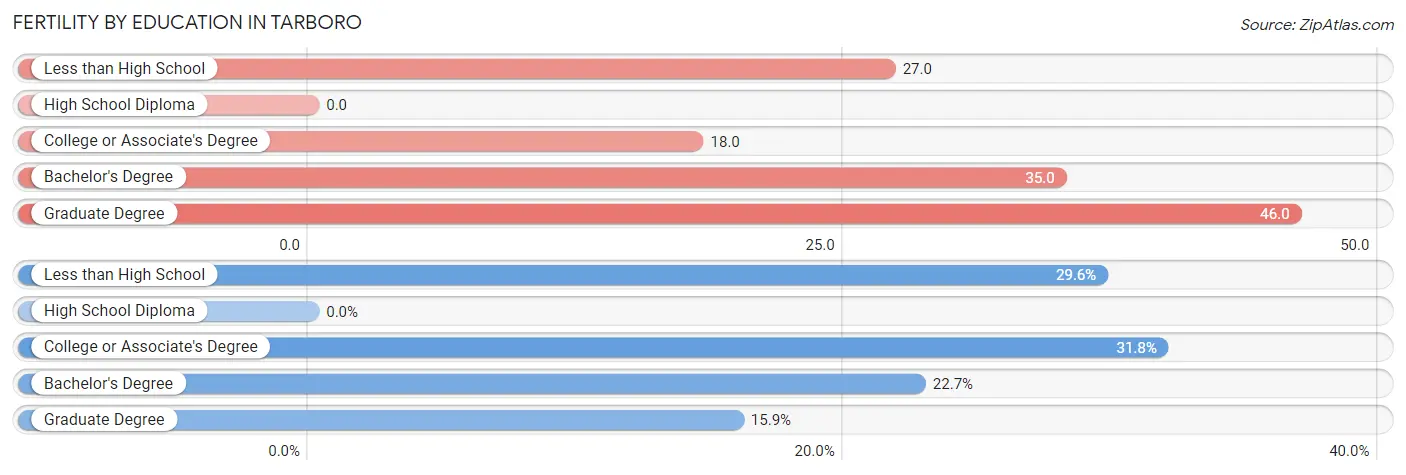
| Educational Attainment | Women with Births | Births / 1,000 Women |
| Less than High School | 13 (29.5%) | 27.0 |
| High School Diploma | 0 (0.0%) | 0.0 |
| College or Associate's Degree | 14 (31.8%) | 18.0 |
| Bachelor's Degree | 10 (22.7%) | 35.0 |
| Graduate Degree | 7 (15.9%) | 46.0 |
| Total | 44 (100.0%) | 21.0 |
Fertility by Education by Marriage Status in Tarboro
84.1% of women with births in Tarboro are unmarried. Women with the educational attainment of graduate degree are most likely to be married with 100.0% of them married at childbirth, while women with the educational attainment of less than high school are least likely to be married with 100.0% of them unmarried at childbirth.
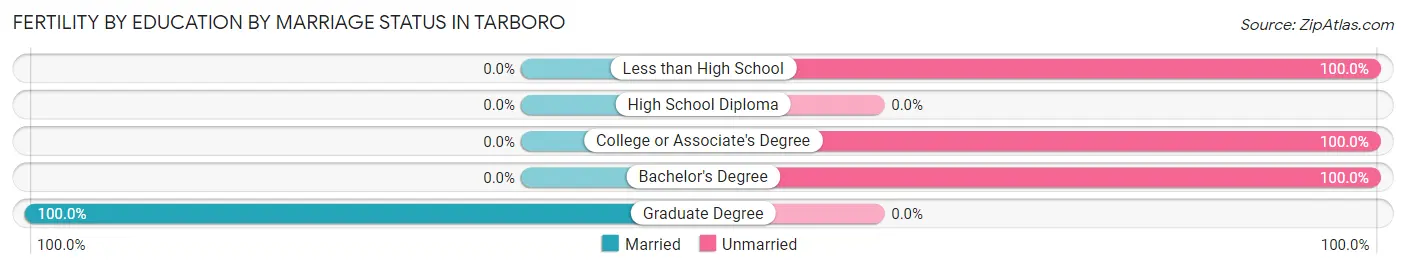
| Educational Attainment | Married | Unmarried |
| Less than High School | 0 (0.0%) | 13 (100.0%) |
| High School Diploma | 0 (0.0%) | 0 (0.0%) |
| College or Associate's Degree | 0 (0.0%) | 14 (100.0%) |
| Bachelor's Degree | 0 (0.0%) | 10 (100.0%) |
| Graduate Degree | 7 (100.0%) | 0 (0.0%) |
| Total | 7 (15.9%) | 37 (84.1%) |
Employment Characteristics in Tarboro
Employment by Class of Employer in Tarboro
Among the 4,110 employed individuals in Tarboro, private company employees (2,676 | 65.1%), state government employees (384 | 9.3%), and local government employees (305 | 7.4%) make up the most common classes of employment.
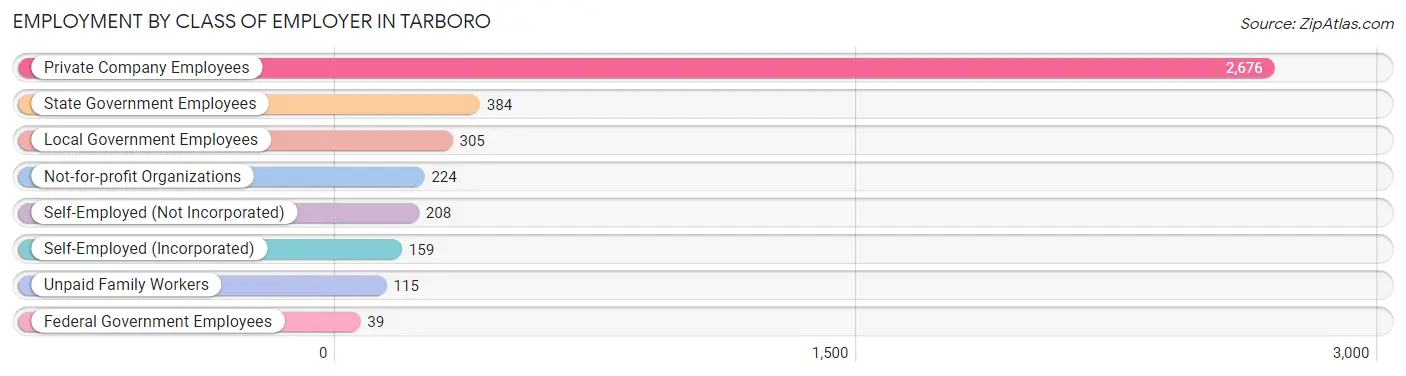
| Employer Class | # Employees | % Employees |
| Private Company Employees | 2,676 | 65.1% |
| Self-Employed (Incorporated) | 159 | 3.9% |
| Self-Employed (Not Incorporated) | 208 | 5.1% |
| Not-for-profit Organizations | 224 | 5.4% |
| Local Government Employees | 305 | 7.4% |
| State Government Employees | 384 | 9.3% |
| Federal Government Employees | 39 | 0.9% |
| Unpaid Family Workers | 115 | 2.8% |
| Total | 4,110 | 100.0% |
Employment Status by Age in Tarboro
According to the labor force statistics for Tarboro, out of the total population over 16 years of age (8,529), 50.3% or 4,290 individuals are in the labor force, with 3.3% or 142 of them unemployed. The age group with the highest labor force participation rate is 35 to 44 years, with 87.1% or 913 individuals in the labor force. Within the labor force, the 16 to 19 years age range has the highest percentage of unemployed individuals, with 47.5% or 58 of them being unemployed.
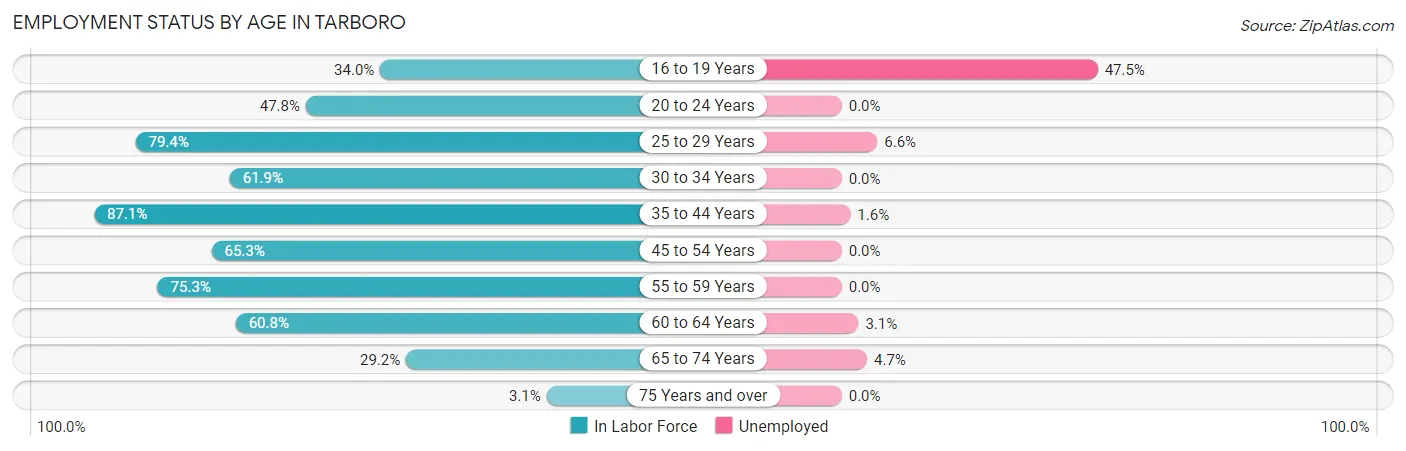
| Age Bracket | In Labor Force | Unemployed |
| 16 to 19 Years | 122 (34.0%) | 58 (47.5%) |
| 20 to 24 Years | 203 (47.8%) | 0 (0.0%) |
| 25 to 29 Years | 377 (79.4%) | 25 (6.6%) |
| 30 to 34 Years | 395 (61.9%) | 0 (0.0%) |
| 35 to 44 Years | 913 (87.1%) | 15 (1.6%) |
| 45 to 54 Years | 577 (65.3%) | 0 (0.0%) |
| 55 to 59 Years | 499 (75.3%) | 0 (0.0%) |
| 60 to 64 Years | 716 (60.8%) | 22 (3.1%) |
| 65 to 74 Years | 449 (29.2%) | 21 (4.7%) |
| 75 Years and over | 41 (3.1%) | 0 (0.0%) |
| Total | 4,290 (50.3%) | 142 (3.3%) |
Employment Status by Educational Attainment in Tarboro
According to labor force statistics for Tarboro, 71.2% of individuals (3,477) out of the total population between 25 and 64 years of age (4,884) are in the labor force, with 1.8% or 63 of them being unemployed. The group with the highest labor force participation rate are those with the educational attainment of college / associate degree, with 81.2% or 1,383 individuals in the labor force. Within the labor force, individuals with less than high school education have the highest percentage of unemployment, with 7.2% or 15 of them being unemployed.
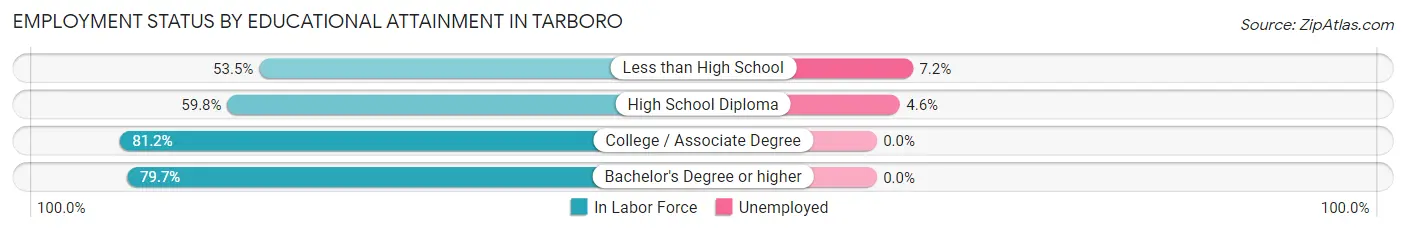
| Educational Attainment | In Labor Force | Unemployed |
| Less than High School | 209 (53.5%) | 28 (7.2%) |
| High School Diploma | 1,016 (59.8%) | 78 (4.6%) |
| College / Associate Degree | 1,383 (81.2%) | 0 (0.0%) |
| Bachelor's Degree or higher | 870 (79.7%) | 0 (0.0%) |
| Total | 3,477 (71.2%) | 88 (1.8%) |
Employment Occupations by Sex in Tarboro
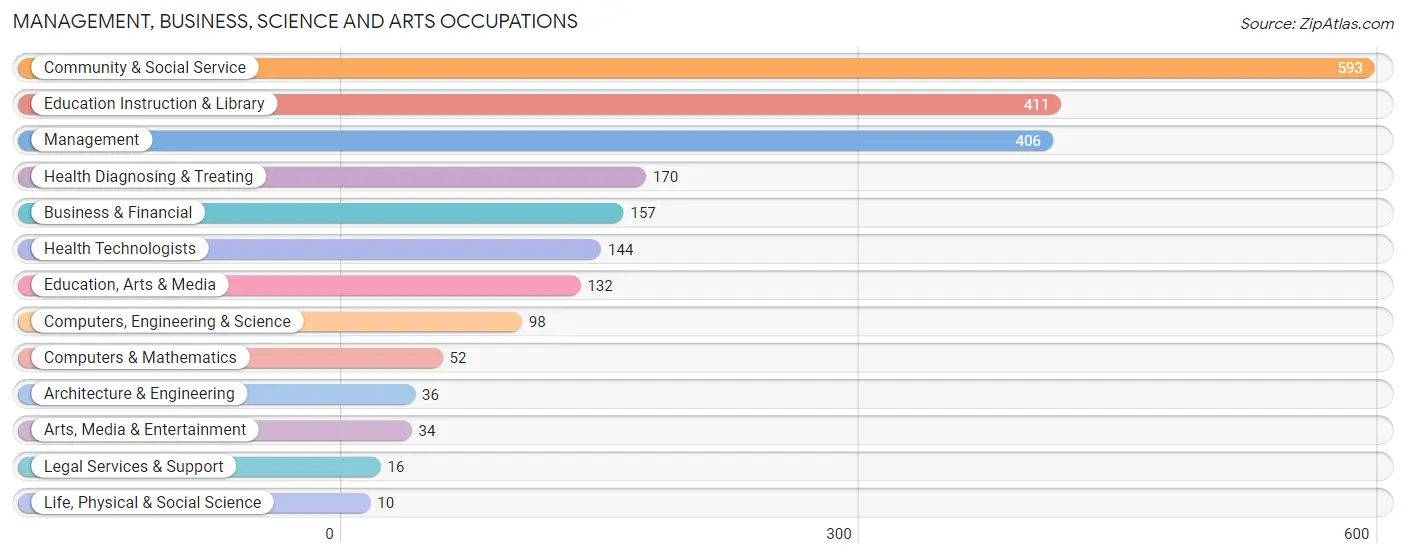
Management, Business, Science and Arts Occupations
The most common Management, Business, Science and Arts occupations in Tarboro are Community & Social Service (593 | 14.3%), Education Instruction & Library (411 | 9.9%), Management (406 | 9.8%), Health Diagnosing & Treating (170 | 4.1%), and Business & Financial (157 | 3.8%).
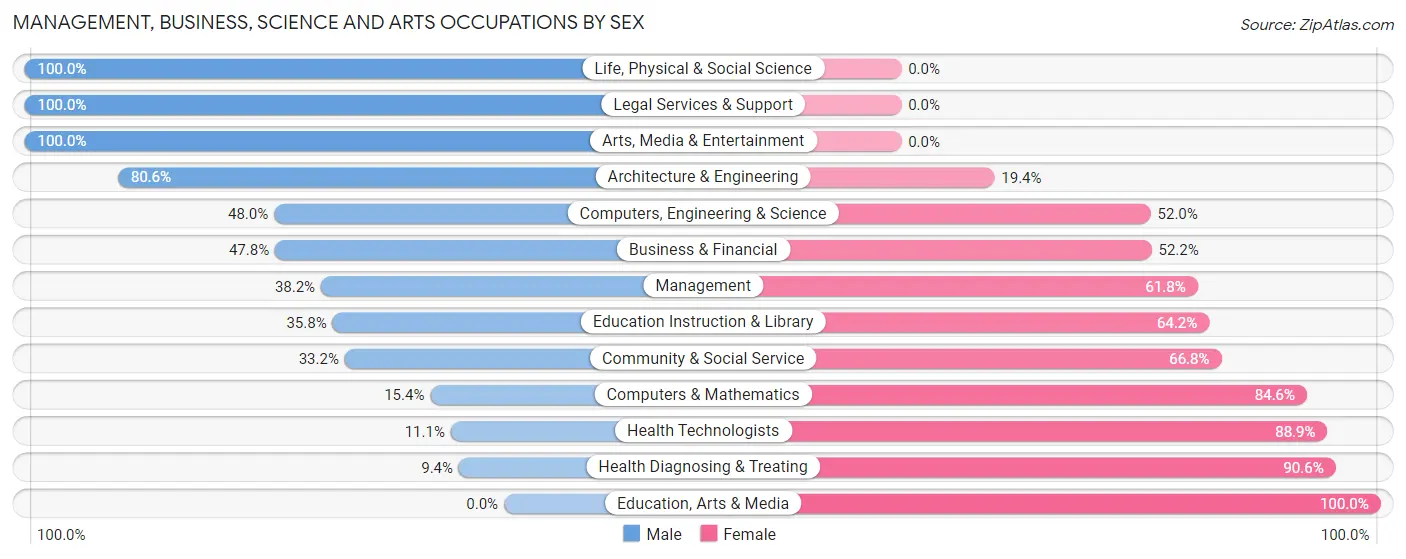
Management, Business, Science and Arts Occupations by Sex
Within the Management, Business, Science and Arts occupations in Tarboro, the most male-oriented occupations are Life, Physical & Social Science (100.0%), Legal Services & Support (100.0%), and Arts, Media & Entertainment (100.0%), while the most female-oriented occupations are Education, Arts & Media (100.0%), Health Diagnosing & Treating (90.6%), and Health Technologists (88.9%).
| Occupation | Male | Female |
| Management | 155 (38.2%) | 251 (61.8%) |
| Business & Financial | 75 (47.8%) | 82 (52.2%) |
| Computers, Engineering & Science | 47 (48.0%) | 51 (52.0%) |
| Computers & Mathematics | 8 (15.4%) | 44 (84.6%) |
| Architecture & Engineering | 29 (80.6%) | 7 (19.4%) |
| Life, Physical & Social Science | 10 (100.0%) | 0 (0.0%) |
| Community & Social Service | 197 (33.2%) | 396 (66.8%) |
| Education, Arts & Media | 0 (0.0%) | 132 (100.0%) |
| Legal Services & Support | 16 (100.0%) | 0 (0.0%) |
| Education Instruction & Library | 147 (35.8%) | 264 (64.2%) |
| Arts, Media & Entertainment | 34 (100.0%) | 0 (0.0%) |
| Health Diagnosing & Treating | 16 (9.4%) | 154 (90.6%) |
| Health Technologists | 16 (11.1%) | 128 (88.9%) |
| Total (Category) | 490 (34.4%) | 934 (65.6%) |
| Total (Overall) | 1,726 (41.6%) | 2,426 (58.4%) |
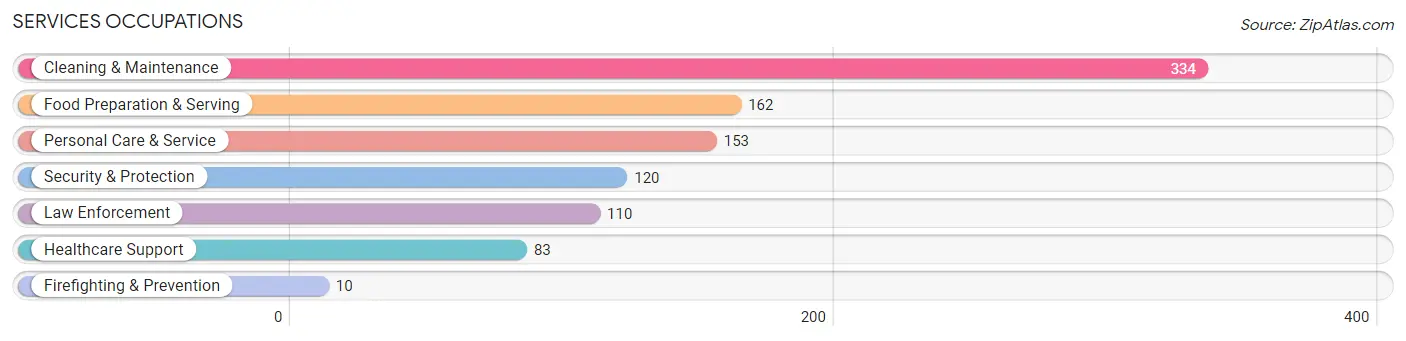
Services Occupations
The most common Services occupations in Tarboro are Cleaning & Maintenance (334 | 8.0%), Food Preparation & Serving (162 | 3.9%), Personal Care & Service (153 | 3.7%), Security & Protection (120 | 2.9%), and Law Enforcement (110 | 2.6%).
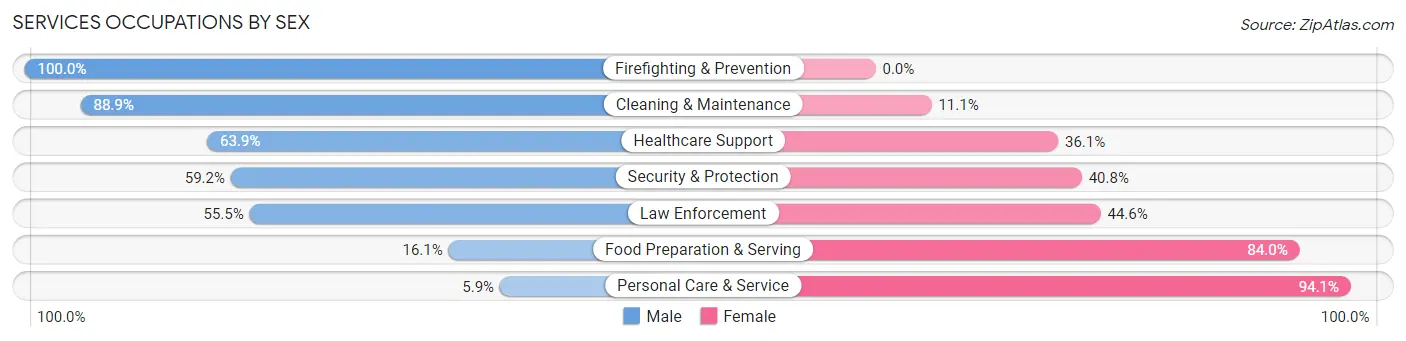
Services Occupations by Sex
Within the Services occupations in Tarboro, the most male-oriented occupations are Firefighting & Prevention (100.0%), Cleaning & Maintenance (88.9%), and Healthcare Support (63.9%), while the most female-oriented occupations are Personal Care & Service (94.1%), Food Preparation & Serving (84.0%), and Law Enforcement (44.6%).
| Occupation | Male | Female |
| Healthcare Support | 53 (63.9%) | 30 (36.1%) |
| Security & Protection | 71 (59.2%) | 49 (40.8%) |
| Firefighting & Prevention | 10 (100.0%) | 0 (0.0%) |
| Law Enforcement | 61 (55.4%) | 49 (44.6%) |
| Food Preparation & Serving | 26 (16.1%) | 136 (84.0%) |
| Cleaning & Maintenance | 297 (88.9%) | 37 (11.1%) |
| Personal Care & Service | 9 (5.9%) | 144 (94.1%) |
| Total (Category) | 456 (53.5%) | 396 (46.5%) |
| Total (Overall) | 1,726 (41.6%) | 2,426 (58.4%) |
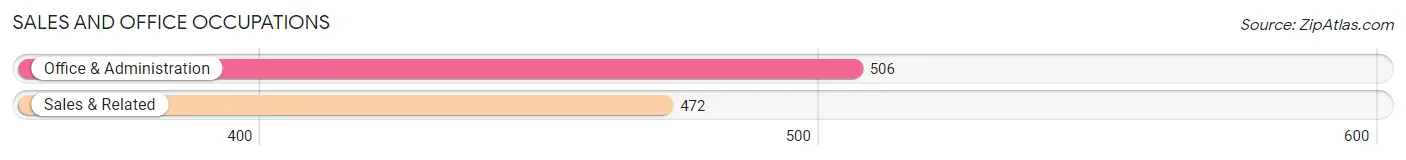
Sales and Office Occupations
The most common Sales and Office occupations in Tarboro are Office & Administration (506 | 12.2%), and Sales & Related (472 | 11.4%).
Sales and Office Occupations by Sex
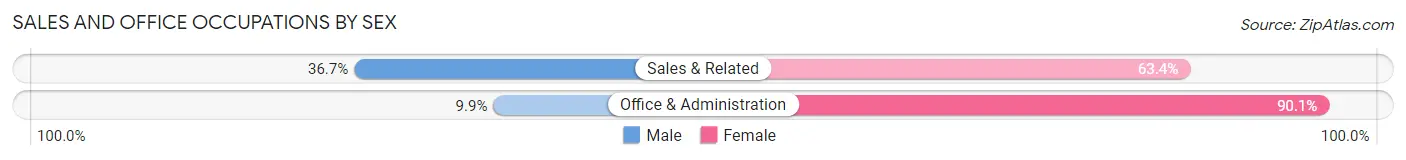
| Occupation | Male | Female |
| Sales & Related | 173 (36.6%) | 299 (63.3%) |
| Office & Administration | 50 (9.9%) | 456 (90.1%) |
| Total (Category) | 223 (22.8%) | 755 (77.2%) |
| Total (Overall) | 1,726 (41.6%) | 2,426 (58.4%) |
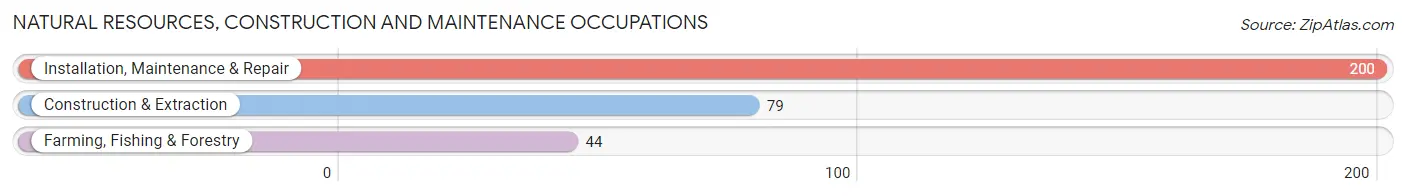
Natural Resources, Construction and Maintenance Occupations
The most common Natural Resources, Construction and Maintenance occupations in Tarboro are Installation, Maintenance & Repair (200 | 4.8%), Construction & Extraction (79 | 1.9%), and Farming, Fishing & Forestry (44 | 1.1%).
Natural Resources, Construction and Maintenance Occupations by Sex
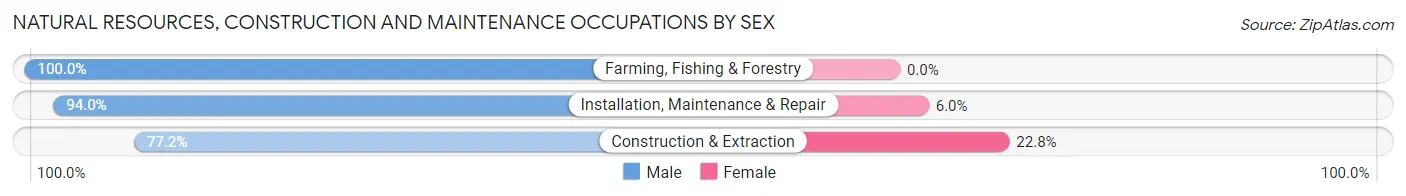
| Occupation | Male | Female |
| Farming, Fishing & Forestry | 44 (100.0%) | 0 (0.0%) |
| Construction & Extraction | 61 (77.2%) | 18 (22.8%) |
| Installation, Maintenance & Repair | 188 (94.0%) | 12 (6.0%) |
| Total (Category) | 293 (90.7%) | 30 (9.3%) |
| Total (Overall) | 1,726 (41.6%) | 2,426 (58.4%) |
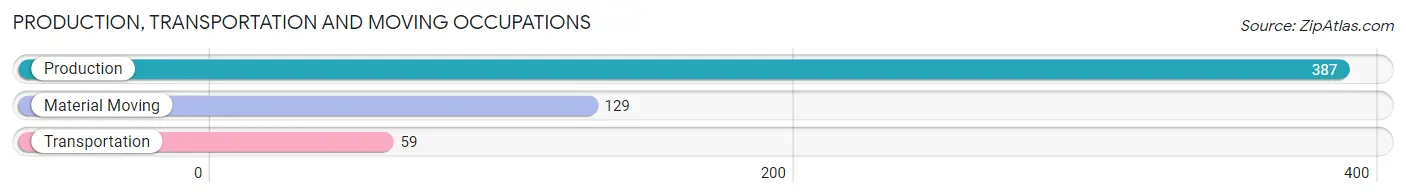
Production, Transportation and Moving Occupations
The most common Production, Transportation and Moving occupations in Tarboro are Production (387 | 9.3%), Material Moving (129 | 3.1%), and Transportation (59 | 1.4%).
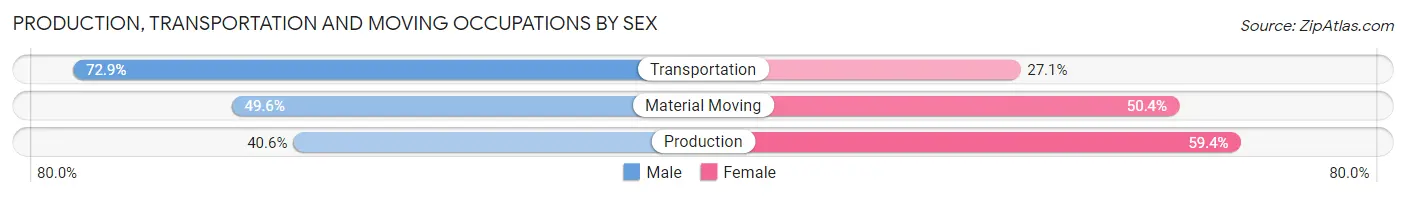
Production, Transportation and Moving Occupations by Sex
| Occupation | Male | Female |
| Production | 157 (40.6%) | 230 (59.4%) |
| Transportation | 43 (72.9%) | 16 (27.1%) |
| Material Moving | 64 (49.6%) | 65 (50.4%) |
| Total (Category) | 264 (45.9%) | 311 (54.1%) |
| Total (Overall) | 1,726 (41.6%) | 2,426 (58.4%) |
Employment Industries by Sex in Tarboro
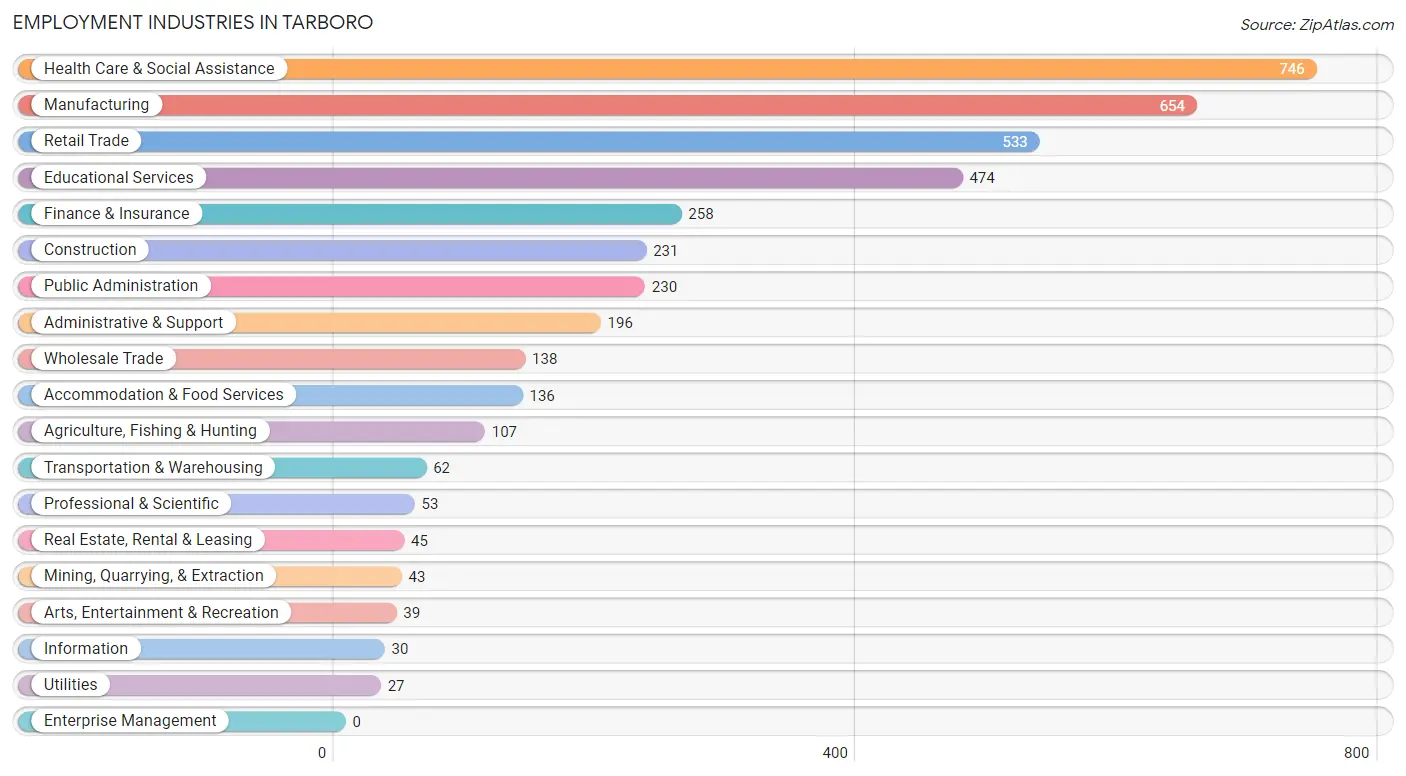
Employment Industries in Tarboro
The major employment industries in Tarboro include Health Care & Social Assistance (746 | 18.0%), Manufacturing (654 | 15.8%), Retail Trade (533 | 12.8%), Educational Services (474 | 11.4%), and Finance & Insurance (258 | 6.2%).
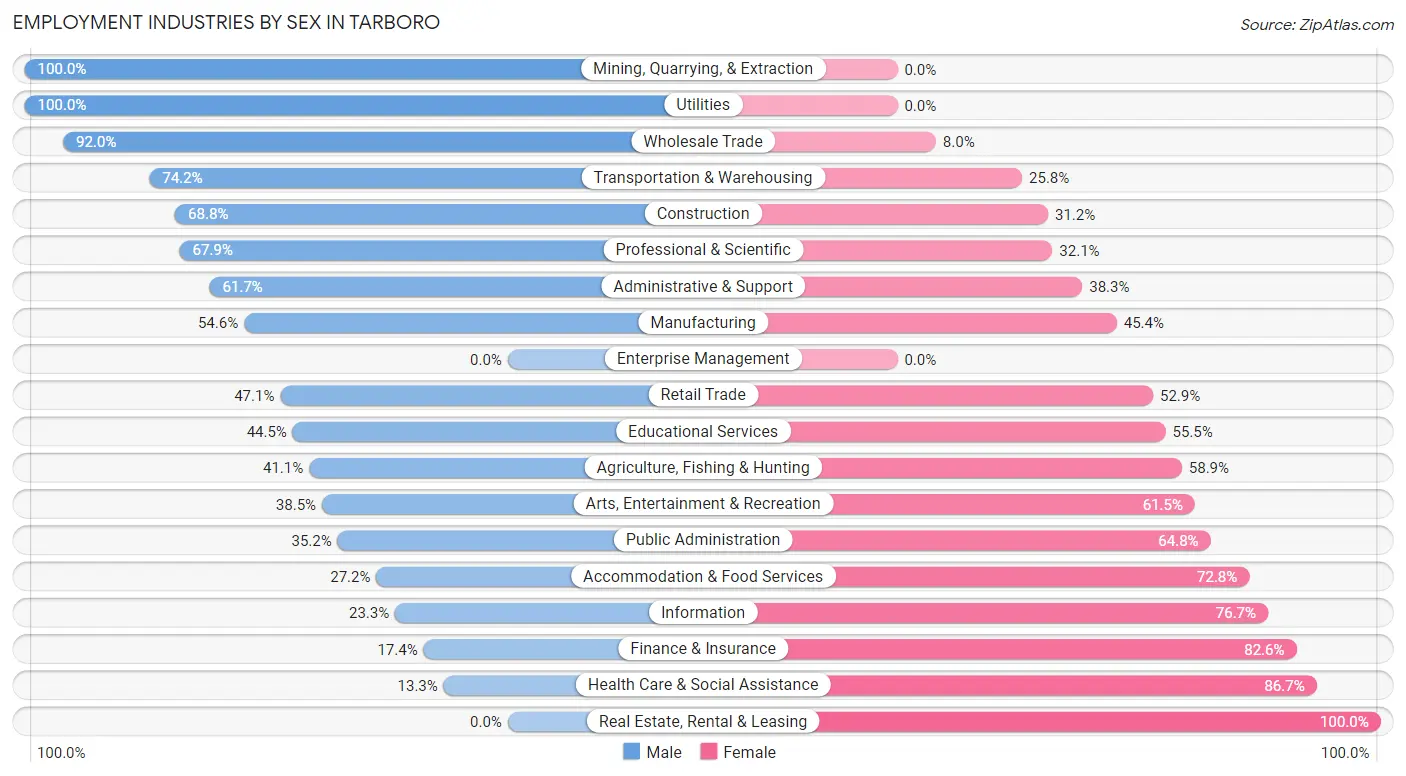
Employment Industries by Sex in Tarboro
The Tarboro industries that see more men than women are Mining, Quarrying, & Extraction (100.0%), Utilities (100.0%), and Wholesale Trade (92.0%), whereas the industries that tend to have a higher number of women are Real Estate, Rental & Leasing (100.0%), Health Care & Social Assistance (86.7%), and Finance & Insurance (82.6%).
| Industry | Male | Female |
| Agriculture, Fishing & Hunting | 44 (41.1%) | 63 (58.9%) |
| Mining, Quarrying, & Extraction | 43 (100.0%) | 0 (0.0%) |
| Construction | 159 (68.8%) | 72 (31.2%) |
| Manufacturing | 357 (54.6%) | 297 (45.4%) |
| Wholesale Trade | 127 (92.0%) | 11 (8.0%) |
| Retail Trade | 251 (47.1%) | 282 (52.9%) |
| Transportation & Warehousing | 46 (74.2%) | 16 (25.8%) |
| Utilities | 27 (100.0%) | 0 (0.0%) |
| Information | 7 (23.3%) | 23 (76.7%) |
| Finance & Insurance | 45 (17.4%) | 213 (82.6%) |
| Real Estate, Rental & Leasing | 0 (0.0%) | 45 (100.0%) |
| Professional & Scientific | 36 (67.9%) | 17 (32.1%) |
| Enterprise Management | 0 (0.0%) | 0 (0.0%) |
| Administrative & Support | 121 (61.7%) | 75 (38.3%) |
| Educational Services | 211 (44.5%) | 263 (55.5%) |
| Health Care & Social Assistance | 99 (13.3%) | 647 (86.7%) |
| Arts, Entertainment & Recreation | 15 (38.5%) | 24 (61.5%) |
| Accommodation & Food Services | 37 (27.2%) | 99 (72.8%) |
| Public Administration | 81 (35.2%) | 149 (64.8%) |
| Total | 1,726 (41.6%) | 2,426 (58.4%) |
Education in Tarboro
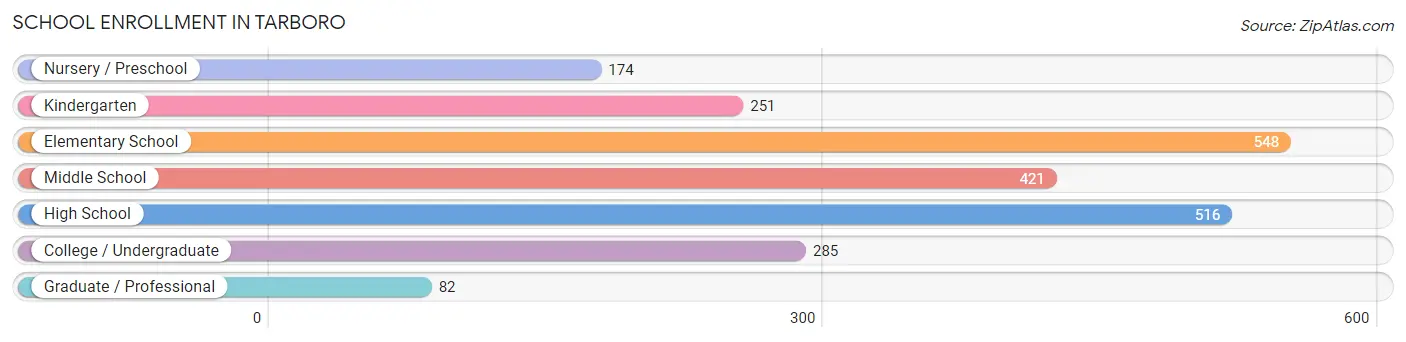
School Enrollment in Tarboro
The most common levels of schooling among the 2,277 students in Tarboro are elementary school (548 | 24.1%), high school (516 | 22.7%), and middle school (421 | 18.5%).
| School Level | # Students | % Students |
| Nursery / Preschool | 174 | 7.6% |
| Kindergarten | 251 | 11.0% |
| Elementary School | 548 | 24.1% |
| Middle School | 421 | 18.5% |
| High School | 516 | 22.7% |
| College / Undergraduate | 285 | 12.5% |
| Graduate / Professional | 82 | 3.6% |
| Total | 2,277 | 100.0% |
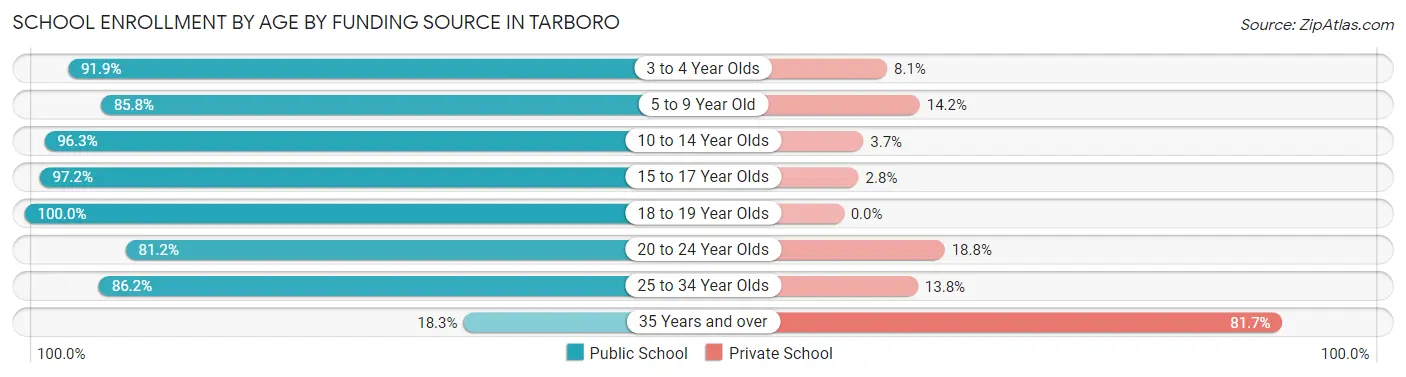
School Enrollment by Age by Funding Source in Tarboro
Out of a total of 2,277 students who are enrolled in schools in Tarboro, 269 (11.8%) attend a private institution, while the remaining 2,008 (88.2%) are enrolled in public schools. The age group of 35 years and over has the highest likelihood of being enrolled in private schools, with 67 (81.7% in the age bracket) enrolled. Conversely, the age group of 18 to 19 year olds has the lowest likelihood of being enrolled in a private school, with 137 (100.0% in the age bracket) attending a public institution.
| Age Bracket | Public School | Private School |
| 3 to 4 Year Olds | 159 (91.9%) | 14 (8.1%) |
| 5 to 9 Year Old | 678 (85.8%) | 112 (14.2%) |
| 10 to 14 Year Olds | 474 (96.3%) | 18 (3.7%) |
| 15 to 17 Year Olds | 314 (97.2%) | 9 (2.8%) |
| 18 to 19 Year Olds | 137 (100.0%) | 0 (0.0%) |
| 20 to 24 Year Olds | 151 (81.2%) | 35 (18.8%) |
| 25 to 34 Year Olds | 81 (86.2%) | 13 (13.8%) |
| 35 Years and over | 15 (18.3%) | 67 (81.7%) |
| Total | 2,008 (88.2%) | 269 (11.8%) |
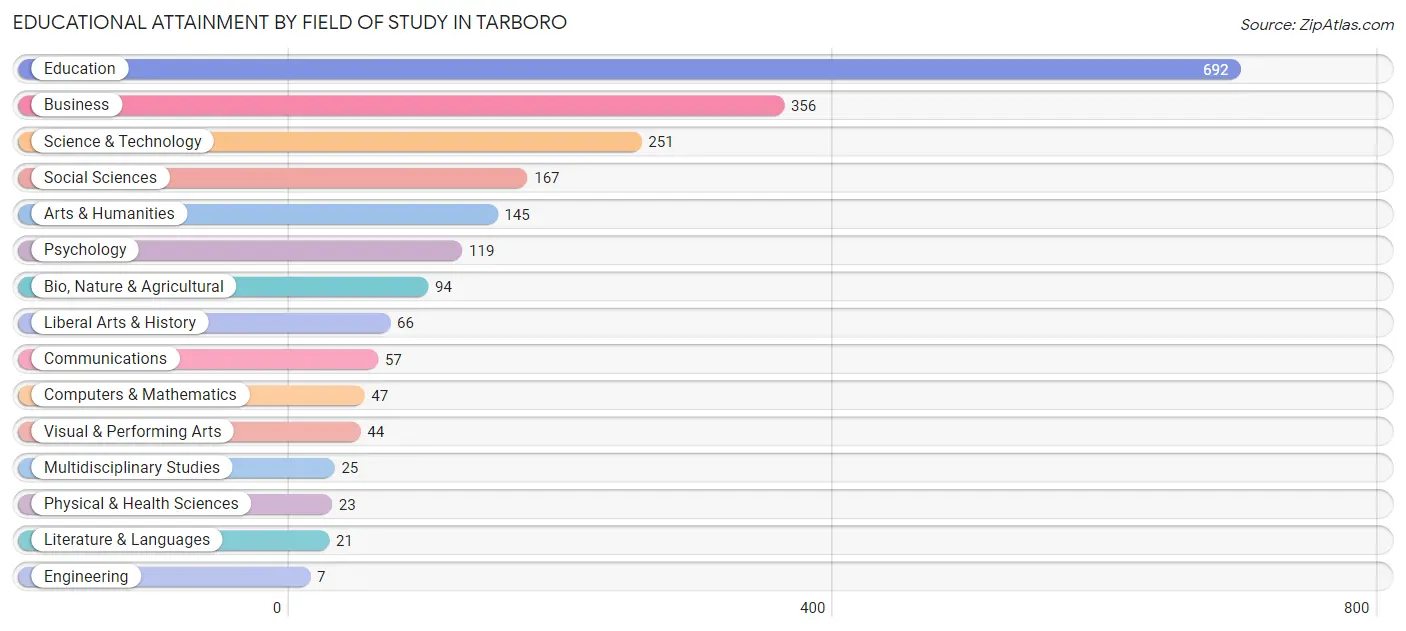
Educational Attainment by Field of Study in Tarboro
Education (692 | 32.7%), business (356 | 16.8%), science & technology (251 | 11.9%), social sciences (167 | 7.9%), and arts & humanities (145 | 6.9%) are the most common fields of study among 2,114 individuals in Tarboro who have obtained a bachelor's degree or higher.
| Field of Study | # Graduates | % Graduates |
| Computers & Mathematics | 47 | 2.2% |
| Bio, Nature & Agricultural | 94 | 4.4% |
| Physical & Health Sciences | 23 | 1.1% |
| Psychology | 119 | 5.6% |
| Social Sciences | 167 | 7.9% |
| Engineering | 7 | 0.3% |
| Multidisciplinary Studies | 25 | 1.2% |
| Science & Technology | 251 | 11.9% |
| Business | 356 | 16.8% |
| Education | 692 | 32.7% |
| Literature & Languages | 21 | 1.0% |
| Liberal Arts & History | 66 | 3.1% |
| Visual & Performing Arts | 44 | 2.1% |
| Communications | 57 | 2.7% |
| Arts & Humanities | 145 | 6.9% |
| Total | 2,114 | 100.0% |
Transportation & Commute in Tarboro
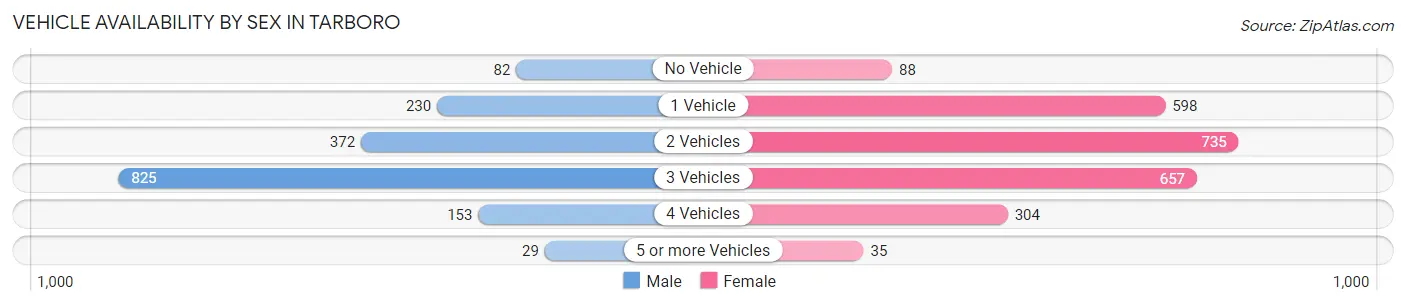
Vehicle Availability by Sex in Tarboro
The most prevalent vehicle ownership categories in Tarboro are males with 3 vehicles (825, accounting for 48.8%) and females with 3 vehicles (657, making up 34.1%).
| Vehicles Available | Male | Female |
| No Vehicle | 82 (4.9%) | 88 (3.6%) |
| 1 Vehicle | 230 (13.6%) | 598 (24.7%) |
| 2 Vehicles | 372 (22.0%) | 735 (30.4%) |
| 3 Vehicles | 825 (48.8%) | 657 (27.2%) |
| 4 Vehicles | 153 (9.0%) | 304 (12.6%) |
| 5 or more Vehicles | 29 (1.7%) | 35 (1.5%) |
| Total | 1,691 (100.0%) | 2,417 (100.0%) |
Commute Time in Tarboro
The most frequently occuring commute durations in Tarboro are 5 to 9 minutes (1,030 commuters, 27.3%), 10 to 14 minutes (648 commuters, 17.2%), and 30 to 34 minutes (421 commuters, 11.2%).
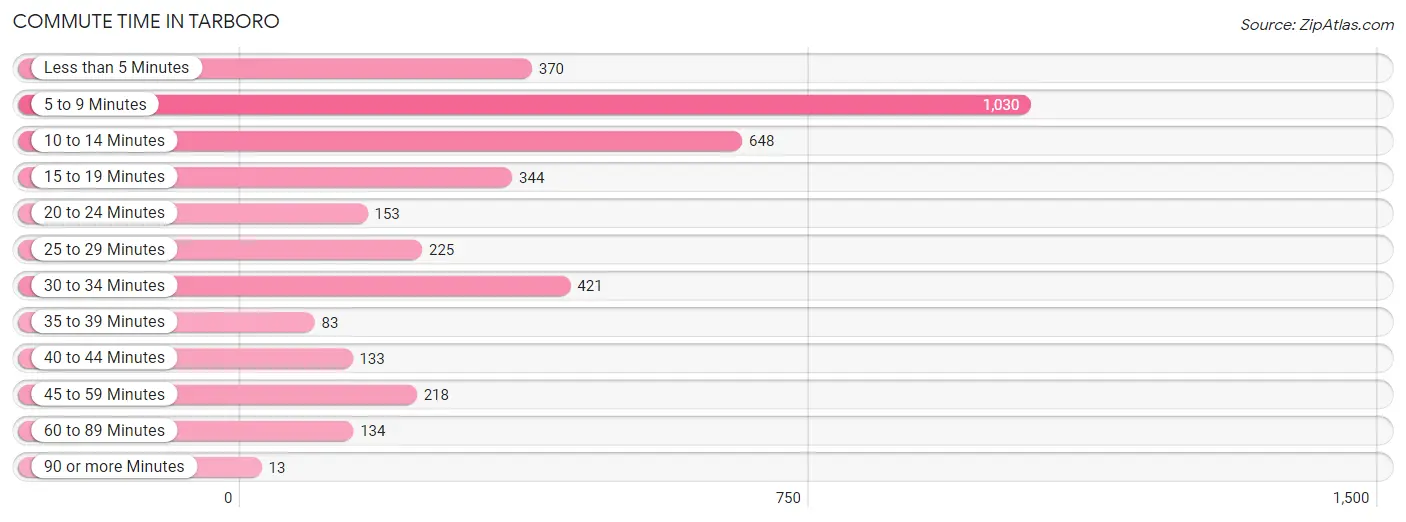
| Commute Time | # Commuters | % Commuters |
| Less than 5 Minutes | 370 | 9.8% |
| 5 to 9 Minutes | 1,030 | 27.3% |
| 10 to 14 Minutes | 648 | 17.2% |
| 15 to 19 Minutes | 344 | 9.1% |
| 20 to 24 Minutes | 153 | 4.1% |
| 25 to 29 Minutes | 225 | 6.0% |
| 30 to 34 Minutes | 421 | 11.2% |
| 35 to 39 Minutes | 83 | 2.2% |
| 40 to 44 Minutes | 133 | 3.5% |
| 45 to 59 Minutes | 218 | 5.8% |
| 60 to 89 Minutes | 134 | 3.5% |
| 90 or more Minutes | 13 | 0.3% |
Commute Time by Sex in Tarboro
The most common commute times in Tarboro are 5 to 9 minutes (386 commuters, 23.3%) for males and 5 to 9 minutes (644 commuters, 30.4%) for females.
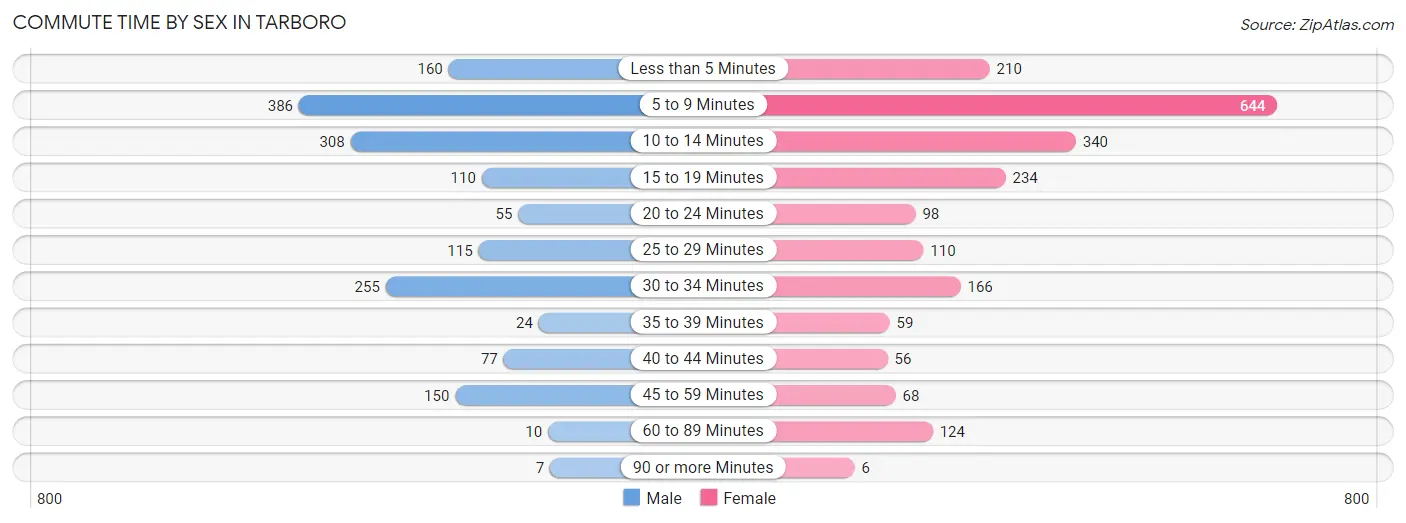
| Commute Time | Male | Female |
| Less than 5 Minutes | 160 (9.7%) | 210 (9.9%) |
| 5 to 9 Minutes | 386 (23.3%) | 644 (30.4%) |
| 10 to 14 Minutes | 308 (18.6%) | 340 (16.1%) |
| 15 to 19 Minutes | 110 (6.6%) | 234 (11.1%) |
| 20 to 24 Minutes | 55 (3.3%) | 98 (4.6%) |
| 25 to 29 Minutes | 115 (6.9%) | 110 (5.2%) |
| 30 to 34 Minutes | 255 (15.4%) | 166 (7.9%) |
| 35 to 39 Minutes | 24 (1.5%) | 59 (2.8%) |
| 40 to 44 Minutes | 77 (4.6%) | 56 (2.6%) |
| 45 to 59 Minutes | 150 (9.0%) | 68 (3.2%) |
| 60 to 89 Minutes | 10 (0.6%) | 124 (5.9%) |
| 90 or more Minutes | 7 (0.4%) | 6 (0.3%) |
Time of Departure to Work by Sex in Tarboro
The most frequent times of departure to work in Tarboro are 7:00 AM to 7:29 AM (366, 22.1%) for males and 8:00 AM to 8:29 AM (420, 19.9%) for females.
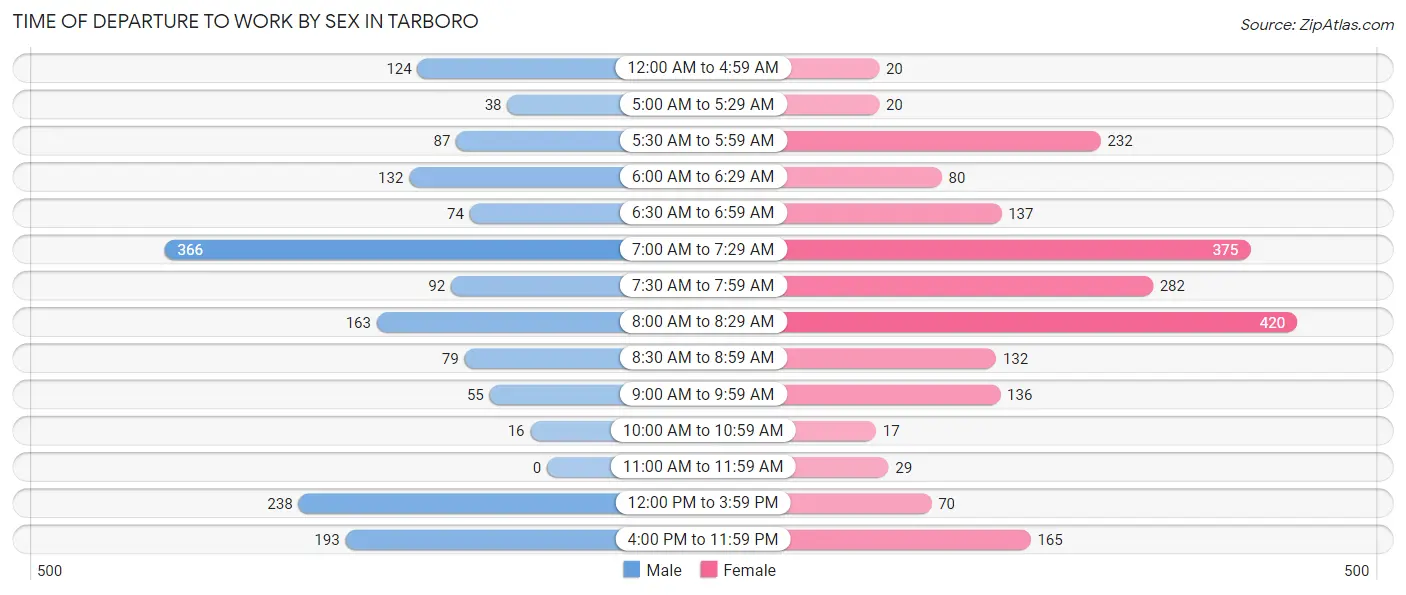
| Time of Departure | Male | Female |
| 12:00 AM to 4:59 AM | 124 (7.5%) | 20 (0.9%) |
| 5:00 AM to 5:29 AM | 38 (2.3%) | 20 (0.9%) |
| 5:30 AM to 5:59 AM | 87 (5.2%) | 232 (11.0%) |
| 6:00 AM to 6:29 AM | 132 (8.0%) | 80 (3.8%) |
| 6:30 AM to 6:59 AM | 74 (4.5%) | 137 (6.5%) |
| 7:00 AM to 7:29 AM | 366 (22.1%) | 375 (17.7%) |
| 7:30 AM to 7:59 AM | 92 (5.6%) | 282 (13.3%) |
| 8:00 AM to 8:29 AM | 163 (9.8%) | 420 (19.9%) |
| 8:30 AM to 8:59 AM | 79 (4.8%) | 132 (6.2%) |
| 9:00 AM to 9:59 AM | 55 (3.3%) | 136 (6.4%) |
| 10:00 AM to 10:59 AM | 16 (1.0%) | 17 (0.8%) |
| 11:00 AM to 11:59 AM | 0 (0.0%) | 29 (1.4%) |
| 12:00 PM to 3:59 PM | 238 (14.4%) | 70 (3.3%) |
| 4:00 PM to 11:59 PM | 193 (11.7%) | 165 (7.8%) |
| Total | 1,657 (100.0%) | 2,115 (100.0%) |
Housing Occupancy in Tarboro
Occupancy by Ownership in Tarboro
Of the total 4,776 dwellings in Tarboro, owner-occupied units account for 2,777 (58.1%), while renter-occupied units make up 1,999 (41.9%).
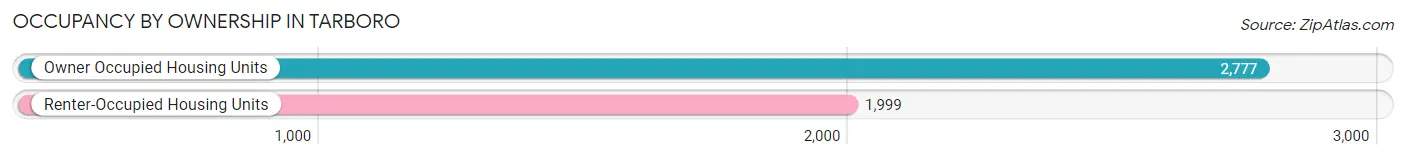
| Occupancy | # Housing Units | % Housing Units |
| Owner Occupied Housing Units | 2,777 | 58.1% |
| Renter-Occupied Housing Units | 1,999 | 41.9% |
| Total Occupied Housing Units | 4,776 | 100.0% |
Occupancy by Household Size in Tarboro
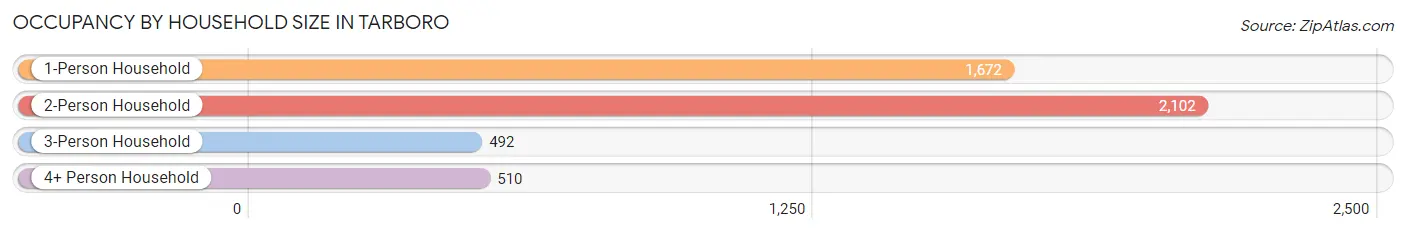
| Household Size | # Housing Units | % Housing Units |
| 1-Person Household | 1,672 | 35.0% |
| 2-Person Household | 2,102 | 44.0% |
| 3-Person Household | 492 | 10.3% |
| 4+ Person Household | 510 | 10.7% |
| Total Housing Units | 4,776 | 100.0% |
Occupancy by Ownership by Household Size in Tarboro
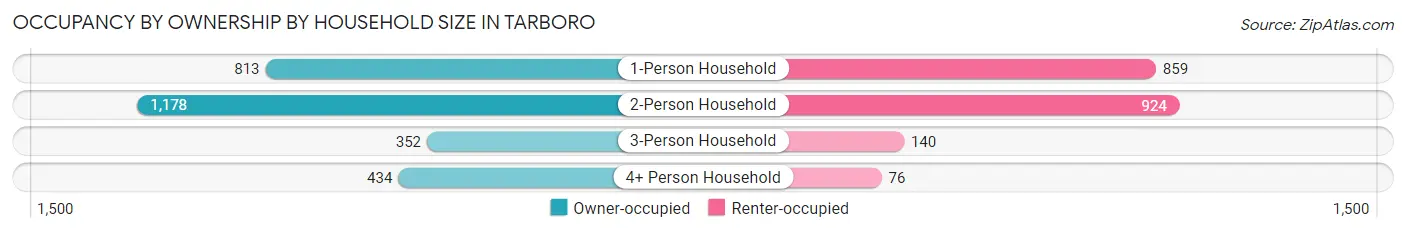
| Household Size | Owner-occupied | Renter-occupied |
| 1-Person Household | 813 (48.6%) | 859 (51.4%) |
| 2-Person Household | 1,178 (56.0%) | 924 (44.0%) |
| 3-Person Household | 352 (71.5%) | 140 (28.5%) |
| 4+ Person Household | 434 (85.1%) | 76 (14.9%) |
| Total Housing Units | 2,777 (58.1%) | 1,999 (41.9%) |
Occupancy by Educational Attainment in Tarboro
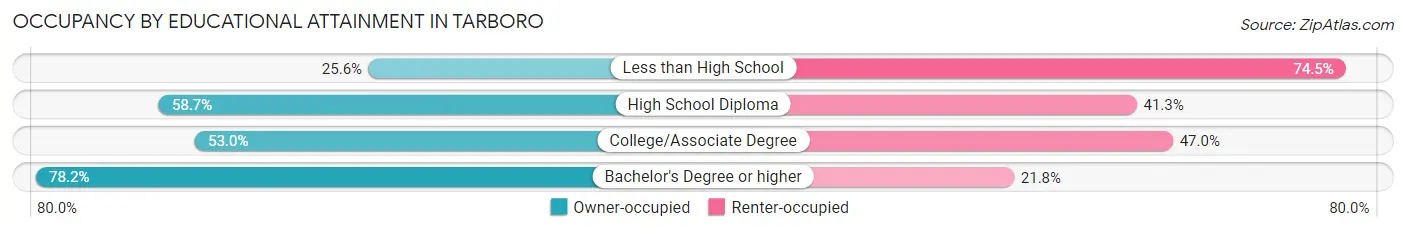
| Household Size | Owner-occupied | Renter-occupied |
| Less than High School | 152 (25.6%) | 443 (74.5%) |
| High School Diploma | 756 (58.7%) | 532 (41.3%) |
| College/Associate Degree | 824 (53.0%) | 732 (47.0%) |
| Bachelor's Degree or higher | 1,045 (78.2%) | 292 (21.8%) |
Occupancy by Age of Householder in Tarboro
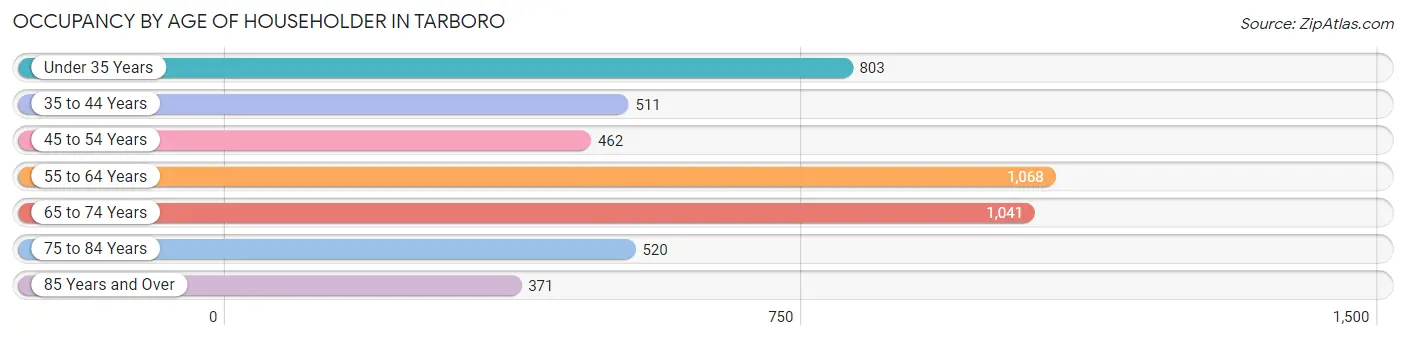
| Age Bracket | # Households | % Households |
| Under 35 Years | 803 | 16.8% |
| 35 to 44 Years | 511 | 10.7% |
| 45 to 54 Years | 462 | 9.7% |
| 55 to 64 Years | 1,068 | 22.4% |
| 65 to 74 Years | 1,041 | 21.8% |
| 75 to 84 Years | 520 | 10.9% |
| 85 Years and Over | 371 | 7.8% |
| Total | 4,776 | 100.0% |
Housing Finances in Tarboro
Median Income by Occupancy in Tarboro
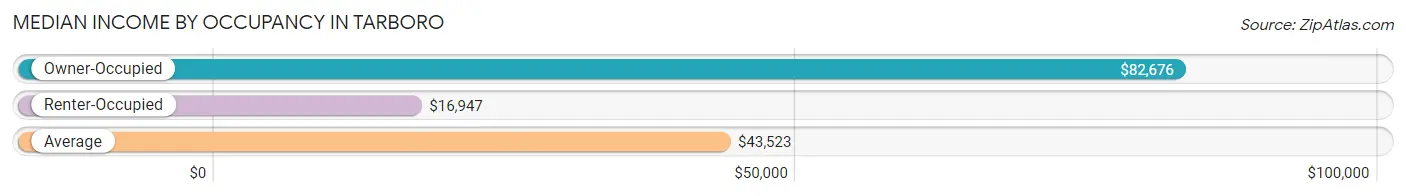
| Occupancy Type | # Households | Median Income |
| Owner-Occupied | 2,777 (58.1%) | $82,676 |
| Renter-Occupied | 1,999 (41.9%) | $16,947 |
| Average | 4,776 (100.0%) | $43,523 |
Occupancy by Householder Income Bracket in Tarboro
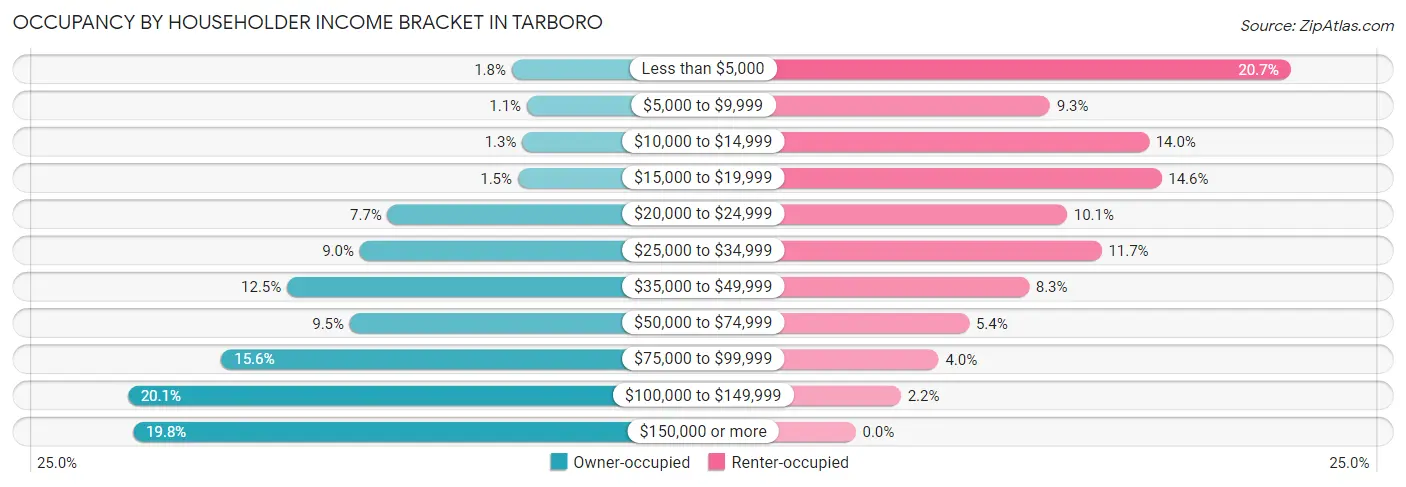
| Income Bracket | Owner-occupied | Renter-occupied |
| Less than $5,000 | 50 (1.8%) | 414 (20.7%) |
| $5,000 to $9,999 | 30 (1.1%) | 185 (9.2%) |
| $10,000 to $14,999 | 36 (1.3%) | 279 (14.0%) |
| $15,000 to $19,999 | 42 (1.5%) | 291 (14.6%) |
| $20,000 to $24,999 | 214 (7.7%) | 201 (10.1%) |
| $25,000 to $34,999 | 251 (9.0%) | 234 (11.7%) |
| $35,000 to $49,999 | 347 (12.5%) | 165 (8.3%) |
| $50,000 to $74,999 | 264 (9.5%) | 108 (5.4%) |
| $75,000 to $99,999 | 434 (15.6%) | 79 (4.0%) |
| $100,000 to $149,999 | 558 (20.1%) | 43 (2.1%) |
| $150,000 or more | 551 (19.8%) | 0 (0.0%) |
| Total | 2,777 (100.0%) | 1,999 (100.0%) |
Monthly Housing Cost Tiers in Tarboro
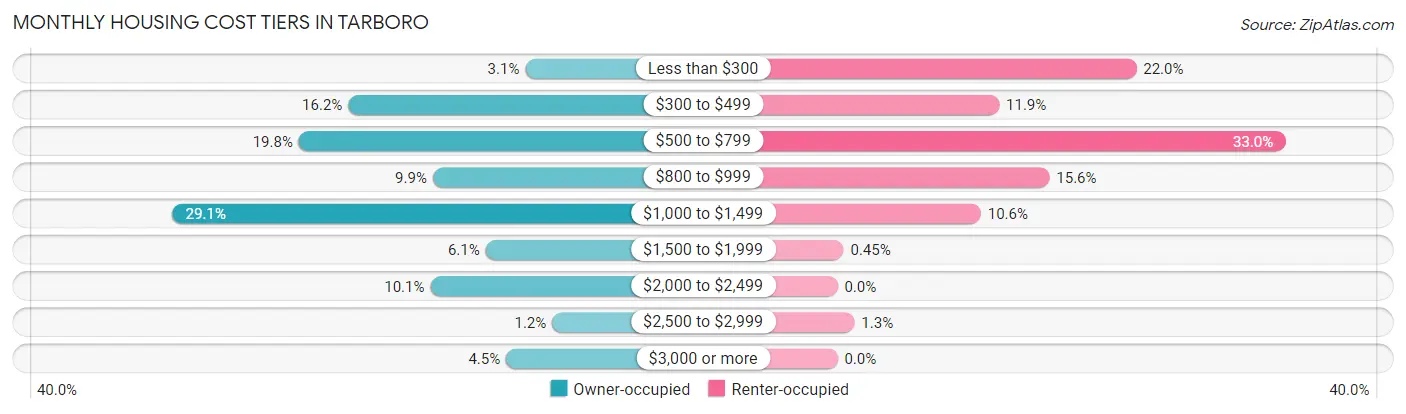
| Monthly Cost | Owner-occupied | Renter-occupied |
| Less than $300 | 87 (3.1%) | 440 (22.0%) |
| $300 to $499 | 449 (16.2%) | 238 (11.9%) |
| $500 to $799 | 550 (19.8%) | 659 (33.0%) |
| $800 to $999 | 276 (9.9%) | 312 (15.6%) |
| $1,000 to $1,499 | 808 (29.1%) | 211 (10.6%) |
| $1,500 to $1,999 | 168 (6.0%) | 9 (0.4%) |
| $2,000 to $2,499 | 281 (10.1%) | 0 (0.0%) |
| $2,500 to $2,999 | 32 (1.1%) | 25 (1.3%) |
| $3,000 or more | 126 (4.5%) | 0 (0.0%) |
| Total | 2,777 (100.0%) | 1,999 (100.0%) |
Physical Housing Characteristics in Tarboro
Housing Structures in Tarboro
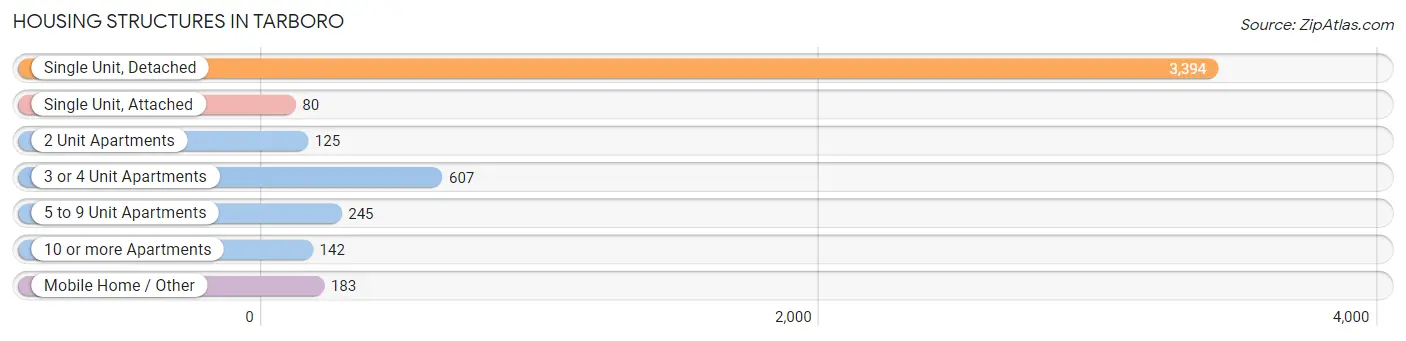
| Structure Type | # Housing Units | % Housing Units |
| Single Unit, Detached | 3,394 | 71.1% |
| Single Unit, Attached | 80 | 1.7% |
| 2 Unit Apartments | 125 | 2.6% |
| 3 or 4 Unit Apartments | 607 | 12.7% |
| 5 to 9 Unit Apartments | 245 | 5.1% |
| 10 or more Apartments | 142 | 3.0% |
| Mobile Home / Other | 183 | 3.8% |
| Total | 4,776 | 100.0% |
Housing Structures by Occupancy in Tarboro
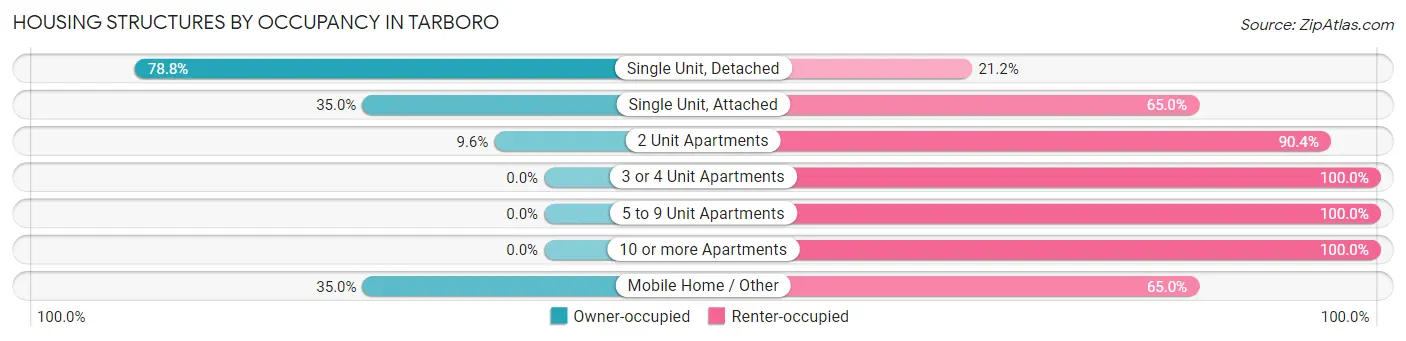
| Structure Type | Owner-occupied | Renter-occupied |
| Single Unit, Detached | 2,673 (78.8%) | 721 (21.2%) |
| Single Unit, Attached | 28 (35.0%) | 52 (65.0%) |
| 2 Unit Apartments | 12 (9.6%) | 113 (90.4%) |
| 3 or 4 Unit Apartments | 0 (0.0%) | 607 (100.0%) |
| 5 to 9 Unit Apartments | 0 (0.0%) | 245 (100.0%) |
| 10 or more Apartments | 0 (0.0%) | 142 (100.0%) |
| Mobile Home / Other | 64 (35.0%) | 119 (65.0%) |
| Total | 2,777 (58.1%) | 1,999 (41.9%) |
Housing Structures by Number of Rooms in Tarboro
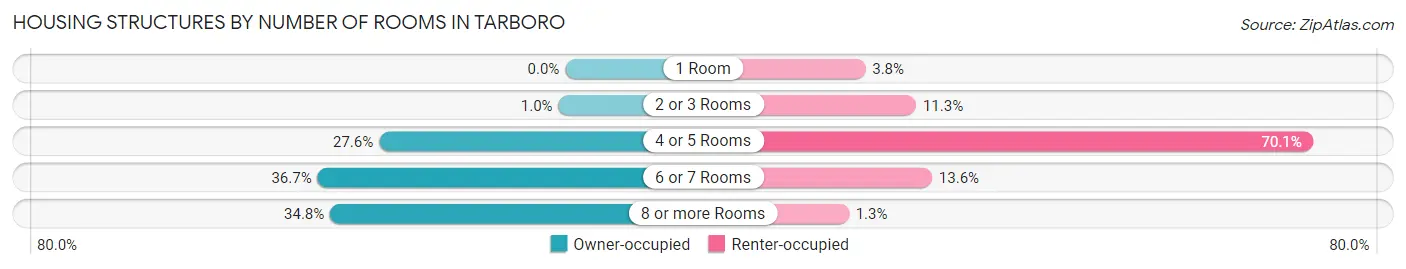
| Number of Rooms | Owner-occupied | Renter-occupied |
| 1 Room | 0 (0.0%) | 75 (3.7%) |
| 2 or 3 Rooms | 28 (1.0%) | 225 (11.3%) |
| 4 or 5 Rooms | 765 (27.6%) | 1,401 (70.1%) |
| 6 or 7 Rooms | 1,018 (36.7%) | 272 (13.6%) |
| 8 or more Rooms | 966 (34.8%) | 26 (1.3%) |
| Total | 2,777 (100.0%) | 1,999 (100.0%) |
Housing Structure by Heating Type in Tarboro
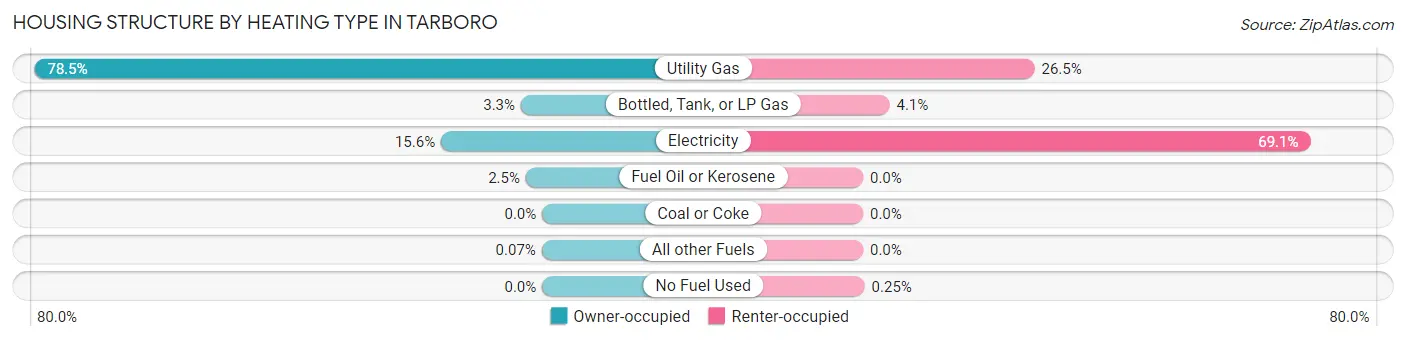
| Heating Type | Owner-occupied | Renter-occupied |
| Utility Gas | 2,180 (78.5%) | 530 (26.5%) |
| Bottled, Tank, or LP Gas | 91 (3.3%) | 82 (4.1%) |
| Electricity | 434 (15.6%) | 1,382 (69.1%) |
| Fuel Oil or Kerosene | 70 (2.5%) | 0 (0.0%) |
| Coal or Coke | 0 (0.0%) | 0 (0.0%) |
| All other Fuels | 2 (0.1%) | 0 (0.0%) |
| No Fuel Used | 0 (0.0%) | 5 (0.3%) |
| Total | 2,777 (100.0%) | 1,999 (100.0%) |
Household Vehicle Usage in Tarboro
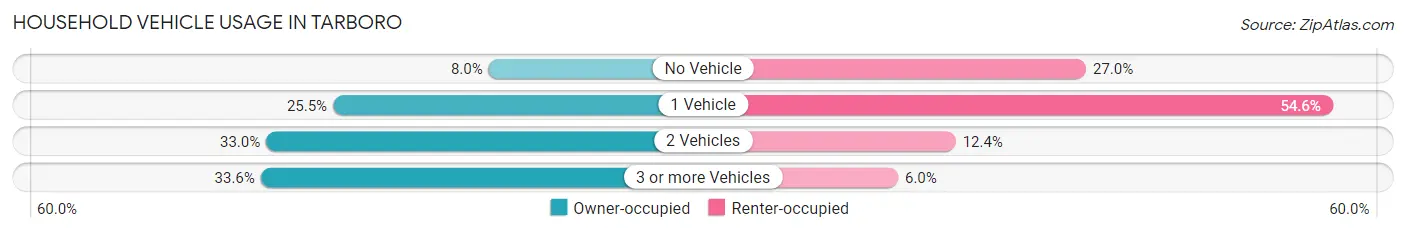
| Vehicles per Household | Owner-occupied | Renter-occupied |
| No Vehicle | 223 (8.0%) | 540 (27.0%) |
| 1 Vehicle | 707 (25.5%) | 1,092 (54.6%) |
| 2 Vehicles | 915 (33.0%) | 248 (12.4%) |
| 3 or more Vehicles | 932 (33.6%) | 119 (5.9%) |
| Total | 2,777 (100.0%) | 1,999 (100.0%) |
Real Estate & Mortgages in Tarboro
Real Estate and Mortgage Overview in Tarboro
| Characteristic | Without Mortgage | With Mortgage |
| Housing Units | 1,211 | 1,566 |
| Median Property Value | $125,500 | $173,800 |
| Median Household Income | $58,604 | $412 |
| Monthly Housing Costs | $545 | $47 |
| Real Estate Taxes | $1,587 | $76 |
Property Value by Mortgage Status in Tarboro
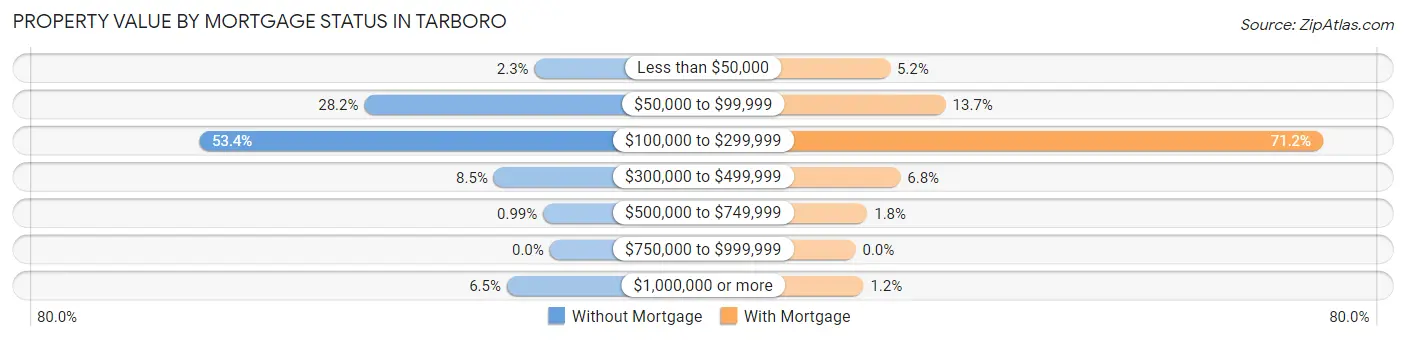
| Property Value | Without Mortgage | With Mortgage |
| Less than $50,000 | 28 (2.3%) | 82 (5.2%) |
| $50,000 to $99,999 | 342 (28.2%) | 215 (13.7%) |
| $100,000 to $299,999 | 647 (53.4%) | 1,115 (71.2%) |
| $300,000 to $499,999 | 103 (8.5%) | 107 (6.8%) |
| $500,000 to $749,999 | 12 (1.0%) | 28 (1.8%) |
| $750,000 to $999,999 | 0 (0.0%) | 0 (0.0%) |
| $1,000,000 or more | 79 (6.5%) | 19 (1.2%) |
| Total | 1,211 (100.0%) | 1,566 (100.0%) |
Household Income by Mortgage Status in Tarboro
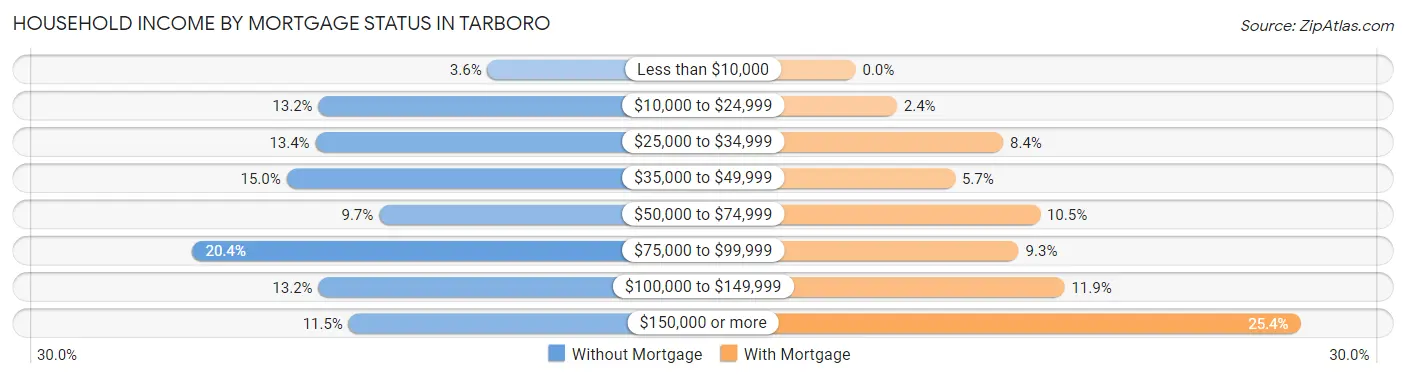
| Household Income | Without Mortgage | With Mortgage |
| Less than $10,000 | 43 (3.5%) | 0 (0.0%) |
| $10,000 to $24,999 | 160 (13.2%) | 37 (2.4%) |
| $25,000 to $34,999 | 162 (13.4%) | 132 (8.4%) |
| $35,000 to $49,999 | 182 (15.0%) | 89 (5.7%) |
| $50,000 to $74,999 | 118 (9.7%) | 165 (10.5%) |
| $75,000 to $99,999 | 247 (20.4%) | 146 (9.3%) |
| $100,000 to $149,999 | 160 (13.2%) | 187 (11.9%) |
| $150,000 or more | 139 (11.5%) | 398 (25.4%) |
| Total | 1,211 (100.0%) | 1,566 (100.0%) |
Property Value to Household Income Ratio in Tarboro
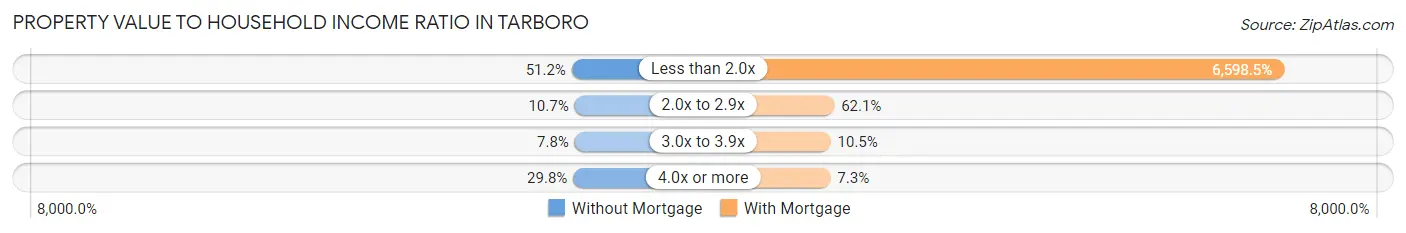
| Value-to-Income Ratio | Without Mortgage | With Mortgage |
| Less than 2.0x | 620 (51.2%) | 103,333 (6,598.5%) |
| 2.0x to 2.9x | 129 (10.6%) | 973 (62.1%) |
| 3.0x to 3.9x | 94 (7.8%) | 164 (10.5%) |
| 4.0x or more | 361 (29.8%) | 114 (7.3%) |
| Total | 1,211 (100.0%) | 1,566 (100.0%) |
Real Estate Taxes by Mortgage Status in Tarboro
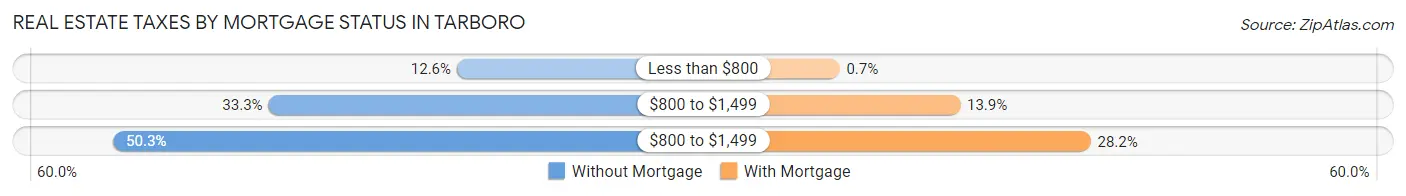
| Property Taxes | Without Mortgage | With Mortgage |
| Less than $800 | 153 (12.6%) | 11 (0.7%) |
| $800 to $1,499 | 403 (33.3%) | 218 (13.9%) |
| $800 to $1,499 | 609 (50.3%) | 442 (28.2%) |
| Total | 1,211 (100.0%) | 1,566 (100.0%) |
Health & Disability in Tarboro
Health Insurance Coverage by Age in Tarboro
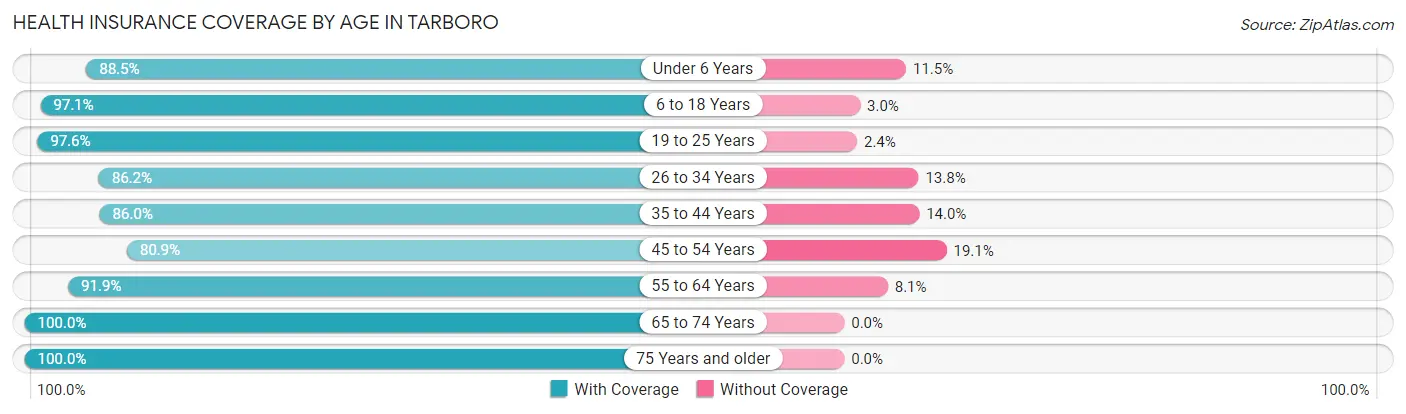
| Age Bracket | With Coverage | Without Coverage |
| Under 6 Years | 776 (88.5%) | 101 (11.5%) |
| 6 to 18 Years | 1,546 (97.1%) | 47 (2.9%) |
| 19 to 25 Years | 451 (97.6%) | 11 (2.4%) |
| 26 to 34 Years | 878 (86.2%) | 141 (13.8%) |
| 35 to 44 Years | 862 (86.0%) | 140 (14.0%) |
| 45 to 54 Years | 628 (80.9%) | 148 (19.1%) |
| 55 to 64 Years | 1,677 (91.9%) | 148 (8.1%) |
| 65 to 74 Years | 1,500 (100.0%) | 0 (0.0%) |
| 75 Years and older | 1,113 (100.0%) | 0 (0.0%) |
| Total | 9,431 (92.8%) | 736 (7.2%) |
Health Insurance Coverage by Citizenship Status in Tarboro
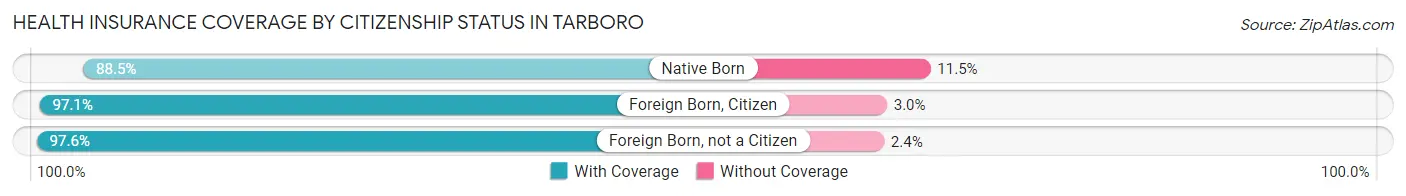
| Citizenship Status | With Coverage | Without Coverage |
| Native Born | 776 (88.5%) | 101 (11.5%) |
| Foreign Born, Citizen | 1,546 (97.1%) | 47 (2.9%) |
| Foreign Born, not a Citizen | 451 (97.6%) | 11 (2.4%) |
Health Insurance Coverage by Household Income in Tarboro
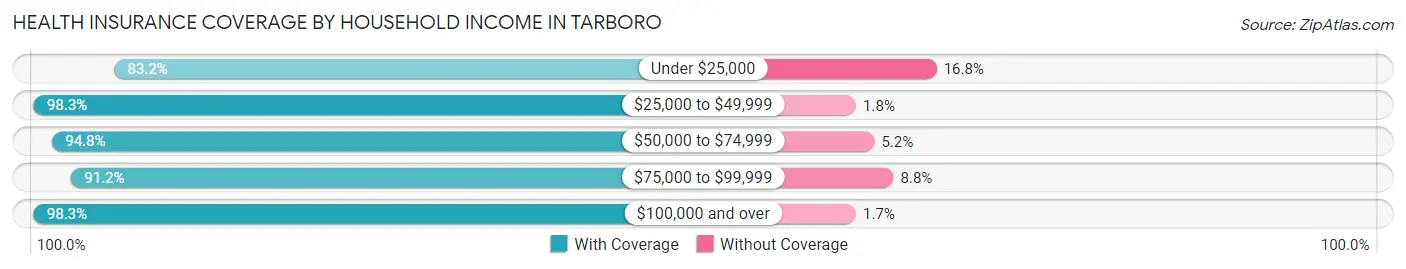
| Household Income | With Coverage | Without Coverage |
| Under $25,000 | 2,469 (83.2%) | 500 (16.8%) |
| $25,000 to $49,999 | 1,793 (98.3%) | 32 (1.8%) |
| $50,000 to $74,999 | 547 (94.8%) | 30 (5.2%) |
| $75,000 to $99,999 | 1,186 (91.2%) | 114 (8.8%) |
| $100,000 and over | 3,382 (98.3%) | 60 (1.7%) |
Public vs Private Health Insurance Coverage by Age in Tarboro
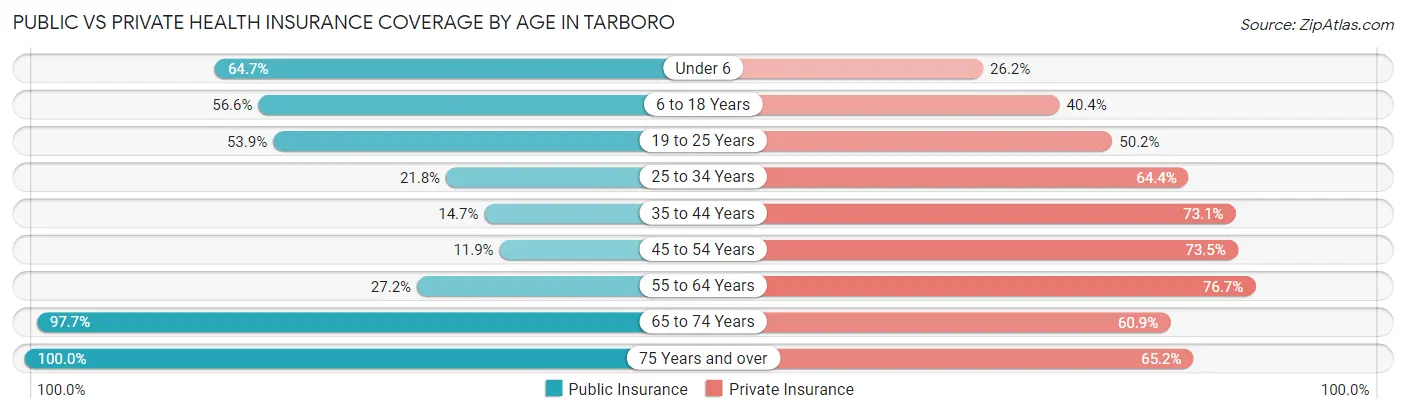
| Age Bracket | Public Insurance | Private Insurance |
| Under 6 | 567 (64.6%) | 230 (26.2%) |
| 6 to 18 Years | 902 (56.6%) | 644 (40.4%) |
| 19 to 25 Years | 249 (53.9%) | 232 (50.2%) |
| 25 to 34 Years | 222 (21.8%) | 656 (64.4%) |
| 35 to 44 Years | 147 (14.7%) | 732 (73.1%) |
| 45 to 54 Years | 92 (11.9%) | 570 (73.5%) |
| 55 to 64 Years | 496 (27.2%) | 1,400 (76.7%) |
| 65 to 74 Years | 1,466 (97.7%) | 914 (60.9%) |
| 75 Years and over | 1,113 (100.0%) | 726 (65.2%) |
| Total | 5,254 (51.7%) | 6,104 (60.0%) |
Disability Status by Sex by Age in Tarboro
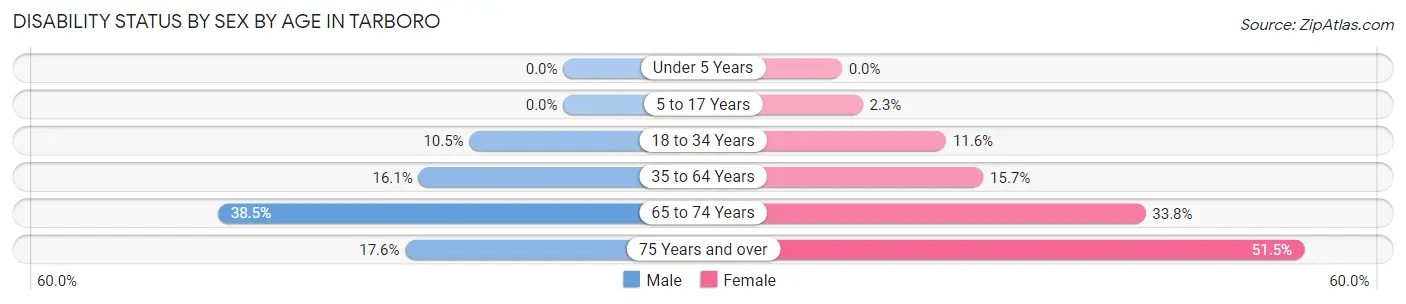
| Age Bracket | Male | Female |
| Under 5 Years | 0 (0.0%) | 0 (0.0%) |
| 5 to 17 Years | 0 (0.0%) | 21 (2.3%) |
| 18 to 34 Years | 62 (10.5%) | 117 (11.6%) |
| 35 to 64 Years | 286 (16.1%) | 288 (15.7%) |
| 65 to 74 Years | 197 (38.5%) | 334 (33.8%) |
| 75 Years and over | 69 (17.6%) | 371 (51.5%) |
Disability Class by Sex by Age in Tarboro
Disability Class: Hearing Difficulty
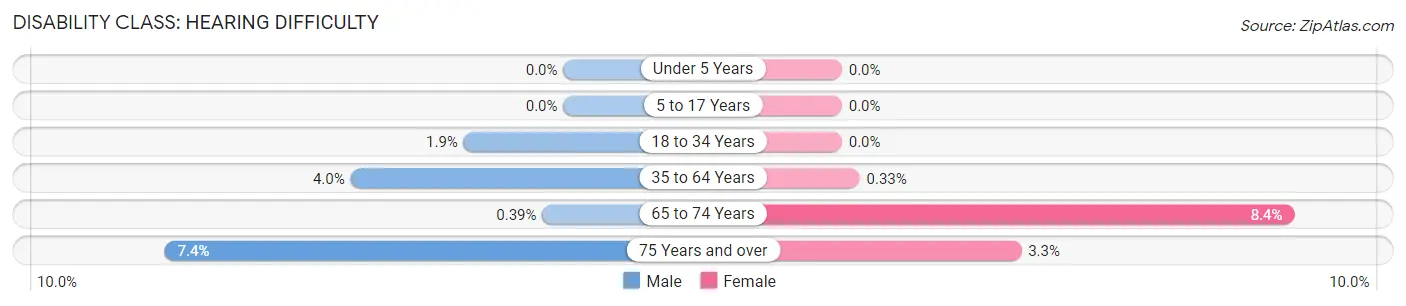
| Age Bracket | Male | Female |
| Under 5 Years | 0 (0.0%) | 0 (0.0%) |
| 5 to 17 Years | 0 (0.0%) | 0 (0.0%) |
| 18 to 34 Years | 11 (1.8%) | 0 (0.0%) |
| 35 to 64 Years | 70 (4.0%) | 6 (0.3%) |
| 65 to 74 Years | 2 (0.4%) | 83 (8.4%) |
| 75 Years and over | 29 (7.4%) | 24 (3.3%) |
Disability Class: Vision Difficulty
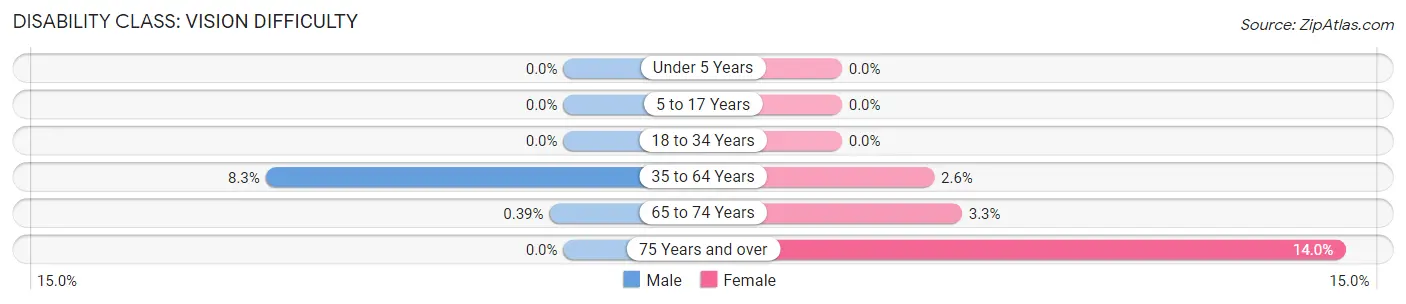
| Age Bracket | Male | Female |
| Under 5 Years | 0 (0.0%) | 0 (0.0%) |
| 5 to 17 Years | 0 (0.0%) | 0 (0.0%) |
| 18 to 34 Years | 0 (0.0%) | 0 (0.0%) |
| 35 to 64 Years | 147 (8.3%) | 47 (2.6%) |
| 65 to 74 Years | 2 (0.4%) | 33 (3.3%) |
| 75 Years and over | 0 (0.0%) | 101 (14.0%) |
Disability Class: Cognitive Difficulty
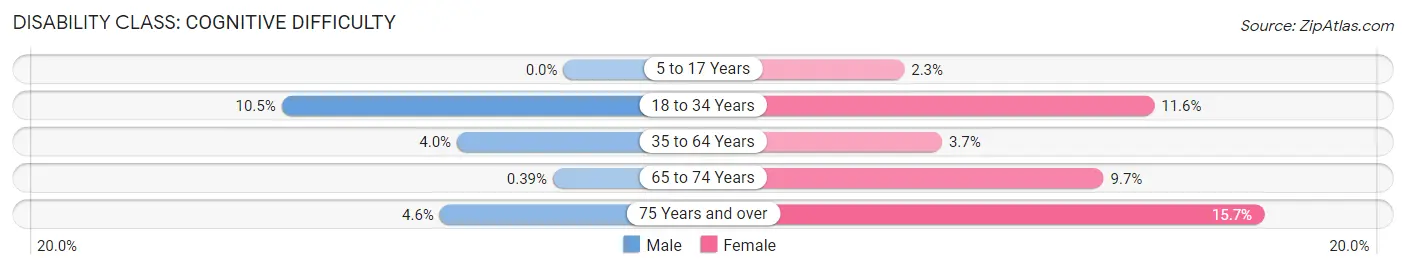
| Age Bracket | Male | Female |
| 5 to 17 Years | 0 (0.0%) | 21 (2.3%) |
| 18 to 34 Years | 62 (10.5%) | 117 (11.6%) |
| 35 to 64 Years | 70 (4.0%) | 68 (3.7%) |
| 65 to 74 Years | 2 (0.4%) | 96 (9.7%) |
| 75 Years and over | 18 (4.6%) | 113 (15.7%) |
Disability Class: Ambulatory Difficulty
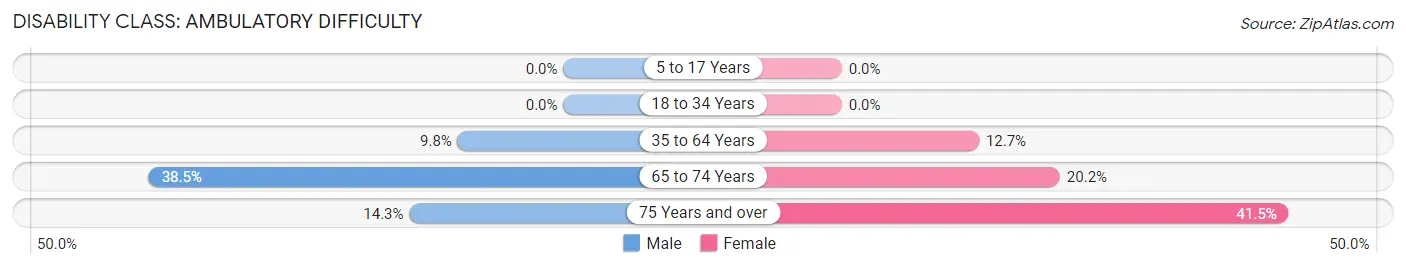
| Age Bracket | Male | Female |
| 5 to 17 Years | 0 (0.0%) | 0 (0.0%) |
| 18 to 34 Years | 0 (0.0%) | 0 (0.0%) |
| 35 to 64 Years | 174 (9.8%) | 233 (12.7%) |
| 65 to 74 Years | 197 (38.5%) | 200 (20.2%) |
| 75 Years and over | 56 (14.3%) | 299 (41.5%) |
Disability Class: Self-Care Difficulty
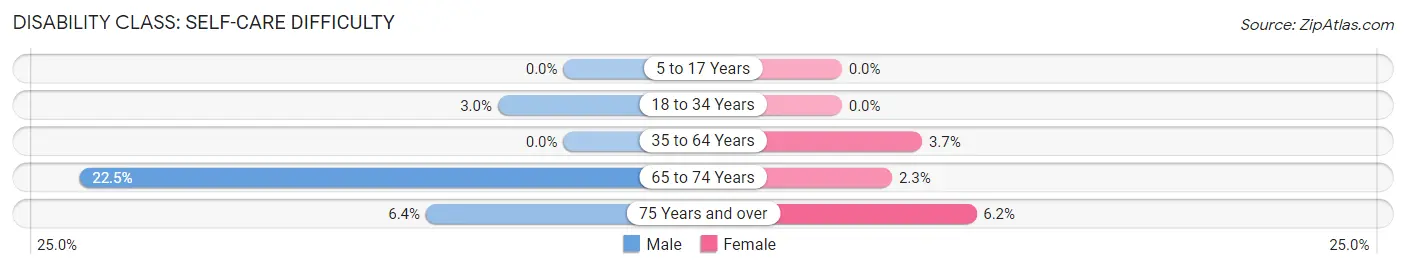
| Age Bracket | Male | Female |
| 5 to 17 Years | 0 (0.0%) | 0 (0.0%) |
| 18 to 34 Years | 18 (3.0%) | 0 (0.0%) |
| 35 to 64 Years | 0 (0.0%) | 68 (3.7%) |
| 65 to 74 Years | 115 (22.5%) | 23 (2.3%) |
| 75 Years and over | 25 (6.4%) | 45 (6.2%) |
Technology Access in Tarboro
Computing Device Access in Tarboro
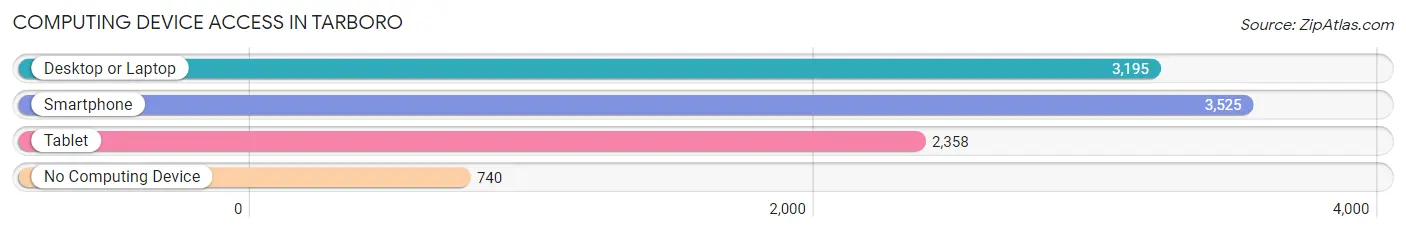
| Device Type | # Households | % Households |
| Desktop or Laptop | 3,195 | 66.9% |
| Smartphone | 3,525 | 73.8% |
| Tablet | 2,358 | 49.4% |
| No Computing Device | 740 | 15.5% |
| Total | 4,776 | 100.0% |
Internet Access in Tarboro
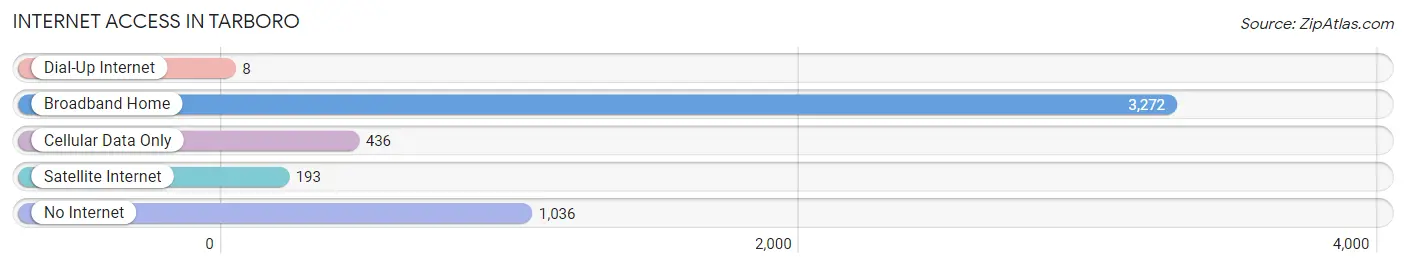
| Internet Type | # Households | % Households |
| Dial-Up Internet | 8 | 0.2% |
| Broadband Home | 3,272 | 68.5% |
| Cellular Data Only | 436 | 9.1% |
| Satellite Internet | 193 | 4.0% |
| No Internet | 1,036 | 21.7% |
| Total | 4,776 | 100.0% |
Tarboro Summary
Tarboro is a town located in Edgecombe County, North Carolina. It is the county seat of Edgecombe County and is located in the Inner Banks region of the state. The town has a population of 11,415 as of the 2010 census.
History
Tarboro was founded in 1760 by John Gray Blount, a planter from Bertie County. The town was named after the Tar River, which runs through the area. The town was incorporated in 1760 and was the first town in Edgecombe County.
Tarboro was an important trading center in the early 19th century. It was a major port for the export of cotton and other goods. The town was also a major stop on the Wilmington and Weldon Railroad, which connected Wilmington, North Carolina to Weldon, North Carolina.
During the Civil War, Tarboro was the site of several battles. In April 1865, Union forces under General William T. Sherman occupied the town.
Geography
Tarboro is located in the Inner Banks region of North Carolina. The town is situated on the Tar River, which runs through the area. The town is located about 40 miles east of Raleigh and about 50 miles west of Greenville.
The town has a total area of 8.3 square miles, all of which is land. The town is located at an elevation of about 100 feet above sea level.
Economy
The economy of Tarboro is largely based on agriculture and manufacturing. The town is home to several large manufacturing companies, including Carolina Turf and Sod, Edgecombe Furniture, and Tarboro Mills.
Agriculture is also an important part of the local economy. The town is home to several large farms, including the Tarboro Cotton Farm and the Tarboro Dairy Farm.
Demographics
As of the 2010 census, Tarboro had a population of 11,415. The racial makeup of the town was 57.3% White, 37.2% African American, 0.5% Native American, 0.7% Asian, 0.1% Pacific Islander, and 4.2% from other races. Hispanic or Latino of any race were 3.2% of the population.
The median income for a household in Tarboro was $31,919, and the median income for a family was $41,919. The per capita income for the town was $17,919. About 19.2% of the population was below the poverty line.
Tarboro is served by the Edgecombe County Public Schools system. The town is home to several schools, including Tarboro High School, Tarboro Middle School, and Tarboro Elementary School.
Common Questions
What is Per Capita Income in Tarboro?
Per Capita income in Tarboro is $30,196.
What is the Median Family Income in Tarboro?
Median Family Income in Tarboro is $68,194.
What is the Median Household income in Tarboro?
Median Household Income in Tarboro is $43,523.
What is Income or Wage Gap in Tarboro?
Income or Wage Gap in Tarboro is 0.3%.
Women in Tarboro earn 99.7 cents for every dollar earned by a man.
What is Inequality or Gini Index in Tarboro?
Inequality or Gini Index in Tarboro is 0.53.
What is the Total Population of Tarboro?
Total Population of Tarboro is 10,696.
What is the Total Male Population of Tarboro?
Total Male Population of Tarboro is 4,608.
What is the Total Female Population of Tarboro?
Total Female Population of Tarboro is 6,088.
What is the Ratio of Males per 100 Females in Tarboro?
There are 75.69 Males per 100 Females in Tarboro.
What is the Ratio of Females per 100 Males in Tarboro?
There are 132.12 Females per 100 Males in Tarboro.
What is the Median Population Age in Tarboro?
Median Population Age in Tarboro is 48.2 Years.
What is the Average Family Size in Tarboro
Average Family Size in Tarboro is 2.7 People.
What is the Average Household Size in Tarboro
Average Household Size in Tarboro is 2.1 People.
How Large is the Labor Force in Tarboro?
There are 4,290 People in the Labor Forcein in Tarboro.
What is the Percentage of People in the Labor Force in Tarboro?
50.3% of People are in the Labor Force in Tarboro.
What is the Unemployment Rate in Tarboro?
Unemployment Rate in Tarboro is 3.3%.