Burnsville, NC Map & Demographics
Burnsville Map
Burnsville Overview
$27,243
PER CAPITA INCOME
$63,512
AVG FAMILY INCOME
$39,018
AVG HOUSEHOLD INCOME
14.5%
WAGE / INCOME GAP [ % ]
85.5¢/ $1
WAGE / INCOME GAP [ $ ]
0.55
INEQUALITY / GINI INDEX
2,380
TOTAL POPULATION
1,269
MALE POPULATION
1,111
FEMALE POPULATION
114.22
MALES / 100 FEMALES
87.55
FEMALES / 100 MALES
37.4
MEDIAN AGE
3.0
AVG FAMILY SIZE
2.3
AVG HOUSEHOLD SIZE
959
LABOR FORCE [ PEOPLE ]
52.2%
PERCENT IN LABOR FORCE
6.0%
UNEMPLOYMENT RATE
Burnsville Zip Codes
Burnsville Area Codes
Income in Burnsville
Income Overview in Burnsville
Per Capita Income in Burnsville is $27,243, while median incomes of families and households are $63,512 and $39,018 respectively.
| Characteristic | Number | Measure |
| Per Capita Income | 2,380 | $27,243 |
| Median Family Income | 564 | $63,512 |
| Mean Family Income | 564 | $83,216 |
| Median Household Income | 972 | $39,018 |
| Mean Household Income | 972 | $63,831 |
| Income Deficit | 564 | $0 |
| Wage / Income Gap (%) | 2,380 | 14.54% |
| Wage / Income Gap ($) | 2,380 | 85.46¢ per $1 |
| Gini / Inequality Index | 2,380 | 0.55 |
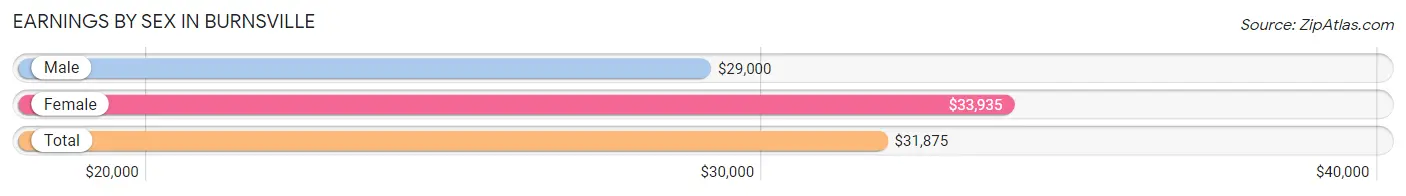
Earnings by Sex in Burnsville
Average Earnings in Burnsville are $31,875, $29,000 for men and $33,935 for women, a difference of 14.5%.
| Sex | Number | Average Earnings |
| Male | 604 (55.7%) | $29,000 |
| Female | 481 (44.3%) | $33,935 |
| Total | 1,085 (100.0%) | $31,875 |
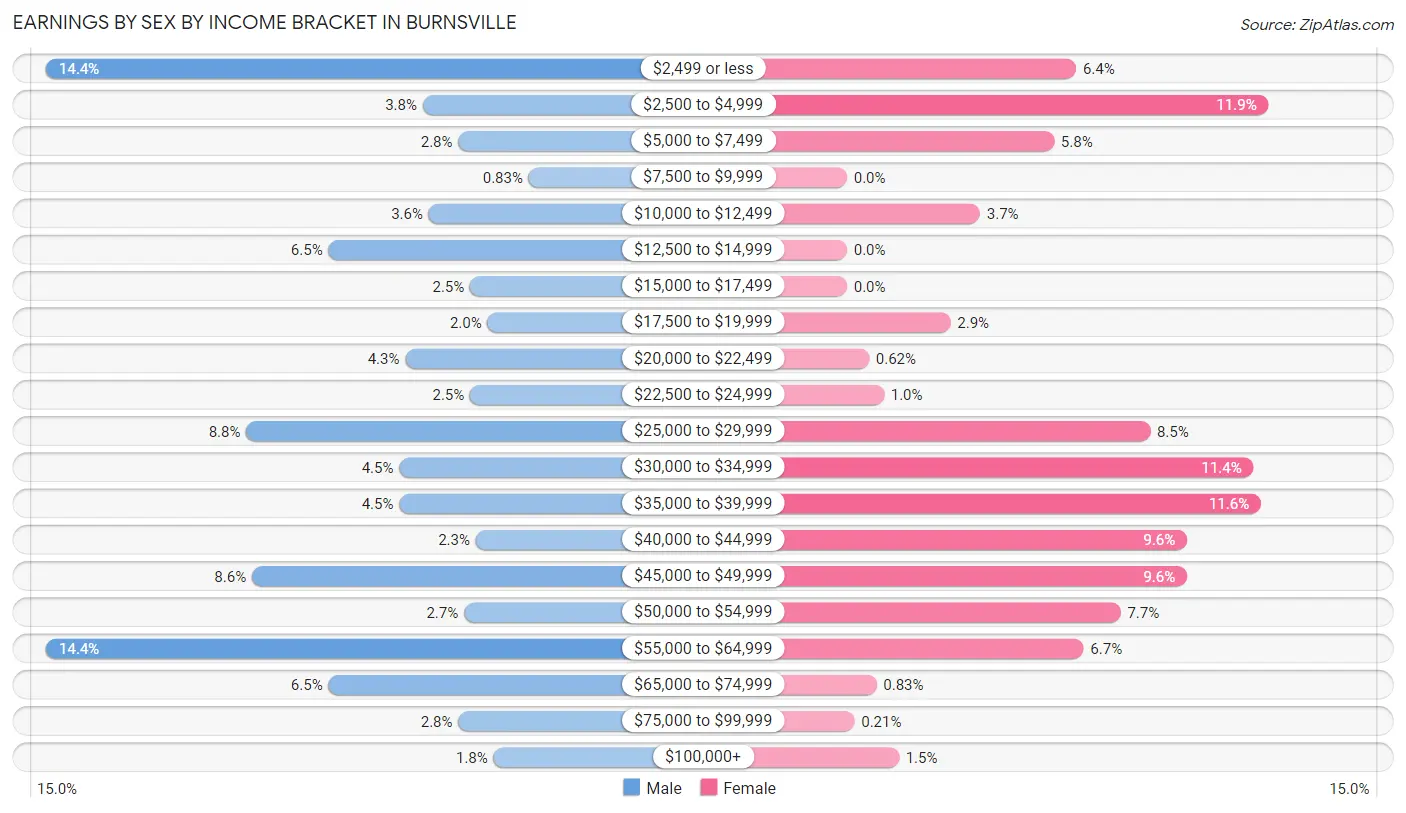
Earnings by Sex by Income Bracket in Burnsville
The most common earnings brackets in Burnsville are $2,499 or less for men (87 | 14.4%) and $2,500 to $4,999 for women (57 | 11.8%).
| Income | Male | Female |
| $2,499 or less | 87 (14.4%) | 31 (6.4%) |
| $2,500 to $4,999 | 23 (3.8%) | 57 (11.8%) |
| $5,000 to $7,499 | 17 (2.8%) | 28 (5.8%) |
| $7,500 to $9,999 | 5 (0.8%) | 0 (0.0%) |
| $10,000 to $12,499 | 22 (3.6%) | 18 (3.7%) |
| $12,500 to $14,999 | 39 (6.5%) | 0 (0.0%) |
| $15,000 to $17,499 | 15 (2.5%) | 0 (0.0%) |
| $17,500 to $19,999 | 12 (2.0%) | 14 (2.9%) |
| $20,000 to $22,499 | 26 (4.3%) | 3 (0.6%) |
| $22,500 to $24,999 | 15 (2.5%) | 5 (1.0%) |
| $25,000 to $29,999 | 53 (8.8%) | 41 (8.5%) |
| $30,000 to $34,999 | 27 (4.5%) | 55 (11.4%) |
| $35,000 to $39,999 | 27 (4.5%) | 56 (11.6%) |
| $40,000 to $44,999 | 14 (2.3%) | 46 (9.6%) |
| $45,000 to $49,999 | 52 (8.6%) | 46 (9.6%) |
| $50,000 to $54,999 | 16 (2.6%) | 37 (7.7%) |
| $55,000 to $64,999 | 87 (14.4%) | 32 (6.7%) |
| $65,000 to $74,999 | 39 (6.5%) | 4 (0.8%) |
| $75,000 to $99,999 | 17 (2.8%) | 1 (0.2%) |
| $100,000+ | 11 (1.8%) | 7 (1.5%) |
| Total | 604 (100.0%) | 481 (100.0%) |
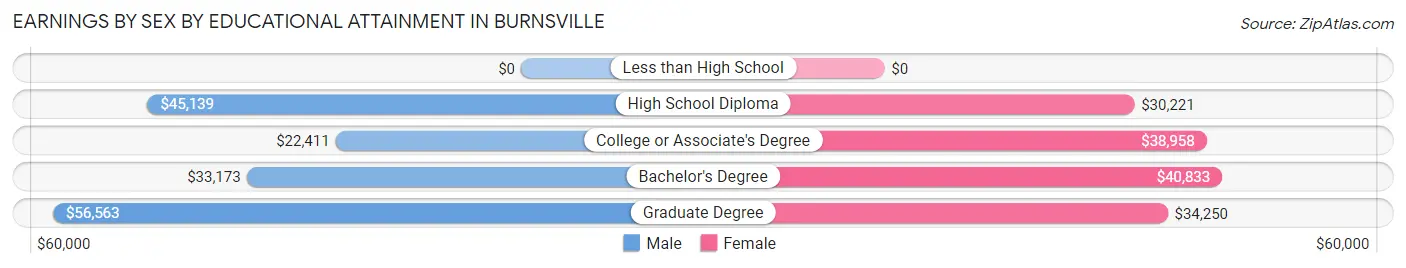
Earnings by Sex by Educational Attainment in Burnsville
Average earnings in Burnsville are $31,058 for men and $35,263 for women, a difference of 11.9%. Men with an educational attainment of graduate degree enjoy the highest average annual earnings of $56,563, while those with college or associate's degree education earn the least with $22,411. Women with an educational attainment of bachelor's degree earn the most with the average annual earnings of $40,833, while those with high school diploma education have the smallest earnings of $30,221.
| Educational Attainment | Male Income | Female Income |
| Less than High School | - | - |
| High School Diploma | $45,139 | $30,221 |
| College or Associate's Degree | $22,411 | $38,958 |
| Bachelor's Degree | $33,173 | $40,833 |
| Graduate Degree | $56,563 | $34,250 |
| Total | $31,058 | $35,263 |
Family Income in Burnsville
Family Income Brackets in Burnsville
According to the Burnsville family income data, there are 98 families falling into the $50,000 to $74,999 income range, which is the most common income bracket and makes up 17.4% of all families. Conversely, the $10,000 to $14,999 income bracket is the least frequent group with only 9 families (1.6%) belonging to this category.
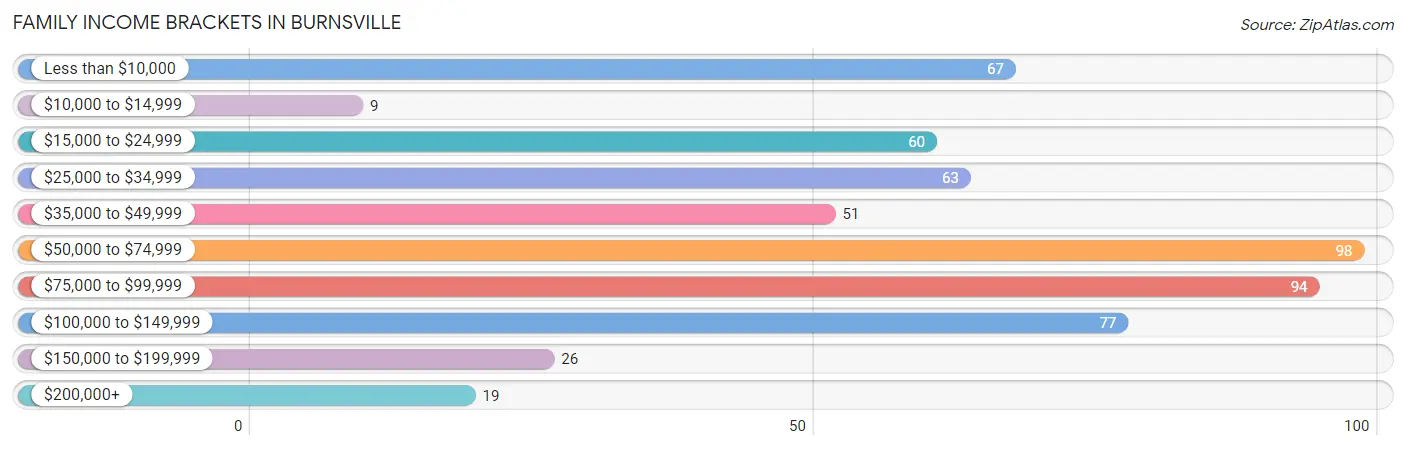
| Income Bracket | # Families | % Families |
| Less than $10,000 | 67 | 11.9% |
| $10,000 to $14,999 | 9 | 1.6% |
| $15,000 to $24,999 | 60 | 10.6% |
| $25,000 to $34,999 | 63 | 11.2% |
| $35,000 to $49,999 | 51 | 9.0% |
| $50,000 to $74,999 | 98 | 17.4% |
| $75,000 to $99,999 | 94 | 16.7% |
| $100,000 to $149,999 | 77 | 13.7% |
| $150,000 to $199,999 | 26 | 4.6% |
| $200,000+ | 19 | 3.4% |
Family Income by Famaliy Size in Burnsville
3-person families (79 | 14.0%) account for the highest median family income in Burnsville with $69,896 per family, while 2-person families (344 | 61.0%) have the highest median income of $26,666 per family member.
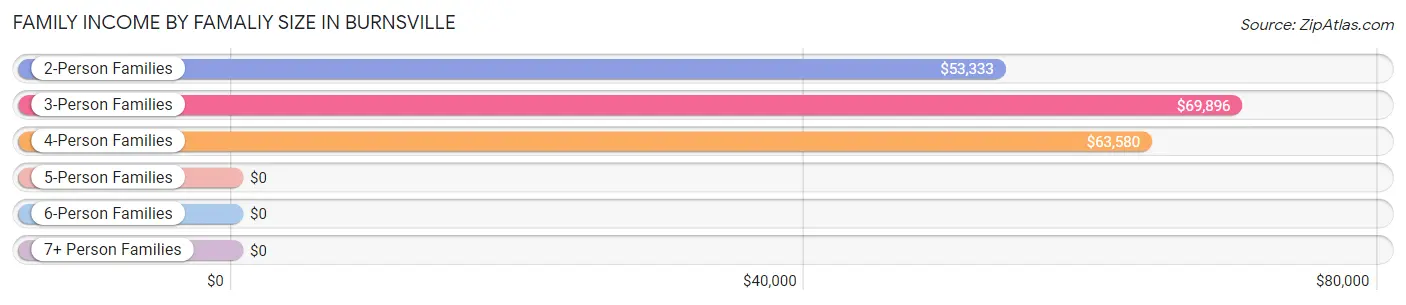
| Income Bracket | # Families | Median Income |
| 2-Person Families | 344 (61.0%) | $53,333 |
| 3-Person Families | 79 (14.0%) | $69,896 |
| 4-Person Families | 77 (13.7%) | $63,580 |
| 5-Person Families | 54 (9.6%) | $0 |
| 6-Person Families | 0 (0.0%) | $0 |
| 7+ Person Families | 10 (1.8%) | $0 |
| Total | 564 (100.0%) | $63,512 |
Family Income by Number of Earners in Burnsville
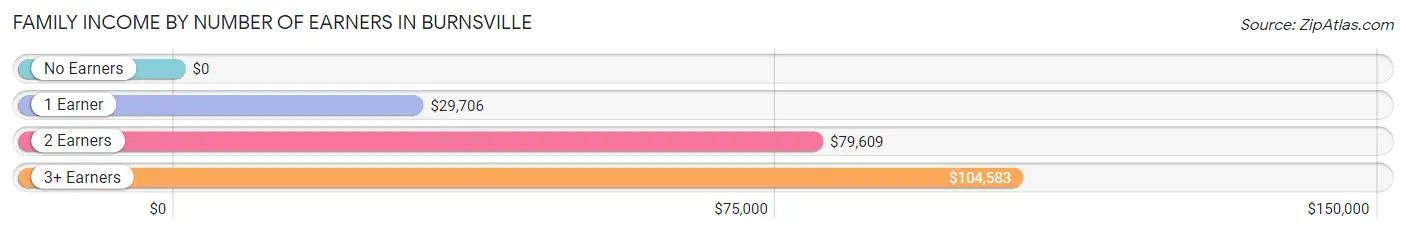
| Number of Earners | # Families | Median Income |
| No Earners | 120 (21.3%) | $0 |
| 1 Earner | 166 (29.4%) | $29,706 |
| 2 Earners | 243 (43.1%) | $79,609 |
| 3+ Earners | 35 (6.2%) | $104,583 |
| Total | 564 (100.0%) | $63,512 |
Household Income in Burnsville
Household Income Brackets in Burnsville
With 173 households falling in the category, the $50,000 to $74,999 income range is the most frequent in Burnsville, accounting for 17.8% of all households. In contrast, only 19 households (1.9%) fall into the $200,000+ income bracket, making it the least populous group.
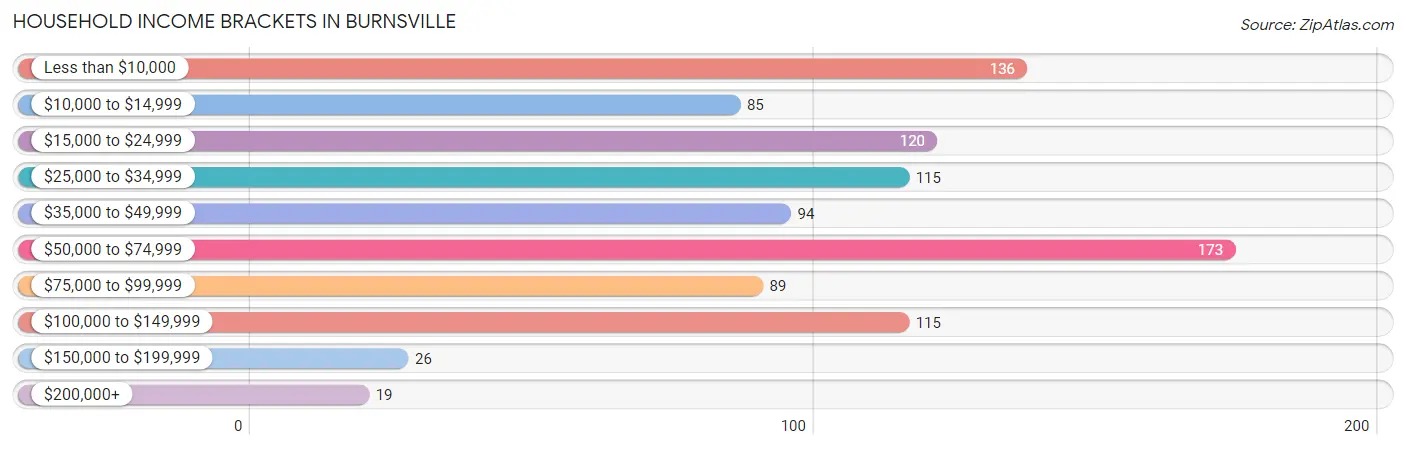
| Income Bracket | # Households | % Households |
| Less than $10,000 | 136 | 14.0% |
| $10,000 to $14,999 | 85 | 8.7% |
| $15,000 to $24,999 | 120 | 12.3% |
| $25,000 to $34,999 | 115 | 11.8% |
| $35,000 to $49,999 | 94 | 9.7% |
| $50,000 to $74,999 | 173 | 17.8% |
| $75,000 to $99,999 | 89 | 9.2% |
| $100,000 to $149,999 | 115 | 11.8% |
| $150,000 to $199,999 | 26 | 2.7% |
| $200,000+ | 19 | 2.0% |
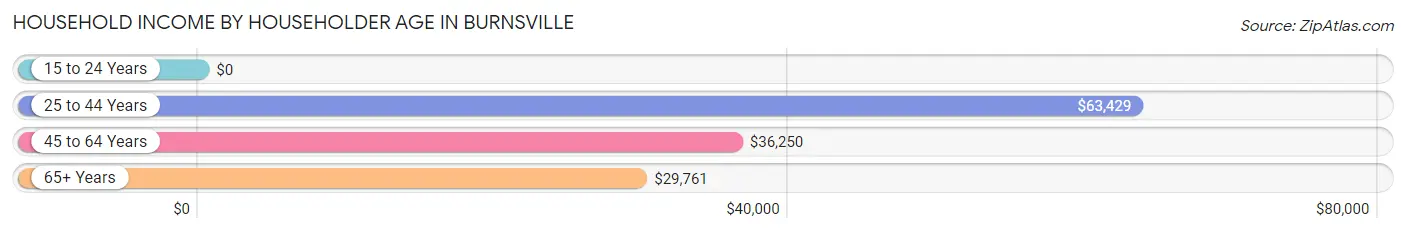
Household Income by Householder Age in Burnsville
The median household income in Burnsville is $39,018, with the highest median household income of $63,429 found in the 25 to 44 years age bracket for the primary householder. A total of 383 households (39.4%) fall into this category. Meanwhile, the 15 to 24 years age bracket for the primary householder has the lowest median household income of $0, with 14 households (1.4%) in this group.
| Income Bracket | # Households | Median Income |
| 15 to 24 Years | 14 (1.4%) | $0 |
| 25 to 44 Years | 383 (39.4%) | $63,429 |
| 45 to 64 Years | 264 (27.2%) | $36,250 |
| 65+ Years | 311 (32.0%) | $29,761 |
| Total | 972 (100.0%) | $39,018 |
Poverty in Burnsville
Income Below Poverty by Sex and Age in Burnsville
With 33.4% poverty level for males and 24.7% for females among the residents of Burnsville, 12 to 14 year old males and 6 to 11 year old females are the most vulnerable to poverty, with 19 males (76.0%) and 71 females (64.0%) in their respective age groups living below the poverty level.
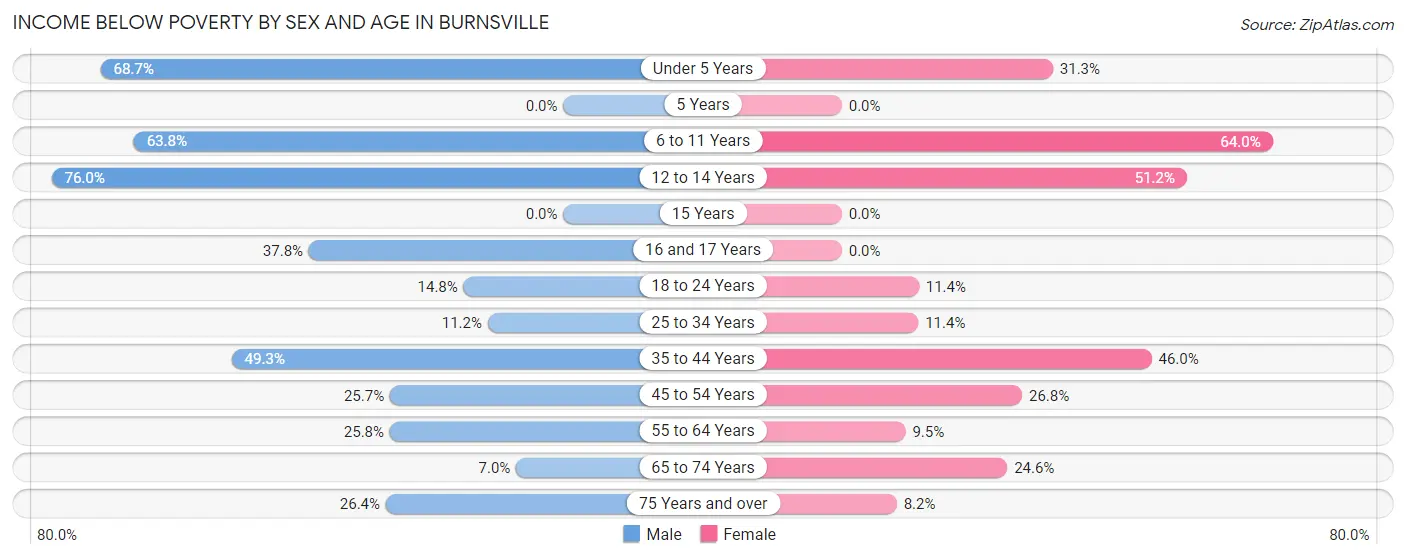
| Age Bracket | Male | Female |
| Under 5 Years | 123 (68.7%) | 21 (31.3%) |
| 5 Years | 0 (0.0%) | 0 (0.0%) |
| 6 to 11 Years | 37 (63.8%) | 71 (64.0%) |
| 12 to 14 Years | 19 (76.0%) | 21 (51.2%) |
| 15 Years | 0 (0.0%) | 0 (0.0%) |
| 16 and 17 Years | 17 (37.8%) | 0 (0.0%) |
| 18 to 24 Years | 8 (14.8%) | 4 (11.4%) |
| 25 to 34 Years | 23 (11.2%) | 21 (11.4%) |
| 35 to 44 Years | 67 (49.3%) | 46 (46.0%) |
| 45 to 54 Years | 26 (25.7%) | 34 (26.8%) |
| 55 to 64 Years | 34 (25.8%) | 7 (9.5%) |
| 65 to 74 Years | 7 (7.0%) | 28 (24.6%) |
| 75 Years and over | 34 (26.4%) | 11 (8.2%) |
| Total | 395 (33.4%) | 264 (24.7%) |
Income Above Poverty by Sex and Age in Burnsville
According to the poverty statistics in Burnsville, males aged 5 years and females aged 15 years are the age groups that are most secure financially, with 100.0% of males and 100.0% of females in these age groups living above the poverty line.
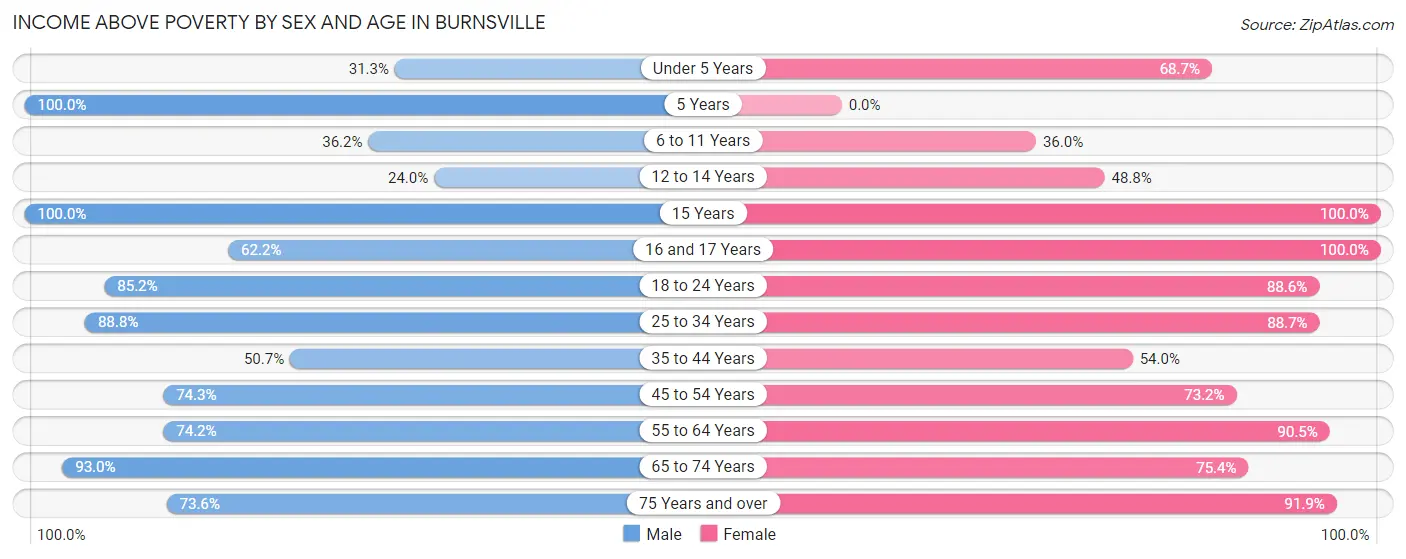
| Age Bracket | Male | Female |
| Under 5 Years | 56 (31.3%) | 46 (68.7%) |
| 5 Years | 3 (100.0%) | 0 (0.0%) |
| 6 to 11 Years | 21 (36.2%) | 40 (36.0%) |
| 12 to 14 Years | 6 (24.0%) | 20 (48.8%) |
| 15 Years | 17 (100.0%) | 41 (100.0%) |
| 16 and 17 Years | 28 (62.2%) | 38 (100.0%) |
| 18 to 24 Years | 46 (85.2%) | 31 (88.6%) |
| 25 to 34 Years | 182 (88.8%) | 164 (88.6%) |
| 35 to 44 Years | 69 (50.7%) | 54 (54.0%) |
| 45 to 54 Years | 75 (74.3%) | 93 (73.2%) |
| 55 to 64 Years | 98 (74.2%) | 67 (90.5%) |
| 65 to 74 Years | 93 (93.0%) | 86 (75.4%) |
| 75 Years and over | 95 (73.6%) | 124 (91.8%) |
| Total | 789 (66.6%) | 804 (75.3%) |
Income Below Poverty Among Married-Couple Families in Burnsville
The poverty statistics for married-couple families in Burnsville show that 7.1% or 28 of the total 396 families live below the poverty line. Families with 3 or 4 children have the highest poverty rate of 47.6%, comprising of 10 families. On the other hand, families with 5 or more children have the lowest poverty rate of 0.0%, which includes 0 families.
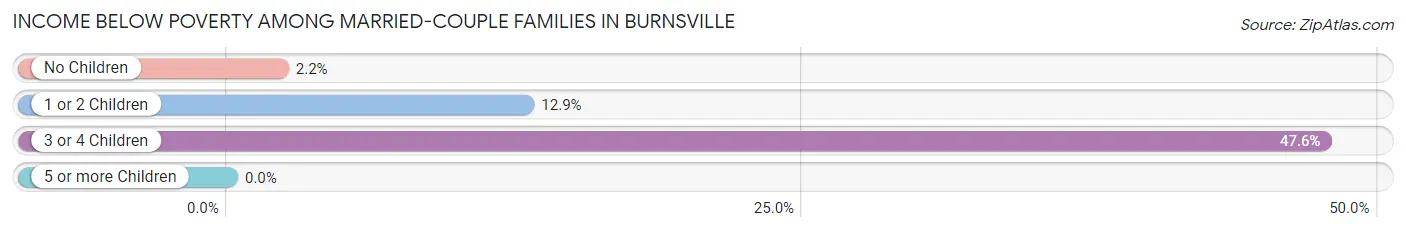
| Children | Above Poverty | Below Poverty |
| No Children | 266 (97.8%) | 6 (2.2%) |
| 1 or 2 Children | 81 (87.1%) | 12 (12.9%) |
| 3 or 4 Children | 11 (52.4%) | 10 (47.6%) |
| 5 or more Children | 10 (100.0%) | 0 (0.0%) |
| Total | 368 (92.9%) | 28 (7.1%) |
Income Below Poverty Among Single-Parent Households in Burnsville
According to the poverty data in Burnsville, 30.4% or 14 single-father households and 54.1% or 66 single-mother households are living below the poverty line. Among single-father households, those with 1 or 2 children have the highest poverty rate, with 14 households (31.1%) experiencing poverty. Likewise, among single-mother households, those with 3 or 4 children have the highest poverty rate, with 29 households (80.6%) falling below the poverty line.
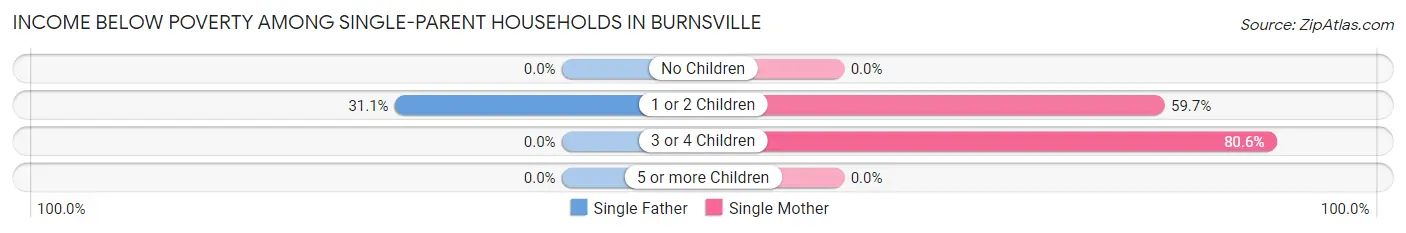
| Children | Single Father | Single Mother |
| No Children | 0 (0.0%) | 0 (0.0%) |
| 1 or 2 Children | 14 (31.1%) | 37 (59.7%) |
| 3 or 4 Children | 0 (0.0%) | 29 (80.6%) |
| 5 or more Children | 0 (0.0%) | 0 (0.0%) |
| Total | 14 (30.4%) | 66 (54.1%) |
Income Below Poverty Among Married-Couple vs Single-Parent Households in Burnsville
The poverty data for Burnsville shows that 28 of the married-couple family households (7.1%) and 80 of the single-parent households (47.6%) are living below the poverty level. Within the married-couple family households, those with 3 or 4 children have the highest poverty rate, with 10 households (47.6%) falling below the poverty line. Among the single-parent households, those with 3 or 4 children have the highest poverty rate, with 29 household (80.6%) living below poverty.
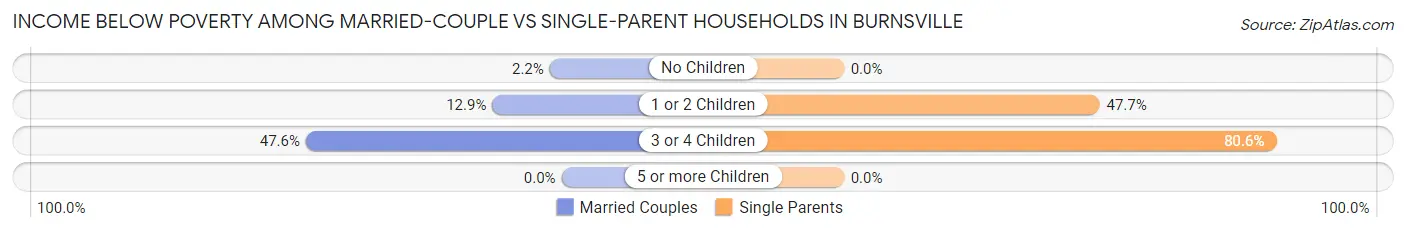
| Children | Married-Couple Families | Single-Parent Households |
| No Children | 6 (2.2%) | 0 (0.0%) |
| 1 or 2 Children | 12 (12.9%) | 51 (47.7%) |
| 3 or 4 Children | 10 (47.6%) | 29 (80.6%) |
| 5 or more Children | 0 (0.0%) | 0 (0.0%) |
| Total | 28 (7.1%) | 80 (47.6%) |
Race in Burnsville
The most populous races in Burnsville are White / Caucasian (1,949 | 81.9%), Hispanic or Latino (354 | 14.9%), and Two or more Races (238 | 10.0%).
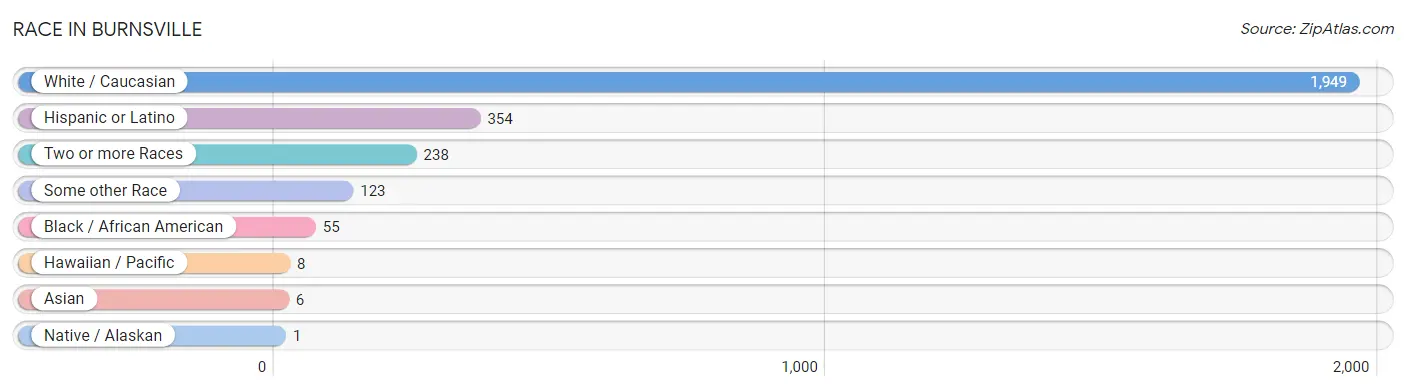
| Race | # Population | % Population |
| Asian | 6 | 0.3% |
| Black / African American | 55 | 2.3% |
| Hawaiian / Pacific | 8 | 0.3% |
| Hispanic or Latino | 354 | 14.9% |
| Native / Alaskan | 1 | 0.0% |
| White / Caucasian | 1,949 | 81.9% |
| Two or more Races | 238 | 10.0% |
| Some other Race | 123 | 5.2% |
| Total | 2,380 | 100.0% |
Ancestry in Burnsville
The most populous ancestries reported in Burnsville are English (253 | 10.6%), German (250 | 10.5%), American (230 | 9.7%), Mexican (205 | 8.6%), and Scotch-Irish (150 | 6.3%), together accounting for 45.7% of all Burnsville residents.
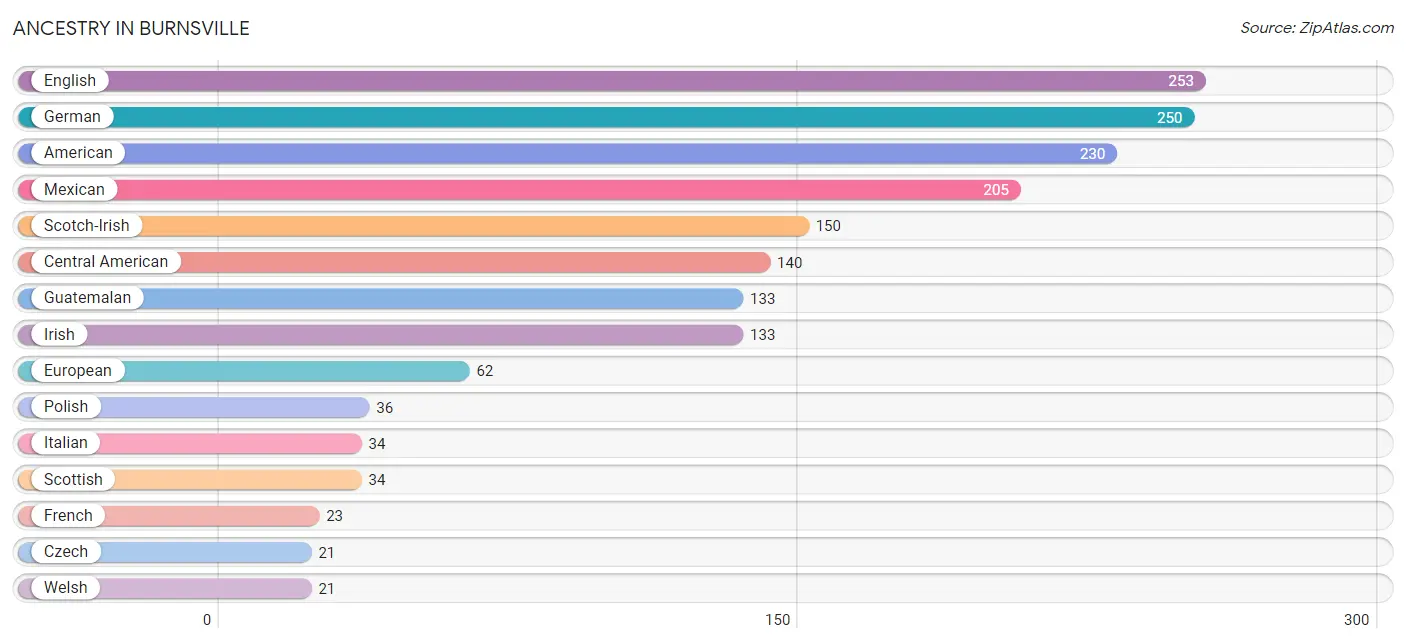
| Ancestry | # Population | % Population |
| Alaskan Athabascan | 2 | 0.1% |
| American | 230 | 9.7% |
| Blackfeet | 2 | 0.1% |
| British | 13 | 0.5% |
| Bulgarian | 4 | 0.2% |
| Central American | 140 | 5.9% |
| Cuban | 2 | 0.1% |
| Czech | 21 | 0.9% |
| Dutch | 10 | 0.4% |
| English | 253 | 10.6% |
| European | 62 | 2.6% |
| French | 23 | 1.0% |
| French American Indian | 1 | 0.0% |
| German | 250 | 10.5% |
| Greek | 12 | 0.5% |
| Guatemalan | 133 | 5.6% |
| Irish | 133 | 5.6% |
| Italian | 34 | 1.4% |
| Korean | 1 | 0.0% |
| Laotian | 2 | 0.1% |
| Mexican | 205 | 8.6% |
| Native Hawaiian | 8 | 0.3% |
| New Zealander | 2 | 0.1% |
| Norwegian | 3 | 0.1% |
| Polish | 36 | 1.5% |
| Salvadoran | 7 | 0.3% |
| Scotch-Irish | 150 | 6.3% |
| Scottish | 34 | 1.4% |
| South African | 5 | 0.2% |
| Subsaharan African | 5 | 0.2% |
| Swedish | 12 | 0.5% |
| Swiss | 12 | 0.5% |
| Turkish | 3 | 0.1% |
| Ukrainian | 4 | 0.2% |
| Welsh | 21 | 0.9% | View All 35 Rows |
Immigrants in Burnsville
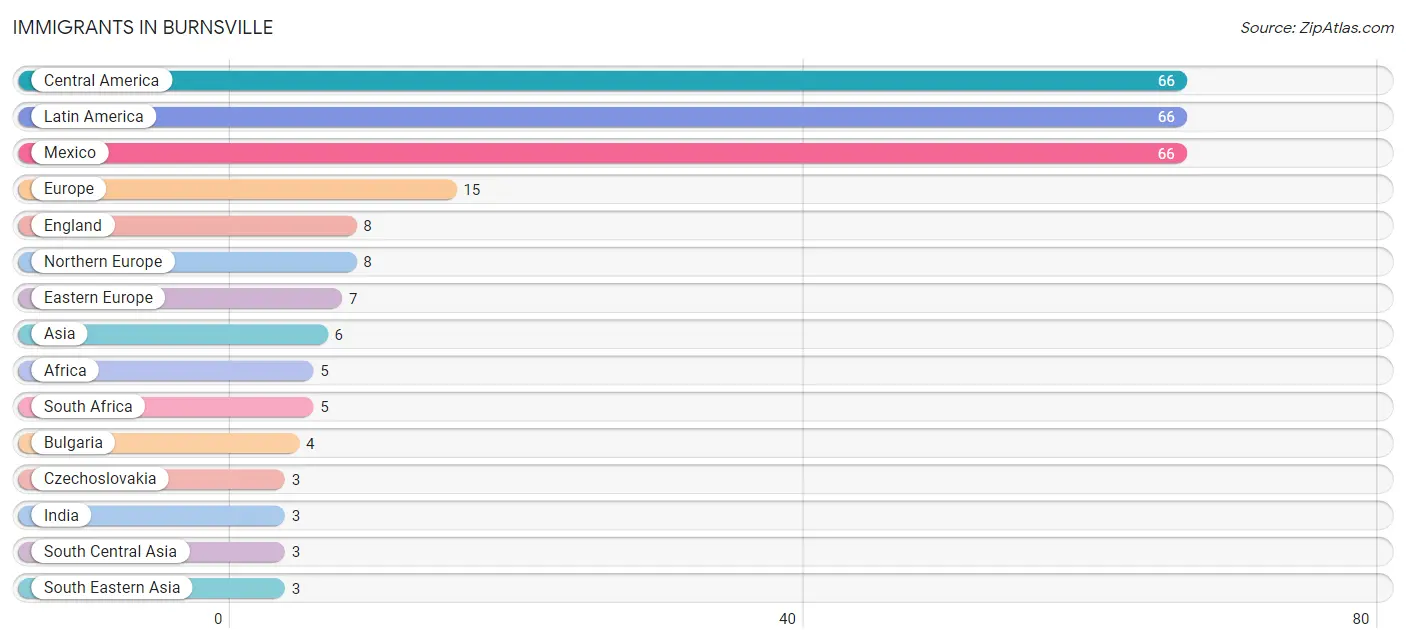
The most numerous immigrant groups reported in Burnsville came from Central America (66 | 2.8%), Latin America (66 | 2.8%), Mexico (66 | 2.8%), Europe (15 | 0.6%), and England (8 | 0.3%), together accounting for 9.3% of all Burnsville residents.
| Immigration Origin | # Population | % Population |
| Africa | 5 | 0.2% |
| Asia | 6 | 0.3% |
| Bulgaria | 4 | 0.2% |
| Central America | 66 | 2.8% |
| Czechoslovakia | 3 | 0.1% |
| Eastern Europe | 7 | 0.3% |
| England | 8 | 0.3% |
| Europe | 15 | 0.6% |
| India | 3 | 0.1% |
| Indonesia | 2 | 0.1% |
| Latin America | 66 | 2.8% |
| Mexico | 66 | 2.8% |
| Northern Europe | 8 | 0.3% |
| Oceania | 2 | 0.1% |
| Philippines | 1 | 0.0% |
| South Africa | 5 | 0.2% |
| South Central Asia | 3 | 0.1% |
| South Eastern Asia | 3 | 0.1% | View All 18 Rows |
Sex and Age in Burnsville
Sex and Age in Burnsville
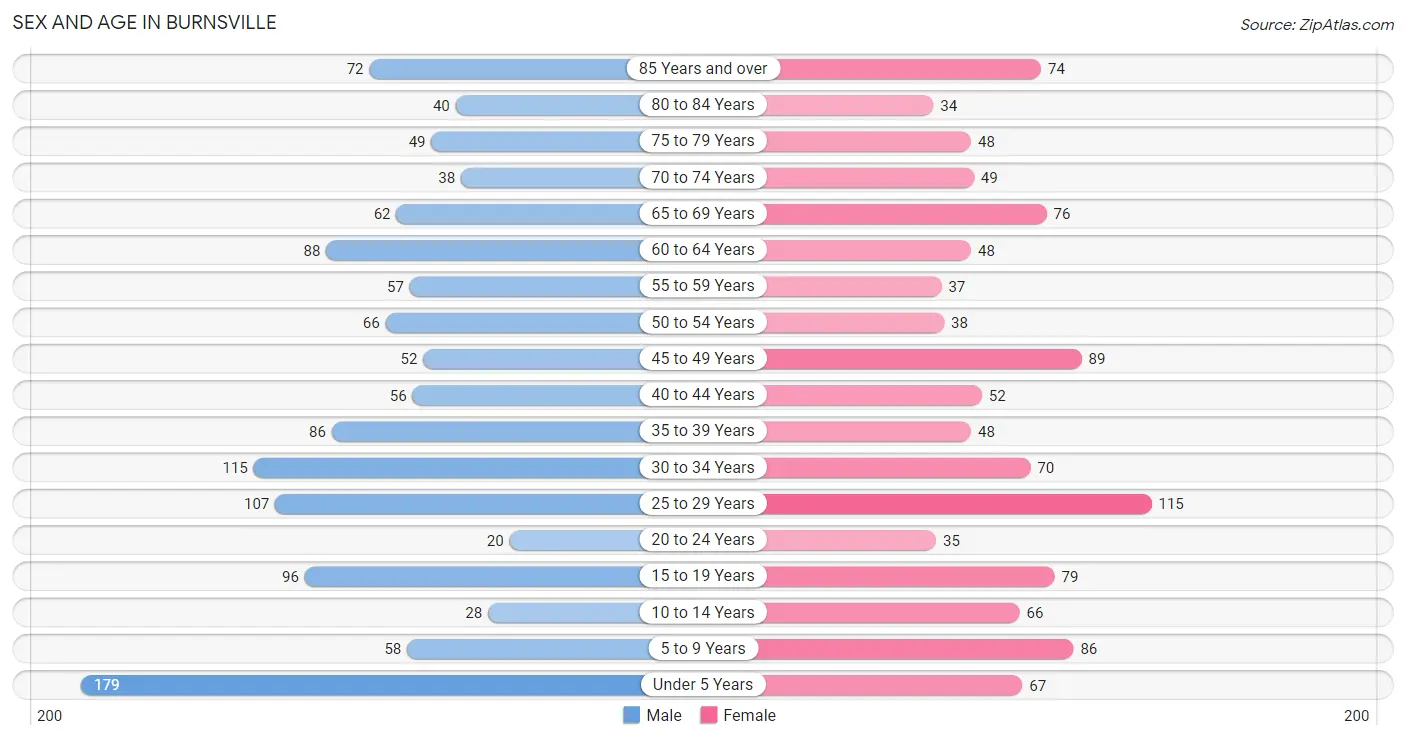
The most populous age groups in Burnsville are Under 5 Years (179 | 14.1%) for men and 25 to 29 Years (115 | 10.3%) for women.
| Age Bracket | Male | Female |
| Under 5 Years | 179 (14.1%) | 67 (6.0%) |
| 5 to 9 Years | 58 (4.6%) | 86 (7.7%) |
| 10 to 14 Years | 28 (2.2%) | 66 (5.9%) |
| 15 to 19 Years | 96 (7.6%) | 79 (7.1%) |
| 20 to 24 Years | 20 (1.6%) | 35 (3.2%) |
| 25 to 29 Years | 107 (8.4%) | 115 (10.3%) |
| 30 to 34 Years | 115 (9.1%) | 70 (6.3%) |
| 35 to 39 Years | 86 (6.8%) | 48 (4.3%) |
| 40 to 44 Years | 56 (4.4%) | 52 (4.7%) |
| 45 to 49 Years | 52 (4.1%) | 89 (8.0%) |
| 50 to 54 Years | 66 (5.2%) | 38 (3.4%) |
| 55 to 59 Years | 57 (4.5%) | 37 (3.3%) |
| 60 to 64 Years | 88 (6.9%) | 48 (4.3%) |
| 65 to 69 Years | 62 (4.9%) | 76 (6.8%) |
| 70 to 74 Years | 38 (3.0%) | 49 (4.4%) |
| 75 to 79 Years | 49 (3.9%) | 48 (4.3%) |
| 80 to 84 Years | 40 (3.2%) | 34 (3.1%) |
| 85 Years and over | 72 (5.7%) | 74 (6.7%) |
| Total | 1,269 (100.0%) | 1,111 (100.0%) |
Families and Households in Burnsville
Median Family Size in Burnsville
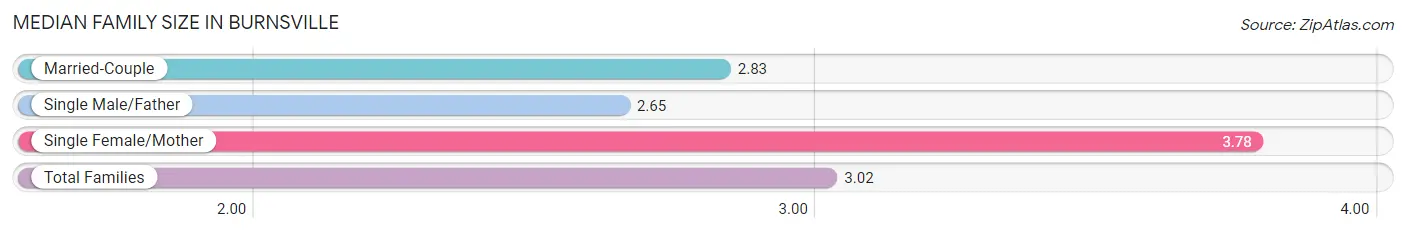
The median family size in Burnsville is 3.02 persons per family, with single female/mother families (122 | 21.6%) accounting for the largest median family size of 3.78 persons per family. On the other hand, single male/father families (46 | 8.2%) represent the smallest median family size with 2.65 persons per family.
| Family Type | # Families | Family Size |
| Married-Couple | 396 (70.2%) | 2.83 |
| Single Male/Father | 46 (8.2%) | 2.65 |
| Single Female/Mother | 122 (21.6%) | 3.78 |
| Total Families | 564 (100.0%) | 3.02 |
Median Household Size in Burnsville
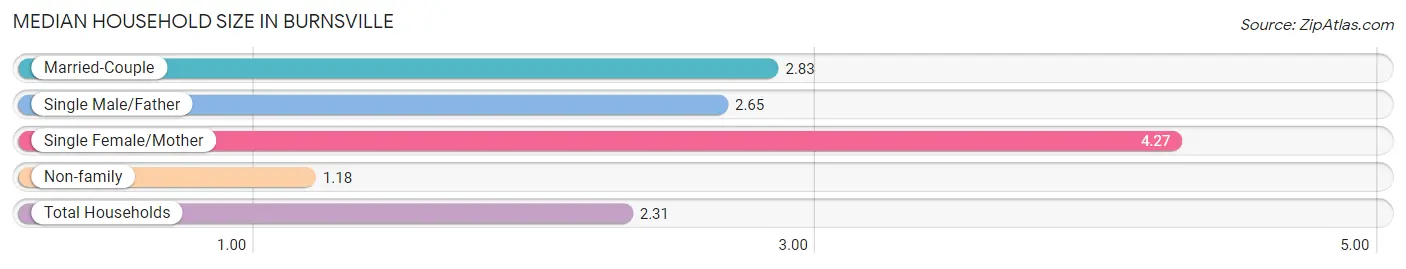
The median household size in Burnsville is 2.31 persons per household, with single female/mother households (122 | 12.6%) accounting for the largest median household size of 4.27 persons per household. non-family households (408 | 42.0%) represent the smallest median household size with 1.18 persons per household.
| Household Type | # Households | Household Size |
| Married-Couple | 396 (40.7%) | 2.83 |
| Single Male/Father | 46 (4.7%) | 2.65 |
| Single Female/Mother | 122 (12.6%) | 4.27 |
| Non-family | 408 (42.0%) | 1.18 |
| Total Households | 972 (100.0%) | 2.31 |
Household Size by Marriage Status in Burnsville
Out of a total of 972 households in Burnsville, 564 (58.0%) are family households, while 408 (42.0%) are nonfamily households. The most numerous type of family households are 2-person households, comprising 310, and the most common type of nonfamily households are 1-person households, comprising 332.
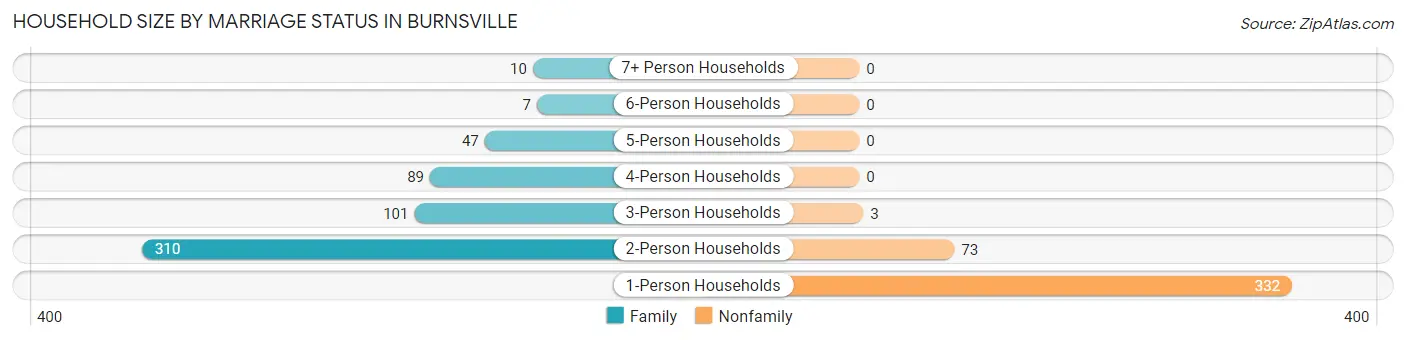
| Household Size | Family Households | Nonfamily Households |
| 1-Person Households | - | 332 (34.2%) |
| 2-Person Households | 310 (31.9%) | 73 (7.5%) |
| 3-Person Households | 101 (10.4%) | 3 (0.3%) |
| 4-Person Households | 89 (9.2%) | 0 (0.0%) |
| 5-Person Households | 47 (4.8%) | 0 (0.0%) |
| 6-Person Households | 7 (0.7%) | 0 (0.0%) |
| 7+ Person Households | 10 (1.0%) | 0 (0.0%) |
| Total | 564 (58.0%) | 408 (42.0%) |
Female Fertility in Burnsville
Fertility by Age in Burnsville
Average fertility rate in Burnsville is 57.0 births per 1,000 women. Women in the age bracket of 20 to 34 years have the highest fertility rate with 127.0 births per 1,000 women. Women in the age bracket of 20 to 34 years acount for 100.0% of all women with births.
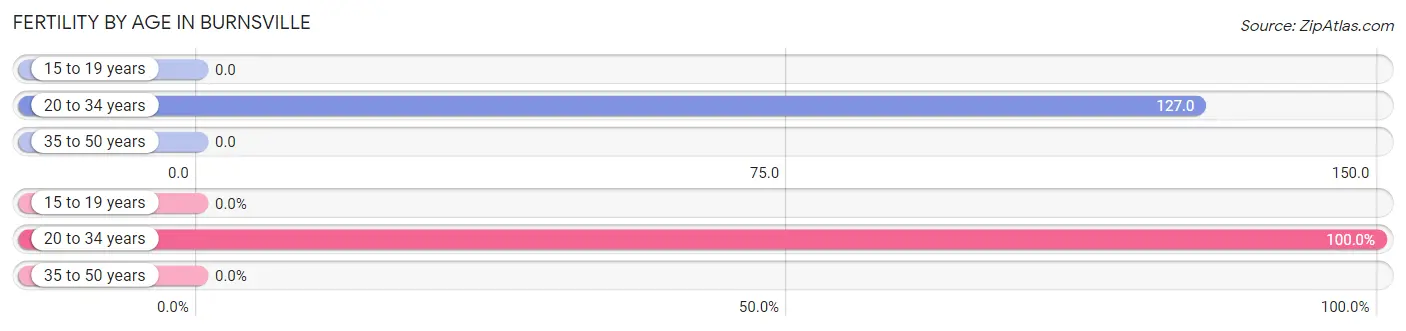
| Age Bracket | Women with Births | Births / 1,000 Women |
| 15 to 19 years | 0 (0.0%) | 0.0 |
| 20 to 34 years | 28 (100.0%) | 127.0 |
| 35 to 50 years | 0 (0.0%) | 0.0 |
| Total | 28 (100.0%) | 57.0 |
Fertility by Age by Marriage Status in Burnsville
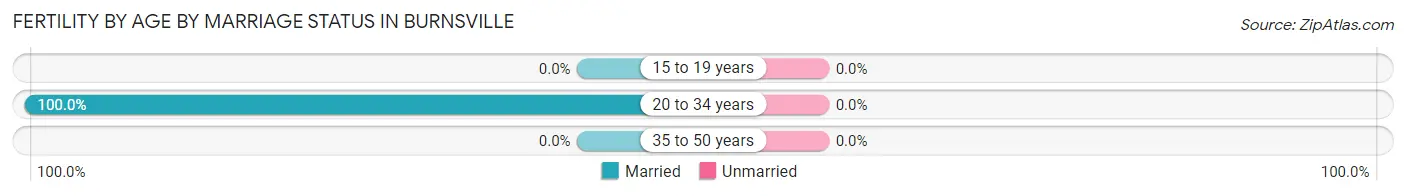
| Age Bracket | Married | Unmarried |
| 15 to 19 years | 0 (0.0%) | 0 (0.0%) |
| 20 to 34 years | 28 (100.0%) | 0 (0.0%) |
| 35 to 50 years | 0 (0.0%) | 0 (0.0%) |
| Total | 28 (100.0%) | 0 (0.0%) |
Fertility by Education in Burnsville
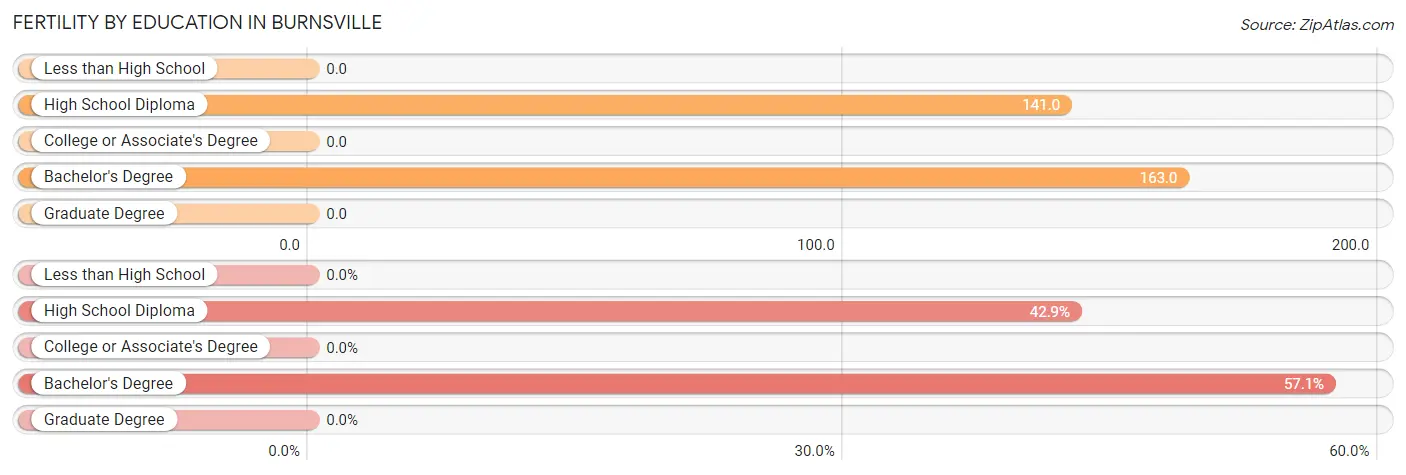
| Educational Attainment | Women with Births | Births / 1,000 Women |
| Less than High School | 0 (0.0%) | 0.0 |
| High School Diploma | 12 (42.9%) | 141.0 |
| College or Associate's Degree | 0 (0.0%) | 0.0 |
| Bachelor's Degree | 16 (57.1%) | 163.0 |
| Graduate Degree | 0 (0.0%) | 0.0 |
| Total | 28 (100.0%) | 57.0 |
Fertility by Education by Marriage Status in Burnsville
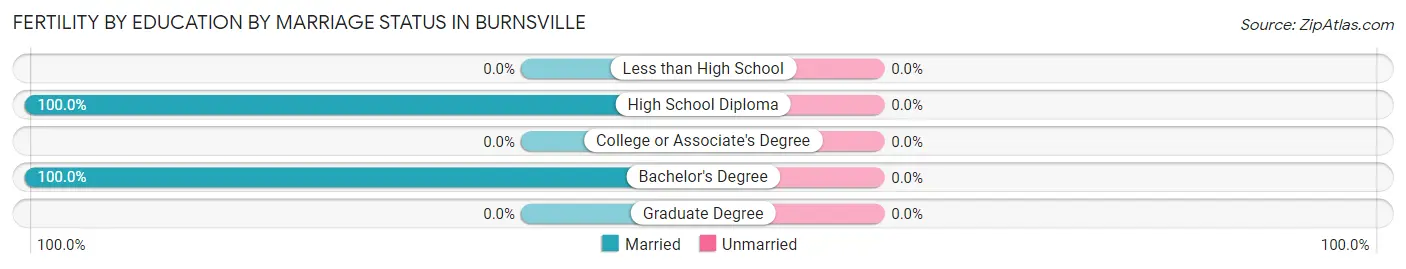
| Educational Attainment | Married | Unmarried |
| Less than High School | 0 (0.0%) | 0 (0.0%) |
| High School Diploma | 12 (100.0%) | 0 (0.0%) |
| College or Associate's Degree | 0 (0.0%) | 0 (0.0%) |
| Bachelor's Degree | 16 (100.0%) | 0 (0.0%) |
| Graduate Degree | 0 (0.0%) | 0 (0.0%) |
| Total | 28 (100.0%) | 0 (0.0%) |
Employment Characteristics in Burnsville
Employment by Class of Employer in Burnsville
Among the 872 employed individuals in Burnsville, private company employees (524 | 60.1%), self-employed (not incorporated) (120 | 13.8%), and state government employees (101 | 11.6%) make up the most common classes of employment.
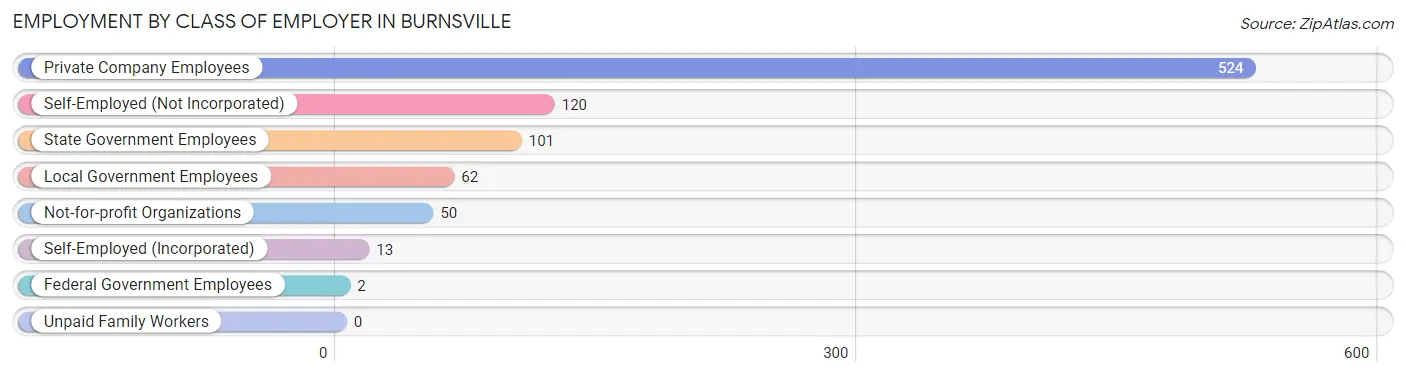
| Employer Class | # Employees | % Employees |
| Private Company Employees | 524 | 60.1% |
| Self-Employed (Incorporated) | 13 | 1.5% |
| Self-Employed (Not Incorporated) | 120 | 13.8% |
| Not-for-profit Organizations | 50 | 5.7% |
| Local Government Employees | 62 | 7.1% |
| State Government Employees | 101 | 11.6% |
| Federal Government Employees | 2 | 0.2% |
| Unpaid Family Workers | 0 | 0.0% |
| Total | 872 | 100.0% |
Employment Status by Age in Burnsville
According to the labor force statistics for Burnsville, out of the total population over 16 years of age (1,838), 52.2% or 959 individuals are in the labor force, with 6.0% or 58 of them unemployed. The age group with the highest labor force participation rate is 20 to 24 years, with 92.7% or 51 individuals in the labor force. Within the labor force, the 60 to 64 years age range has the highest percentage of unemployed individuals, with 26.7% or 12 of them being unemployed.
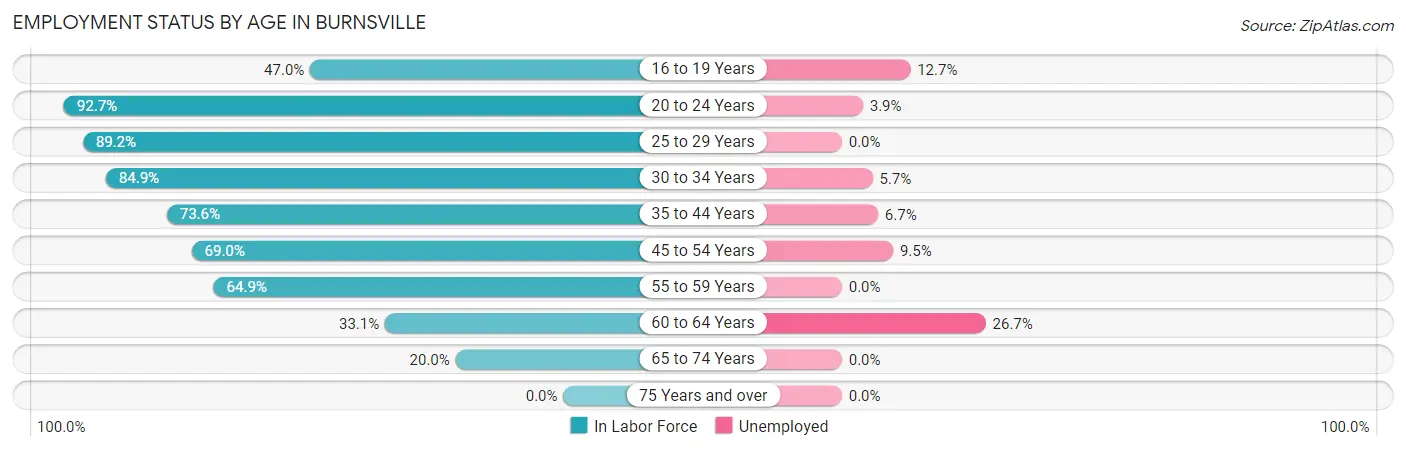
| Age Bracket | In Labor Force | Unemployed |
| 16 to 19 Years | 55 (47.0%) | 7 (12.7%) |
| 20 to 24 Years | 51 (92.7%) | 2 (3.9%) |
| 25 to 29 Years | 198 (89.2%) | 0 (0.0%) |
| 30 to 34 Years | 157 (84.9%) | 9 (5.7%) |
| 35 to 44 Years | 178 (73.6%) | 12 (6.7%) |
| 45 to 54 Years | 169 (69.0%) | 16 (9.5%) |
| 55 to 59 Years | 61 (64.9%) | 0 (0.0%) |
| 60 to 64 Years | 45 (33.1%) | 12 (26.7%) |
| 65 to 74 Years | 45 (20.0%) | 0 (0.0%) |
| 75 Years and over | 0 (0.0%) | 0 (0.0%) |
| Total | 959 (52.2%) | 58 (6.0%) |
Employment Status by Educational Attainment in Burnsville
According to labor force statistics for Burnsville, 71.9% of individuals (808) out of the total population between 25 and 64 years of age (1,124) are in the labor force, with 6.1% or 49 of them being unemployed. The group with the highest labor force participation rate are those with the educational attainment of bachelor's degree or higher, with 85.3% or 203 individuals in the labor force. Within the labor force, individuals with high school diploma education have the highest percentage of unemployment, with 11.4% or 28 of them being unemployed.
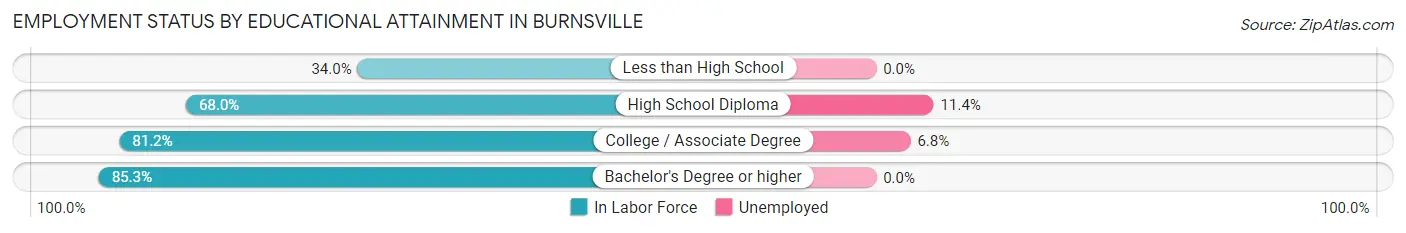
| Educational Attainment | In Labor Force | Unemployed |
| Less than High School | 48 (34.0%) | 0 (0.0%) |
| High School Diploma | 246 (68.0%) | 41 (11.4%) |
| College / Associate Degree | 311 (81.2%) | 26 (6.8%) |
| Bachelor's Degree or higher | 203 (85.3%) | 0 (0.0%) |
| Total | 808 (71.9%) | 69 (6.1%) |
Employment Occupations by Sex in Burnsville
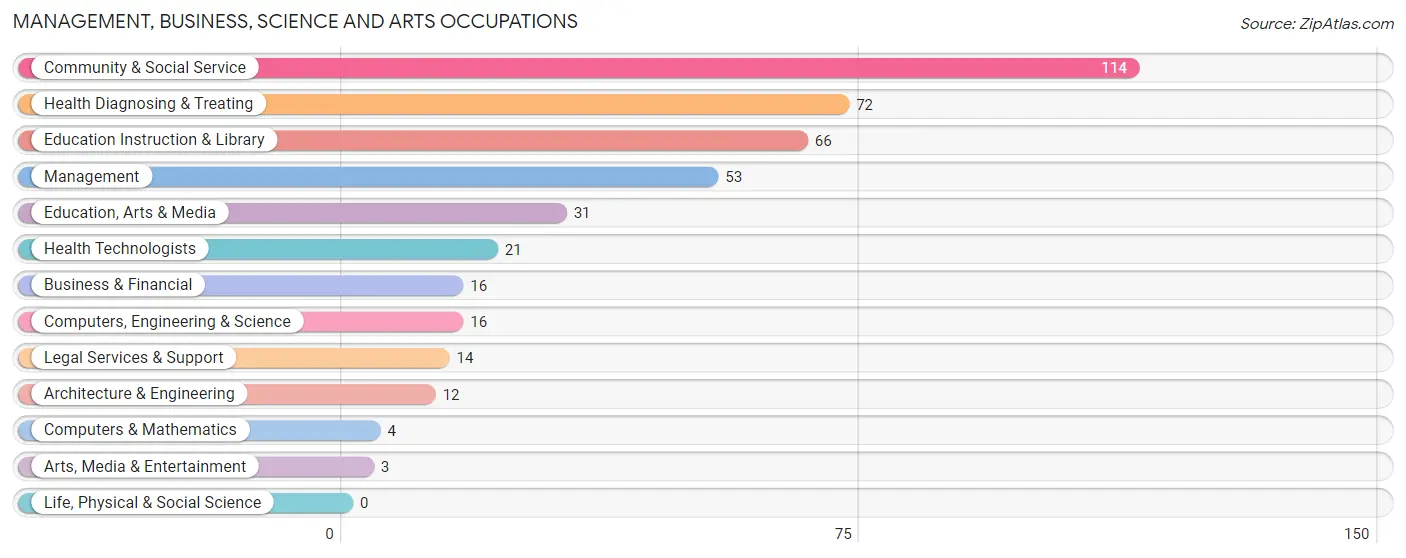
Management, Business, Science and Arts Occupations
The most common Management, Business, Science and Arts occupations in Burnsville are Community & Social Service (114 | 12.7%), Health Diagnosing & Treating (72 | 8.0%), Education Instruction & Library (66 | 7.3%), Management (53 | 5.9%), and Education, Arts & Media (31 | 3.4%).
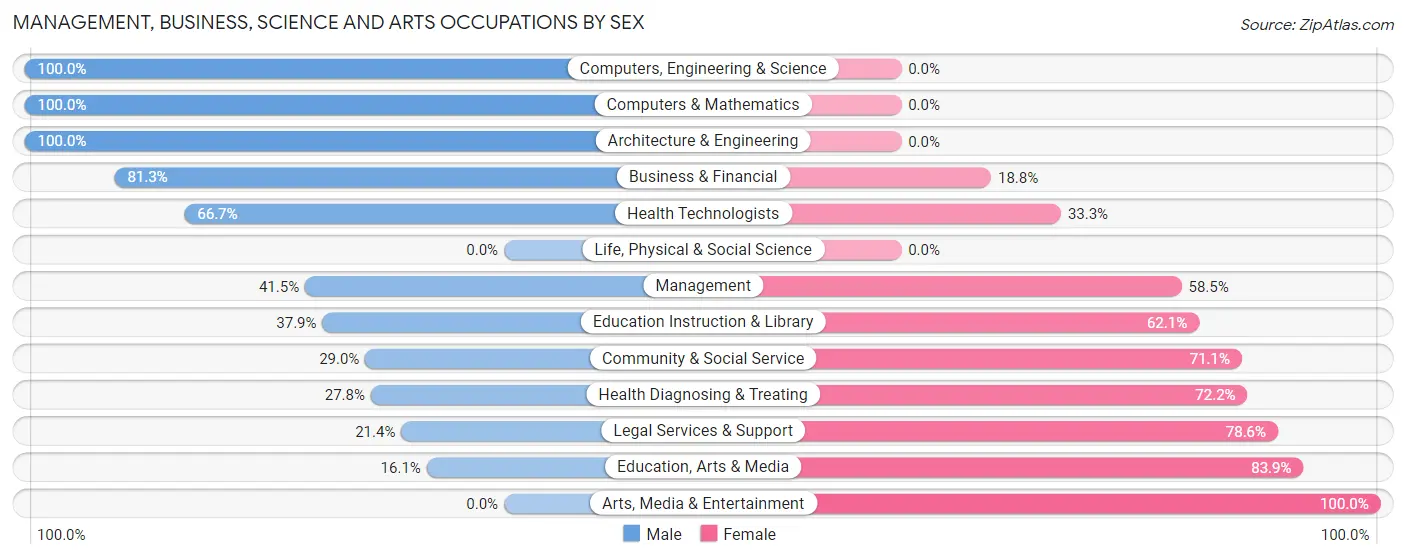
Management, Business, Science and Arts Occupations by Sex
Within the Management, Business, Science and Arts occupations in Burnsville, the most male-oriented occupations are Computers, Engineering & Science (100.0%), Computers & Mathematics (100.0%), and Architecture & Engineering (100.0%), while the most female-oriented occupations are Arts, Media & Entertainment (100.0%), Education, Arts & Media (83.9%), and Legal Services & Support (78.6%).
| Occupation | Male | Female |
| Management | 22 (41.5%) | 31 (58.5%) |
| Business & Financial | 13 (81.2%) | 3 (18.8%) |
| Computers, Engineering & Science | 16 (100.0%) | 0 (0.0%) |
| Computers & Mathematics | 4 (100.0%) | 0 (0.0%) |
| Architecture & Engineering | 12 (100.0%) | 0 (0.0%) |
| Life, Physical & Social Science | 0 (0.0%) | 0 (0.0%) |
| Community & Social Service | 33 (28.9%) | 81 (71.1%) |
| Education, Arts & Media | 5 (16.1%) | 26 (83.9%) |
| Legal Services & Support | 3 (21.4%) | 11 (78.6%) |
| Education Instruction & Library | 25 (37.9%) | 41 (62.1%) |
| Arts, Media & Entertainment | 0 (0.0%) | 3 (100.0%) |
| Health Diagnosing & Treating | 20 (27.8%) | 52 (72.2%) |
| Health Technologists | 14 (66.7%) | 7 (33.3%) |
| Total (Category) | 104 (38.4%) | 167 (61.6%) |
| Total (Overall) | 471 (52.3%) | 430 (47.7%) |
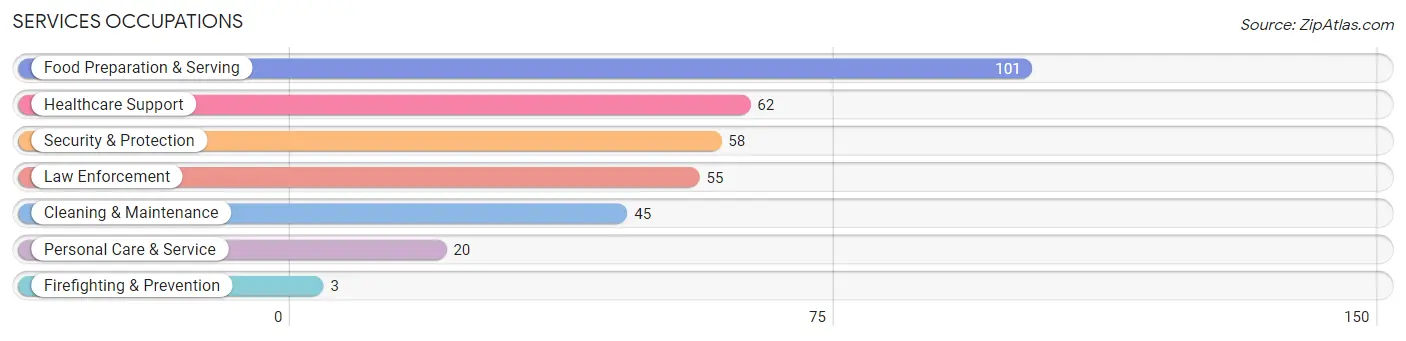
Services Occupations
The most common Services occupations in Burnsville are Food Preparation & Serving (101 | 11.2%), Healthcare Support (62 | 6.9%), Security & Protection (58 | 6.4%), Law Enforcement (55 | 6.1%), and Cleaning & Maintenance (45 | 5.0%).
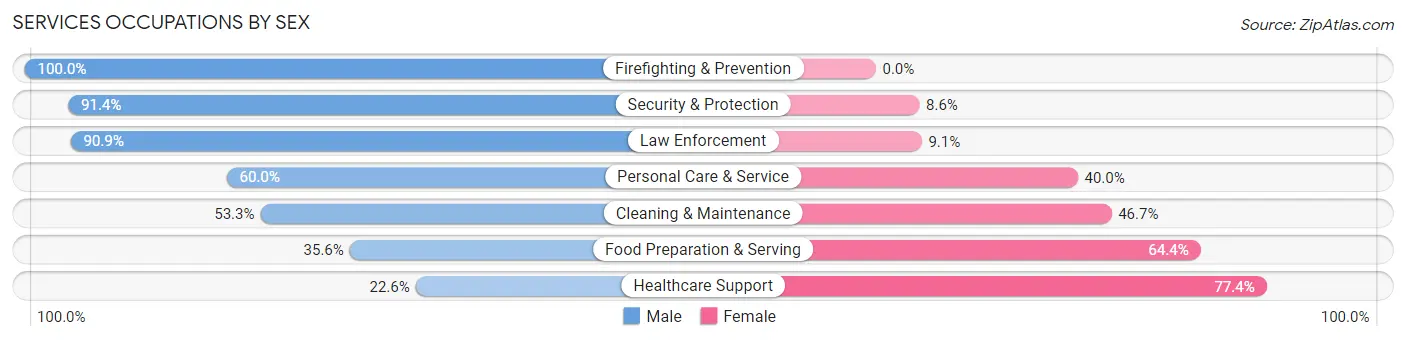
Services Occupations by Sex
Within the Services occupations in Burnsville, the most male-oriented occupations are Firefighting & Prevention (100.0%), Security & Protection (91.4%), and Law Enforcement (90.9%), while the most female-oriented occupations are Healthcare Support (77.4%), Food Preparation & Serving (64.4%), and Cleaning & Maintenance (46.7%).
| Occupation | Male | Female |
| Healthcare Support | 14 (22.6%) | 48 (77.4%) |
| Security & Protection | 53 (91.4%) | 5 (8.6%) |
| Firefighting & Prevention | 3 (100.0%) | 0 (0.0%) |
| Law Enforcement | 50 (90.9%) | 5 (9.1%) |
| Food Preparation & Serving | 36 (35.6%) | 65 (64.4%) |
| Cleaning & Maintenance | 24 (53.3%) | 21 (46.7%) |
| Personal Care & Service | 12 (60.0%) | 8 (40.0%) |
| Total (Category) | 139 (48.6%) | 147 (51.4%) |
| Total (Overall) | 471 (52.3%) | 430 (47.7%) |
Sales and Office Occupations
The most common Sales and Office occupations in Burnsville are Sales & Related (102 | 11.3%), and Office & Administration (46 | 5.1%).
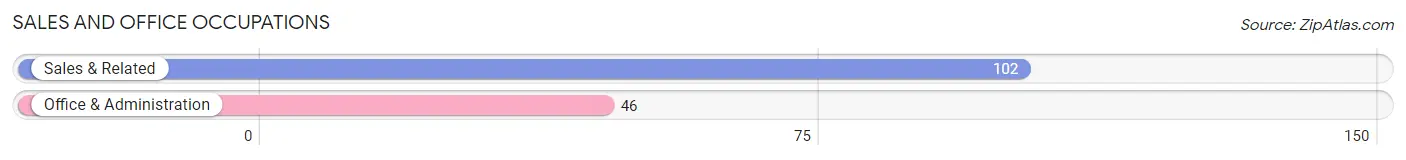
Sales and Office Occupations by Sex
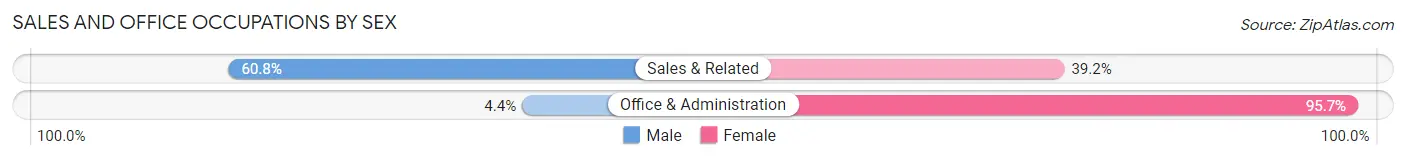
| Occupation | Male | Female |
| Sales & Related | 62 (60.8%) | 40 (39.2%) |
| Office & Administration | 2 (4.3%) | 44 (95.7%) |
| Total (Category) | 64 (43.2%) | 84 (56.8%) |
| Total (Overall) | 471 (52.3%) | 430 (47.7%) |
Natural Resources, Construction and Maintenance Occupations
The most common Natural Resources, Construction and Maintenance occupations in Burnsville are Construction & Extraction (68 | 7.5%), and Installation, Maintenance & Repair (34 | 3.8%).
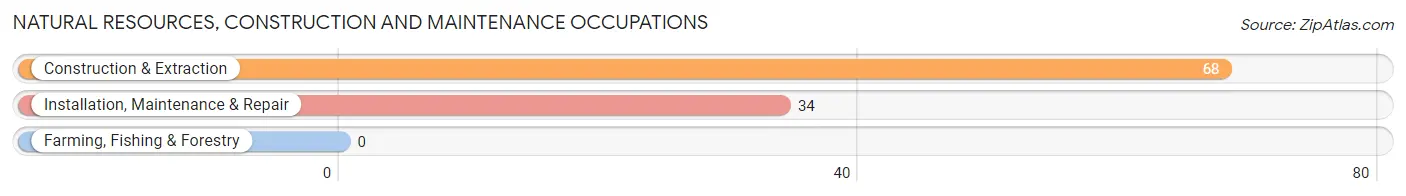
Natural Resources, Construction and Maintenance Occupations by Sex
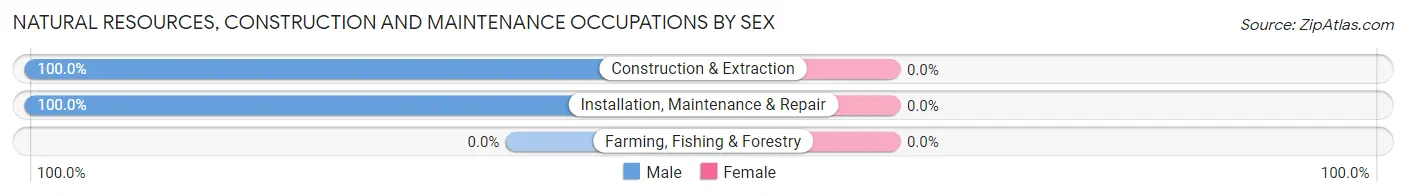
| Occupation | Male | Female |
| Farming, Fishing & Forestry | 0 (0.0%) | 0 (0.0%) |
| Construction & Extraction | 68 (100.0%) | 0 (0.0%) |
| Installation, Maintenance & Repair | 34 (100.0%) | 0 (0.0%) |
| Total (Category) | 102 (100.0%) | 0 (0.0%) |
| Total (Overall) | 471 (52.3%) | 430 (47.7%) |
Production, Transportation and Moving Occupations
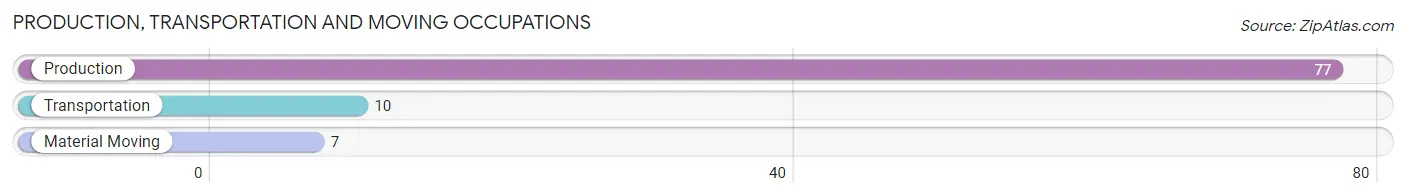
The most common Production, Transportation and Moving occupations in Burnsville are Production (77 | 8.6%), Transportation (10 | 1.1%), and Material Moving (7 | 0.8%).
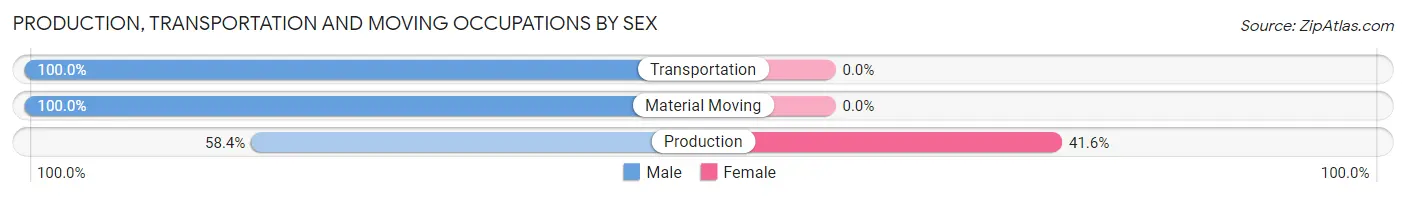
Production, Transportation and Moving Occupations by Sex
| Occupation | Male | Female |
| Production | 45 (58.4%) | 32 (41.6%) |
| Transportation | 10 (100.0%) | 0 (0.0%) |
| Material Moving | 7 (100.0%) | 0 (0.0%) |
| Total (Category) | 62 (66.0%) | 32 (34.0%) |
| Total (Overall) | 471 (52.3%) | 430 (47.7%) |
Employment Industries by Sex in Burnsville
Employment Industries in Burnsville
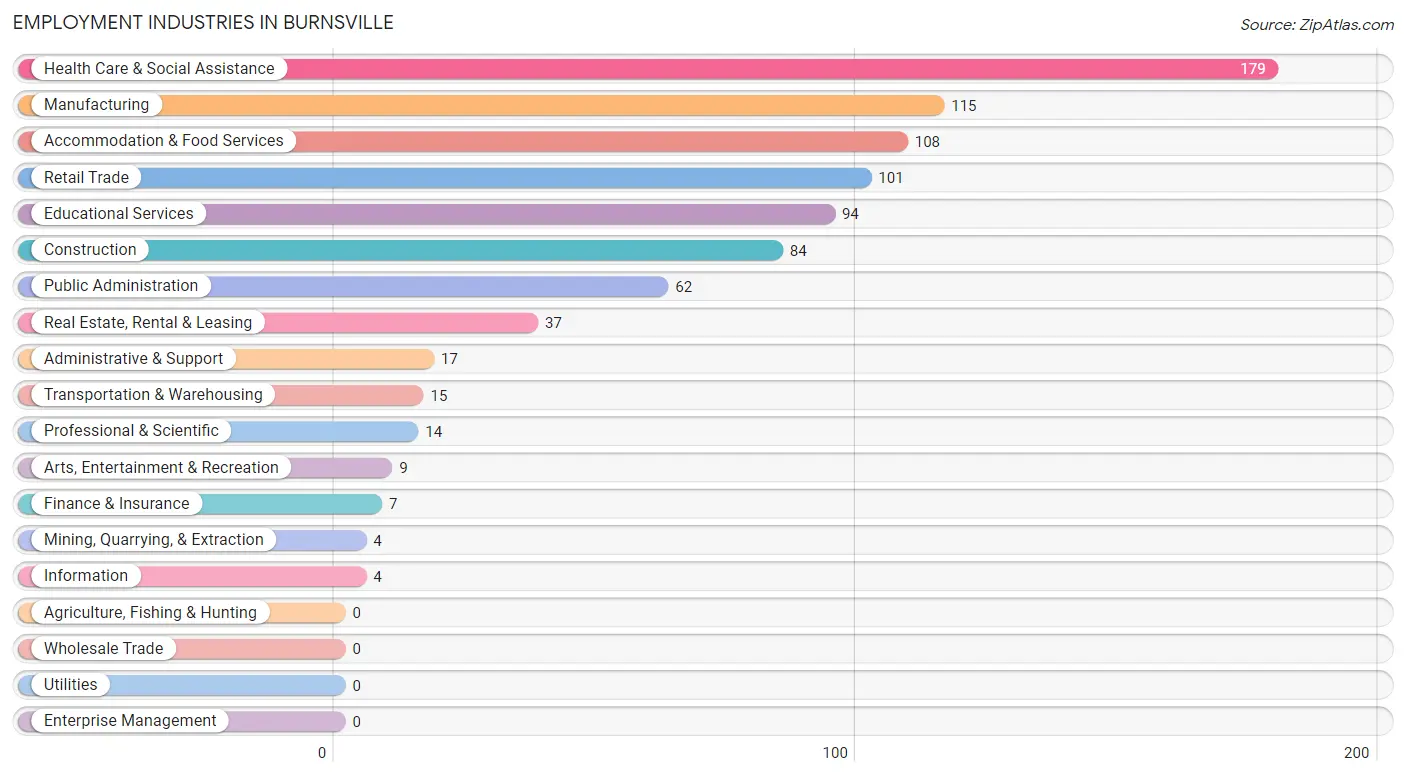
The major employment industries in Burnsville include Health Care & Social Assistance (179 | 19.9%), Manufacturing (115 | 12.8%), Accommodation & Food Services (108 | 12.0%), Retail Trade (101 | 11.2%), and Educational Services (94 | 10.4%).
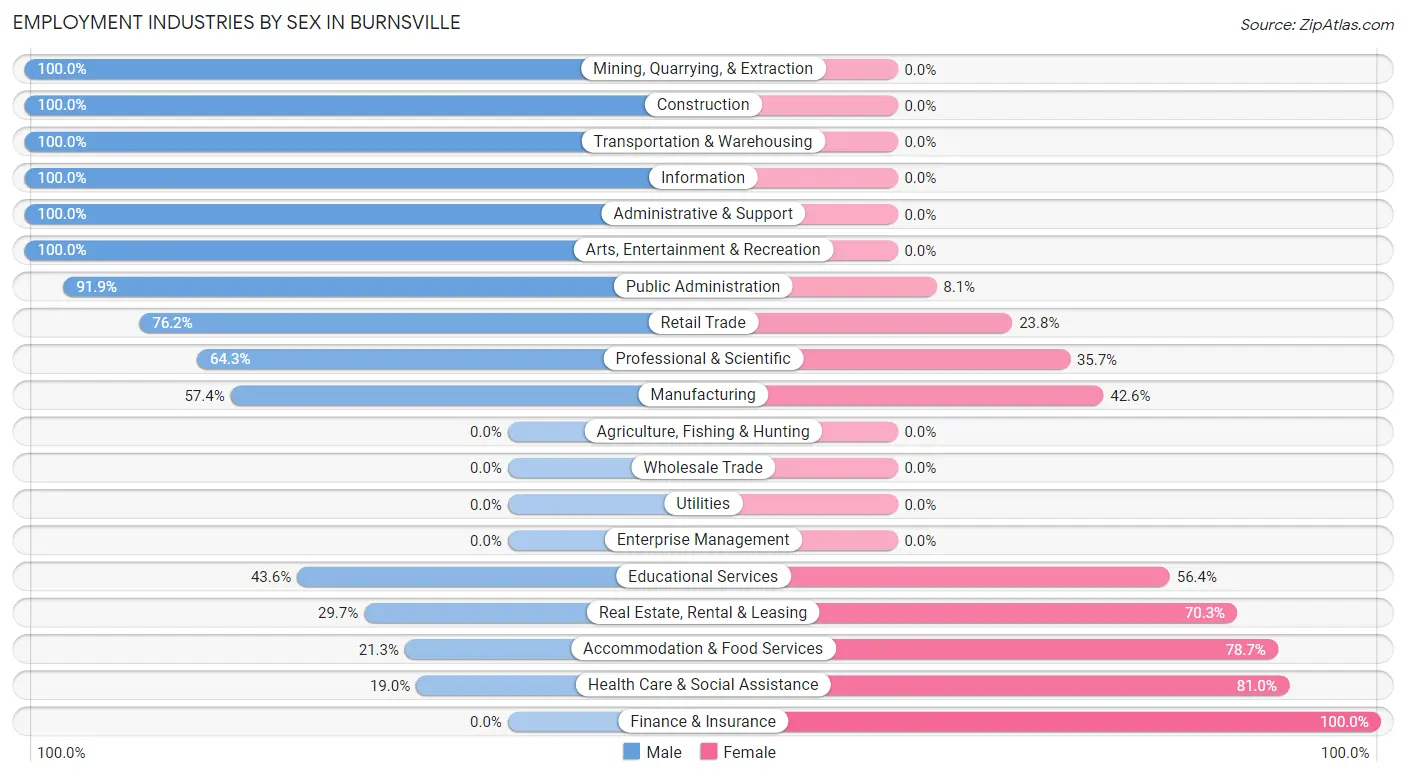
Employment Industries by Sex in Burnsville
The Burnsville industries that see more men than women are Mining, Quarrying, & Extraction (100.0%), Construction (100.0%), and Transportation & Warehousing (100.0%), whereas the industries that tend to have a higher number of women are Finance & Insurance (100.0%), Health Care & Social Assistance (81.0%), and Accommodation & Food Services (78.7%).
| Industry | Male | Female |
| Agriculture, Fishing & Hunting | 0 (0.0%) | 0 (0.0%) |
| Mining, Quarrying, & Extraction | 4 (100.0%) | 0 (0.0%) |
| Construction | 84 (100.0%) | 0 (0.0%) |
| Manufacturing | 66 (57.4%) | 49 (42.6%) |
| Wholesale Trade | 0 (0.0%) | 0 (0.0%) |
| Retail Trade | 77 (76.2%) | 24 (23.8%) |
| Transportation & Warehousing | 15 (100.0%) | 0 (0.0%) |
| Utilities | 0 (0.0%) | 0 (0.0%) |
| Information | 4 (100.0%) | 0 (0.0%) |
| Finance & Insurance | 0 (0.0%) | 7 (100.0%) |
| Real Estate, Rental & Leasing | 11 (29.7%) | 26 (70.3%) |
| Professional & Scientific | 9 (64.3%) | 5 (35.7%) |
| Enterprise Management | 0 (0.0%) | 0 (0.0%) |
| Administrative & Support | 17 (100.0%) | 0 (0.0%) |
| Educational Services | 41 (43.6%) | 53 (56.4%) |
| Health Care & Social Assistance | 34 (19.0%) | 145 (81.0%) |
| Arts, Entertainment & Recreation | 9 (100.0%) | 0 (0.0%) |
| Accommodation & Food Services | 23 (21.3%) | 85 (78.7%) |
| Public Administration | 57 (91.9%) | 5 (8.1%) |
| Total | 471 (52.3%) | 430 (47.7%) |
Education in Burnsville
School Enrollment in Burnsville
The most common levels of schooling among the 485 students in Burnsville are high school (187 | 38.6%), elementary school (113 | 23.3%), and college / undergraduate (86 | 17.7%).
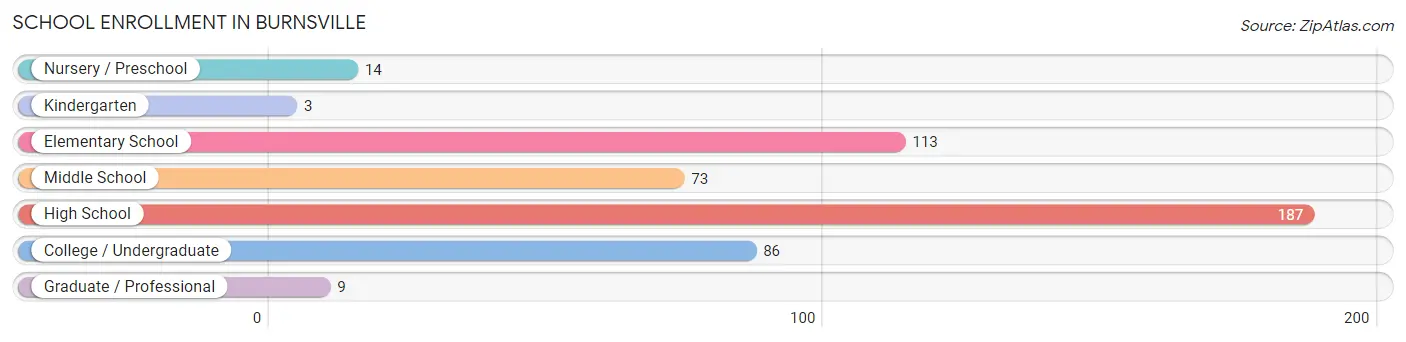
| School Level | # Students | % Students |
| Nursery / Preschool | 14 | 2.9% |
| Kindergarten | 3 | 0.6% |
| Elementary School | 113 | 23.3% |
| Middle School | 73 | 15.0% |
| High School | 187 | 38.6% |
| College / Undergraduate | 86 | 17.7% |
| Graduate / Professional | 9 | 1.9% |
| Total | 485 | 100.0% |
School Enrollment by Age by Funding Source in Burnsville
Out of a total of 485 students who are enrolled in schools in Burnsville, 28 (5.8%) attend a private institution, while the remaining 457 (94.2%) are enrolled in public schools. The age group of 20 to 24 year olds has the highest likelihood of being enrolled in private schools, with 8 (44.4% in the age bracket) enrolled. Conversely, the age group of 3 to 4 year olds has the lowest likelihood of being enrolled in a private school, with 14 (100.0% in the age bracket) attending a public institution.
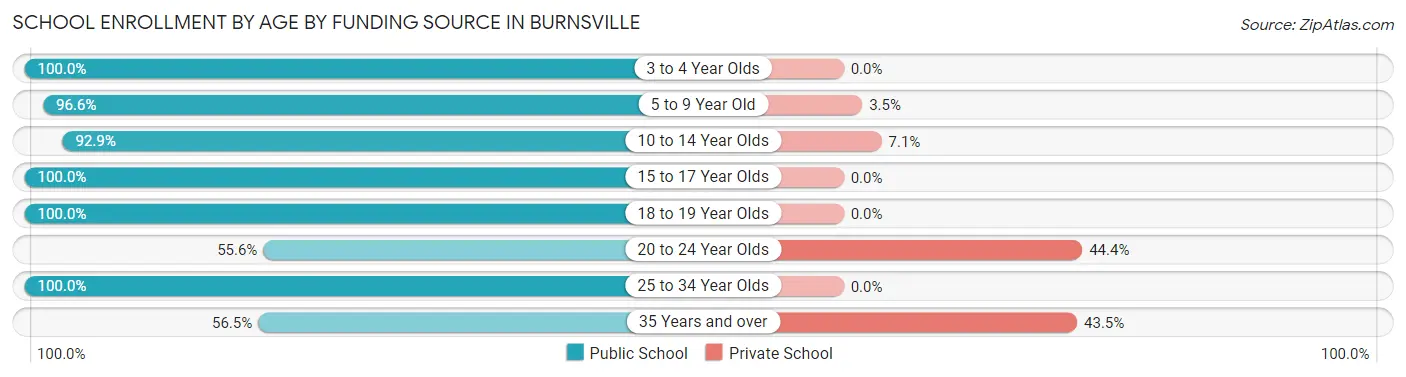
| Age Bracket | Public School | Private School |
| 3 to 4 Year Olds | 14 (100.0%) | 0 (0.0%) |
| 5 to 9 Year Old | 112 (96.6%) | 4 (3.5%) |
| 10 to 14 Year Olds | 79 (92.9%) | 6 (7.1%) |
| 15 to 17 Year Olds | 141 (100.0%) | 0 (0.0%) |
| 18 to 19 Year Olds | 34 (100.0%) | 0 (0.0%) |
| 20 to 24 Year Olds | 10 (55.6%) | 8 (44.4%) |
| 25 to 34 Year Olds | 54 (100.0%) | 0 (0.0%) |
| 35 Years and over | 13 (56.5%) | 10 (43.5%) |
| Total | 457 (94.2%) | 28 (5.8%) |
Educational Attainment by Field of Study in Burnsville
Education (88 | 22.2%), liberal arts & history (41 | 10.3%), science & technology (38 | 9.6%), arts & humanities (38 | 9.6%), and psychology (37 | 9.3%) are the most common fields of study among 396 individuals in Burnsville who have obtained a bachelor's degree or higher.
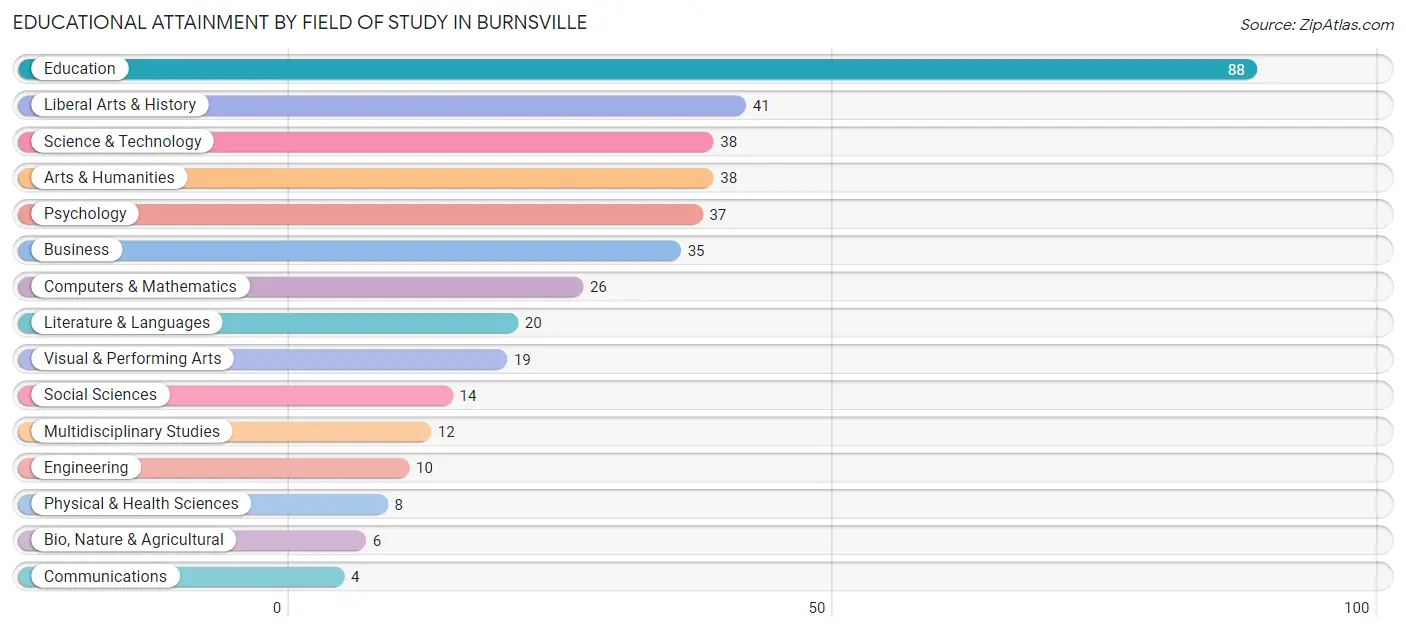
| Field of Study | # Graduates | % Graduates |
| Computers & Mathematics | 26 | 6.6% |
| Bio, Nature & Agricultural | 6 | 1.5% |
| Physical & Health Sciences | 8 | 2.0% |
| Psychology | 37 | 9.3% |
| Social Sciences | 14 | 3.5% |
| Engineering | 10 | 2.5% |
| Multidisciplinary Studies | 12 | 3.0% |
| Science & Technology | 38 | 9.6% |
| Business | 35 | 8.8% |
| Education | 88 | 22.2% |
| Literature & Languages | 20 | 5.1% |
| Liberal Arts & History | 41 | 10.3% |
| Visual & Performing Arts | 19 | 4.8% |
| Communications | 4 | 1.0% |
| Arts & Humanities | 38 | 9.6% |
| Total | 396 | 100.0% |
Transportation & Commute in Burnsville
Vehicle Availability by Sex in Burnsville
The most prevalent vehicle ownership categories in Burnsville are males with 2 vehicles (193, accounting for 42.6%) and females with 2 vehicles (216, making up 46.1%).
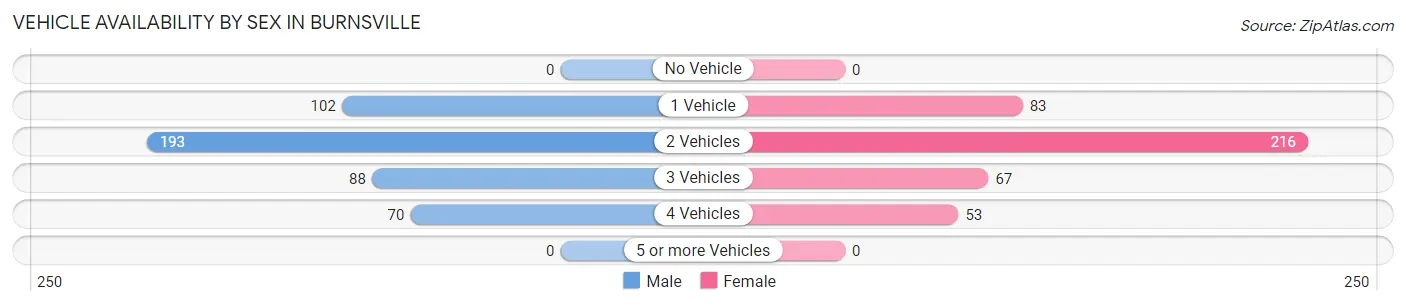
| Vehicles Available | Male | Female |
| No Vehicle | 0 (0.0%) | 0 (0.0%) |
| 1 Vehicle | 102 (22.5%) | 83 (19.8%) |
| 2 Vehicles | 193 (42.6%) | 216 (51.5%) |
| 3 Vehicles | 88 (19.4%) | 67 (16.0%) |
| 4 Vehicles | 70 (15.4%) | 53 (12.7%) |
| 5 or more Vehicles | 0 (0.0%) | 0 (0.0%) |
| Total | 453 (100.0%) | 419 (100.0%) |
Commute Time in Burnsville
The most frequently occuring commute durations in Burnsville are 5 to 9 minutes (167 commuters, 20.6%), 10 to 14 minutes (123 commuters, 15.2%), and 20 to 24 minutes (116 commuters, 14.3%).
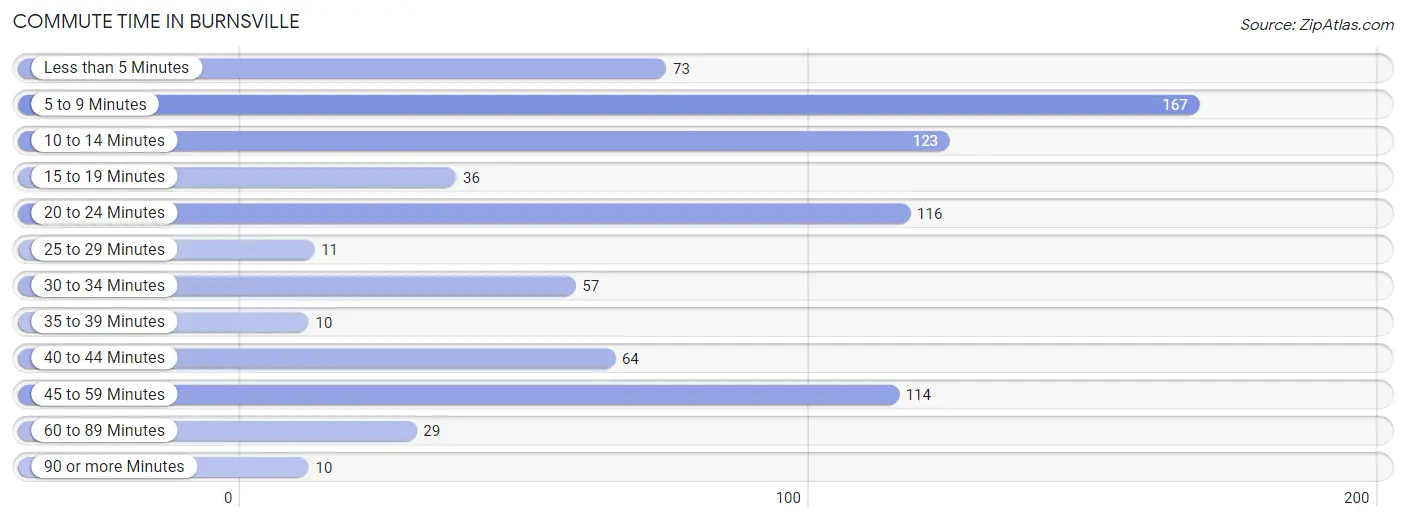
| Commute Time | # Commuters | % Commuters |
| Less than 5 Minutes | 73 | 9.0% |
| 5 to 9 Minutes | 167 | 20.6% |
| 10 to 14 Minutes | 123 | 15.2% |
| 15 to 19 Minutes | 36 | 4.4% |
| 20 to 24 Minutes | 116 | 14.3% |
| 25 to 29 Minutes | 11 | 1.4% |
| 30 to 34 Minutes | 57 | 7.0% |
| 35 to 39 Minutes | 10 | 1.2% |
| 40 to 44 Minutes | 64 | 7.9% |
| 45 to 59 Minutes | 114 | 14.1% |
| 60 to 89 Minutes | 29 | 3.6% |
| 90 or more Minutes | 10 | 1.2% |
Commute Time by Sex in Burnsville
The most common commute times in Burnsville are 5 to 9 minutes (97 commuters, 22.8%) for males and 10 to 14 minutes (73 commuters, 19.0%) for females.
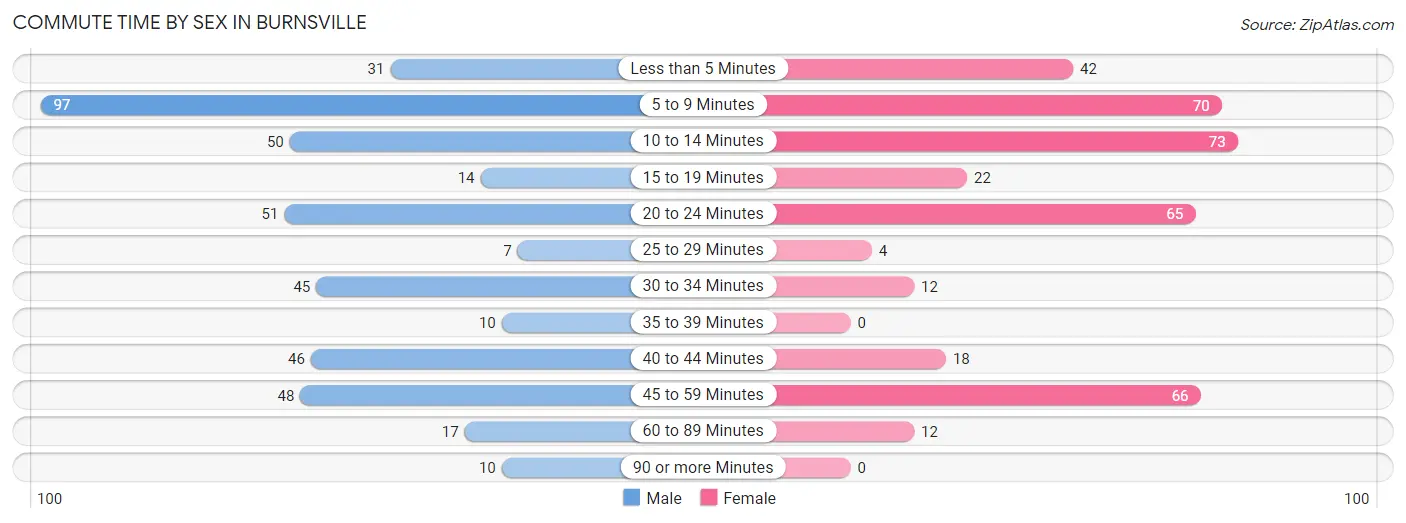
| Commute Time | Male | Female |
| Less than 5 Minutes | 31 (7.3%) | 42 (10.9%) |
| 5 to 9 Minutes | 97 (22.8%) | 70 (18.2%) |
| 10 to 14 Minutes | 50 (11.7%) | 73 (19.0%) |
| 15 to 19 Minutes | 14 (3.3%) | 22 (5.7%) |
| 20 to 24 Minutes | 51 (12.0%) | 65 (16.9%) |
| 25 to 29 Minutes | 7 (1.6%) | 4 (1.0%) |
| 30 to 34 Minutes | 45 (10.6%) | 12 (3.1%) |
| 35 to 39 Minutes | 10 (2.4%) | 0 (0.0%) |
| 40 to 44 Minutes | 46 (10.8%) | 18 (4.7%) |
| 45 to 59 Minutes | 48 (11.3%) | 66 (17.2%) |
| 60 to 89 Minutes | 17 (4.0%) | 12 (3.1%) |
| 90 or more Minutes | 10 (2.4%) | 0 (0.0%) |
Time of Departure to Work by Sex in Burnsville
The most frequent times of departure to work in Burnsville are 8:00 AM to 8:29 AM (80, 18.8%) for males and 6:00 AM to 6:29 AM (83, 21.6%) for females.
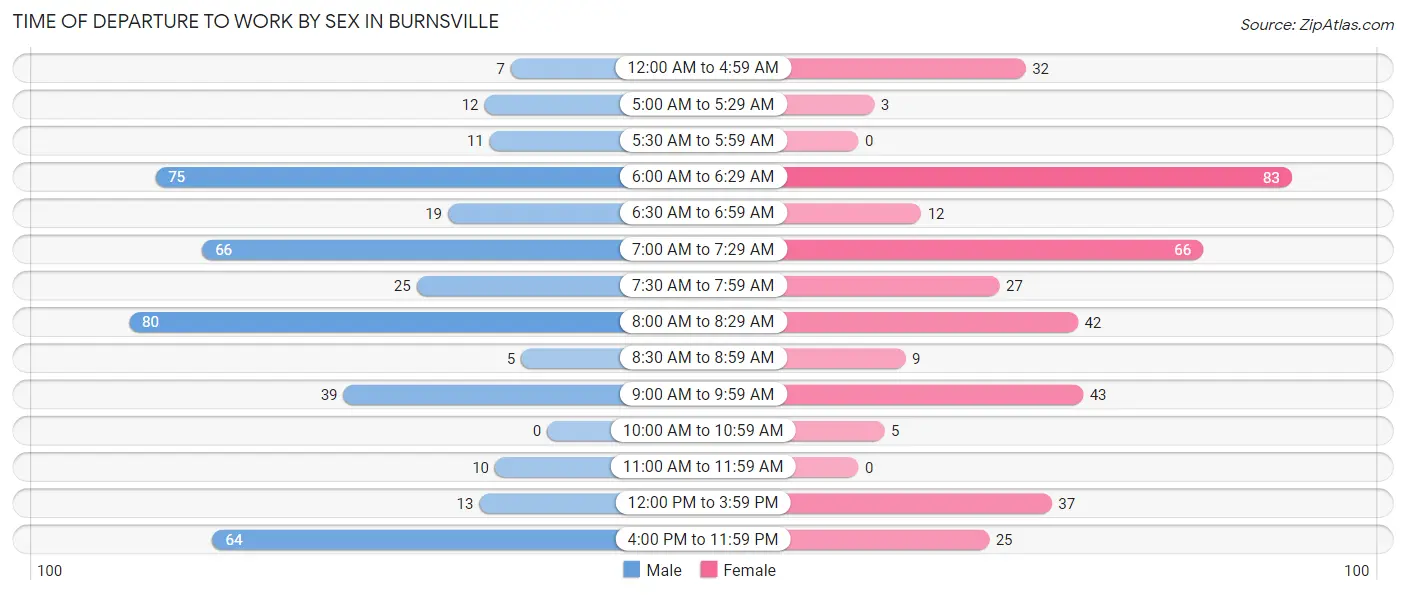
| Time of Departure | Male | Female |
| 12:00 AM to 4:59 AM | 7 (1.6%) | 32 (8.3%) |
| 5:00 AM to 5:29 AM | 12 (2.8%) | 3 (0.8%) |
| 5:30 AM to 5:59 AM | 11 (2.6%) | 0 (0.0%) |
| 6:00 AM to 6:29 AM | 75 (17.6%) | 83 (21.6%) |
| 6:30 AM to 6:59 AM | 19 (4.5%) | 12 (3.1%) |
| 7:00 AM to 7:29 AM | 66 (15.5%) | 66 (17.2%) |
| 7:30 AM to 7:59 AM | 25 (5.9%) | 27 (7.0%) |
| 8:00 AM to 8:29 AM | 80 (18.8%) | 42 (10.9%) |
| 8:30 AM to 8:59 AM | 5 (1.2%) | 9 (2.3%) |
| 9:00 AM to 9:59 AM | 39 (9.1%) | 43 (11.2%) |
| 10:00 AM to 10:59 AM | 0 (0.0%) | 5 (1.3%) |
| 11:00 AM to 11:59 AM | 10 (2.4%) | 0 (0.0%) |
| 12:00 PM to 3:59 PM | 13 (3.0%) | 37 (9.6%) |
| 4:00 PM to 11:59 PM | 64 (15.0%) | 25 (6.5%) |
| Total | 426 (100.0%) | 384 (100.0%) |
Housing Occupancy in Burnsville
Occupancy by Ownership in Burnsville
Of the total 972 dwellings in Burnsville, owner-occupied units account for 497 (51.1%), while renter-occupied units make up 475 (48.9%).
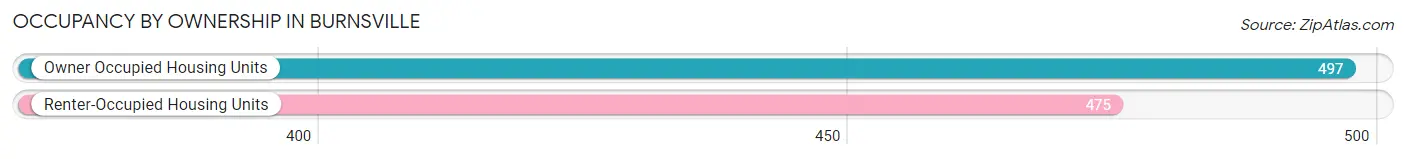
| Occupancy | # Housing Units | % Housing Units |
| Owner Occupied Housing Units | 497 | 51.1% |
| Renter-Occupied Housing Units | 475 | 48.9% |
| Total Occupied Housing Units | 972 | 100.0% |
Occupancy by Household Size in Burnsville
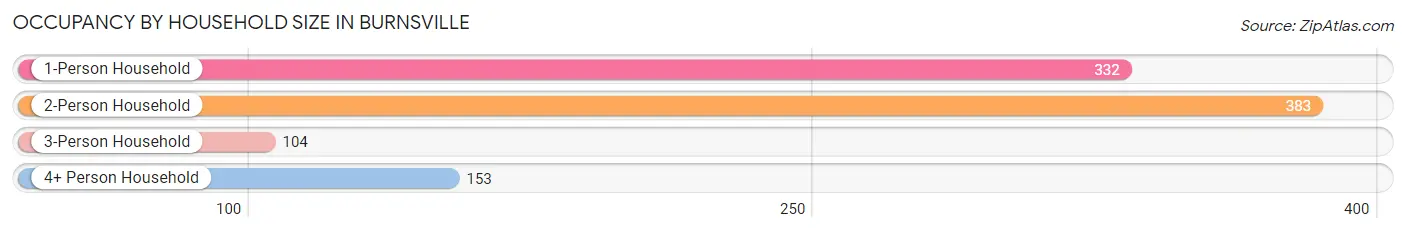
| Household Size | # Housing Units | % Housing Units |
| 1-Person Household | 332 | 34.2% |
| 2-Person Household | 383 | 39.4% |
| 3-Person Household | 104 | 10.7% |
| 4+ Person Household | 153 | 15.7% |
| Total Housing Units | 972 | 100.0% |
Occupancy by Ownership by Household Size in Burnsville
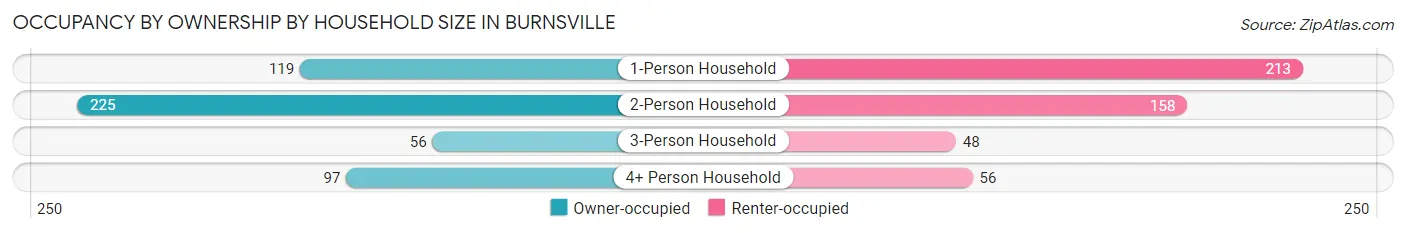
| Household Size | Owner-occupied | Renter-occupied |
| 1-Person Household | 119 (35.8%) | 213 (64.2%) |
| 2-Person Household | 225 (58.8%) | 158 (41.2%) |
| 3-Person Household | 56 (53.8%) | 48 (46.2%) |
| 4+ Person Household | 97 (63.4%) | 56 (36.6%) |
| Total Housing Units | 497 (51.1%) | 475 (48.9%) |
Occupancy by Educational Attainment in Burnsville
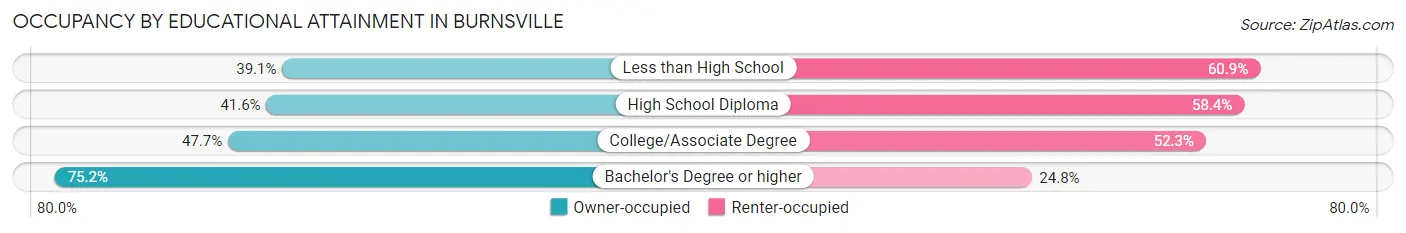
| Household Size | Owner-occupied | Renter-occupied |
| Less than High School | 36 (39.1%) | 56 (60.9%) |
| High School Diploma | 152 (41.6%) | 213 (58.4%) |
| College/Associate Degree | 136 (47.7%) | 149 (52.3%) |
| Bachelor's Degree or higher | 173 (75.2%) | 57 (24.8%) |
Occupancy by Age of Householder in Burnsville
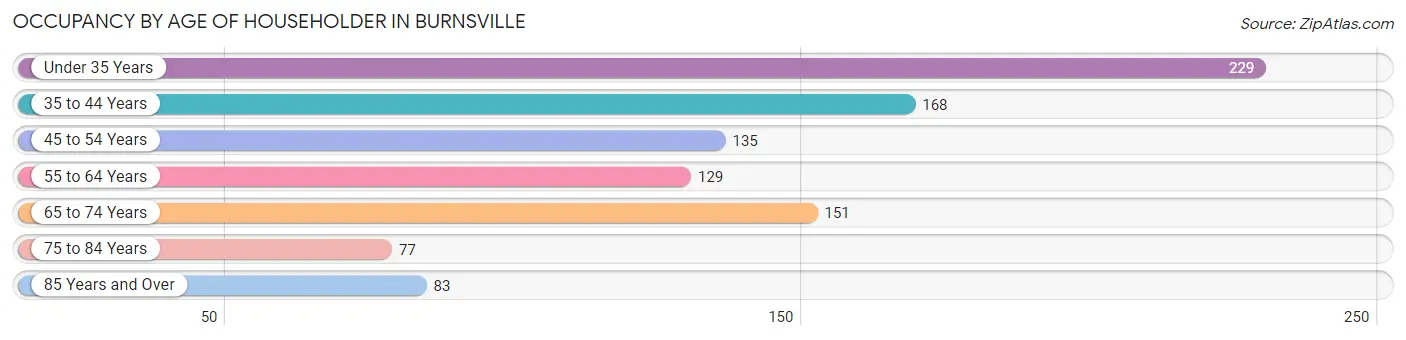
| Age Bracket | # Households | % Households |
| Under 35 Years | 229 | 23.6% |
| 35 to 44 Years | 168 | 17.3% |
| 45 to 54 Years | 135 | 13.9% |
| 55 to 64 Years | 129 | 13.3% |
| 65 to 74 Years | 151 | 15.5% |
| 75 to 84 Years | 77 | 7.9% |
| 85 Years and Over | 83 | 8.5% |
| Total | 972 | 100.0% |
Housing Finances in Burnsville
Median Income by Occupancy in Burnsville
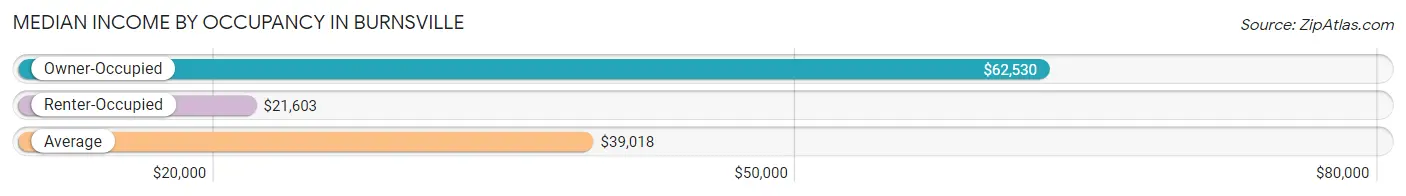
| Occupancy Type | # Households | Median Income |
| Owner-Occupied | 497 (51.1%) | $62,530 |
| Renter-Occupied | 475 (48.9%) | $21,603 |
| Average | 972 (100.0%) | $39,018 |
Occupancy by Householder Income Bracket in Burnsville
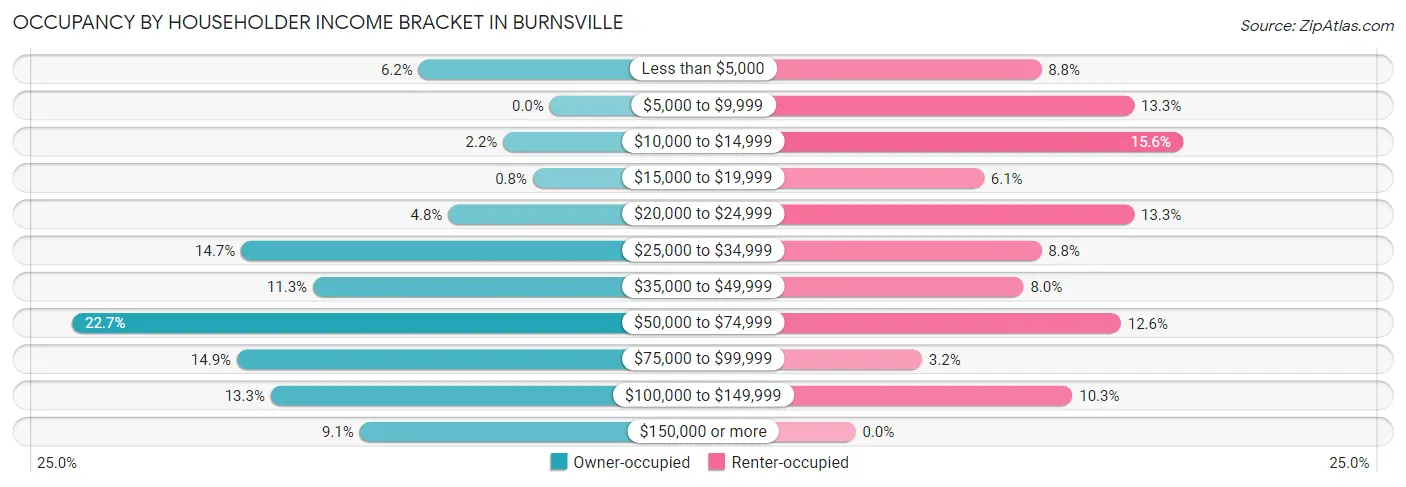
| Income Bracket | Owner-occupied | Renter-occupied |
| Less than $5,000 | 31 (6.2%) | 42 (8.8%) |
| $5,000 to $9,999 | 0 (0.0%) | 63 (13.3%) |
| $10,000 to $14,999 | 11 (2.2%) | 74 (15.6%) |
| $15,000 to $19,999 | 4 (0.8%) | 29 (6.1%) |
| $20,000 to $24,999 | 24 (4.8%) | 63 (13.3%) |
| $25,000 to $34,999 | 73 (14.7%) | 42 (8.8%) |
| $35,000 to $49,999 | 56 (11.3%) | 38 (8.0%) |
| $50,000 to $74,999 | 113 (22.7%) | 60 (12.6%) |
| $75,000 to $99,999 | 74 (14.9%) | 15 (3.2%) |
| $100,000 to $149,999 | 66 (13.3%) | 49 (10.3%) |
| $150,000 or more | 45 (9.0%) | 0 (0.0%) |
| Total | 497 (100.0%) | 475 (100.0%) |
Monthly Housing Cost Tiers in Burnsville
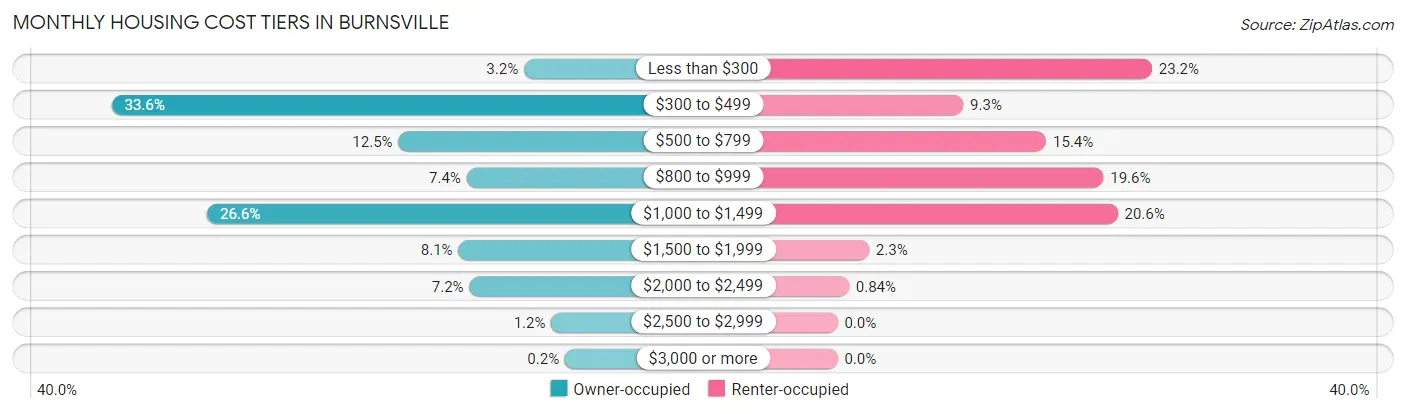
| Monthly Cost | Owner-occupied | Renter-occupied |
| Less than $300 | 16 (3.2%) | 110 (23.2%) |
| $300 to $499 | 167 (33.6%) | 44 (9.3%) |
| $500 to $799 | 62 (12.5%) | 73 (15.4%) |
| $800 to $999 | 37 (7.4%) | 93 (19.6%) |
| $1,000 to $1,499 | 132 (26.6%) | 98 (20.6%) |
| $1,500 to $1,999 | 40 (8.1%) | 11 (2.3%) |
| $2,000 to $2,499 | 36 (7.2%) | 4 (0.8%) |
| $2,500 to $2,999 | 6 (1.2%) | 0 (0.0%) |
| $3,000 or more | 1 (0.2%) | 0 (0.0%) |
| Total | 497 (100.0%) | 475 (100.0%) |
Physical Housing Characteristics in Burnsville
Housing Structures in Burnsville
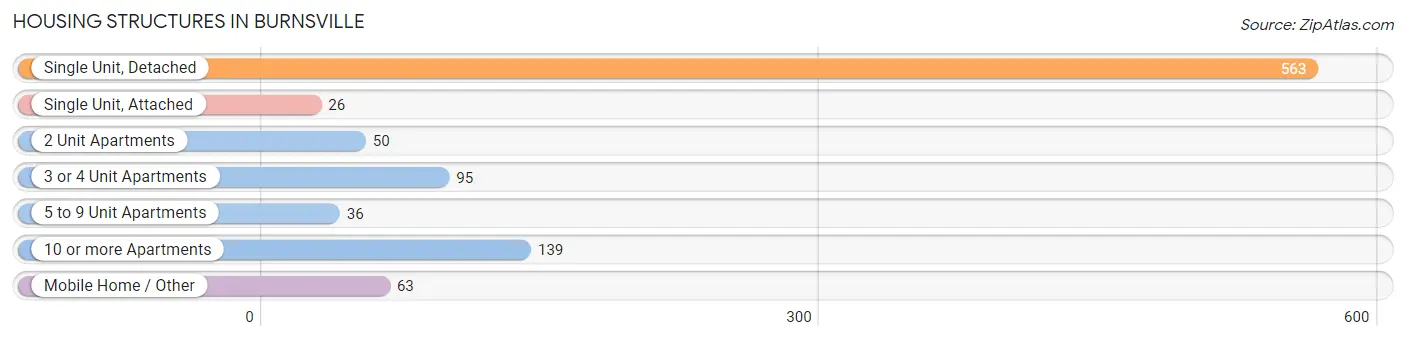
| Structure Type | # Housing Units | % Housing Units |
| Single Unit, Detached | 563 | 57.9% |
| Single Unit, Attached | 26 | 2.7% |
| 2 Unit Apartments | 50 | 5.1% |
| 3 or 4 Unit Apartments | 95 | 9.8% |
| 5 to 9 Unit Apartments | 36 | 3.7% |
| 10 or more Apartments | 139 | 14.3% |
| Mobile Home / Other | 63 | 6.5% |
| Total | 972 | 100.0% |
Housing Structures by Occupancy in Burnsville
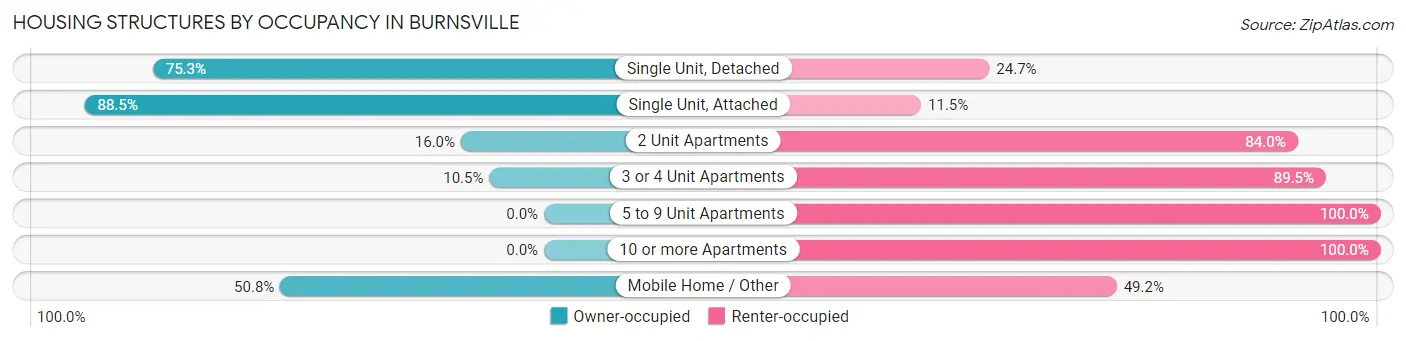
| Structure Type | Owner-occupied | Renter-occupied |
| Single Unit, Detached | 424 (75.3%) | 139 (24.7%) |
| Single Unit, Attached | 23 (88.5%) | 3 (11.5%) |
| 2 Unit Apartments | 8 (16.0%) | 42 (84.0%) |
| 3 or 4 Unit Apartments | 10 (10.5%) | 85 (89.5%) |
| 5 to 9 Unit Apartments | 0 (0.0%) | 36 (100.0%) |
| 10 or more Apartments | 0 (0.0%) | 139 (100.0%) |
| Mobile Home / Other | 32 (50.8%) | 31 (49.2%) |
| Total | 497 (51.1%) | 475 (48.9%) |
Housing Structures by Number of Rooms in Burnsville
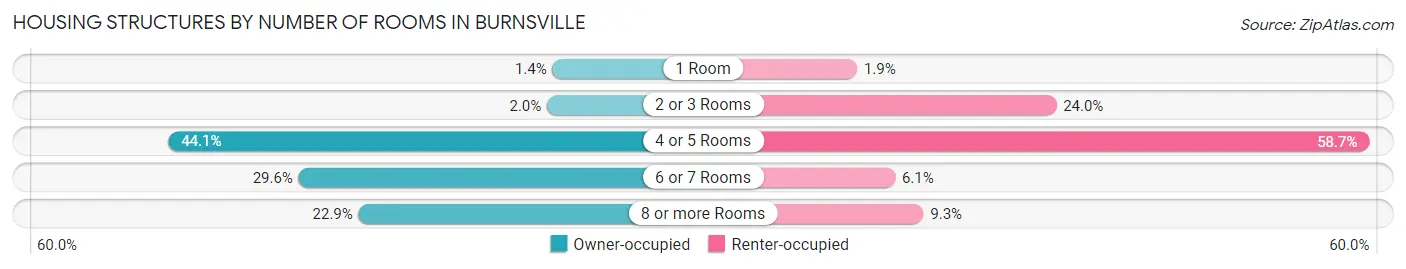
| Number of Rooms | Owner-occupied | Renter-occupied |
| 1 Room | 7 (1.4%) | 9 (1.9%) |
| 2 or 3 Rooms | 10 (2.0%) | 114 (24.0%) |
| 4 or 5 Rooms | 219 (44.1%) | 279 (58.7%) |
| 6 or 7 Rooms | 147 (29.6%) | 29 (6.1%) |
| 8 or more Rooms | 114 (22.9%) | 44 (9.3%) |
| Total | 497 (100.0%) | 475 (100.0%) |
Housing Structure by Heating Type in Burnsville
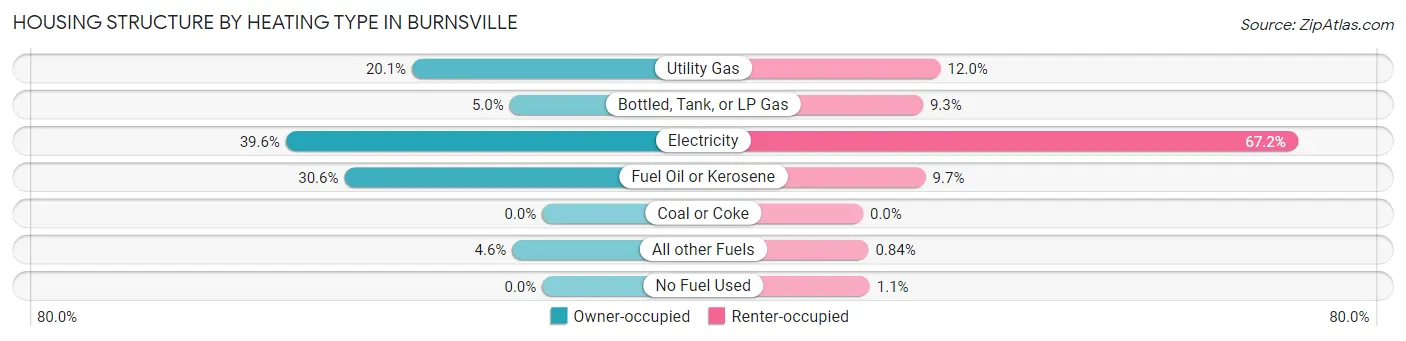
| Heating Type | Owner-occupied | Renter-occupied |
| Utility Gas | 100 (20.1%) | 57 (12.0%) |
| Bottled, Tank, or LP Gas | 25 (5.0%) | 44 (9.3%) |
| Electricity | 197 (39.6%) | 319 (67.2%) |
| Fuel Oil or Kerosene | 152 (30.6%) | 46 (9.7%) |
| Coal or Coke | 0 (0.0%) | 0 (0.0%) |
| All other Fuels | 23 (4.6%) | 4 (0.8%) |
| No Fuel Used | 0 (0.0%) | 5 (1.1%) |
| Total | 497 (100.0%) | 475 (100.0%) |
Household Vehicle Usage in Burnsville
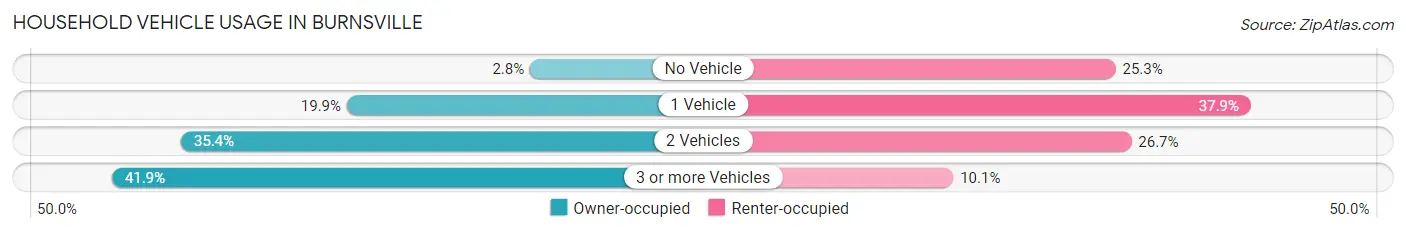
| Vehicles per Household | Owner-occupied | Renter-occupied |
| No Vehicle | 14 (2.8%) | 120 (25.3%) |
| 1 Vehicle | 99 (19.9%) | 180 (37.9%) |
| 2 Vehicles | 176 (35.4%) | 127 (26.7%) |
| 3 or more Vehicles | 208 (41.8%) | 48 (10.1%) |
| Total | 497 (100.0%) | 475 (100.0%) |
Real Estate & Mortgages in Burnsville
Real Estate and Mortgage Overview in Burnsville
| Characteristic | Without Mortgage | With Mortgage |
| Housing Units | 231 | 266 |
| Median Property Value | $214,500 | $201,700 |
| Median Household Income | $48,594 | $38 |
| Monthly Housing Costs | $372 | $1 |
| Real Estate Taxes | $1,797 | $11 |
Property Value by Mortgage Status in Burnsville
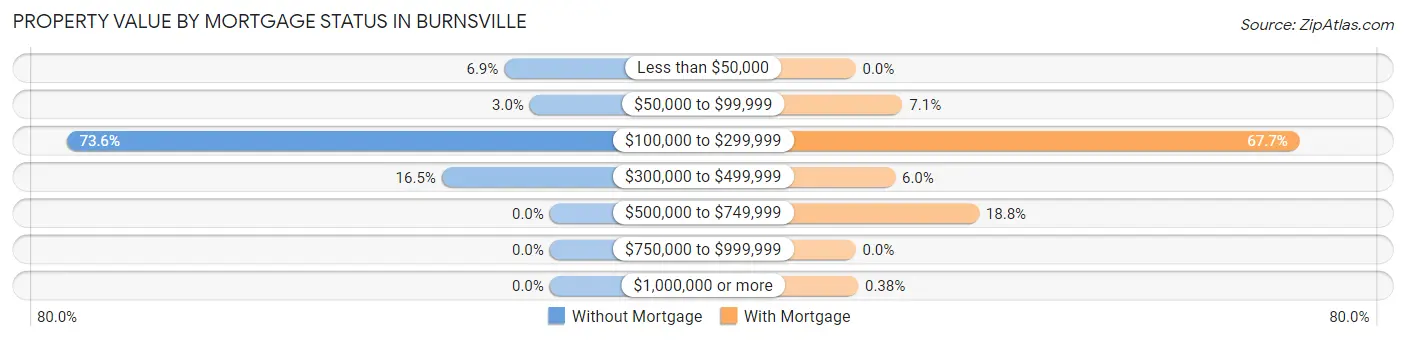
| Property Value | Without Mortgage | With Mortgage |
| Less than $50,000 | 16 (6.9%) | 0 (0.0%) |
| $50,000 to $99,999 | 7 (3.0%) | 19 (7.1%) |
| $100,000 to $299,999 | 170 (73.6%) | 180 (67.7%) |
| $300,000 to $499,999 | 38 (16.5%) | 16 (6.0%) |
| $500,000 to $749,999 | 0 (0.0%) | 50 (18.8%) |
| $750,000 to $999,999 | 0 (0.0%) | 0 (0.0%) |
| $1,000,000 or more | 0 (0.0%) | 1 (0.4%) |
| Total | 231 (100.0%) | 266 (100.0%) |
Household Income by Mortgage Status in Burnsville
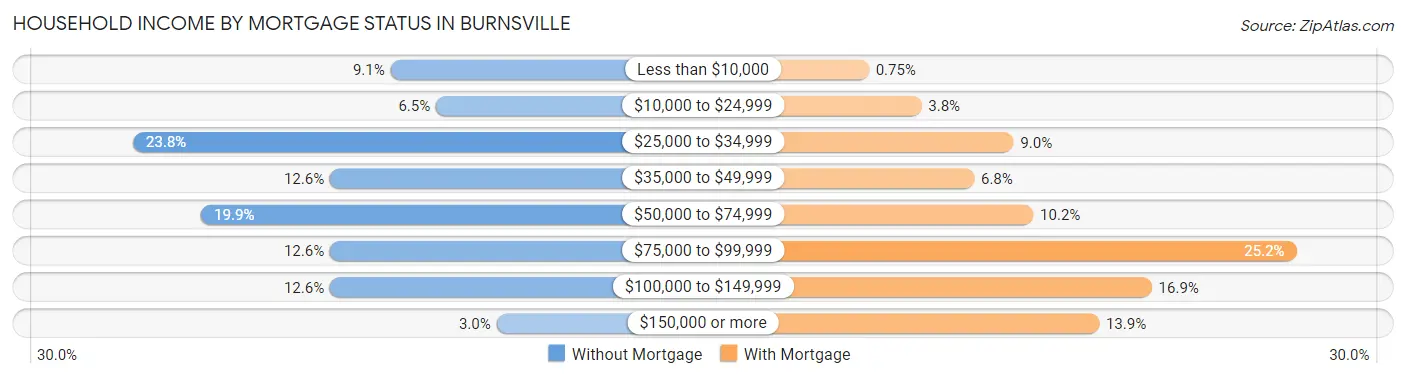
| Household Income | Without Mortgage | With Mortgage |
| Less than $10,000 | 21 (9.1%) | 2 (0.7%) |
| $10,000 to $24,999 | 15 (6.5%) | 10 (3.8%) |
| $25,000 to $34,999 | 55 (23.8%) | 24 (9.0%) |
| $35,000 to $49,999 | 29 (12.6%) | 18 (6.8%) |
| $50,000 to $74,999 | 46 (19.9%) | 27 (10.2%) |
| $75,000 to $99,999 | 29 (12.6%) | 67 (25.2%) |
| $100,000 to $149,999 | 29 (12.6%) | 45 (16.9%) |
| $150,000 or more | 7 (3.0%) | 37 (13.9%) |
| Total | 231 (100.0%) | 266 (100.0%) |
Property Value to Household Income Ratio in Burnsville
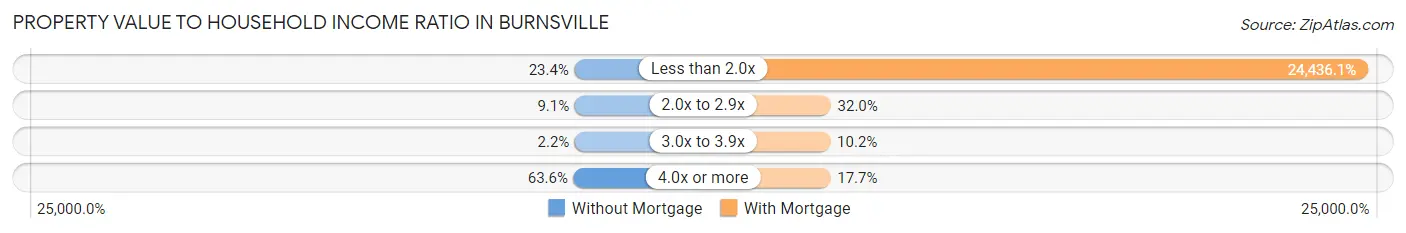
| Value-to-Income Ratio | Without Mortgage | With Mortgage |
| Less than 2.0x | 54 (23.4%) | 65,000 (24,436.1%) |
| 2.0x to 2.9x | 21 (9.1%) | 85 (32.0%) |
| 3.0x to 3.9x | 5 (2.2%) | 27 (10.2%) |
| 4.0x or more | 147 (63.6%) | 47 (17.7%) |
| Total | 231 (100.0%) | 266 (100.0%) |
Real Estate Taxes by Mortgage Status in Burnsville
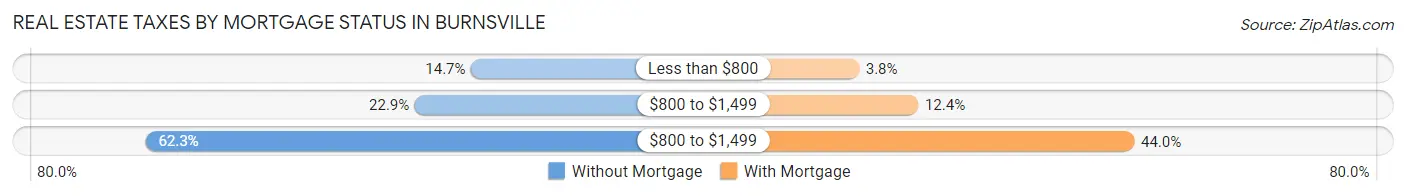
| Property Taxes | Without Mortgage | With Mortgage |
| Less than $800 | 34 (14.7%) | 10 (3.8%) |
| $800 to $1,499 | 53 (22.9%) | 33 (12.4%) |
| $800 to $1,499 | 144 (62.3%) | 117 (44.0%) |
| Total | 231 (100.0%) | 266 (100.0%) |
Health & Disability in Burnsville
Health Insurance Coverage by Age in Burnsville
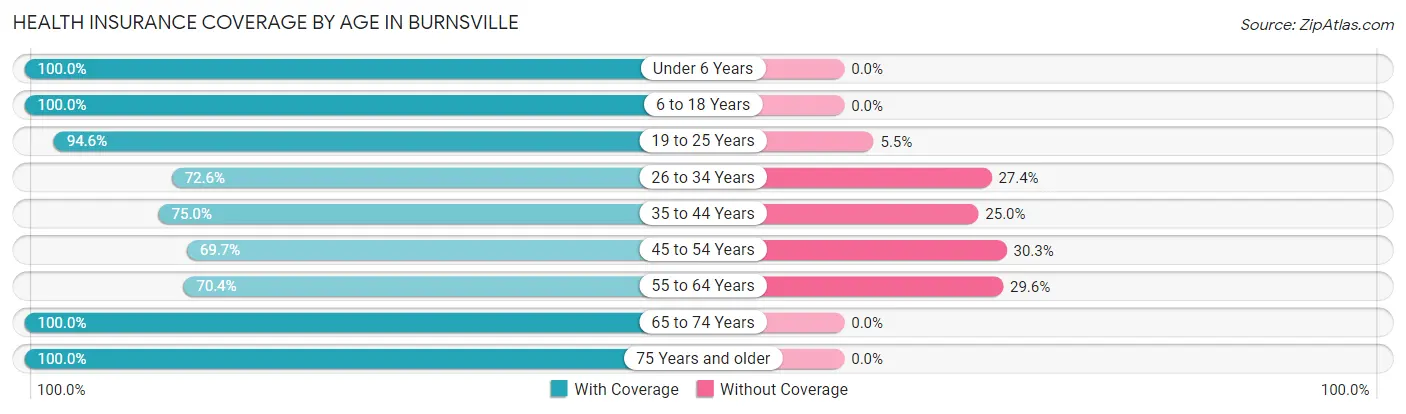
| Age Bracket | With Coverage | Without Coverage |
| Under 6 Years | 249 (100.0%) | 0 (0.0%) |
| 6 to 18 Years | 410 (100.0%) | 0 (0.0%) |
| 19 to 25 Years | 52 (94.6%) | 3 (5.4%) |
| 26 to 34 Years | 283 (72.6%) | 107 (27.4%) |
| 35 to 44 Years | 177 (75.0%) | 59 (25.0%) |
| 45 to 54 Years | 159 (69.7%) | 69 (30.3%) |
| 55 to 64 Years | 145 (70.4%) | 61 (29.6%) |
| 65 to 74 Years | 214 (100.0%) | 0 (0.0%) |
| 75 Years and older | 264 (100.0%) | 0 (0.0%) |
| Total | 1,953 (86.7%) | 299 (13.3%) |
Health Insurance Coverage by Citizenship Status in Burnsville
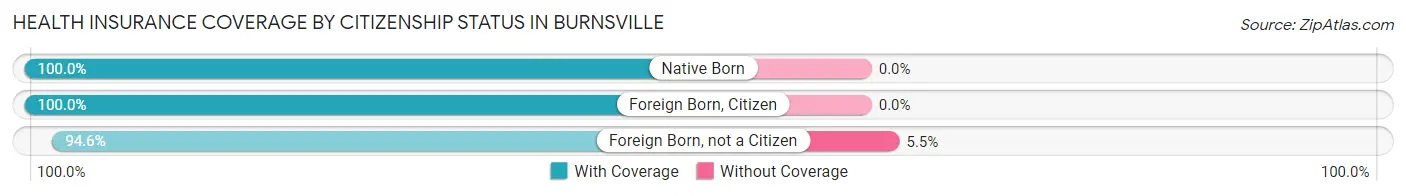
| Citizenship Status | With Coverage | Without Coverage |
| Native Born | 249 (100.0%) | 0 (0.0%) |
| Foreign Born, Citizen | 410 (100.0%) | 0 (0.0%) |
| Foreign Born, not a Citizen | 52 (94.6%) | 3 (5.4%) |
Health Insurance Coverage by Household Income in Burnsville
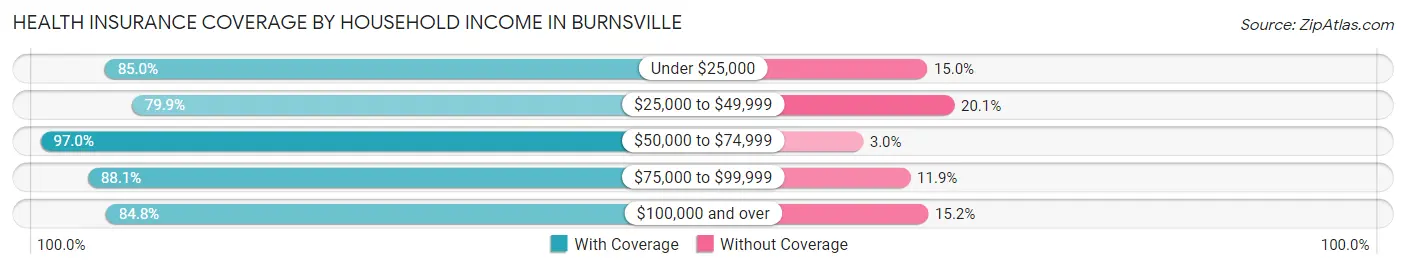
| Household Income | With Coverage | Without Coverage |
| Under $25,000 | 611 (85.0%) | 108 (15.0%) |
| $25,000 to $49,999 | 306 (79.9%) | 77 (20.1%) |
| $50,000 to $74,999 | 420 (97.0%) | 13 (3.0%) |
| $75,000 to $99,999 | 193 (88.1%) | 26 (11.9%) |
| $100,000 and over | 417 (84.8%) | 75 (15.2%) |
Public vs Private Health Insurance Coverage by Age in Burnsville
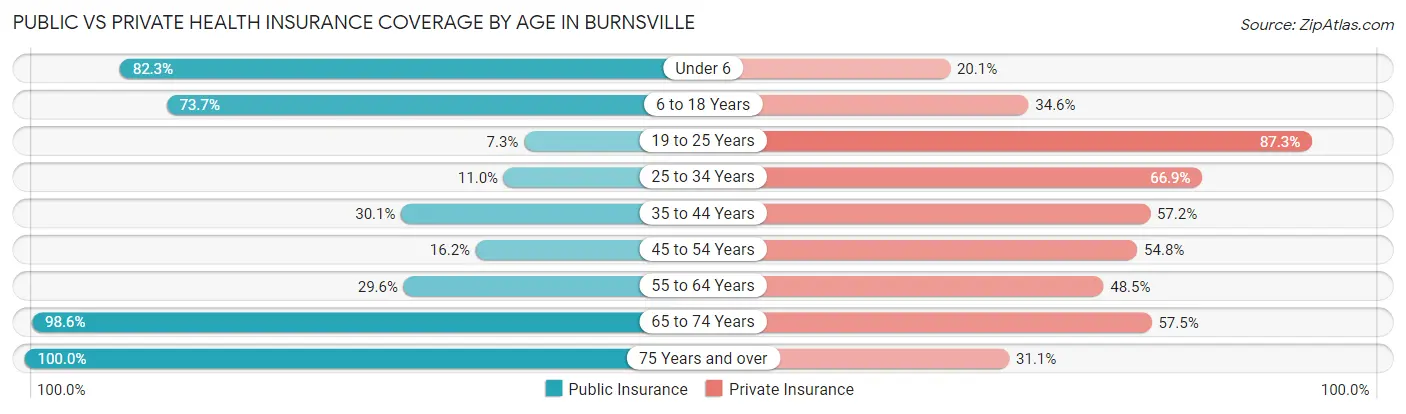
| Age Bracket | Public Insurance | Private Insurance |
| Under 6 | 205 (82.3%) | 50 (20.1%) |
| 6 to 18 Years | 302 (73.7%) | 142 (34.6%) |
| 19 to 25 Years | 4 (7.3%) | 48 (87.3%) |
| 25 to 34 Years | 43 (11.0%) | 261 (66.9%) |
| 35 to 44 Years | 71 (30.1%) | 135 (57.2%) |
| 45 to 54 Years | 37 (16.2%) | 125 (54.8%) |
| 55 to 64 Years | 61 (29.6%) | 100 (48.5%) |
| 65 to 74 Years | 211 (98.6%) | 123 (57.5%) |
| 75 Years and over | 264 (100.0%) | 82 (31.1%) |
| Total | 1,198 (53.2%) | 1,066 (47.3%) |
Disability Status by Sex by Age in Burnsville
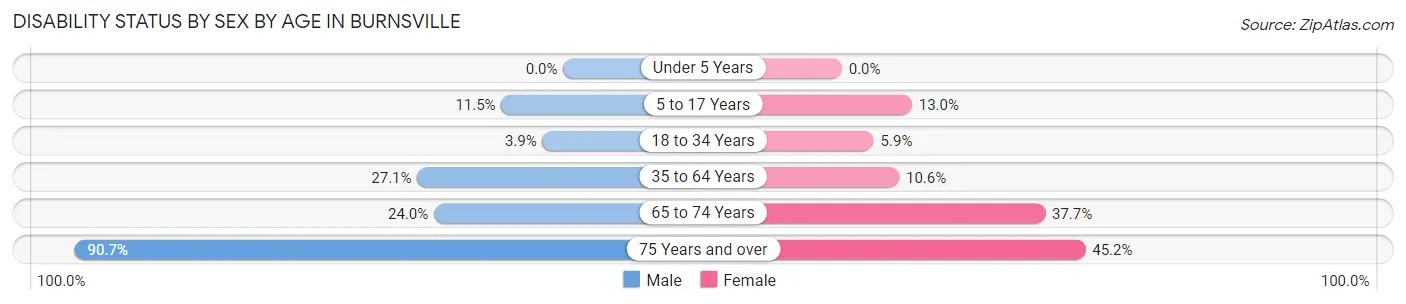
| Age Bracket | Male | Female |
| Under 5 Years | 0 (0.0%) | 0 (0.0%) |
| 5 to 17 Years | 17 (11.5%) | 30 (13.0%) |
| 18 to 34 Years | 10 (3.9%) | 13 (5.9%) |
| 35 to 64 Years | 100 (27.1%) | 32 (10.6%) |
| 65 to 74 Years | 24 (24.0%) | 43 (37.7%) |
| 75 Years and over | 117 (90.7%) | 61 (45.2%) |
Disability Class by Sex by Age in Burnsville
Disability Class: Hearing Difficulty
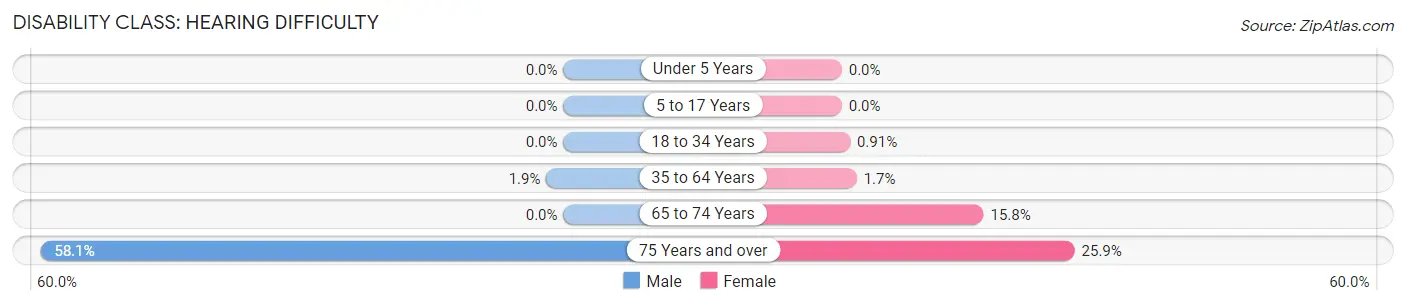
| Age Bracket | Male | Female |
| Under 5 Years | 0 (0.0%) | 0 (0.0%) |
| 5 to 17 Years | 0 (0.0%) | 0 (0.0%) |
| 18 to 34 Years | 0 (0.0%) | 2 (0.9%) |
| 35 to 64 Years | 7 (1.9%) | 5 (1.7%) |
| 65 to 74 Years | 0 (0.0%) | 18 (15.8%) |
| 75 Years and over | 75 (58.1%) | 35 (25.9%) |
Disability Class: Vision Difficulty
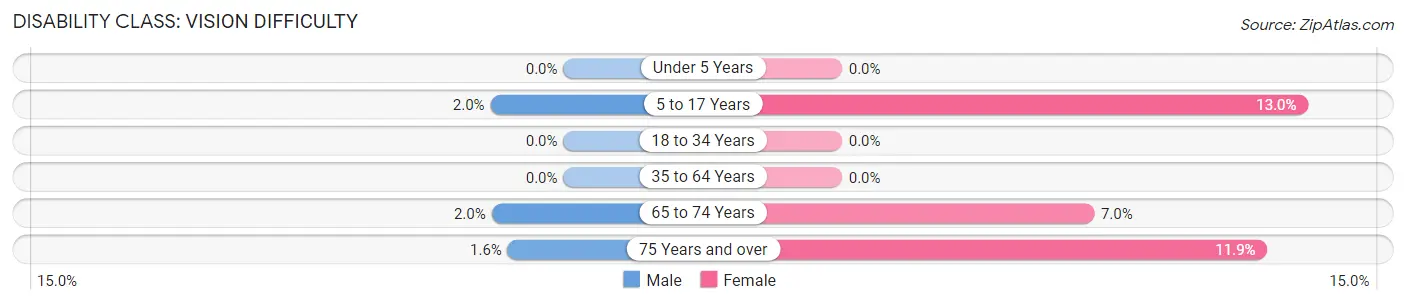
| Age Bracket | Male | Female |
| Under 5 Years | 0 (0.0%) | 0 (0.0%) |
| 5 to 17 Years | 3 (2.0%) | 30 (13.0%) |
| 18 to 34 Years | 0 (0.0%) | 0 (0.0%) |
| 35 to 64 Years | 0 (0.0%) | 0 (0.0%) |
| 65 to 74 Years | 2 (2.0%) | 8 (7.0%) |
| 75 Years and over | 2 (1.5%) | 16 (11.8%) |
Disability Class: Cognitive Difficulty
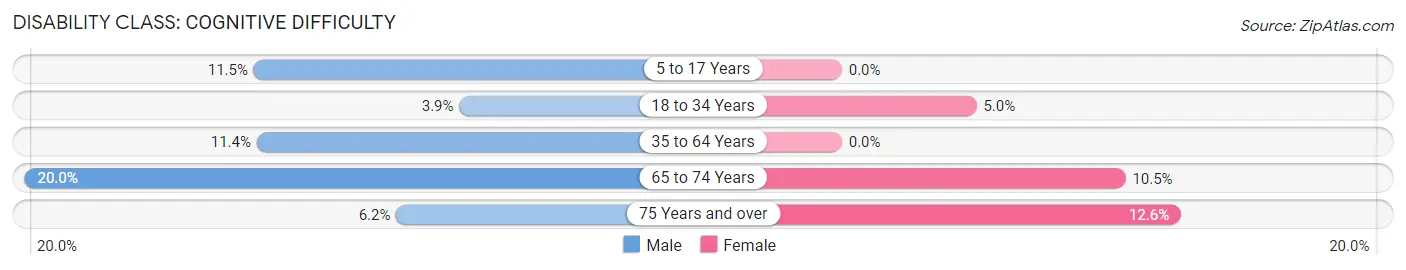
| Age Bracket | Male | Female |
| 5 to 17 Years | 17 (11.5%) | 0 (0.0%) |
| 18 to 34 Years | 10 (3.9%) | 11 (5.0%) |
| 35 to 64 Years | 42 (11.4%) | 0 (0.0%) |
| 65 to 74 Years | 20 (20.0%) | 12 (10.5%) |
| 75 Years and over | 8 (6.2%) | 17 (12.6%) |
Disability Class: Ambulatory Difficulty
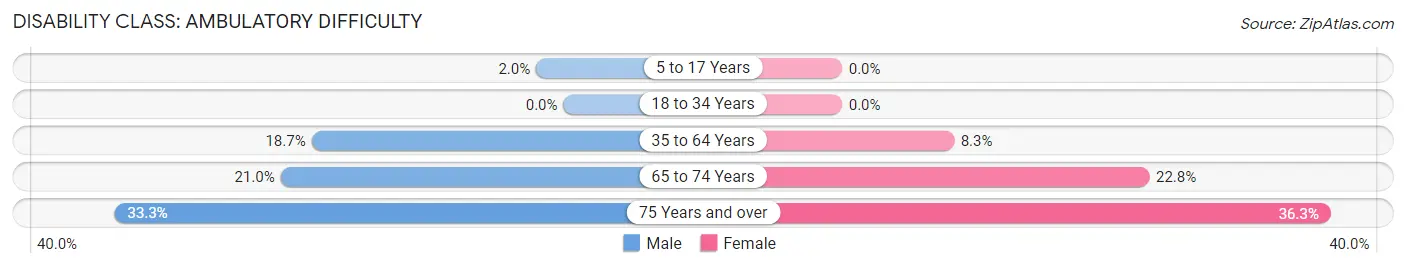
| Age Bracket | Male | Female |
| 5 to 17 Years | 3 (2.0%) | 0 (0.0%) |
| 18 to 34 Years | 0 (0.0%) | 0 (0.0%) |
| 35 to 64 Years | 69 (18.7%) | 25 (8.3%) |
| 65 to 74 Years | 21 (21.0%) | 26 (22.8%) |
| 75 Years and over | 43 (33.3%) | 49 (36.3%) |
Disability Class: Self-Care Difficulty
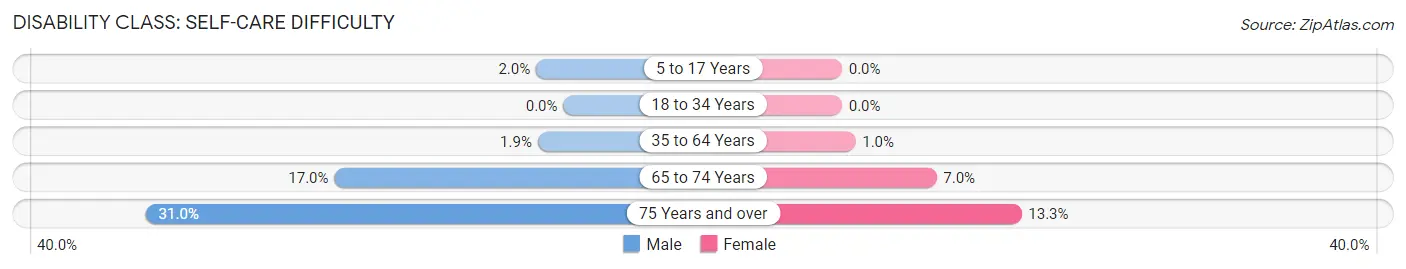
| Age Bracket | Male | Female |
| 5 to 17 Years | 3 (2.0%) | 0 (0.0%) |
| 18 to 34 Years | 0 (0.0%) | 0 (0.0%) |
| 35 to 64 Years | 7 (1.9%) | 3 (1.0%) |
| 65 to 74 Years | 17 (17.0%) | 8 (7.0%) |
| 75 Years and over | 40 (31.0%) | 18 (13.3%) |
Technology Access in Burnsville
Computing Device Access in Burnsville
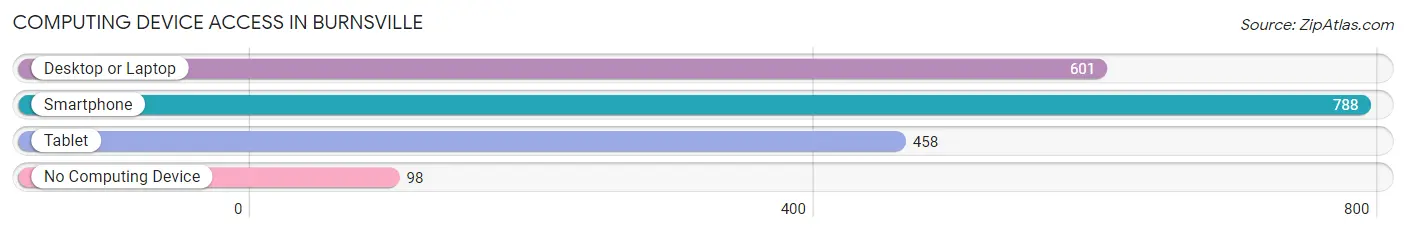
| Device Type | # Households | % Households |
| Desktop or Laptop | 601 | 61.8% |
| Smartphone | 788 | 81.1% |
| Tablet | 458 | 47.1% |
| No Computing Device | 98 | 10.1% |
| Total | 972 | 100.0% |
Internet Access in Burnsville
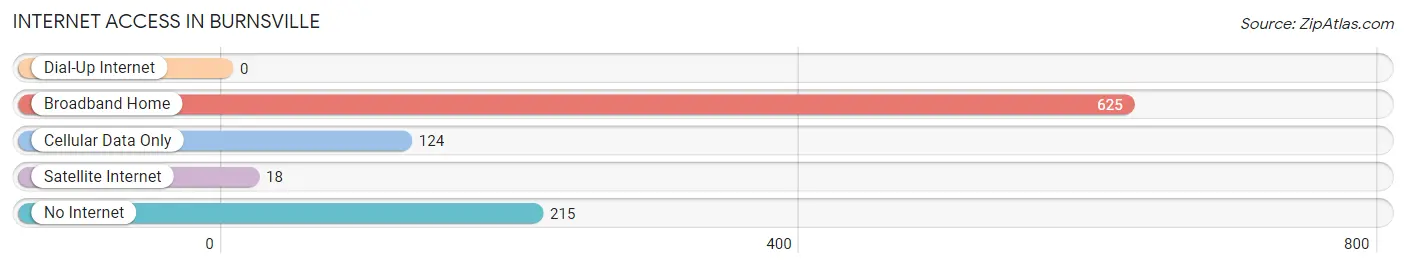
| Internet Type | # Households | % Households |
| Dial-Up Internet | 0 | 0.0% |
| Broadband Home | 625 | 64.3% |
| Cellular Data Only | 124 | 12.8% |
| Satellite Internet | 18 | 1.8% |
| No Internet | 215 | 22.1% |
| Total | 972 | 100.0% |
Burnsville Summary
Burnsville is a small town located in Yancey County, North Carolina. It is situated in the Blue Ridge Mountains, and is the county seat of Yancey County. The town has a population of 1,639 people, according to the 2010 census.
Geography
Burnsville is located in the Blue Ridge Mountains of western North Carolina. It is situated in the Toe River Valley, which is a tributary of the French Broad River. The town is located at an elevation of 2,000 feet, and is surrounded by the Pisgah National Forest. The town is located at the intersection of US 19E and NC 197.
Climate
Burnsville has a humid subtropical climate, with hot summers and mild winters. The average annual temperature is 57°F, and the average annual precipitation is 44 inches.
Demographics
As of the 2010 census, Burnsville had a population of 1,639 people. The racial makeup of the town was 95.3% White, 1.2% African American, 0.3% Native American, 0.3% Asian, 0.1% Pacific Islander, 1.2% from other races, and 1.7% from two or more races. Hispanic or Latino of any race were 2.7% of the population.
Economy
Burnsville is a small town with a limited economy. The town is home to several small businesses, including restaurants, retail stores, and a few manufacturing companies. The town is also home to a number of farms and ranches. The town is also home to a number of tourist attractions, including the Blue Ridge Parkway, the Toe River Arts Council, and the Yancey County Historical Museum.
History
Burnsville was founded in 1835 by William Burns, who named the town after himself. The town was originally a farming community, and the first post office was established in 1837. The town was incorporated in 1851, and the first courthouse was built in 1853.
In the late 19th century, Burnsville became a popular tourist destination, due to its proximity to the Blue Ridge Parkway. The town was also home to a number of resorts, including the Burnsville Hotel and the Burnsville Inn.
In the early 20th century, Burnsville became a center for the timber industry. The town was also home to a number of sawmills and furniture factories.
In the late 20th century, Burnsville became a popular destination for outdoor recreation, due to its proximity to the Pisgah National Forest. The town is also home to a number of art galleries, antique stores, and craft shops.
Today, Burnsville is a small town with a limited economy. The town is home to a number of small businesses, and is a popular destination for outdoor recreation.
Common Questions
What is Per Capita Income in Burnsville?
Per Capita income in Burnsville is $27,243.
What is the Median Family Income in Burnsville?
Median Family Income in Burnsville is $63,512.
What is the Median Household income in Burnsville?
Median Household Income in Burnsville is $39,018.
What is Income or Wage Gap in Burnsville?
Income or Wage Gap in Burnsville is 14.5%.
Women in Burnsville earn 85.5 cents for every dollar earned by a man.
What is Inequality or Gini Index in Burnsville?
Inequality or Gini Index in Burnsville is 0.55.
What is the Total Population of Burnsville?
Total Population of Burnsville is 2,380.
What is the Total Male Population of Burnsville?
Total Male Population of Burnsville is 1,269.
What is the Total Female Population of Burnsville?
Total Female Population of Burnsville is 1,111.
What is the Ratio of Males per 100 Females in Burnsville?
There are 114.22 Males per 100 Females in Burnsville.
What is the Ratio of Females per 100 Males in Burnsville?
There are 87.55 Females per 100 Males in Burnsville.
What is the Median Population Age in Burnsville?
Median Population Age in Burnsville is 37.4 Years.
What is the Average Family Size in Burnsville
Average Family Size in Burnsville is 3.0 People.
What is the Average Household Size in Burnsville
Average Household Size in Burnsville is 2.3 People.
How Large is the Labor Force in Burnsville?
There are 959 People in the Labor Forcein in Burnsville.
What is the Percentage of People in the Labor Force in Burnsville?
52.2% of People are in the Labor Force in Burnsville.
What is the Unemployment Rate in Burnsville?
Unemployment Rate in Burnsville is 6.0%.