Benson, NC Map & Demographics
Benson Map
Benson Overview
$24,298
PER CAPITA INCOME
$55,088
AVG FAMILY INCOME
$56,054
AVG HOUSEHOLD INCOME
4.4%
WAGE / INCOME GAP [ % ]
95.6¢/ $1
WAGE / INCOME GAP [ $ ]
$12,711
FAMILY INCOME DEFICIT
0.41
INEQUALITY / GINI INDEX
4,004
TOTAL POPULATION
1,688
MALE POPULATION
2,316
FEMALE POPULATION
72.88
MALES / 100 FEMALES
137.20
FEMALES / 100 MALES
34.4
MEDIAN AGE
2.8
AVG FAMILY SIZE
2.5
AVG HOUSEHOLD SIZE
1,770
LABOR FORCE [ PEOPLE ]
61.4%
PERCENT IN LABOR FORCE
2.6%
UNEMPLOYMENT RATE
Benson Zip Codes
Benson Area Codes
Income in Benson
Income Overview in Benson
Per Capita Income in Benson is $24,298, while median incomes of families and households are $55,088 and $56,054 respectively.
| Characteristic | Number | Measure |
| Per Capita Income | 4,004 | $24,298 |
| Median Family Income | 1,139 | $55,088 |
| Mean Family Income | 1,139 | $55,152 |
| Median Household Income | 1,522 | $56,054 |
| Mean Household Income | 1,522 | $59,867 |
| Income Deficit | 1,139 | $12,711 |
| Wage / Income Gap (%) | 4,004 | 4.42% |
| Wage / Income Gap ($) | 4,004 | 95.58¢ per $1 |
| Gini / Inequality Index | 4,004 | 0.41 |
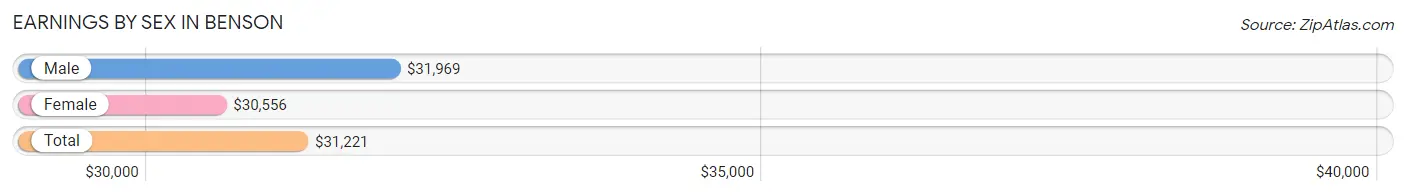
Earnings by Sex in Benson
Average Earnings in Benson are $31,221, $31,969 for men and $30,556 for women, a difference of 4.4%.
| Sex | Number | Average Earnings |
| Male | 588 (33.4%) | $31,969 |
| Female | 1,172 (66.6%) | $30,556 |
| Total | 1,760 (100.0%) | $31,221 |
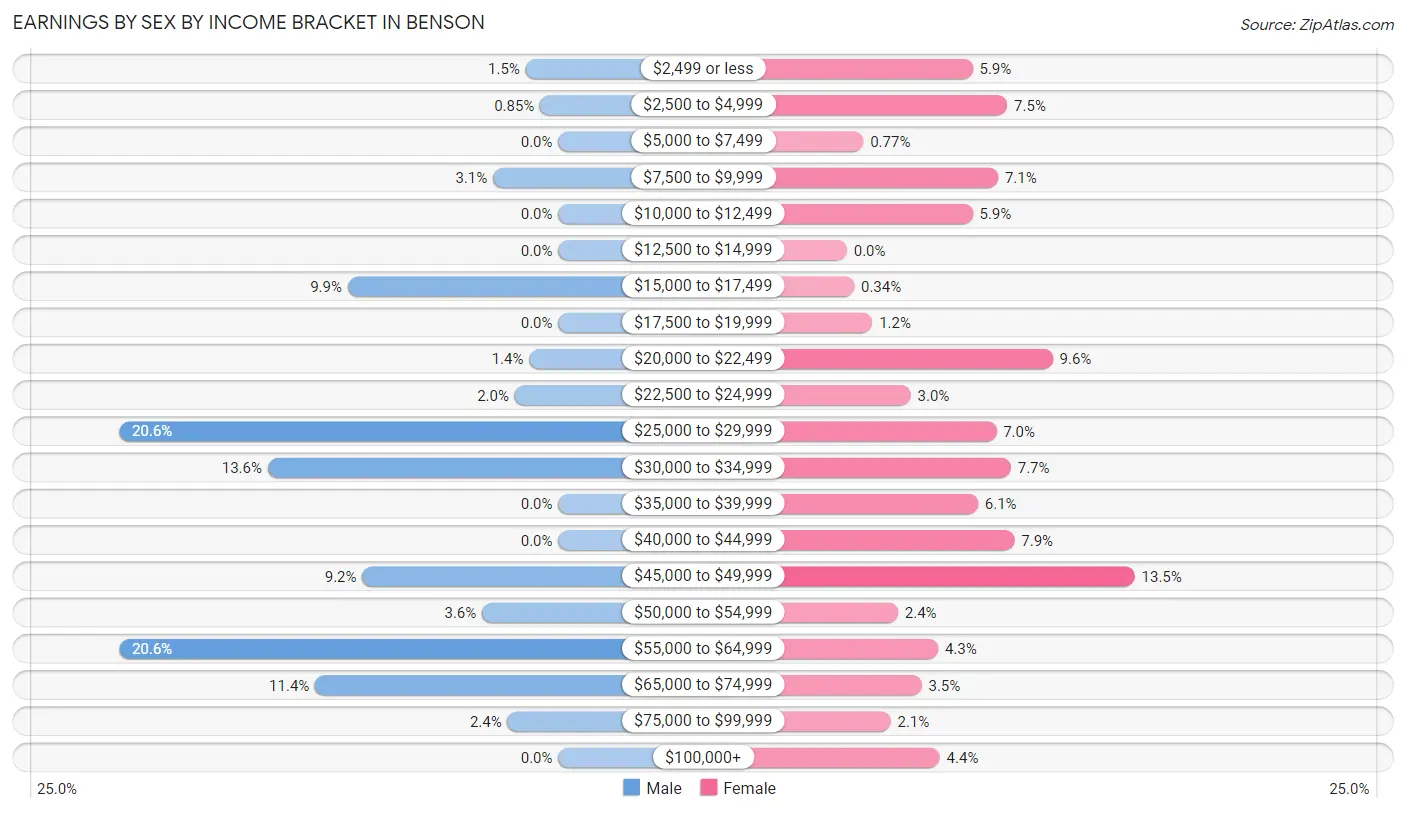
Earnings by Sex by Income Bracket in Benson
The most common earnings brackets in Benson are $25,000 to $29,999 for men (121 | 20.6%) and $45,000 to $49,999 for women (158 | 13.5%).
| Income | Male | Female |
| $2,499 or less | 9 (1.5%) | 69 (5.9%) |
| $2,500 to $4,999 | 5 (0.9%) | 88 (7.5%) |
| $5,000 to $7,499 | 0 (0.0%) | 9 (0.8%) |
| $7,500 to $9,999 | 18 (3.1%) | 83 (7.1%) |
| $10,000 to $12,499 | 0 (0.0%) | 69 (5.9%) |
| $12,500 to $14,999 | 0 (0.0%) | 0 (0.0%) |
| $15,000 to $17,499 | 58 (9.9%) | 4 (0.3%) |
| $17,500 to $19,999 | 0 (0.0%) | 14 (1.2%) |
| $20,000 to $22,499 | 8 (1.4%) | 113 (9.6%) |
| $22,500 to $24,999 | 12 (2.0%) | 35 (3.0%) |
| $25,000 to $29,999 | 121 (20.6%) | 82 (7.0%) |
| $30,000 to $34,999 | 80 (13.6%) | 90 (7.7%) |
| $35,000 to $39,999 | 0 (0.0%) | 72 (6.1%) |
| $40,000 to $44,999 | 0 (0.0%) | 92 (7.9%) |
| $45,000 to $49,999 | 54 (9.2%) | 158 (13.5%) |
| $50,000 to $54,999 | 21 (3.6%) | 28 (2.4%) |
| $55,000 to $64,999 | 121 (20.6%) | 50 (4.3%) |
| $65,000 to $74,999 | 67 (11.4%) | 41 (3.5%) |
| $75,000 to $99,999 | 14 (2.4%) | 24 (2.1%) |
| $100,000+ | 0 (0.0%) | 51 (4.3%) |
| Total | 588 (100.0%) | 1,172 (100.0%) |
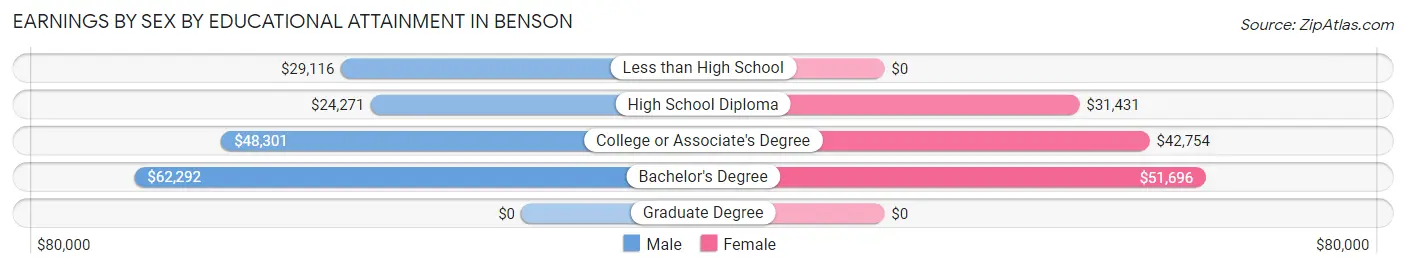
Earnings by Sex by Educational Attainment in Benson
Average earnings in Benson are $32,047 for men and $32,208 for women, a difference of 0.5%. Men with an educational attainment of bachelor's degree enjoy the highest average annual earnings of $62,292, while those with high school diploma education earn the least with $24,271. Women with an educational attainment of bachelor's degree earn the most with the average annual earnings of $51,696, while those with high school diploma education have the smallest earnings of $31,431.
| Educational Attainment | Male Income | Female Income |
| Less than High School | $29,116 | $0 |
| High School Diploma | $24,271 | $31,431 |
| College or Associate's Degree | $48,301 | $42,754 |
| Bachelor's Degree | $62,292 | $51,696 |
| Graduate Degree | - | - |
| Total | $32,047 | $32,208 |
Family Income in Benson
Family Income Brackets in Benson
According to the Benson family income data, there are 308 families falling into the $50,000 to $74,999 income range, which is the most common income bracket and makes up 27.0% of all families. Conversely, the $10,000 to $14,999 income bracket is the least frequent group with only 9 families (0.8%) belonging to this category.
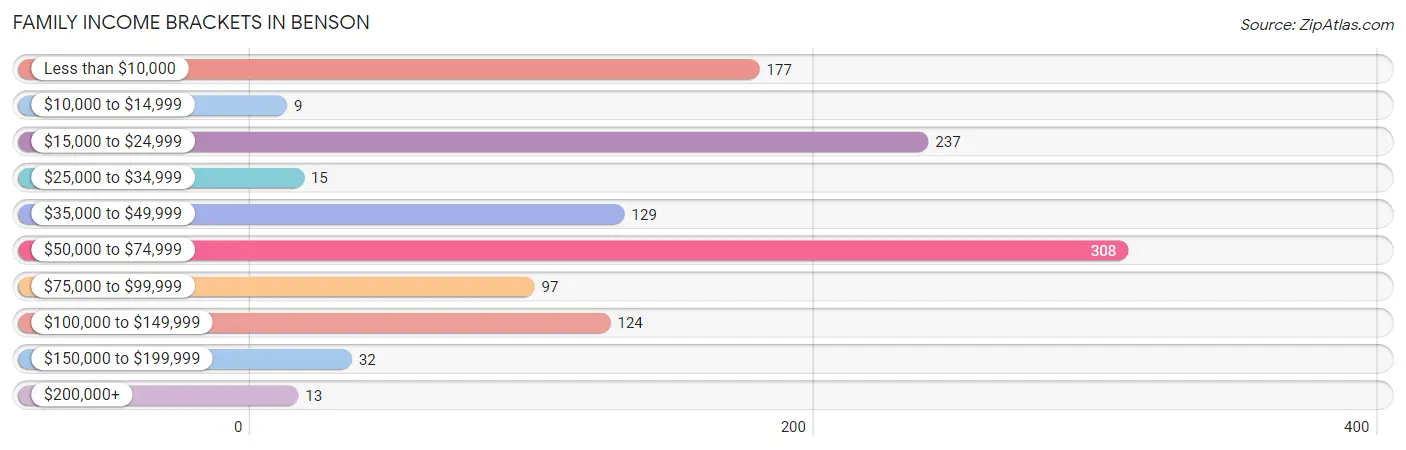
| Income Bracket | # Families | % Families |
| Less than $10,000 | 177 | 15.5% |
| $10,000 to $14,999 | 9 | 0.8% |
| $15,000 to $24,999 | 237 | 20.8% |
| $25,000 to $34,999 | 15 | 1.3% |
| $35,000 to $49,999 | 129 | 11.3% |
| $50,000 to $74,999 | 308 | 27.0% |
| $75,000 to $99,999 | 97 | 8.5% |
| $100,000 to $149,999 | 124 | 10.9% |
| $150,000 to $199,999 | 32 | 2.8% |
| $200,000+ | 13 | 1.1% |
Family Income by Famaliy Size in Benson
2-person families (585 | 51.4%) account for the highest median family income in Benson with $68,622 per family, while 2-person families (585 | 51.4%) have the highest median income of $34,311 per family member.
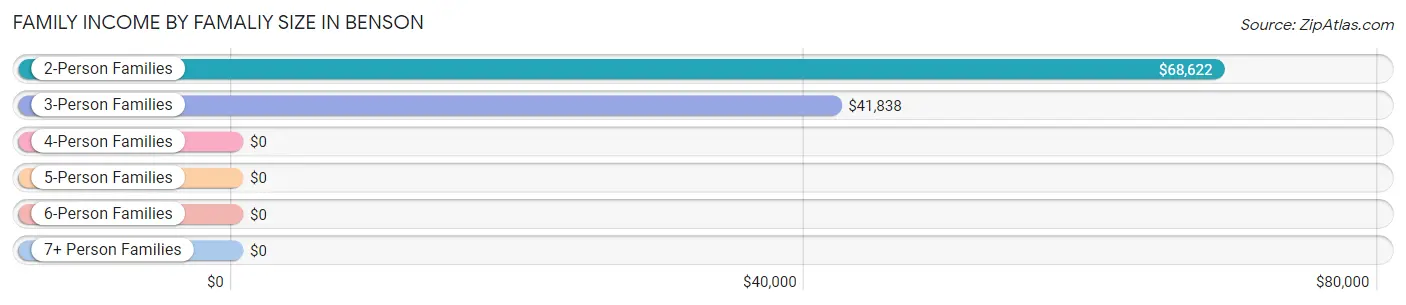
| Income Bracket | # Families | Median Income |
| 2-Person Families | 585 (51.4%) | $68,622 |
| 3-Person Families | 245 (21.5%) | $41,838 |
| 4-Person Families | 218 (19.1%) | $0 |
| 5-Person Families | 71 (6.2%) | $0 |
| 6-Person Families | 20 (1.8%) | $0 |
| 7+ Person Families | 0 (0.0%) | $0 |
| Total | 1,139 (100.0%) | $55,088 |
Family Income by Number of Earners in Benson
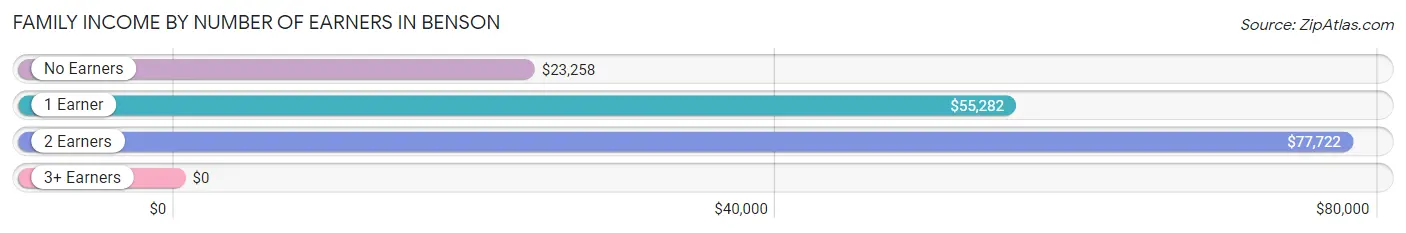
| Number of Earners | # Families | Median Income |
| No Earners | 210 (18.4%) | $23,258 |
| 1 Earner | 588 (51.6%) | $55,282 |
| 2 Earners | 338 (29.7%) | $77,722 |
| 3+ Earners | 3 (0.3%) | $0 |
| Total | 1,139 (100.0%) | $55,088 |
Household Income in Benson
Household Income Brackets in Benson
With 559 households falling in the category, the $50,000 to $74,999 income range is the most frequent in Benson, accounting for 36.7% of all households. In contrast, only 24 households (1.6%) fall into the $10,000 to $14,999 income bracket, making it the least populous group.
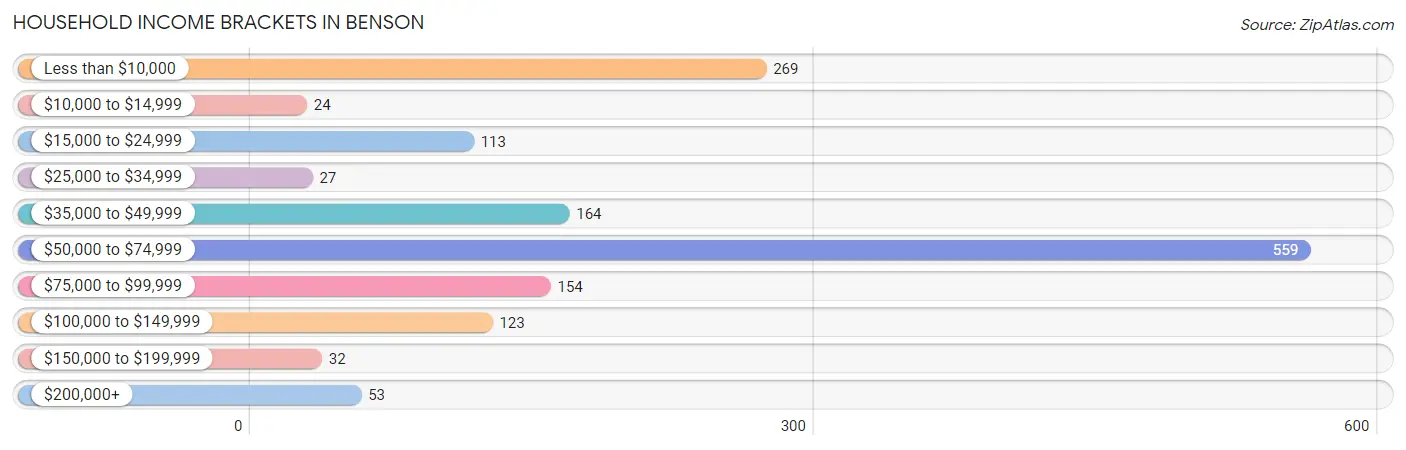
| Income Bracket | # Households | % Households |
| Less than $10,000 | 269 | 17.7% |
| $10,000 to $14,999 | 24 | 1.6% |
| $15,000 to $24,999 | 113 | 7.4% |
| $25,000 to $34,999 | 27 | 1.8% |
| $35,000 to $49,999 | 164 | 10.8% |
| $50,000 to $74,999 | 559 | 36.7% |
| $75,000 to $99,999 | 154 | 10.1% |
| $100,000 to $149,999 | 123 | 8.1% |
| $150,000 to $199,999 | 32 | 2.1% |
| $200,000+ | 53 | 3.5% |
Household Income by Householder Age in Benson
The median household income in Benson is $56,054, with the highest median household income of $64,489 found in the 65+ years age bracket for the primary householder. A total of 514 households (33.8%) fall into this category. Meanwhile, the 15 to 24 years age bracket for the primary householder has the lowest median household income of $0, with 57 households (3.7%) in this group.
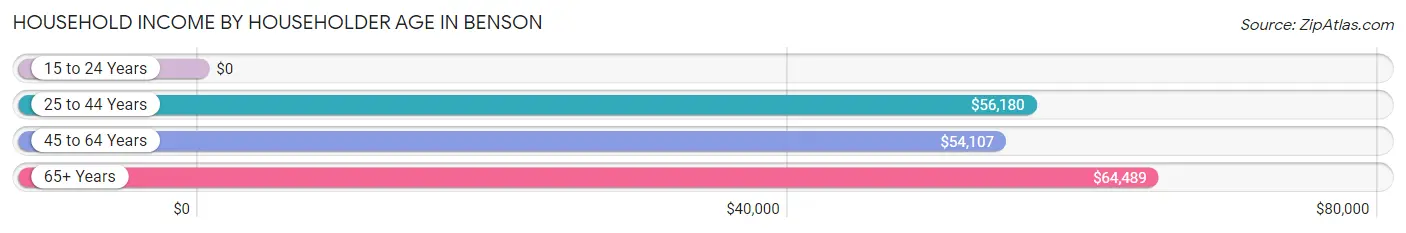
| Income Bracket | # Households | Median Income |
| 15 to 24 Years | 57 (3.7%) | $0 |
| 25 to 44 Years | 677 (44.5%) | $56,180 |
| 45 to 64 Years | 274 (18.0%) | $54,107 |
| 65+ Years | 514 (33.8%) | $64,489 |
| Total | 1,522 (100.0%) | $56,054 |
Poverty in Benson
Income Below Poverty by Sex and Age in Benson
With 37.6% poverty level for males and 37.9% for females among the residents of Benson, 5 year old males and 5 year old females are the most vulnerable to poverty, with 48 males (100.0%) and 12 females (100.0%) in their respective age groups living below the poverty level.
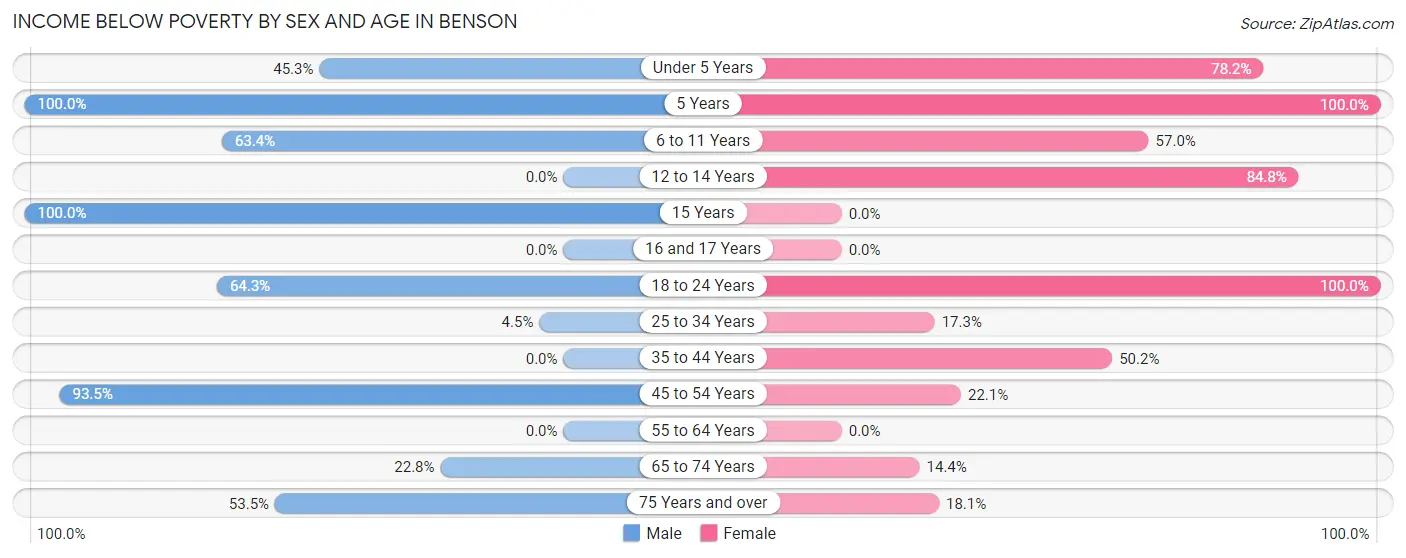
| Age Bracket | Male | Female |
| Under 5 Years | 82 (45.3%) | 194 (78.2%) |
| 5 Years | 48 (100.0%) | 12 (100.0%) |
| 6 to 11 Years | 90 (63.4%) | 45 (57.0%) |
| 12 to 14 Years | 0 (0.0%) | 145 (84.8%) |
| 15 Years | 156 (100.0%) | 0 (0.0%) |
| 16 and 17 Years | 0 (0.0%) | 0 (0.0%) |
| 18 to 24 Years | 9 (64.3%) | 119 (100.0%) |
| 25 to 34 Years | 21 (4.5%) | 59 (17.2%) |
| 35 to 44 Years | 0 (0.0%) | 127 (50.2%) |
| 45 to 54 Years | 115 (93.5%) | 60 (22.1%) |
| 55 to 64 Years | 0 (0.0%) | 0 (0.0%) |
| 65 to 74 Years | 50 (22.8%) | 68 (14.4%) |
| 75 Years and over | 53 (53.5%) | 24 (18.0%) |
| Total | 624 (37.6%) | 853 (37.9%) |
Income Above Poverty by Sex and Age in Benson
According to the poverty statistics in Benson, males aged 12 to 14 years and females aged 55 to 64 years are the age groups that are most secure financially, with 100.0% of males and 100.0% of females in these age groups living above the poverty line.
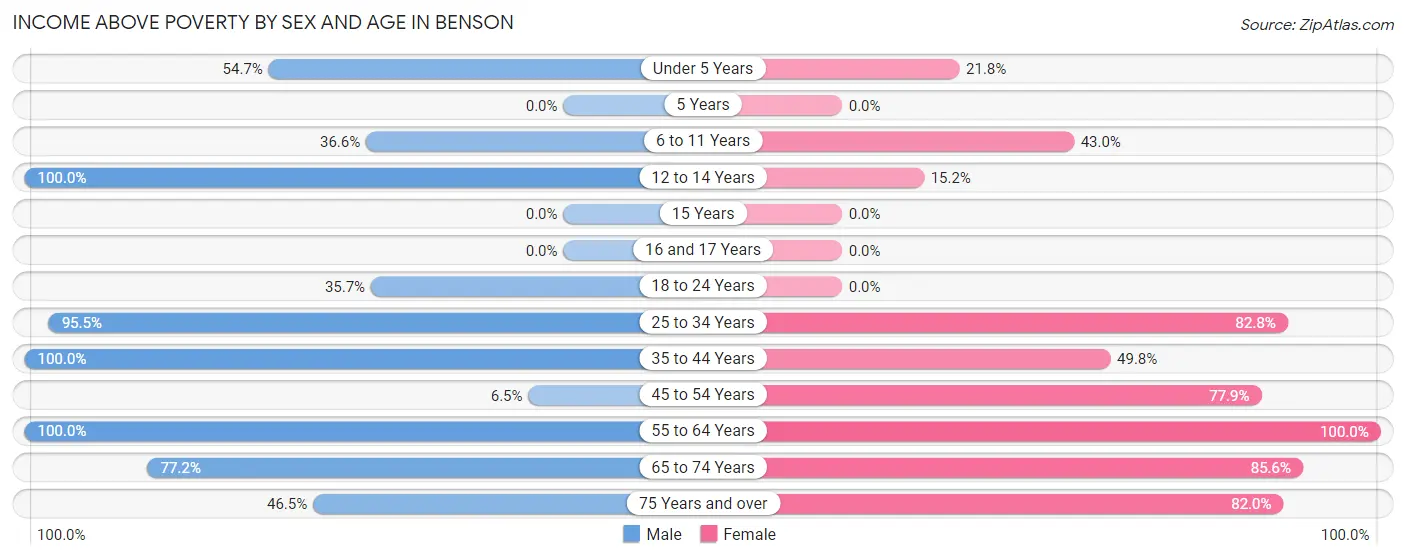
| Age Bracket | Male | Female |
| Under 5 Years | 99 (54.7%) | 54 (21.8%) |
| 5 Years | 0 (0.0%) | 0 (0.0%) |
| 6 to 11 Years | 52 (36.6%) | 34 (43.0%) |
| 12 to 14 Years | 84 (100.0%) | 26 (15.2%) |
| 15 Years | 0 (0.0%) | 0 (0.0%) |
| 16 and 17 Years | 0 (0.0%) | 0 (0.0%) |
| 18 to 24 Years | 5 (35.7%) | 0 (0.0%) |
| 25 to 34 Years | 448 (95.5%) | 283 (82.8%) |
| 35 to 44 Years | 76 (100.0%) | 126 (49.8%) |
| 45 to 54 Years | 8 (6.5%) | 211 (77.9%) |
| 55 to 64 Years | 50 (100.0%) | 154 (100.0%) |
| 65 to 74 Years | 169 (77.2%) | 403 (85.6%) |
| 75 Years and over | 46 (46.5%) | 109 (82.0%) |
| Total | 1,037 (62.4%) | 1,400 (62.1%) |
Income Below Poverty Among Married-Couple Families in Benson
The poverty statistics for married-couple families in Benson show that 12.2% or 65 of the total 534 families live below the poverty line. Families with no children have the highest poverty rate of 16.0%, comprising of 53 families. On the other hand, families with 3 or 4 children have the lowest poverty rate of 0.0%, which includes 0 families.
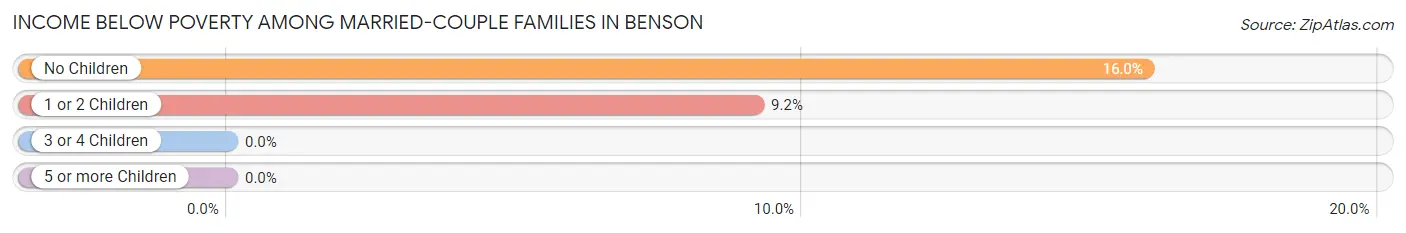
| Children | Above Poverty | Below Poverty |
| No Children | 279 (84.0%) | 53 (16.0%) |
| 1 or 2 Children | 119 (90.8%) | 12 (9.2%) |
| 3 or 4 Children | 71 (100.0%) | 0 (0.0%) |
| 5 or more Children | 0 (0.0%) | 0 (0.0%) |
| Total | 469 (87.8%) | 65 (12.2%) |
Income Below Poverty Among Single-Parent Households in Benson
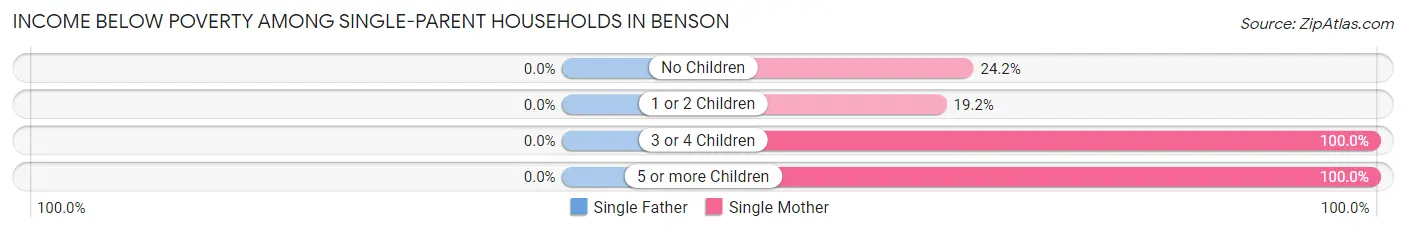
| Children | Single Father | Single Mother |
| No Children | 0 (0.0%) | 52 (24.2%) |
| 1 or 2 Children | 0 (0.0%) | 14 (19.2%) |
| 3 or 4 Children | 0 (0.0%) | 206 (100.0%) |
| 5 or more Children | 0 (0.0%) | 20 (100.0%) |
| Total | 0 (0.0%) | 292 (56.8%) |
Income Below Poverty Among Married-Couple vs Single-Parent Households in Benson
The poverty data for Benson shows that 65 of the married-couple family households (12.2%) and 292 of the single-parent households (48.3%) are living below the poverty level. Within the married-couple family households, those with no children have the highest poverty rate, with 53 households (16.0%) falling below the poverty line. Among the single-parent households, those with 3 or 4 children have the highest poverty rate, with 206 household (100.0%) living below poverty.
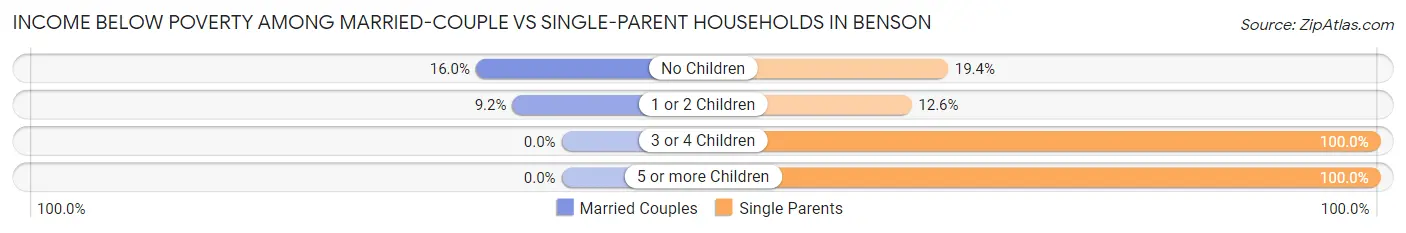
| Children | Married-Couple Families | Single-Parent Households |
| No Children | 53 (16.0%) | 52 (19.4%) |
| 1 or 2 Children | 12 (9.2%) | 14 (12.6%) |
| 3 or 4 Children | 0 (0.0%) | 206 (100.0%) |
| 5 or more Children | 0 (0.0%) | 20 (100.0%) |
| Total | 65 (12.2%) | 292 (48.3%) |
Race in Benson
The most populous races in Benson are White / Caucasian (1,738 | 43.4%), Black / African American (1,584 | 39.6%), and Hispanic or Latino (873 | 21.8%).
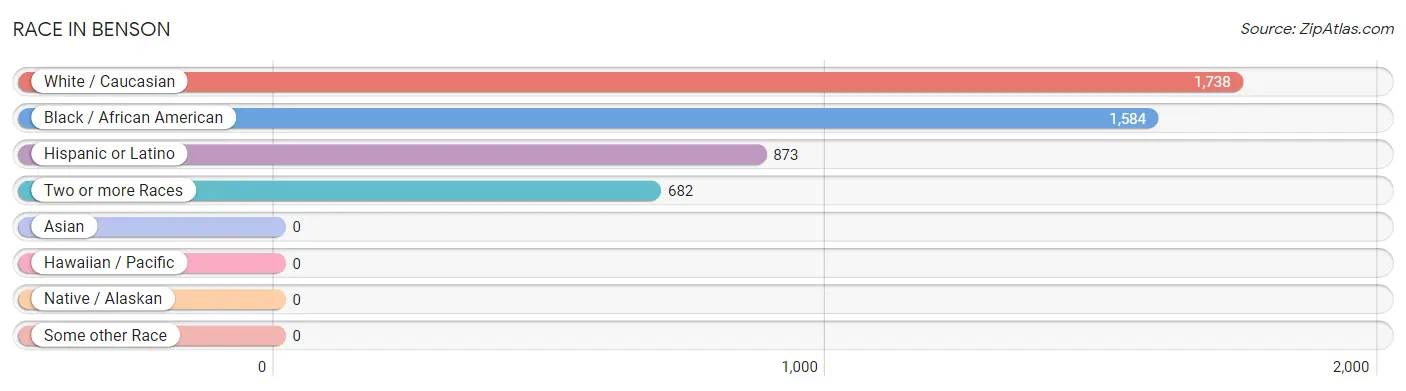
| Race | # Population | % Population |
| Asian | 0 | 0.0% |
| Black / African American | 1,584 | 39.6% |
| Hawaiian / Pacific | 0 | 0.0% |
| Hispanic or Latino | 873 | 21.8% |
| Native / Alaskan | 0 | 0.0% |
| White / Caucasian | 1,738 | 43.4% |
| Two or more Races | 682 | 17.0% |
| Some other Race | 0 | 0.0% |
| Total | 4,004 | 100.0% |
Ancestry in Benson
The most populous ancestries reported in Benson are Mexican (865 | 21.6%), English (298 | 7.4%), American (235 | 5.9%), German (143 | 3.6%), and Irish (66 | 1.7%), together accounting for 40.1% of all Benson residents.
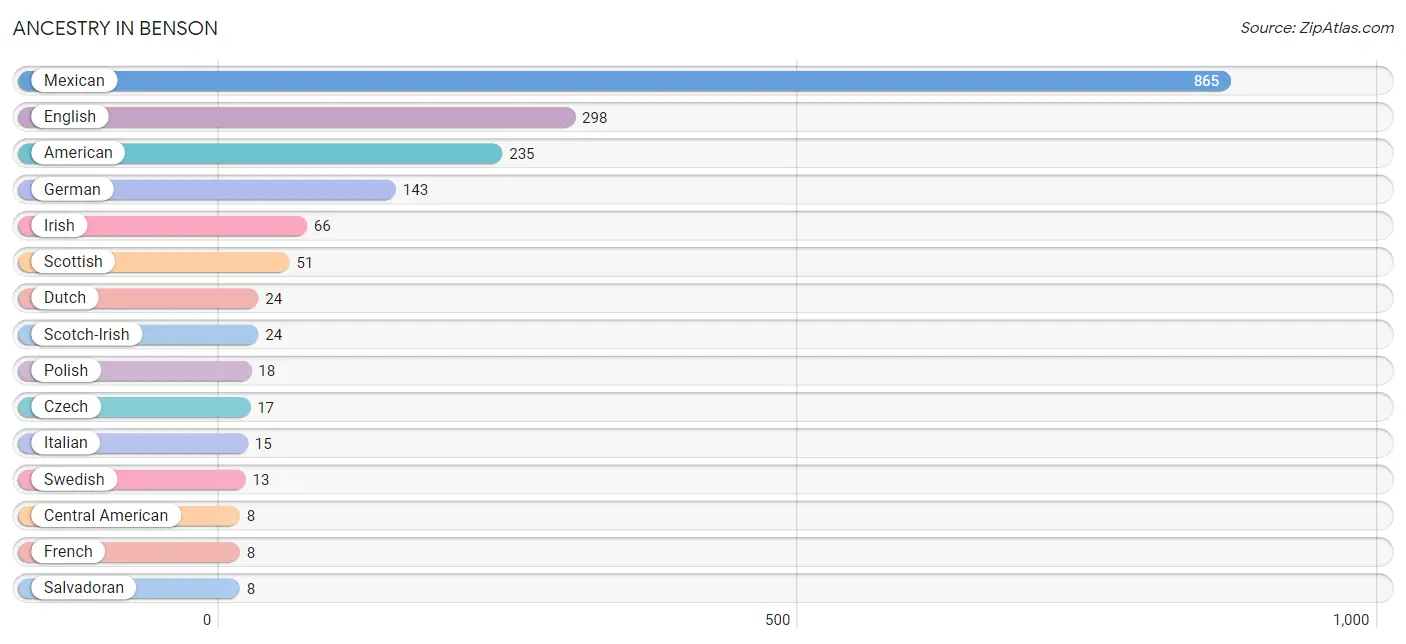
| Ancestry | # Population | % Population |
| American | 235 | 5.9% |
| Central American | 8 | 0.2% |
| Czech | 17 | 0.4% |
| Dutch | 24 | 0.6% |
| English | 298 | 7.4% |
| French | 8 | 0.2% |
| German | 143 | 3.6% |
| Irish | 66 | 1.7% |
| Italian | 15 | 0.4% |
| Mexican | 865 | 21.6% |
| Polish | 18 | 0.4% |
| Salvadoran | 8 | 0.2% |
| Scandinavian | 5 | 0.1% |
| Scotch-Irish | 24 | 0.6% |
| Scottish | 51 | 1.3% |
| Swedish | 13 | 0.3% | View All 16 Rows |
Immigrants in Benson
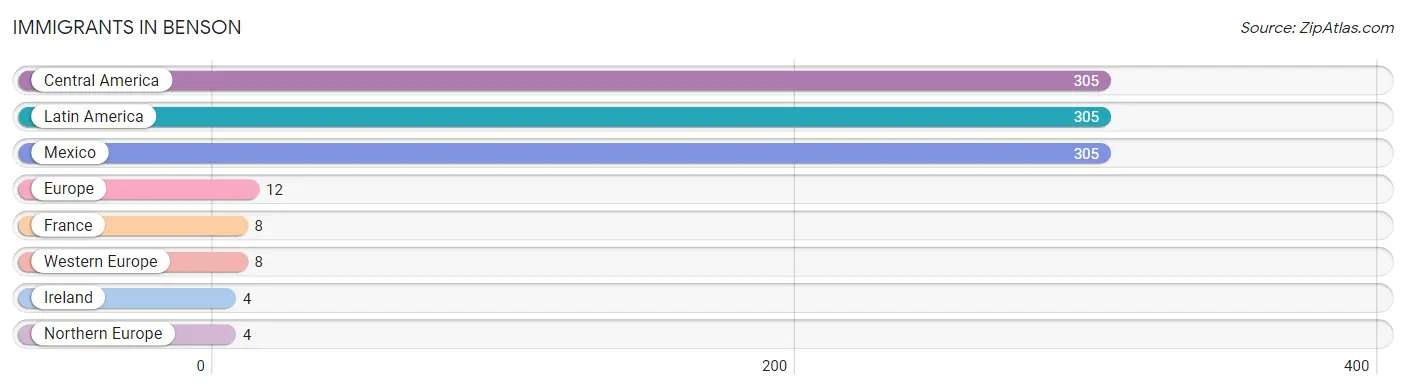
The most numerous immigrant groups reported in Benson came from Central America (305 | 7.6%), Latin America (305 | 7.6%), Mexico (305 | 7.6%), Europe (12 | 0.3%), and France (8 | 0.2%), together accounting for 23.4% of all Benson residents.
| Immigration Origin | # Population | % Population |
| Central America | 305 | 7.6% |
| Europe | 12 | 0.3% |
| France | 8 | 0.2% |
| Ireland | 4 | 0.1% |
| Latin America | 305 | 7.6% |
| Mexico | 305 | 7.6% |
| Northern Europe | 4 | 0.1% |
| Western Europe | 8 | 0.2% | View All 8 Rows |
Sex and Age in Benson
Sex and Age in Benson
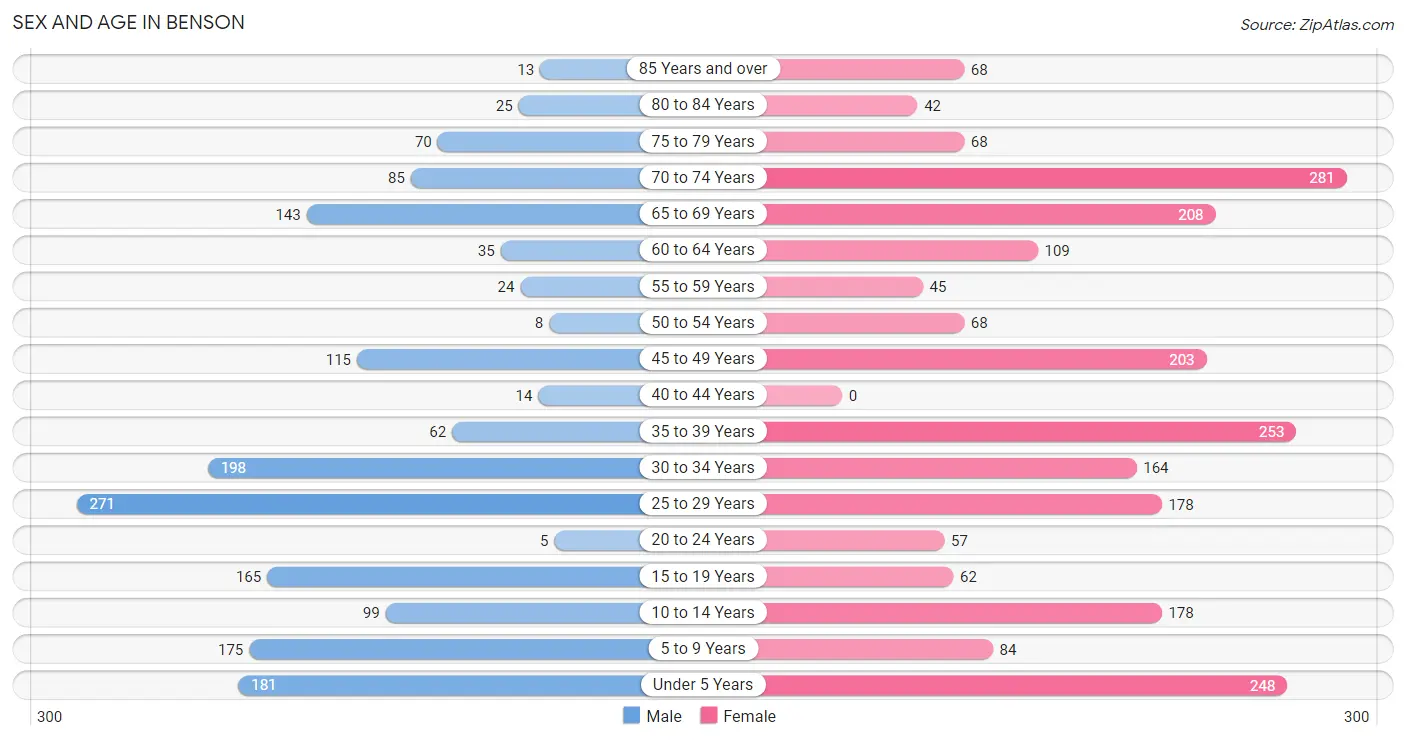
The most populous age groups in Benson are 25 to 29 Years (271 | 16.1%) for men and 70 to 74 Years (281 | 12.1%) for women.
| Age Bracket | Male | Female |
| Under 5 Years | 181 (10.7%) | 248 (10.7%) |
| 5 to 9 Years | 175 (10.4%) | 84 (3.6%) |
| 10 to 14 Years | 99 (5.9%) | 178 (7.7%) |
| 15 to 19 Years | 165 (9.8%) | 62 (2.7%) |
| 20 to 24 Years | 5 (0.3%) | 57 (2.5%) |
| 25 to 29 Years | 271 (16.1%) | 178 (7.7%) |
| 30 to 34 Years | 198 (11.7%) | 164 (7.1%) |
| 35 to 39 Years | 62 (3.7%) | 253 (10.9%) |
| 40 to 44 Years | 14 (0.8%) | 0 (0.0%) |
| 45 to 49 Years | 115 (6.8%) | 203 (8.8%) |
| 50 to 54 Years | 8 (0.5%) | 68 (2.9%) |
| 55 to 59 Years | 24 (1.4%) | 45 (1.9%) |
| 60 to 64 Years | 35 (2.1%) | 109 (4.7%) |
| 65 to 69 Years | 143 (8.5%) | 208 (9.0%) |
| 70 to 74 Years | 85 (5.0%) | 281 (12.1%) |
| 75 to 79 Years | 70 (4.2%) | 68 (2.9%) |
| 80 to 84 Years | 25 (1.5%) | 42 (1.8%) |
| 85 Years and over | 13 (0.8%) | 68 (2.9%) |
| Total | 1,688 (100.0%) | 2,316 (100.0%) |
Families and Households in Benson
Median Family Size in Benson
The median family size in Benson is 2.83 persons per family, with single female/mother families (514 | 45.1%) accounting for the largest median family size of 3.19 persons per family. On the other hand, single male/father families (91 | 8.0%) represent the smallest median family size with 1.93 persons per family.
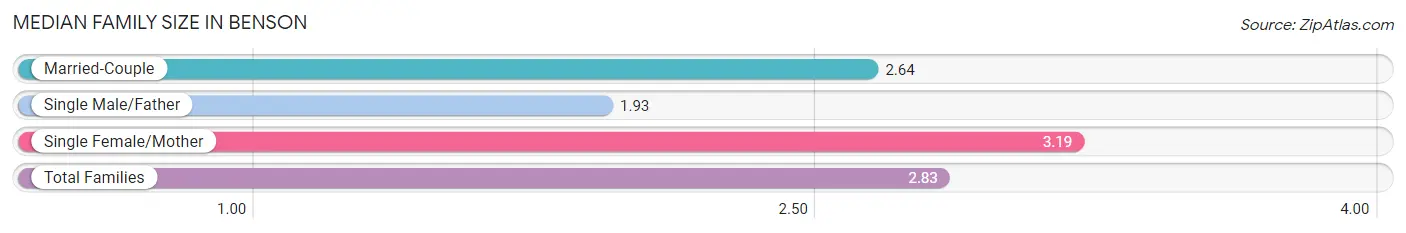
| Family Type | # Families | Family Size |
| Married-Couple | 534 (46.9%) | 2.64 |
| Single Male/Father | 91 (8.0%) | 1.93 |
| Single Female/Mother | 514 (45.1%) | 3.19 |
| Total Families | 1,139 (100.0%) | 2.83 |
Median Household Size in Benson
The median household size in Benson is 2.55 persons per household, with single female/mother households (514 | 33.8%) accounting for the largest median household size of 3.39 persons per household. non-family households (383 | 25.2%) represent the smallest median household size with 1.23 persons per household.
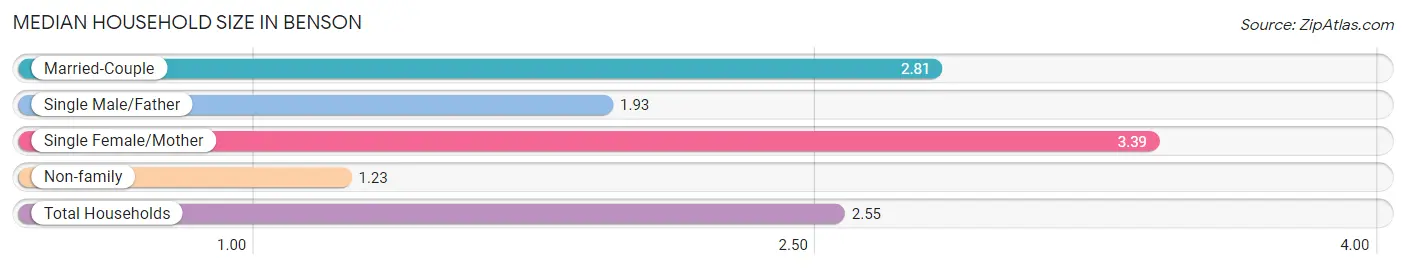
| Household Type | # Households | Household Size |
| Married-Couple | 534 (35.1%) | 2.81 |
| Single Male/Father | 91 (6.0%) | 1.93 |
| Single Female/Mother | 514 (33.8%) | 3.39 |
| Non-family | 383 (25.2%) | 1.23 |
| Total Households | 1,522 (100.0%) | 2.55 |
Household Size by Marriage Status in Benson
Out of a total of 1,522 households in Benson, 1,139 (74.8%) are family households, while 383 (25.2%) are nonfamily households. The most numerous type of family households are 2-person households, comprising 585, and the most common type of nonfamily households are 1-person households, comprising 326.
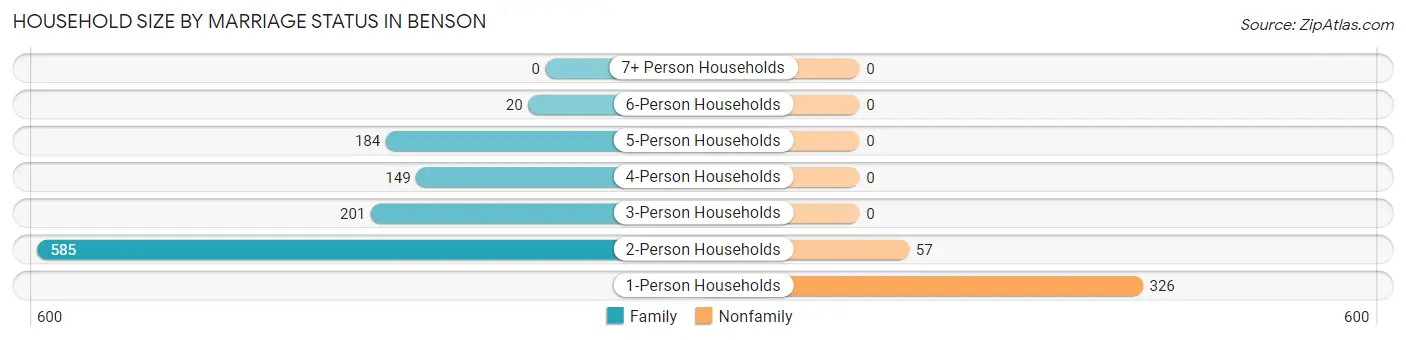
| Household Size | Family Households | Nonfamily Households |
| 1-Person Households | - | 326 (21.4%) |
| 2-Person Households | 585 (38.4%) | 57 (3.7%) |
| 3-Person Households | 201 (13.2%) | 0 (0.0%) |
| 4-Person Households | 149 (9.8%) | 0 (0.0%) |
| 5-Person Households | 184 (12.1%) | 0 (0.0%) |
| 6-Person Households | 20 (1.3%) | 0 (0.0%) |
| 7+ Person Households | 0 (0.0%) | 0 (0.0%) |
| Total | 1,139 (74.8%) | 383 (25.2%) |
Female Fertility in Benson
Fertility by Age in Benson
Average fertility rate in Benson is 38.0 births per 1,000 women. Women in the age bracket of 20 to 34 years have the highest fertility rate with 88.0 births per 1,000 women. Women in the age bracket of 20 to 34 years acount for 100.0% of all women with births.
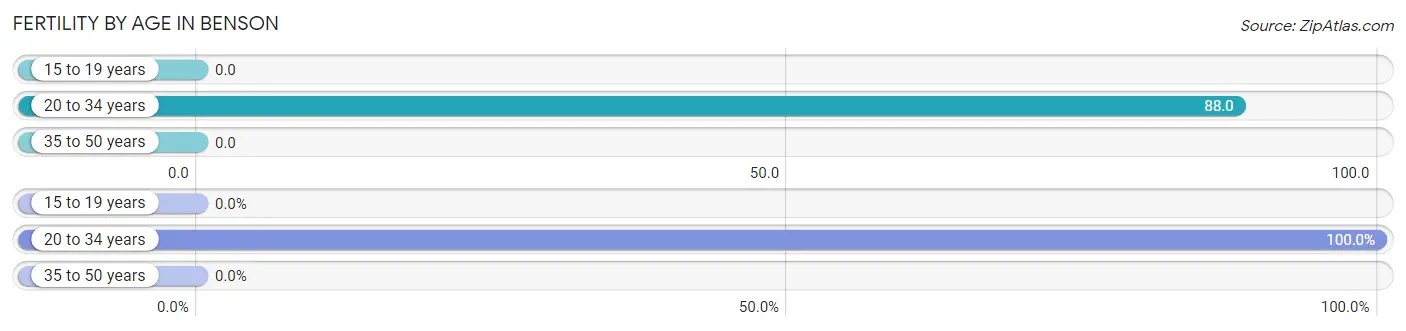
| Age Bracket | Women with Births | Births / 1,000 Women |
| 15 to 19 years | 0 (0.0%) | 0.0 |
| 20 to 34 years | 35 (100.0%) | 88.0 |
| 35 to 50 years | 0 (0.0%) | 0.0 |
| Total | 35 (100.0%) | 38.0 |
Fertility by Age by Marriage Status in Benson
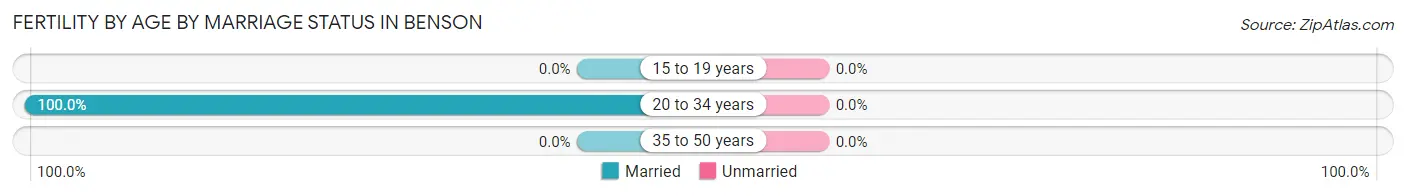
| Age Bracket | Married | Unmarried |
| 15 to 19 years | 0 (0.0%) | 0 (0.0%) |
| 20 to 34 years | 35 (100.0%) | 0 (0.0%) |
| 35 to 50 years | 0 (0.0%) | 0 (0.0%) |
| Total | 35 (100.0%) | 0 (0.0%) |
Fertility by Education in Benson
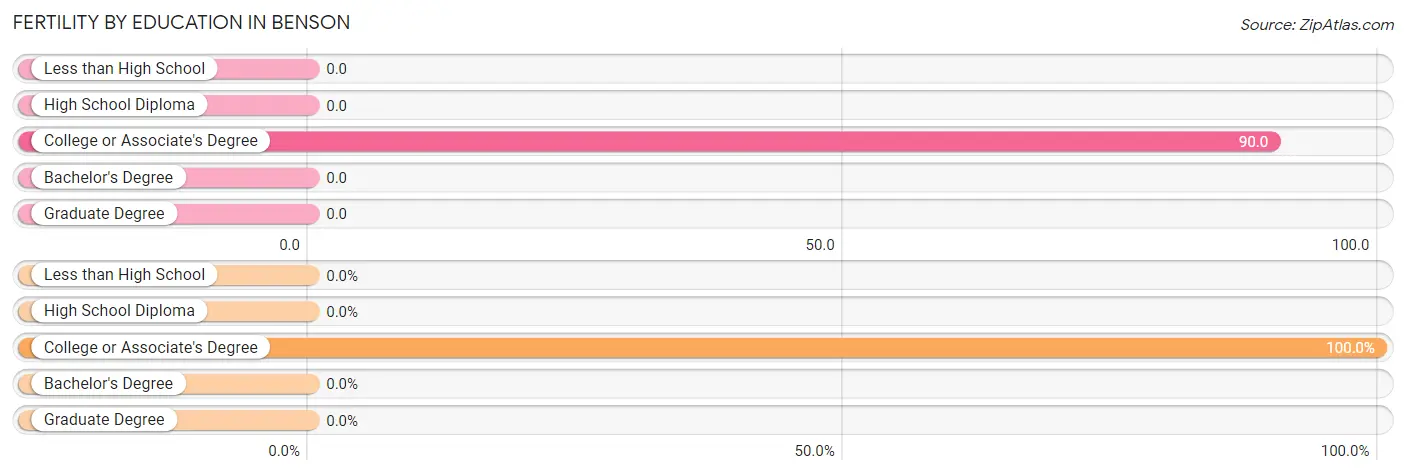
| Educational Attainment | Women with Births | Births / 1,000 Women |
| Less than High School | 0 (0.0%) | 0.0 |
| High School Diploma | 0 (0.0%) | 0.0 |
| College or Associate's Degree | 35 (100.0%) | 90.0 |
| Bachelor's Degree | 0 (0.0%) | 0.0 |
| Graduate Degree | 0 (0.0%) | 0.0 |
| Total | 35 (100.0%) | 38.0 |
Fertility by Education by Marriage Status in Benson
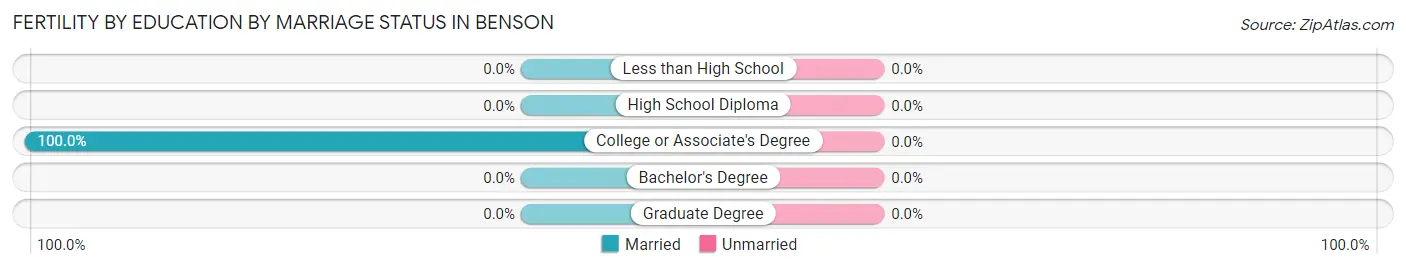
| Educational Attainment | Married | Unmarried |
| Less than High School | 0 (0.0%) | 0 (0.0%) |
| High School Diploma | 0 (0.0%) | 0 (0.0%) |
| College or Associate's Degree | 35 (100.0%) | 0 (0.0%) |
| Bachelor's Degree | 0 (0.0%) | 0 (0.0%) |
| Graduate Degree | 0 (0.0%) | 0 (0.0%) |
| Total | 35 (100.0%) | 0 (0.0%) |
Employment Characteristics in Benson
Employment by Class of Employer in Benson
Among the 1,724 employed individuals in Benson, private company employees (1,159 | 67.2%), not-for-profit organizations (226 | 13.1%), and self-employed (not incorporated) (179 | 10.4%) make up the most common classes of employment.
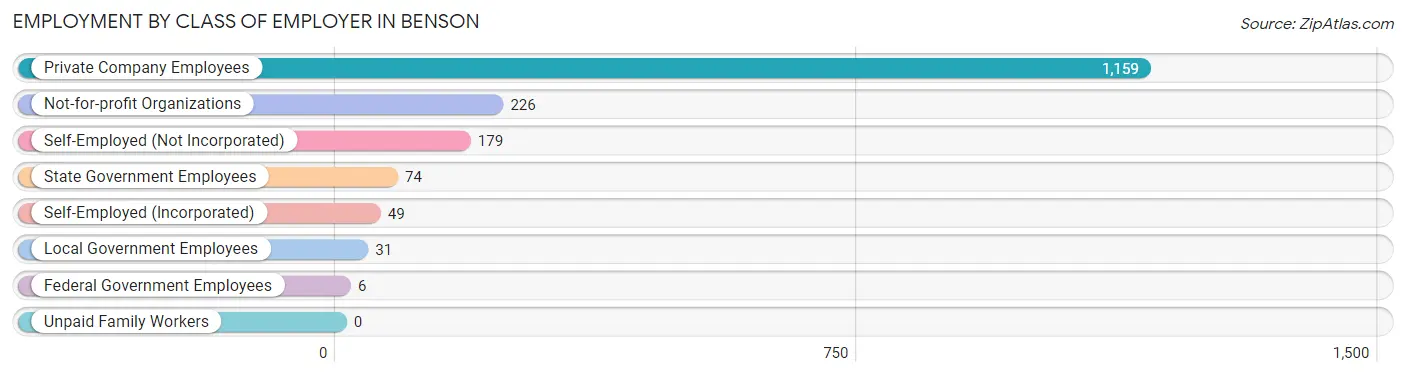
| Employer Class | # Employees | % Employees |
| Private Company Employees | 1,159 | 67.2% |
| Self-Employed (Incorporated) | 49 | 2.8% |
| Self-Employed (Not Incorporated) | 179 | 10.4% |
| Not-for-profit Organizations | 226 | 13.1% |
| Local Government Employees | 31 | 1.8% |
| State Government Employees | 74 | 4.3% |
| Federal Government Employees | 6 | 0.4% |
| Unpaid Family Workers | 0 | 0.0% |
| Total | 1,724 | 100.0% |
Employment Status by Age in Benson
According to the labor force statistics for Benson, out of the total population over 16 years of age (2,883), 61.4% or 1,770 individuals are in the labor force, with 2.6% or 46 of them unemployed. The age group with the highest labor force participation rate is 16 to 19 years, with 100.0% or 71 individuals in the labor force. Within the labor force, the 16 to 19 years age range has the highest percentage of unemployed individuals, with 12.7% or 9 of them being unemployed.
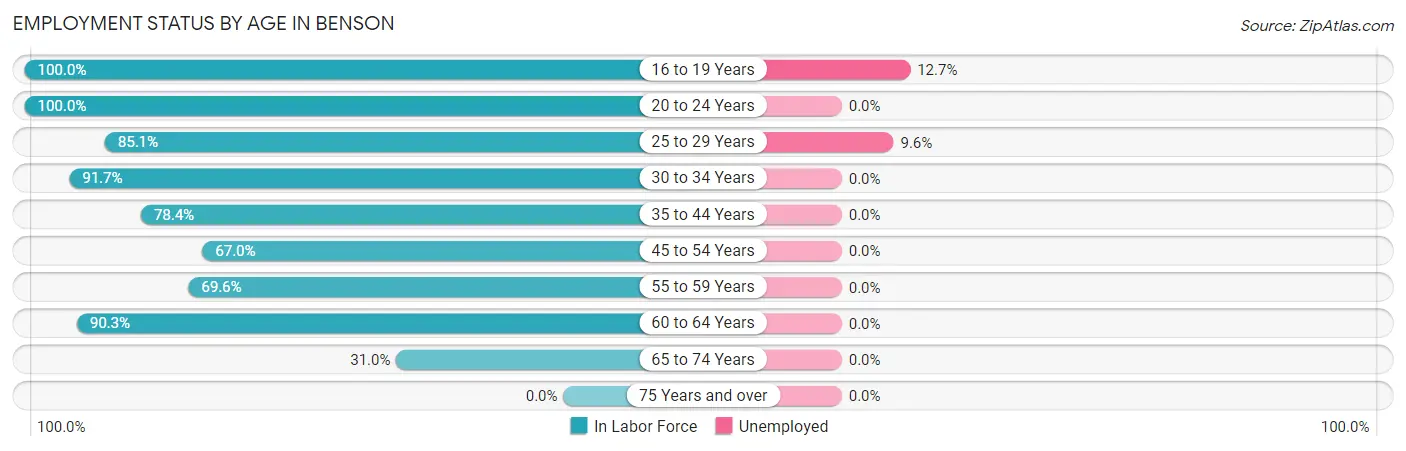
| Age Bracket | In Labor Force | Unemployed |
| 16 to 19 Years | 71 (100.0%) | 9 (12.7%) |
| 20 to 24 Years | 62 (100.0%) | 0 (0.0%) |
| 25 to 29 Years | 382 (85.1%) | 37 (9.6%) |
| 30 to 34 Years | 332 (91.7%) | 0 (0.0%) |
| 35 to 44 Years | 258 (78.4%) | 0 (0.0%) |
| 45 to 54 Years | 264 (67.0%) | 0 (0.0%) |
| 55 to 59 Years | 48 (69.6%) | 0 (0.0%) |
| 60 to 64 Years | 130 (90.3%) | 0 (0.0%) |
| 65 to 74 Years | 222 (31.0%) | 0 (0.0%) |
| 75 Years and over | 0 (0.0%) | 0 (0.0%) |
| Total | 1,770 (61.4%) | 46 (2.6%) |
Employment Status by Educational Attainment in Benson
According to labor force statistics for Benson, 80.9% of individuals (1,413) out of the total population between 25 and 64 years of age (1,747) are in the labor force, with 2.6% or 37 of them being unemployed. The group with the highest labor force participation rate are those with the educational attainment of less than high school, with 95.8% or 272 individuals in the labor force. Within the labor force, individuals with less than high school education have the highest percentage of unemployment, with 13.2% or 36 of them being unemployed.
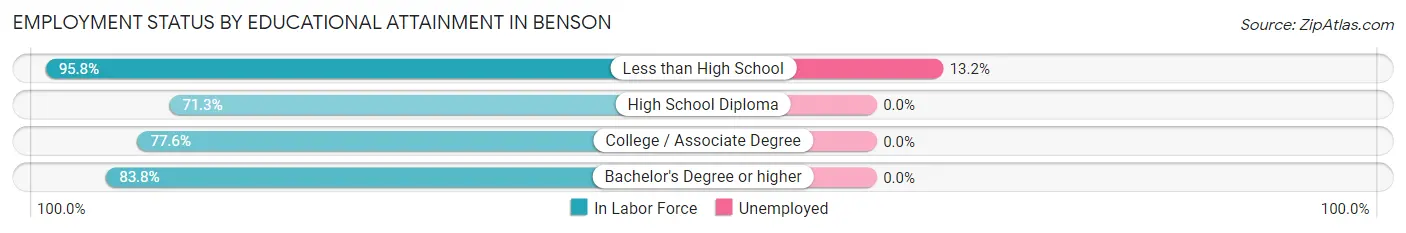
| Educational Attainment | In Labor Force | Unemployed |
| Less than High School | 272 (95.8%) | 37 (13.2%) |
| High School Diploma | 234 (71.3%) | 0 (0.0%) |
| College / Associate Degree | 541 (77.6%) | 0 (0.0%) |
| Bachelor's Degree or higher | 367 (83.8%) | 0 (0.0%) |
| Total | 1,413 (80.9%) | 45 (2.6%) |
Employment Occupations by Sex in Benson
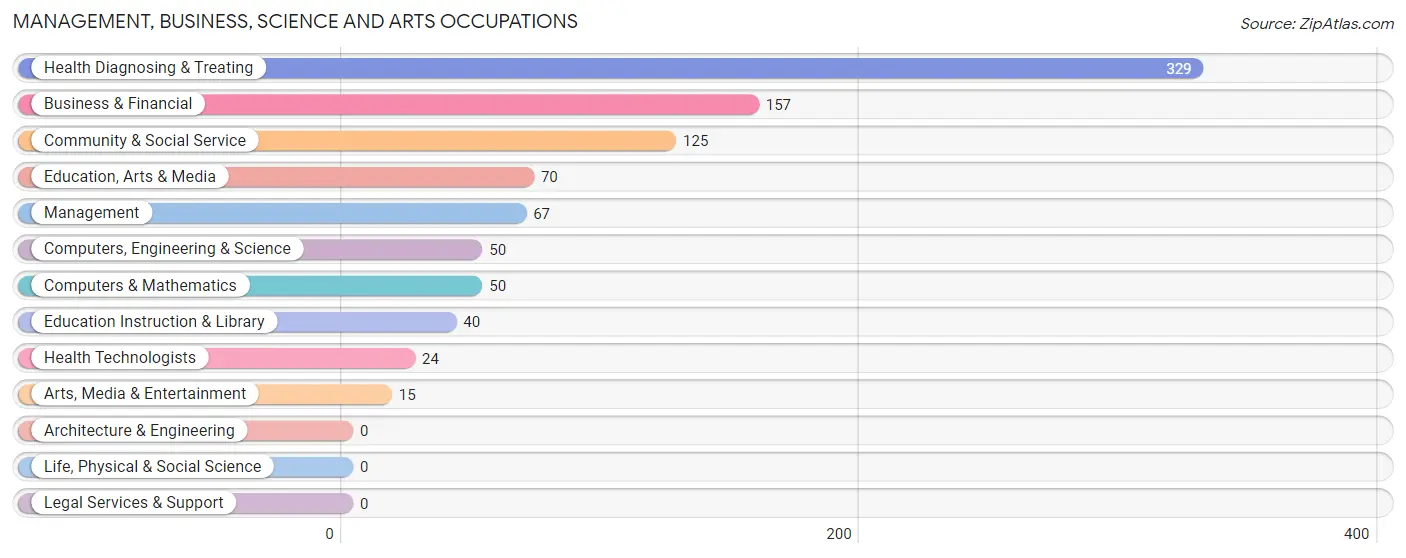
Management, Business, Science and Arts Occupations
The most common Management, Business, Science and Arts occupations in Benson are Health Diagnosing & Treating (329 | 19.2%), Business & Financial (157 | 9.1%), Community & Social Service (125 | 7.3%), Education, Arts & Media (70 | 4.1%), and Management (67 | 3.9%).
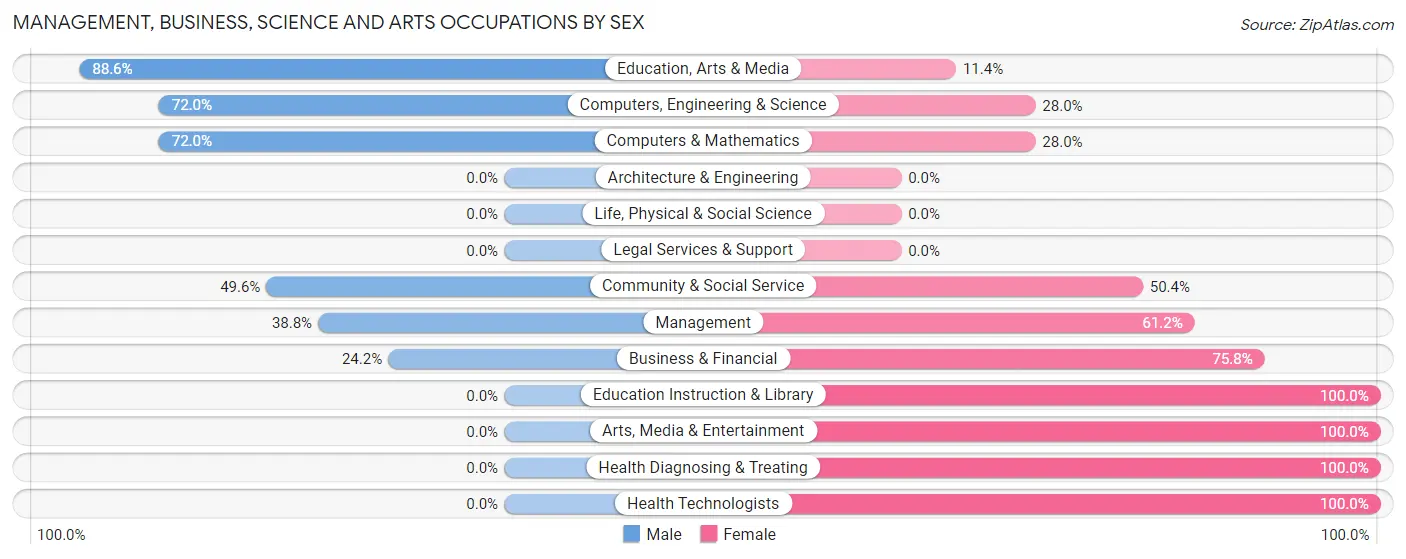
Management, Business, Science and Arts Occupations by Sex
Within the Management, Business, Science and Arts occupations in Benson, the most male-oriented occupations are Education, Arts & Media (88.6%), Computers, Engineering & Science (72.0%), and Computers & Mathematics (72.0%), while the most female-oriented occupations are Education Instruction & Library (100.0%), Arts, Media & Entertainment (100.0%), and Health Diagnosing & Treating (100.0%).
| Occupation | Male | Female |
| Management | 26 (38.8%) | 41 (61.2%) |
| Business & Financial | 38 (24.2%) | 119 (75.8%) |
| Computers, Engineering & Science | 36 (72.0%) | 14 (28.0%) |
| Computers & Mathematics | 36 (72.0%) | 14 (28.0%) |
| Architecture & Engineering | 0 (0.0%) | 0 (0.0%) |
| Life, Physical & Social Science | 0 (0.0%) | 0 (0.0%) |
| Community & Social Service | 62 (49.6%) | 63 (50.4%) |
| Education, Arts & Media | 62 (88.6%) | 8 (11.4%) |
| Legal Services & Support | 0 (0.0%) | 0 (0.0%) |
| Education Instruction & Library | 0 (0.0%) | 40 (100.0%) |
| Arts, Media & Entertainment | 0 (0.0%) | 15 (100.0%) |
| Health Diagnosing & Treating | 0 (0.0%) | 329 (100.0%) |
| Health Technologists | 0 (0.0%) | 24 (100.0%) |
| Total (Category) | 162 (22.3%) | 566 (77.7%) |
| Total (Overall) | 582 (33.9%) | 1,136 (66.1%) |
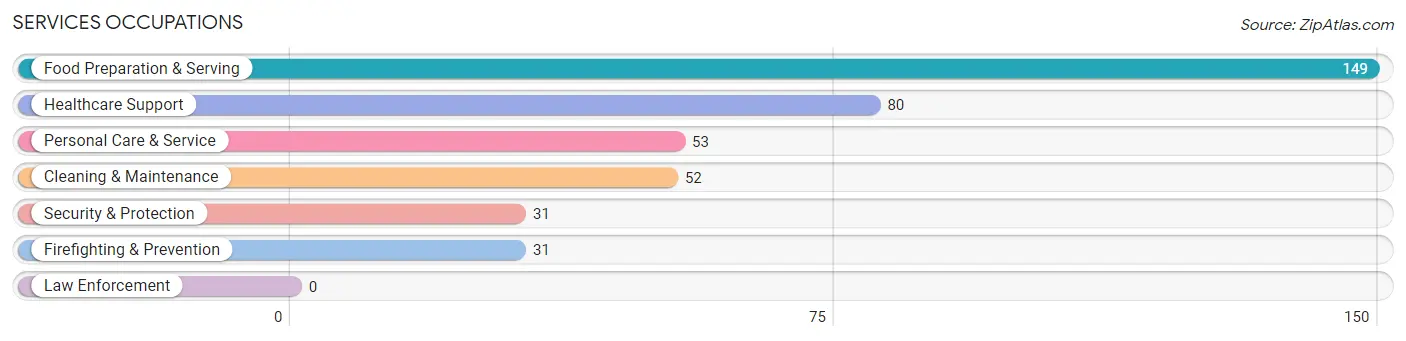
Services Occupations
The most common Services occupations in Benson are Food Preparation & Serving (149 | 8.7%), Healthcare Support (80 | 4.7%), Personal Care & Service (53 | 3.1%), Cleaning & Maintenance (52 | 3.0%), and Security & Protection (31 | 1.8%).
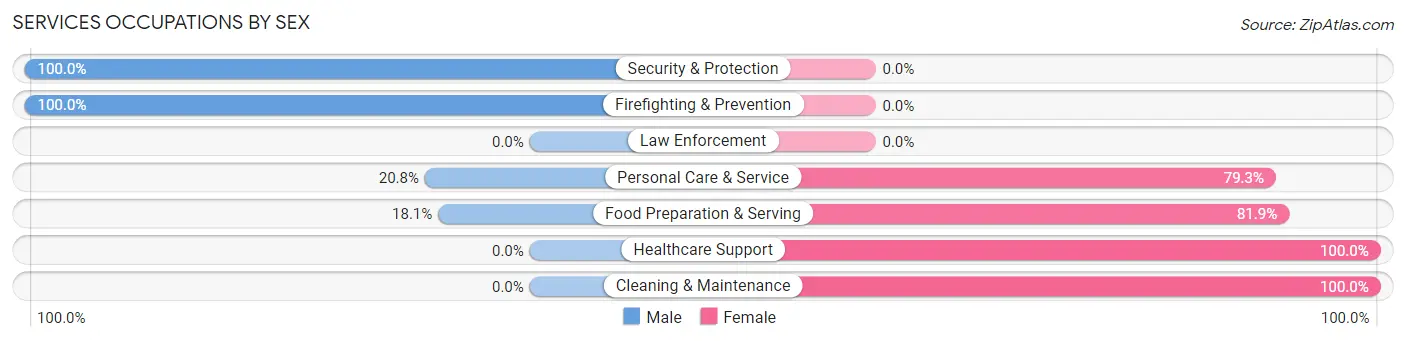
Services Occupations by Sex
Within the Services occupations in Benson, the most male-oriented occupations are Security & Protection (100.0%), Firefighting & Prevention (100.0%), and Personal Care & Service (20.7%), while the most female-oriented occupations are Healthcare Support (100.0%), Cleaning & Maintenance (100.0%), and Food Preparation & Serving (81.9%).
| Occupation | Male | Female |
| Healthcare Support | 0 (0.0%) | 80 (100.0%) |
| Security & Protection | 31 (100.0%) | 0 (0.0%) |
| Firefighting & Prevention | 31 (100.0%) | 0 (0.0%) |
| Law Enforcement | 0 (0.0%) | 0 (0.0%) |
| Food Preparation & Serving | 27 (18.1%) | 122 (81.9%) |
| Cleaning & Maintenance | 0 (0.0%) | 52 (100.0%) |
| Personal Care & Service | 11 (20.7%) | 42 (79.2%) |
| Total (Category) | 69 (18.9%) | 296 (81.1%) |
| Total (Overall) | 582 (33.9%) | 1,136 (66.1%) |
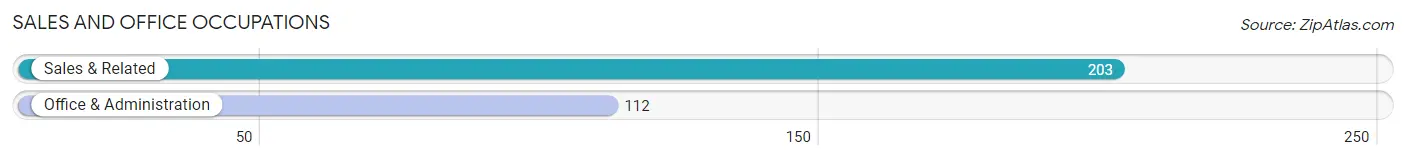
Sales and Office Occupations
The most common Sales and Office occupations in Benson are Sales & Related (203 | 11.8%), and Office & Administration (112 | 6.5%).
Sales and Office Occupations by Sex
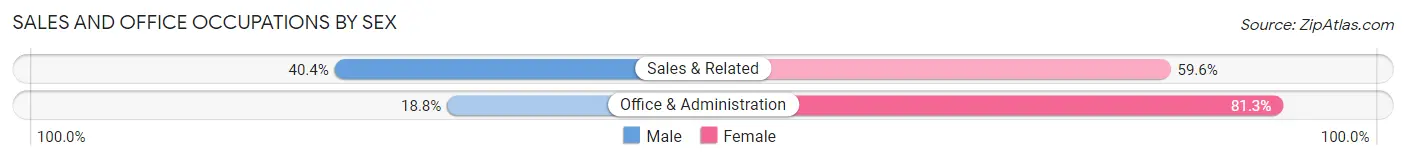
| Occupation | Male | Female |
| Sales & Related | 82 (40.4%) | 121 (59.6%) |
| Office & Administration | 21 (18.8%) | 91 (81.2%) |
| Total (Category) | 103 (32.7%) | 212 (67.3%) |
| Total (Overall) | 582 (33.9%) | 1,136 (66.1%) |
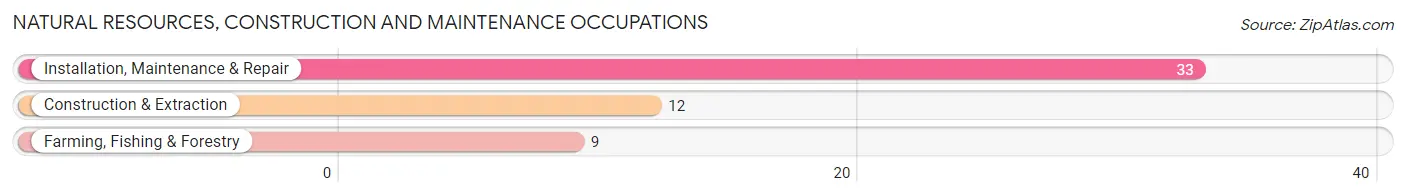
Natural Resources, Construction and Maintenance Occupations
The most common Natural Resources, Construction and Maintenance occupations in Benson are Installation, Maintenance & Repair (33 | 1.9%), Construction & Extraction (12 | 0.7%), and Farming, Fishing & Forestry (9 | 0.5%).
Natural Resources, Construction and Maintenance Occupations by Sex
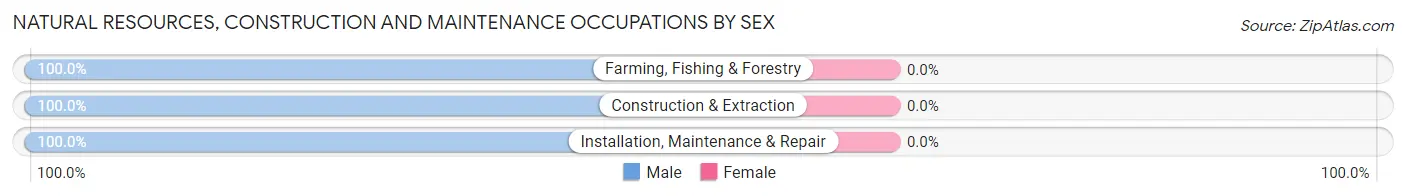
| Occupation | Male | Female |
| Farming, Fishing & Forestry | 9 (100.0%) | 0 (0.0%) |
| Construction & Extraction | 12 (100.0%) | 0 (0.0%) |
| Installation, Maintenance & Repair | 33 (100.0%) | 0 (0.0%) |
| Total (Category) | 54 (100.0%) | 0 (0.0%) |
| Total (Overall) | 582 (33.9%) | 1,136 (66.1%) |
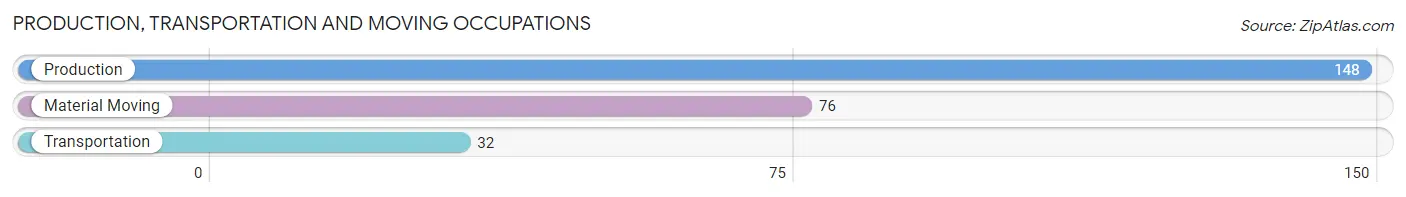
Production, Transportation and Moving Occupations
The most common Production, Transportation and Moving occupations in Benson are Production (148 | 8.6%), Material Moving (76 | 4.4%), and Transportation (32 | 1.9%).
Production, Transportation and Moving Occupations by Sex
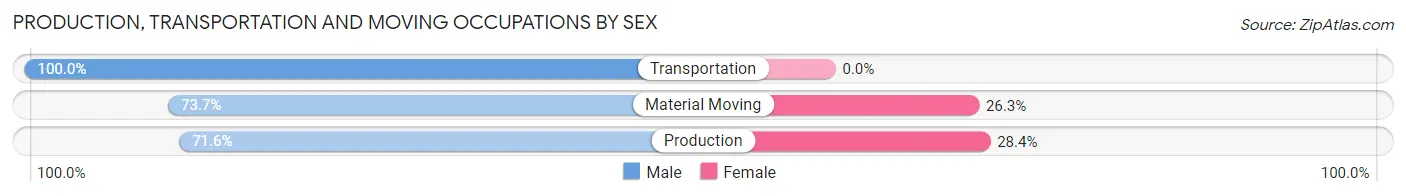
| Occupation | Male | Female |
| Production | 106 (71.6%) | 42 (28.4%) |
| Transportation | 32 (100.0%) | 0 (0.0%) |
| Material Moving | 56 (73.7%) | 20 (26.3%) |
| Total (Category) | 194 (75.8%) | 62 (24.2%) |
| Total (Overall) | 582 (33.9%) | 1,136 (66.1%) |
Employment Industries by Sex in Benson
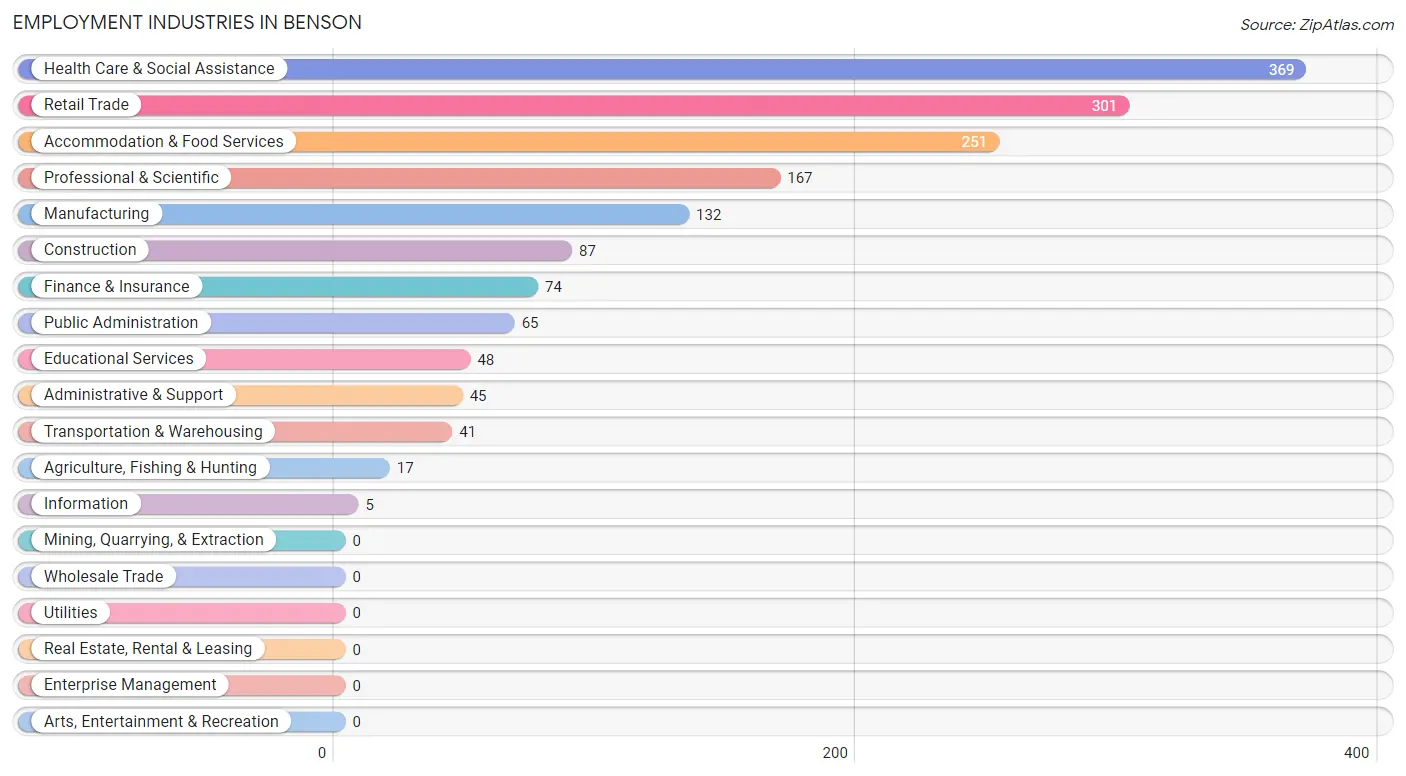
Employment Industries in Benson
The major employment industries in Benson include Health Care & Social Assistance (369 | 21.5%), Retail Trade (301 | 17.5%), Accommodation & Food Services (251 | 14.6%), Professional & Scientific (167 | 9.7%), and Manufacturing (132 | 7.7%).
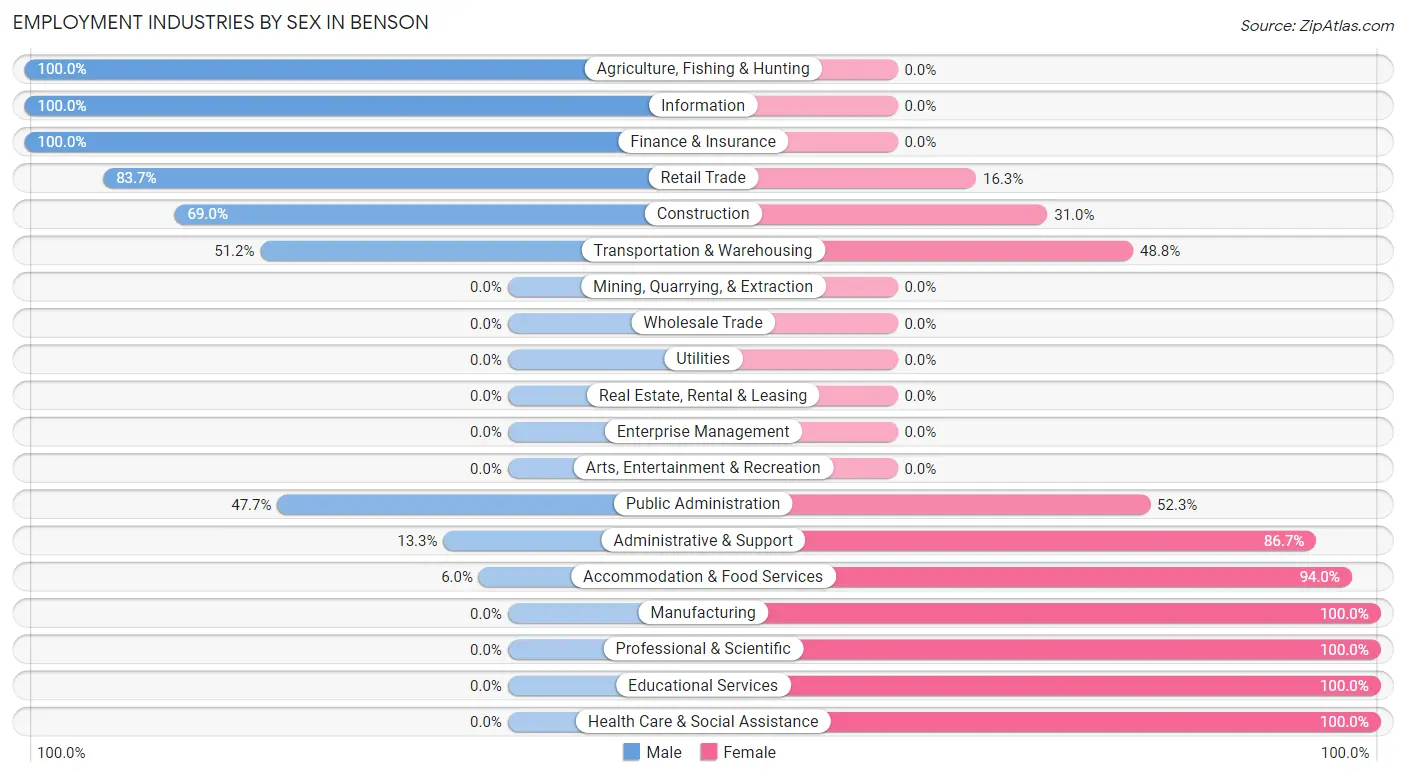
Employment Industries by Sex in Benson
The Benson industries that see more men than women are Agriculture, Fishing & Hunting (100.0%), Information (100.0%), and Finance & Insurance (100.0%), whereas the industries that tend to have a higher number of women are Manufacturing (100.0%), Professional & Scientific (100.0%), and Educational Services (100.0%).
| Industry | Male | Female |
| Agriculture, Fishing & Hunting | 17 (100.0%) | 0 (0.0%) |
| Mining, Quarrying, & Extraction | 0 (0.0%) | 0 (0.0%) |
| Construction | 60 (69.0%) | 27 (31.0%) |
| Manufacturing | 0 (0.0%) | 132 (100.0%) |
| Wholesale Trade | 0 (0.0%) | 0 (0.0%) |
| Retail Trade | 252 (83.7%) | 49 (16.3%) |
| Transportation & Warehousing | 21 (51.2%) | 20 (48.8%) |
| Utilities | 0 (0.0%) | 0 (0.0%) |
| Information | 5 (100.0%) | 0 (0.0%) |
| Finance & Insurance | 74 (100.0%) | 0 (0.0%) |
| Real Estate, Rental & Leasing | 0 (0.0%) | 0 (0.0%) |
| Professional & Scientific | 0 (0.0%) | 167 (100.0%) |
| Enterprise Management | 0 (0.0%) | 0 (0.0%) |
| Administrative & Support | 6 (13.3%) | 39 (86.7%) |
| Educational Services | 0 (0.0%) | 48 (100.0%) |
| Health Care & Social Assistance | 0 (0.0%) | 369 (100.0%) |
| Arts, Entertainment & Recreation | 0 (0.0%) | 0 (0.0%) |
| Accommodation & Food Services | 15 (6.0%) | 236 (94.0%) |
| Public Administration | 31 (47.7%) | 34 (52.3%) |
| Total | 582 (33.9%) | 1,136 (66.1%) |
Education in Benson
School Enrollment in Benson
The most common levels of schooling among the 534 students in Benson are elementary school (206 | 38.6%), college / undergraduate (172 | 32.2%), and middle school (41 | 7.7%).
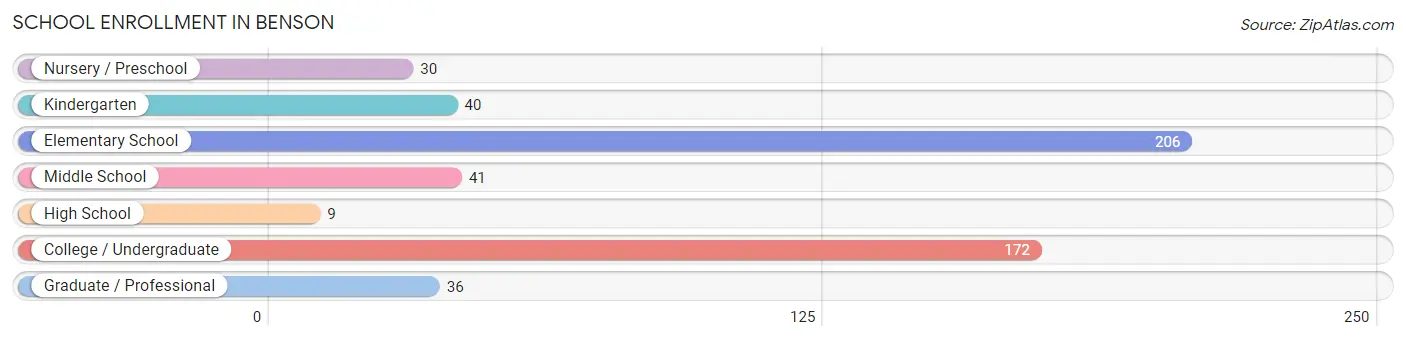
| School Level | # Students | % Students |
| Nursery / Preschool | 30 | 5.6% |
| Kindergarten | 40 | 7.5% |
| Elementary School | 206 | 38.6% |
| Middle School | 41 | 7.7% |
| High School | 9 | 1.7% |
| College / Undergraduate | 172 | 32.2% |
| Graduate / Professional | 36 | 6.7% |
| Total | 534 | 100.0% |
School Enrollment by Age by Funding Source in Benson
Out of a total of 534 students who are enrolled in schools in Benson, 53 (9.9%) attend a private institution, while the remaining 481 (90.1%) are enrolled in public schools. The age group of 5 to 9 year old has the highest likelihood of being enrolled in private schools, with 46 (17.8% in the age bracket) enrolled. Conversely, the age group of 3 to 4 year olds has the lowest likelihood of being enrolled in a private school, with 10 (100.0% in the age bracket) attending a public institution.
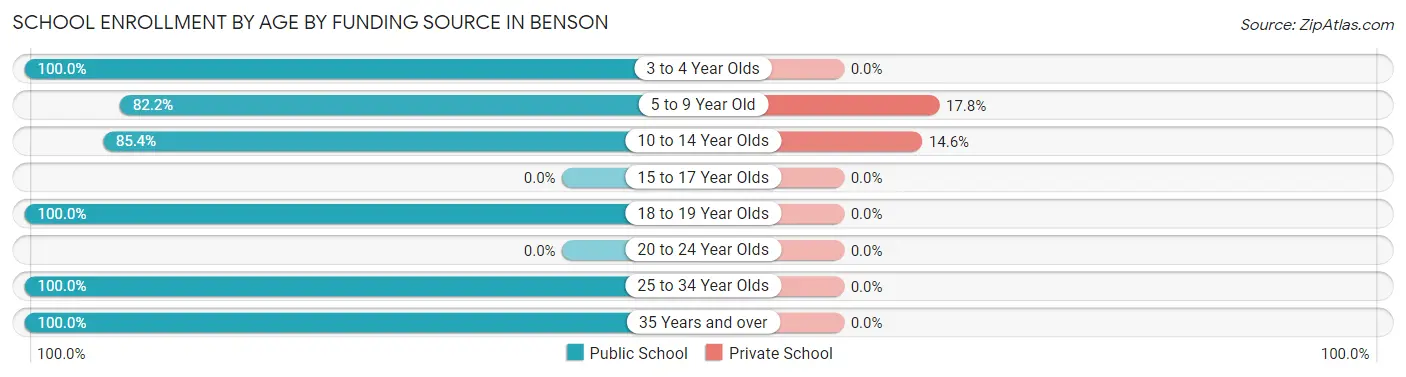
| Age Bracket | Public School | Private School |
| 3 to 4 Year Olds | 10 (100.0%) | 0 (0.0%) |
| 5 to 9 Year Old | 213 (82.2%) | 46 (17.8%) |
| 10 to 14 Year Olds | 41 (85.4%) | 7 (14.6%) |
| 15 to 17 Year Olds | 0 (0.0%) | 0 (0.0%) |
| 18 to 19 Year Olds | 9 (100.0%) | 0 (0.0%) |
| 20 to 24 Year Olds | 0 (0.0%) | 0 (0.0%) |
| 25 to 34 Year Olds | 184 (100.0%) | 0 (0.0%) |
| 35 Years and over | 24 (100.0%) | 0 (0.0%) |
| Total | 481 (90.1%) | 53 (9.9%) |
Educational Attainment by Field of Study in Benson
Business (184 | 24.1%), science & technology (131 | 17.2%), education (113 | 14.8%), psychology (90 | 11.8%), and social sciences (78 | 10.2%) are the most common fields of study among 762 individuals in Benson who have obtained a bachelor's degree or higher.
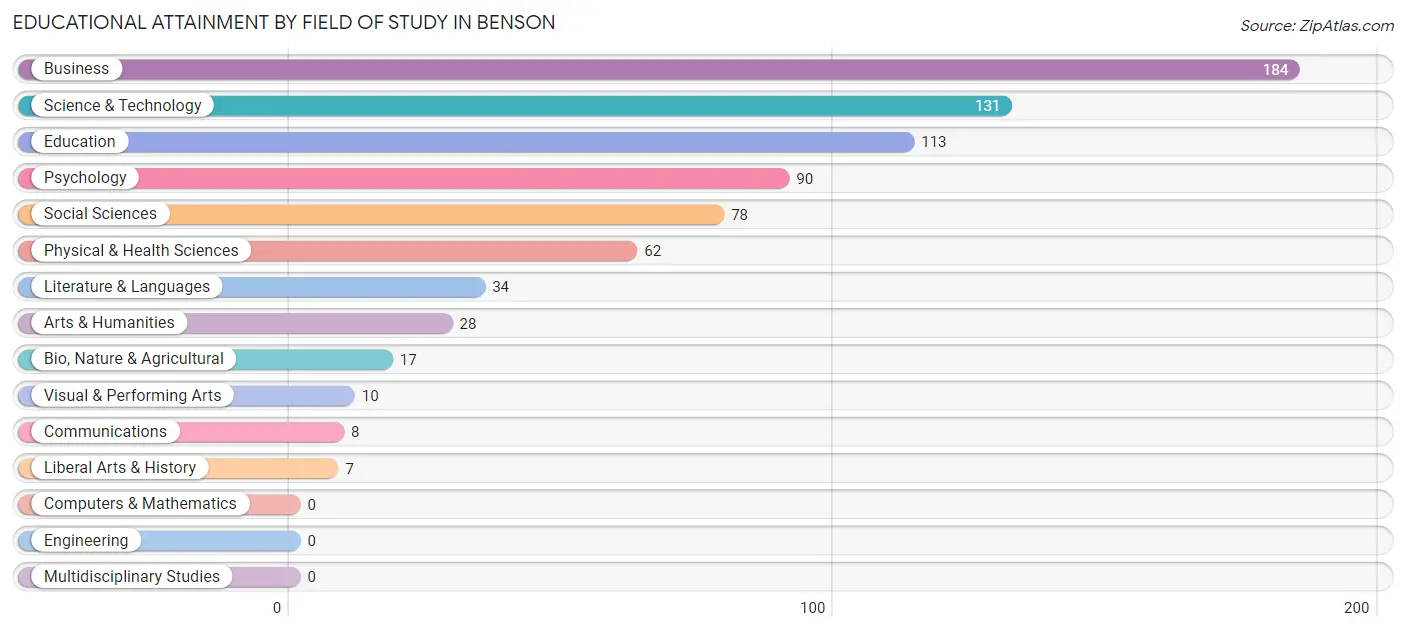
| Field of Study | # Graduates | % Graduates |
| Computers & Mathematics | 0 | 0.0% |
| Bio, Nature & Agricultural | 17 | 2.2% |
| Physical & Health Sciences | 62 | 8.1% |
| Psychology | 90 | 11.8% |
| Social Sciences | 78 | 10.2% |
| Engineering | 0 | 0.0% |
| Multidisciplinary Studies | 0 | 0.0% |
| Science & Technology | 131 | 17.2% |
| Business | 184 | 24.1% |
| Education | 113 | 14.8% |
| Literature & Languages | 34 | 4.5% |
| Liberal Arts & History | 7 | 0.9% |
| Visual & Performing Arts | 10 | 1.3% |
| Communications | 8 | 1.1% |
| Arts & Humanities | 28 | 3.7% |
| Total | 762 | 100.0% |
Transportation & Commute in Benson
Vehicle Availability by Sex in Benson
The most prevalent vehicle ownership categories in Benson are males with 2 vehicles (247, accounting for 42.7%) and females with 2 vehicles (489, making up 21.8%).
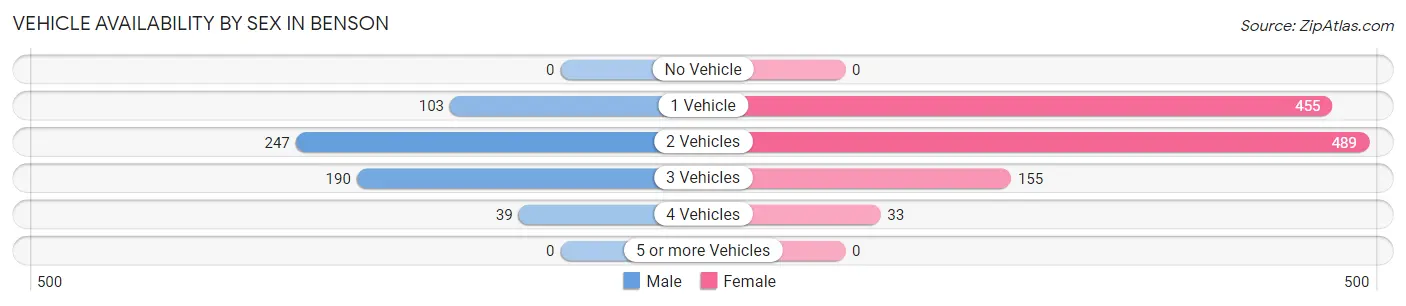
| Vehicles Available | Male | Female |
| No Vehicle | 0 (0.0%) | 0 (0.0%) |
| 1 Vehicle | 103 (17.8%) | 455 (40.2%) |
| 2 Vehicles | 247 (42.7%) | 489 (43.2%) |
| 3 Vehicles | 190 (32.8%) | 155 (13.7%) |
| 4 Vehicles | 39 (6.7%) | 33 (2.9%) |
| 5 or more Vehicles | 0 (0.0%) | 0 (0.0%) |
| Total | 579 (100.0%) | 1,132 (100.0%) |
Commute Time in Benson
The most frequently occuring commute durations in Benson are 15 to 19 minutes (289 commuters, 20.3%), 20 to 24 minutes (188 commuters, 13.2%), and 5 to 9 minutes (186 commuters, 13.1%).
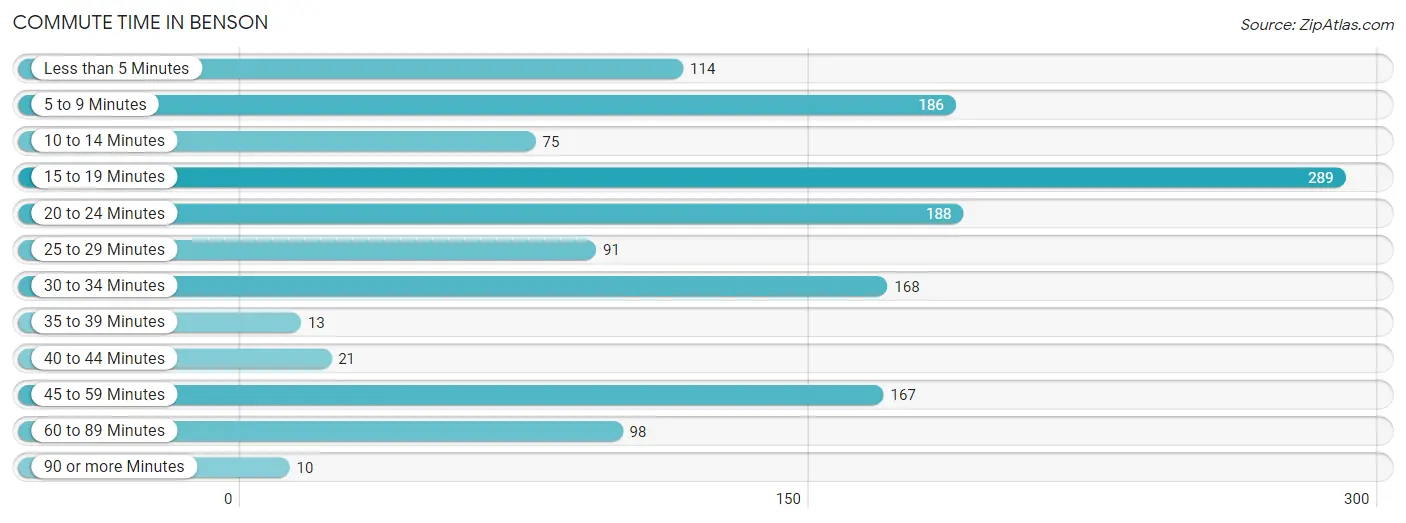
| Commute Time | # Commuters | % Commuters |
| Less than 5 Minutes | 114 | 8.0% |
| 5 to 9 Minutes | 186 | 13.1% |
| 10 to 14 Minutes | 75 | 5.3% |
| 15 to 19 Minutes | 289 | 20.3% |
| 20 to 24 Minutes | 188 | 13.2% |
| 25 to 29 Minutes | 91 | 6.4% |
| 30 to 34 Minutes | 168 | 11.8% |
| 35 to 39 Minutes | 13 | 0.9% |
| 40 to 44 Minutes | 21 | 1.5% |
| 45 to 59 Minutes | 167 | 11.8% |
| 60 to 89 Minutes | 98 | 6.9% |
| 90 or more Minutes | 10 | 0.7% |
Commute Time by Sex in Benson
The most common commute times in Benson are 45 to 59 minutes (134 commuters, 26.5%) for males and 15 to 19 minutes (242 commuters, 26.5%) for females.
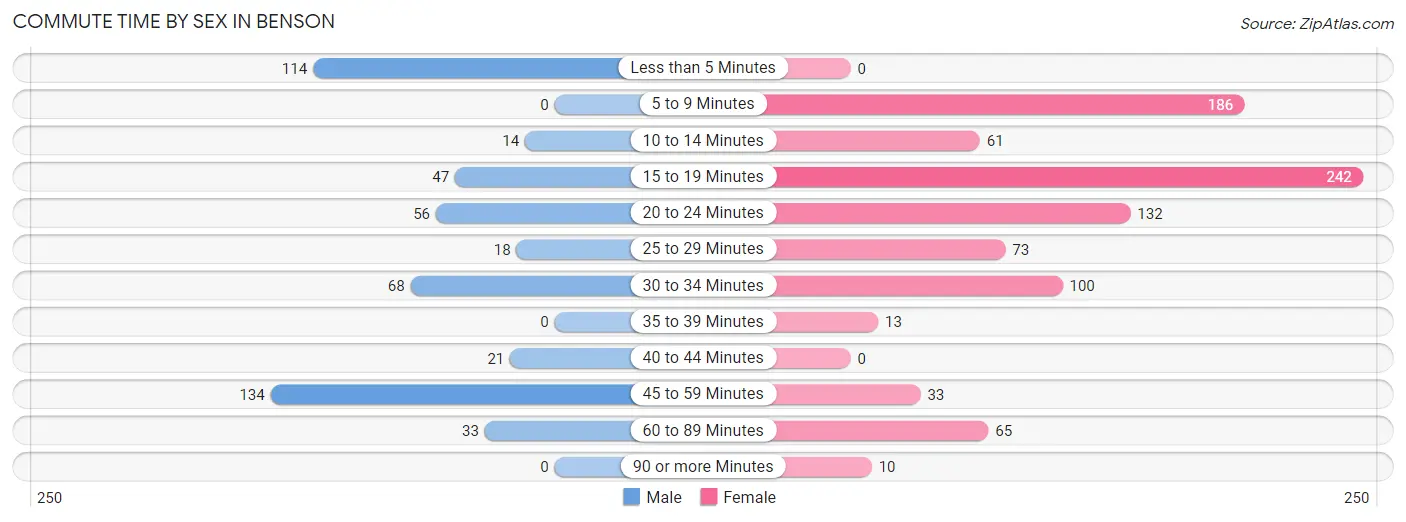
| Commute Time | Male | Female |
| Less than 5 Minutes | 114 (22.6%) | 0 (0.0%) |
| 5 to 9 Minutes | 0 (0.0%) | 186 (20.3%) |
| 10 to 14 Minutes | 14 (2.8%) | 61 (6.7%) |
| 15 to 19 Minutes | 47 (9.3%) | 242 (26.5%) |
| 20 to 24 Minutes | 56 (11.1%) | 132 (14.4%) |
| 25 to 29 Minutes | 18 (3.6%) | 73 (8.0%) |
| 30 to 34 Minutes | 68 (13.5%) | 100 (10.9%) |
| 35 to 39 Minutes | 0 (0.0%) | 13 (1.4%) |
| 40 to 44 Minutes | 21 (4.2%) | 0 (0.0%) |
| 45 to 59 Minutes | 134 (26.5%) | 33 (3.6%) |
| 60 to 89 Minutes | 33 (6.5%) | 65 (7.1%) |
| 90 or more Minutes | 0 (0.0%) | 10 (1.1%) |
Time of Departure to Work by Sex in Benson
The most frequent times of departure to work in Benson are 6:00 AM to 6:29 AM (126, 24.9%) for males and 8:00 AM to 8:29 AM (209, 22.8%) for females.
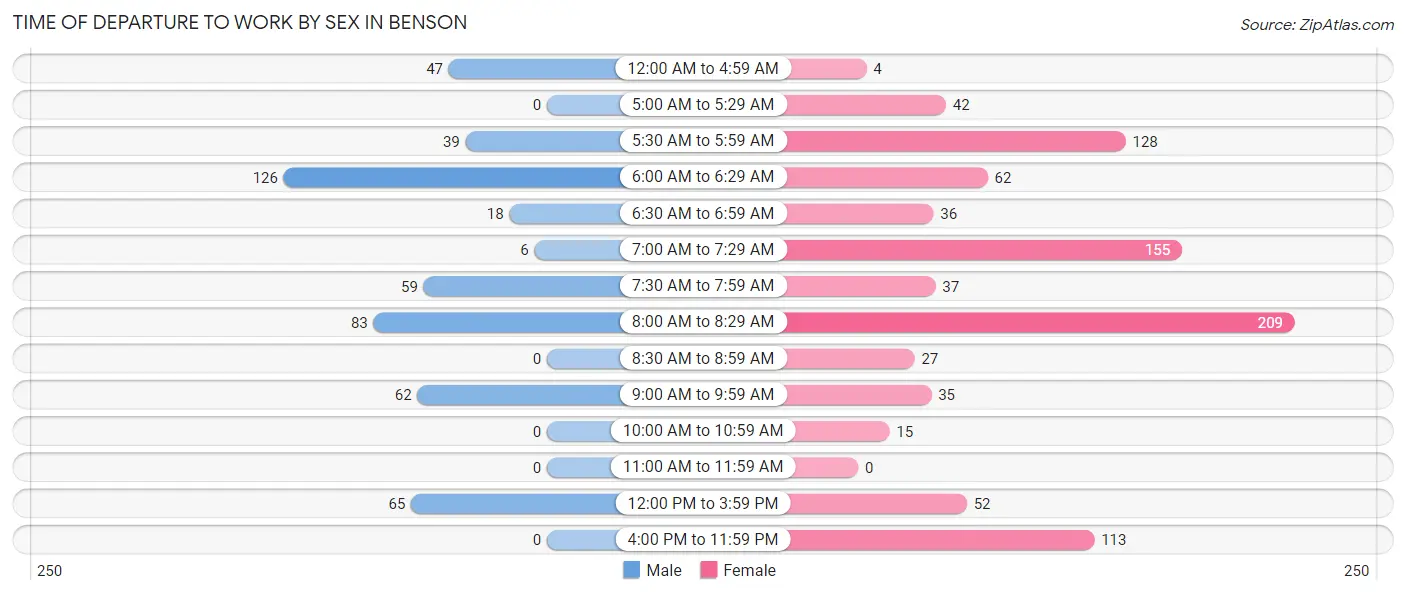
| Time of Departure | Male | Female |
| 12:00 AM to 4:59 AM | 47 (9.3%) | 4 (0.4%) |
| 5:00 AM to 5:29 AM | 0 (0.0%) | 42 (4.6%) |
| 5:30 AM to 5:59 AM | 39 (7.7%) | 128 (14.0%) |
| 6:00 AM to 6:29 AM | 126 (24.9%) | 62 (6.8%) |
| 6:30 AM to 6:59 AM | 18 (3.6%) | 36 (3.9%) |
| 7:00 AM to 7:29 AM | 6 (1.2%) | 155 (16.9%) |
| 7:30 AM to 7:59 AM | 59 (11.7%) | 37 (4.0%) |
| 8:00 AM to 8:29 AM | 83 (16.4%) | 209 (22.8%) |
| 8:30 AM to 8:59 AM | 0 (0.0%) | 27 (2.9%) |
| 9:00 AM to 9:59 AM | 62 (12.3%) | 35 (3.8%) |
| 10:00 AM to 10:59 AM | 0 (0.0%) | 15 (1.6%) |
| 11:00 AM to 11:59 AM | 0 (0.0%) | 0 (0.0%) |
| 12:00 PM to 3:59 PM | 65 (12.9%) | 52 (5.7%) |
| 4:00 PM to 11:59 PM | 0 (0.0%) | 113 (12.3%) |
| Total | 505 (100.0%) | 915 (100.0%) |
Housing Occupancy in Benson
Occupancy by Ownership in Benson
Of the total 1,522 dwellings in Benson, owner-occupied units account for 725 (47.6%), while renter-occupied units make up 797 (52.4%).
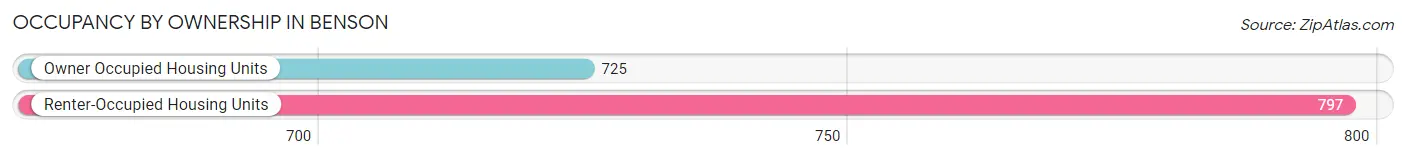
| Occupancy | # Housing Units | % Housing Units |
| Owner Occupied Housing Units | 725 | 47.6% |
| Renter-Occupied Housing Units | 797 | 52.4% |
| Total Occupied Housing Units | 1,522 | 100.0% |
Occupancy by Household Size in Benson
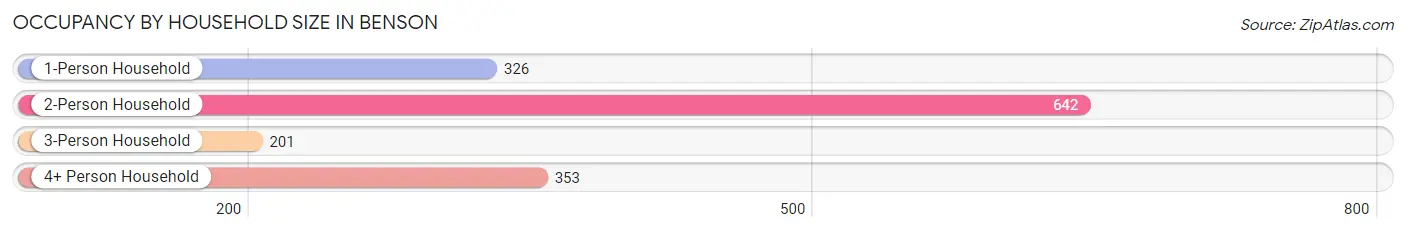
| Household Size | # Housing Units | % Housing Units |
| 1-Person Household | 326 | 21.4% |
| 2-Person Household | 642 | 42.2% |
| 3-Person Household | 201 | 13.2% |
| 4+ Person Household | 353 | 23.2% |
| Total Housing Units | 1,522 | 100.0% |
Occupancy by Ownership by Household Size in Benson
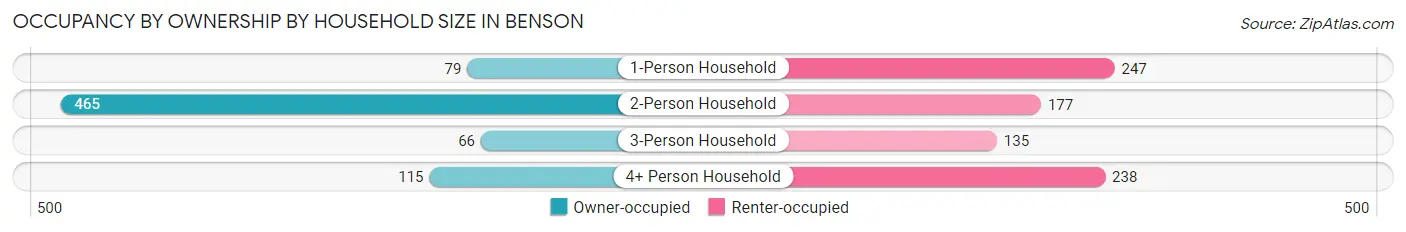
| Household Size | Owner-occupied | Renter-occupied |
| 1-Person Household | 79 (24.2%) | 247 (75.8%) |
| 2-Person Household | 465 (72.4%) | 177 (27.6%) |
| 3-Person Household | 66 (32.8%) | 135 (67.2%) |
| 4+ Person Household | 115 (32.6%) | 238 (67.4%) |
| Total Housing Units | 725 (47.6%) | 797 (52.4%) |
Occupancy by Educational Attainment in Benson
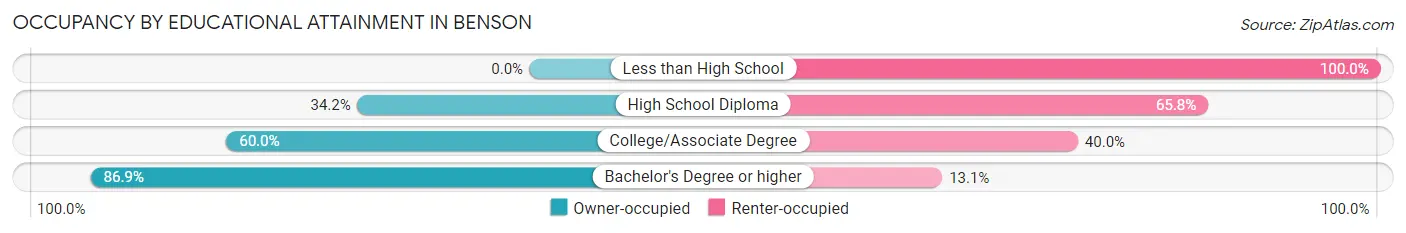
| Household Size | Owner-occupied | Renter-occupied |
| Less than High School | 0 (0.0%) | 334 (100.0%) |
| High School Diploma | 120 (34.2%) | 231 (65.8%) |
| College/Associate Degree | 273 (60.0%) | 182 (40.0%) |
| Bachelor's Degree or higher | 332 (86.9%) | 50 (13.1%) |
Occupancy by Age of Householder in Benson
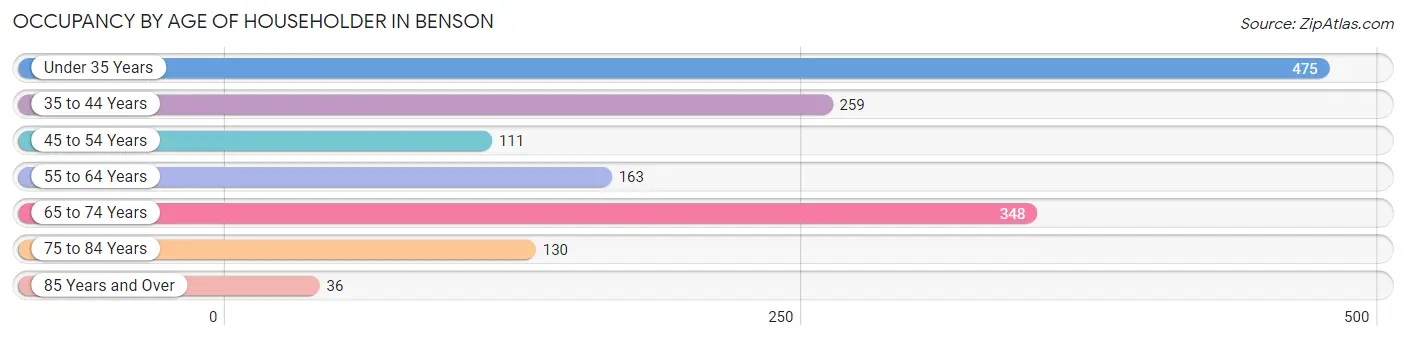
| Age Bracket | # Households | % Households |
| Under 35 Years | 475 | 31.2% |
| 35 to 44 Years | 259 | 17.0% |
| 45 to 54 Years | 111 | 7.3% |
| 55 to 64 Years | 163 | 10.7% |
| 65 to 74 Years | 348 | 22.9% |
| 75 to 84 Years | 130 | 8.5% |
| 85 Years and Over | 36 | 2.4% |
| Total | 1,522 | 100.0% |
Housing Finances in Benson
Median Income by Occupancy in Benson
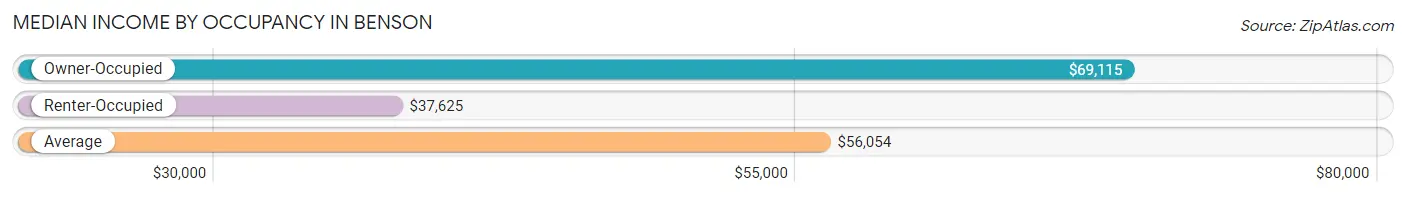
| Occupancy Type | # Households | Median Income |
| Owner-Occupied | 725 (47.6%) | $69,115 |
| Renter-Occupied | 797 (52.4%) | $37,625 |
| Average | 1,522 (100.0%) | $56,054 |
Occupancy by Householder Income Bracket in Benson
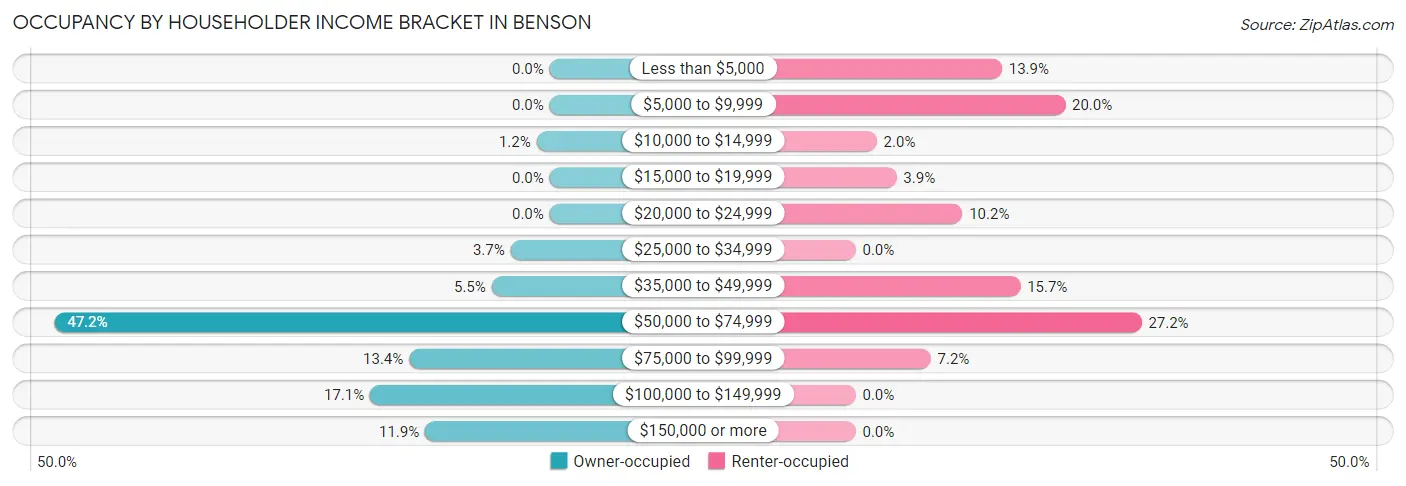
| Income Bracket | Owner-occupied | Renter-occupied |
| Less than $5,000 | 0 (0.0%) | 111 (13.9%) |
| $5,000 to $9,999 | 0 (0.0%) | 159 (20.0%) |
| $10,000 to $14,999 | 9 (1.2%) | 16 (2.0%) |
| $15,000 to $19,999 | 0 (0.0%) | 31 (3.9%) |
| $20,000 to $24,999 | 0 (0.0%) | 81 (10.2%) |
| $25,000 to $34,999 | 27 (3.7%) | 0 (0.0%) |
| $35,000 to $49,999 | 40 (5.5%) | 125 (15.7%) |
| $50,000 to $74,999 | 342 (47.2%) | 217 (27.2%) |
| $75,000 to $99,999 | 97 (13.4%) | 57 (7.1%) |
| $100,000 to $149,999 | 124 (17.1%) | 0 (0.0%) |
| $150,000 or more | 86 (11.9%) | 0 (0.0%) |
| Total | 725 (100.0%) | 797 (100.0%) |
Monthly Housing Cost Tiers in Benson
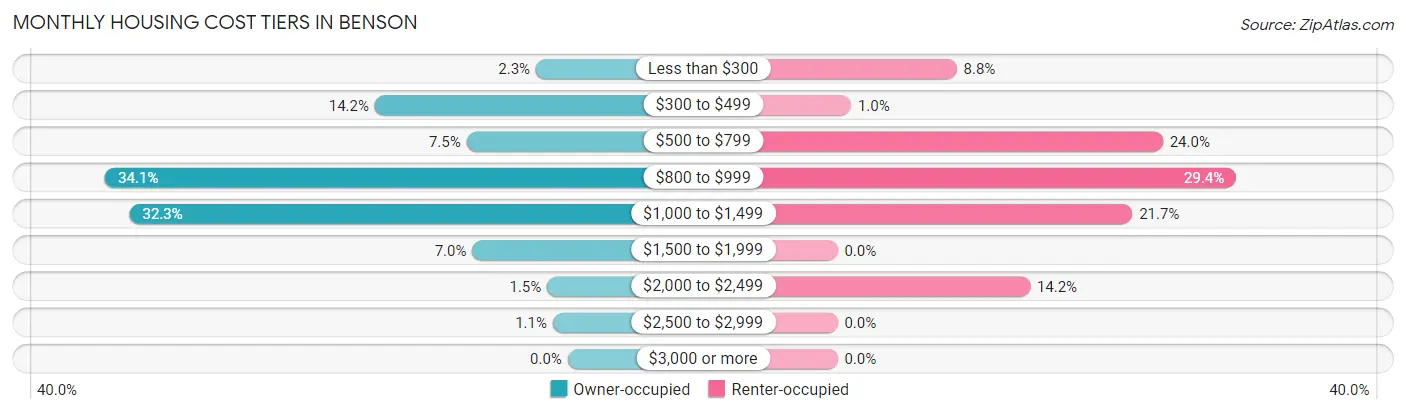
| Monthly Cost | Owner-occupied | Renter-occupied |
| Less than $300 | 17 (2.3%) | 70 (8.8%) |
| $300 to $499 | 103 (14.2%) | 8 (1.0%) |
| $500 to $799 | 54 (7.4%) | 191 (24.0%) |
| $800 to $999 | 247 (34.1%) | 234 (29.4%) |
| $1,000 to $1,499 | 234 (32.3%) | 173 (21.7%) |
| $1,500 to $1,999 | 51 (7.0%) | 0 (0.0%) |
| $2,000 to $2,499 | 11 (1.5%) | 113 (14.2%) |
| $2,500 to $2,999 | 8 (1.1%) | 0 (0.0%) |
| $3,000 or more | 0 (0.0%) | 0 (0.0%) |
| Total | 725 (100.0%) | 797 (100.0%) |
Physical Housing Characteristics in Benson
Housing Structures in Benson
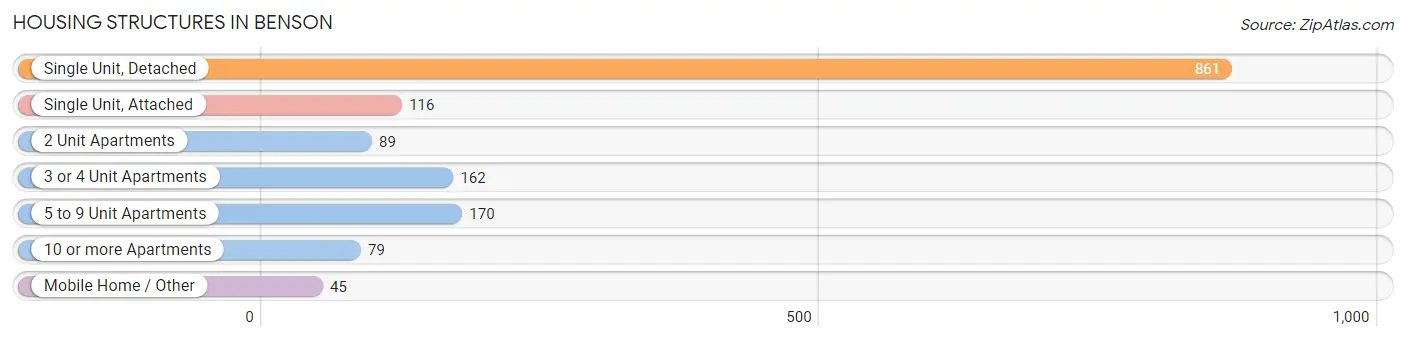
| Structure Type | # Housing Units | % Housing Units |
| Single Unit, Detached | 861 | 56.6% |
| Single Unit, Attached | 116 | 7.6% |
| 2 Unit Apartments | 89 | 5.9% |
| 3 or 4 Unit Apartments | 162 | 10.6% |
| 5 to 9 Unit Apartments | 170 | 11.2% |
| 10 or more Apartments | 79 | 5.2% |
| Mobile Home / Other | 45 | 3.0% |
| Total | 1,522 | 100.0% |
Housing Structures by Occupancy in Benson
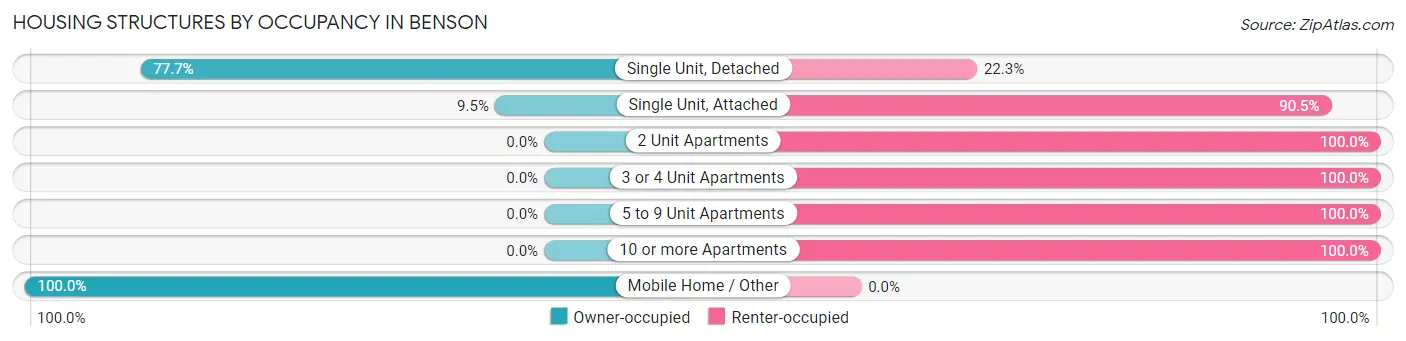
| Structure Type | Owner-occupied | Renter-occupied |
| Single Unit, Detached | 669 (77.7%) | 192 (22.3%) |
| Single Unit, Attached | 11 (9.5%) | 105 (90.5%) |
| 2 Unit Apartments | 0 (0.0%) | 89 (100.0%) |
| 3 or 4 Unit Apartments | 0 (0.0%) | 162 (100.0%) |
| 5 to 9 Unit Apartments | 0 (0.0%) | 170 (100.0%) |
| 10 or more Apartments | 0 (0.0%) | 79 (100.0%) |
| Mobile Home / Other | 45 (100.0%) | 0 (0.0%) |
| Total | 725 (47.6%) | 797 (52.4%) |
Housing Structures by Number of Rooms in Benson
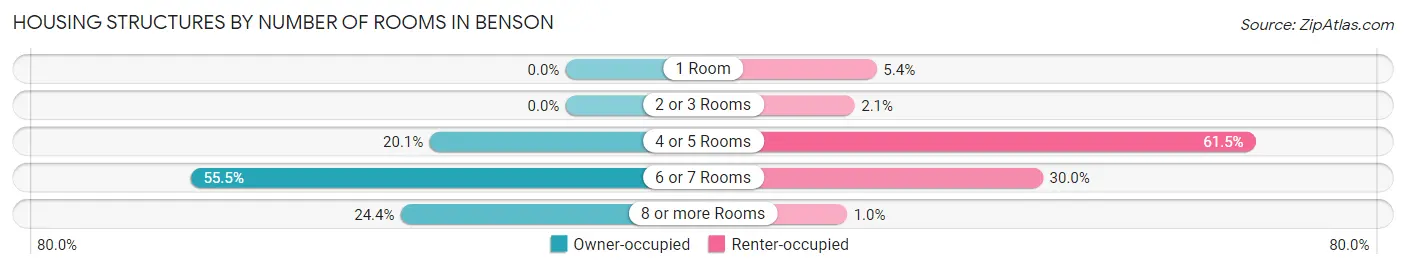
| Number of Rooms | Owner-occupied | Renter-occupied |
| 1 Room | 0 (0.0%) | 43 (5.4%) |
| 2 or 3 Rooms | 0 (0.0%) | 17 (2.1%) |
| 4 or 5 Rooms | 146 (20.1%) | 490 (61.5%) |
| 6 or 7 Rooms | 402 (55.4%) | 239 (30.0%) |
| 8 or more Rooms | 177 (24.4%) | 8 (1.0%) |
| Total | 725 (100.0%) | 797 (100.0%) |
Housing Structure by Heating Type in Benson
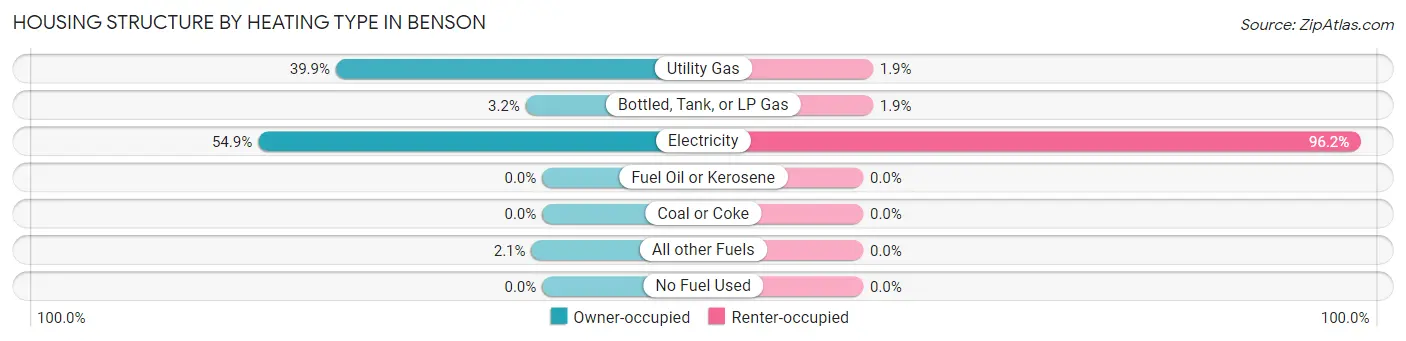
| Heating Type | Owner-occupied | Renter-occupied |
| Utility Gas | 289 (39.9%) | 15 (1.9%) |
| Bottled, Tank, or LP Gas | 23 (3.2%) | 15 (1.9%) |
| Electricity | 398 (54.9%) | 767 (96.2%) |
| Fuel Oil or Kerosene | 0 (0.0%) | 0 (0.0%) |
| Coal or Coke | 0 (0.0%) | 0 (0.0%) |
| All other Fuels | 15 (2.1%) | 0 (0.0%) |
| No Fuel Used | 0 (0.0%) | 0 (0.0%) |
| Total | 725 (100.0%) | 797 (100.0%) |
Household Vehicle Usage in Benson
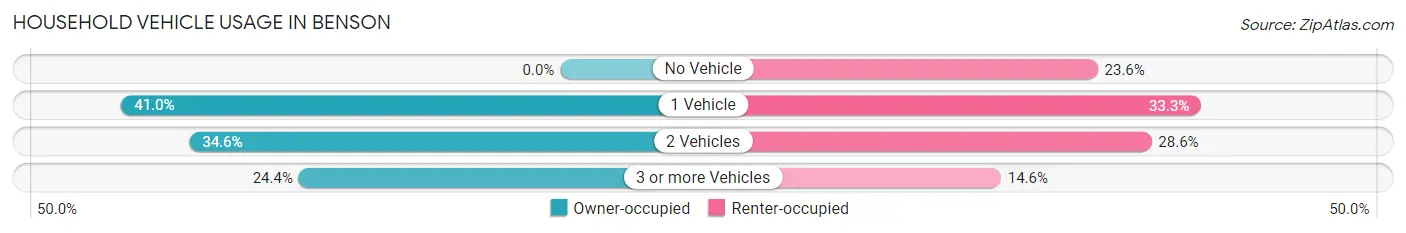
| Vehicles per Household | Owner-occupied | Renter-occupied |
| No Vehicle | 0 (0.0%) | 188 (23.6%) |
| 1 Vehicle | 297 (41.0%) | 265 (33.3%) |
| 2 Vehicles | 251 (34.6%) | 228 (28.6%) |
| 3 or more Vehicles | 177 (24.4%) | 116 (14.5%) |
| Total | 725 (100.0%) | 797 (100.0%) |
Real Estate & Mortgages in Benson
Real Estate and Mortgage Overview in Benson
| Characteristic | Without Mortgage | With Mortgage |
| Housing Units | 199 | 526 |
| Median Property Value | - | - |
| Median Household Income | $79,972 | $64 |
| Monthly Housing Costs | $479 | $0 |
| Real Estate Taxes | $1,696 | $71 |
Property Value by Mortgage Status in Benson
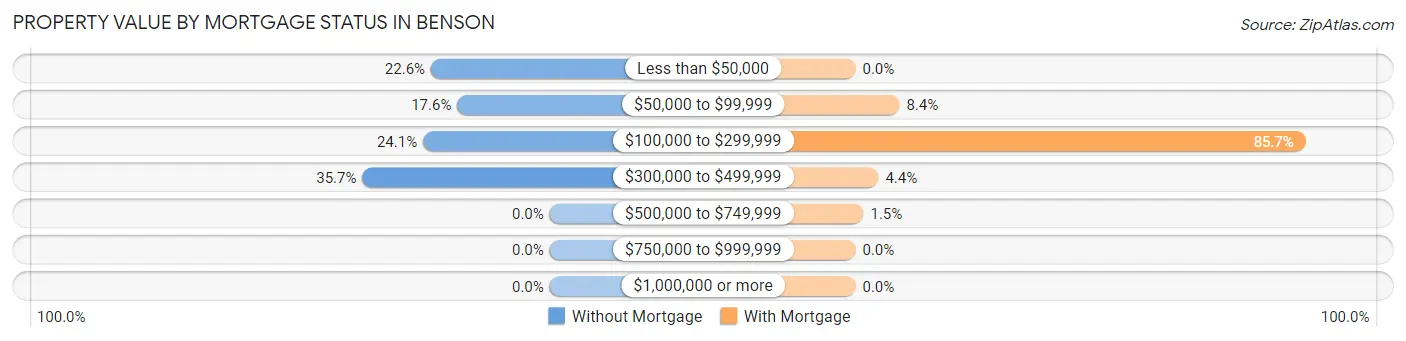
| Property Value | Without Mortgage | With Mortgage |
| Less than $50,000 | 45 (22.6%) | 0 (0.0%) |
| $50,000 to $99,999 | 35 (17.6%) | 44 (8.4%) |
| $100,000 to $299,999 | 48 (24.1%) | 451 (85.7%) |
| $300,000 to $499,999 | 71 (35.7%) | 23 (4.4%) |
| $500,000 to $749,999 | 0 (0.0%) | 8 (1.5%) |
| $750,000 to $999,999 | 0 (0.0%) | 0 (0.0%) |
| $1,000,000 or more | 0 (0.0%) | 0 (0.0%) |
| Total | 199 (100.0%) | 526 (100.0%) |
Household Income by Mortgage Status in Benson
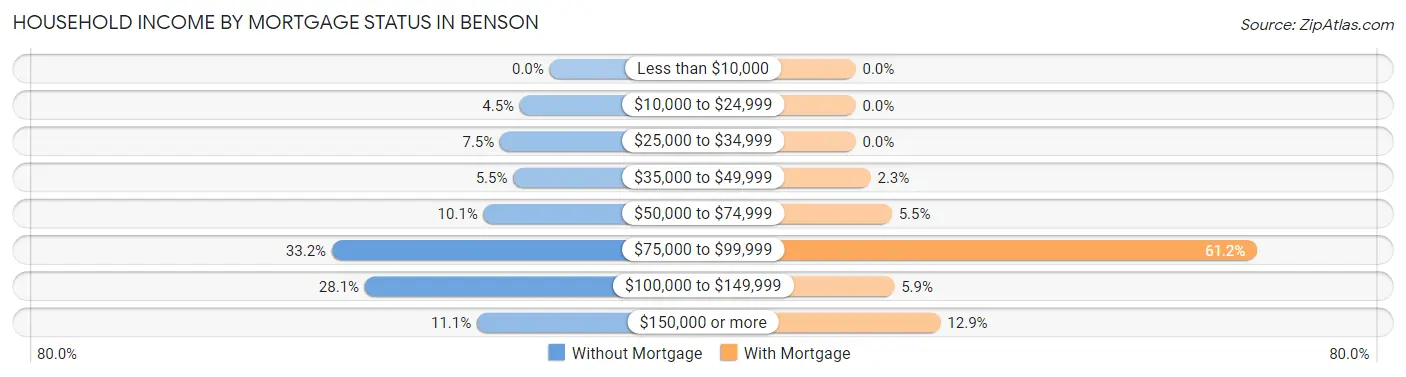
| Household Income | Without Mortgage | With Mortgage |
| Less than $10,000 | 0 (0.0%) | 0 (0.0%) |
| $10,000 to $24,999 | 9 (4.5%) | 0 (0.0%) |
| $25,000 to $34,999 | 15 (7.5%) | 0 (0.0%) |
| $35,000 to $49,999 | 11 (5.5%) | 12 (2.3%) |
| $50,000 to $74,999 | 20 (10.1%) | 29 (5.5%) |
| $75,000 to $99,999 | 66 (33.2%) | 322 (61.2%) |
| $100,000 to $149,999 | 56 (28.1%) | 31 (5.9%) |
| $150,000 or more | 22 (11.1%) | 68 (12.9%) |
| Total | 199 (100.0%) | 526 (100.0%) |
Property Value to Household Income Ratio in Benson
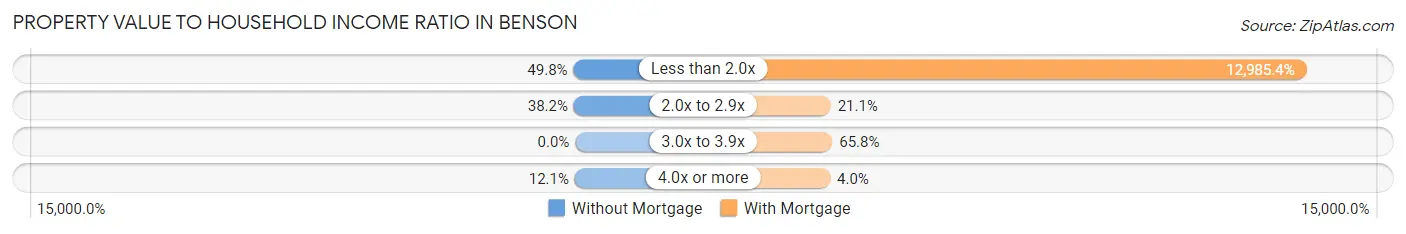
| Value-to-Income Ratio | Without Mortgage | With Mortgage |
| Less than 2.0x | 99 (49.7%) | 68,303 (12,985.4%) |
| 2.0x to 2.9x | 76 (38.2%) | 111 (21.1%) |
| 3.0x to 3.9x | 0 (0.0%) | 346 (65.8%) |
| 4.0x or more | 24 (12.1%) | 21 (4.0%) |
| Total | 199 (100.0%) | 526 (100.0%) |
Real Estate Taxes by Mortgage Status in Benson
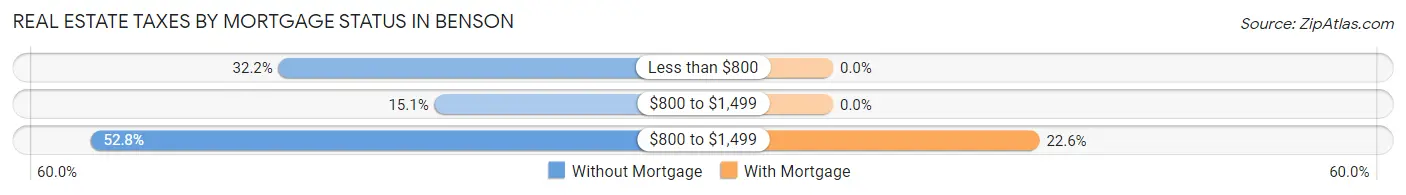
| Property Taxes | Without Mortgage | With Mortgage |
| Less than $800 | 64 (32.2%) | 0 (0.0%) |
| $800 to $1,499 | 30 (15.1%) | 0 (0.0%) |
| $800 to $1,499 | 105 (52.8%) | 119 (22.6%) |
| Total | 199 (100.0%) | 526 (100.0%) |
Health & Disability in Benson
Health Insurance Coverage by Age in Benson
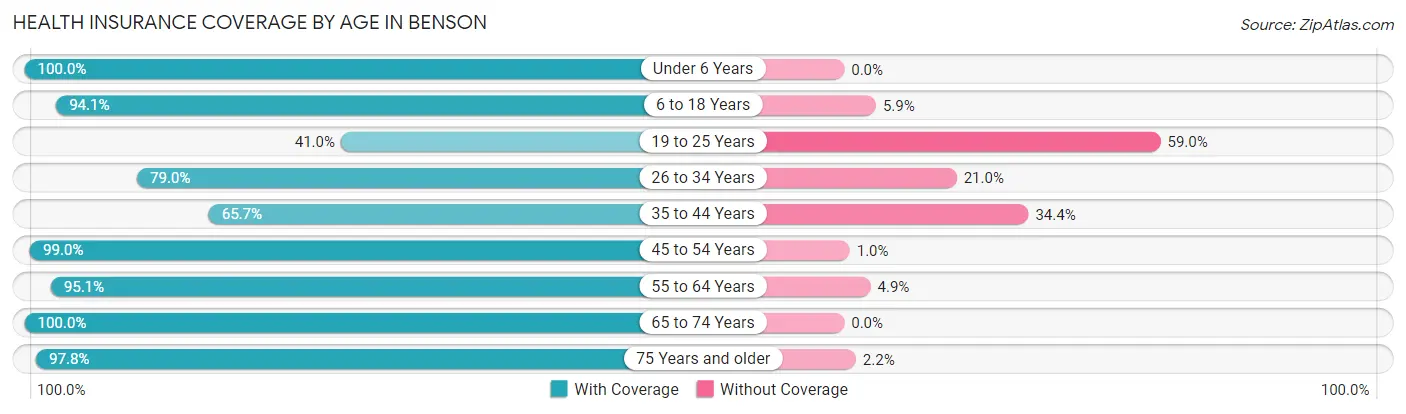
| Age Bracket | With Coverage | Without Coverage |
| Under 6 Years | 489 (100.0%) | 0 (0.0%) |
| 6 to 18 Years | 653 (94.1%) | 41 (5.9%) |
| 19 to 25 Years | 64 (41.0%) | 92 (59.0%) |
| 26 to 34 Years | 569 (79.0%) | 151 (21.0%) |
| 35 to 44 Years | 216 (65.6%) | 113 (34.4%) |
| 45 to 54 Years | 390 (99.0%) | 4 (1.0%) |
| 55 to 64 Years | 194 (95.1%) | 10 (4.9%) |
| 65 to 74 Years | 690 (100.0%) | 0 (0.0%) |
| 75 Years and older | 227 (97.8%) | 5 (2.2%) |
| Total | 3,492 (89.4%) | 416 (10.6%) |
Health Insurance Coverage by Citizenship Status in Benson
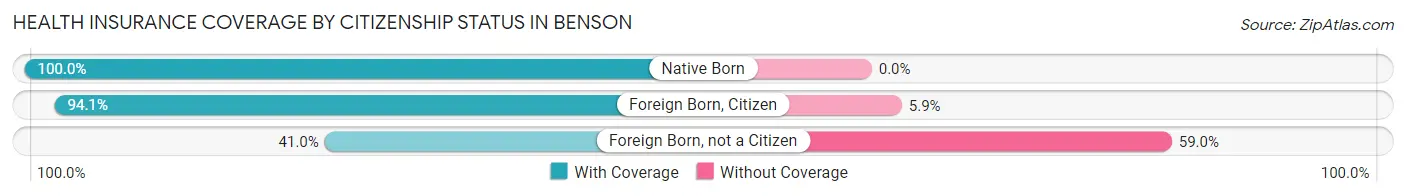
| Citizenship Status | With Coverage | Without Coverage |
| Native Born | 489 (100.0%) | 0 (0.0%) |
| Foreign Born, Citizen | 653 (94.1%) | 41 (5.9%) |
| Foreign Born, not a Citizen | 64 (41.0%) | 92 (59.0%) |
Health Insurance Coverage by Household Income in Benson
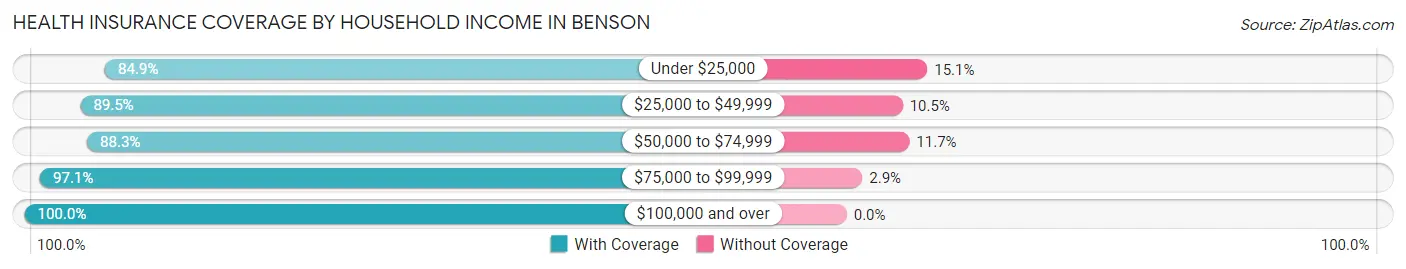
| Household Income | With Coverage | Without Coverage |
| Under $25,000 | 754 (84.9%) | 134 (15.1%) |
| $25,000 to $49,999 | 342 (89.5%) | 40 (10.5%) |
| $50,000 to $74,999 | 1,648 (88.3%) | 219 (11.7%) |
| $75,000 to $99,999 | 334 (97.1%) | 10 (2.9%) |
| $100,000 and over | 401 (100.0%) | 0 (0.0%) |
Public vs Private Health Insurance Coverage by Age in Benson
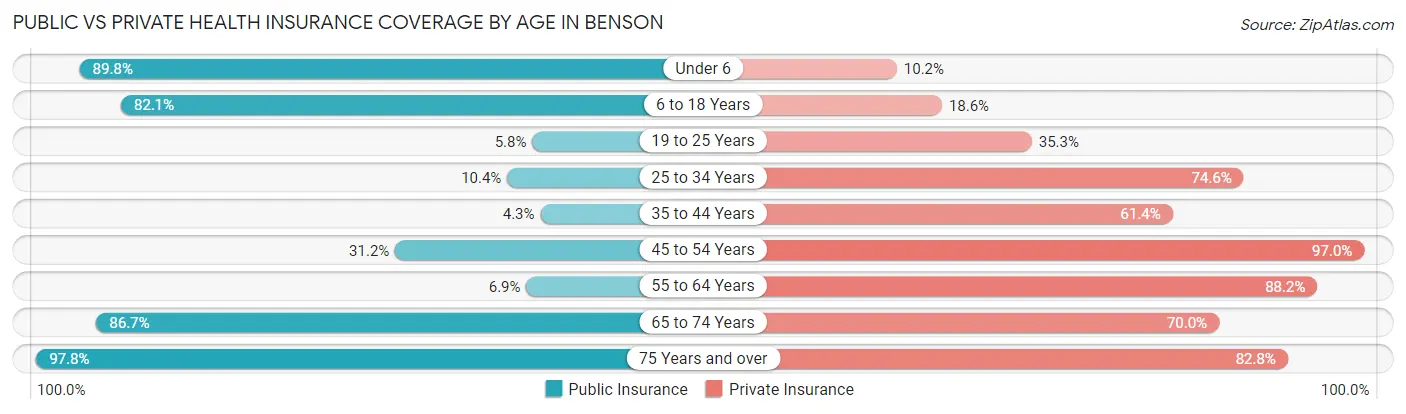
| Age Bracket | Public Insurance | Private Insurance |
| Under 6 | 439 (89.8%) | 50 (10.2%) |
| 6 to 18 Years | 570 (82.1%) | 129 (18.6%) |
| 19 to 25 Years | 9 (5.8%) | 55 (35.3%) |
| 25 to 34 Years | 75 (10.4%) | 537 (74.6%) |
| 35 to 44 Years | 14 (4.3%) | 202 (61.4%) |
| 45 to 54 Years | 123 (31.2%) | 382 (97.0%) |
| 55 to 64 Years | 14 (6.9%) | 180 (88.2%) |
| 65 to 74 Years | 598 (86.7%) | 483 (70.0%) |
| 75 Years and over | 227 (97.8%) | 192 (82.8%) |
| Total | 2,069 (52.9%) | 2,210 (56.6%) |
Disability Status by Sex by Age in Benson
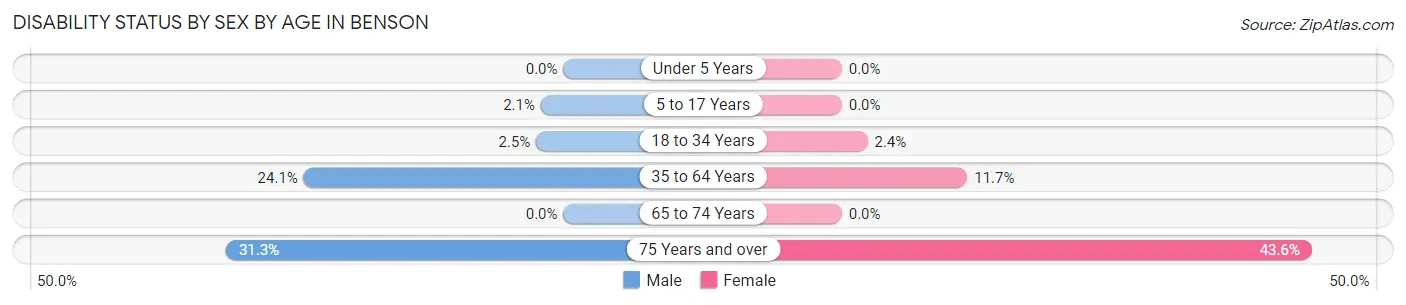
| Age Bracket | Male | Female |
| Under 5 Years | 0 (0.0%) | 0 (0.0%) |
| 5 to 17 Years | 9 (2.1%) | 0 (0.0%) |
| 18 to 34 Years | 12 (2.5%) | 11 (2.4%) |
| 35 to 64 Years | 60 (24.1%) | 79 (11.7%) |
| 65 to 74 Years | 0 (0.0%) | 0 (0.0%) |
| 75 Years and over | 31 (31.3%) | 58 (43.6%) |
Disability Class by Sex by Age in Benson
Disability Class: Hearing Difficulty
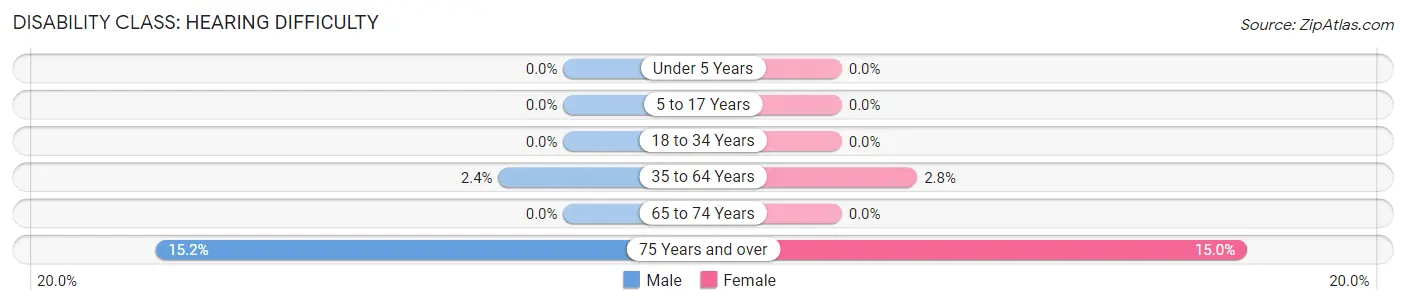
| Age Bracket | Male | Female |
| Under 5 Years | 0 (0.0%) | 0 (0.0%) |
| 5 to 17 Years | 0 (0.0%) | 0 (0.0%) |
| 18 to 34 Years | 0 (0.0%) | 0 (0.0%) |
| 35 to 64 Years | 6 (2.4%) | 19 (2.8%) |
| 65 to 74 Years | 0 (0.0%) | 0 (0.0%) |
| 75 Years and over | 15 (15.1%) | 20 (15.0%) |
Disability Class: Vision Difficulty
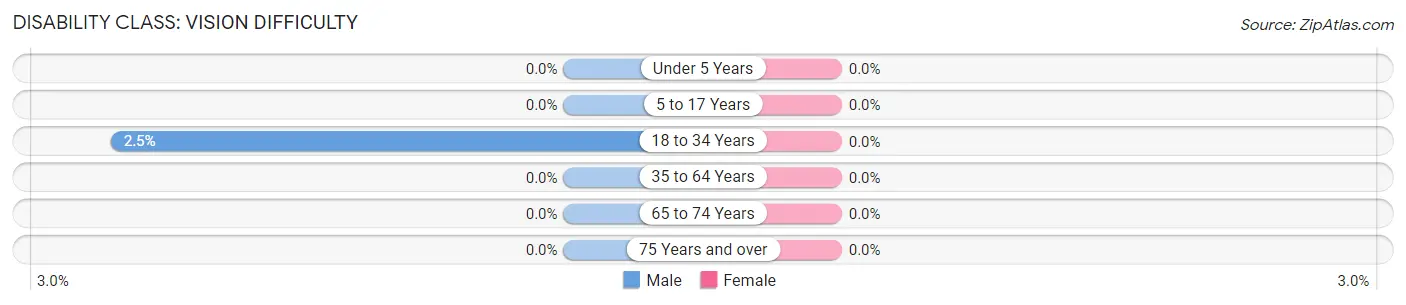
| Age Bracket | Male | Female |
| Under 5 Years | 0 (0.0%) | 0 (0.0%) |
| 5 to 17 Years | 0 (0.0%) | 0 (0.0%) |
| 18 to 34 Years | 12 (2.5%) | 0 (0.0%) |
| 35 to 64 Years | 0 (0.0%) | 0 (0.0%) |
| 65 to 74 Years | 0 (0.0%) | 0 (0.0%) |
| 75 Years and over | 0 (0.0%) | 0 (0.0%) |
Disability Class: Cognitive Difficulty
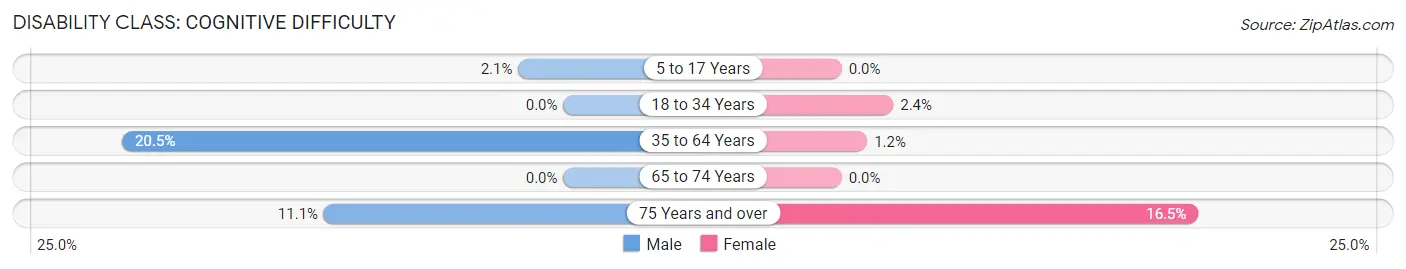
| Age Bracket | Male | Female |
| 5 to 17 Years | 9 (2.1%) | 0 (0.0%) |
| 18 to 34 Years | 0 (0.0%) | 11 (2.4%) |
| 35 to 64 Years | 51 (20.5%) | 8 (1.2%) |
| 65 to 74 Years | 0 (0.0%) | 0 (0.0%) |
| 75 Years and over | 11 (11.1%) | 22 (16.5%) |
Disability Class: Ambulatory Difficulty
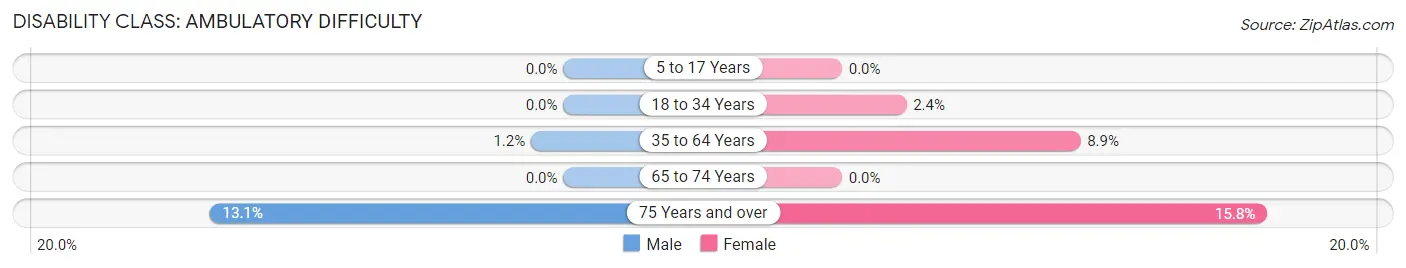
| Age Bracket | Male | Female |
| 5 to 17 Years | 0 (0.0%) | 0 (0.0%) |
| 18 to 34 Years | 0 (0.0%) | 11 (2.4%) |
| 35 to 64 Years | 3 (1.2%) | 60 (8.8%) |
| 65 to 74 Years | 0 (0.0%) | 0 (0.0%) |
| 75 Years and over | 13 (13.1%) | 21 (15.8%) |
Disability Class: Self-Care Difficulty
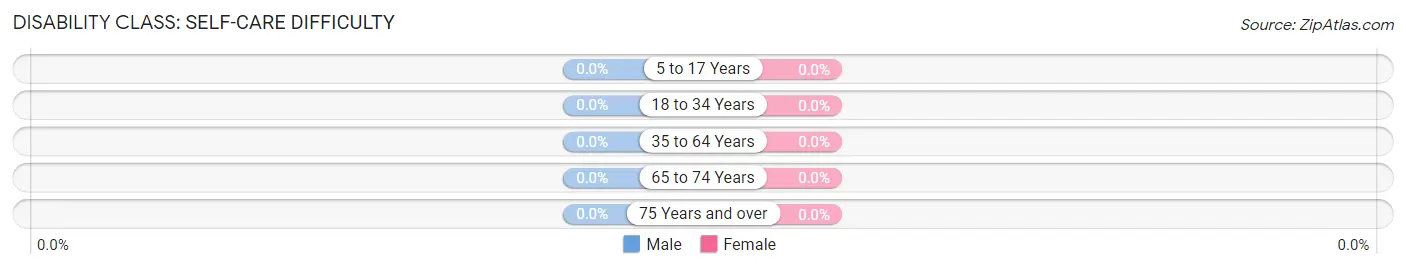
| Age Bracket | Male | Female |
| 5 to 17 Years | 0 (0.0%) | 0 (0.0%) |
| 18 to 34 Years | 0 (0.0%) | 0 (0.0%) |
| 35 to 64 Years | 0 (0.0%) | 0 (0.0%) |
| 65 to 74 Years | 0 (0.0%) | 0 (0.0%) |
| 75 Years and over | 0 (0.0%) | 0 (0.0%) |
Technology Access in Benson
Computing Device Access in Benson
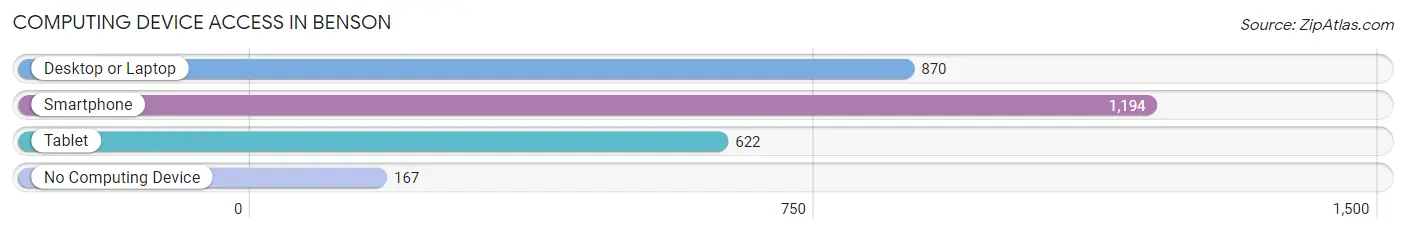
| Device Type | # Households | % Households |
| Desktop or Laptop | 870 | 57.2% |
| Smartphone | 1,194 | 78.4% |
| Tablet | 622 | 40.9% |
| No Computing Device | 167 | 11.0% |
| Total | 1,522 | 100.0% |
Internet Access in Benson
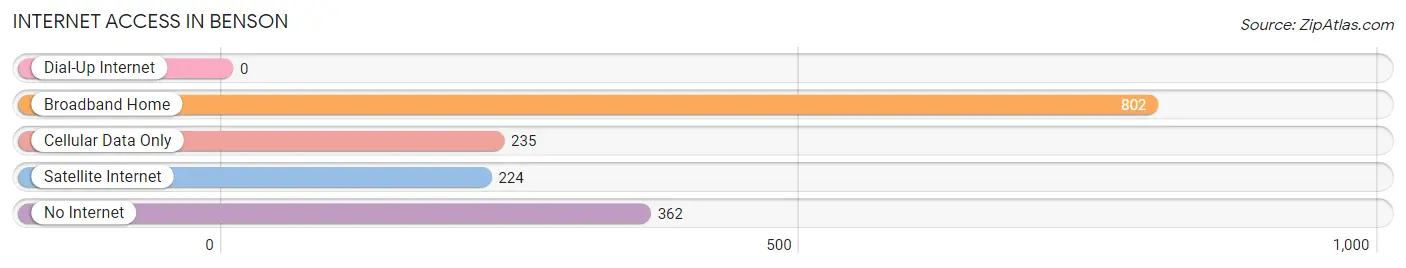
| Internet Type | # Households | % Households |
| Dial-Up Internet | 0 | 0.0% |
| Broadband Home | 802 | 52.7% |
| Cellular Data Only | 235 | 15.4% |
| Satellite Internet | 224 | 14.7% |
| No Internet | 362 | 23.8% |
| Total | 1,522 | 100.0% |
Benson Summary
Benson, North Carolina is a small town located in Johnston County, North Carolina. It is situated in the heart of the state, approximately 30 miles southeast of Raleigh. The town was founded in 1855 and has a population of approximately 3,500 people.
Geography
Benson is located in the Coastal Plain region of North Carolina. The town is situated on the banks of the Neuse River, which is the longest river in the state. The town is surrounded by rolling hills and farmland, and is located near the intersection of Interstate 95 and US Highway 301. The town is also located near the Neuse River State Park, which offers a variety of outdoor activities such as camping, fishing, and hiking.
Economy
Benson’s economy is largely based on agriculture and manufacturing. The town is home to several large farms, including tobacco, cotton, and soybean farms. Benson is also home to several manufacturing companies, including a furniture factory, a plastics factory, and a paper mill. The town is also home to several small businesses, including restaurants, retail stores, and service providers.
Demographics
As of the 2010 census, Benson had a population of 3,521 people. The racial makeup of the town was 79.3% White, 16.2% African American, 0.7% Native American, 0.7% Asian, 0.1% Pacific Islander, and 2.9% from other races. The median household income was $35,945, and the median family income was $41,945.
The town is served by the Johnston County School System, which includes Benson Elementary School, Benson Middle School, and Benson High School. The town is also home to several churches, including Benson Baptist Church, Benson United Methodist Church, and Benson Presbyterian Church.
Conclusion
Benson, North Carolina is a small town located in Johnston County, North Carolina. It is situated in the heart of the state, approximately 30 miles southeast of Raleigh. The town was founded in 1855 and has a population of approximately 3,500 people. Benson’s economy is largely based on agriculture and manufacturing, and the town is served by the Johnston County School System. The town is also home to several churches, and offers a variety of outdoor activities such as camping, fishing, and hiking.
Common Questions
What is Per Capita Income in Benson?
Per Capita income in Benson is $24,298.
What is the Median Family Income in Benson?
Median Family Income in Benson is $55,088.
What is the Median Household income in Benson?
Median Household Income in Benson is $56,054.
What is Income or Wage Gap in Benson?
Income or Wage Gap in Benson is 4.4%.
Women in Benson earn 95.6 cents for every dollar earned by a man.
What is Family Income Deficit in Benson?
Family Income Deficit in Benson is $12,711.
Families that are below poverty line in Benson earn $12,711 less on average than the poverty threshold level.
What is Inequality or Gini Index in Benson?
Inequality or Gini Index in Benson is 0.41.
What is the Total Population of Benson?
Total Population of Benson is 4,004.
What is the Total Male Population of Benson?
Total Male Population of Benson is 1,688.
What is the Total Female Population of Benson?
Total Female Population of Benson is 2,316.
What is the Ratio of Males per 100 Females in Benson?
There are 72.88 Males per 100 Females in Benson.
What is the Ratio of Females per 100 Males in Benson?
There are 137.20 Females per 100 Males in Benson.
What is the Median Population Age in Benson?
Median Population Age in Benson is 34.4 Years.
What is the Average Family Size in Benson
Average Family Size in Benson is 2.8 People.
What is the Average Household Size in Benson
Average Household Size in Benson is 2.5 People.
How Large is the Labor Force in Benson?
There are 1,770 People in the Labor Forcein in Benson.
What is the Percentage of People in the Labor Force in Benson?
61.4% of People are in the Labor Force in Benson.
What is the Unemployment Rate in Benson?
Unemployment Rate in Benson is 2.6%.