Raeford, NC Map & Demographics
Raeford Map
Raeford Overview
$23,217
PER CAPITA INCOME
$60,175
AVG FAMILY INCOME
$38,371
AVG HOUSEHOLD INCOME
0.48
INEQUALITY / GINI INDEX
4,570
TOTAL POPULATION
2,158
MALE POPULATION
2,412
FEMALE POPULATION
89.47
MALES / 100 FEMALES
111.77
FEMALES / 100 MALES
38.5
MEDIAN AGE
3.4
AVG FAMILY SIZE
2.4
AVG HOUSEHOLD SIZE
1,867
LABOR FORCE [ PEOPLE ]
51.0%
PERCENT IN LABOR FORCE
4.3%
UNEMPLOYMENT RATE
Raeford Zip Codes
Raeford Area Codes
Income in Raeford
Income Overview in Raeford
Per Capita Income in Raeford is $23,217, while median incomes of families and households are $60,175 and $38,371 respectively.
| Characteristic | Number | Measure |
| Per Capita Income | 4,570 | $23,217 |
| Median Family Income | 916 | $60,175 |
| Mean Family Income | 916 | $68,344 |
| Median Household Income | 1,767 | $38,371 |
| Mean Household Income | 1,767 | $53,017 |
| Income Deficit | 916 | $0 |
| Wage / Income Gap (%) | 4,570 | 0.00% |
| Wage / Income Gap ($) | 4,570 | 100.00¢ per $1 |
| Gini / Inequality Index | 4,570 | 0.48 |
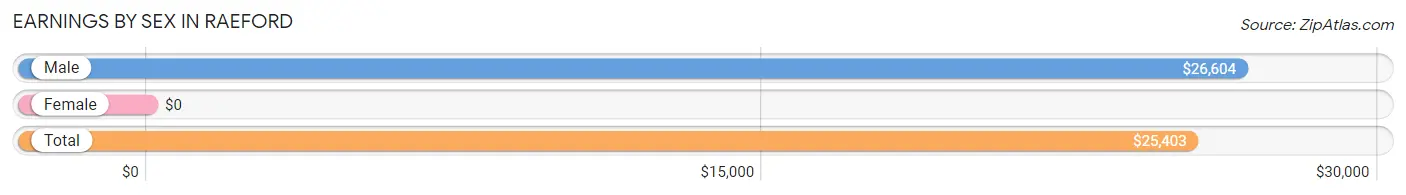
Earnings by Sex in Raeford
| Sex | Number | Average Earnings |
| Male | 972 (47.1%) | $26,604 |
| Female | 1,093 (52.9%) | $0 |
| Total | 2,065 (100.0%) | $25,403 |
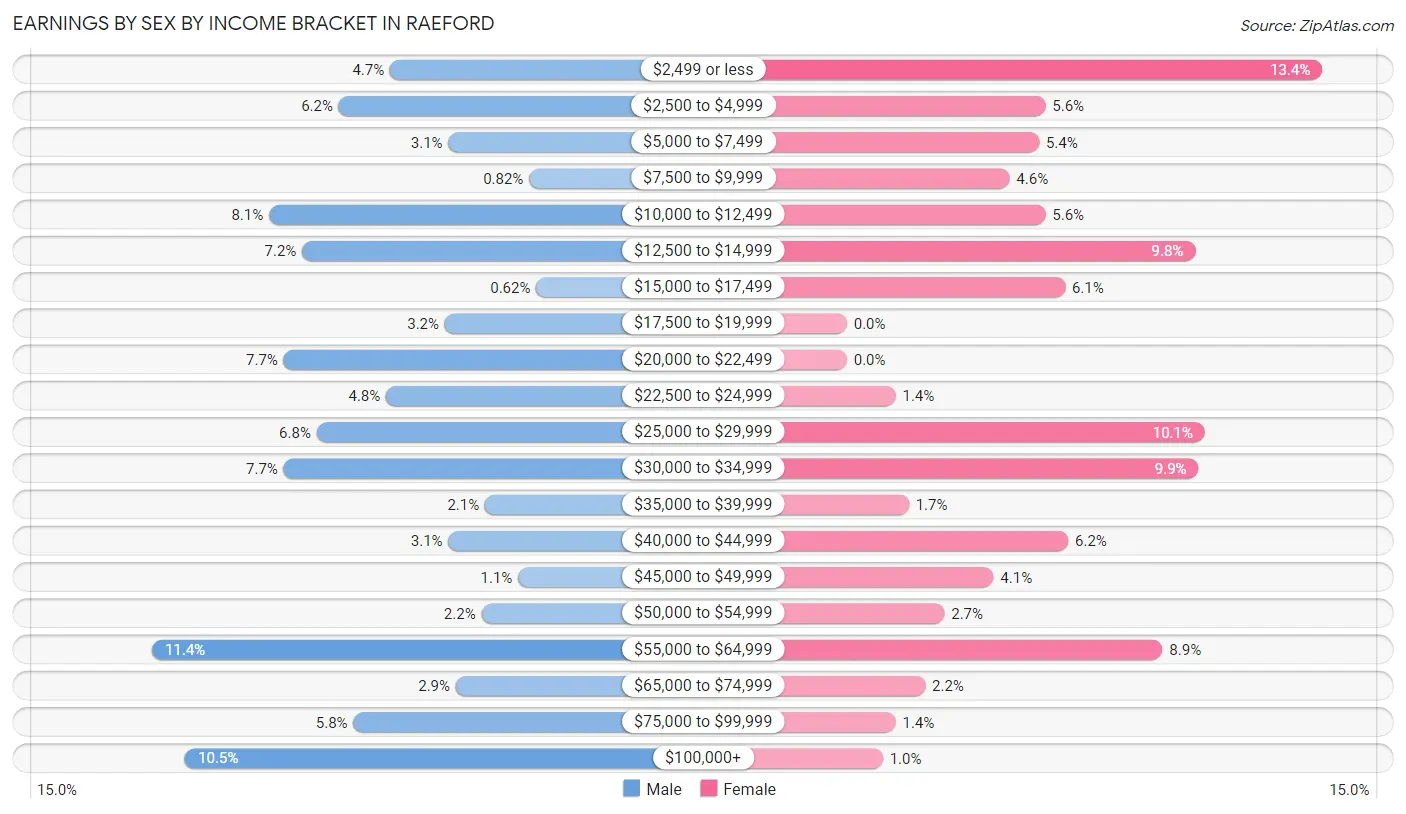
Earnings by Sex by Income Bracket in Raeford
The most common earnings brackets in Raeford are $55,000 to $64,999 for men (111 | 11.4%) and $2,499 or less for women (146 | 13.4%).
| Income | Male | Female |
| $2,499 or less | 46 (4.7%) | 146 (13.4%) |
| $2,500 to $4,999 | 60 (6.2%) | 61 (5.6%) |
| $5,000 to $7,499 | 30 (3.1%) | 59 (5.4%) |
| $7,500 to $9,999 | 8 (0.8%) | 50 (4.6%) |
| $10,000 to $12,499 | 79 (8.1%) | 61 (5.6%) |
| $12,500 to $14,999 | 70 (7.2%) | 107 (9.8%) |
| $15,000 to $17,499 | 6 (0.6%) | 67 (6.1%) |
| $17,500 to $19,999 | 31 (3.2%) | 0 (0.0%) |
| $20,000 to $22,499 | 75 (7.7%) | 0 (0.0%) |
| $22,500 to $24,999 | 47 (4.8%) | 15 (1.4%) |
| $25,000 to $29,999 | 66 (6.8%) | 110 (10.1%) |
| $30,000 to $34,999 | 75 (7.7%) | 108 (9.9%) |
| $35,000 to $39,999 | 20 (2.1%) | 19 (1.7%) |
| $40,000 to $44,999 | 30 (3.1%) | 68 (6.2%) |
| $45,000 to $49,999 | 11 (1.1%) | 45 (4.1%) |
| $50,000 to $54,999 | 21 (2.2%) | 30 (2.7%) |
| $55,000 to $64,999 | 111 (11.4%) | 97 (8.9%) |
| $65,000 to $74,999 | 28 (2.9%) | 24 (2.2%) |
| $75,000 to $99,999 | 56 (5.8%) | 15 (1.4%) |
| $100,000+ | 102 (10.5%) | 11 (1.0%) |
| Total | 972 (100.0%) | 1,093 (100.0%) |
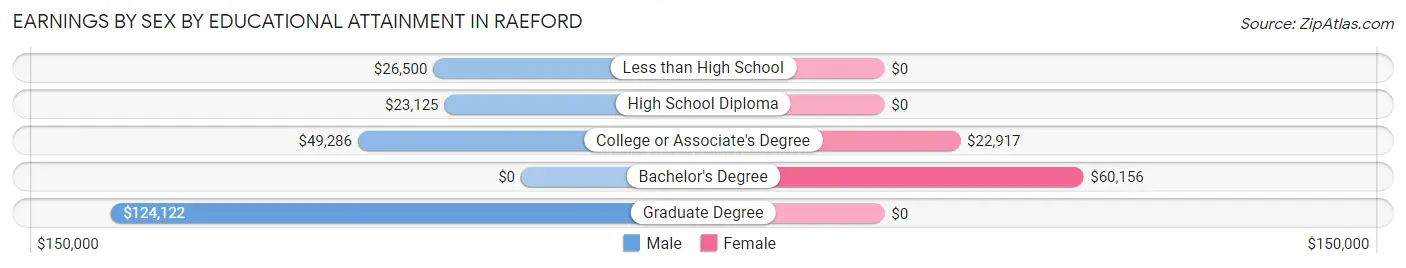
Earnings by Sex by Educational Attainment in Raeford
Average earnings in Raeford are $28,889 for men and $27,399 for women, a difference of 5.2%. Men with an educational attainment of graduate degree enjoy the highest average annual earnings of $124,122, while those with high school diploma education earn the least with $23,125. Women with an educational attainment of bachelor's degree earn the most with the average annual earnings of $60,156, while those with college or associate's degree education have the smallest earnings of $22,917.
| Educational Attainment | Male Income | Female Income |
| Less than High School | $26,500 | $0 |
| High School Diploma | $23,125 | $0 |
| College or Associate's Degree | $49,286 | $22,917 |
| Bachelor's Degree | - | - |
| Graduate Degree | $124,122 | $0 |
| Total | $28,889 | $27,399 |
Family Income in Raeford
Family Income Brackets in Raeford
According to the Raeford family income data, there are 205 families falling into the $50,000 to $74,999 income range, which is the most common income bracket and makes up 22.4% of all families. Conversely, the $200,000+ income bracket is the least frequent group with only 12 families (1.3%) belonging to this category.
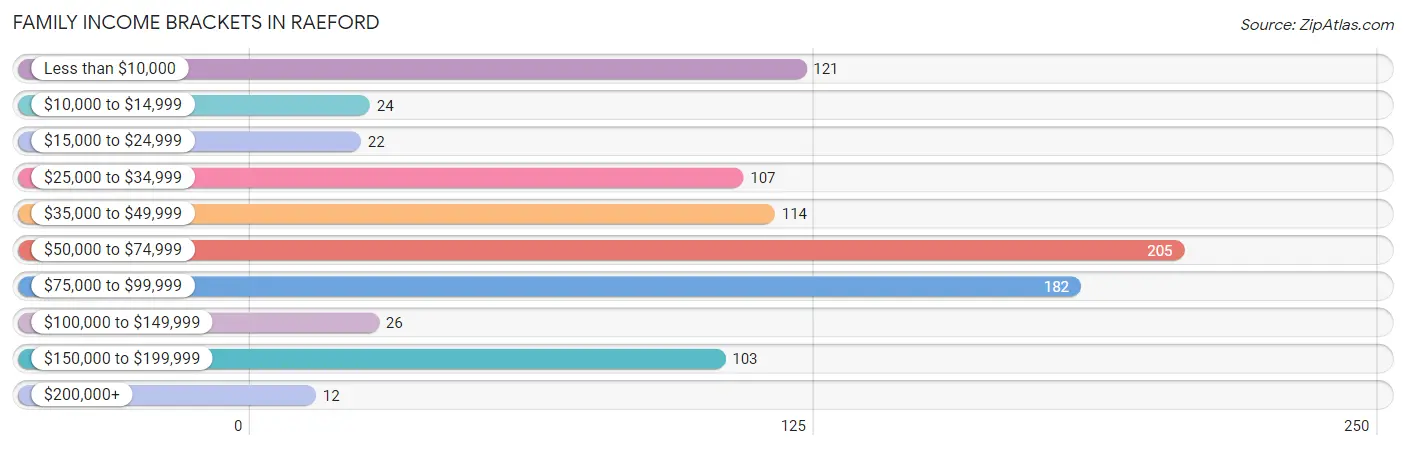
| Income Bracket | # Families | % Families |
| Less than $10,000 | 121 | 13.2% |
| $10,000 to $14,999 | 24 | 2.6% |
| $15,000 to $24,999 | 22 | 2.4% |
| $25,000 to $34,999 | 107 | 11.7% |
| $35,000 to $49,999 | 114 | 12.4% |
| $50,000 to $74,999 | 205 | 22.4% |
| $75,000 to $99,999 | 182 | 19.9% |
| $100,000 to $149,999 | 26 | 2.8% |
| $150,000 to $199,999 | 103 | 11.2% |
| $200,000+ | 12 | 1.3% |
Family Income by Famaliy Size in Raeford
2-person families (401 | 43.8%) account for the highest median family income in Raeford with $65,972 per family, while 2-person families (401 | 43.8%) have the highest median income of $32,986 per family member.
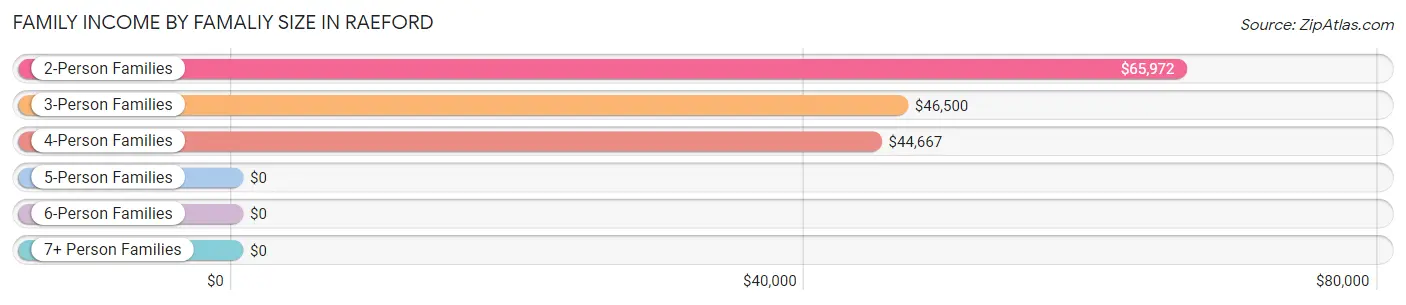
| Income Bracket | # Families | Median Income |
| 2-Person Families | 401 (43.8%) | $65,972 |
| 3-Person Families | 358 (39.1%) | $46,500 |
| 4-Person Families | 136 (14.8%) | $44,667 |
| 5-Person Families | 21 (2.3%) | $0 |
| 6-Person Families | 0 (0.0%) | $0 |
| 7+ Person Families | 0 (0.0%) | $0 |
| Total | 916 (100.0%) | $60,175 |
Family Income by Number of Earners in Raeford
The median family income in Raeford is $60,175, with families comprising 2 earners (309) having the highest median family income of $86,932, while families with 1 earner (423) have the lowest median family income of $38,942, accounting for 33.7% and 46.2% of families, respectively.
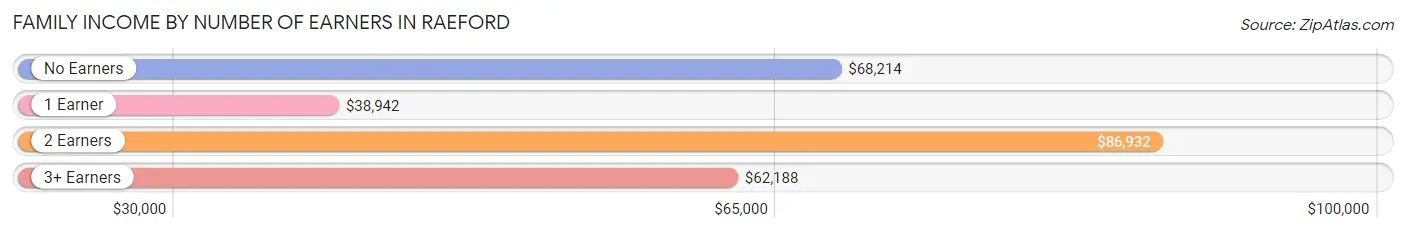
| Number of Earners | # Families | Median Income |
| No Earners | 132 (14.4%) | $68,214 |
| 1 Earner | 423 (46.2%) | $38,942 |
| 2 Earners | 309 (33.7%) | $86,932 |
| 3+ Earners | 52 (5.7%) | $62,188 |
| Total | 916 (100.0%) | $60,175 |
Household Income in Raeford
Household Income Brackets in Raeford
With 311 households falling in the category, the $50,000 to $74,999 income range is the most frequent in Raeford, accounting for 17.6% of all households. In contrast, only 25 households (1.4%) fall into the $200,000+ income bracket, making it the least populous group.
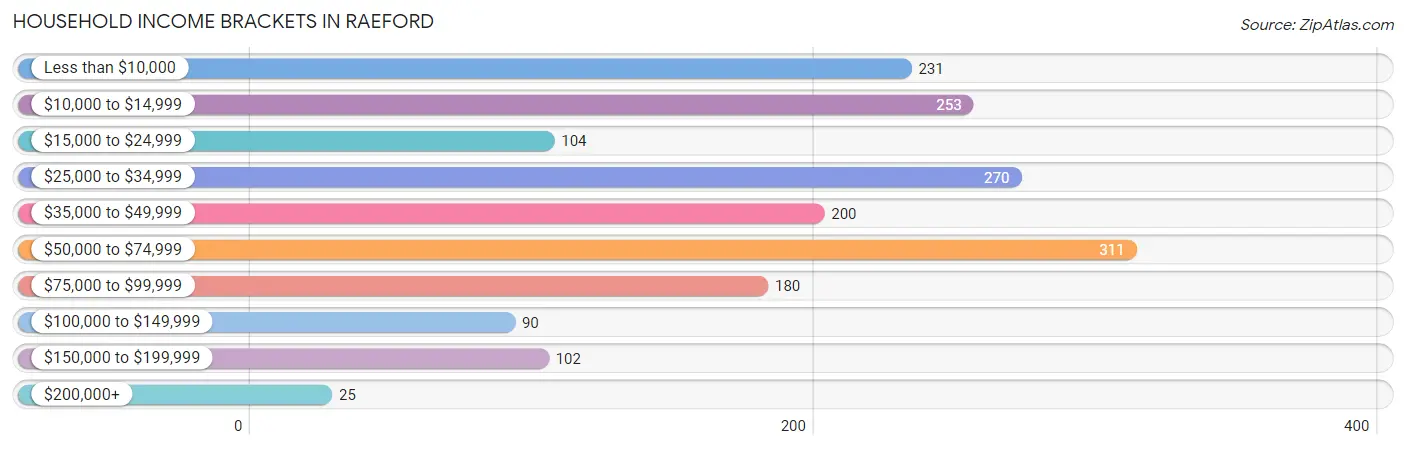
| Income Bracket | # Households | % Households |
| Less than $10,000 | 231 | 13.1% |
| $10,000 to $14,999 | 253 | 14.3% |
| $15,000 to $24,999 | 104 | 5.9% |
| $25,000 to $34,999 | 270 | 15.3% |
| $35,000 to $49,999 | 200 | 11.3% |
| $50,000 to $74,999 | 311 | 17.6% |
| $75,000 to $99,999 | 180 | 10.2% |
| $100,000 to $149,999 | 90 | 5.1% |
| $150,000 to $199,999 | 102 | 5.8% |
| $200,000+ | 25 | 1.4% |
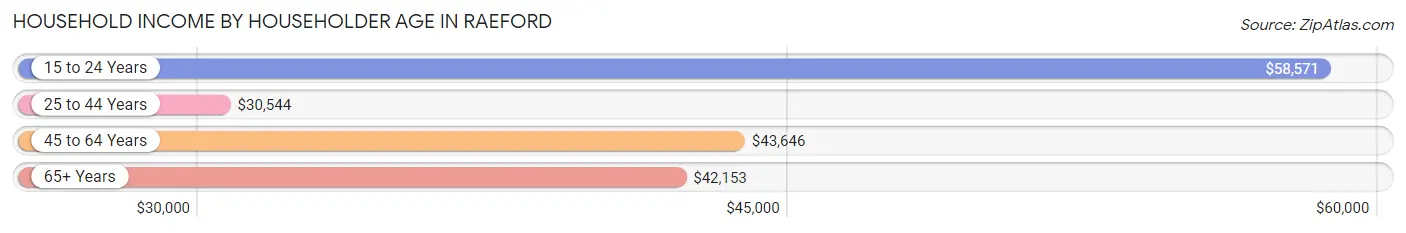
Household Income by Householder Age in Raeford
The median household income in Raeford is $38,371, with the highest median household income of $58,571 found in the 15 to 24 years age bracket for the primary householder. A total of 48 households (2.7%) fall into this category. Meanwhile, the 25 to 44 years age bracket for the primary householder has the lowest median household income of $30,544, with 523 households (29.6%) in this group.
| Income Bracket | # Households | Median Income |
| 15 to 24 Years | 48 (2.7%) | $58,571 |
| 25 to 44 Years | 523 (29.6%) | $30,544 |
| 45 to 64 Years | 695 (39.3%) | $43,646 |
| 65+ Years | 501 (28.3%) | $42,153 |
| Total | 1,767 (100.0%) | $38,371 |
Poverty in Raeford
Income Below Poverty by Sex and Age in Raeford
With 24.3% poverty level for males and 31.0% for females among the residents of Raeford, 18 to 24 year old males and 5 year old females are the most vulnerable to poverty, with 69 males (62.2%) and 16 females (100.0%) in their respective age groups living below the poverty level.
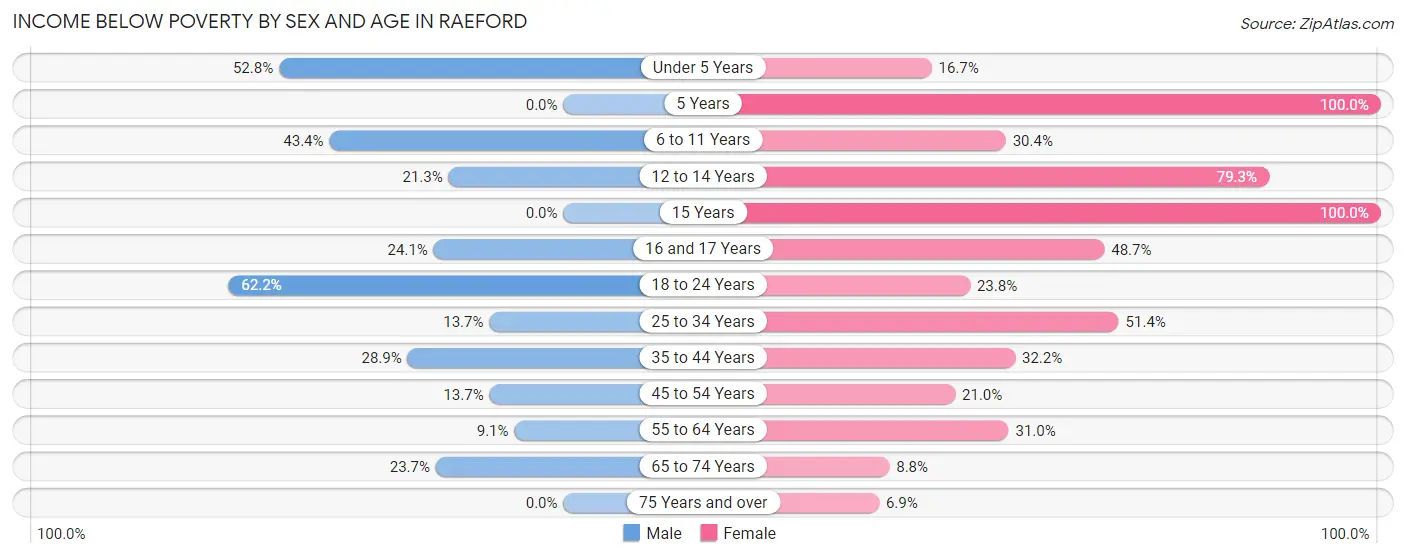
| Age Bracket | Male | Female |
| Under 5 Years | 76 (52.8%) | 13 (16.7%) |
| 5 Years | 0 (0.0%) | 16 (100.0%) |
| 6 to 11 Years | 86 (43.4%) | 49 (30.4%) |
| 12 to 14 Years | 26 (21.3%) | 84 (79.2%) |
| 15 Years | 0 (0.0%) | 12 (100.0%) |
| 16 and 17 Years | 13 (24.1%) | 38 (48.7%) |
| 18 to 24 Years | 69 (62.2%) | 54 (23.8%) |
| 25 to 34 Years | 36 (13.7%) | 148 (51.4%) |
| 35 to 44 Years | 59 (28.9%) | 82 (32.2%) |
| 45 to 54 Years | 27 (13.7%) | 45 (21.0%) |
| 55 to 64 Years | 29 (9.1%) | 121 (30.9%) |
| 65 to 74 Years | 49 (23.7%) | 27 (8.8%) |
| 75 Years and over | 0 (0.0%) | 8 (6.9%) |
| Total | 470 (24.3%) | 697 (31.0%) |
Income Above Poverty by Sex and Age in Raeford
According to the poverty statistics in Raeford, males aged 15 years and females aged 75 years and over are the age groups that are most secure financially, with 100.0% of males and 93.1% of females in these age groups living above the poverty line.
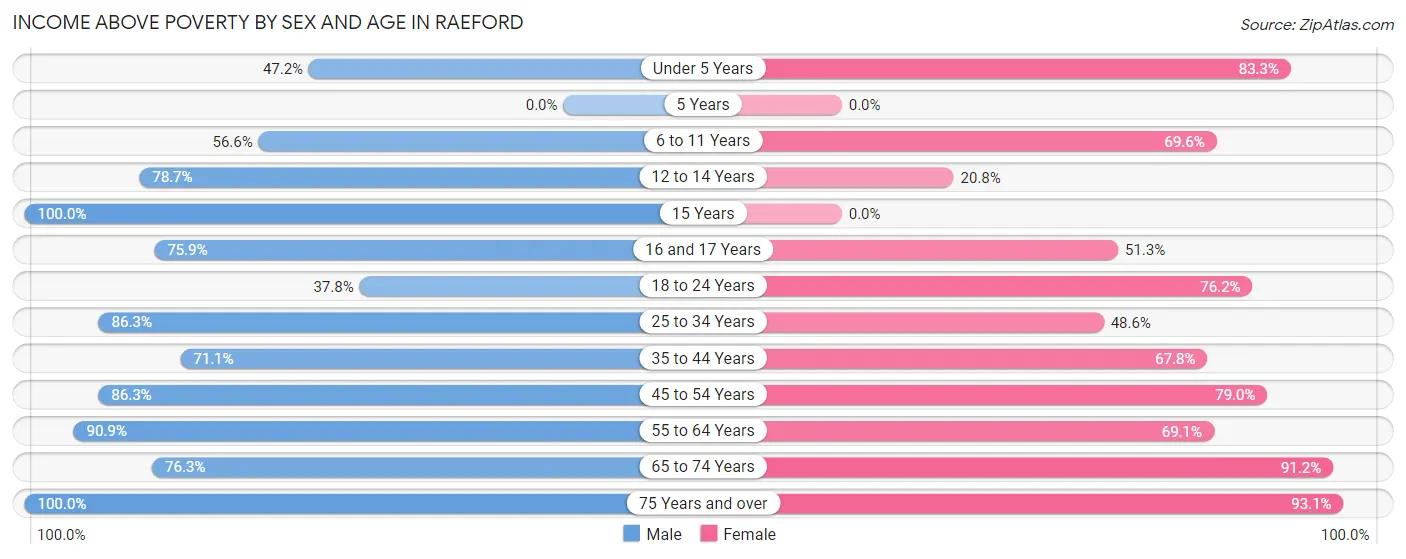
| Age Bracket | Male | Female |
| Under 5 Years | 68 (47.2%) | 65 (83.3%) |
| 5 Years | 0 (0.0%) | 0 (0.0%) |
| 6 to 11 Years | 112 (56.6%) | 112 (69.6%) |
| 12 to 14 Years | 96 (78.7%) | 22 (20.7%) |
| 15 Years | 27 (100.0%) | 0 (0.0%) |
| 16 and 17 Years | 41 (75.9%) | 40 (51.3%) |
| 18 to 24 Years | 42 (37.8%) | 173 (76.2%) |
| 25 to 34 Years | 226 (86.3%) | 140 (48.6%) |
| 35 to 44 Years | 145 (71.1%) | 173 (67.8%) |
| 45 to 54 Years | 170 (86.3%) | 169 (79.0%) |
| 55 to 64 Years | 290 (90.9%) | 270 (69.1%) |
| 65 to 74 Years | 158 (76.3%) | 279 (91.2%) |
| 75 Years and over | 86 (100.0%) | 108 (93.1%) |
| Total | 1,461 (75.7%) | 1,551 (69.0%) |
Income Below Poverty Among Married-Couple Families in Raeford
The poverty statistics for married-couple families in Raeford show that 5.0% or 26 of the total 522 families live below the poverty line. Families with 1 or 2 children have the highest poverty rate of 15.9%, comprising of 26 families. On the other hand, families with no children have the lowest poverty rate of 0.0%, which includes 0 families.
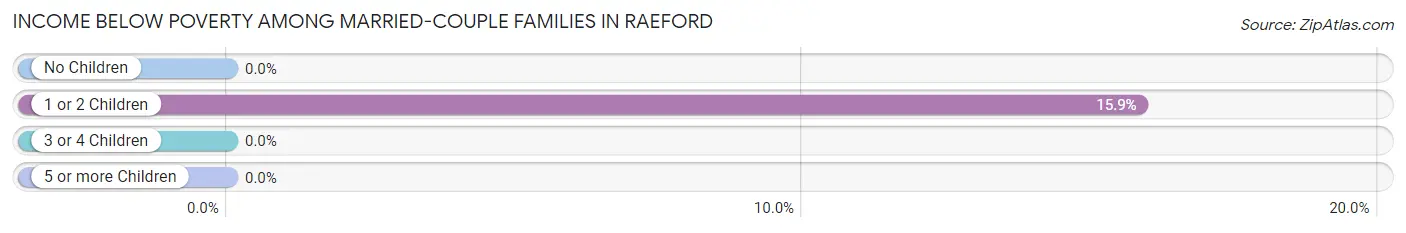
| Children | Above Poverty | Below Poverty |
| No Children | 348 (100.0%) | 0 (0.0%) |
| 1 or 2 Children | 138 (84.2%) | 26 (15.9%) |
| 3 or 4 Children | 10 (100.0%) | 0 (0.0%) |
| 5 or more Children | 0 (0.0%) | 0 (0.0%) |
| Total | 496 (95.0%) | 26 (5.0%) |
Income Below Poverty Among Single-Parent Households in Raeford
According to the poverty data in Raeford, 7.5% or 3 single-father households and 46.9% or 166 single-mother households are living below the poverty line. Among single-father households, those with 1 or 2 children have the highest poverty rate, with 3 households (13.6%) experiencing poverty. Likewise, among single-mother households, those with 3 or 4 children have the highest poverty rate, with 49 households (80.3%) falling below the poverty line.
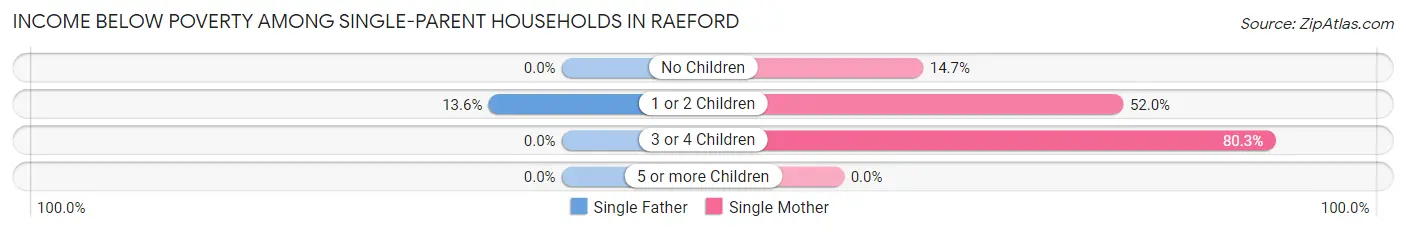
| Children | Single Father | Single Mother |
| No Children | 0 (0.0%) | 14 (14.7%) |
| 1 or 2 Children | 3 (13.6%) | 103 (52.0%) |
| 3 or 4 Children | 0 (0.0%) | 49 (80.3%) |
| 5 or more Children | 0 (0.0%) | 0 (0.0%) |
| Total | 3 (7.5%) | 166 (46.9%) |
Income Below Poverty Among Married-Couple vs Single-Parent Households in Raeford
The poverty data for Raeford shows that 26 of the married-couple family households (5.0%) and 169 of the single-parent households (42.9%) are living below the poverty level. Within the married-couple family households, those with 1 or 2 children have the highest poverty rate, with 26 households (15.9%) falling below the poverty line. Among the single-parent households, those with 3 or 4 children have the highest poverty rate, with 49 household (80.3%) living below poverty.
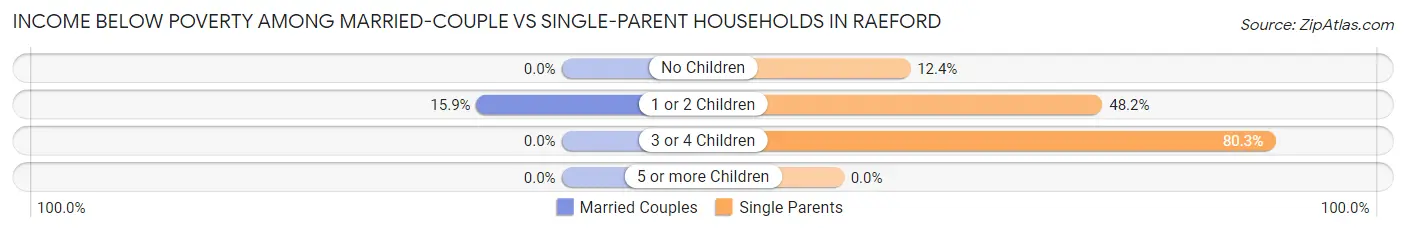
| Children | Married-Couple Families | Single-Parent Households |
| No Children | 0 (0.0%) | 14 (12.4%) |
| 1 or 2 Children | 26 (15.9%) | 106 (48.2%) |
| 3 or 4 Children | 0 (0.0%) | 49 (80.3%) |
| 5 or more Children | 0 (0.0%) | 0 (0.0%) |
| Total | 26 (5.0%) | 169 (42.9%) |
Race in Raeford
The most populous races in Raeford are Black / African American (2,062 | 45.1%), White / Caucasian (1,587 | 34.7%), and Two or more Races (434 | 9.5%).
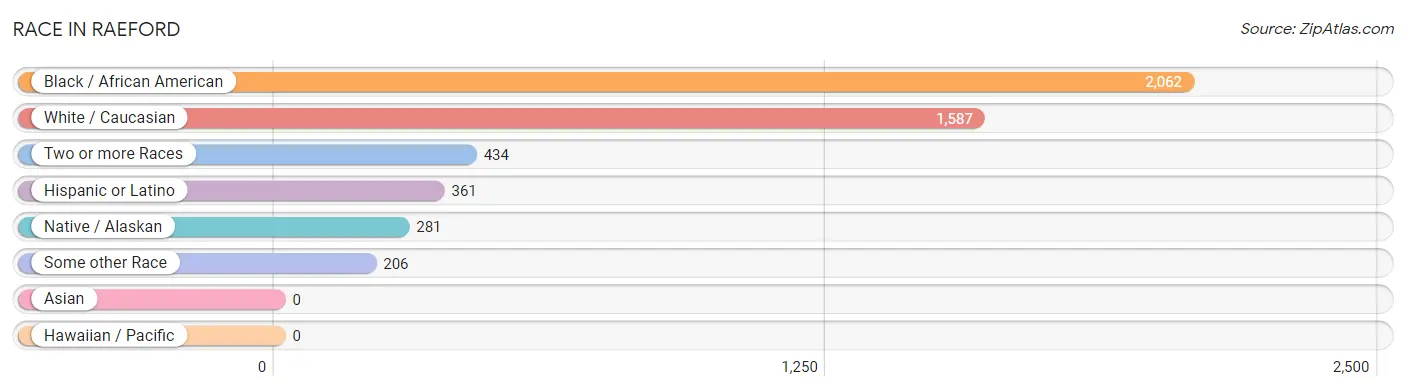
| Race | # Population | % Population |
| Asian | 0 | 0.0% |
| Black / African American | 2,062 | 45.1% |
| Hawaiian / Pacific | 0 | 0.0% |
| Hispanic or Latino | 361 | 7.9% |
| Native / Alaskan | 281 | 6.1% |
| White / Caucasian | 1,587 | 34.7% |
| Two or more Races | 434 | 9.5% |
| Some other Race | 206 | 4.5% |
| Total | 4,570 | 100.0% |
Ancestry in Raeford
The most populous ancestries reported in Raeford are English (456 | 10.0%), American (343 | 7.5%), Lumbee (211 | 4.6%), Puerto Rican (170 | 3.7%), and Mexican (158 | 3.5%), together accounting for 29.3% of all Raeford residents.
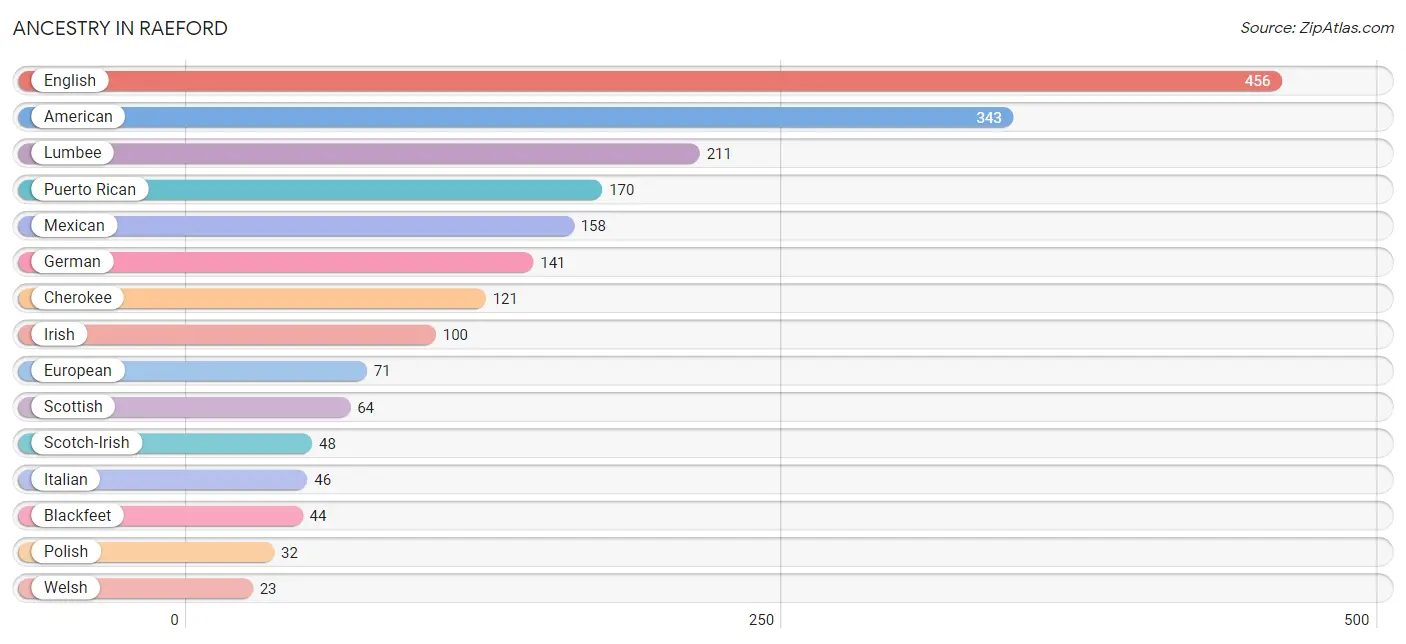
| Ancestry | # Population | % Population |
| African | 8 | 0.2% |
| American | 343 | 7.5% |
| Blackfeet | 44 | 1.0% |
| Central American | 13 | 0.3% |
| Central American Indian | 13 | 0.3% |
| Cherokee | 121 | 2.6% |
| Cuban | 4 | 0.1% |
| Dutch | 11 | 0.2% |
| English | 456 | 10.0% |
| European | 71 | 1.5% |
| French | 12 | 0.3% |
| German | 141 | 3.1% |
| Honduran | 13 | 0.3% |
| Irish | 100 | 2.2% |
| Italian | 46 | 1.0% |
| Jamaican | 11 | 0.2% |
| Lumbee | 211 | 4.6% |
| Mexican | 158 | 3.5% |
| Polish | 32 | 0.7% |
| Puerto Rican | 170 | 3.7% |
| Scotch-Irish | 48 | 1.1% |
| Scottish | 64 | 1.4% |
| Subsaharan African | 8 | 0.2% |
| Swiss | 12 | 0.3% |
| Welsh | 23 | 0.5% | View All 25 Rows |
Immigrants in Raeford
The most numerous immigrant groups reported in Raeford came from Latin America (103 | 2.2%), Central America (92 | 2.0%), Mexico (52 | 1.1%), Guatemala (27 | 0.6%), and Europe (18 | 0.4%), together accounting for 6.4% of all Raeford residents.
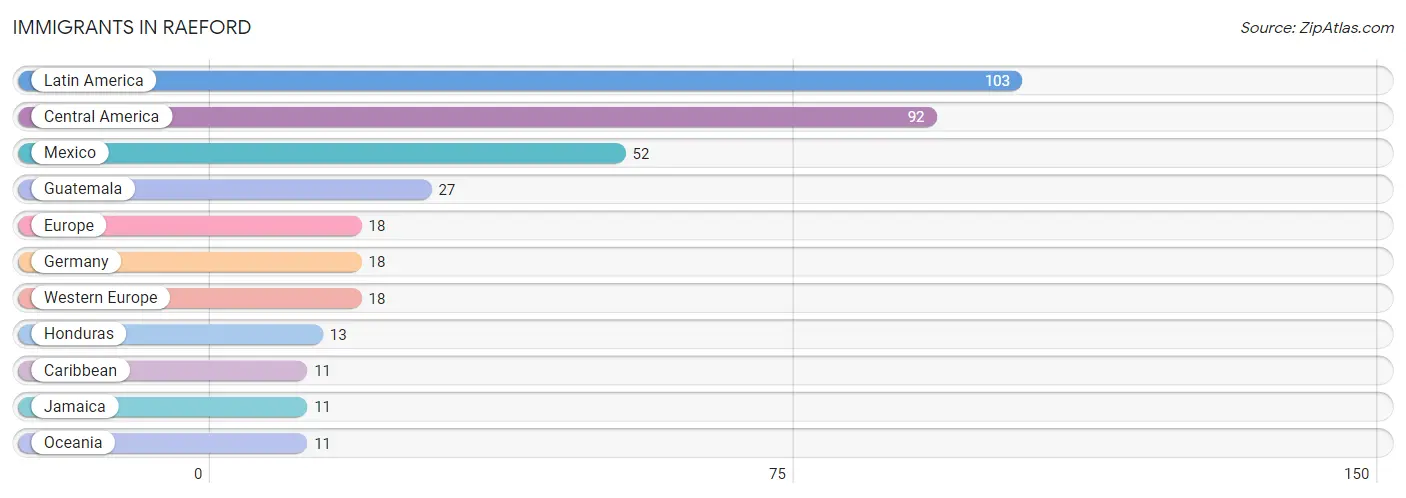
| Immigration Origin | # Population | % Population |
| Caribbean | 11 | 0.2% |
| Central America | 92 | 2.0% |
| Europe | 18 | 0.4% |
| Germany | 18 | 0.4% |
| Guatemala | 27 | 0.6% |
| Honduras | 13 | 0.3% |
| Jamaica | 11 | 0.2% |
| Latin America | 103 | 2.2% |
| Mexico | 52 | 1.1% |
| Oceania | 11 | 0.2% |
| Western Europe | 18 | 0.4% | View All 11 Rows |
Sex and Age in Raeford
Sex and Age in Raeford
The most populous age groups in Raeford are 25 to 29 Years (264 | 12.2%) for men and 55 to 59 Years (281 | 11.7%) for women.
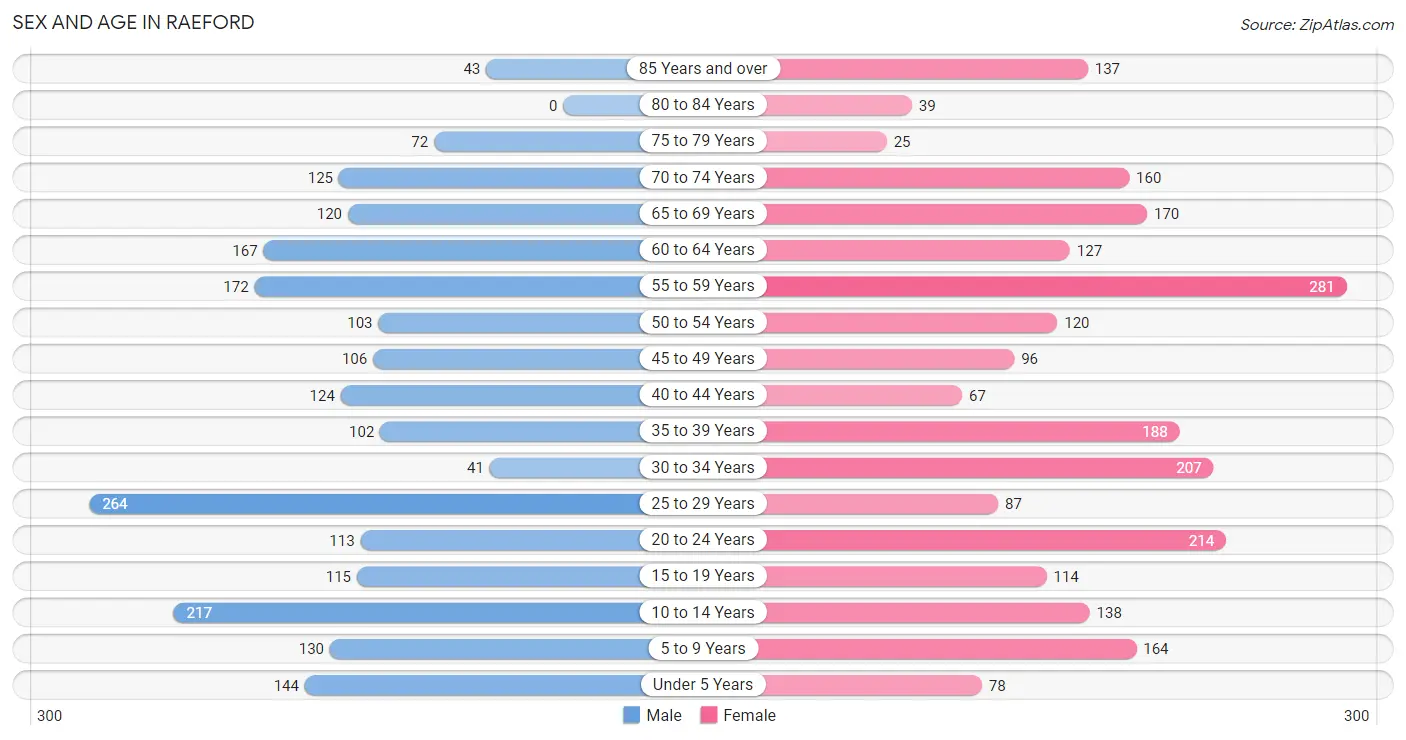
| Age Bracket | Male | Female |
| Under 5 Years | 144 (6.7%) | 78 (3.2%) |
| 5 to 9 Years | 130 (6.0%) | 164 (6.8%) |
| 10 to 14 Years | 217 (10.1%) | 138 (5.7%) |
| 15 to 19 Years | 115 (5.3%) | 114 (4.7%) |
| 20 to 24 Years | 113 (5.2%) | 214 (8.9%) |
| 25 to 29 Years | 264 (12.2%) | 87 (3.6%) |
| 30 to 34 Years | 41 (1.9%) | 207 (8.6%) |
| 35 to 39 Years | 102 (4.7%) | 188 (7.8%) |
| 40 to 44 Years | 124 (5.8%) | 67 (2.8%) |
| 45 to 49 Years | 106 (4.9%) | 96 (4.0%) |
| 50 to 54 Years | 103 (4.8%) | 120 (5.0%) |
| 55 to 59 Years | 172 (8.0%) | 281 (11.7%) |
| 60 to 64 Years | 167 (7.7%) | 127 (5.3%) |
| 65 to 69 Years | 120 (5.6%) | 170 (7.0%) |
| 70 to 74 Years | 125 (5.8%) | 160 (6.6%) |
| 75 to 79 Years | 72 (3.3%) | 25 (1.0%) |
| 80 to 84 Years | 0 (0.0%) | 39 (1.6%) |
| 85 Years and over | 43 (2.0%) | 137 (5.7%) |
| Total | 2,158 (100.0%) | 2,412 (100.0%) |
Families and Households in Raeford
Median Family Size in Raeford
The median family size in Raeford is 3.39 persons per family, with single female/mother families (354 | 38.7%) accounting for the largest median family size of 3.65 persons per family. On the other hand, single male/father families (40 | 4.4%) represent the smallest median family size with 2.30 persons per family.
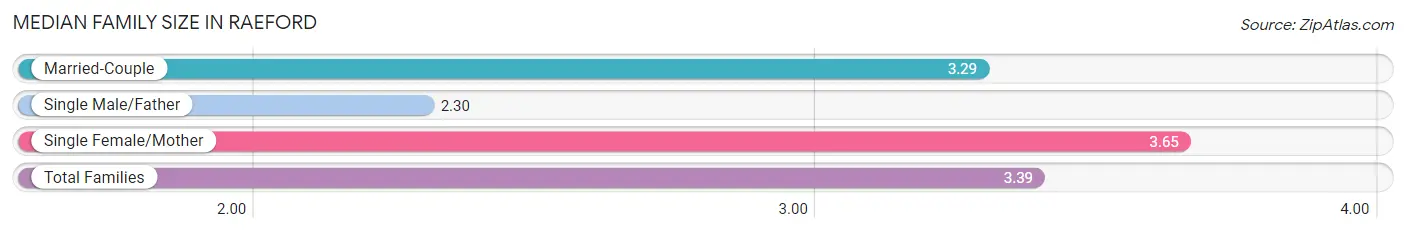
| Family Type | # Families | Family Size |
| Married-Couple | 522 (57.0%) | 3.29 |
| Single Male/Father | 40 (4.4%) | 2.30 |
| Single Female/Mother | 354 (38.7%) | 3.65 |
| Total Families | 916 (100.0%) | 3.39 |
Median Household Size in Raeford
The median household size in Raeford is 2.36 persons per household, with single female/mother households (354 | 20.0%) accounting for the largest median household size of 3.7 persons per household. non-family households (851 | 48.2%) represent the smallest median household size with 1.16 persons per household.
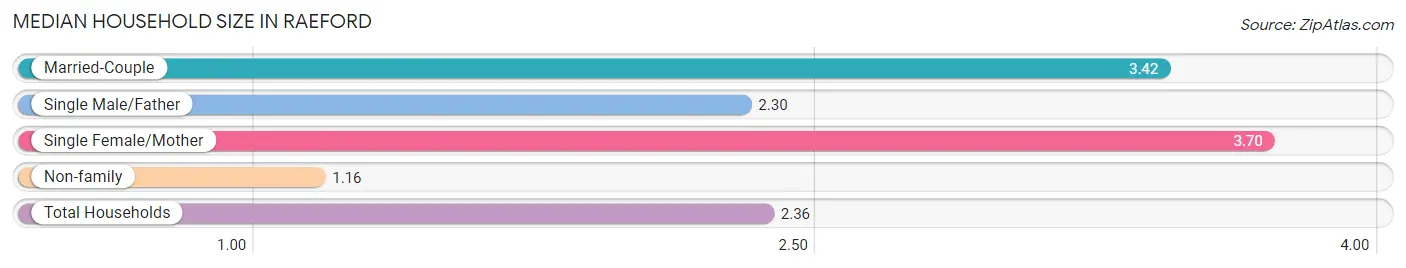
| Household Type | # Households | Household Size |
| Married-Couple | 522 (29.5%) | 3.42 |
| Single Male/Father | 40 (2.3%) | 2.30 |
| Single Female/Mother | 354 (20.0%) | 3.70 |
| Non-family | 851 (48.2%) | 1.16 |
| Total Households | 1,767 (100.0%) | 2.36 |
Household Size by Marriage Status in Raeford
Out of a total of 1,767 households in Raeford, 916 (51.8%) are family households, while 851 (48.2%) are nonfamily households. The most numerous type of family households are 2-person households, comprising 384, and the most common type of nonfamily households are 1-person households, comprising 799.
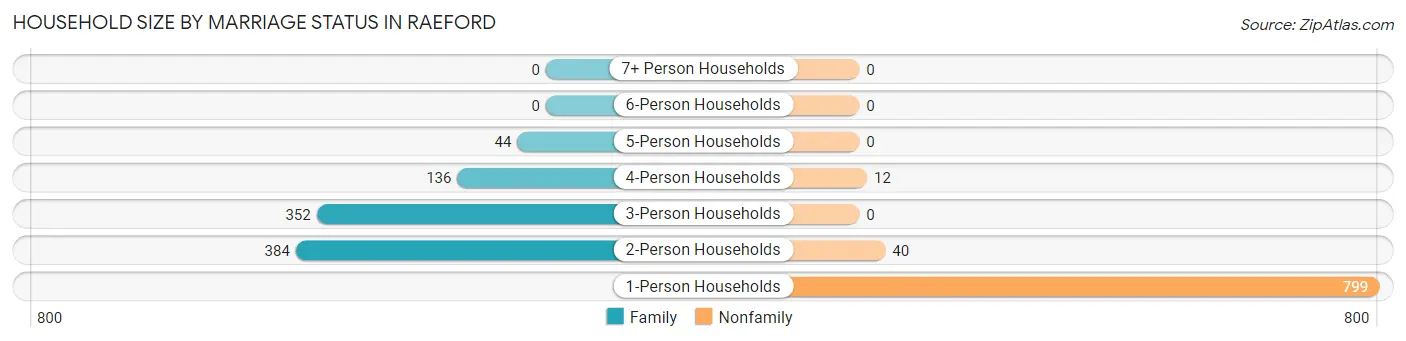
| Household Size | Family Households | Nonfamily Households |
| 1-Person Households | - | 799 (45.2%) |
| 2-Person Households | 384 (21.7%) | 40 (2.3%) |
| 3-Person Households | 352 (19.9%) | 0 (0.0%) |
| 4-Person Households | 136 (7.7%) | 12 (0.7%) |
| 5-Person Households | 44 (2.5%) | 0 (0.0%) |
| 6-Person Households | 0 (0.0%) | 0 (0.0%) |
| 7+ Person Households | 0 (0.0%) | 0 (0.0%) |
| Total | 916 (51.8%) | 851 (48.2%) |
Female Fertility in Raeford
Fertility by Age in Raeford
Average fertility rate in Raeford is 34.0 births per 1,000 women. Women in the age bracket of 20 to 34 years have the highest fertility rate with 65.0 births per 1,000 women. Women in the age bracket of 20 to 34 years acount for 100.0% of all women with births.
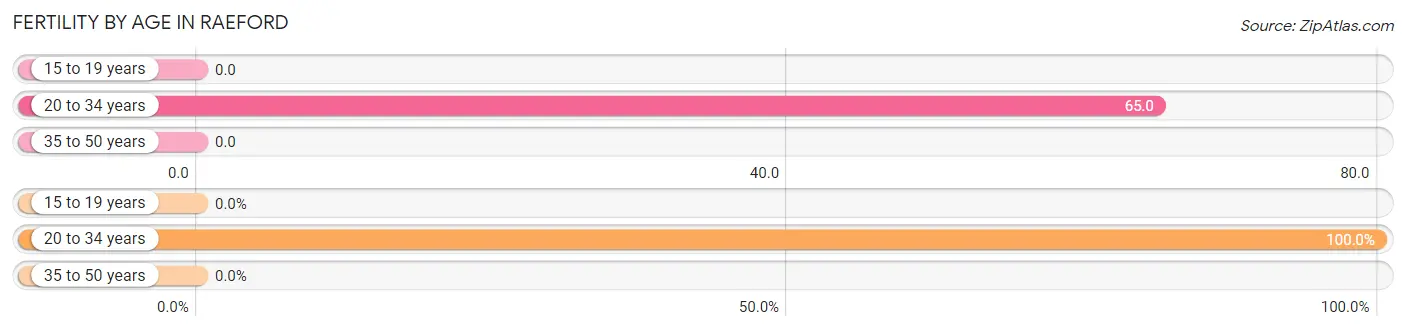
| Age Bracket | Women with Births | Births / 1,000 Women |
| 15 to 19 years | 0 (0.0%) | 0.0 |
| 20 to 34 years | 33 (100.0%) | 65.0 |
| 35 to 50 years | 0 (0.0%) | 0.0 |
| Total | 33 (100.0%) | 34.0 |
Fertility by Age by Marriage Status in Raeford
36.4% of women with births (33) in Raeford are married. The highest percentage of unmarried women with births falls into 20 to 34 years age bracket with 63.6% of them unmarried at the time of birth, while the lowest percentage of unmarried women with births belong to 20 to 34 years age bracket with 63.6% of them unmarried.
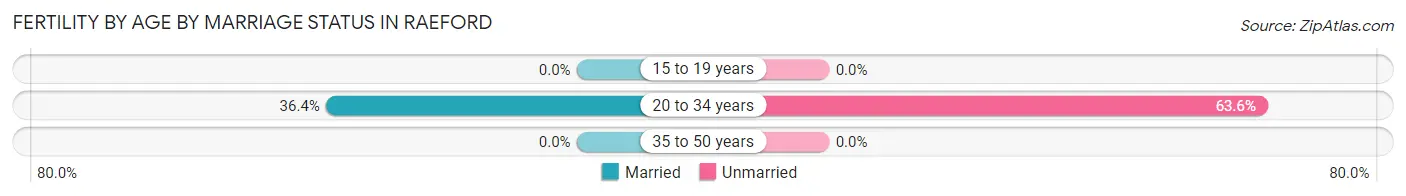
| Age Bracket | Married | Unmarried |
| 15 to 19 years | 0 (0.0%) | 0 (0.0%) |
| 20 to 34 years | 12 (36.4%) | 21 (63.6%) |
| 35 to 50 years | 0 (0.0%) | 0 (0.0%) |
| Total | 12 (36.4%) | 21 (63.6%) |
Fertility by Education in Raeford
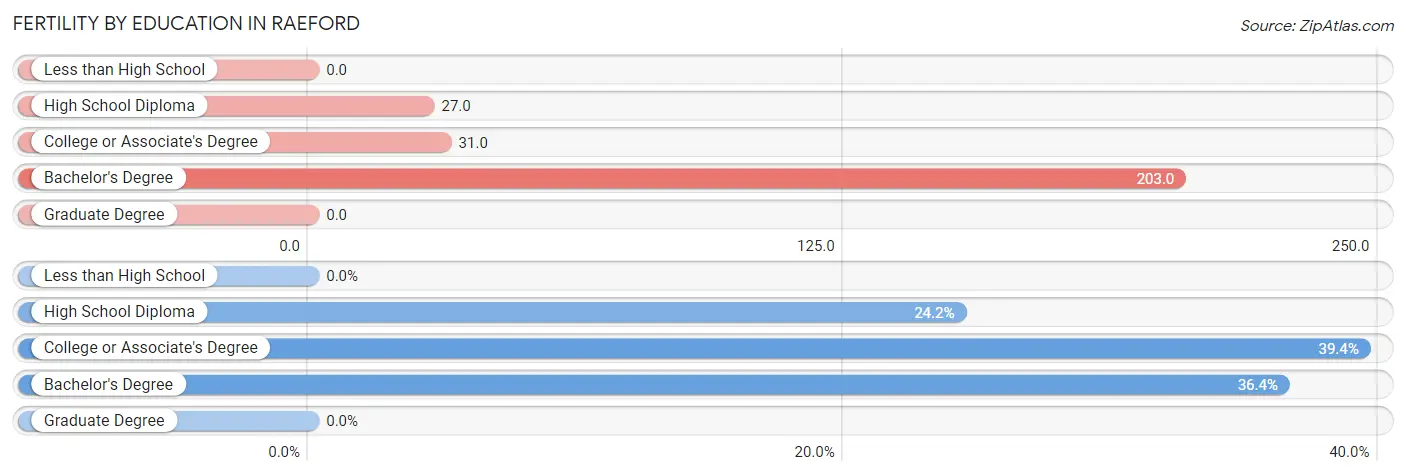
| Educational Attainment | Women with Births | Births / 1,000 Women |
| Less than High School | 0 (0.0%) | 0.0 |
| High School Diploma | 8 (24.2%) | 27.0 |
| College or Associate's Degree | 13 (39.4%) | 31.0 |
| Bachelor's Degree | 12 (36.4%) | 203.0 |
| Graduate Degree | 0 (0.0%) | 0.0 |
| Total | 33 (100.0%) | 34.0 |
Fertility by Education by Marriage Status in Raeford
63.6% of women with births in Raeford are unmarried. Women with the educational attainment of bachelor's degree are most likely to be married with 100.0% of them married at childbirth, while women with the educational attainment of high school diploma are least likely to be married with 100.0% of them unmarried at childbirth.
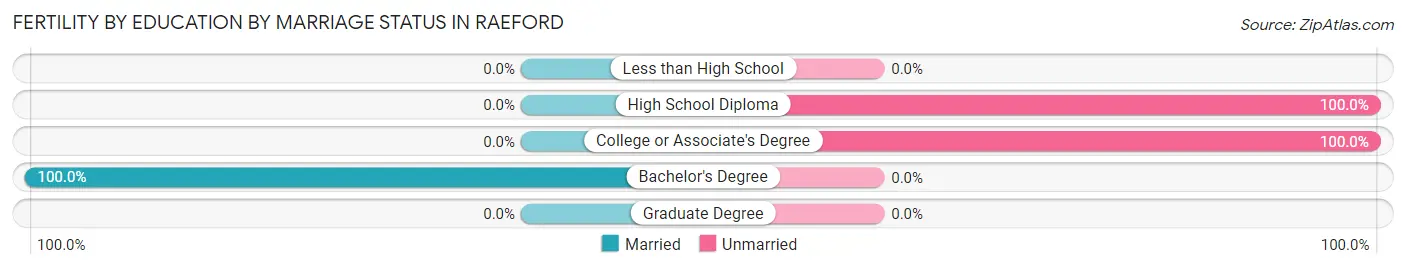
| Educational Attainment | Married | Unmarried |
| Less than High School | 0 (0.0%) | 0 (0.0%) |
| High School Diploma | 0 (0.0%) | 8 (100.0%) |
| College or Associate's Degree | 0 (0.0%) | 13 (100.0%) |
| Bachelor's Degree | 12 (100.0%) | 0 (0.0%) |
| Graduate Degree | 0 (0.0%) | 0 (0.0%) |
| Total | 12 (36.4%) | 21 (63.6%) |
Employment Characteristics in Raeford
Employment by Class of Employer in Raeford
Among the 1,681 employed individuals in Raeford, private company employees (1,029 | 61.2%), state government employees (199 | 11.8%), and local government employees (168 | 10.0%) make up the most common classes of employment.
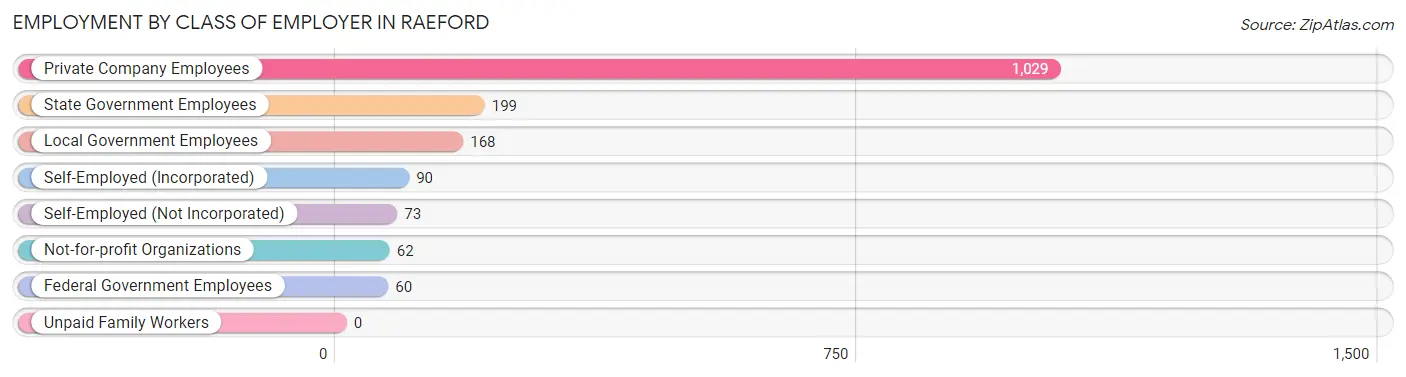
| Employer Class | # Employees | % Employees |
| Private Company Employees | 1,029 | 61.2% |
| Self-Employed (Incorporated) | 90 | 5.3% |
| Self-Employed (Not Incorporated) | 73 | 4.3% |
| Not-for-profit Organizations | 62 | 3.7% |
| Local Government Employees | 168 | 10.0% |
| State Government Employees | 199 | 11.8% |
| Federal Government Employees | 60 | 3.6% |
| Unpaid Family Workers | 0 | 0.0% |
| Total | 1,681 | 100.0% |
Employment Status by Age in Raeford
According to the labor force statistics for Raeford, out of the total population over 16 years of age (3,660), 51.0% or 1,867 individuals are in the labor force, with 4.3% or 80 of them unemployed. The age group with the highest labor force participation rate is 25 to 29 years, with 92.0% or 323 individuals in the labor force. Within the labor force, the 30 to 34 years age range has the highest percentage of unemployed individuals, with 26.4% or 39 of them being unemployed.
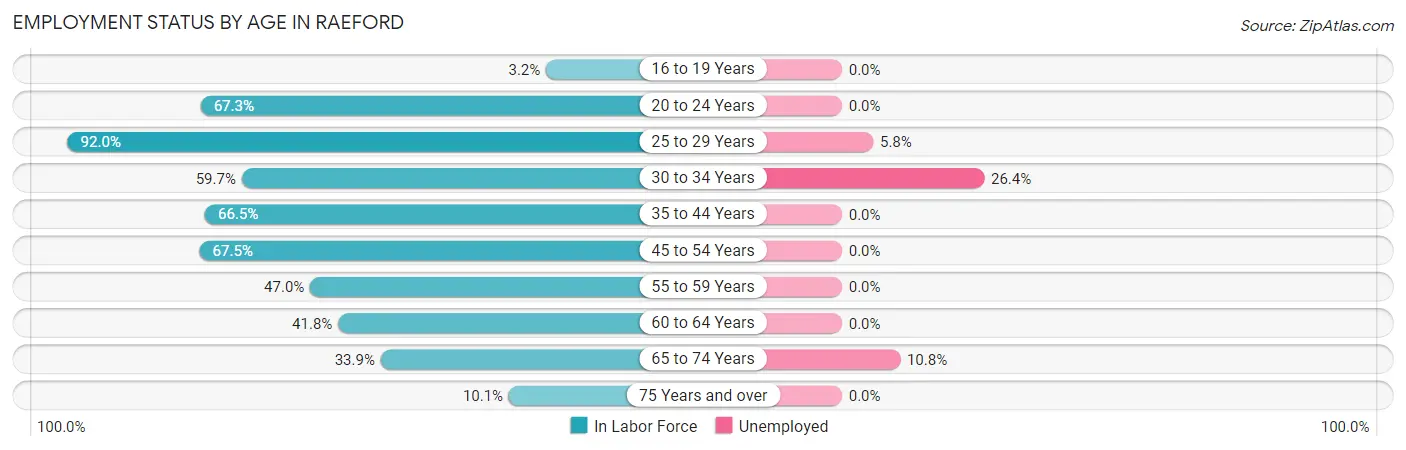
| Age Bracket | In Labor Force | Unemployed |
| 16 to 19 Years | 6 (3.2%) | 0 (0.0%) |
| 20 to 24 Years | 220 (67.3%) | 0 (0.0%) |
| 25 to 29 Years | 323 (92.0%) | 19 (5.8%) |
| 30 to 34 Years | 148 (59.7%) | 39 (26.4%) |
| 35 to 44 Years | 320 (66.5%) | 0 (0.0%) |
| 45 to 54 Years | 287 (67.5%) | 0 (0.0%) |
| 55 to 59 Years | 213 (47.0%) | 0 (0.0%) |
| 60 to 64 Years | 123 (41.8%) | 0 (0.0%) |
| 65 to 74 Years | 195 (33.9%) | 21 (10.8%) |
| 75 Years and over | 32 (10.1%) | 0 (0.0%) |
| Total | 1,867 (51.0%) | 80 (4.3%) |
Employment Status by Educational Attainment in Raeford
According to labor force statistics for Raeford, 62.8% of individuals (1,414) out of the total population between 25 and 64 years of age (2,252) are in the labor force, with 4.1% or 58 of them being unemployed. The group with the highest labor force participation rate are those with the educational attainment of bachelor's degree or higher, with 82.8% or 298 individuals in the labor force. Within the labor force, individuals with high school diploma education have the highest percentage of unemployment, with 9.0% or 35 of them being unemployed.
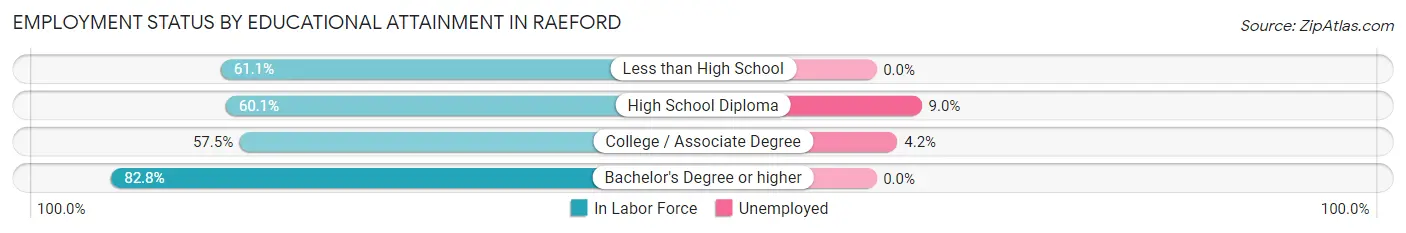
| Educational Attainment | In Labor Force | Unemployed |
| Less than High School | 187 (61.1%) | 0 (0.0%) |
| High School Diploma | 389 (60.1%) | 58 (9.0%) |
| College / Associate Degree | 540 (57.5%) | 39 (4.2%) |
| Bachelor's Degree or higher | 298 (82.8%) | 0 (0.0%) |
| Total | 1,414 (62.8%) | 92 (4.1%) |
Employment Occupations by Sex in Raeford
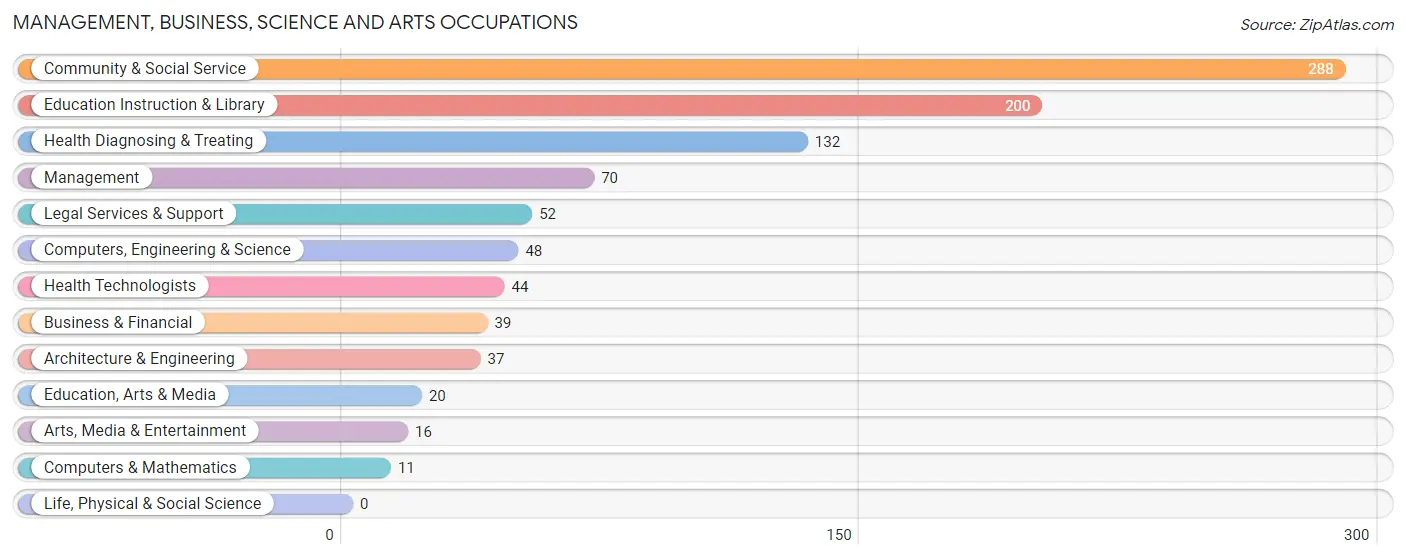
Management, Business, Science and Arts Occupations
The most common Management, Business, Science and Arts occupations in Raeford are Community & Social Service (288 | 16.5%), Education Instruction & Library (200 | 11.5%), Health Diagnosing & Treating (132 | 7.6%), Management (70 | 4.0%), and Legal Services & Support (52 | 3.0%).
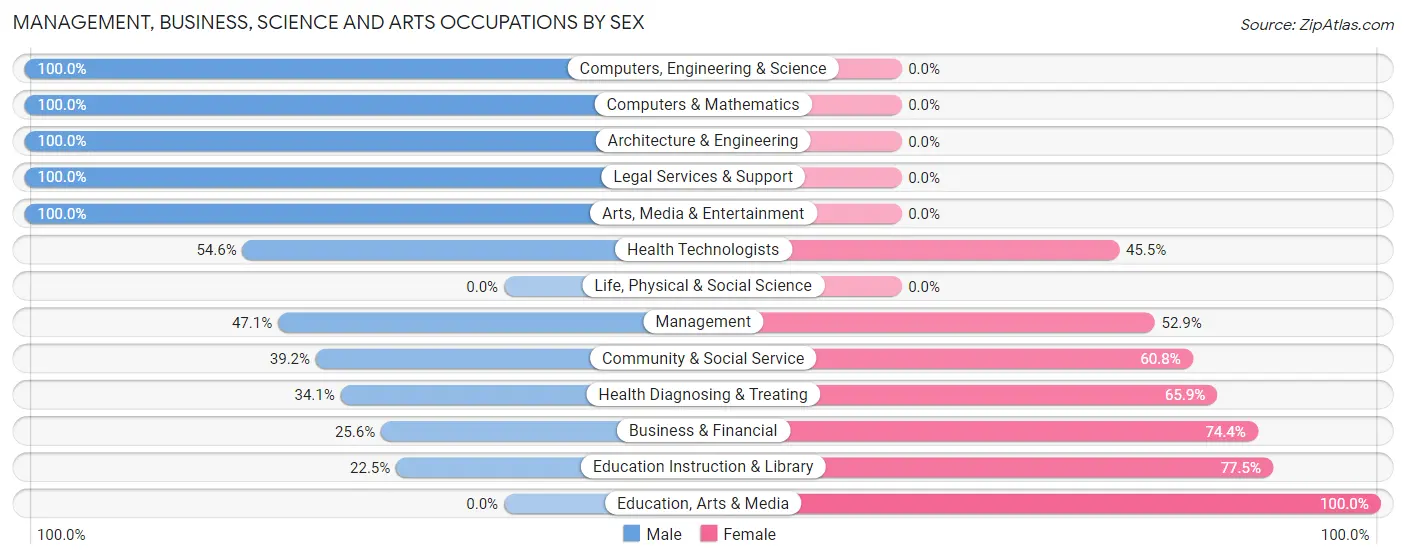
Management, Business, Science and Arts Occupations by Sex
Within the Management, Business, Science and Arts occupations in Raeford, the most male-oriented occupations are Computers, Engineering & Science (100.0%), Computers & Mathematics (100.0%), and Architecture & Engineering (100.0%), while the most female-oriented occupations are Education, Arts & Media (100.0%), Education Instruction & Library (77.5%), and Business & Financial (74.4%).
| Occupation | Male | Female |
| Management | 33 (47.1%) | 37 (52.9%) |
| Business & Financial | 10 (25.6%) | 29 (74.4%) |
| Computers, Engineering & Science | 48 (100.0%) | 0 (0.0%) |
| Computers & Mathematics | 11 (100.0%) | 0 (0.0%) |
| Architecture & Engineering | 37 (100.0%) | 0 (0.0%) |
| Life, Physical & Social Science | 0 (0.0%) | 0 (0.0%) |
| Community & Social Service | 113 (39.2%) | 175 (60.8%) |
| Education, Arts & Media | 0 (0.0%) | 20 (100.0%) |
| Legal Services & Support | 52 (100.0%) | 0 (0.0%) |
| Education Instruction & Library | 45 (22.5%) | 155 (77.5%) |
| Arts, Media & Entertainment | 16 (100.0%) | 0 (0.0%) |
| Health Diagnosing & Treating | 45 (34.1%) | 87 (65.9%) |
| Health Technologists | 24 (54.5%) | 20 (45.5%) |
| Total (Category) | 249 (43.1%) | 328 (56.9%) |
| Total (Overall) | 856 (49.2%) | 885 (50.8%) |
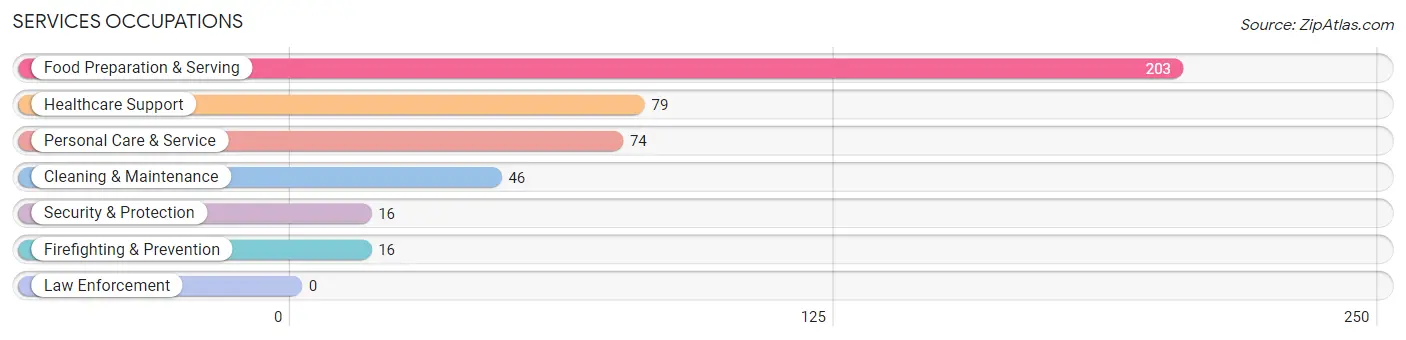
Services Occupations
The most common Services occupations in Raeford are Food Preparation & Serving (203 | 11.7%), Healthcare Support (79 | 4.5%), Personal Care & Service (74 | 4.3%), Cleaning & Maintenance (46 | 2.6%), and Security & Protection (16 | 0.9%).
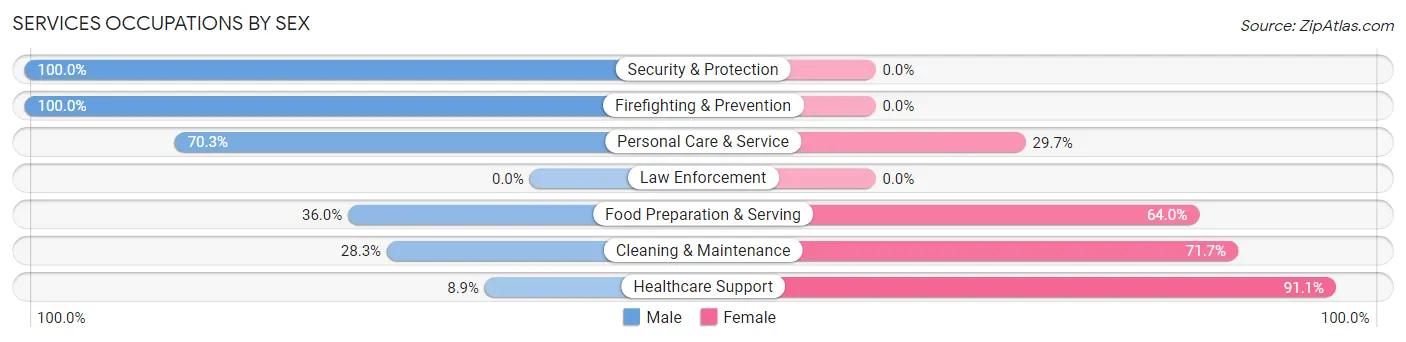
Services Occupations by Sex
Within the Services occupations in Raeford, the most male-oriented occupations are Security & Protection (100.0%), Firefighting & Prevention (100.0%), and Personal Care & Service (70.3%), while the most female-oriented occupations are Healthcare Support (91.1%), Cleaning & Maintenance (71.7%), and Food Preparation & Serving (64.0%).
| Occupation | Male | Female |
| Healthcare Support | 7 (8.9%) | 72 (91.1%) |
| Security & Protection | 16 (100.0%) | 0 (0.0%) |
| Firefighting & Prevention | 16 (100.0%) | 0 (0.0%) |
| Law Enforcement | 0 (0.0%) | 0 (0.0%) |
| Food Preparation & Serving | 73 (36.0%) | 130 (64.0%) |
| Cleaning & Maintenance | 13 (28.3%) | 33 (71.7%) |
| Personal Care & Service | 52 (70.3%) | 22 (29.7%) |
| Total (Category) | 161 (38.5%) | 257 (61.5%) |
| Total (Overall) | 856 (49.2%) | 885 (50.8%) |
Sales and Office Occupations
The most common Sales and Office occupations in Raeford are Office & Administration (267 | 15.3%), and Sales & Related (163 | 9.4%).
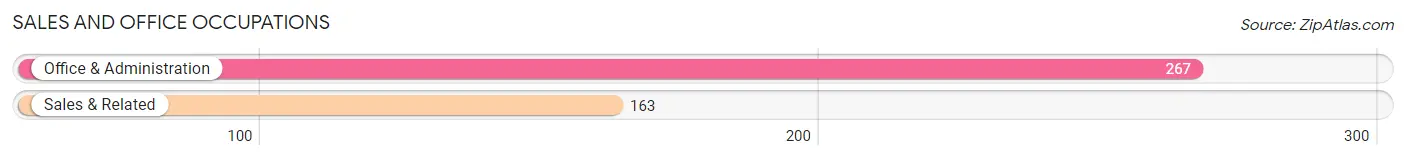
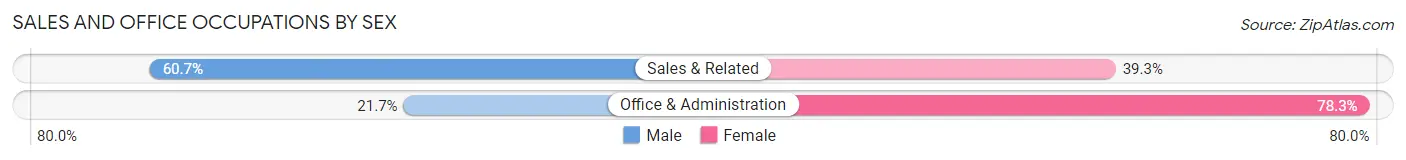
Sales and Office Occupations by Sex
| Occupation | Male | Female |
| Sales & Related | 99 (60.7%) | 64 (39.3%) |
| Office & Administration | 58 (21.7%) | 209 (78.3%) |
| Total (Category) | 157 (36.5%) | 273 (63.5%) |
| Total (Overall) | 856 (49.2%) | 885 (50.8%) |
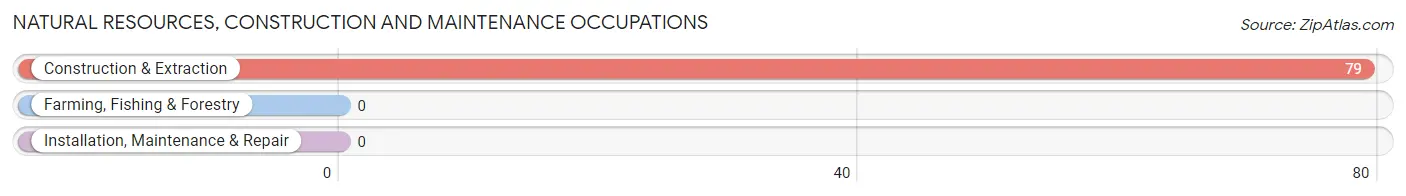
Natural Resources, Construction and Maintenance Occupations
The most common Natural Resources, Construction and Maintenance occupations in Raeford are , and Construction & Extraction (79 | 4.5%).
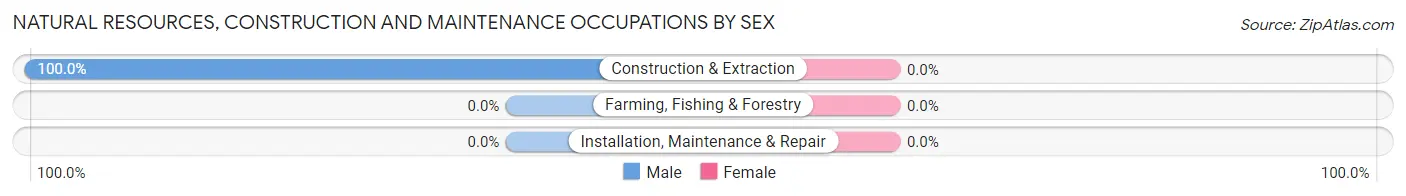
Natural Resources, Construction and Maintenance Occupations by Sex
| Occupation | Male | Female |
| Farming, Fishing & Forestry | 0 (0.0%) | 0 (0.0%) |
| Construction & Extraction | 79 (100.0%) | 0 (0.0%) |
| Installation, Maintenance & Repair | 0 (0.0%) | 0 (0.0%) |
| Total (Category) | 79 (100.0%) | 0 (0.0%) |
| Total (Overall) | 856 (49.2%) | 885 (50.8%) |
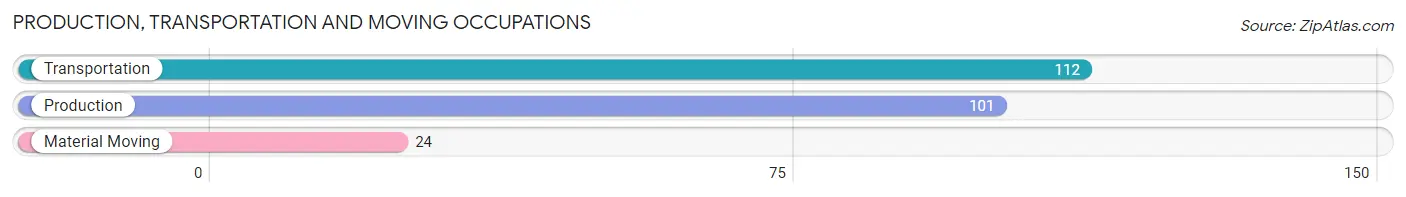
Production, Transportation and Moving Occupations
The most common Production, Transportation and Moving occupations in Raeford are Transportation (112 | 6.4%), Production (101 | 5.8%), and Material Moving (24 | 1.4%).
Production, Transportation and Moving Occupations by Sex
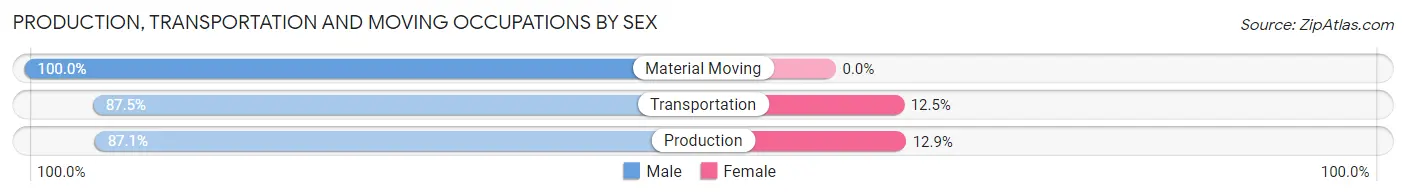
| Occupation | Male | Female |
| Production | 88 (87.1%) | 13 (12.9%) |
| Transportation | 98 (87.5%) | 14 (12.5%) |
| Material Moving | 24 (100.0%) | 0 (0.0%) |
| Total (Category) | 210 (88.6%) | 27 (11.4%) |
| Total (Overall) | 856 (49.2%) | 885 (50.8%) |
Employment Industries by Sex in Raeford
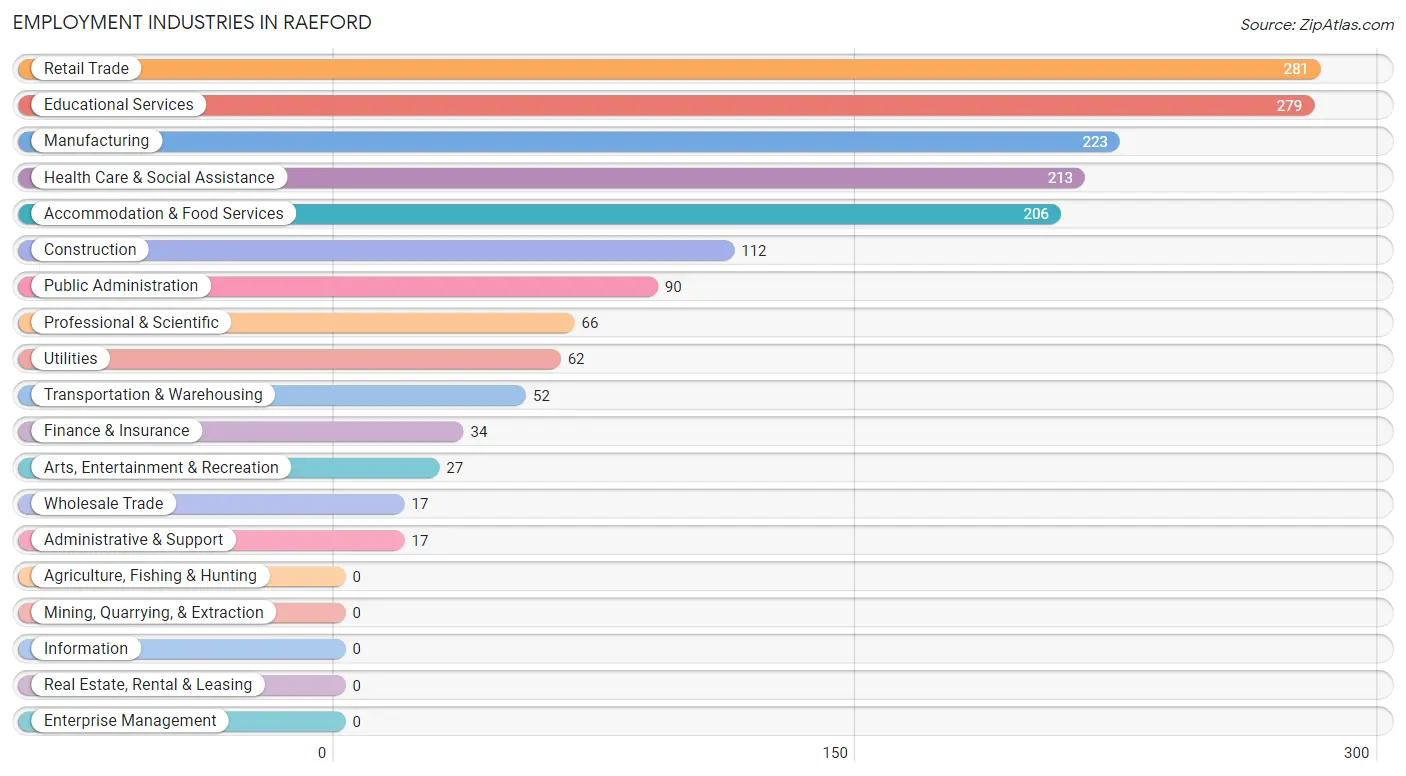
Employment Industries in Raeford
The major employment industries in Raeford include Retail Trade (281 | 16.1%), Educational Services (279 | 16.0%), Manufacturing (223 | 12.8%), Health Care & Social Assistance (213 | 12.2%), and Accommodation & Food Services (206 | 11.8%).
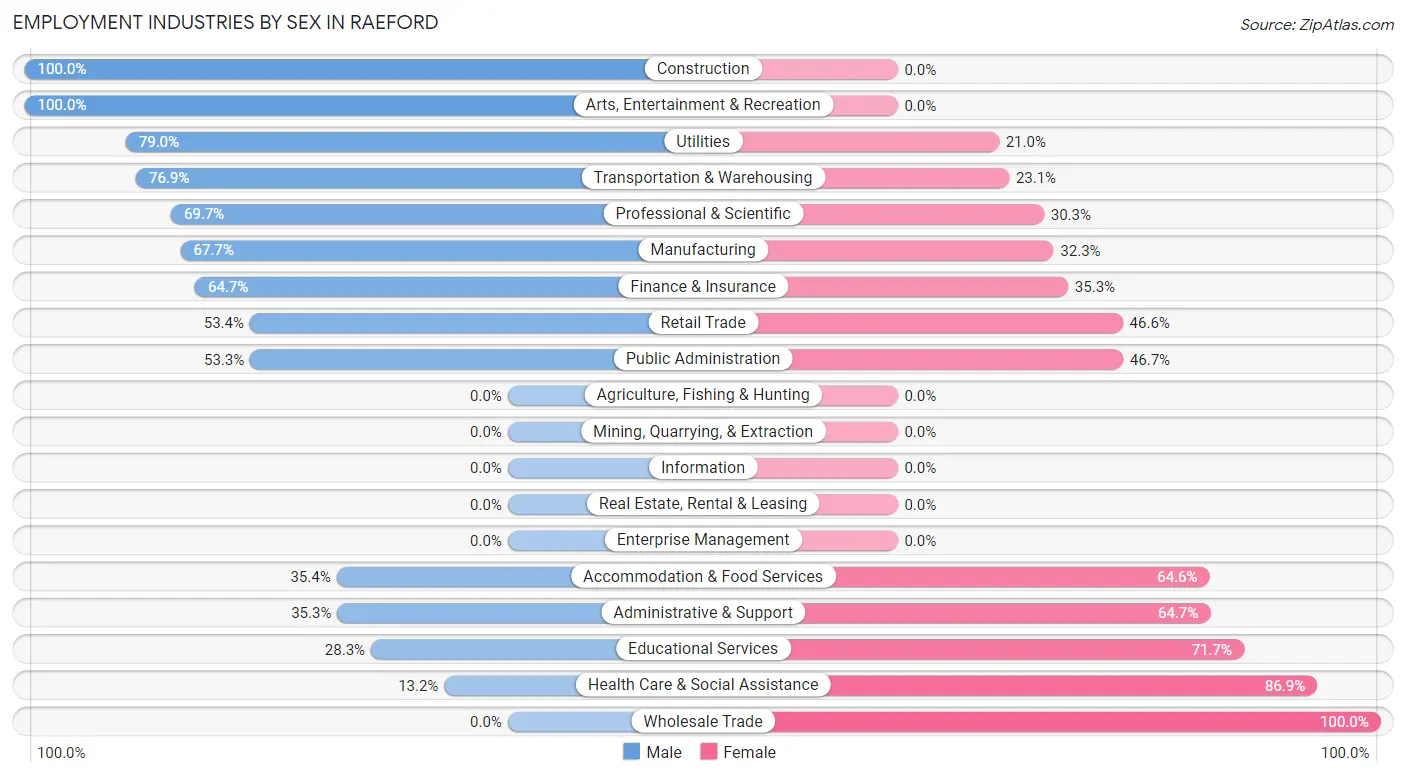
Employment Industries by Sex in Raeford
The Raeford industries that see more men than women are Construction (100.0%), Arts, Entertainment & Recreation (100.0%), and Utilities (79.0%), whereas the industries that tend to have a higher number of women are Wholesale Trade (100.0%), Health Care & Social Assistance (86.9%), and Educational Services (71.7%).
| Industry | Male | Female |
| Agriculture, Fishing & Hunting | 0 (0.0%) | 0 (0.0%) |
| Mining, Quarrying, & Extraction | 0 (0.0%) | 0 (0.0%) |
| Construction | 112 (100.0%) | 0 (0.0%) |
| Manufacturing | 151 (67.7%) | 72 (32.3%) |
| Wholesale Trade | 0 (0.0%) | 17 (100.0%) |
| Retail Trade | 150 (53.4%) | 131 (46.6%) |
| Transportation & Warehousing | 40 (76.9%) | 12 (23.1%) |
| Utilities | 49 (79.0%) | 13 (21.0%) |
| Information | 0 (0.0%) | 0 (0.0%) |
| Finance & Insurance | 22 (64.7%) | 12 (35.3%) |
| Real Estate, Rental & Leasing | 0 (0.0%) | 0 (0.0%) |
| Professional & Scientific | 46 (69.7%) | 20 (30.3%) |
| Enterprise Management | 0 (0.0%) | 0 (0.0%) |
| Administrative & Support | 6 (35.3%) | 11 (64.7%) |
| Educational Services | 79 (28.3%) | 200 (71.7%) |
| Health Care & Social Assistance | 28 (13.2%) | 185 (86.9%) |
| Arts, Entertainment & Recreation | 27 (100.0%) | 0 (0.0%) |
| Accommodation & Food Services | 73 (35.4%) | 133 (64.6%) |
| Public Administration | 48 (53.3%) | 42 (46.7%) |
| Total | 856 (49.2%) | 885 (50.8%) |
Education in Raeford
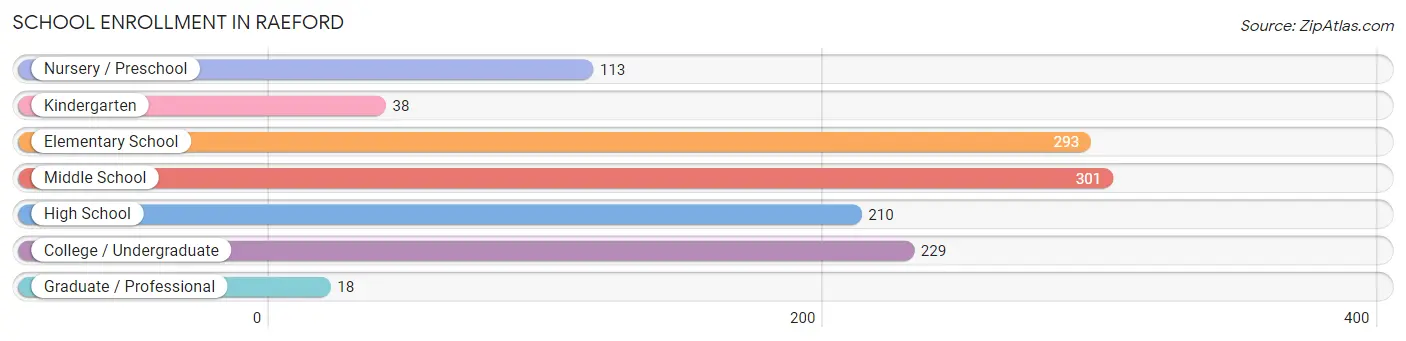
School Enrollment in Raeford
The most common levels of schooling among the 1,202 students in Raeford are middle school (301 | 25.0%), elementary school (293 | 24.4%), and college / undergraduate (229 | 19.1%).
| School Level | # Students | % Students |
| Nursery / Preschool | 113 | 9.4% |
| Kindergarten | 38 | 3.2% |
| Elementary School | 293 | 24.4% |
| Middle School | 301 | 25.0% |
| High School | 210 | 17.5% |
| College / Undergraduate | 229 | 19.1% |
| Graduate / Professional | 18 | 1.5% |
| Total | 1,202 | 100.0% |
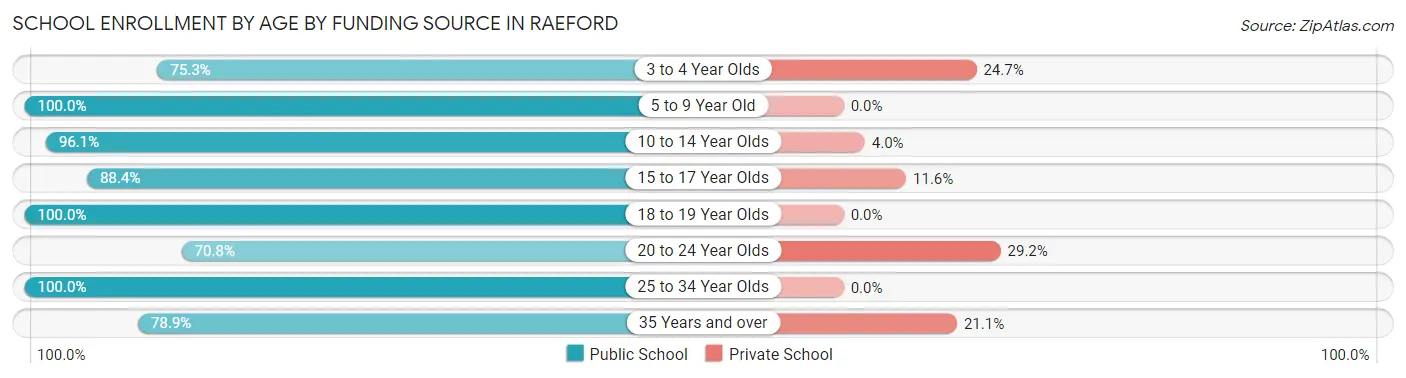
School Enrollment by Age by Funding Source in Raeford
Out of a total of 1,202 students who are enrolled in schools in Raeford, 115 (9.6%) attend a private institution, while the remaining 1,087 (90.4%) are enrolled in public schools. The age group of 20 to 24 year olds has the highest likelihood of being enrolled in private schools, with 38 (29.2% in the age bracket) enrolled. Conversely, the age group of 5 to 9 year old has the lowest likelihood of being enrolled in a private school, with 294 (100.0% in the age bracket) attending a public institution.
| Age Bracket | Public School | Private School |
| 3 to 4 Year Olds | 73 (75.3%) | 24 (24.7%) |
| 5 to 9 Year Old | 294 (100.0%) | 0 (0.0%) |
| 10 to 14 Year Olds | 340 (96.1%) | 14 (4.0%) |
| 15 to 17 Year Olds | 152 (88.4%) | 20 (11.6%) |
| 18 to 19 Year Olds | 27 (100.0%) | 0 (0.0%) |
| 20 to 24 Year Olds | 92 (70.8%) | 38 (29.2%) |
| 25 to 34 Year Olds | 38 (100.0%) | 0 (0.0%) |
| 35 Years and over | 71 (78.9%) | 19 (21.1%) |
| Total | 1,087 (90.4%) | 115 (9.6%) |
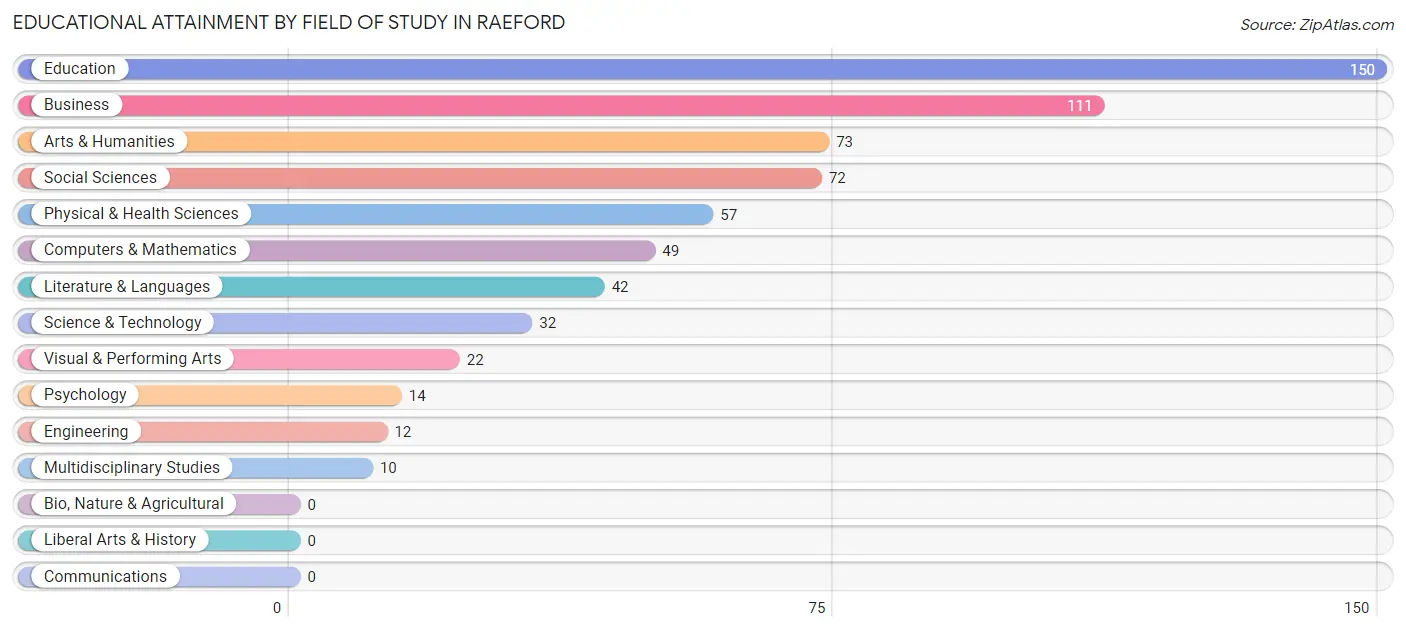
Educational Attainment by Field of Study in Raeford
Education (150 | 23.3%), business (111 | 17.2%), arts & humanities (73 | 11.3%), social sciences (72 | 11.2%), and physical & health sciences (57 | 8.8%) are the most common fields of study among 644 individuals in Raeford who have obtained a bachelor's degree or higher.
| Field of Study | # Graduates | % Graduates |
| Computers & Mathematics | 49 | 7.6% |
| Bio, Nature & Agricultural | 0 | 0.0% |
| Physical & Health Sciences | 57 | 8.8% |
| Psychology | 14 | 2.2% |
| Social Sciences | 72 | 11.2% |
| Engineering | 12 | 1.9% |
| Multidisciplinary Studies | 10 | 1.5% |
| Science & Technology | 32 | 5.0% |
| Business | 111 | 17.2% |
| Education | 150 | 23.3% |
| Literature & Languages | 42 | 6.5% |
| Liberal Arts & History | 0 | 0.0% |
| Visual & Performing Arts | 22 | 3.4% |
| Communications | 0 | 0.0% |
| Arts & Humanities | 73 | 11.3% |
| Total | 644 | 100.0% |
Transportation & Commute in Raeford
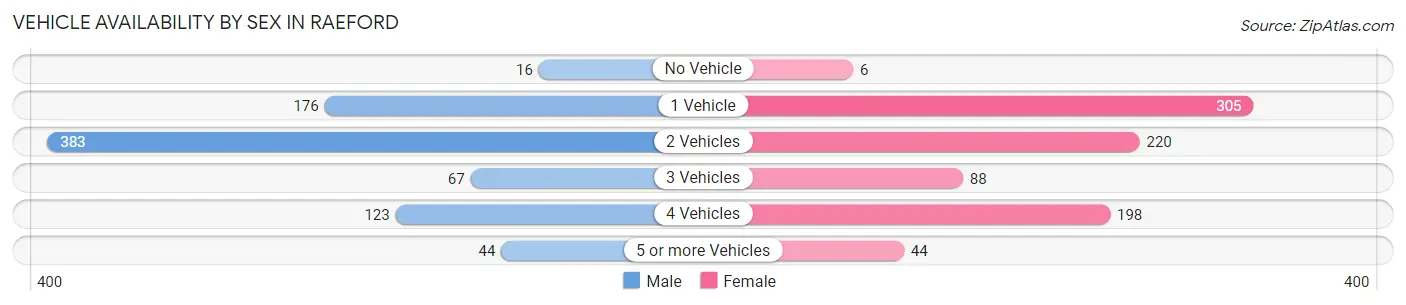
Vehicle Availability by Sex in Raeford
The most prevalent vehicle ownership categories in Raeford are males with 2 vehicles (383, accounting for 47.3%) and females with 2 vehicles (220, making up 44.5%).
| Vehicles Available | Male | Female |
| No Vehicle | 16 (2.0%) | 6 (0.7%) |
| 1 Vehicle | 176 (21.8%) | 305 (35.4%) |
| 2 Vehicles | 383 (47.3%) | 220 (25.6%) |
| 3 Vehicles | 67 (8.3%) | 88 (10.2%) |
| 4 Vehicles | 123 (15.2%) | 198 (23.0%) |
| 5 or more Vehicles | 44 (5.4%) | 44 (5.1%) |
| Total | 809 (100.0%) | 861 (100.0%) |
Commute Time in Raeford
The most frequently occuring commute durations in Raeford are 10 to 14 minutes (297 commuters, 18.9%), 5 to 9 minutes (259 commuters, 16.5%), and 15 to 19 minutes (182 commuters, 11.6%).
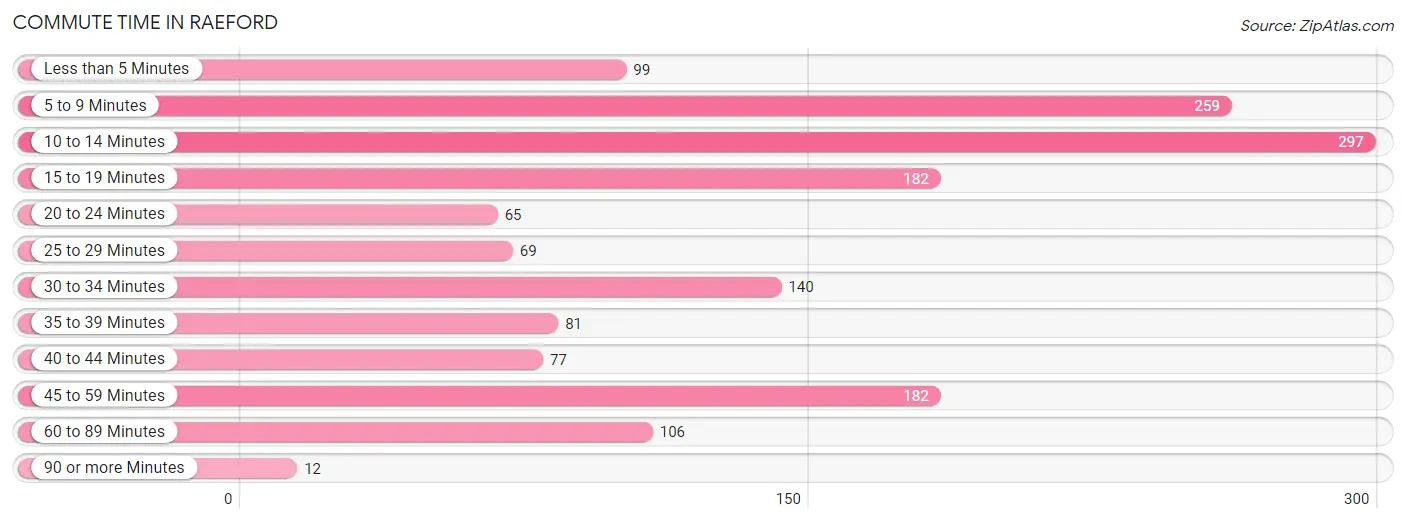
| Commute Time | # Commuters | % Commuters |
| Less than 5 Minutes | 99 | 6.3% |
| 5 to 9 Minutes | 259 | 16.5% |
| 10 to 14 Minutes | 297 | 18.9% |
| 15 to 19 Minutes | 182 | 11.6% |
| 20 to 24 Minutes | 65 | 4.1% |
| 25 to 29 Minutes | 69 | 4.4% |
| 30 to 34 Minutes | 140 | 8.9% |
| 35 to 39 Minutes | 81 | 5.2% |
| 40 to 44 Minutes | 77 | 4.9% |
| 45 to 59 Minutes | 182 | 11.6% |
| 60 to 89 Minutes | 106 | 6.8% |
| 90 or more Minutes | 12 | 0.8% |
Commute Time by Sex in Raeford
The most common commute times in Raeford are 10 to 14 minutes (121 commuters, 15.5%) for males and 5 to 9 minutes (191 commuters, 24.2%) for females.
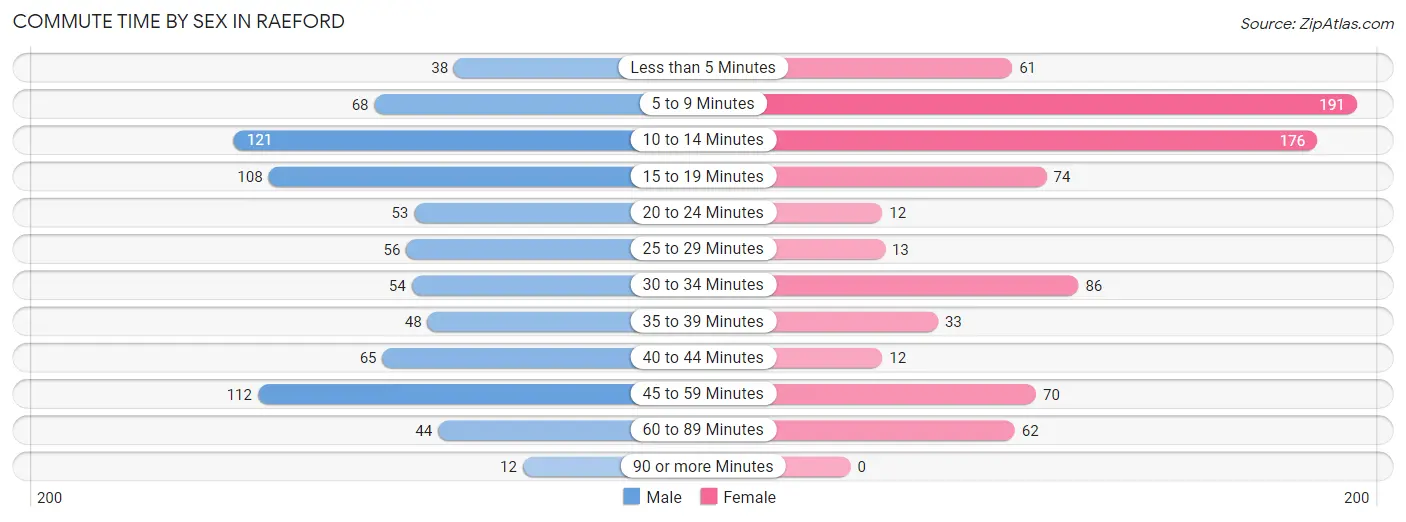
| Commute Time | Male | Female |
| Less than 5 Minutes | 38 (4.9%) | 61 (7.7%) |
| 5 to 9 Minutes | 68 (8.7%) | 191 (24.2%) |
| 10 to 14 Minutes | 121 (15.5%) | 176 (22.3%) |
| 15 to 19 Minutes | 108 (13.9%) | 74 (9.4%) |
| 20 to 24 Minutes | 53 (6.8%) | 12 (1.5%) |
| 25 to 29 Minutes | 56 (7.2%) | 13 (1.7%) |
| 30 to 34 Minutes | 54 (6.9%) | 86 (10.9%) |
| 35 to 39 Minutes | 48 (6.2%) | 33 (4.2%) |
| 40 to 44 Minutes | 65 (8.3%) | 12 (1.5%) |
| 45 to 59 Minutes | 112 (14.4%) | 70 (8.9%) |
| 60 to 89 Minutes | 44 (5.7%) | 62 (7.9%) |
| 90 or more Minutes | 12 (1.5%) | 0 (0.0%) |
Time of Departure to Work by Sex in Raeford
The most frequent times of departure to work in Raeford are 12:00 PM to 3:59 PM (169, 21.7%) for males and 7:00 AM to 7:29 AM (199, 25.2%) for females.
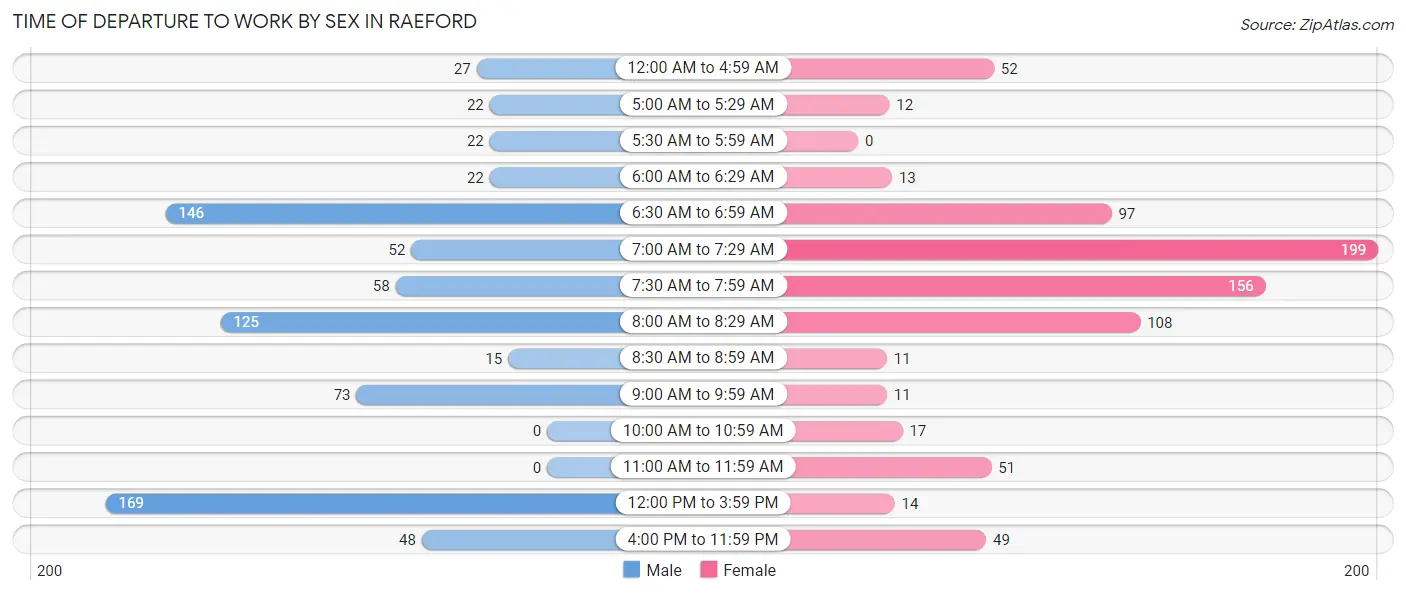
| Time of Departure | Male | Female |
| 12:00 AM to 4:59 AM | 27 (3.5%) | 52 (6.6%) |
| 5:00 AM to 5:29 AM | 22 (2.8%) | 12 (1.5%) |
| 5:30 AM to 5:59 AM | 22 (2.8%) | 0 (0.0%) |
| 6:00 AM to 6:29 AM | 22 (2.8%) | 13 (1.7%) |
| 6:30 AM to 6:59 AM | 146 (18.7%) | 97 (12.3%) |
| 7:00 AM to 7:29 AM | 52 (6.7%) | 199 (25.2%) |
| 7:30 AM to 7:59 AM | 58 (7.4%) | 156 (19.8%) |
| 8:00 AM to 8:29 AM | 125 (16.1%) | 108 (13.7%) |
| 8:30 AM to 8:59 AM | 15 (1.9%) | 11 (1.4%) |
| 9:00 AM to 9:59 AM | 73 (9.4%) | 11 (1.4%) |
| 10:00 AM to 10:59 AM | 0 (0.0%) | 17 (2.1%) |
| 11:00 AM to 11:59 AM | 0 (0.0%) | 51 (6.5%) |
| 12:00 PM to 3:59 PM | 169 (21.7%) | 14 (1.8%) |
| 4:00 PM to 11:59 PM | 48 (6.2%) | 49 (6.2%) |
| Total | 779 (100.0%) | 790 (100.0%) |
Housing Occupancy in Raeford
Occupancy by Ownership in Raeford
Of the total 1,767 dwellings in Raeford, owner-occupied units account for 935 (52.9%), while renter-occupied units make up 832 (47.1%).
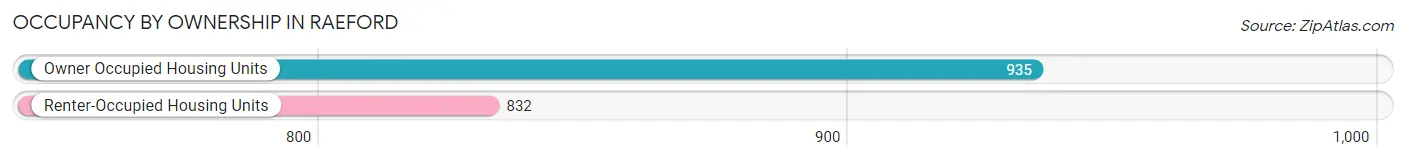
| Occupancy | # Housing Units | % Housing Units |
| Owner Occupied Housing Units | 935 | 52.9% |
| Renter-Occupied Housing Units | 832 | 47.1% |
| Total Occupied Housing Units | 1,767 | 100.0% |
Occupancy by Household Size in Raeford
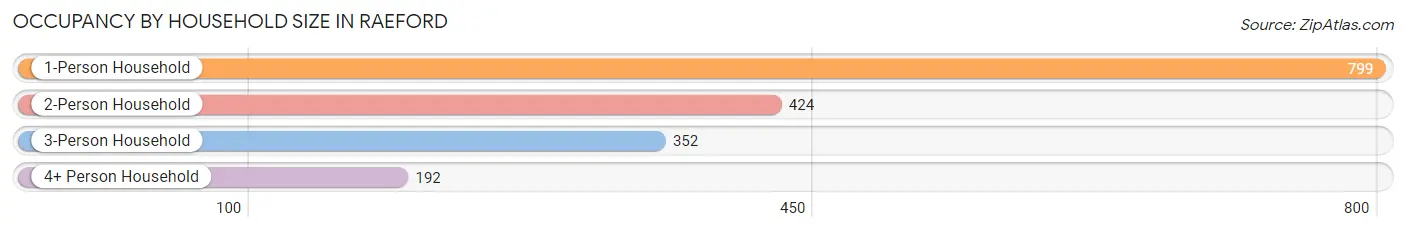
| Household Size | # Housing Units | % Housing Units |
| 1-Person Household | 799 | 45.2% |
| 2-Person Household | 424 | 24.0% |
| 3-Person Household | 352 | 19.9% |
| 4+ Person Household | 192 | 10.9% |
| Total Housing Units | 1,767 | 100.0% |
Occupancy by Ownership by Household Size in Raeford
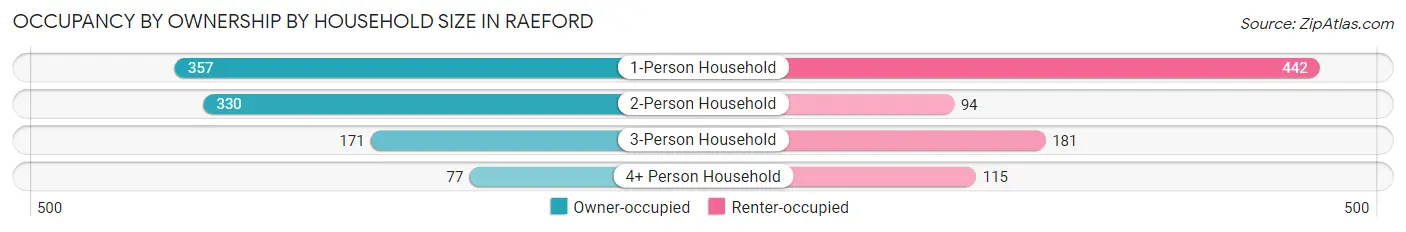
| Household Size | Owner-occupied | Renter-occupied |
| 1-Person Household | 357 (44.7%) | 442 (55.3%) |
| 2-Person Household | 330 (77.8%) | 94 (22.2%) |
| 3-Person Household | 171 (48.6%) | 181 (51.4%) |
| 4+ Person Household | 77 (40.1%) | 115 (59.9%) |
| Total Housing Units | 935 (52.9%) | 832 (47.1%) |
Occupancy by Educational Attainment in Raeford
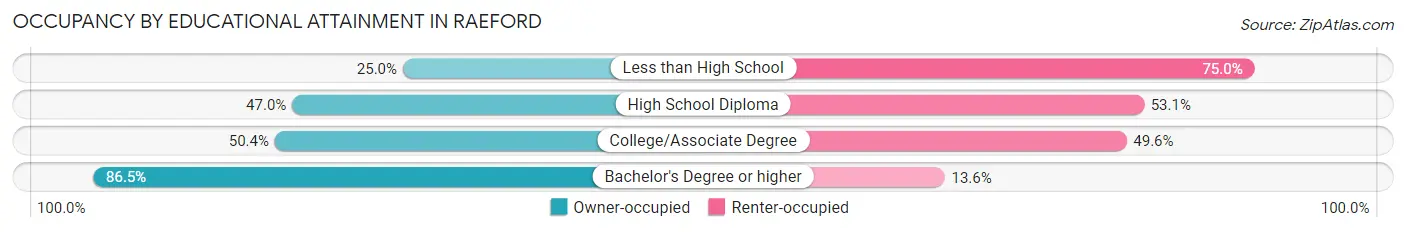
| Household Size | Owner-occupied | Renter-occupied |
| Less than High School | 49 (25.0%) | 147 (75.0%) |
| High School Diploma | 239 (46.9%) | 270 (53.0%) |
| College/Associate Degree | 379 (50.4%) | 373 (49.6%) |
| Bachelor's Degree or higher | 268 (86.5%) | 42 (13.6%) |
Occupancy by Age of Householder in Raeford
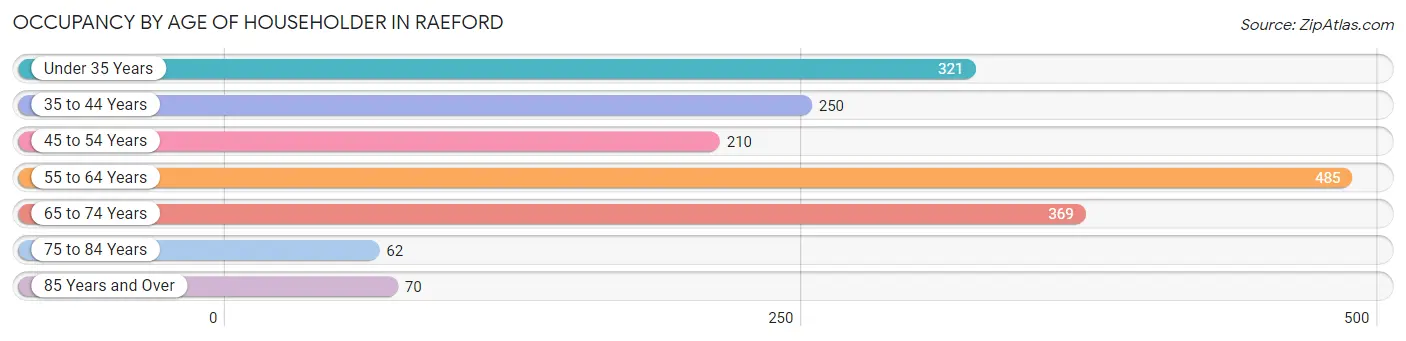
| Age Bracket | # Households | % Households |
| Under 35 Years | 321 | 18.2% |
| 35 to 44 Years | 250 | 14.1% |
| 45 to 54 Years | 210 | 11.9% |
| 55 to 64 Years | 485 | 27.5% |
| 65 to 74 Years | 369 | 20.9% |
| 75 to 84 Years | 62 | 3.5% |
| 85 Years and Over | 70 | 4.0% |
| Total | 1,767 | 100.0% |
Housing Finances in Raeford
Median Income by Occupancy in Raeford
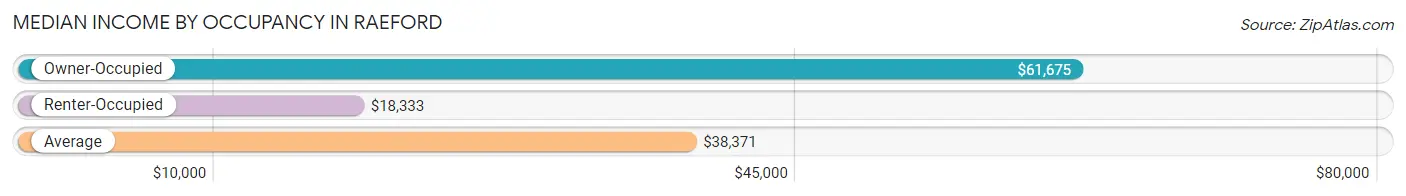
| Occupancy Type | # Households | Median Income |
| Owner-Occupied | 935 (52.9%) | $61,675 |
| Renter-Occupied | 832 (47.1%) | $18,333 |
| Average | 1,767 (100.0%) | $38,371 |
Occupancy by Householder Income Bracket in Raeford
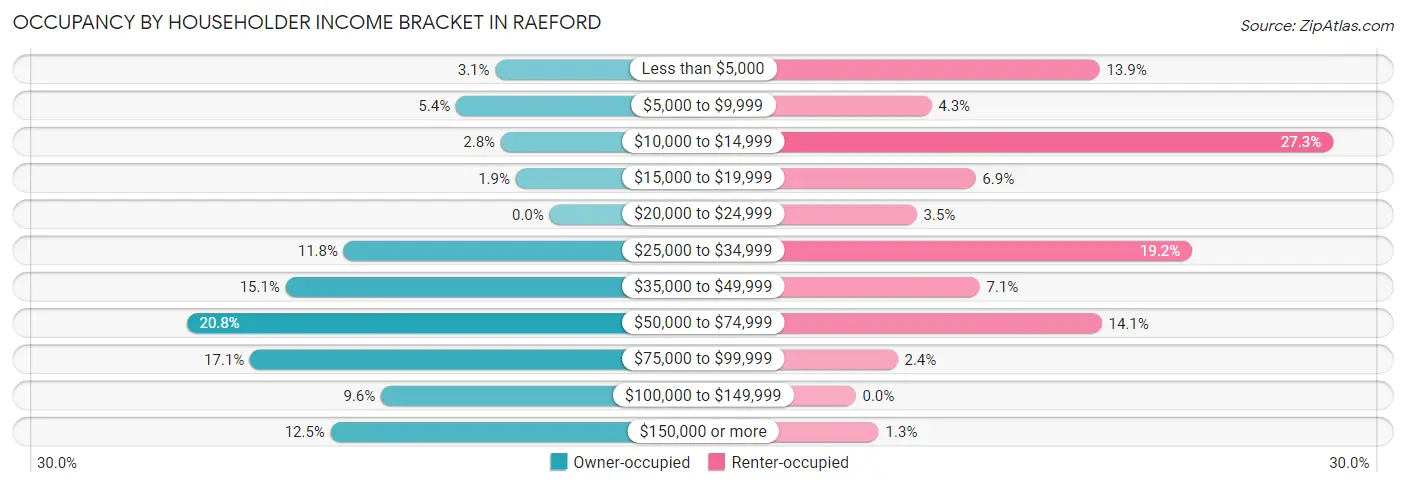
| Income Bracket | Owner-occupied | Renter-occupied |
| Less than $5,000 | 29 (3.1%) | 116 (13.9%) |
| $5,000 to $9,999 | 50 (5.3%) | 36 (4.3%) |
| $10,000 to $14,999 | 26 (2.8%) | 227 (27.3%) |
| $15,000 to $19,999 | 18 (1.9%) | 57 (6.9%) |
| $20,000 to $24,999 | 0 (0.0%) | 29 (3.5%) |
| $25,000 to $34,999 | 110 (11.8%) | 160 (19.2%) |
| $35,000 to $49,999 | 141 (15.1%) | 59 (7.1%) |
| $50,000 to $74,999 | 194 (20.7%) | 117 (14.1%) |
| $75,000 to $99,999 | 160 (17.1%) | 20 (2.4%) |
| $100,000 to $149,999 | 90 (9.6%) | 0 (0.0%) |
| $150,000 or more | 117 (12.5%) | 11 (1.3%) |
| Total | 935 (100.0%) | 832 (100.0%) |
Monthly Housing Cost Tiers in Raeford
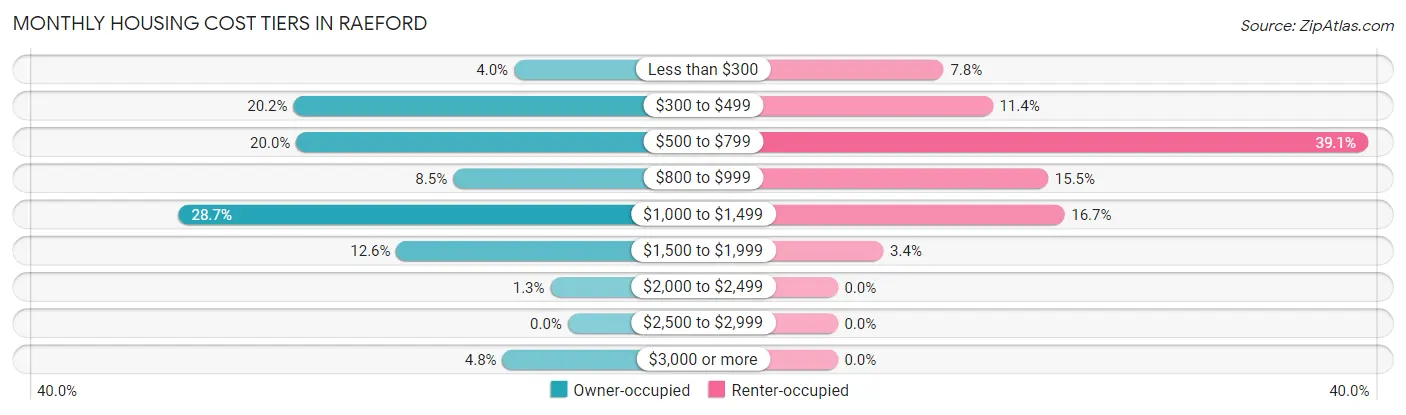
| Monthly Cost | Owner-occupied | Renter-occupied |
| Less than $300 | 37 (4.0%) | 65 (7.8%) |
| $300 to $499 | 189 (20.2%) | 95 (11.4%) |
| $500 to $799 | 187 (20.0%) | 325 (39.1%) |
| $800 to $999 | 79 (8.5%) | 129 (15.5%) |
| $1,000 to $1,499 | 268 (28.7%) | 139 (16.7%) |
| $1,500 to $1,999 | 118 (12.6%) | 28 (3.4%) |
| $2,000 to $2,499 | 12 (1.3%) | 0 (0.0%) |
| $2,500 to $2,999 | 0 (0.0%) | 0 (0.0%) |
| $3,000 or more | 45 (4.8%) | 0 (0.0%) |
| Total | 935 (100.0%) | 832 (100.0%) |
Physical Housing Characteristics in Raeford
Housing Structures in Raeford
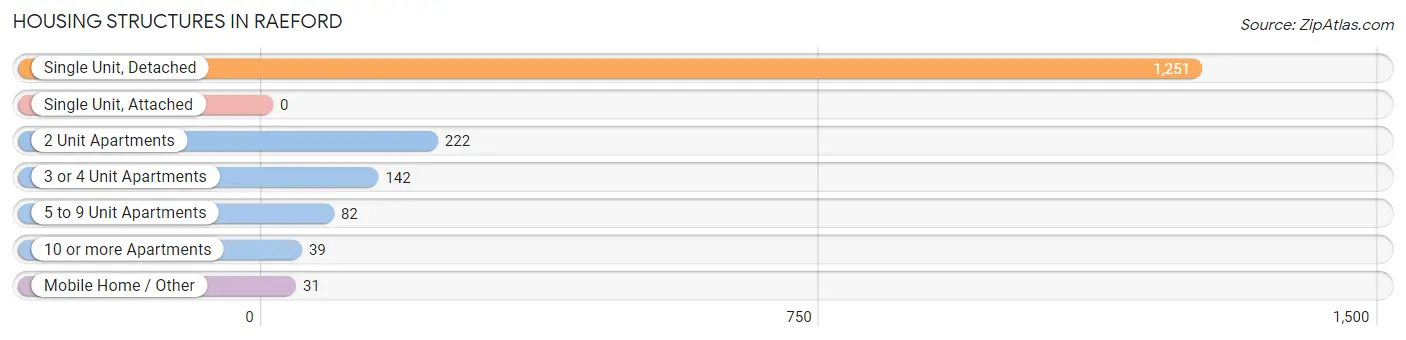
| Structure Type | # Housing Units | % Housing Units |
| Single Unit, Detached | 1,251 | 70.8% |
| Single Unit, Attached | 0 | 0.0% |
| 2 Unit Apartments | 222 | 12.6% |
| 3 or 4 Unit Apartments | 142 | 8.0% |
| 5 to 9 Unit Apartments | 82 | 4.6% |
| 10 or more Apartments | 39 | 2.2% |
| Mobile Home / Other | 31 | 1.8% |
| Total | 1,767 | 100.0% |
Housing Structures by Occupancy in Raeford
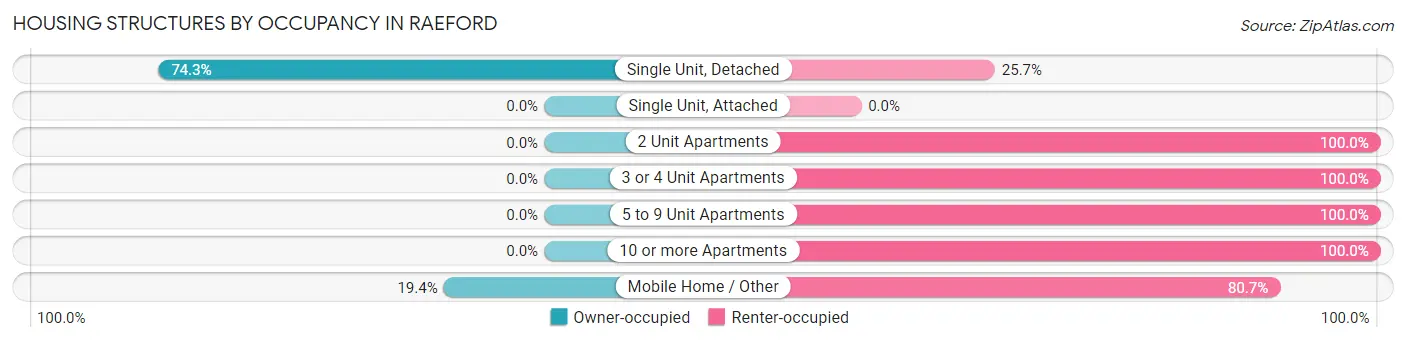
| Structure Type | Owner-occupied | Renter-occupied |
| Single Unit, Detached | 929 (74.3%) | 322 (25.7%) |
| Single Unit, Attached | 0 (0.0%) | 0 (0.0%) |
| 2 Unit Apartments | 0 (0.0%) | 222 (100.0%) |
| 3 or 4 Unit Apartments | 0 (0.0%) | 142 (100.0%) |
| 5 to 9 Unit Apartments | 0 (0.0%) | 82 (100.0%) |
| 10 or more Apartments | 0 (0.0%) | 39 (100.0%) |
| Mobile Home / Other | 6 (19.4%) | 25 (80.6%) |
| Total | 935 (52.9%) | 832 (47.1%) |
Housing Structures by Number of Rooms in Raeford
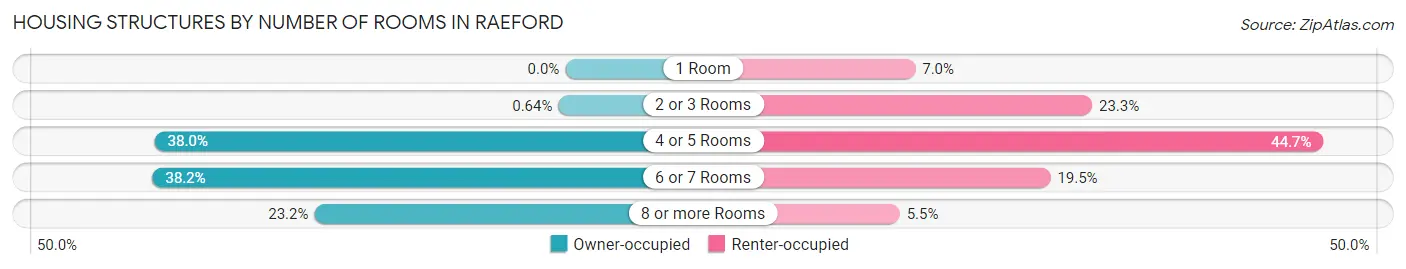
| Number of Rooms | Owner-occupied | Renter-occupied |
| 1 Room | 0 (0.0%) | 58 (7.0%) |
| 2 or 3 Rooms | 6 (0.6%) | 194 (23.3%) |
| 4 or 5 Rooms | 355 (38.0%) | 372 (44.7%) |
| 6 or 7 Rooms | 357 (38.2%) | 162 (19.5%) |
| 8 or more Rooms | 217 (23.2%) | 46 (5.5%) |
| Total | 935 (100.0%) | 832 (100.0%) |
Housing Structure by Heating Type in Raeford
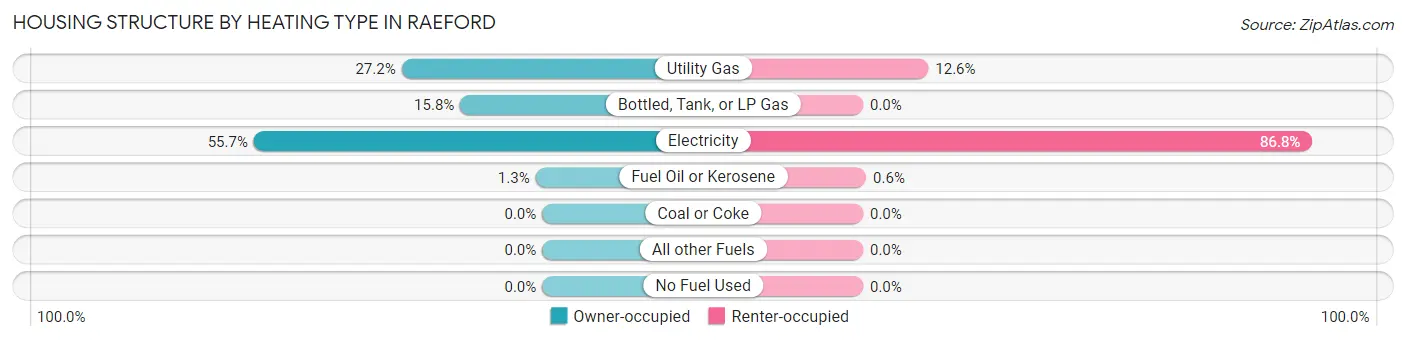
| Heating Type | Owner-occupied | Renter-occupied |
| Utility Gas | 254 (27.2%) | 105 (12.6%) |
| Bottled, Tank, or LP Gas | 148 (15.8%) | 0 (0.0%) |
| Electricity | 521 (55.7%) | 722 (86.8%) |
| Fuel Oil or Kerosene | 12 (1.3%) | 5 (0.6%) |
| Coal or Coke | 0 (0.0%) | 0 (0.0%) |
| All other Fuels | 0 (0.0%) | 0 (0.0%) |
| No Fuel Used | 0 (0.0%) | 0 (0.0%) |
| Total | 935 (100.0%) | 832 (100.0%) |
Household Vehicle Usage in Raeford
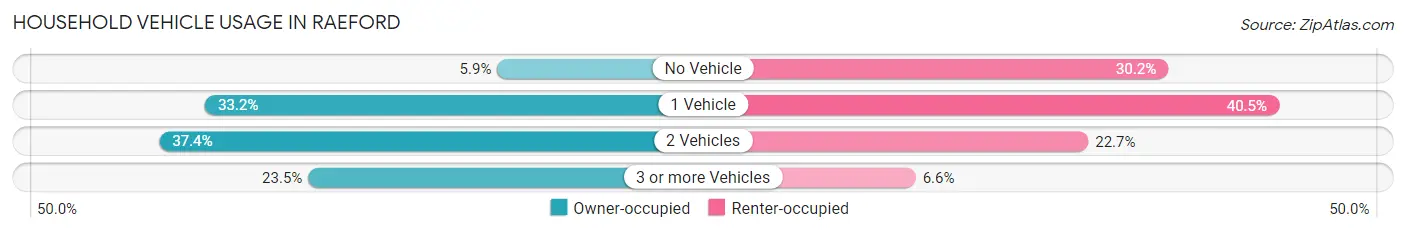
| Vehicles per Household | Owner-occupied | Renter-occupied |
| No Vehicle | 55 (5.9%) | 251 (30.2%) |
| 1 Vehicle | 310 (33.2%) | 337 (40.5%) |
| 2 Vehicles | 350 (37.4%) | 189 (22.7%) |
| 3 or more Vehicles | 220 (23.5%) | 55 (6.6%) |
| Total | 935 (100.0%) | 832 (100.0%) |
Real Estate & Mortgages in Raeford
Real Estate and Mortgage Overview in Raeford
| Characteristic | Without Mortgage | With Mortgage |
| Housing Units | 377 | 558 |
| Median Property Value | $111,700 | $154,200 |
| Median Household Income | $52,014 | $76 |
| Monthly Housing Costs | $451 | $45 |
| Real Estate Taxes | $1,155 | $0 |
Property Value by Mortgage Status in Raeford
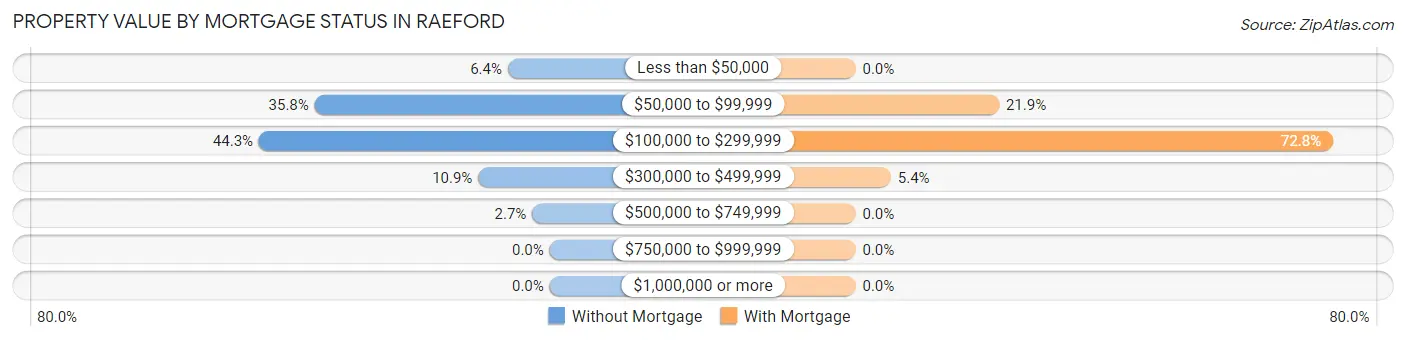
| Property Value | Without Mortgage | With Mortgage |
| Less than $50,000 | 24 (6.4%) | 0 (0.0%) |
| $50,000 to $99,999 | 135 (35.8%) | 122 (21.9%) |
| $100,000 to $299,999 | 167 (44.3%) | 406 (72.8%) |
| $300,000 to $499,999 | 41 (10.9%) | 30 (5.4%) |
| $500,000 to $749,999 | 10 (2.6%) | 0 (0.0%) |
| $750,000 to $999,999 | 0 (0.0%) | 0 (0.0%) |
| $1,000,000 or more | 0 (0.0%) | 0 (0.0%) |
| Total | 377 (100.0%) | 558 (100.0%) |
Household Income by Mortgage Status in Raeford
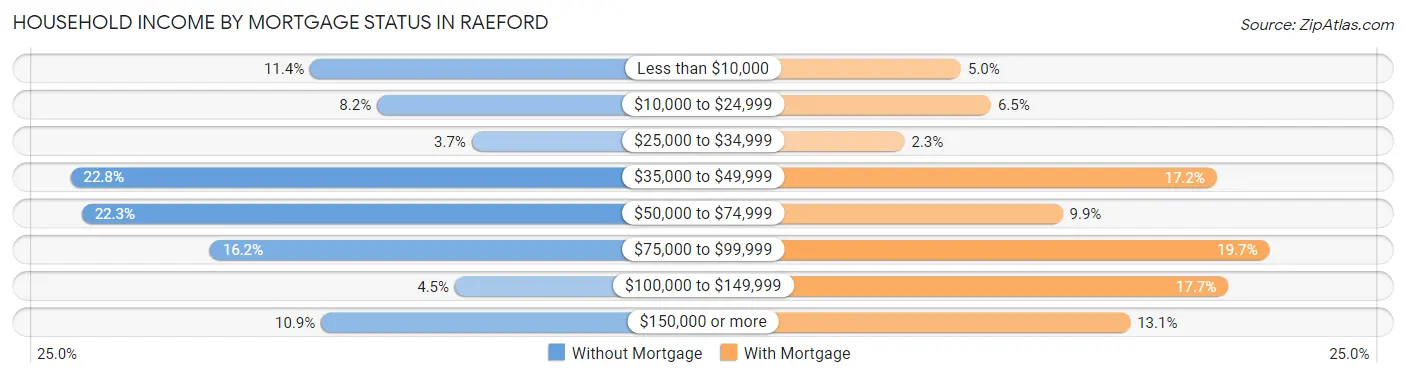
| Household Income | Without Mortgage | With Mortgage |
| Less than $10,000 | 43 (11.4%) | 28 (5.0%) |
| $10,000 to $24,999 | 31 (8.2%) | 36 (6.5%) |
| $25,000 to $34,999 | 14 (3.7%) | 13 (2.3%) |
| $35,000 to $49,999 | 86 (22.8%) | 96 (17.2%) |
| $50,000 to $74,999 | 84 (22.3%) | 55 (9.9%) |
| $75,000 to $99,999 | 61 (16.2%) | 110 (19.7%) |
| $100,000 to $149,999 | 17 (4.5%) | 99 (17.7%) |
| $150,000 or more | 41 (10.9%) | 73 (13.1%) |
| Total | 377 (100.0%) | 558 (100.0%) |
Property Value to Household Income Ratio in Raeford
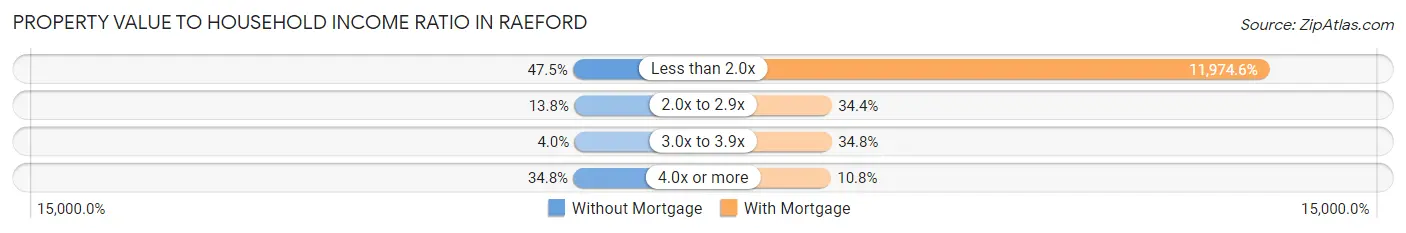
| Value-to-Income Ratio | Without Mortgage | With Mortgage |
| Less than 2.0x | 179 (47.5%) | 66,818 (11,974.6%) |
| 2.0x to 2.9x | 52 (13.8%) | 192 (34.4%) |
| 3.0x to 3.9x | 15 (4.0%) | 194 (34.8%) |
| 4.0x or more | 131 (34.7%) | 60 (10.7%) |
| Total | 377 (100.0%) | 558 (100.0%) |
Real Estate Taxes by Mortgage Status in Raeford
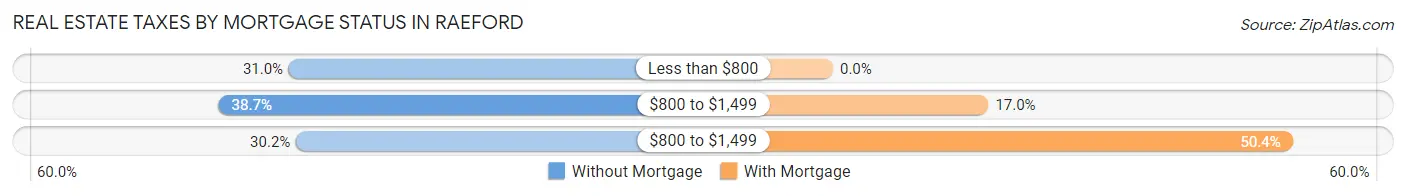
| Property Taxes | Without Mortgage | With Mortgage |
| Less than $800 | 117 (31.0%) | 0 (0.0%) |
| $800 to $1,499 | 146 (38.7%) | 95 (17.0%) |
| $800 to $1,499 | 114 (30.2%) | 281 (50.4%) |
| Total | 377 (100.0%) | 558 (100.0%) |
Health & Disability in Raeford
Health Insurance Coverage by Age in Raeford
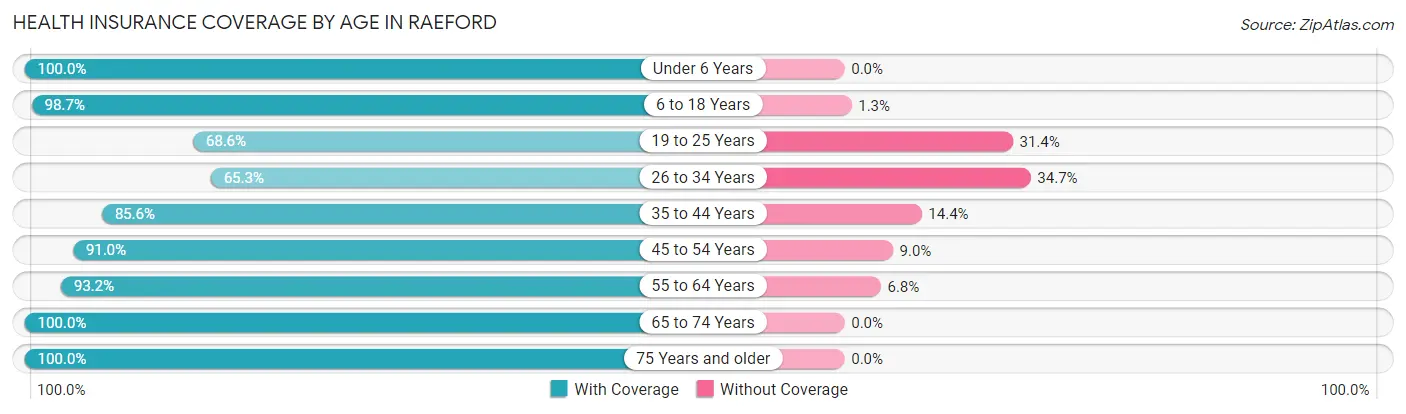
| Age Bracket | With Coverage | Without Coverage |
| Under 6 Years | 238 (100.0%) | 0 (0.0%) |
| 6 to 18 Years | 838 (98.7%) | 11 (1.3%) |
| 19 to 25 Years | 328 (68.6%) | 150 (31.4%) |
| 26 to 34 Years | 205 (65.3%) | 109 (34.7%) |
| 35 to 44 Years | 393 (85.6%) | 66 (14.4%) |
| 45 to 54 Years | 374 (91.0%) | 37 (9.0%) |
| 55 to 64 Years | 662 (93.2%) | 48 (6.8%) |
| 65 to 74 Years | 513 (100.0%) | 0 (0.0%) |
| 75 Years and older | 202 (100.0%) | 0 (0.0%) |
| Total | 3,753 (89.9%) | 421 (10.1%) |
Health Insurance Coverage by Citizenship Status in Raeford
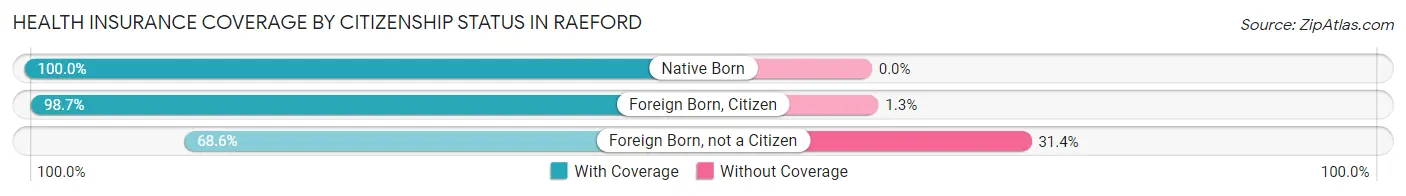
| Citizenship Status | With Coverage | Without Coverage |
| Native Born | 238 (100.0%) | 0 (0.0%) |
| Foreign Born, Citizen | 838 (98.7%) | 11 (1.3%) |
| Foreign Born, not a Citizen | 328 (68.6%) | 150 (31.4%) |
Health Insurance Coverage by Household Income in Raeford
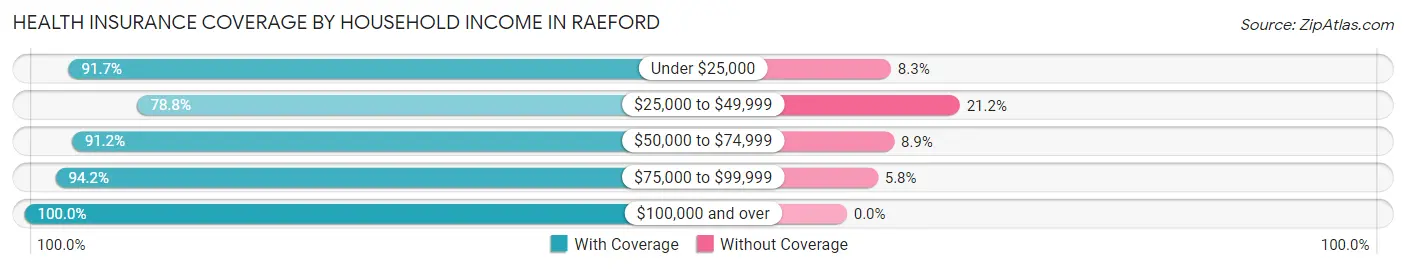
| Household Income | With Coverage | Without Coverage |
| Under $25,000 | 978 (91.7%) | 88 (8.3%) |
| $25,000 to $49,999 | 842 (78.8%) | 226 (21.2%) |
| $50,000 to $74,999 | 783 (91.1%) | 76 (8.8%) |
| $75,000 to $99,999 | 503 (94.2%) | 31 (5.8%) |
| $100,000 and over | 603 (100.0%) | 0 (0.0%) |
Public vs Private Health Insurance Coverage by Age in Raeford
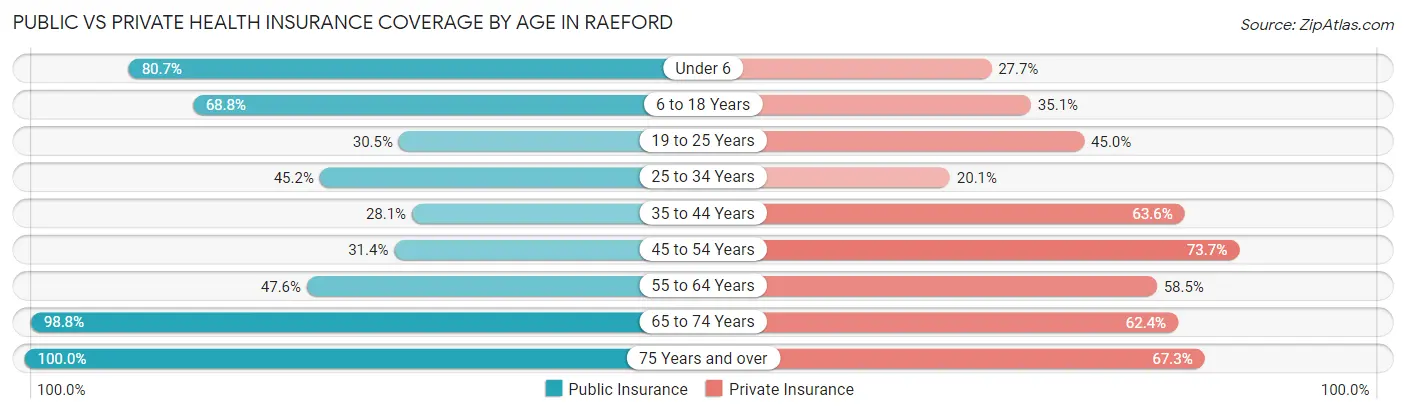
| Age Bracket | Public Insurance | Private Insurance |
| Under 6 | 192 (80.7%) | 66 (27.7%) |
| 6 to 18 Years | 584 (68.8%) | 298 (35.1%) |
| 19 to 25 Years | 146 (30.5%) | 215 (45.0%) |
| 25 to 34 Years | 142 (45.2%) | 63 (20.1%) |
| 35 to 44 Years | 129 (28.1%) | 292 (63.6%) |
| 45 to 54 Years | 129 (31.4%) | 303 (73.7%) |
| 55 to 64 Years | 338 (47.6%) | 415 (58.5%) |
| 65 to 74 Years | 507 (98.8%) | 320 (62.4%) |
| 75 Years and over | 202 (100.0%) | 136 (67.3%) |
| Total | 2,369 (56.8%) | 2,108 (50.5%) |
Disability Status by Sex by Age in Raeford
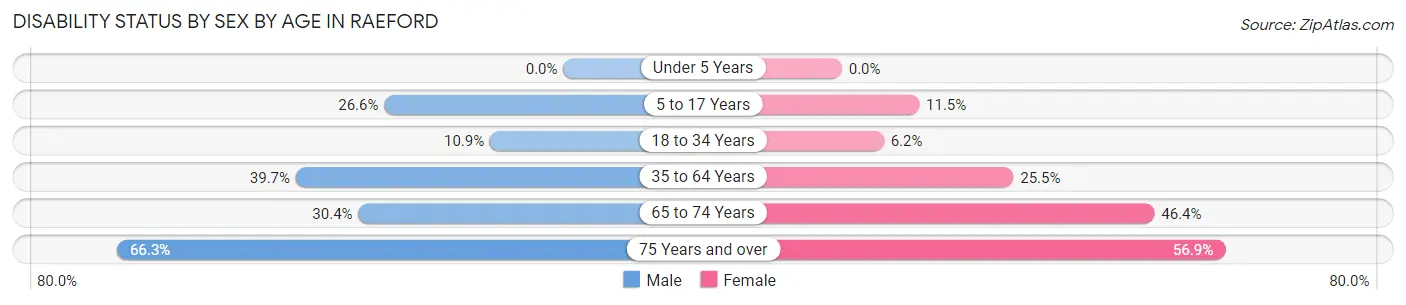
| Age Bracket | Male | Female |
| Under 5 Years | 0 (0.0%) | 0 (0.0%) |
| 5 to 17 Years | 113 (26.6%) | 45 (11.5%) |
| 18 to 34 Years | 39 (10.9%) | 30 (6.2%) |
| 35 to 64 Years | 286 (39.7%) | 219 (25.5%) |
| 65 to 74 Years | 63 (30.4%) | 142 (46.4%) |
| 75 Years and over | 57 (66.3%) | 66 (56.9%) |
Disability Class by Sex by Age in Raeford
Disability Class: Hearing Difficulty
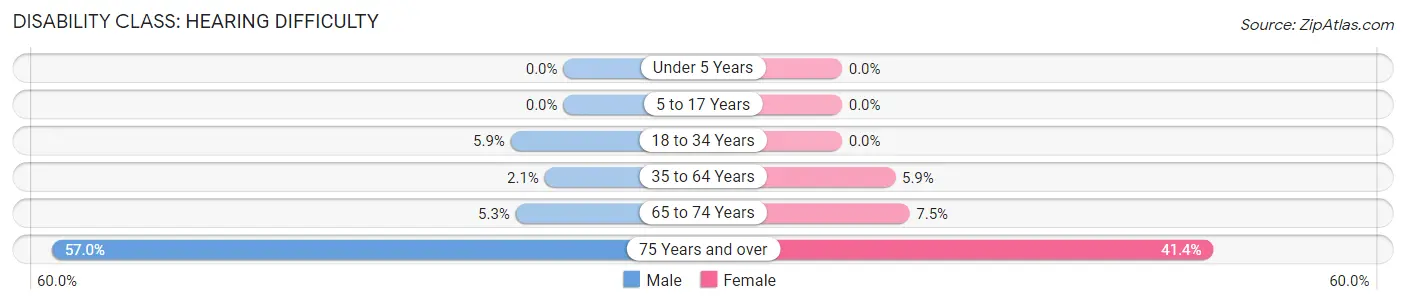
| Age Bracket | Male | Female |
| Under 5 Years | 0 (0.0%) | 0 (0.0%) |
| 5 to 17 Years | 0 (0.0%) | 0 (0.0%) |
| 18 to 34 Years | 21 (5.9%) | 0 (0.0%) |
| 35 to 64 Years | 15 (2.1%) | 51 (5.9%) |
| 65 to 74 Years | 11 (5.3%) | 23 (7.5%) |
| 75 Years and over | 49 (57.0%) | 48 (41.4%) |
Disability Class: Vision Difficulty
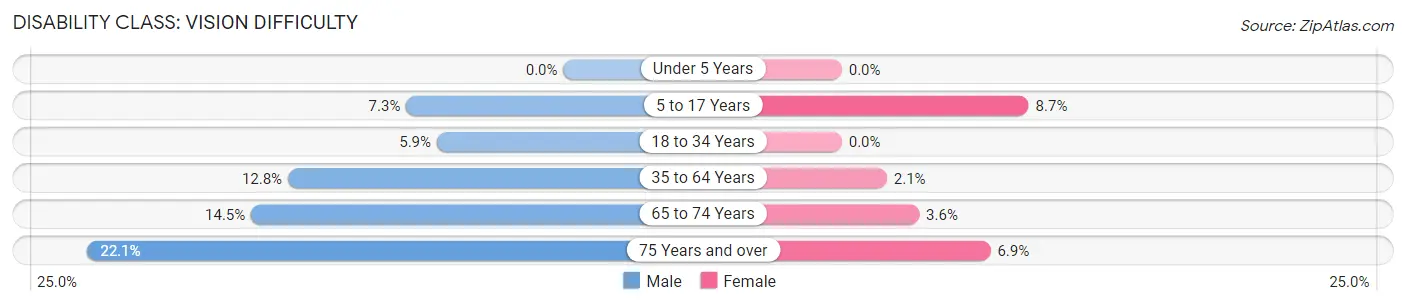
| Age Bracket | Male | Female |
| Under 5 Years | 0 (0.0%) | 0 (0.0%) |
| 5 to 17 Years | 31 (7.3%) | 34 (8.7%) |
| 18 to 34 Years | 21 (5.9%) | 0 (0.0%) |
| 35 to 64 Years | 92 (12.8%) | 18 (2.1%) |
| 65 to 74 Years | 30 (14.5%) | 11 (3.6%) |
| 75 Years and over | 19 (22.1%) | 8 (6.9%) |
Disability Class: Cognitive Difficulty
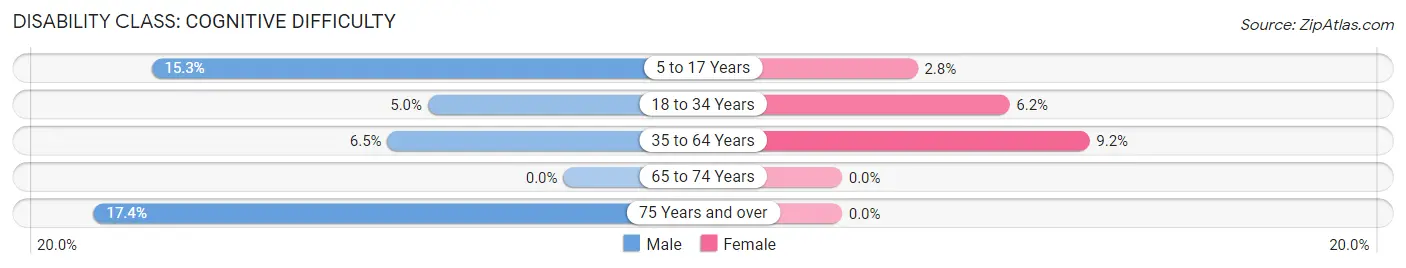
| Age Bracket | Male | Female |
| 5 to 17 Years | 65 (15.3%) | 11 (2.8%) |
| 18 to 34 Years | 18 (5.0%) | 30 (6.2%) |
| 35 to 64 Years | 47 (6.5%) | 79 (9.2%) |
| 65 to 74 Years | 0 (0.0%) | 0 (0.0%) |
| 75 Years and over | 15 (17.4%) | 0 (0.0%) |
Disability Class: Ambulatory Difficulty
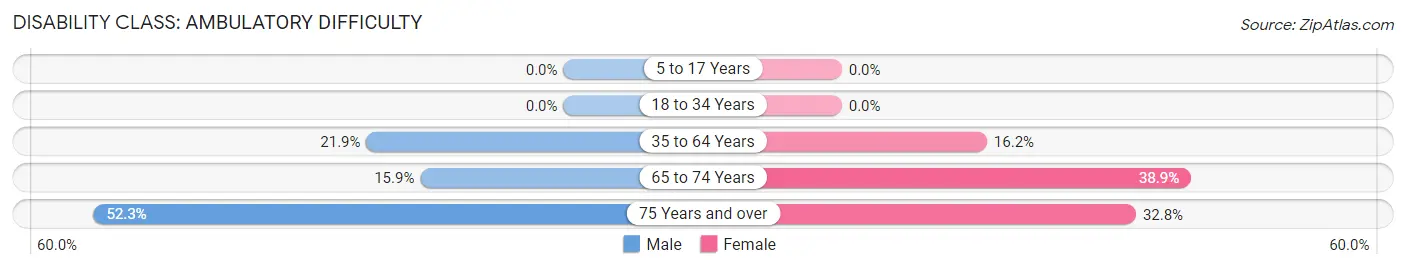
| Age Bracket | Male | Female |
| 5 to 17 Years | 0 (0.0%) | 0 (0.0%) |
| 18 to 34 Years | 0 (0.0%) | 0 (0.0%) |
| 35 to 64 Years | 158 (21.9%) | 139 (16.2%) |
| 65 to 74 Years | 33 (15.9%) | 119 (38.9%) |
| 75 Years and over | 45 (52.3%) | 38 (32.8%) |
Disability Class: Self-Care Difficulty
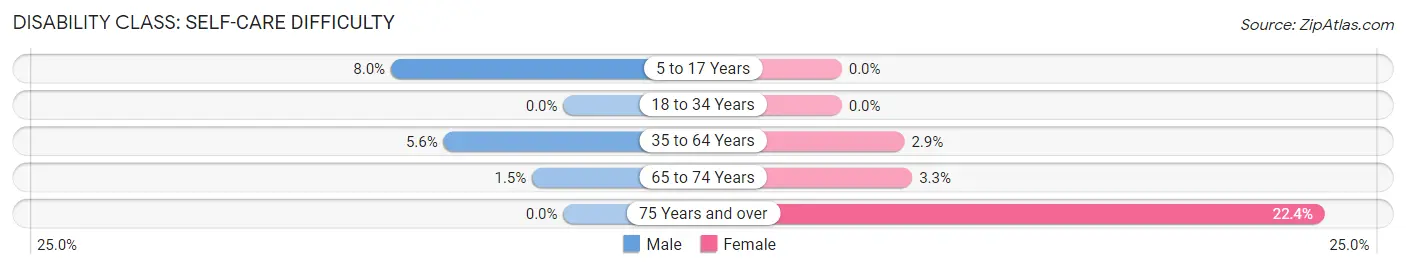
| Age Bracket | Male | Female |
| 5 to 17 Years | 34 (8.0%) | 0 (0.0%) |
| 18 to 34 Years | 0 (0.0%) | 0 (0.0%) |
| 35 to 64 Years | 40 (5.6%) | 25 (2.9%) |
| 65 to 74 Years | 3 (1.5%) | 10 (3.3%) |
| 75 Years and over | 0 (0.0%) | 26 (22.4%) |
Technology Access in Raeford
Computing Device Access in Raeford
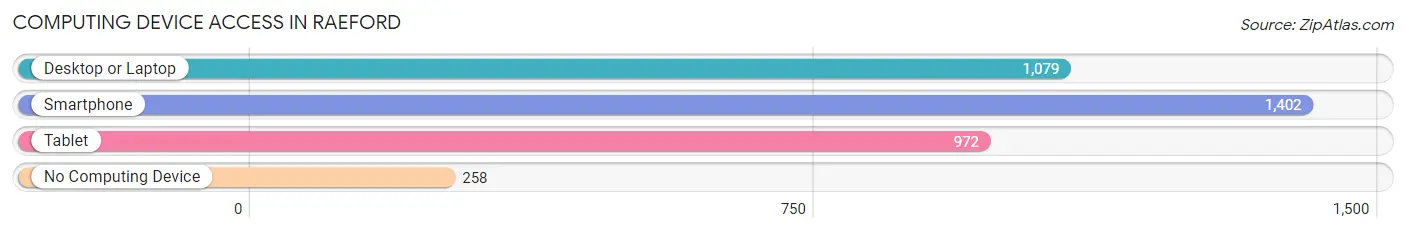
| Device Type | # Households | % Households |
| Desktop or Laptop | 1,079 | 61.1% |
| Smartphone | 1,402 | 79.3% |
| Tablet | 972 | 55.0% |
| No Computing Device | 258 | 14.6% |
| Total | 1,767 | 100.0% |
Internet Access in Raeford
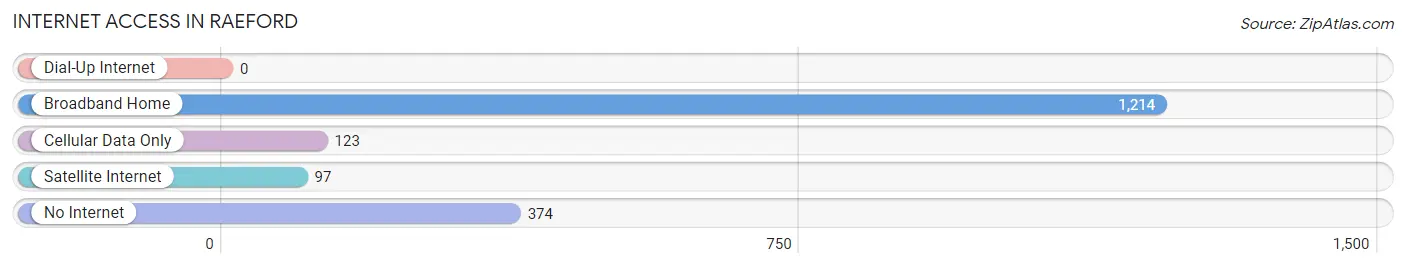
| Internet Type | # Households | % Households |
| Dial-Up Internet | 0 | 0.0% |
| Broadband Home | 1,214 | 68.7% |
| Cellular Data Only | 123 | 7.0% |
| Satellite Internet | 97 | 5.5% |
| No Internet | 374 | 21.2% |
| Total | 1,767 | 100.0% |
Raeford Summary
Raeford, North Carolina is a small town located in Hoke County, in the southeastern part of the state. It is situated about 30 miles south of Fayetteville and about 60 miles northwest of Wilmington. The town is home to a population of approximately 4,500 people, according to the 2010 census.
Raeford is located in the Sandhills region of North Carolina, which is characterized by rolling hills and sandy soils. The town is situated on the banks of the Little River, which is a tributary of the Cape Fear River. The area is known for its mild climate, with temperatures rarely dropping below freezing in the winter and rarely exceeding 90 degrees in the summer.
Raeford was founded in 1887 and was named after the Raeford family, who were early settlers in the area. The town was originally a farming community, but in the early 20th century, the economy shifted to focus on the textile industry. The town was home to several cotton mills, which provided employment for many of the town’s residents.
The economy of Raeford has since diversified, with the town now home to a variety of businesses, including manufacturing, retail, and healthcare. The town is also home to a number of educational institutions, including a community college and a technical institute.
Raeford’s population is predominantly white, with African Americans making up about 25% of the population. The median household income in Raeford is $37,000, which is slightly lower than the state average. The town has a poverty rate of about 20%, which is higher than the state average.
Raeford is served by the Hoke County School System, which includes five elementary schools, two middle schools, and one high school. The town is also home to a number of churches, including Baptist, Methodist, and Presbyterian.
Raeford is home to a number of parks and recreational facilities, including a public pool, a skate park, and a disc golf course. The town also hosts a number of annual events, including the Raeford Summer Festival and the Raeford Christmas Parade.
Raeford is a small town with a rich history and a diverse economy. The town is home to a variety of businesses, educational institutions, and recreational facilities, making it an ideal place to live and work. The town’s population is predominantly white, with African Americans making up about 25% of the population. The median household income in Raeford is slightly lower than the state average, and the town has a poverty rate of about 20%. Raeford is served by the Hoke County School System and is home to a number of churches, parks, and recreational facilities. The town hosts a number of annual events, making it an ideal place to live and work.
Common Questions
What is Per Capita Income in Raeford?
Per Capita income in Raeford is $23,217.
What is the Median Family Income in Raeford?
Median Family Income in Raeford is $60,175.
What is the Median Household income in Raeford?
Median Household Income in Raeford is $38,371.
What is Inequality or Gini Index in Raeford?
Inequality or Gini Index in Raeford is 0.48.
What is the Total Population of Raeford?
Total Population of Raeford is 4,570.
What is the Total Male Population of Raeford?
Total Male Population of Raeford is 2,158.
What is the Total Female Population of Raeford?
Total Female Population of Raeford is 2,412.
What is the Ratio of Males per 100 Females in Raeford?
There are 89.47 Males per 100 Females in Raeford.
What is the Ratio of Females per 100 Males in Raeford?
There are 111.77 Females per 100 Males in Raeford.
What is the Median Population Age in Raeford?
Median Population Age in Raeford is 38.5 Years.
What is the Average Family Size in Raeford
Average Family Size in Raeford is 3.4 People.
What is the Average Household Size in Raeford
Average Household Size in Raeford is 2.4 People.
How Large is the Labor Force in Raeford?
There are 1,867 People in the Labor Forcein in Raeford.
What is the Percentage of People in the Labor Force in Raeford?
51.0% of People are in the Labor Force in Raeford.
What is the Unemployment Rate in Raeford?
Unemployment Rate in Raeford is 4.3%.