Zip Codes with the Highest Percentage of Households with Income Below $10,000 in Winston Salem, NC

RELATED REPORTS & OPTIONS

Household Income | $0-10k
Population
Families and Households
Female Fertility
Female Fertility (Unmarried)
Race (Community Size)
Race (Percentage)
Ancestry (Community Size)
AfricanAmericanArabArgentineanArmenianAustrianBarbadianBelgianBhutaneseBlackfeetBrazilianBritishBritish West IndianBurmeseCanadianCape VerdeanCentral AmericanCentral American IndianCherokeeChileanColombianCosta RicanCreekCroatianCubanCzechCzechoslovakianDanishDominicanDutchEastern EuropeanEcuadorianEgyptianEnglishEthiopianEuropeanFilipinoFinnishFrenchFrench American IndianFrench CanadianGermanGhanaianGreekGuatemalanGuyaneseHaitianHonduranHungarianIndian (Asian)IranianIrishItalianJamaicanJapaneseKenyanKoreanLaotianLebaneseLithuanianLumbeeMacedonianMexicanMexican American IndianMongolianMoroccanNative HawaiianNavajoNicaraguanNigerianNorthern EuropeanNorwegianPakistaniPanamanianPennsylvania GermanPeruvianPolishPortuguesePuerto RicanRomanianRussianSalvadoranScandinavianScotch-IrishScottishSenegaleseSerbianSiouxSlavicSlovakSloveneSouth AmericanSpaniardSpanishSri LankanSubsaharan AfricanSudaneseSwedishSwissThaiTrinidadian and TobagonianTurkishUkrainianVenezuelanWelshWest IndianYugoslavian
Ancestry (Percentage)
AfricanAmericanArabArgentineanArmenianAustrianBarbadianBelgianBhutaneseBlackfeetBrazilianBritishBritish West IndianBurmeseCanadianCape VerdeanCentral AmericanCentral American IndianCherokeeChileanColombianCosta RicanCreekCroatianCubanCzechCzechoslovakianDanishDominicanDutchEastern EuropeanEcuadorianEgyptianEnglishEthiopianEuropeanFilipinoFinnishFrenchFrench American IndianFrench CanadianGermanGhanaianGreekGuatemalanGuyaneseHaitianHonduranHungarianIndian (Asian)IranianIrishItalianJamaicanJapaneseKenyanKoreanLaotianLebaneseLithuanianLumbeeMacedonianMexicanMexican American IndianMongolianMoroccanNative HawaiianNavajoNicaraguanNigerianNorthern EuropeanNorwegianPakistaniPanamanianPennsylvania GermanPeruvianPolishPortuguesePuerto RicanRomanianRussianSalvadoranScandinavianScotch-IrishScottishSenegaleseSerbianSiouxSlavicSlovakSloveneSouth AmericanSpaniardSpanishSri LankanSubsaharan AfricanSudaneseSwedishSwissThaiTrinidadian and TobagonianTurkishUkrainianVenezuelanWelshWest IndianYugoslavian
Immigrant Origin (Total)
Immigrant Origin (Percentage)
Income
Income (Families)
Income (Households)
Poverty
Poverty (Families)
Unemployment
Employment Occupations
Employment Industries
Employer Class
Commute Time
Commute Means
School Enrollment
Education by Degree Field
Occupancy
Finances
Physical Characteristics
Winston Salem
Compare Zip Codes
Comparison Subject

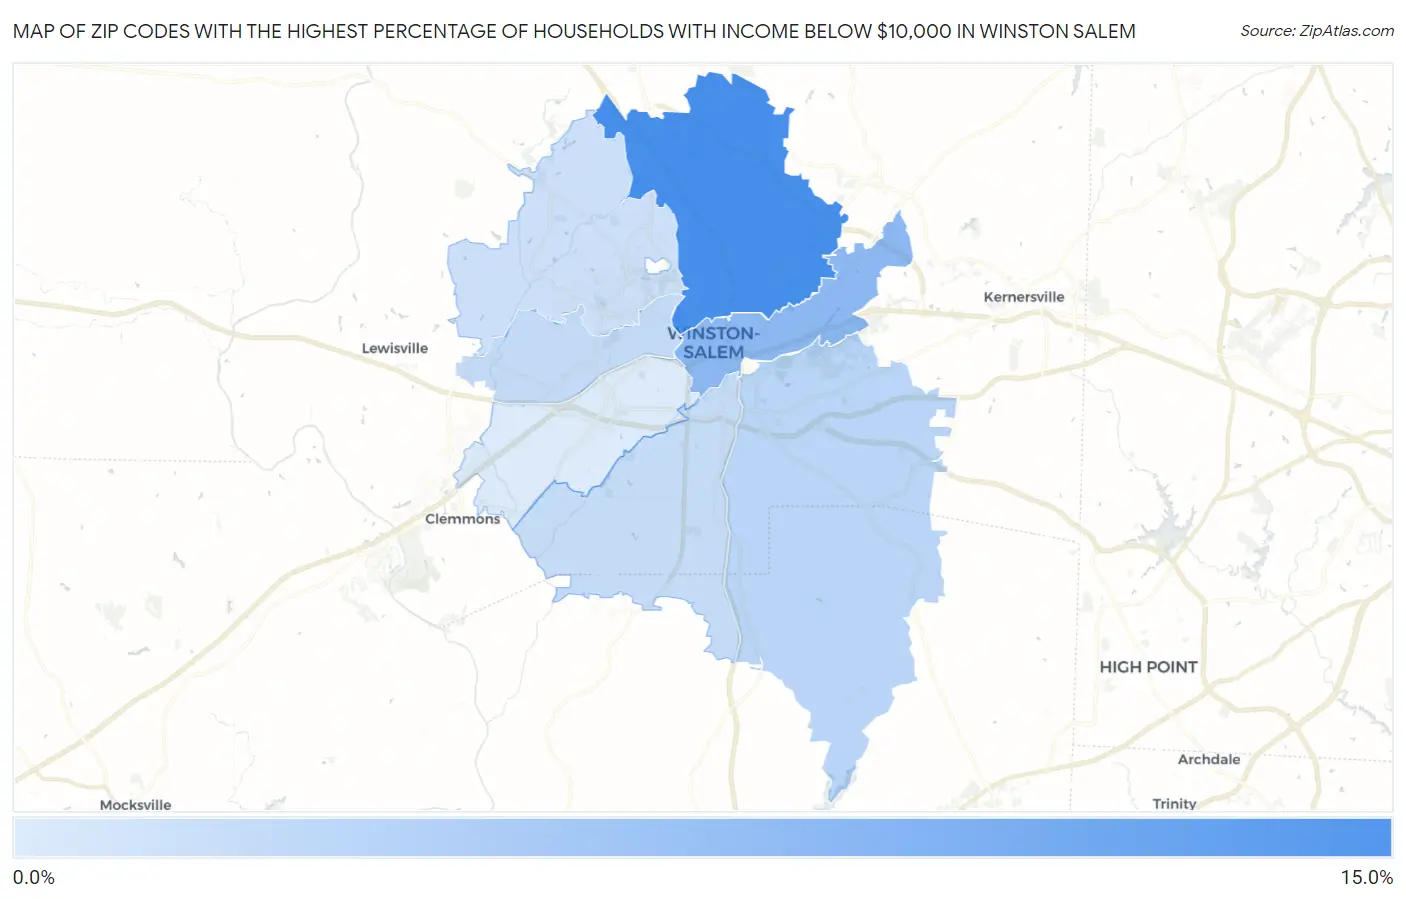
Map of Zip Codes with the Highest Percentage of Households with Income Below $10,000 in Winston Salem

0.0%
15.0%
Zip Codes with the Highest Percentage of Households with Income Below $10,000 in Winston Salem Map

Zip Codes with the Highest Percentage of Households with Income Below $10,000 in Winston Salem, NC

Zip Code Households with Income < $10k vs State vs National
1.2710513.7%5.1%(+8.60)#504.9%(+8.80)#1,842
2.271019.5%5.1%(+4.40)#1074.9%(+4.60)#3,961
3.271076.7%5.1%(+1.60)#2204.9%(+1.80)#7,520
4.271046.2%5.1%(+1.10)#2604.9%(+1.30)#8,536
5.271276.1%5.1%(+1.00)#2654.9%(+1.20)#8,721
6.271065.6%5.1%(+0.500)#3094.9%(+0.700)#9,957
7.271034.7%5.1%(-0.400)#3844.9%(-0.200)#12,651

Common Questions

What are the Top 5 Zip Codes with the Highest Percentage of Households with Income Below $10,000 in Winston Salem, NC?
Top 5 Zip Codes with the Highest Percentage of Households with Income Below $10,000 in Winston Salem, NC are:
#1
13.7%
#2
9.5%
#3
6.7%
#4
6.2%
#5
6.1%
What zip code has the Highest Percentage of Households with Income Below $10,000 in Winston Salem, NC?
27105 has the Highest Percentage of Households with Income Below $10,000 in Winston Salem, NC with 13.7%.
What is the Percentage of Households with Income Below $10,000 in Winston Salem, NC?
Percentage of Households with Income Below $10,000 in Winston Salem is 7.3%.
What is the Percentage of Households with Income Below $10,000 in North Carolina?
Percentage of Households with Income Below $10,000 in North Carolina is 5.1%.
What is the Percentage of Households with Income Below $10,000 in the United States?
Percentage of Households with Income Below $10,000 in the United States is 4.9%.