Mooresboro, NC Map & Demographics
Mooresboro Map
Mooresboro Overview
$24,702
PER CAPITA INCOME
$47,083
AVG FAMILY INCOME
$10,447
FAMILY INCOME DEFICIT
0.56
INEQUALITY / GINI INDEX
204
TOTAL POPULATION
100
MALE POPULATION
104
FEMALE POPULATION
96.15
MALES / 100 FEMALES
104.00
FEMALES / 100 MALES
35.2
MEDIAN AGE
2.8
AVG FAMILY SIZE
2.1
AVG HOUSEHOLD SIZE
92
LABOR FORCE [ PEOPLE ]
54.4%
PERCENT IN LABOR FORCE
6.5%
UNEMPLOYMENT RATE
Mooresboro Zip Codes
Income in Mooresboro
Income Overview in Mooresboro
| Characteristic | Number | Measure |
| Per Capita Income | 204 | $24,702 |
| Median Family Income | 54 | $47,083 |
| Mean Family Income | 54 | $72,263 |
| Median Household Income | 95 | $0 |
| Mean Household Income | 95 | $51,453 |
| Income Deficit | 54 | $10,447 |
| Wage / Income Gap (%) | 204 | 0.00% |
| Wage / Income Gap ($) | 204 | 100.00¢ per $1 |
| Gini / Inequality Index | 204 | 0.56 |
Earnings by Sex in Mooresboro
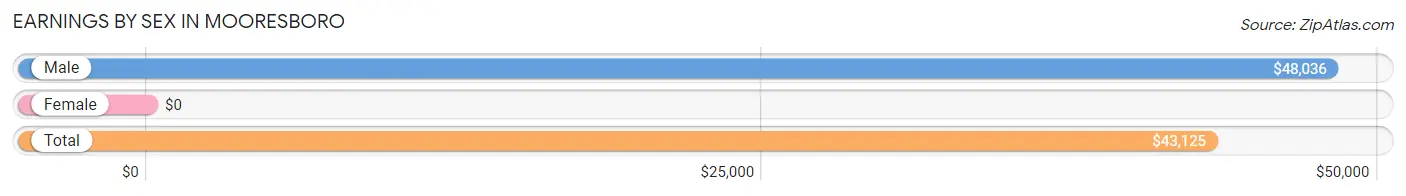
| Sex | Number | Average Earnings |
| Male | 53 (57.0%) | $48,036 |
| Female | 40 (43.0%) | $0 |
| Total | 93 (100.0%) | $43,125 |
Earnings by Sex by Income Bracket in Mooresboro
The most common earnings brackets in Mooresboro are $45,000 to $49,999 for men (12 | 22.6%) and $12,500 to $14,999 for women (7 | 17.5%).
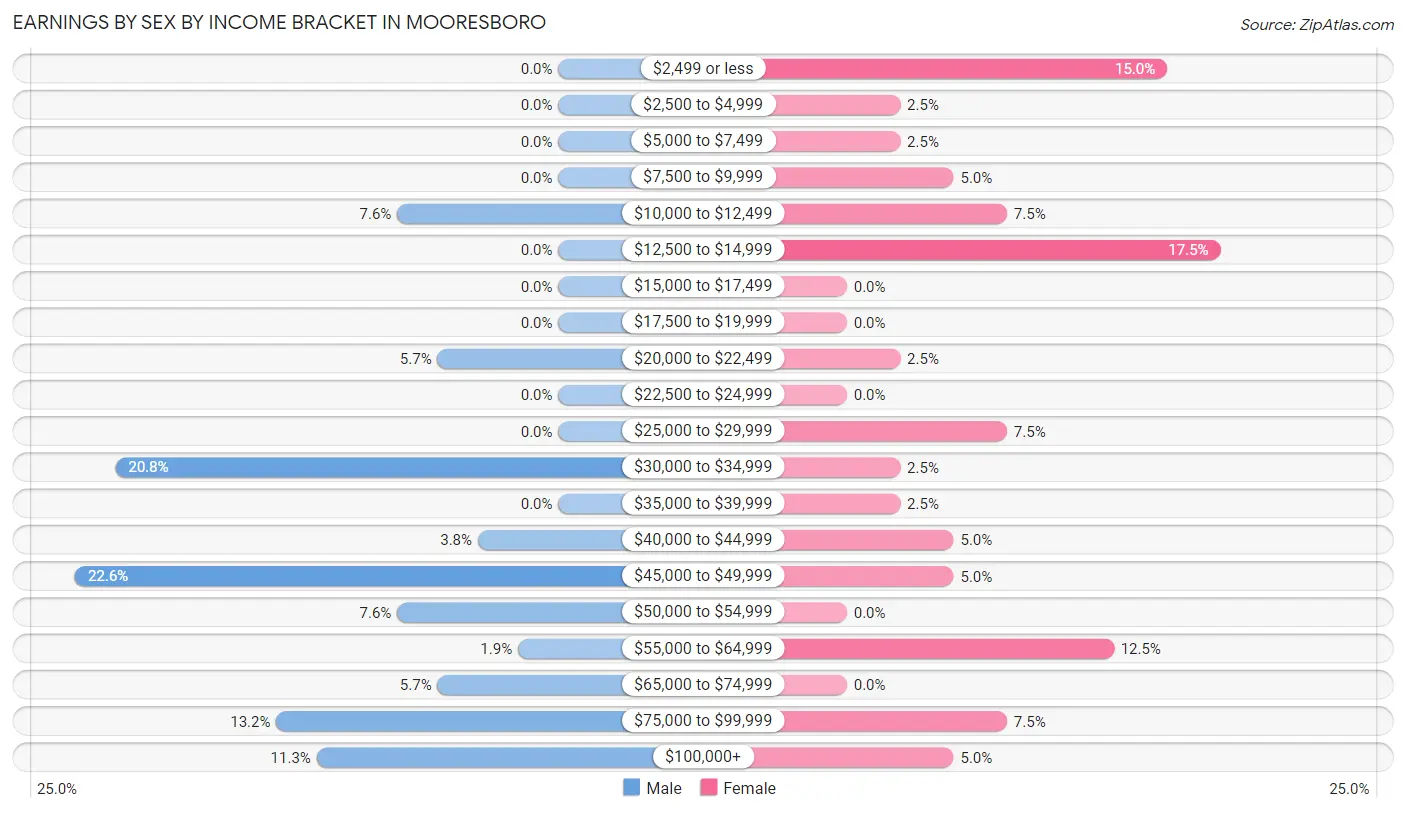
| Income | Male | Female |
| $2,499 or less | 0 (0.0%) | 6 (15.0%) |
| $2,500 to $4,999 | 0 (0.0%) | 1 (2.5%) |
| $5,000 to $7,499 | 0 (0.0%) | 1 (2.5%) |
| $7,500 to $9,999 | 0 (0.0%) | 2 (5.0%) |
| $10,000 to $12,499 | 4 (7.5%) | 3 (7.5%) |
| $12,500 to $14,999 | 0 (0.0%) | 7 (17.5%) |
| $15,000 to $17,499 | 0 (0.0%) | 0 (0.0%) |
| $17,500 to $19,999 | 0 (0.0%) | 0 (0.0%) |
| $20,000 to $22,499 | 3 (5.7%) | 1 (2.5%) |
| $22,500 to $24,999 | 0 (0.0%) | 0 (0.0%) |
| $25,000 to $29,999 | 0 (0.0%) | 3 (7.5%) |
| $30,000 to $34,999 | 11 (20.7%) | 1 (2.5%) |
| $35,000 to $39,999 | 0 (0.0%) | 1 (2.5%) |
| $40,000 to $44,999 | 2 (3.8%) | 2 (5.0%) |
| $45,000 to $49,999 | 12 (22.6%) | 2 (5.0%) |
| $50,000 to $54,999 | 4 (7.5%) | 0 (0.0%) |
| $55,000 to $64,999 | 1 (1.9%) | 5 (12.5%) |
| $65,000 to $74,999 | 3 (5.7%) | 0 (0.0%) |
| $75,000 to $99,999 | 7 (13.2%) | 3 (7.5%) |
| $100,000+ | 6 (11.3%) | 2 (5.0%) |
| Total | 53 (100.0%) | 40 (100.0%) |
Earnings by Sex by Educational Attainment in Mooresboro
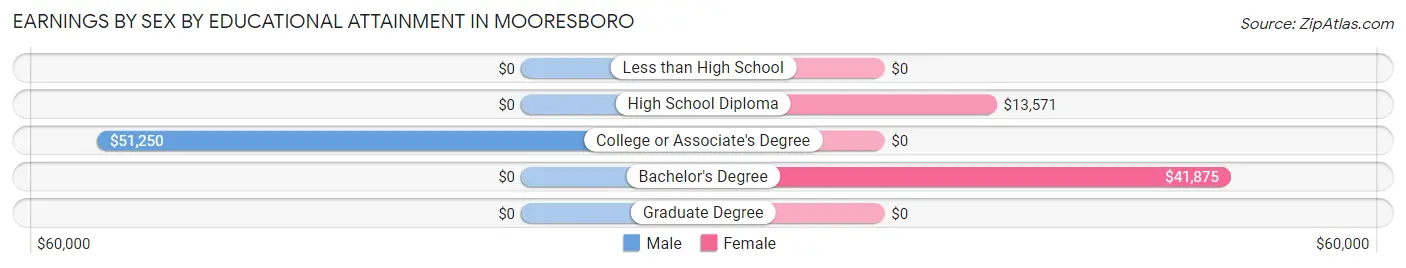
| Educational Attainment | Male Income | Female Income |
| Less than High School | - | - |
| High School Diploma | - | - |
| College or Associate's Degree | $51,250 | $0 |
| Bachelor's Degree | - | - |
| Graduate Degree | - | - |
| Total | $50,313 | $0 |
Family Income in Mooresboro
Family Income Brackets in Mooresboro
According to the Mooresboro family income data, there are 11 families falling into the $35,000 to $49,999 income range, which is the most common income bracket and makes up 20.4% of all families.
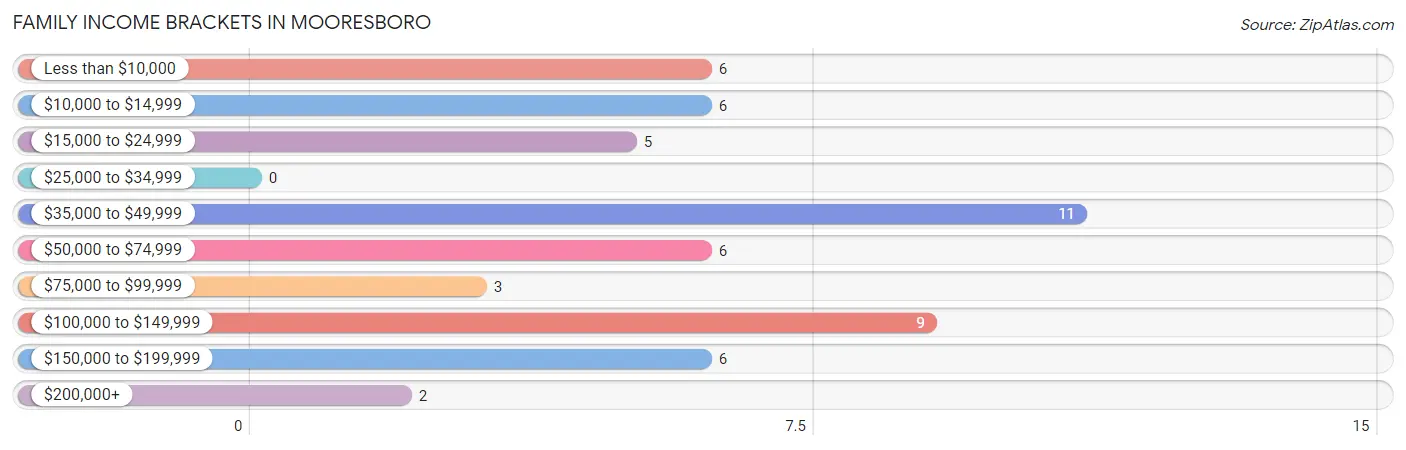
| Income Bracket | # Families | % Families |
| Less than $10,000 | 6 | 11.1% |
| $10,000 to $14,999 | 6 | 11.1% |
| $15,000 to $24,999 | 5 | 9.3% |
| $25,000 to $34,999 | 0 | 0.0% |
| $35,000 to $49,999 | 11 | 20.4% |
| $50,000 to $74,999 | 6 | 11.1% |
| $75,000 to $99,999 | 3 | 5.6% |
| $100,000 to $149,999 | 9 | 16.7% |
| $150,000 to $199,999 | 6 | 11.1% |
| $200,000+ | 2 | 3.7% |
Family Income by Famaliy Size in Mooresboro
2-person families (32 | 59.3%) account for the highest median family income in Mooresboro with $45,500 per family, while 2-person families (32 | 59.3%) have the highest median income of $22,750 per family member.
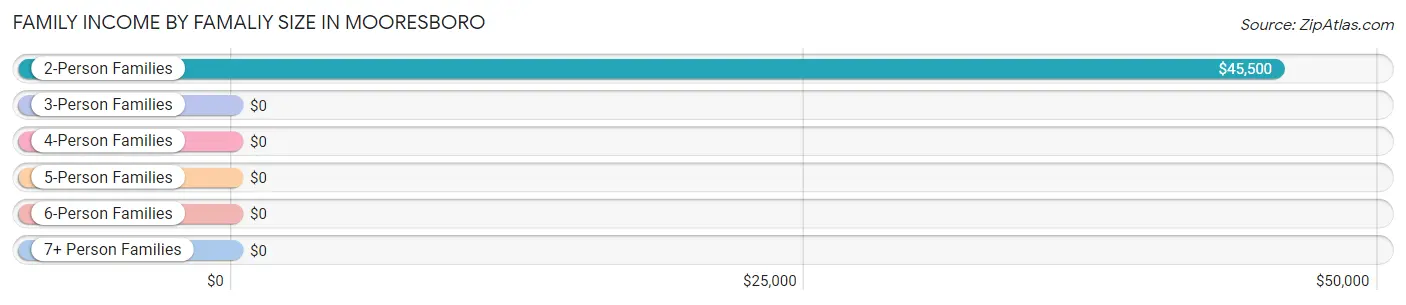
| Income Bracket | # Families | Median Income |
| 2-Person Families | 32 (59.3%) | $45,500 |
| 3-Person Families | 16 (29.6%) | $0 |
| 4-Person Families | 6 (11.1%) | $0 |
| 5-Person Families | 0 (0.0%) | $0 |
| 6-Person Families | 0 (0.0%) | $0 |
| 7+ Person Families | 0 (0.0%) | $0 |
| Total | 54 (100.0%) | $47,083 |
Family Income by Number of Earners in Mooresboro
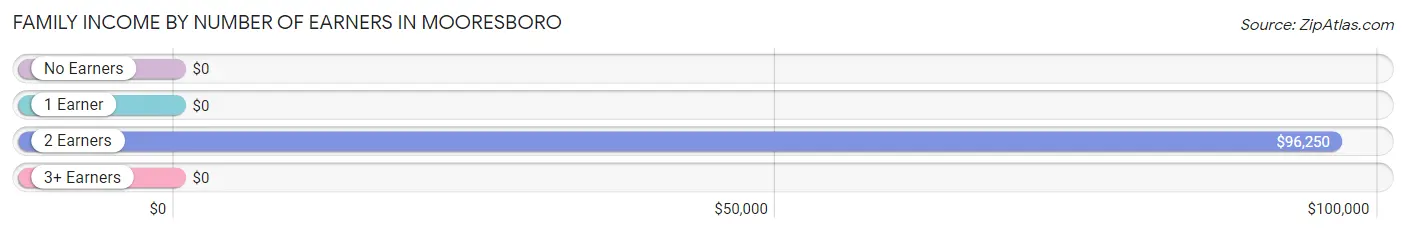
| Number of Earners | # Families | Median Income |
| No Earners | 13 (24.1%) | $0 |
| 1 Earner | 11 (20.4%) | $0 |
| 2 Earners | 30 (55.6%) | $96,250 |
| 3+ Earners | 0 (0.0%) | $0 |
| Total | 54 (100.0%) | $47,083 |
Household Income in Mooresboro
Household Income Brackets in Mooresboro
With 17 households falling in the category, the less than $10,000 income range is the most frequent in Mooresboro, accounting for 17.9% of all households. In contrast, only 2 households (2.1%) fall into the $200,000+ income bracket, making it the least populous group.
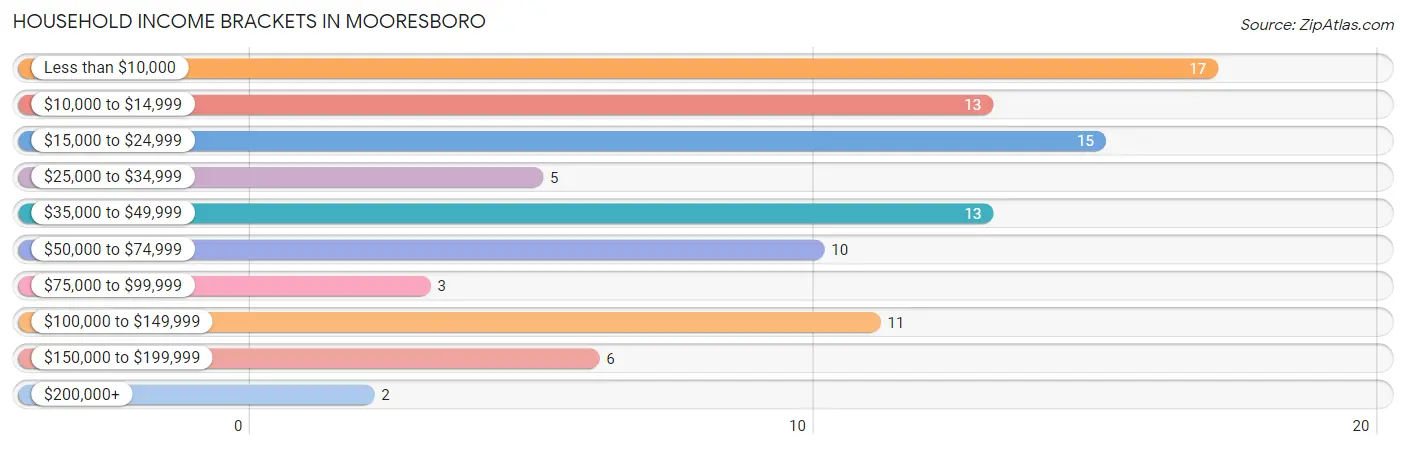
| Income Bracket | # Households | % Households |
| Less than $10,000 | 17 | 17.9% |
| $10,000 to $14,999 | 13 | 13.7% |
| $15,000 to $24,999 | 15 | 15.8% |
| $25,000 to $34,999 | 5 | 5.3% |
| $35,000 to $49,999 | 13 | 13.7% |
| $50,000 to $74,999 | 10 | 10.5% |
| $75,000 to $99,999 | 3 | 3.2% |
| $100,000 to $149,999 | 11 | 11.6% |
| $150,000 to $199,999 | 6 | 6.3% |
| $200,000+ | 2 | 2.1% |
Household Income by Householder Age in Mooresboro
The median household income in Mooresboro is $0, with the highest median household income of $46,000 found in the 15 to 24 years age bracket for the primary householder. A total of 12 households (12.6%) fall into this category. Meanwhile, the 25 to 44 years age bracket for the primary householder has the lowest median household income of $0, with 19 households (20.0%) in this group.
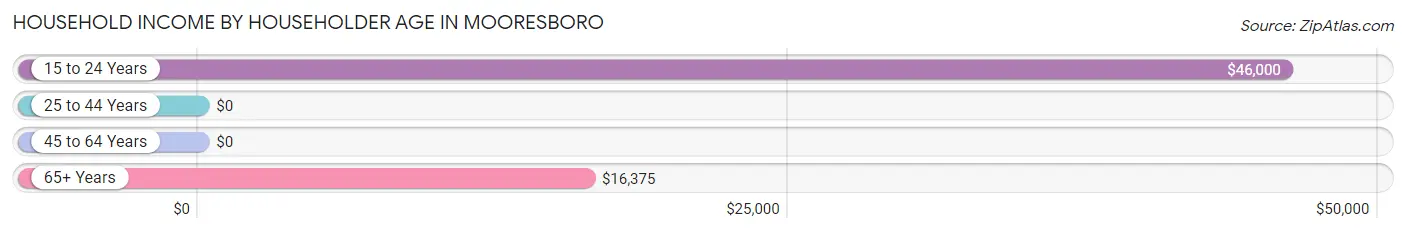
| Income Bracket | # Households | Median Income |
| 15 to 24 Years | 12 (12.6%) | $46,000 |
| 25 to 44 Years | 19 (20.0%) | $0 |
| 45 to 64 Years | 39 (41.0%) | $0 |
| 65+ Years | 25 (26.3%) | $16,375 |
| Total | 95 (100.0%) | $0 |
Poverty in Mooresboro
Income Below Poverty by Sex and Age in Mooresboro
With 18.0% poverty level for males and 45.2% for females among the residents of Mooresboro, 12 to 14 year old males and 25 to 34 year old females are the most vulnerable to poverty, with 6 males (100.0%) and 15 females (78.9%) in their respective age groups living below the poverty level.
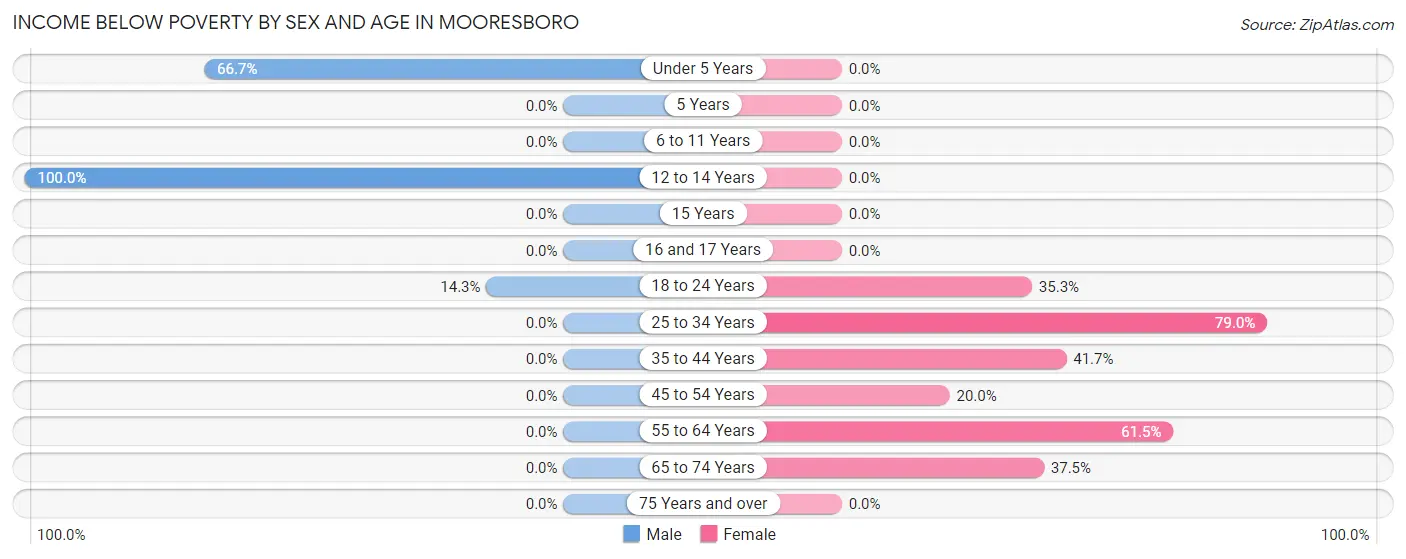
| Age Bracket | Male | Female |
| Under 5 Years | 10 (66.7%) | 0 (0.0%) |
| 5 Years | 0 (0.0%) | 0 (0.0%) |
| 6 to 11 Years | 0 (0.0%) | 0 (0.0%) |
| 12 to 14 Years | 6 (100.0%) | 0 (0.0%) |
| 15 Years | 0 (0.0%) | 0 (0.0%) |
| 16 and 17 Years | 0 (0.0%) | 0 (0.0%) |
| 18 to 24 Years | 2 (14.3%) | 6 (35.3%) |
| 25 to 34 Years | 0 (0.0%) | 15 (78.9%) |
| 35 to 44 Years | 0 (0.0%) | 5 (41.7%) |
| 45 to 54 Years | 0 (0.0%) | 2 (20.0%) |
| 55 to 64 Years | 0 (0.0%) | 16 (61.5%) |
| 65 to 74 Years | 0 (0.0%) | 3 (37.5%) |
| 75 Years and over | 0 (0.0%) | 0 (0.0%) |
| Total | 18 (18.0%) | 47 (45.2%) |
Income Above Poverty by Sex and Age in Mooresboro
According to the poverty statistics in Mooresboro, males aged 5 years and females aged under 5 years are the age groups that are most secure financially, with 100.0% of males and 100.0% of females in these age groups living above the poverty line.
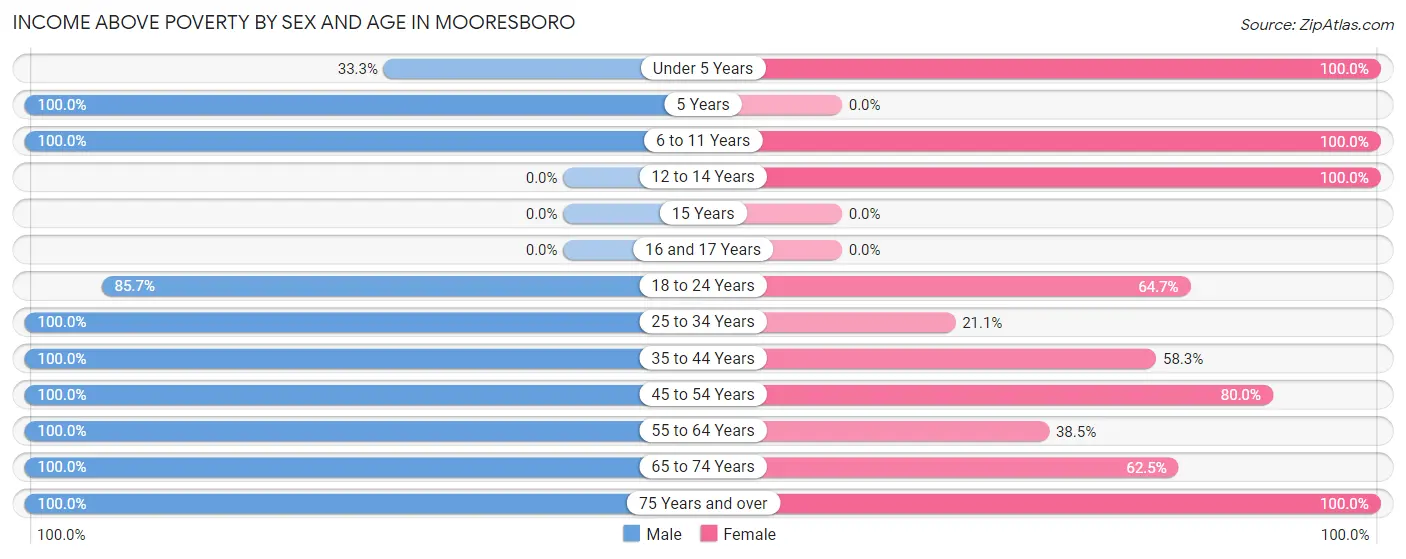
| Age Bracket | Male | Female |
| Under 5 Years | 5 (33.3%) | 2 (100.0%) |
| 5 Years | 2 (100.0%) | 0 (0.0%) |
| 6 to 11 Years | 6 (100.0%) | 2 (100.0%) |
| 12 to 14 Years | 0 (0.0%) | 2 (100.0%) |
| 15 Years | 0 (0.0%) | 0 (0.0%) |
| 16 and 17 Years | 0 (0.0%) | 0 (0.0%) |
| 18 to 24 Years | 12 (85.7%) | 11 (64.7%) |
| 25 to 34 Years | 16 (100.0%) | 4 (21.0%) |
| 35 to 44 Years | 6 (100.0%) | 7 (58.3%) |
| 45 to 54 Years | 3 (100.0%) | 8 (80.0%) |
| 55 to 64 Years | 18 (100.0%) | 10 (38.5%) |
| 65 to 74 Years | 8 (100.0%) | 5 (62.5%) |
| 75 Years and over | 6 (100.0%) | 6 (100.0%) |
| Total | 82 (82.0%) | 57 (54.8%) |
Income Below Poverty Among Married-Couple Families in Mooresboro
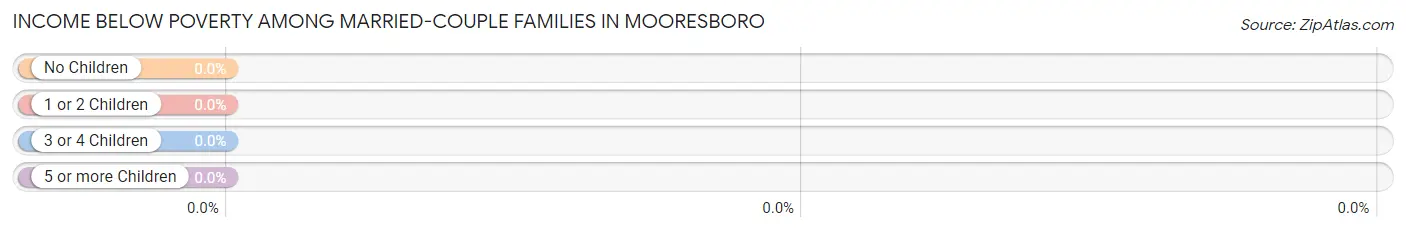
| Children | Above Poverty | Below Poverty |
| No Children | 28 (100.0%) | 0 (0.0%) |
| 1 or 2 Children | 8 (100.0%) | 0 (0.0%) |
| 3 or 4 Children | 0 (0.0%) | 0 (0.0%) |
| 5 or more Children | 0 (0.0%) | 0 (0.0%) |
| Total | 36 (100.0%) | 0 (0.0%) |
Income Below Poverty Among Single-Parent Households in Mooresboro
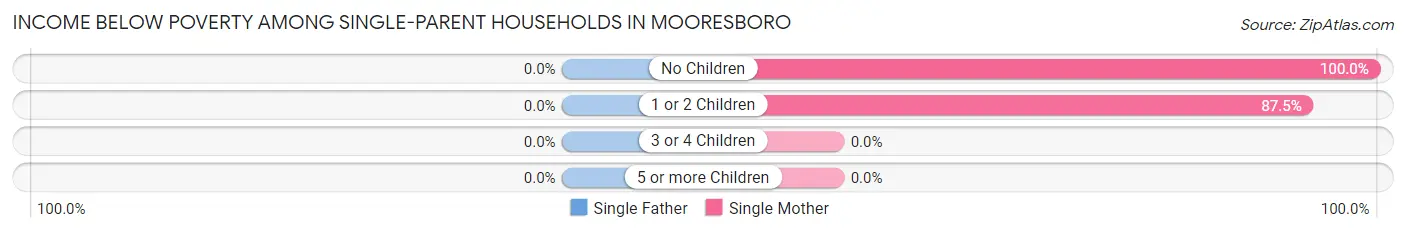
| Children | Single Father | Single Mother |
| No Children | 0 (0.0%) | 10 (100.0%) |
| 1 or 2 Children | 0 (0.0%) | 7 (87.5%) |
| 3 or 4 Children | 0 (0.0%) | 0 (0.0%) |
| 5 or more Children | 0 (0.0%) | 0 (0.0%) |
| Total | 0 (0.0%) | 17 (94.4%) |
Income Below Poverty Among Married-Couple vs Single-Parent Households in Mooresboro
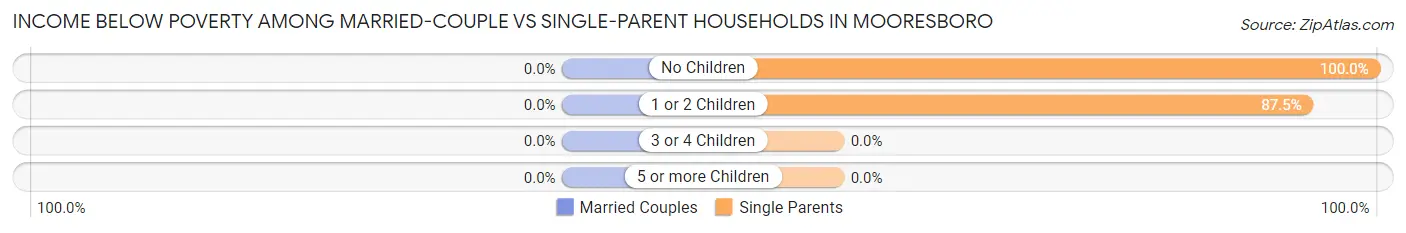
| Children | Married-Couple Families | Single-Parent Households |
| No Children | 0 (0.0%) | 10 (100.0%) |
| 1 or 2 Children | 0 (0.0%) | 7 (87.5%) |
| 3 or 4 Children | 0 (0.0%) | 0 (0.0%) |
| 5 or more Children | 0 (0.0%) | 0 (0.0%) |
| Total | 0 (0.0%) | 17 (94.4%) |
Race in Mooresboro
The most populous races in Mooresboro are White / Caucasian (168 | 82.4%), Black / African American (34 | 16.7%), and Hispanic or Latino (2 | 1.0%).
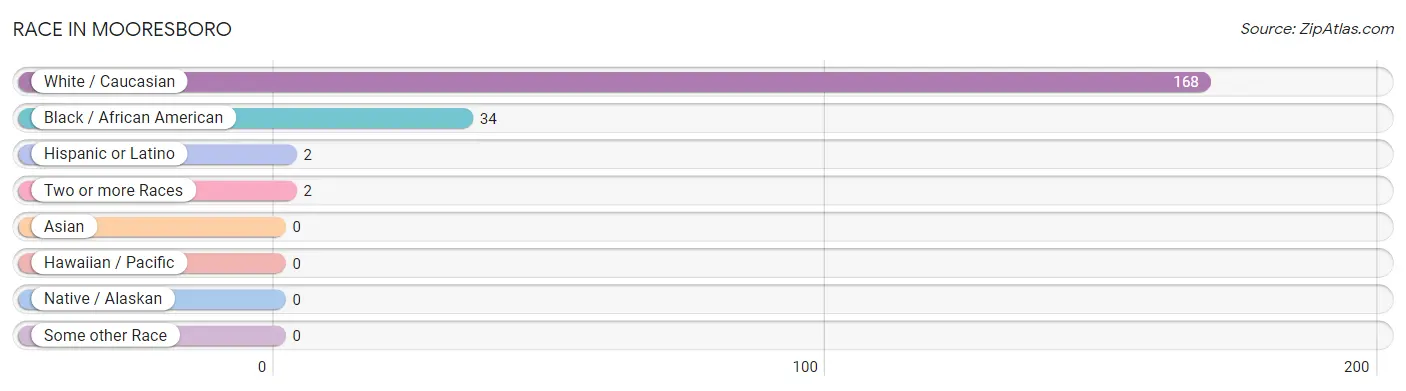
| Race | # Population | % Population |
| Asian | 0 | 0.0% |
| Black / African American | 34 | 16.7% |
| Hawaiian / Pacific | 0 | 0.0% |
| Hispanic or Latino | 2 | 1.0% |
| Native / Alaskan | 0 | 0.0% |
| White / Caucasian | 168 | 82.4% |
| Two or more Races | 2 | 1.0% |
| Some other Race | 0 | 0.0% |
| Total | 204 | 100.0% |
Ancestry in Mooresboro
The most populous ancestries reported in Mooresboro are American (82 | 40.2%), Irish (15 | 7.3%), Scotch-Irish (9 | 4.4%), European (8 | 3.9%), and English (7 | 3.4%), together accounting for 59.3% of all Mooresboro residents.
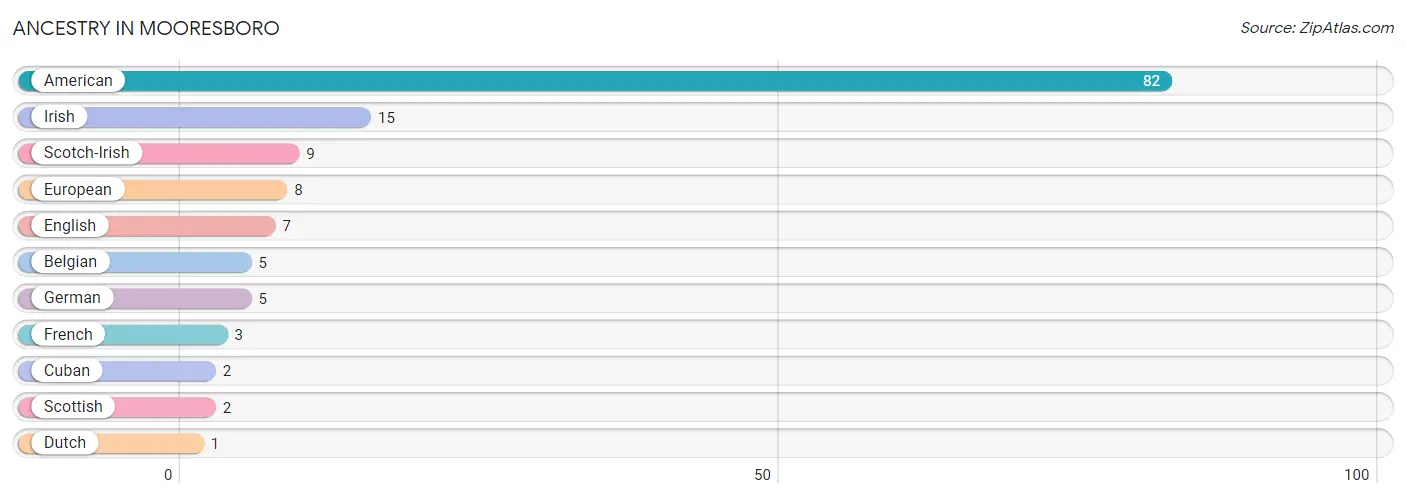
| Ancestry | # Population | % Population |
| American | 82 | 40.2% |
| Belgian | 5 | 2.5% |
| Cuban | 2 | 1.0% |
| Dutch | 1 | 0.5% |
| English | 7 | 3.4% |
| European | 8 | 3.9% |
| French | 3 | 1.5% |
| German | 5 | 2.5% |
| Irish | 15 | 7.3% |
| Scotch-Irish | 9 | 4.4% |
| Scottish | 2 | 1.0% | View All 11 Rows |
Immigrants in Mooresboro
The most numerous immigrant groups reported in Mooresboro came from Belgium (5 | 2.5%), Europe (5 | 2.5%), and Western Europe (5 | 2.5%), together accounting for 7.4% of all Mooresboro residents.
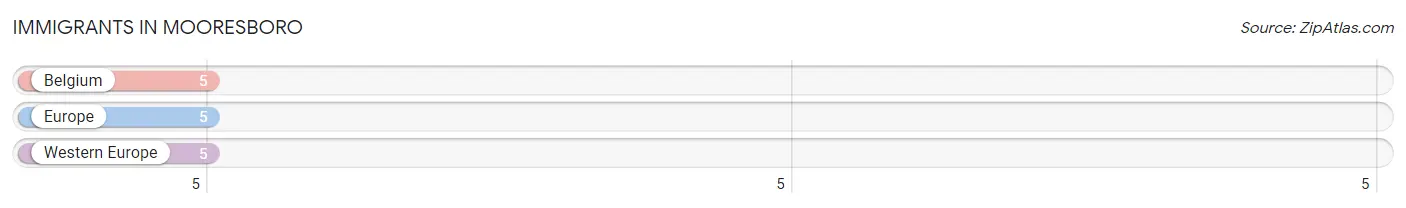
| Immigration Origin | # Population | % Population |
| Belgium | 5 | 2.5% |
| Europe | 5 | 2.5% |
| Western Europe | 5 | 2.5% | View All 3 Rows |
Sex and Age in Mooresboro
Sex and Age in Mooresboro
The most populous age groups in Mooresboro are 25 to 29 Years (16 | 16.0%) for men and 30 to 34 Years (15 | 14.4%) for women.
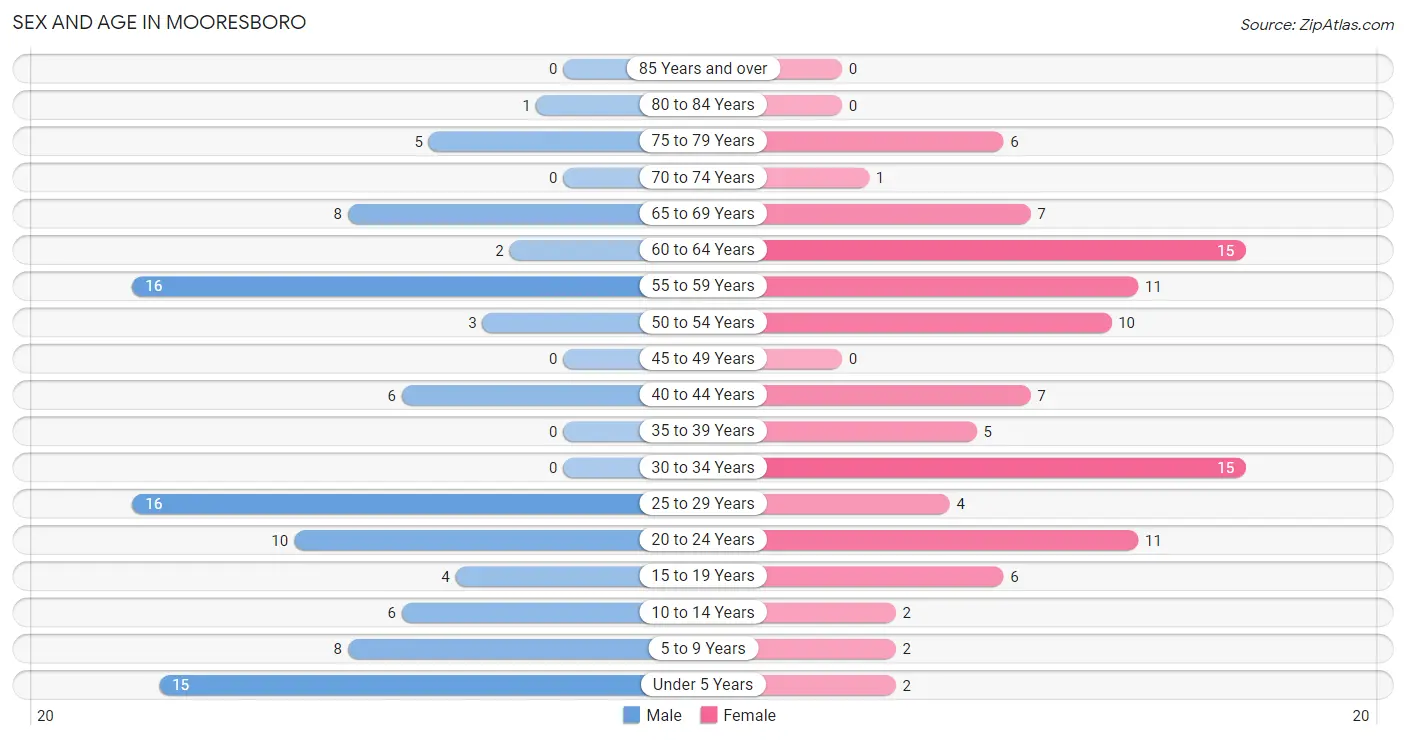
| Age Bracket | Male | Female |
| Under 5 Years | 15 (15.0%) | 2 (1.9%) |
| 5 to 9 Years | 8 (8.0%) | 2 (1.9%) |
| 10 to 14 Years | 6 (6.0%) | 2 (1.9%) |
| 15 to 19 Years | 4 (4.0%) | 6 (5.8%) |
| 20 to 24 Years | 10 (10.0%) | 11 (10.6%) |
| 25 to 29 Years | 16 (16.0%) | 4 (3.8%) |
| 30 to 34 Years | 0 (0.0%) | 15 (14.4%) |
| 35 to 39 Years | 0 (0.0%) | 5 (4.8%) |
| 40 to 44 Years | 6 (6.0%) | 7 (6.7%) |
| 45 to 49 Years | 0 (0.0%) | 0 (0.0%) |
| 50 to 54 Years | 3 (3.0%) | 10 (9.6%) |
| 55 to 59 Years | 16 (16.0%) | 11 (10.6%) |
| 60 to 64 Years | 2 (2.0%) | 15 (14.4%) |
| 65 to 69 Years | 8 (8.0%) | 7 (6.7%) |
| 70 to 74 Years | 0 (0.0%) | 1 (1.0%) |
| 75 to 79 Years | 5 (5.0%) | 6 (5.8%) |
| 80 to 84 Years | 1 (1.0%) | 0 (0.0%) |
| 85 Years and over | 0 (0.0%) | 0 (0.0%) |
| Total | 100 (100.0%) | 104 (100.0%) |
Families and Households in Mooresboro
Median Family Size in Mooresboro
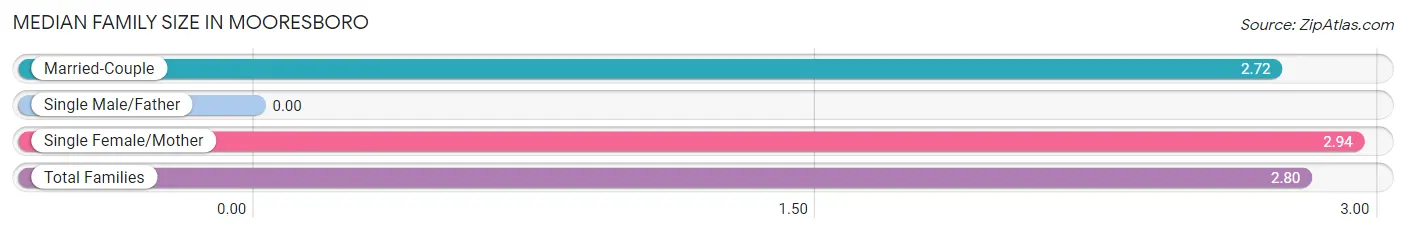
| Family Type | # Families | Family Size |
| Married-Couple | 36 (66.7%) | 2.72 |
| Single Male/Father | 0 (0.0%) | - |
| Single Female/Mother | 18 (33.3%) | 2.94 |
| Total Families | 54 (100.0%) | 2.80 |
Median Household Size in Mooresboro
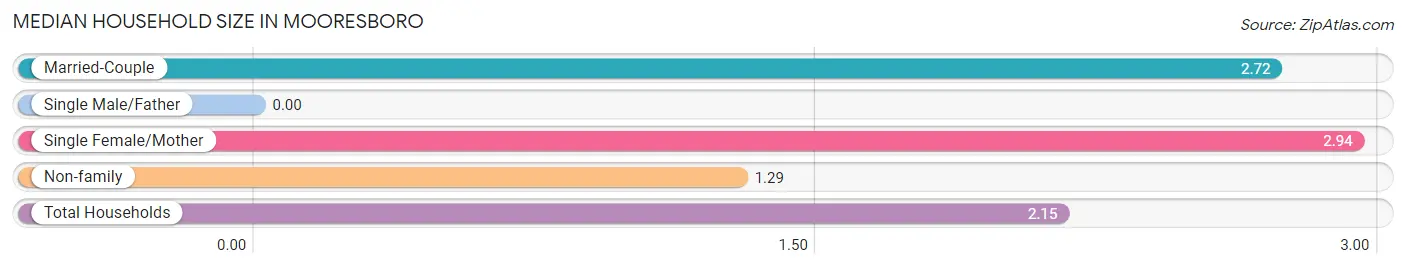
| Household Type | # Households | Household Size |
| Married-Couple | 36 (37.9%) | 2.72 |
| Single Male/Father | 0 (0.0%) | - |
| Single Female/Mother | 18 (19.0%) | 2.94 |
| Non-family | 41 (43.2%) | 1.29 |
| Total Households | 95 (100.0%) | 2.15 |
Household Size by Marriage Status in Mooresboro
Out of a total of 95 households in Mooresboro, 54 (56.8%) are family households, while 41 (43.2%) are nonfamily households. The most numerous type of family households are 2-person households, comprising 32, and the most common type of nonfamily households are 1-person households, comprising 34.
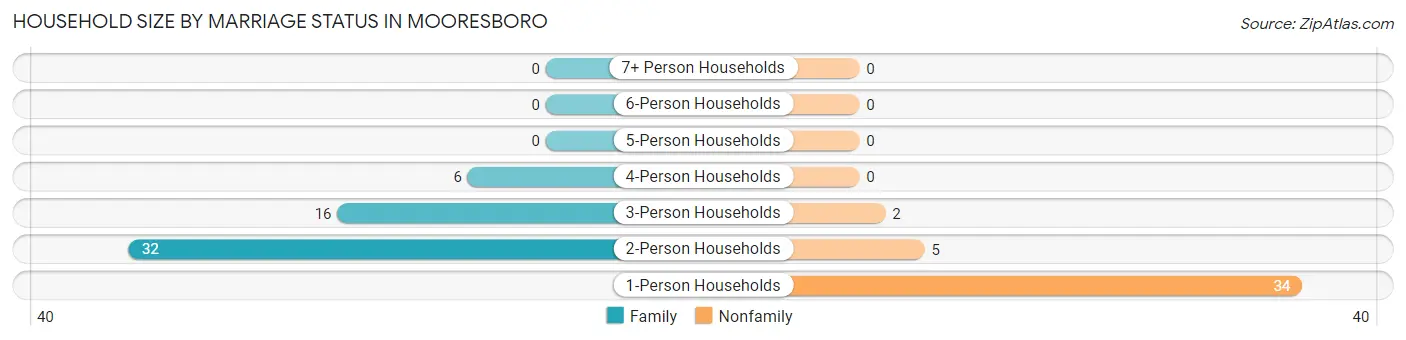
| Household Size | Family Households | Nonfamily Households |
| 1-Person Households | - | 34 (35.8%) |
| 2-Person Households | 32 (33.7%) | 5 (5.3%) |
| 3-Person Households | 16 (16.8%) | 2 (2.1%) |
| 4-Person Households | 6 (6.3%) | 0 (0.0%) |
| 5-Person Households | 0 (0.0%) | 0 (0.0%) |
| 6-Person Households | 0 (0.0%) | 0 (0.0%) |
| 7+ Person Households | 0 (0.0%) | 0 (0.0%) |
| Total | 54 (56.8%) | 41 (43.2%) |
Female Fertility in Mooresboro
Fertility by Age in Mooresboro
Average fertility rate in Mooresboro is 122.0 births per 1,000 women. Women in the age bracket of 20 to 34 years have the highest fertility rate with 200.0 births per 1,000 women. Women in the age bracket of 20 to 34 years acount for 100.0% of all women with births.
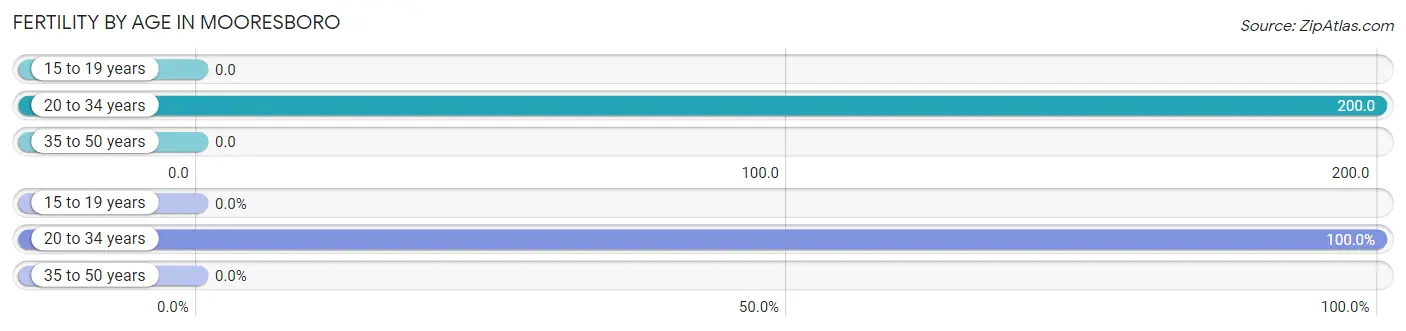
| Age Bracket | Women with Births | Births / 1,000 Women |
| 15 to 19 years | 0 (0.0%) | 0.0 |
| 20 to 34 years | 6 (100.0%) | 200.0 |
| 35 to 50 years | 0 (0.0%) | 0.0 |
| Total | 6 (100.0%) | 122.0 |
Fertility by Age by Marriage Status in Mooresboro
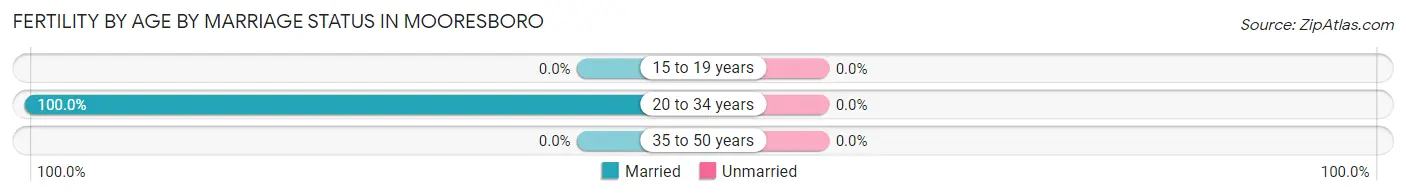
| Age Bracket | Married | Unmarried |
| 15 to 19 years | 0 (0.0%) | 0 (0.0%) |
| 20 to 34 years | 6 (100.0%) | 0 (0.0%) |
| 35 to 50 years | 0 (0.0%) | 0 (0.0%) |
| Total | 6 (100.0%) | 0 (0.0%) |
Fertility by Education in Mooresboro
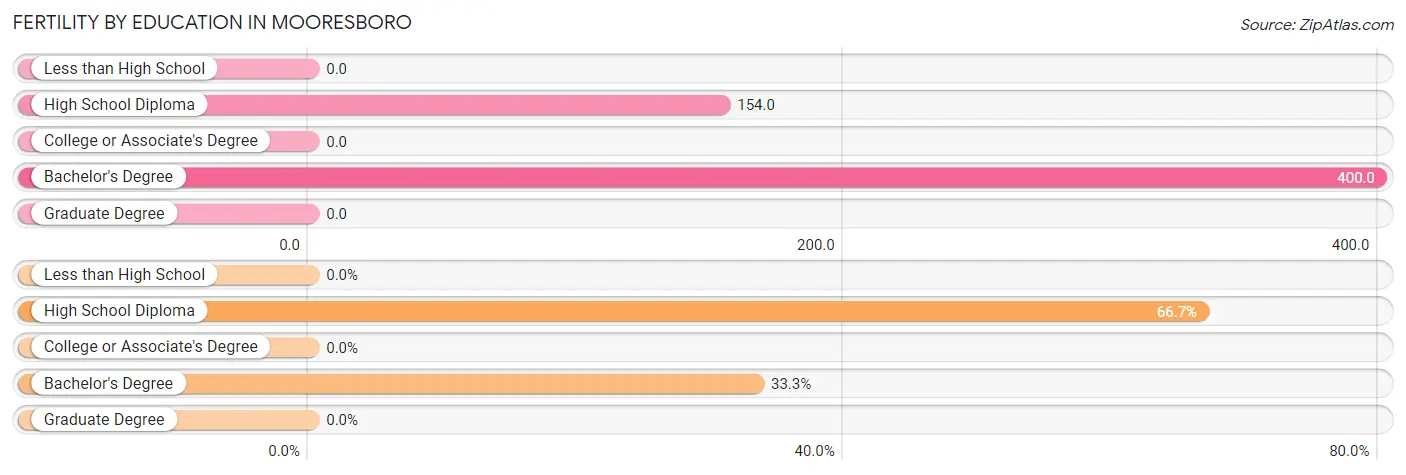
| Educational Attainment | Women with Births | Births / 1,000 Women |
| Less than High School | 0 (0.0%) | 0.0 |
| High School Diploma | 4 (66.7%) | 154.0 |
| College or Associate's Degree | 0 (0.0%) | 0.0 |
| Bachelor's Degree | 2 (33.3%) | 400.0 |
| Graduate Degree | 0 (0.0%) | 0.0 |
| Total | 6 (100.0%) | 122.0 |
Fertility by Education by Marriage Status in Mooresboro
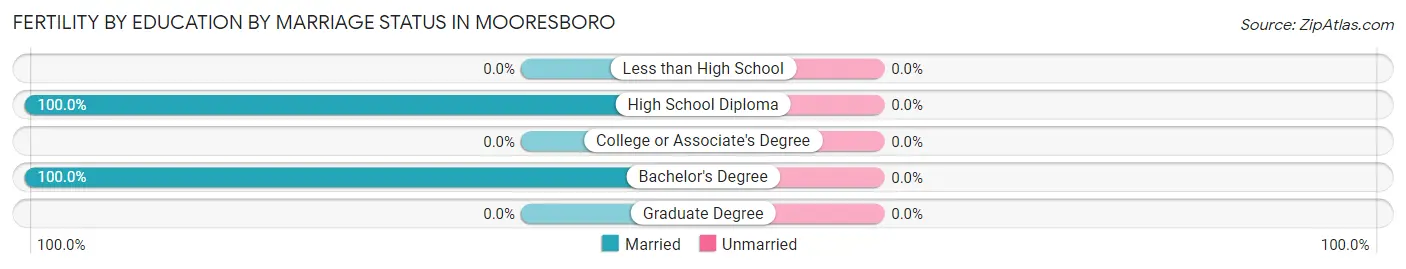
| Educational Attainment | Married | Unmarried |
| Less than High School | 0 (0.0%) | 0 (0.0%) |
| High School Diploma | 4 (100.0%) | 0 (0.0%) |
| College or Associate's Degree | 0 (0.0%) | 0 (0.0%) |
| Bachelor's Degree | 2 (100.0%) | 0 (0.0%) |
| Graduate Degree | 0 (0.0%) | 0 (0.0%) |
| Total | 6 (100.0%) | 0 (0.0%) |
Employment Characteristics in Mooresboro
Employment by Class of Employer in Mooresboro
Among the 86 employed individuals in Mooresboro, private company employees (72 | 83.7%), not-for-profit organizations (5 | 5.8%), and federal government employees (4 | 4.6%) make up the most common classes of employment.
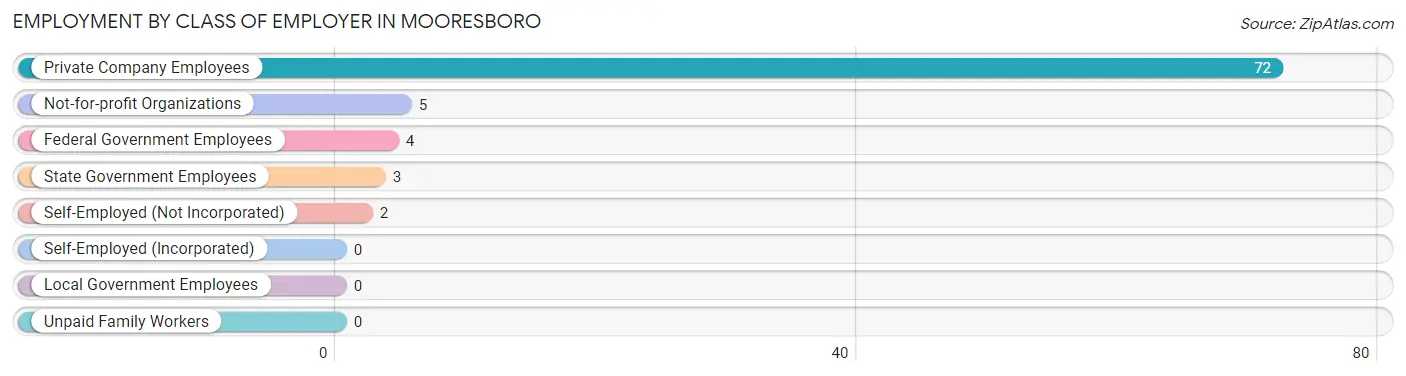
| Employer Class | # Employees | % Employees |
| Private Company Employees | 72 | 83.7% |
| Self-Employed (Incorporated) | 0 | 0.0% |
| Self-Employed (Not Incorporated) | 2 | 2.3% |
| Not-for-profit Organizations | 5 | 5.8% |
| Local Government Employees | 0 | 0.0% |
| State Government Employees | 3 | 3.5% |
| Federal Government Employees | 4 | 4.6% |
| Unpaid Family Workers | 0 | 0.0% |
| Total | 86 | 100.0% |
Employment Status by Age in Mooresboro
According to the labor force statistics for Mooresboro, out of the total population over 16 years of age (169), 54.4% or 92 individuals are in the labor force, with 6.5% or 6 of them unemployed. The age group with the highest labor force participation rate is 16 to 19 years, with 100.0% or 10 individuals in the labor force. Within the labor force, the 16 to 19 years age range has the highest percentage of unemployed individuals, with 60.0% or 6 of them being unemployed.
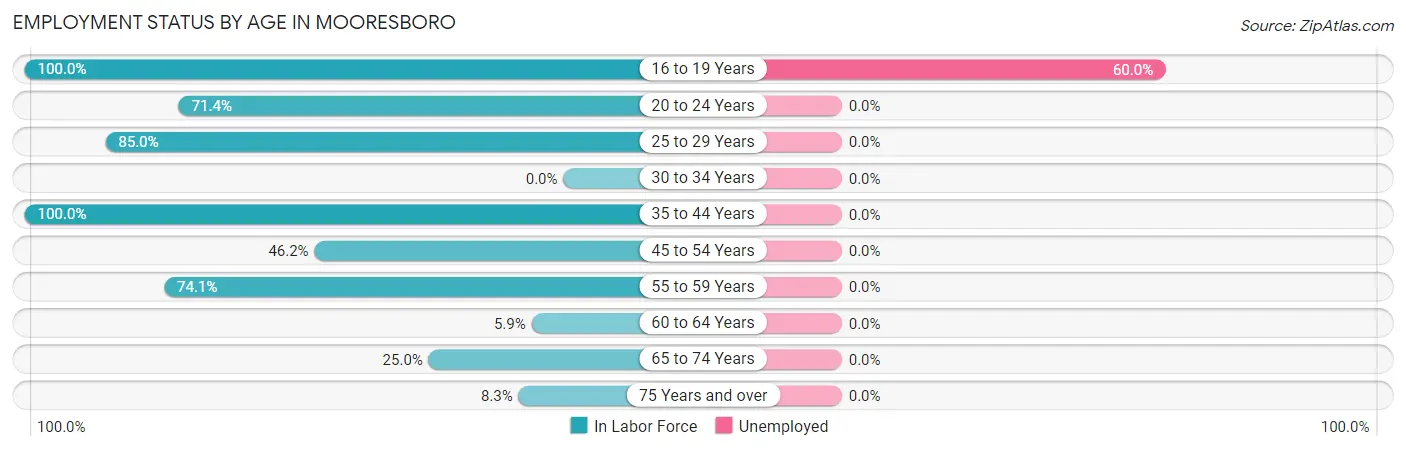
| Age Bracket | In Labor Force | Unemployed |
| 16 to 19 Years | 10 (100.0%) | 6 (60.0%) |
| 20 to 24 Years | 15 (71.4%) | 0 (0.0%) |
| 25 to 29 Years | 17 (85.0%) | 0 (0.0%) |
| 30 to 34 Years | 0 (0.0%) | 0 (0.0%) |
| 35 to 44 Years | 18 (100.0%) | 0 (0.0%) |
| 45 to 54 Years | 6 (46.2%) | 0 (0.0%) |
| 55 to 59 Years | 20 (74.1%) | 0 (0.0%) |
| 60 to 64 Years | 1 (5.9%) | 0 (0.0%) |
| 65 to 74 Years | 4 (25.0%) | 0 (0.0%) |
| 75 Years and over | 1 (8.3%) | 0 (0.0%) |
| Total | 92 (54.4%) | 6 (6.5%) |
Employment Status by Educational Attainment in Mooresboro
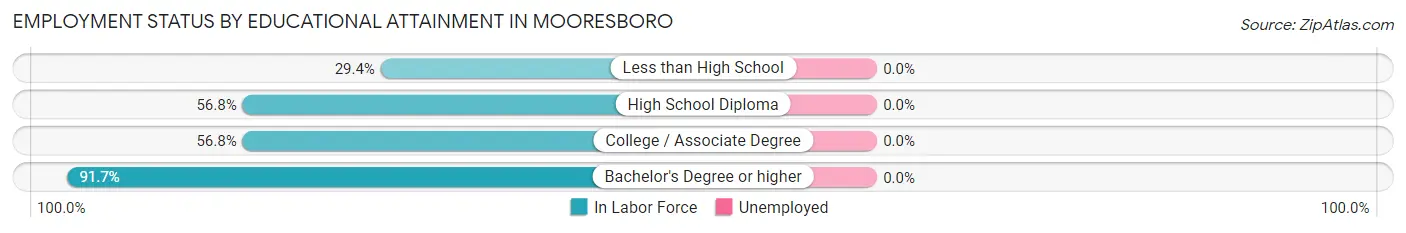
| Educational Attainment | In Labor Force | Unemployed |
| Less than High School | 5 (29.4%) | 0 (0.0%) |
| High School Diploma | 21 (56.8%) | 0 (0.0%) |
| College / Associate Degree | 25 (56.8%) | 0 (0.0%) |
| Bachelor's Degree or higher | 11 (91.7%) | 0 (0.0%) |
| Total | 62 (56.4%) | 0 (0.0%) |
Employment Occupations by Sex in Mooresboro
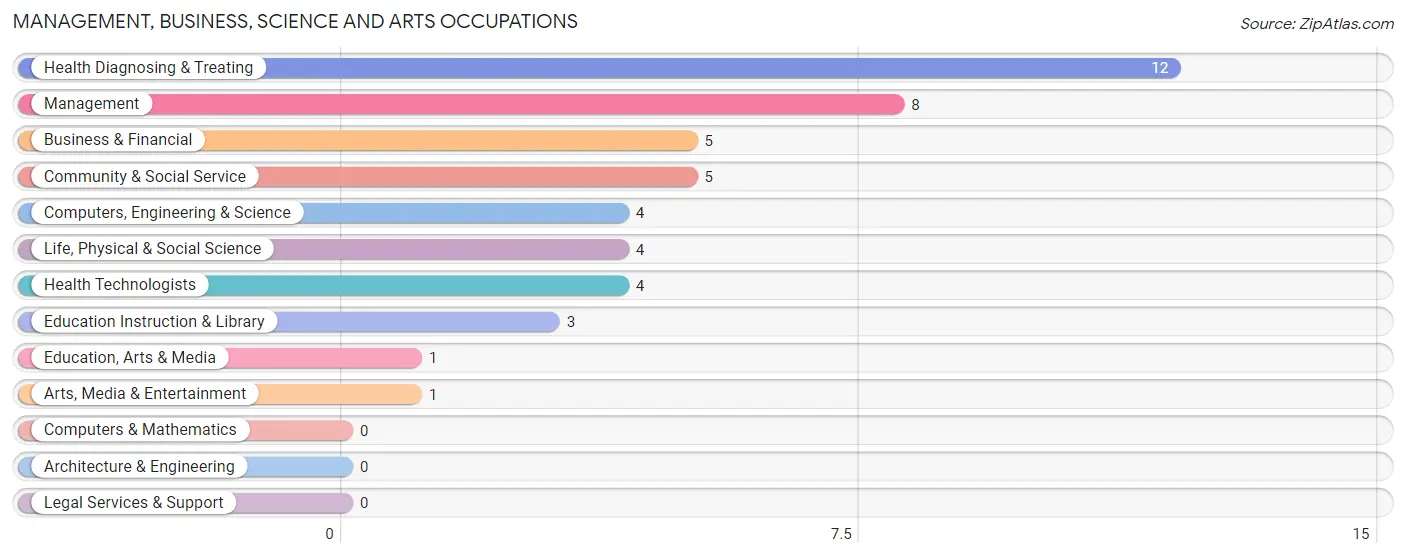
Management, Business, Science and Arts Occupations
The most common Management, Business, Science and Arts occupations in Mooresboro are Health Diagnosing & Treating (12 | 14.0%), Management (8 | 9.3%), Business & Financial (5 | 5.8%), Community & Social Service (5 | 5.8%), and Computers, Engineering & Science (4 | 4.6%).
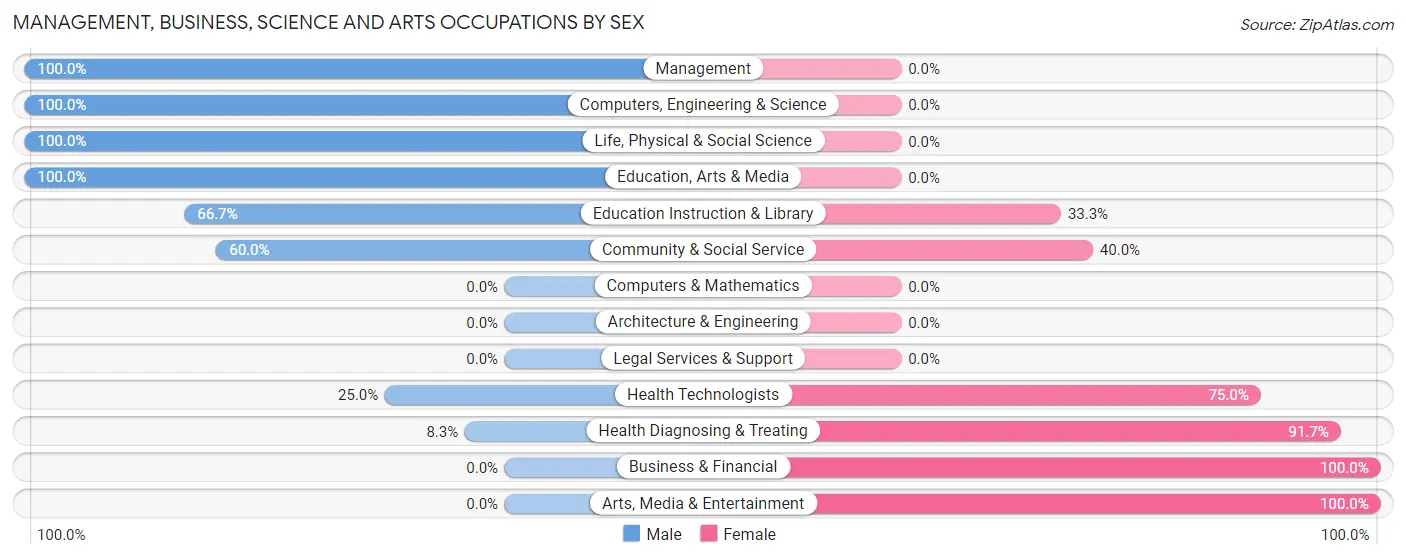
Management, Business, Science and Arts Occupations by Sex
Within the Management, Business, Science and Arts occupations in Mooresboro, the most male-oriented occupations are Management (100.0%), Computers, Engineering & Science (100.0%), and Life, Physical & Social Science (100.0%), while the most female-oriented occupations are Business & Financial (100.0%), Arts, Media & Entertainment (100.0%), and Health Diagnosing & Treating (91.7%).
| Occupation | Male | Female |
| Management | 8 (100.0%) | 0 (0.0%) |
| Business & Financial | 0 (0.0%) | 5 (100.0%) |
| Computers, Engineering & Science | 4 (100.0%) | 0 (0.0%) |
| Computers & Mathematics | 0 (0.0%) | 0 (0.0%) |
| Architecture & Engineering | 0 (0.0%) | 0 (0.0%) |
| Life, Physical & Social Science | 4 (100.0%) | 0 (0.0%) |
| Community & Social Service | 3 (60.0%) | 2 (40.0%) |
| Education, Arts & Media | 1 (100.0%) | 0 (0.0%) |
| Legal Services & Support | 0 (0.0%) | 0 (0.0%) |
| Education Instruction & Library | 2 (66.7%) | 1 (33.3%) |
| Arts, Media & Entertainment | 0 (0.0%) | 1 (100.0%) |
| Health Diagnosing & Treating | 1 (8.3%) | 11 (91.7%) |
| Health Technologists | 1 (25.0%) | 3 (75.0%) |
| Total (Category) | 16 (47.1%) | 18 (52.9%) |
| Total (Overall) | 53 (61.6%) | 33 (38.4%) |
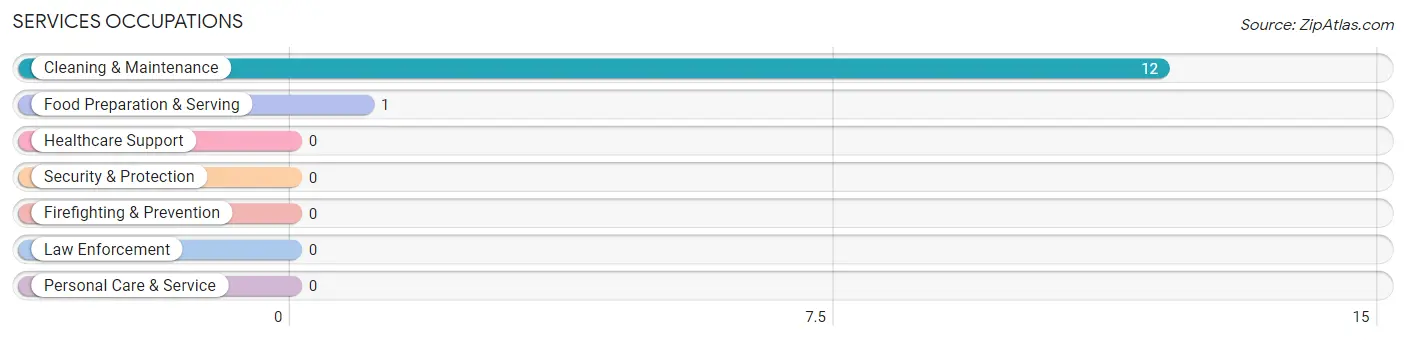
Services Occupations
The most common Services occupations in Mooresboro are Cleaning & Maintenance (12 | 14.0%), and Food Preparation & Serving (1 | 1.2%).
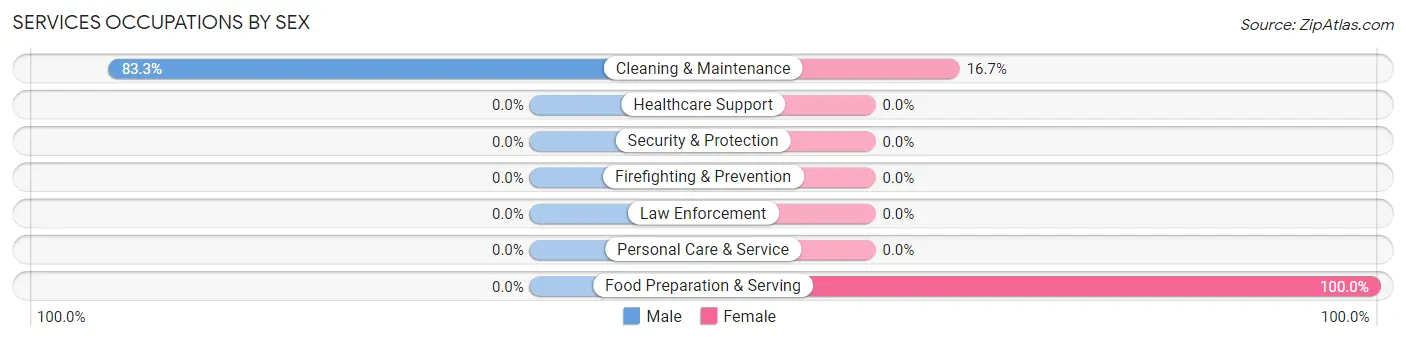
Services Occupations by Sex
| Occupation | Male | Female |
| Healthcare Support | 0 (0.0%) | 0 (0.0%) |
| Security & Protection | 0 (0.0%) | 0 (0.0%) |
| Firefighting & Prevention | 0 (0.0%) | 0 (0.0%) |
| Law Enforcement | 0 (0.0%) | 0 (0.0%) |
| Food Preparation & Serving | 0 (0.0%) | 1 (100.0%) |
| Cleaning & Maintenance | 10 (83.3%) | 2 (16.7%) |
| Personal Care & Service | 0 (0.0%) | 0 (0.0%) |
| Total (Category) | 10 (76.9%) | 3 (23.1%) |
| Total (Overall) | 53 (61.6%) | 33 (38.4%) |
Sales and Office Occupations
The most common Sales and Office occupations in Mooresboro are Office & Administration (6 | 7.0%), and Sales & Related (5 | 5.8%).
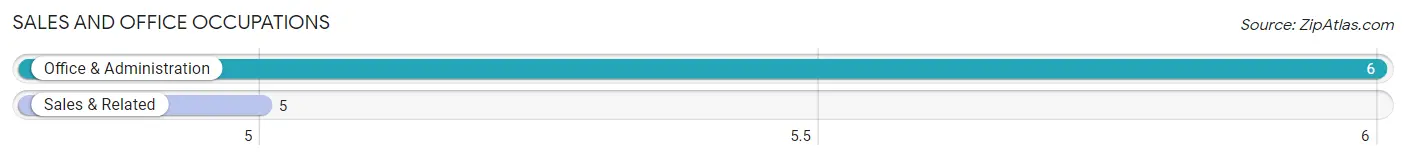
Sales and Office Occupations by Sex
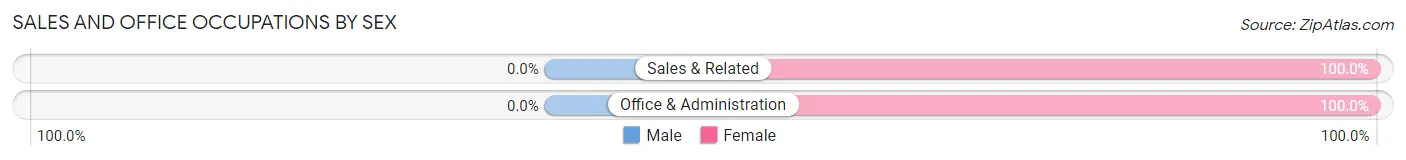
| Occupation | Male | Female |
| Sales & Related | 0 (0.0%) | 5 (100.0%) |
| Office & Administration | 0 (0.0%) | 6 (100.0%) |
| Total (Category) | 0 (0.0%) | 11 (100.0%) |
| Total (Overall) | 53 (61.6%) | 33 (38.4%) |
Natural Resources, Construction and Maintenance Occupations
The most common Natural Resources, Construction and Maintenance occupations in Mooresboro are Construction & Extraction (11 | 12.8%), and Installation, Maintenance & Repair (7 | 8.1%).
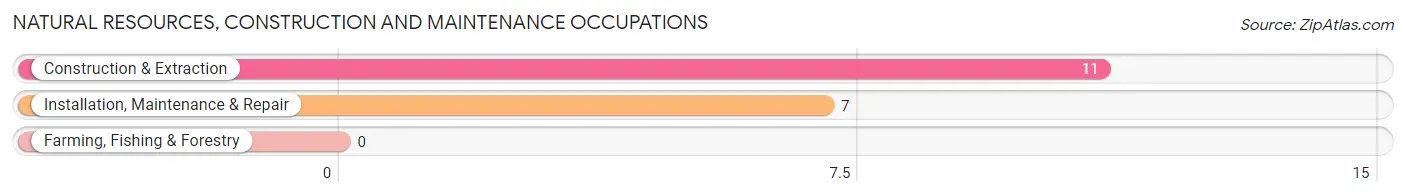
Natural Resources, Construction and Maintenance Occupations by Sex
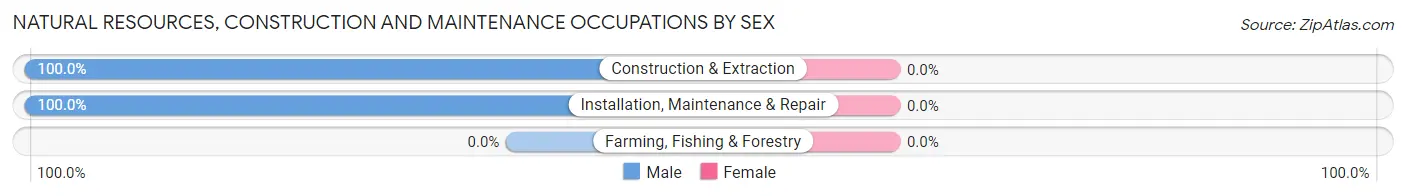
| Occupation | Male | Female |
| Farming, Fishing & Forestry | 0 (0.0%) | 0 (0.0%) |
| Construction & Extraction | 11 (100.0%) | 0 (0.0%) |
| Installation, Maintenance & Repair | 7 (100.0%) | 0 (0.0%) |
| Total (Category) | 18 (100.0%) | 0 (0.0%) |
| Total (Overall) | 53 (61.6%) | 33 (38.4%) |
Production, Transportation and Moving Occupations
The most common Production, Transportation and Moving occupations in Mooresboro are Production (9 | 10.5%), and Material Moving (1 | 1.2%).
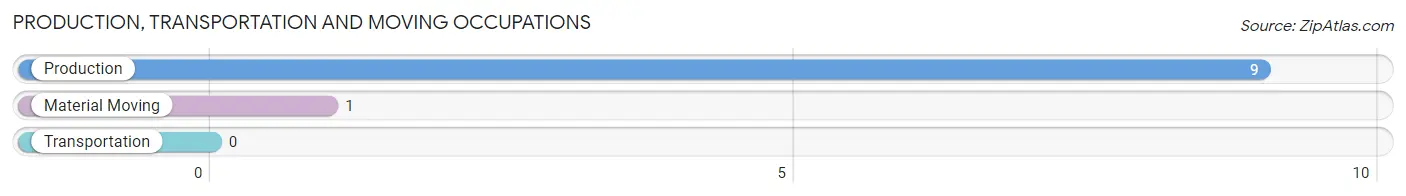
Production, Transportation and Moving Occupations by Sex
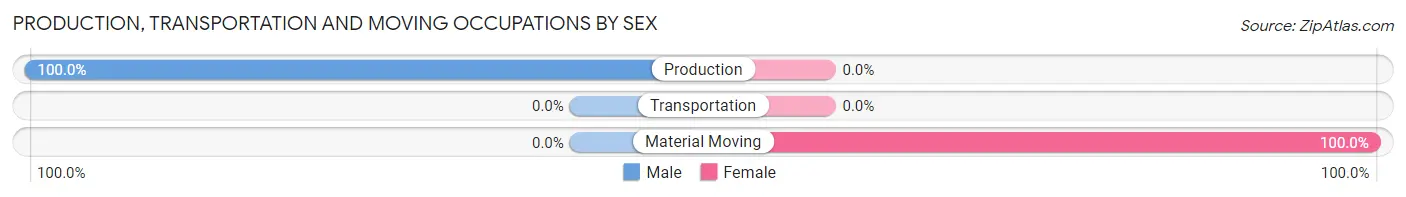
| Occupation | Male | Female |
| Production | 9 (100.0%) | 0 (0.0%) |
| Transportation | 0 (0.0%) | 0 (0.0%) |
| Material Moving | 0 (0.0%) | 1 (100.0%) |
| Total (Category) | 9 (90.0%) | 1 (10.0%) |
| Total (Overall) | 53 (61.6%) | 33 (38.4%) |
Employment Industries by Sex in Mooresboro
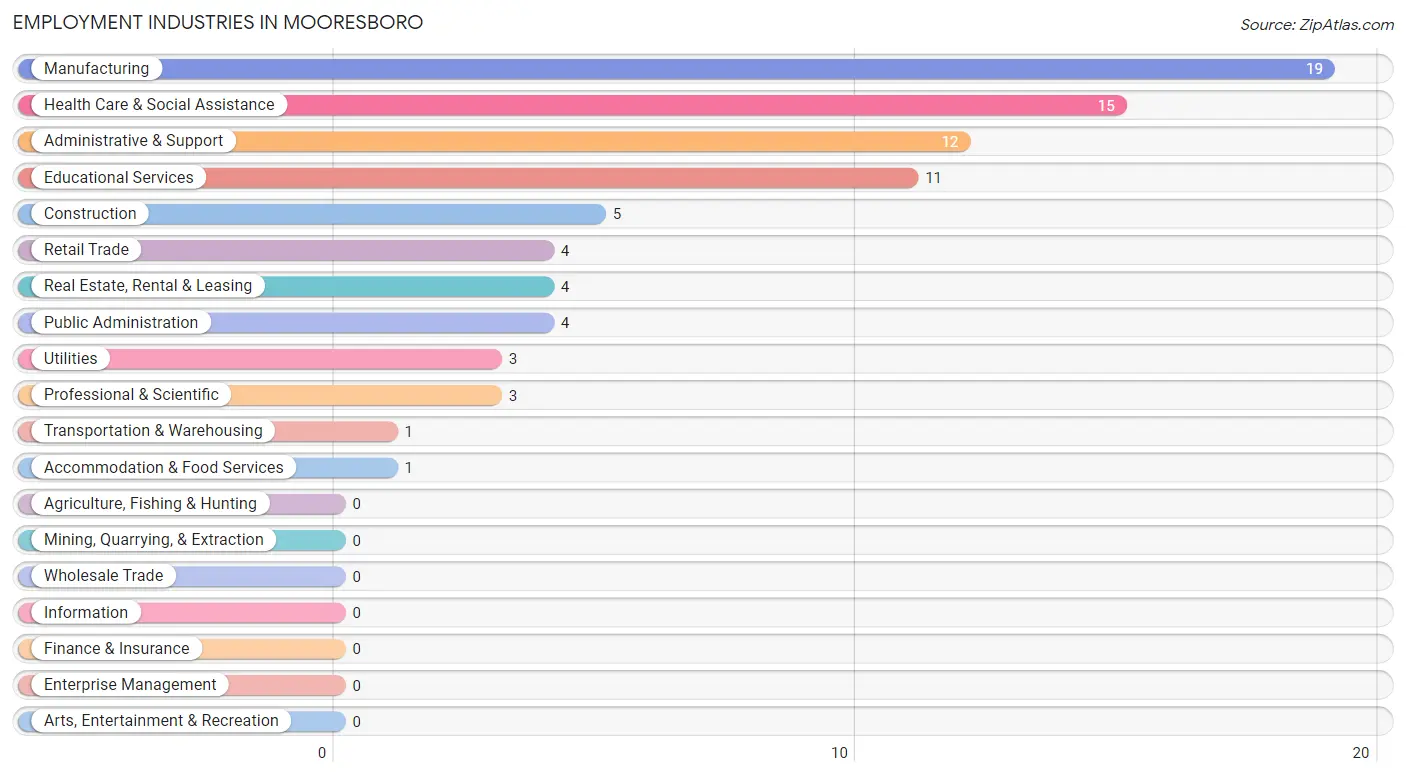
Employment Industries in Mooresboro
The major employment industries in Mooresboro include Manufacturing (19 | 22.1%), Health Care & Social Assistance (15 | 17.4%), Administrative & Support (12 | 14.0%), Educational Services (11 | 12.8%), and Construction (5 | 5.8%).
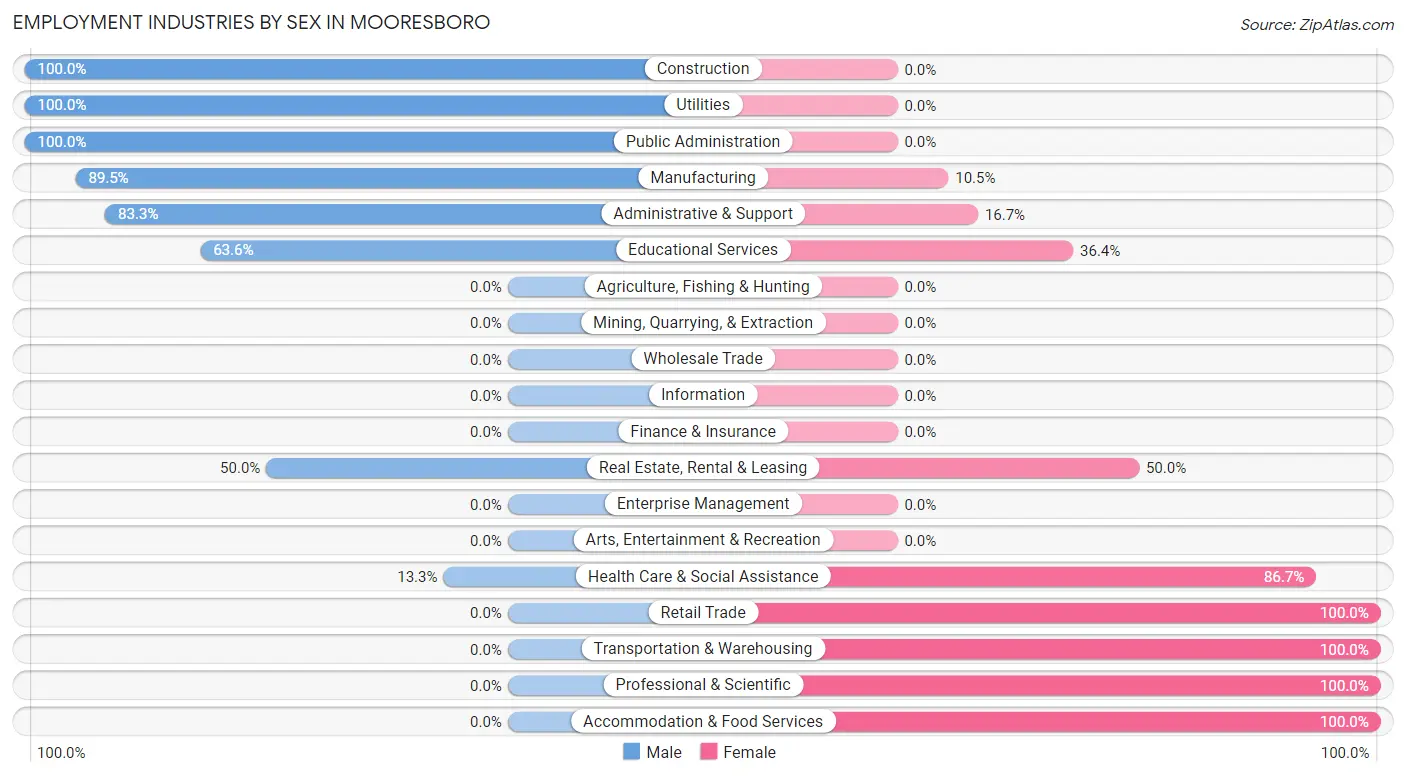
Employment Industries by Sex in Mooresboro
The Mooresboro industries that see more men than women are Construction (100.0%), Utilities (100.0%), and Public Administration (100.0%), whereas the industries that tend to have a higher number of women are Retail Trade (100.0%), Transportation & Warehousing (100.0%), and Professional & Scientific (100.0%).
| Industry | Male | Female |
| Agriculture, Fishing & Hunting | 0 (0.0%) | 0 (0.0%) |
| Mining, Quarrying, & Extraction | 0 (0.0%) | 0 (0.0%) |
| Construction | 5 (100.0%) | 0 (0.0%) |
| Manufacturing | 17 (89.5%) | 2 (10.5%) |
| Wholesale Trade | 0 (0.0%) | 0 (0.0%) |
| Retail Trade | 0 (0.0%) | 4 (100.0%) |
| Transportation & Warehousing | 0 (0.0%) | 1 (100.0%) |
| Utilities | 3 (100.0%) | 0 (0.0%) |
| Information | 0 (0.0%) | 0 (0.0%) |
| Finance & Insurance | 0 (0.0%) | 0 (0.0%) |
| Real Estate, Rental & Leasing | 2 (50.0%) | 2 (50.0%) |
| Professional & Scientific | 0 (0.0%) | 3 (100.0%) |
| Enterprise Management | 0 (0.0%) | 0 (0.0%) |
| Administrative & Support | 10 (83.3%) | 2 (16.7%) |
| Educational Services | 7 (63.6%) | 4 (36.4%) |
| Health Care & Social Assistance | 2 (13.3%) | 13 (86.7%) |
| Arts, Entertainment & Recreation | 0 (0.0%) | 0 (0.0%) |
| Accommodation & Food Services | 0 (0.0%) | 1 (100.0%) |
| Public Administration | 4 (100.0%) | 0 (0.0%) |
| Total | 53 (61.6%) | 33 (38.4%) |
Education in Mooresboro
School Enrollment in Mooresboro
The most common levels of schooling among the 37 students in Mooresboro are college / undergraduate (19 | 51.3%), elementary school (8 | 21.6%), and middle school (8 | 21.6%).
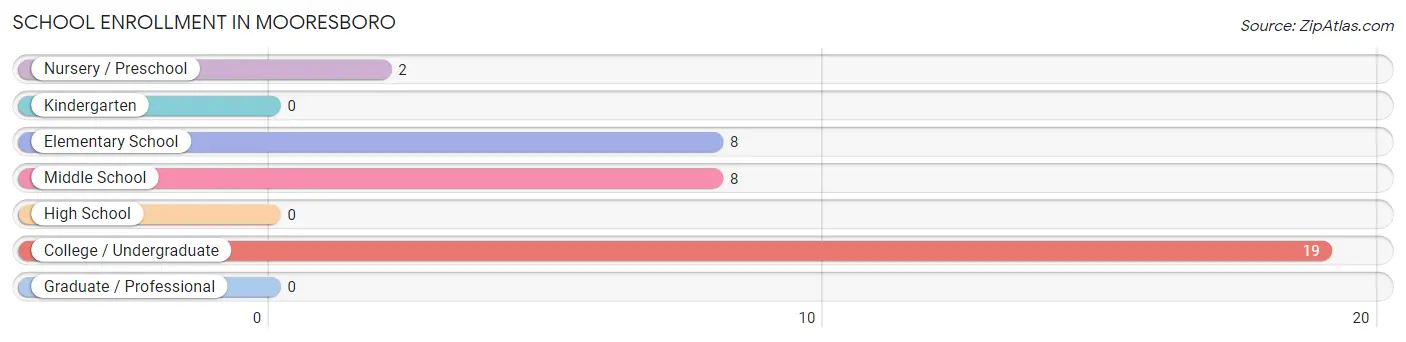
| School Level | # Students | % Students |
| Nursery / Preschool | 2 | 5.4% |
| Kindergarten | 0 | 0.0% |
| Elementary School | 8 | 21.6% |
| Middle School | 8 | 21.6% |
| High School | 0 | 0.0% |
| College / Undergraduate | 19 | 51.3% |
| Graduate / Professional | 0 | 0.0% |
| Total | 37 | 100.0% |
School Enrollment by Age by Funding Source in Mooresboro
Out of a total of 37 students who are enrolled in schools in Mooresboro, 5 (13.5%) attend a private institution, while the remaining 32 (86.5%) are enrolled in public schools. The age group of 20 to 24 year olds has the highest likelihood of being enrolled in private schools, with 3 (37.5% in the age bracket) enrolled. Conversely, the age group of 10 to 14 year olds has the lowest likelihood of being enrolled in a private school, with 8 (100.0% in the age bracket) attending a public institution.
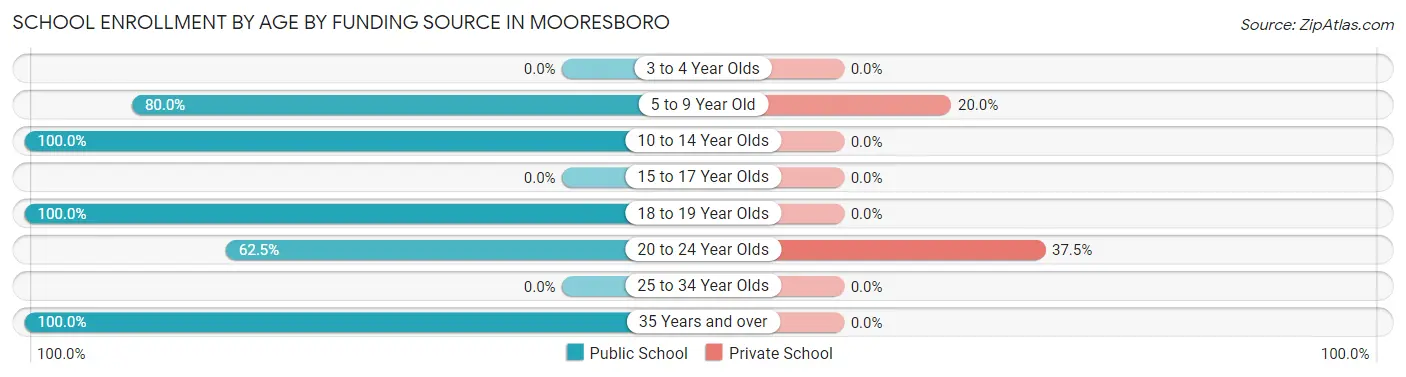
| Age Bracket | Public School | Private School |
| 3 to 4 Year Olds | 0 (0.0%) | 0 (0.0%) |
| 5 to 9 Year Old | 8 (80.0%) | 2 (20.0%) |
| 10 to 14 Year Olds | 8 (100.0%) | 0 (0.0%) |
| 15 to 17 Year Olds | 0 (0.0%) | 0 (0.0%) |
| 18 to 19 Year Olds | 6 (100.0%) | 0 (0.0%) |
| 20 to 24 Year Olds | 5 (62.5%) | 3 (37.5%) |
| 25 to 34 Year Olds | 0 (0.0%) | 0 (0.0%) |
| 35 Years and over | 5 (100.0%) | 0 (0.0%) |
| Total | 32 (86.5%) | 5 (13.5%) |
Educational Attainment by Field of Study in Mooresboro
Science & technology (6 | 31.6%), psychology (4 | 21.0%), business (2 | 10.5%), education (2 | 10.5%), and visual & performing arts (2 | 10.5%) are the most common fields of study among 19 individuals in Mooresboro who have obtained a bachelor's degree or higher.
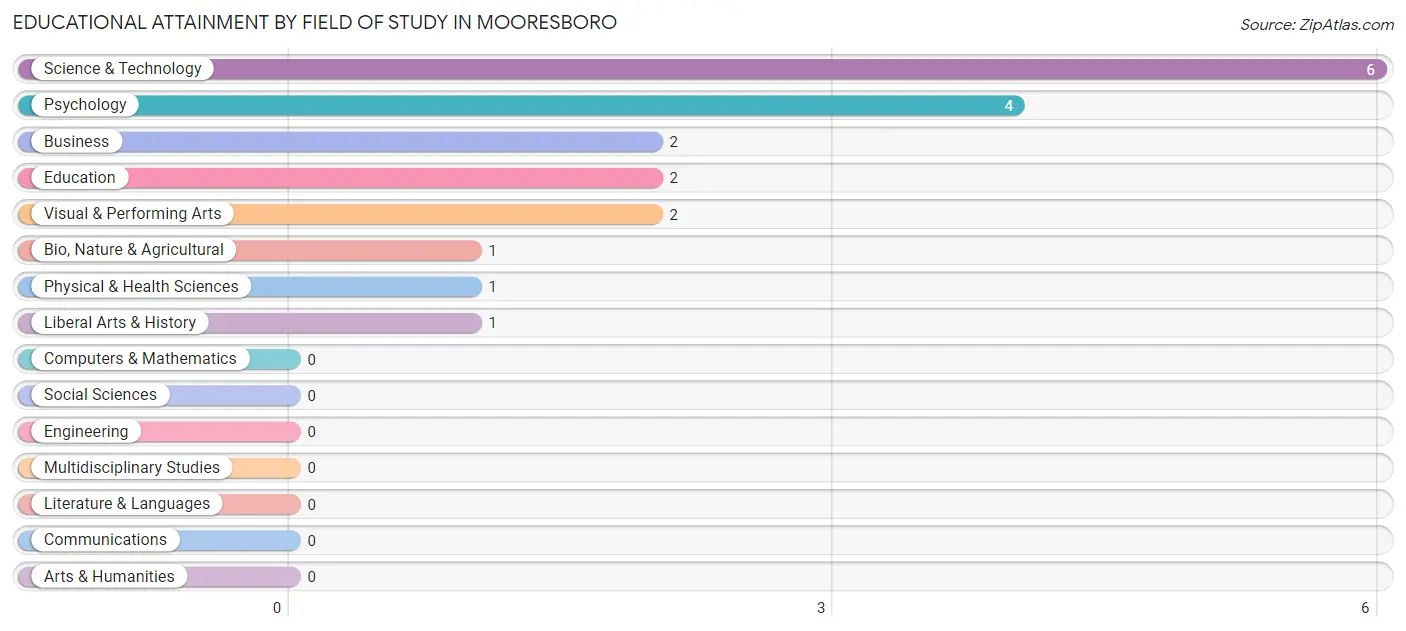
| Field of Study | # Graduates | % Graduates |
| Computers & Mathematics | 0 | 0.0% |
| Bio, Nature & Agricultural | 1 | 5.3% |
| Physical & Health Sciences | 1 | 5.3% |
| Psychology | 4 | 21.0% |
| Social Sciences | 0 | 0.0% |
| Engineering | 0 | 0.0% |
| Multidisciplinary Studies | 0 | 0.0% |
| Science & Technology | 6 | 31.6% |
| Business | 2 | 10.5% |
| Education | 2 | 10.5% |
| Literature & Languages | 0 | 0.0% |
| Liberal Arts & History | 1 | 5.3% |
| Visual & Performing Arts | 2 | 10.5% |
| Communications | 0 | 0.0% |
| Arts & Humanities | 0 | 0.0% |
| Total | 19 | 100.0% |
Transportation & Commute in Mooresboro
Vehicle Availability by Sex in Mooresboro
The most prevalent vehicle ownership categories in Mooresboro are males with 3 vehicles (21, accounting for 39.6%) and females with 3 vehicles (13, making up 63.6%).
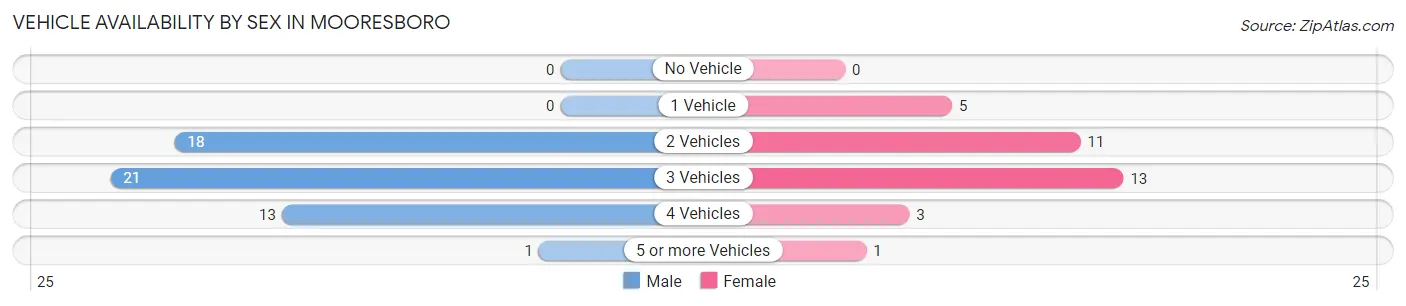
| Vehicles Available | Male | Female |
| No Vehicle | 0 (0.0%) | 0 (0.0%) |
| 1 Vehicle | 0 (0.0%) | 5 (15.1%) |
| 2 Vehicles | 18 (34.0%) | 11 (33.3%) |
| 3 Vehicles | 21 (39.6%) | 13 (39.4%) |
| 4 Vehicles | 13 (24.5%) | 3 (9.1%) |
| 5 or more Vehicles | 1 (1.9%) | 1 (3.0%) |
| Total | 53 (100.0%) | 33 (100.0%) |
Commute Time in Mooresboro
The most frequently occuring commute durations in Mooresboro are 15 to 19 minutes (21 commuters, 25.3%), 5 to 9 minutes (12 commuters, 14.5%), and 20 to 24 minutes (11 commuters, 13.3%).
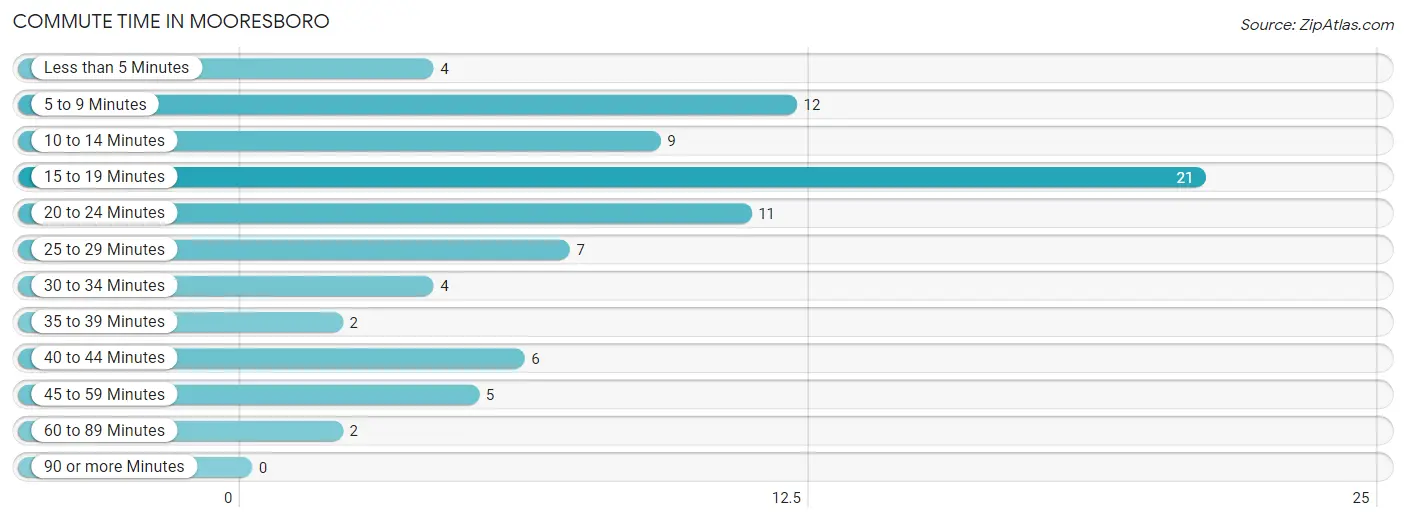
| Commute Time | # Commuters | % Commuters |
| Less than 5 Minutes | 4 | 4.8% |
| 5 to 9 Minutes | 12 | 14.5% |
| 10 to 14 Minutes | 9 | 10.8% |
| 15 to 19 Minutes | 21 | 25.3% |
| 20 to 24 Minutes | 11 | 13.3% |
| 25 to 29 Minutes | 7 | 8.4% |
| 30 to 34 Minutes | 4 | 4.8% |
| 35 to 39 Minutes | 2 | 2.4% |
| 40 to 44 Minutes | 6 | 7.2% |
| 45 to 59 Minutes | 5 | 6.0% |
| 60 to 89 Minutes | 2 | 2.4% |
| 90 or more Minutes | 0 | 0.0% |
Commute Time by Sex in Mooresboro
The most common commute times in Mooresboro are 15 to 19 minutes (11 commuters, 20.7%) for males and 15 to 19 minutes (10 commuters, 33.3%) for females.
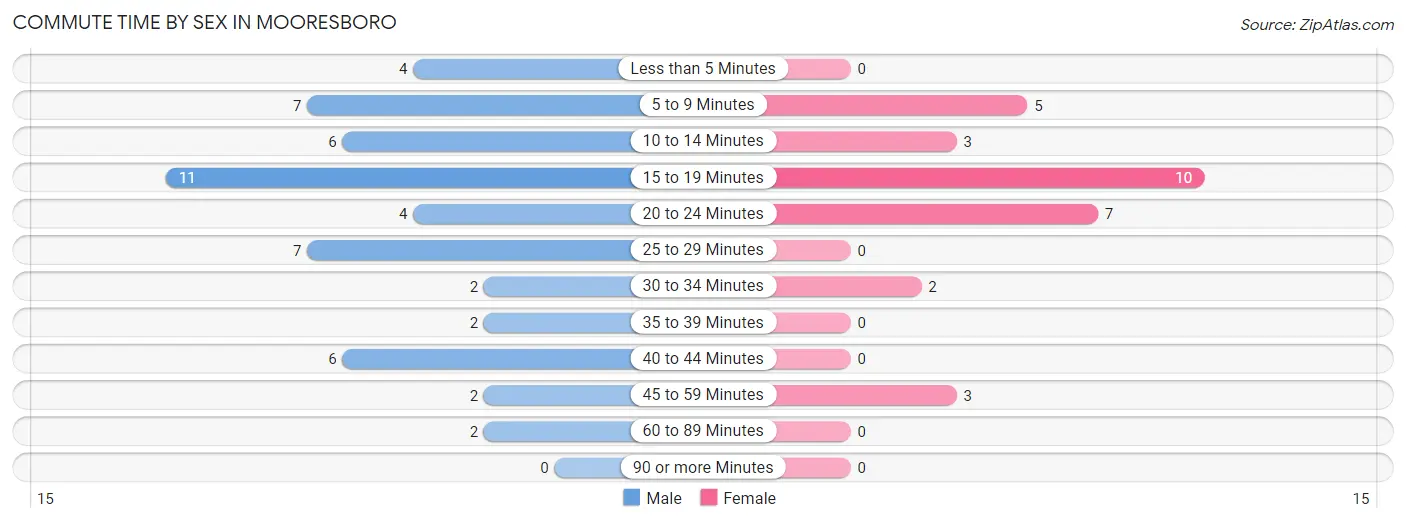
| Commute Time | Male | Female |
| Less than 5 Minutes | 4 (7.5%) | 0 (0.0%) |
| 5 to 9 Minutes | 7 (13.2%) | 5 (16.7%) |
| 10 to 14 Minutes | 6 (11.3%) | 3 (10.0%) |
| 15 to 19 Minutes | 11 (20.7%) | 10 (33.3%) |
| 20 to 24 Minutes | 4 (7.5%) | 7 (23.3%) |
| 25 to 29 Minutes | 7 (13.2%) | 0 (0.0%) |
| 30 to 34 Minutes | 2 (3.8%) | 2 (6.7%) |
| 35 to 39 Minutes | 2 (3.8%) | 0 (0.0%) |
| 40 to 44 Minutes | 6 (11.3%) | 0 (0.0%) |
| 45 to 59 Minutes | 2 (3.8%) | 3 (10.0%) |
| 60 to 89 Minutes | 2 (3.8%) | 0 (0.0%) |
| 90 or more Minutes | 0 (0.0%) | 0 (0.0%) |
Time of Departure to Work by Sex in Mooresboro
The most frequent times of departure to work in Mooresboro are 7:30 AM to 7:59 AM (25, 47.2%) for males and 7:00 AM to 7:29 AM (9, 30.0%) for females.
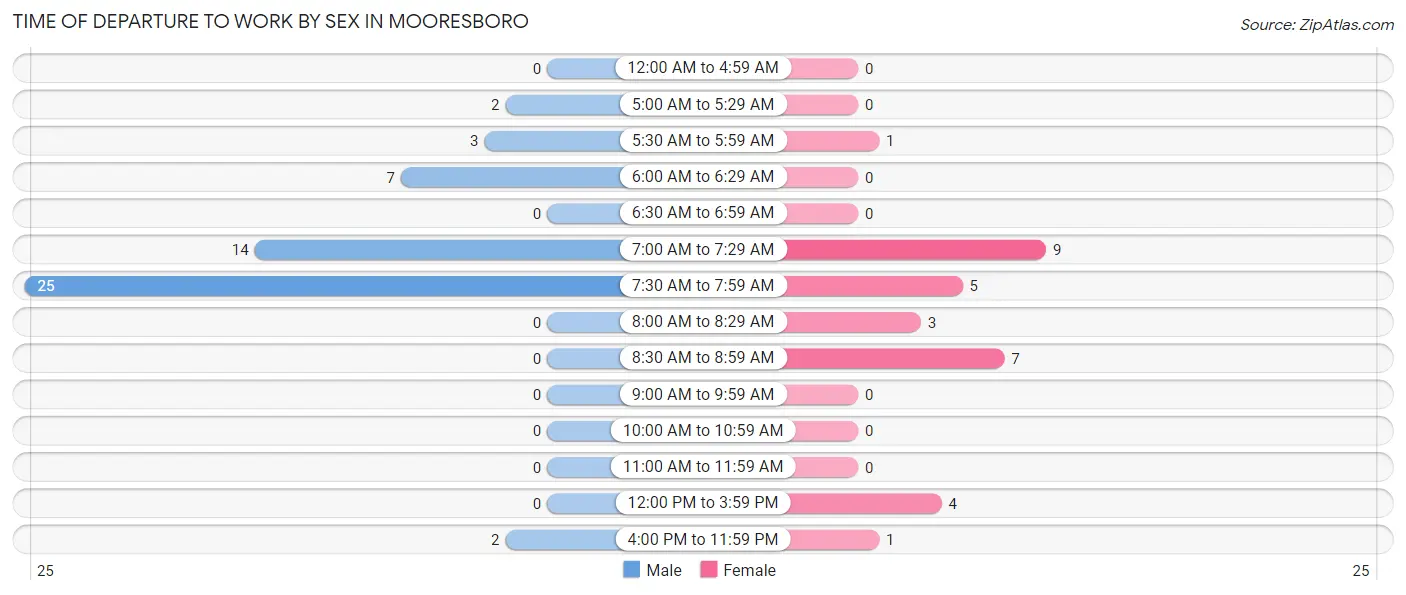
| Time of Departure | Male | Female |
| 12:00 AM to 4:59 AM | 0 (0.0%) | 0 (0.0%) |
| 5:00 AM to 5:29 AM | 2 (3.8%) | 0 (0.0%) |
| 5:30 AM to 5:59 AM | 3 (5.7%) | 1 (3.3%) |
| 6:00 AM to 6:29 AM | 7 (13.2%) | 0 (0.0%) |
| 6:30 AM to 6:59 AM | 0 (0.0%) | 0 (0.0%) |
| 7:00 AM to 7:29 AM | 14 (26.4%) | 9 (30.0%) |
| 7:30 AM to 7:59 AM | 25 (47.2%) | 5 (16.7%) |
| 8:00 AM to 8:29 AM | 0 (0.0%) | 3 (10.0%) |
| 8:30 AM to 8:59 AM | 0 (0.0%) | 7 (23.3%) |
| 9:00 AM to 9:59 AM | 0 (0.0%) | 0 (0.0%) |
| 10:00 AM to 10:59 AM | 0 (0.0%) | 0 (0.0%) |
| 11:00 AM to 11:59 AM | 0 (0.0%) | 0 (0.0%) |
| 12:00 PM to 3:59 PM | 0 (0.0%) | 4 (13.3%) |
| 4:00 PM to 11:59 PM | 2 (3.8%) | 1 (3.3%) |
| Total | 53 (100.0%) | 30 (100.0%) |
Housing Occupancy in Mooresboro
Occupancy by Ownership in Mooresboro
Of the total 95 dwellings in Mooresboro, owner-occupied units account for 67 (70.5%), while renter-occupied units make up 28 (29.5%).
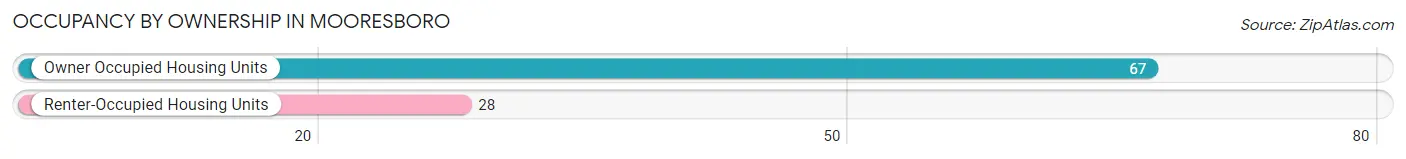
| Occupancy | # Housing Units | % Housing Units |
| Owner Occupied Housing Units | 67 | 70.5% |
| Renter-Occupied Housing Units | 28 | 29.5% |
| Total Occupied Housing Units | 95 | 100.0% |
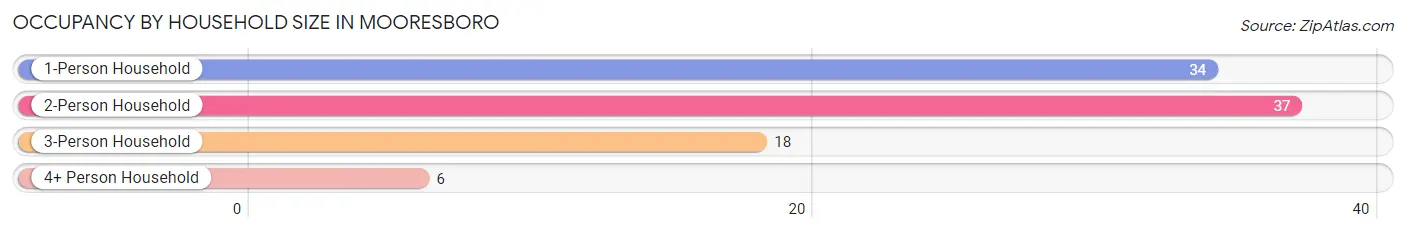
Occupancy by Household Size in Mooresboro
| Household Size | # Housing Units | % Housing Units |
| 1-Person Household | 34 | 35.8% |
| 2-Person Household | 37 | 39.0% |
| 3-Person Household | 18 | 19.0% |
| 4+ Person Household | 6 | 6.3% |
| Total Housing Units | 95 | 100.0% |
Occupancy by Ownership by Household Size in Mooresboro
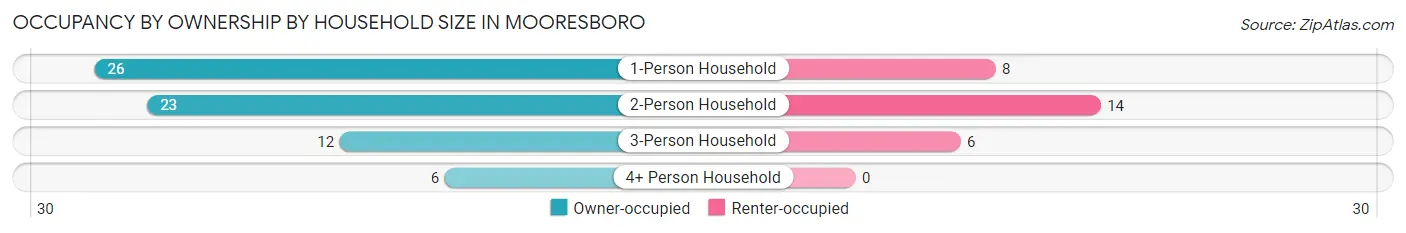
| Household Size | Owner-occupied | Renter-occupied |
| 1-Person Household | 26 (76.5%) | 8 (23.5%) |
| 2-Person Household | 23 (62.2%) | 14 (37.8%) |
| 3-Person Household | 12 (66.7%) | 6 (33.3%) |
| 4+ Person Household | 6 (100.0%) | 0 (0.0%) |
| Total Housing Units | 67 (70.5%) | 28 (29.5%) |
Occupancy by Educational Attainment in Mooresboro
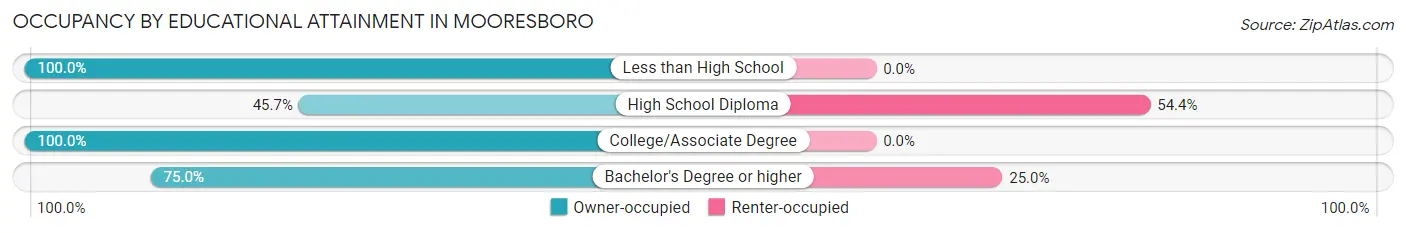
| Household Size | Owner-occupied | Renter-occupied |
| Less than High School | 5 (100.0%) | 0 (0.0%) |
| High School Diploma | 21 (45.7%) | 25 (54.3%) |
| College/Associate Degree | 32 (100.0%) | 0 (0.0%) |
| Bachelor's Degree or higher | 9 (75.0%) | 3 (25.0%) |
Occupancy by Age of Householder in Mooresboro
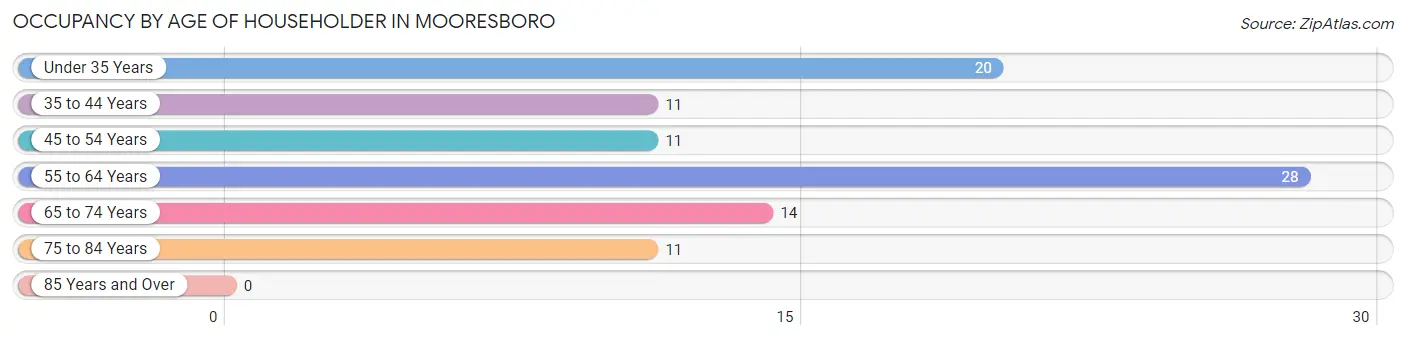
| Age Bracket | # Households | % Households |
| Under 35 Years | 20 | 21.0% |
| 35 to 44 Years | 11 | 11.6% |
| 45 to 54 Years | 11 | 11.6% |
| 55 to 64 Years | 28 | 29.5% |
| 65 to 74 Years | 14 | 14.7% |
| 75 to 84 Years | 11 | 11.6% |
| 85 Years and Over | 0 | 0.0% |
| Total | 95 | 100.0% |
Housing Finances in Mooresboro
Median Income by Occupancy in Mooresboro
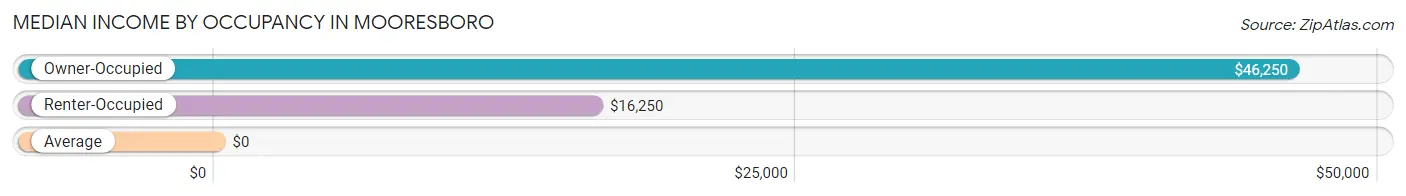
| Occupancy Type | # Households | Median Income |
| Owner-Occupied | 67 (70.5%) | $46,250 |
| Renter-Occupied | 28 (29.5%) | $16,250 |
| Average | 95 (100.0%) | $0 |
Occupancy by Householder Income Bracket in Mooresboro
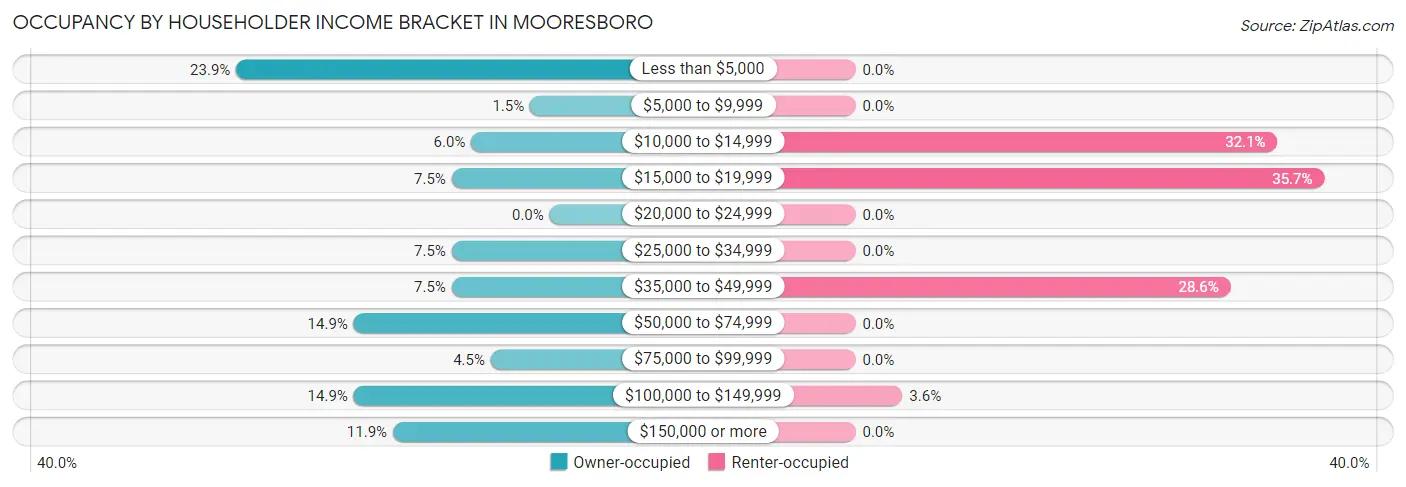
| Income Bracket | Owner-occupied | Renter-occupied |
| Less than $5,000 | 16 (23.9%) | 0 (0.0%) |
| $5,000 to $9,999 | 1 (1.5%) | 0 (0.0%) |
| $10,000 to $14,999 | 4 (6.0%) | 9 (32.1%) |
| $15,000 to $19,999 | 5 (7.5%) | 10 (35.7%) |
| $20,000 to $24,999 | 0 (0.0%) | 0 (0.0%) |
| $25,000 to $34,999 | 5 (7.5%) | 0 (0.0%) |
| $35,000 to $49,999 | 5 (7.5%) | 8 (28.6%) |
| $50,000 to $74,999 | 10 (14.9%) | 0 (0.0%) |
| $75,000 to $99,999 | 3 (4.5%) | 0 (0.0%) |
| $100,000 to $149,999 | 10 (14.9%) | 1 (3.6%) |
| $150,000 or more | 8 (11.9%) | 0 (0.0%) |
| Total | 67 (100.0%) | 28 (100.0%) |
Monthly Housing Cost Tiers in Mooresboro
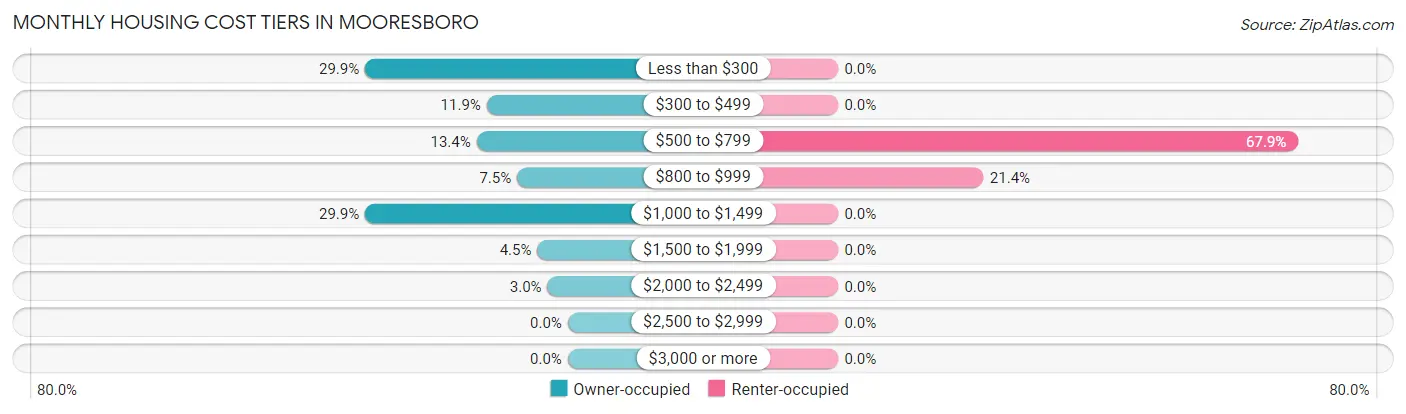
| Monthly Cost | Owner-occupied | Renter-occupied |
| Less than $300 | 20 (29.8%) | 0 (0.0%) |
| $300 to $499 | 8 (11.9%) | 0 (0.0%) |
| $500 to $799 | 9 (13.4%) | 19 (67.9%) |
| $800 to $999 | 5 (7.5%) | 6 (21.4%) |
| $1,000 to $1,499 | 20 (29.8%) | 0 (0.0%) |
| $1,500 to $1,999 | 3 (4.5%) | 0 (0.0%) |
| $2,000 to $2,499 | 2 (3.0%) | 0 (0.0%) |
| $2,500 to $2,999 | 0 (0.0%) | 0 (0.0%) |
| $3,000 or more | 0 (0.0%) | 0 (0.0%) |
| Total | 67 (100.0%) | 28 (100.0%) |
Physical Housing Characteristics in Mooresboro
Housing Structures in Mooresboro
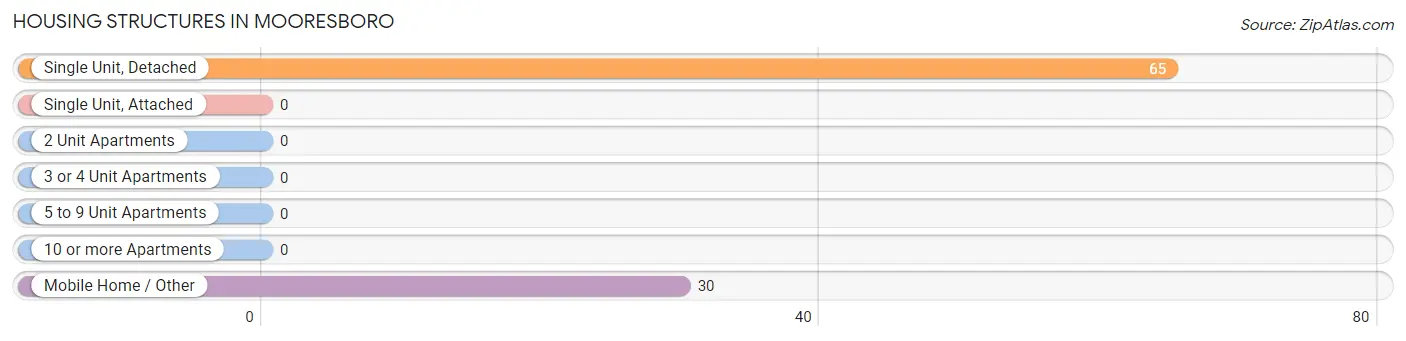
| Structure Type | # Housing Units | % Housing Units |
| Single Unit, Detached | 65 | 68.4% |
| Single Unit, Attached | 0 | 0.0% |
| 2 Unit Apartments | 0 | 0.0% |
| 3 or 4 Unit Apartments | 0 | 0.0% |
| 5 to 9 Unit Apartments | 0 | 0.0% |
| 10 or more Apartments | 0 | 0.0% |
| Mobile Home / Other | 30 | 31.6% |
| Total | 95 | 100.0% |
Housing Structures by Occupancy in Mooresboro
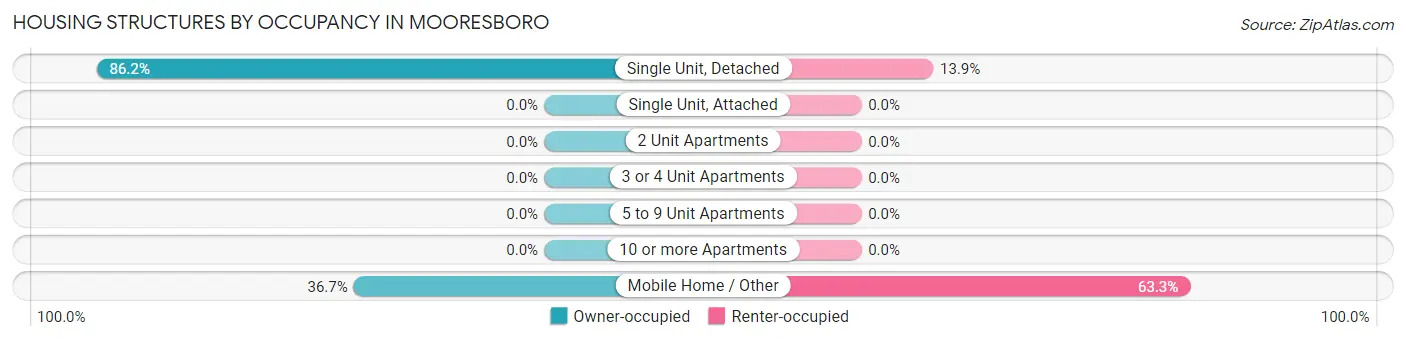
| Structure Type | Owner-occupied | Renter-occupied |
| Single Unit, Detached | 56 (86.2%) | 9 (13.9%) |
| Single Unit, Attached | 0 (0.0%) | 0 (0.0%) |
| 2 Unit Apartments | 0 (0.0%) | 0 (0.0%) |
| 3 or 4 Unit Apartments | 0 (0.0%) | 0 (0.0%) |
| 5 to 9 Unit Apartments | 0 (0.0%) | 0 (0.0%) |
| 10 or more Apartments | 0 (0.0%) | 0 (0.0%) |
| Mobile Home / Other | 11 (36.7%) | 19 (63.3%) |
| Total | 67 (70.5%) | 28 (29.5%) |
Housing Structures by Number of Rooms in Mooresboro
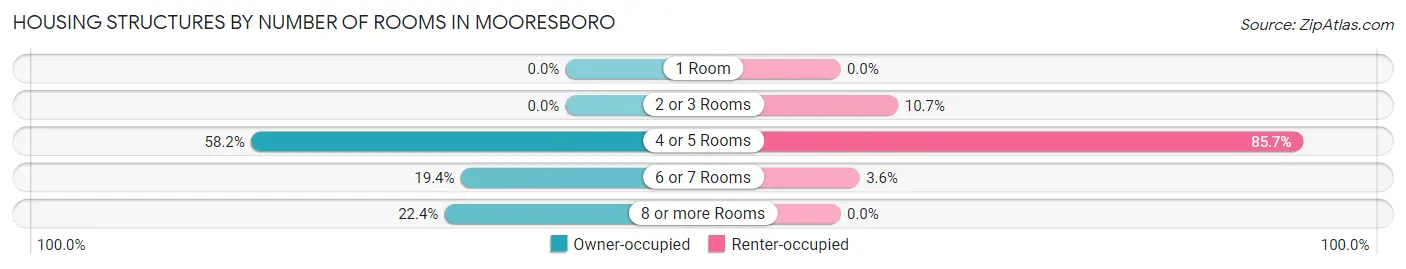
| Number of Rooms | Owner-occupied | Renter-occupied |
| 1 Room | 0 (0.0%) | 0 (0.0%) |
| 2 or 3 Rooms | 0 (0.0%) | 3 (10.7%) |
| 4 or 5 Rooms | 39 (58.2%) | 24 (85.7%) |
| 6 or 7 Rooms | 13 (19.4%) | 1 (3.6%) |
| 8 or more Rooms | 15 (22.4%) | 0 (0.0%) |
| Total | 67 (100.0%) | 28 (100.0%) |
Housing Structure by Heating Type in Mooresboro
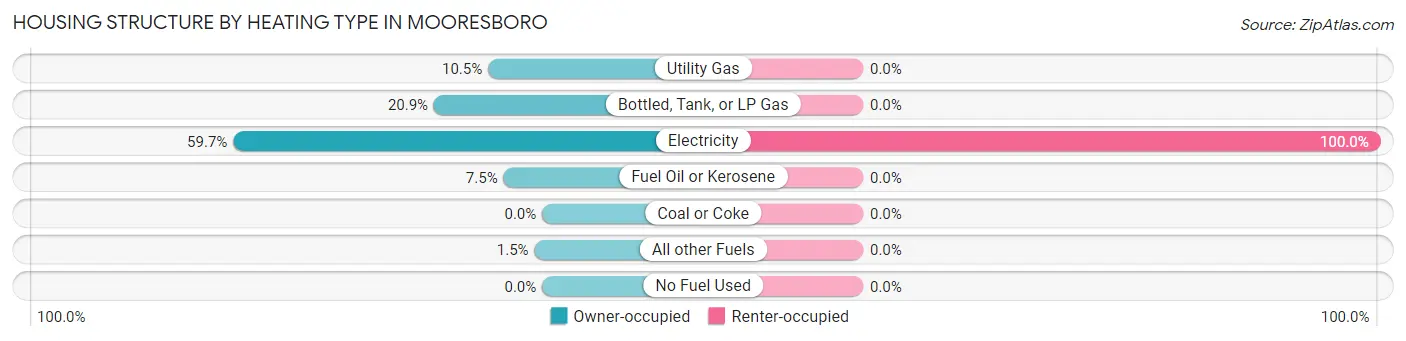
| Heating Type | Owner-occupied | Renter-occupied |
| Utility Gas | 7 (10.4%) | 0 (0.0%) |
| Bottled, Tank, or LP Gas | 14 (20.9%) | 0 (0.0%) |
| Electricity | 40 (59.7%) | 28 (100.0%) |
| Fuel Oil or Kerosene | 5 (7.5%) | 0 (0.0%) |
| Coal or Coke | 0 (0.0%) | 0 (0.0%) |
| All other Fuels | 1 (1.5%) | 0 (0.0%) |
| No Fuel Used | 0 (0.0%) | 0 (0.0%) |
| Total | 67 (100.0%) | 28 (100.0%) |
Household Vehicle Usage in Mooresboro
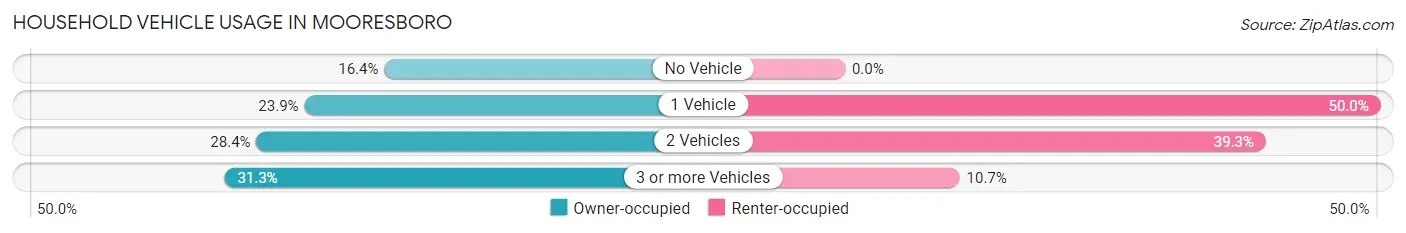
| Vehicles per Household | Owner-occupied | Renter-occupied |
| No Vehicle | 11 (16.4%) | 0 (0.0%) |
| 1 Vehicle | 16 (23.9%) | 14 (50.0%) |
| 2 Vehicles | 19 (28.4%) | 11 (39.3%) |
| 3 or more Vehicles | 21 (31.3%) | 3 (10.7%) |
| Total | 67 (100.0%) | 28 (100.0%) |
Real Estate & Mortgages in Mooresboro
Real Estate and Mortgage Overview in Mooresboro
| Characteristic | Without Mortgage | With Mortgage |
| Housing Units | 36 | 31 |
| Median Property Value | $57,100 | $151,600 |
| Median Household Income | - | - |
| Monthly Housing Costs | $283 | $0 |
| Real Estate Taxes | $564 | $3 |
Property Value by Mortgage Status in Mooresboro
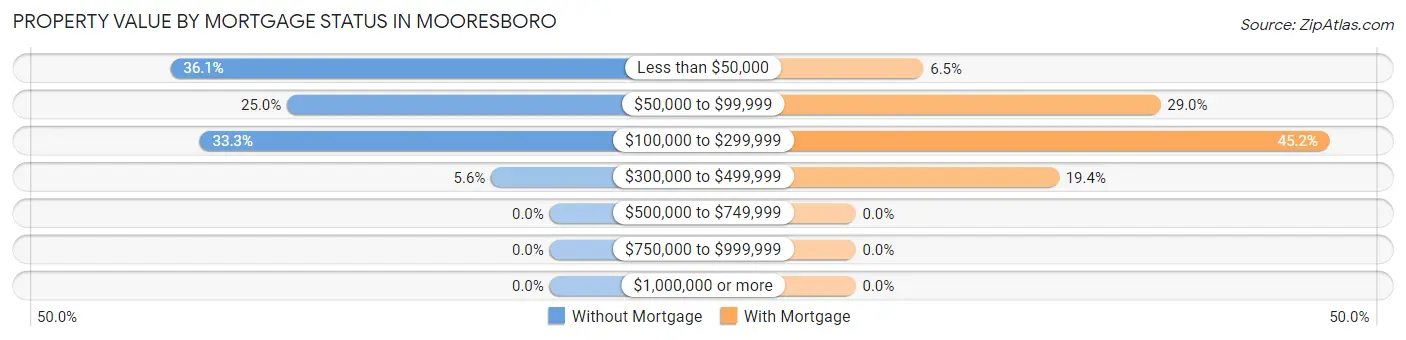
| Property Value | Without Mortgage | With Mortgage |
| Less than $50,000 | 13 (36.1%) | 2 (6.5%) |
| $50,000 to $99,999 | 9 (25.0%) | 9 (29.0%) |
| $100,000 to $299,999 | 12 (33.3%) | 14 (45.2%) |
| $300,000 to $499,999 | 2 (5.6%) | 6 (19.4%) |
| $500,000 to $749,999 | 0 (0.0%) | 0 (0.0%) |
| $750,000 to $999,999 | 0 (0.0%) | 0 (0.0%) |
| $1,000,000 or more | 0 (0.0%) | 0 (0.0%) |
| Total | 36 (100.0%) | 31 (100.0%) |
Household Income by Mortgage Status in Mooresboro
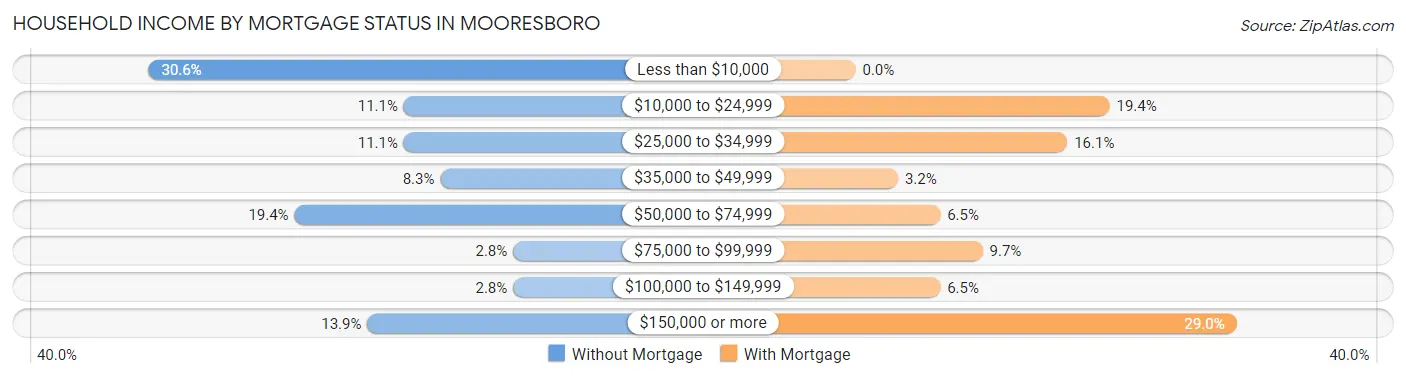
| Household Income | Without Mortgage | With Mortgage |
| Less than $10,000 | 11 (30.6%) | 0 (0.0%) |
| $10,000 to $24,999 | 4 (11.1%) | 6 (19.4%) |
| $25,000 to $34,999 | 4 (11.1%) | 5 (16.1%) |
| $35,000 to $49,999 | 3 (8.3%) | 1 (3.2%) |
| $50,000 to $74,999 | 7 (19.4%) | 2 (6.5%) |
| $75,000 to $99,999 | 1 (2.8%) | 3 (9.7%) |
| $100,000 to $149,999 | 1 (2.8%) | 2 (6.5%) |
| $150,000 or more | 5 (13.9%) | 9 (29.0%) |
| Total | 36 (100.0%) | 31 (100.0%) |
Property Value to Household Income Ratio in Mooresboro
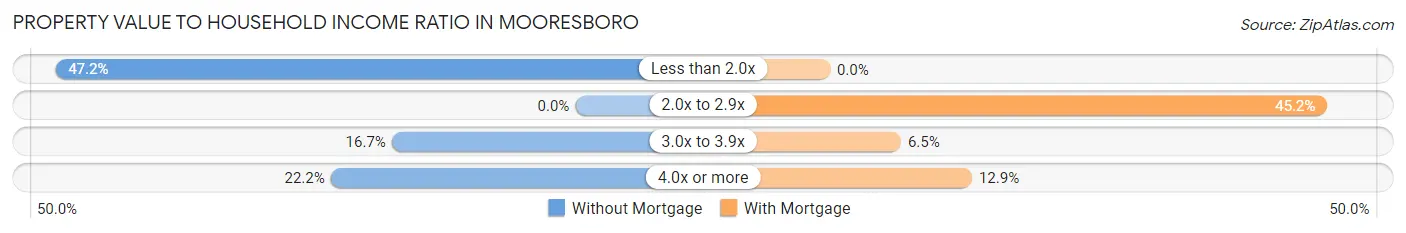
| Value-to-Income Ratio | Without Mortgage | With Mortgage |
| Less than 2.0x | 17 (47.2%) | 0 (0.0%) |
| 2.0x to 2.9x | 0 (0.0%) | 14 (45.2%) |
| 3.0x to 3.9x | 6 (16.7%) | 2 (6.5%) |
| 4.0x or more | 8 (22.2%) | 4 (12.9%) |
| Total | 36 (100.0%) | 31 (100.0%) |
Real Estate Taxes by Mortgage Status in Mooresboro
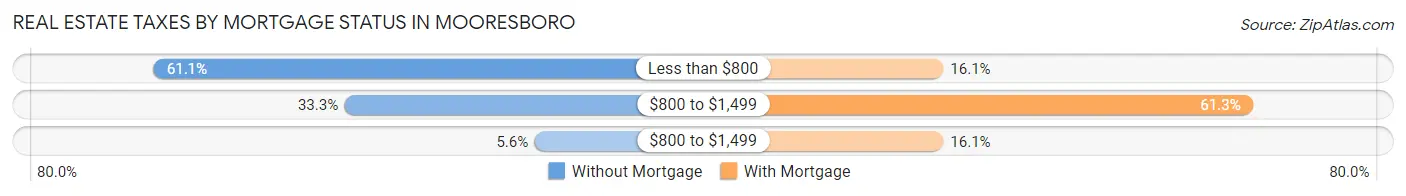
| Property Taxes | Without Mortgage | With Mortgage |
| Less than $800 | 22 (61.1%) | 5 (16.1%) |
| $800 to $1,499 | 12 (33.3%) | 19 (61.3%) |
| $800 to $1,499 | 2 (5.6%) | 5 (16.1%) |
| Total | 36 (100.0%) | 31 (100.0%) |
Health & Disability in Mooresboro
Health Insurance Coverage by Age in Mooresboro
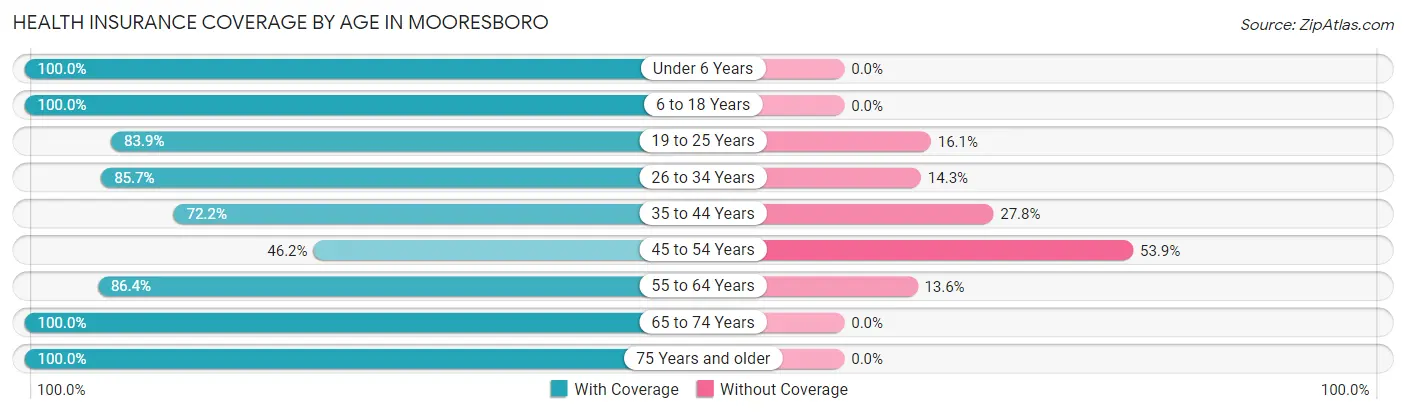
| Age Bracket | With Coverage | Without Coverage |
| Under 6 Years | 19 (100.0%) | 0 (0.0%) |
| 6 to 18 Years | 16 (100.0%) | 0 (0.0%) |
| 19 to 25 Years | 26 (83.9%) | 5 (16.1%) |
| 26 to 34 Years | 30 (85.7%) | 5 (14.3%) |
| 35 to 44 Years | 13 (72.2%) | 5 (27.8%) |
| 45 to 54 Years | 6 (46.2%) | 7 (53.8%) |
| 55 to 64 Years | 38 (86.4%) | 6 (13.6%) |
| 65 to 74 Years | 16 (100.0%) | 0 (0.0%) |
| 75 Years and older | 12 (100.0%) | 0 (0.0%) |
| Total | 176 (86.3%) | 28 (13.7%) |
Health Insurance Coverage by Citizenship Status in Mooresboro
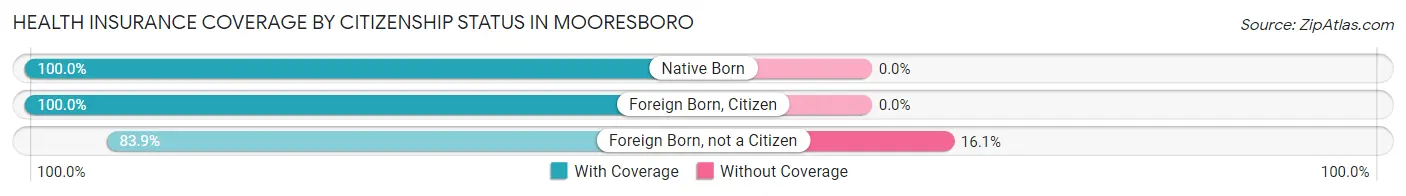
| Citizenship Status | With Coverage | Without Coverage |
| Native Born | 19 (100.0%) | 0 (0.0%) |
| Foreign Born, Citizen | 16 (100.0%) | 0 (0.0%) |
| Foreign Born, not a Citizen | 26 (83.9%) | 5 (16.1%) |
Health Insurance Coverage by Household Income in Mooresboro
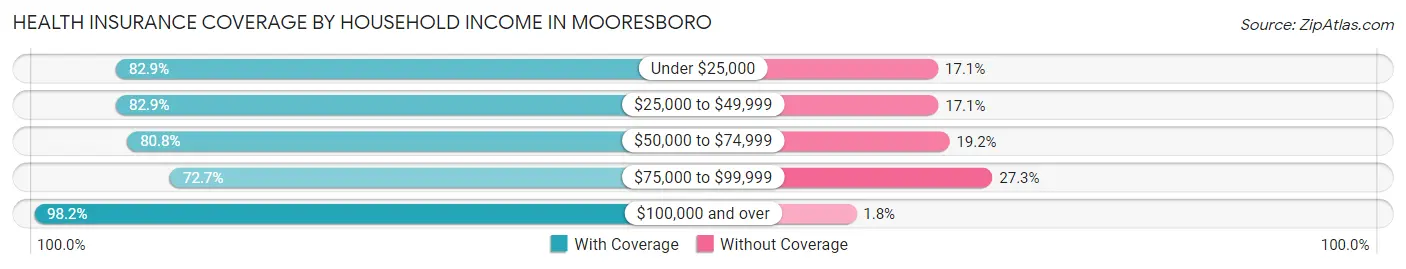
| Household Income | With Coverage | Without Coverage |
| Under $25,000 | 63 (82.9%) | 13 (17.1%) |
| $25,000 to $49,999 | 29 (82.9%) | 6 (17.1%) |
| $50,000 to $74,999 | 21 (80.8%) | 5 (19.2%) |
| $75,000 to $99,999 | 8 (72.7%) | 3 (27.3%) |
| $100,000 and over | 55 (98.2%) | 1 (1.8%) |
Public vs Private Health Insurance Coverage by Age in Mooresboro
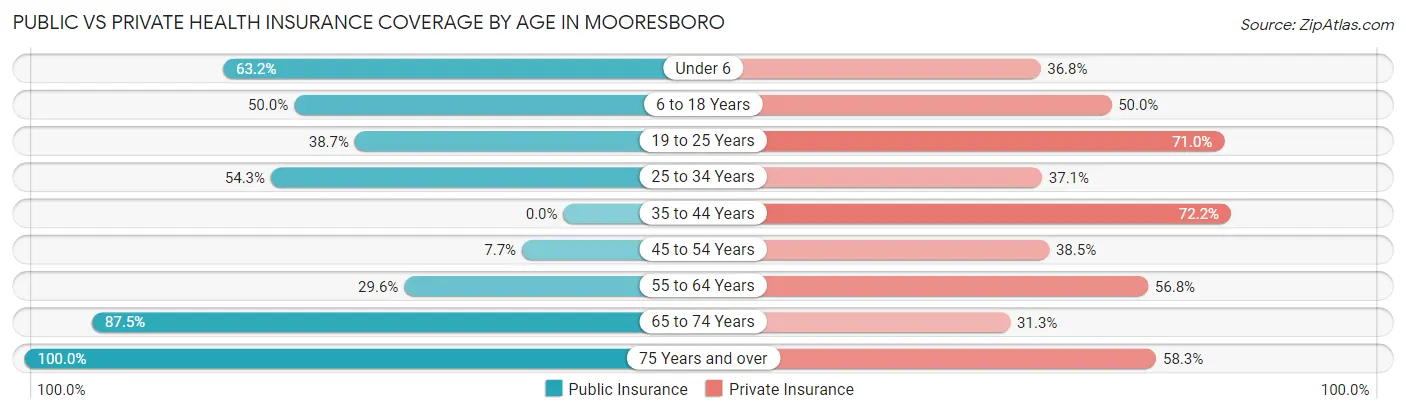
| Age Bracket | Public Insurance | Private Insurance |
| Under 6 | 12 (63.2%) | 7 (36.8%) |
| 6 to 18 Years | 8 (50.0%) | 8 (50.0%) |
| 19 to 25 Years | 12 (38.7%) | 22 (71.0%) |
| 25 to 34 Years | 19 (54.3%) | 13 (37.1%) |
| 35 to 44 Years | 0 (0.0%) | 13 (72.2%) |
| 45 to 54 Years | 1 (7.7%) | 5 (38.5%) |
| 55 to 64 Years | 13 (29.5%) | 25 (56.8%) |
| 65 to 74 Years | 14 (87.5%) | 5 (31.2%) |
| 75 Years and over | 12 (100.0%) | 7 (58.3%) |
| Total | 91 (44.6%) | 105 (51.5%) |
Disability Status by Sex by Age in Mooresboro
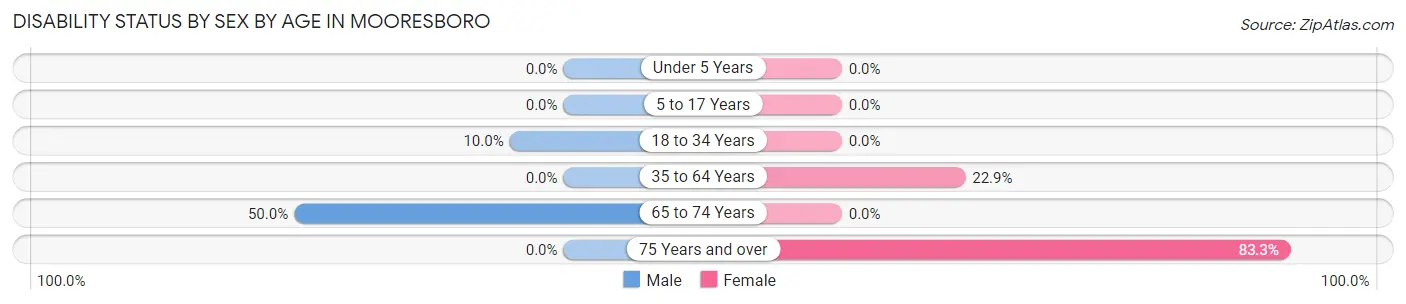
| Age Bracket | Male | Female |
| Under 5 Years | 0 (0.0%) | 0 (0.0%) |
| 5 to 17 Years | 0 (0.0%) | 0 (0.0%) |
| 18 to 34 Years | 3 (10.0%) | 0 (0.0%) |
| 35 to 64 Years | 0 (0.0%) | 11 (22.9%) |
| 65 to 74 Years | 4 (50.0%) | 0 (0.0%) |
| 75 Years and over | 0 (0.0%) | 5 (83.3%) |
Disability Class by Sex by Age in Mooresboro
Disability Class: Hearing Difficulty
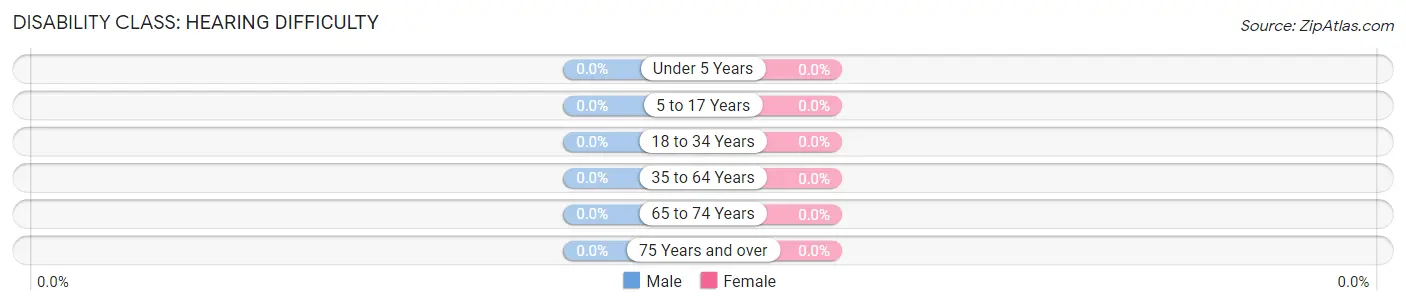
| Age Bracket | Male | Female |
| Under 5 Years | 0 (0.0%) | 0 (0.0%) |
| 5 to 17 Years | 0 (0.0%) | 0 (0.0%) |
| 18 to 34 Years | 0 (0.0%) | 0 (0.0%) |
| 35 to 64 Years | 0 (0.0%) | 0 (0.0%) |
| 65 to 74 Years | 0 (0.0%) | 0 (0.0%) |
| 75 Years and over | 0 (0.0%) | 0 (0.0%) |
Disability Class: Vision Difficulty
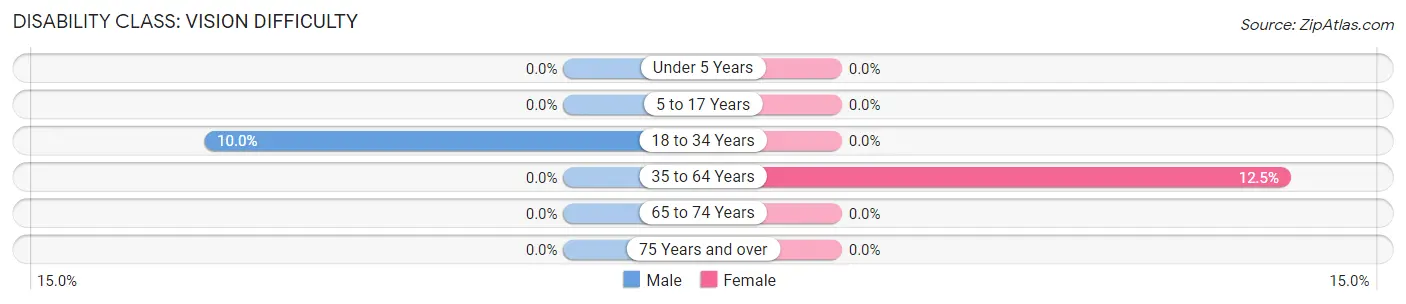
| Age Bracket | Male | Female |
| Under 5 Years | 0 (0.0%) | 0 (0.0%) |
| 5 to 17 Years | 0 (0.0%) | 0 (0.0%) |
| 18 to 34 Years | 3 (10.0%) | 0 (0.0%) |
| 35 to 64 Years | 0 (0.0%) | 6 (12.5%) |
| 65 to 74 Years | 0 (0.0%) | 0 (0.0%) |
| 75 Years and over | 0 (0.0%) | 0 (0.0%) |
Disability Class: Cognitive Difficulty
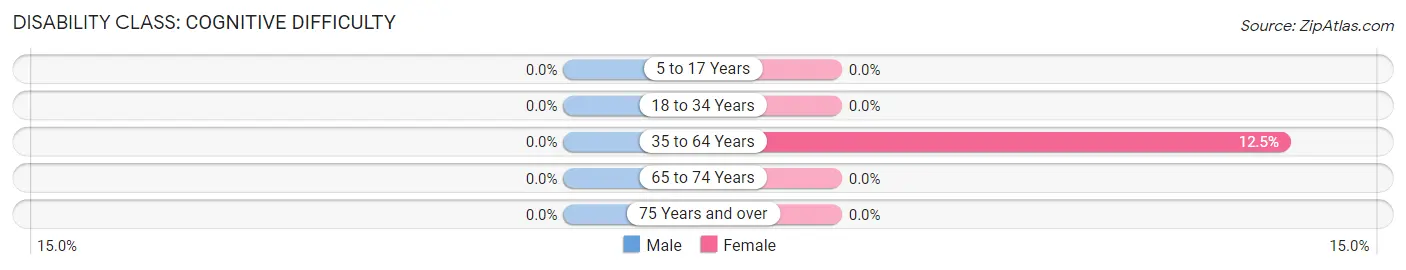
| Age Bracket | Male | Female |
| 5 to 17 Years | 0 (0.0%) | 0 (0.0%) |
| 18 to 34 Years | 0 (0.0%) | 0 (0.0%) |
| 35 to 64 Years | 0 (0.0%) | 6 (12.5%) |
| 65 to 74 Years | 0 (0.0%) | 0 (0.0%) |
| 75 Years and over | 0 (0.0%) | 0 (0.0%) |
Disability Class: Ambulatory Difficulty
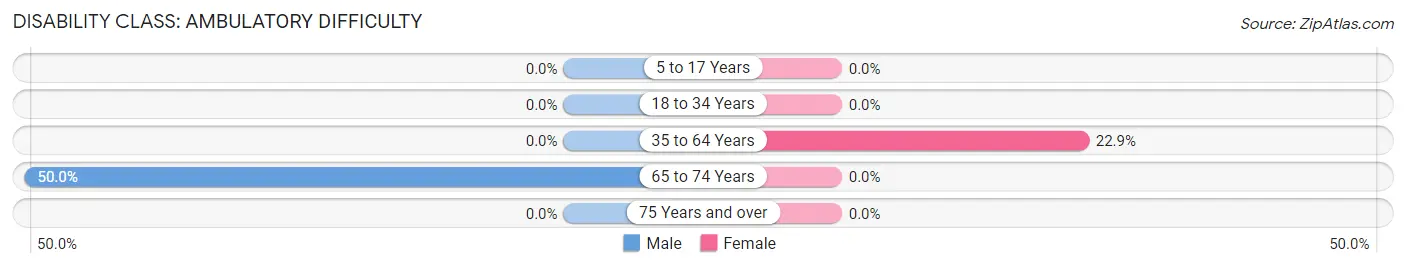
| Age Bracket | Male | Female |
| 5 to 17 Years | 0 (0.0%) | 0 (0.0%) |
| 18 to 34 Years | 0 (0.0%) | 0 (0.0%) |
| 35 to 64 Years | 0 (0.0%) | 11 (22.9%) |
| 65 to 74 Years | 4 (50.0%) | 0 (0.0%) |
| 75 Years and over | 0 (0.0%) | 0 (0.0%) |
Disability Class: Self-Care Difficulty
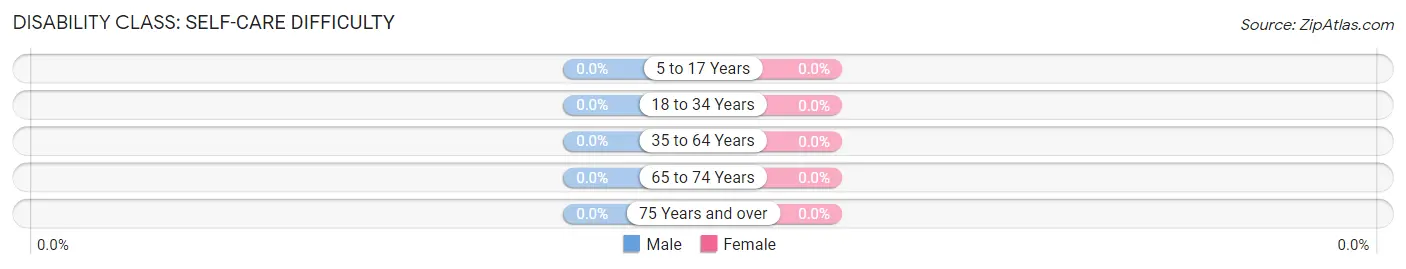
| Age Bracket | Male | Female |
| 5 to 17 Years | 0 (0.0%) | 0 (0.0%) |
| 18 to 34 Years | 0 (0.0%) | 0 (0.0%) |
| 35 to 64 Years | 0 (0.0%) | 0 (0.0%) |
| 65 to 74 Years | 0 (0.0%) | 0 (0.0%) |
| 75 Years and over | 0 (0.0%) | 0 (0.0%) |
Technology Access in Mooresboro
Computing Device Access in Mooresboro
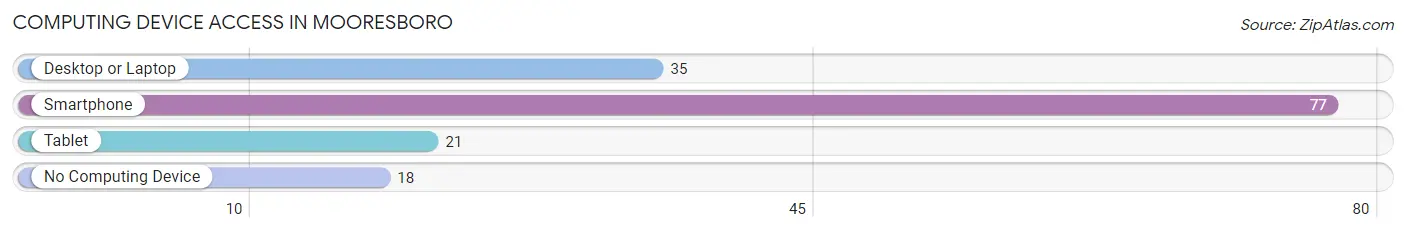
| Device Type | # Households | % Households |
| Desktop or Laptop | 35 | 36.8% |
| Smartphone | 77 | 81.0% |
| Tablet | 21 | 22.1% |
| No Computing Device | 18 | 19.0% |
| Total | 95 | 100.0% |
Internet Access in Mooresboro
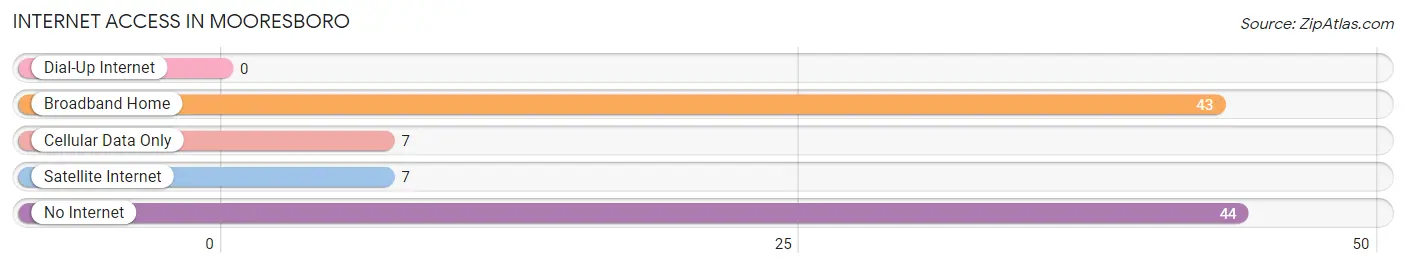
| Internet Type | # Households | % Households |
| Dial-Up Internet | 0 | 0.0% |
| Broadband Home | 43 | 45.3% |
| Cellular Data Only | 7 | 7.4% |
| Satellite Internet | 7 | 7.4% |
| No Internet | 44 | 46.3% |
| Total | 95 | 100.0% |
Mooresboro Summary
Mooresboro is a small town located in Cleveland County, North Carolina. It is situated in the foothills of the Blue Ridge Mountains, approximately 25 miles west of Charlotte. The town has a population of approximately 1,000 people and is part of the Shelby Metropolitan Statistical Area.
History
Mooresboro was founded in 1887 by William Moore, a local farmer. He named the town after himself and it was incorporated in 1889. The town was originally a farming community, but it soon developed into a small industrial center. The town was home to several cotton mills, a furniture factory, and a brickyard. The town also had a railroad station, which connected it to the larger cities of Charlotte and Shelby.
In the early 1900s, Mooresboro experienced a period of growth and prosperity. The town was home to several businesses, including a bank, a hotel, and a movie theater. The town also had a thriving school system, with several elementary and high schools.
In the 1950s, the town began to decline as the local economy shifted away from manufacturing and towards agriculture. The town’s population began to decline as well, and by the 1970s, the town had become a small, rural community.
Geography
Mooresboro is located in the foothills of the Blue Ridge Mountains in western North Carolina. The town is situated at the intersection of US Highway 74 and NC Highway 18. The town is approximately 25 miles west of Charlotte and is part of the Shelby Metropolitan Statistical Area.
The town is located in a hilly region, with elevations ranging from 800 to 1,000 feet above sea level. The town is surrounded by forests and is home to several creeks and streams. The town is also located near several lakes, including Lake Lure and Lake Wylie.
Economy
Mooresboro’s economy is largely based on agriculture. The town is home to several farms, which produce a variety of crops, including corn, soybeans, and tobacco. The town is also home to several small businesses, including a grocery store, a hardware store, and a restaurant.
The town is also home to several manufacturing companies, including a furniture factory and a brickyard. The town is also home to several small retail stores, including a gas station and a convenience store.
Demographics
As of the 2010 census, Mooresboro had a population of 1,000 people. The town is predominantly white, with approximately 95% of the population being white. The town is also home to a small African American population, with approximately 4% of the population being African American. The town is also home to a small Hispanic population, with approximately 1% of the population being Hispanic.
The median household income in Mooresboro is approximately $35,000, and the median home value is approximately $100,000. The town has a poverty rate of approximately 15%, which is slightly higher than the national average.
Conclusion
Mooresboro is a small town located in Cleveland County, North Carolina. The town has a population of approximately 1,000 people and is part of the Shelby Metropolitan Statistical Area. The town’s economy is largely based on agriculture, and it is home to several small businesses and manufacturing companies. The town is predominantly white, with a small African American and Hispanic population. The median household income in Mooresboro is approximately $35,000, and the median home value is approximately $100,000.
Common Questions
What is Per Capita Income in Mooresboro?
Per Capita income in Mooresboro is $24,702.
What is the Median Family Income in Mooresboro?
Median Family Income in Mooresboro is $47,083.
What is Family Income Deficit in Mooresboro?
Family Income Deficit in Mooresboro is $10,447.
Families that are below poverty line in Mooresboro earn $10,447 less on average than the poverty threshold level.
What is Inequality or Gini Index in Mooresboro?
Inequality or Gini Index in Mooresboro is 0.56.
What is the Total Population of Mooresboro?
Total Population of Mooresboro is 204.
What is the Total Male Population of Mooresboro?
Total Male Population of Mooresboro is 100.
What is the Total Female Population of Mooresboro?
Total Female Population of Mooresboro is 104.
What is the Ratio of Males per 100 Females in Mooresboro?
There are 96.15 Males per 100 Females in Mooresboro.
What is the Ratio of Females per 100 Males in Mooresboro?
There are 104.00 Females per 100 Males in Mooresboro.
What is the Median Population Age in Mooresboro?
Median Population Age in Mooresboro is 35.2 Years.
What is the Average Family Size in Mooresboro
Average Family Size in Mooresboro is 2.8 People.
What is the Average Household Size in Mooresboro
Average Household Size in Mooresboro is 2.1 People.
How Large is the Labor Force in Mooresboro?
There are 92 People in the Labor Forcein in Mooresboro.
What is the Percentage of People in the Labor Force in Mooresboro?
54.4% of People are in the Labor Force in Mooresboro.
What is the Unemployment Rate in Mooresboro?
Unemployment Rate in Mooresboro is 6.5%.