Kings Mountain, NC Map & Demographics
Kings Mountain Map
Kings Mountain Overview
$26,335
PER CAPITA INCOME
$59,531
AVG FAMILY INCOME
$45,301
AVG HOUSEHOLD INCOME
19.3%
WAGE / INCOME GAP [ % ]
80.7¢/ $1
WAGE / INCOME GAP [ $ ]
0.49
INEQUALITY / GINI INDEX
11,246
TOTAL POPULATION
5,279
MALE POPULATION
5,967
FEMALE POPULATION
88.47
MALES / 100 FEMALES
113.03
FEMALES / 100 MALES
41.5
MEDIAN AGE
3.4
AVG FAMILY SIZE
2.6
AVG HOUSEHOLD SIZE
5,398
LABOR FORCE [ PEOPLE ]
61.1%
PERCENT IN LABOR FORCE
6.8%
UNEMPLOYMENT RATE
Kings Mountain Zip Codes
Income in Kings Mountain
Income Overview in Kings Mountain
Per Capita Income in Kings Mountain is $26,335, while median incomes of families and households are $59,531 and $45,301 respectively.
| Characteristic | Number | Measure |
| Per Capita Income | 11,246 | $26,335 |
| Median Family Income | 2,608 | $59,531 |
| Mean Family Income | 2,608 | $78,489 |
| Median Household Income | 4,184 | $45,301 |
| Mean Household Income | 4,184 | $64,844 |
| Income Deficit | 2,608 | $0 |
| Wage / Income Gap (%) | 11,246 | 19.33% |
| Wage / Income Gap ($) | 11,246 | 80.67¢ per $1 |
| Gini / Inequality Index | 11,246 | 0.49 |
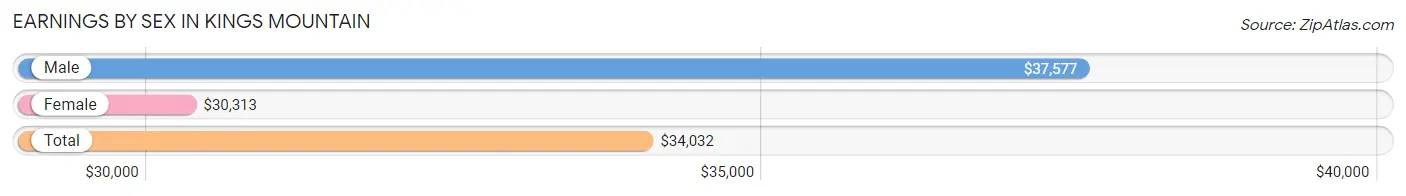
Earnings by Sex in Kings Mountain
Average Earnings in Kings Mountain are $34,032, $37,577 for men and $30,313 for women, a difference of 19.3%.
| Sex | Number | Average Earnings |
| Male | 2,870 (53.3%) | $37,577 |
| Female | 2,518 (46.7%) | $30,313 |
| Total | 5,388 (100.0%) | $34,032 |
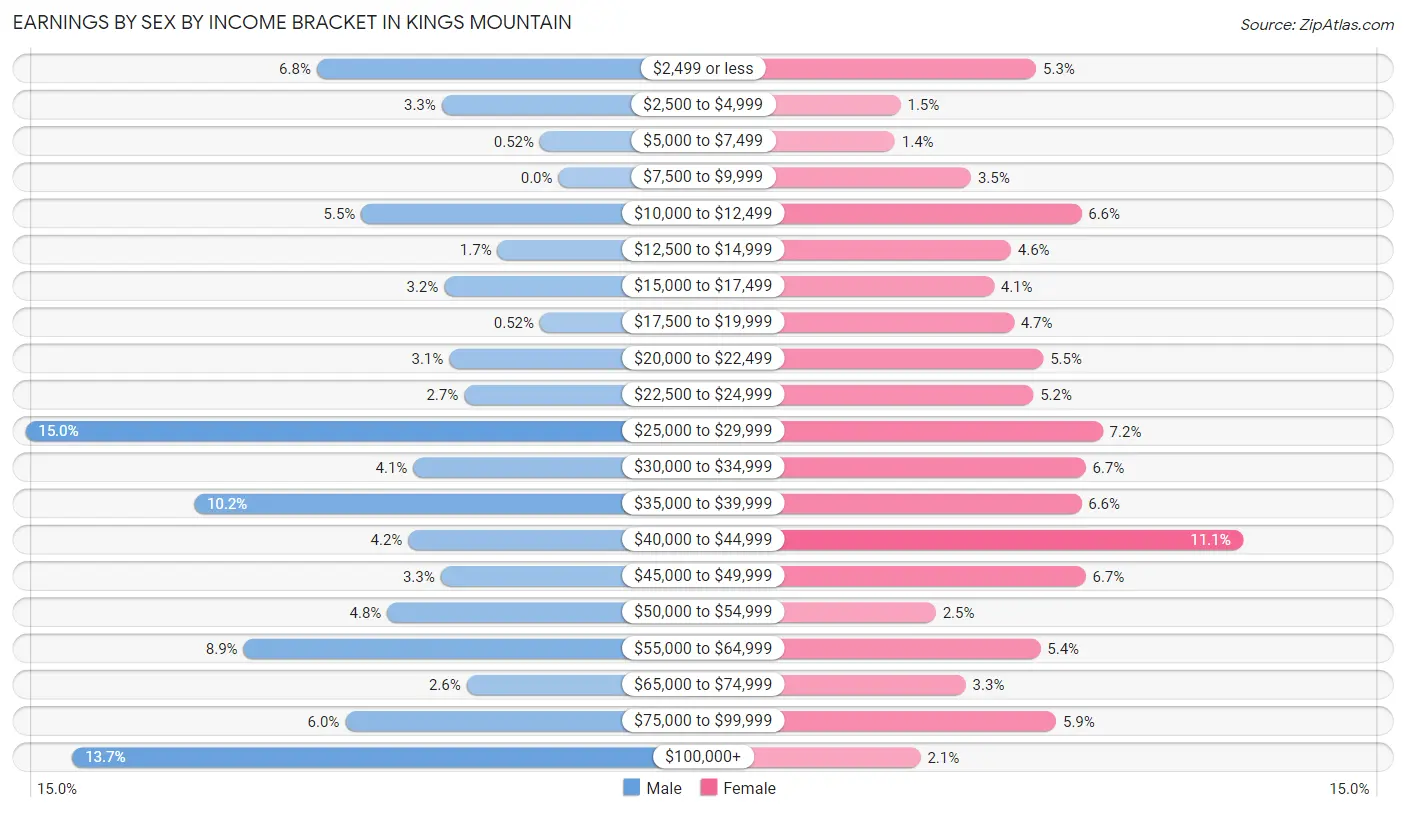
Earnings by Sex by Income Bracket in Kings Mountain
The most common earnings brackets in Kings Mountain are $25,000 to $29,999 for men (430 | 15.0%) and $40,000 to $44,999 for women (280 | 11.1%).
| Income | Male | Female |
| $2,499 or less | 195 (6.8%) | 134 (5.3%) |
| $2,500 to $4,999 | 94 (3.3%) | 38 (1.5%) |
| $5,000 to $7,499 | 15 (0.5%) | 34 (1.3%) |
| $7,500 to $9,999 | 0 (0.0%) | 88 (3.5%) |
| $10,000 to $12,499 | 159 (5.5%) | 166 (6.6%) |
| $12,500 to $14,999 | 49 (1.7%) | 116 (4.6%) |
| $15,000 to $17,499 | 92 (3.2%) | 104 (4.1%) |
| $17,500 to $19,999 | 15 (0.5%) | 118 (4.7%) |
| $20,000 to $22,499 | 88 (3.1%) | 139 (5.5%) |
| $22,500 to $24,999 | 76 (2.6%) | 132 (5.2%) |
| $25,000 to $29,999 | 430 (15.0%) | 181 (7.2%) |
| $30,000 to $34,999 | 117 (4.1%) | 169 (6.7%) |
| $35,000 to $39,999 | 294 (10.2%) | 166 (6.6%) |
| $40,000 to $44,999 | 121 (4.2%) | 280 (11.1%) |
| $45,000 to $49,999 | 95 (3.3%) | 169 (6.7%) |
| $50,000 to $54,999 | 138 (4.8%) | 63 (2.5%) |
| $55,000 to $64,999 | 254 (8.8%) | 137 (5.4%) |
| $65,000 to $74,999 | 74 (2.6%) | 84 (3.3%) |
| $75,000 to $99,999 | 172 (6.0%) | 148 (5.9%) |
| $100,000+ | 392 (13.7%) | 52 (2.1%) |
| Total | 2,870 (100.0%) | 2,518 (100.0%) |
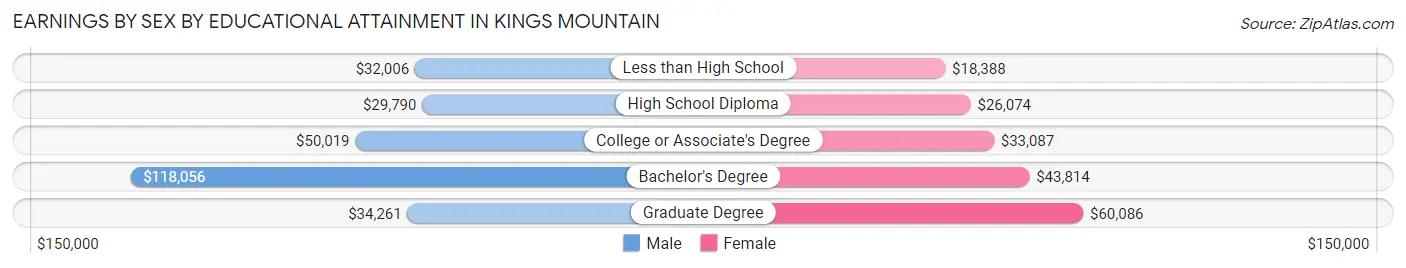
Earnings by Sex by Educational Attainment in Kings Mountain
Average earnings in Kings Mountain are $39,724 for men and $36,765 for women, a difference of 7.4%. Men with an educational attainment of bachelor's degree enjoy the highest average annual earnings of $118,056, while those with high school diploma education earn the least with $29,790. Women with an educational attainment of graduate degree earn the most with the average annual earnings of $60,086, while those with less than high school education have the smallest earnings of $18,388.
| Educational Attainment | Male Income | Female Income |
| Less than High School | $32,006 | $18,388 |
| High School Diploma | $29,790 | $26,074 |
| College or Associate's Degree | $50,019 | $33,087 |
| Bachelor's Degree | $118,056 | $43,814 |
| Graduate Degree | $34,261 | $60,086 |
| Total | $39,724 | $36,765 |
Family Income in Kings Mountain
Family Income Brackets in Kings Mountain
According to the Kings Mountain family income data, there are 464 families falling into the $35,000 to $49,999 income range, which is the most common income bracket and makes up 17.8% of all families. Conversely, the $10,000 to $14,999 income bracket is the least frequent group with only 63 families (2.4%) belonging to this category.
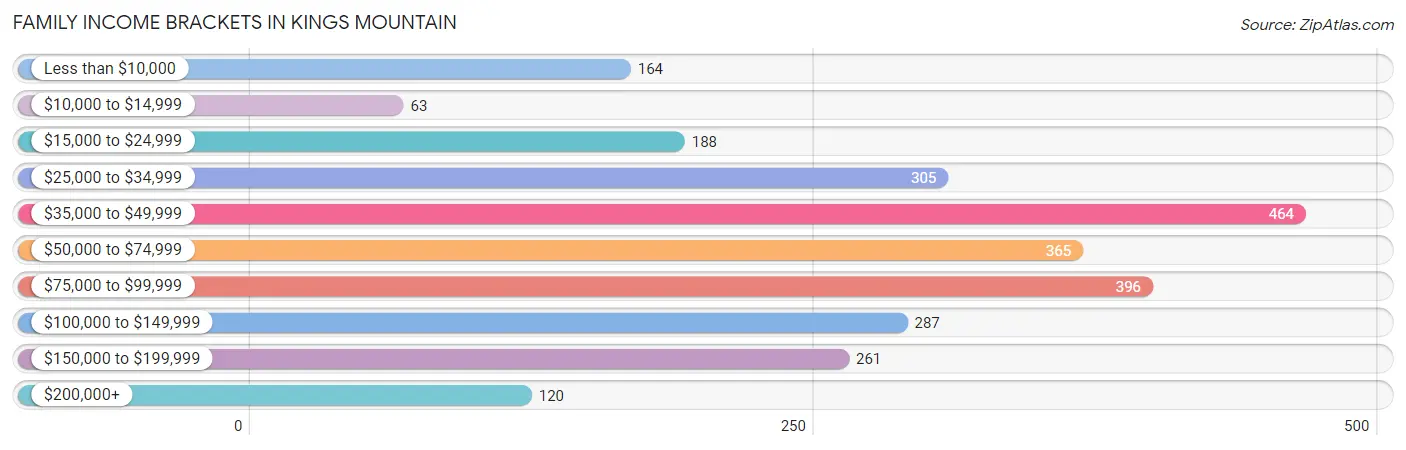
| Income Bracket | # Families | % Families |
| Less than $10,000 | 164 | 6.3% |
| $10,000 to $14,999 | 63 | 2.4% |
| $15,000 to $24,999 | 188 | 7.2% |
| $25,000 to $34,999 | 305 | 11.7% |
| $35,000 to $49,999 | 464 | 17.8% |
| $50,000 to $74,999 | 365 | 14.0% |
| $75,000 to $99,999 | 396 | 15.2% |
| $100,000 to $149,999 | 287 | 11.0% |
| $150,000 to $199,999 | 261 | 10.0% |
| $200,000+ | 120 | 4.6% |
Family Income by Famaliy Size in Kings Mountain
6-person families (25 | 1.0%) account for the highest median family income in Kings Mountain with $80,764 per family, while 2-person families (1,297 | 49.7%) have the highest median income of $32,442 per family member.
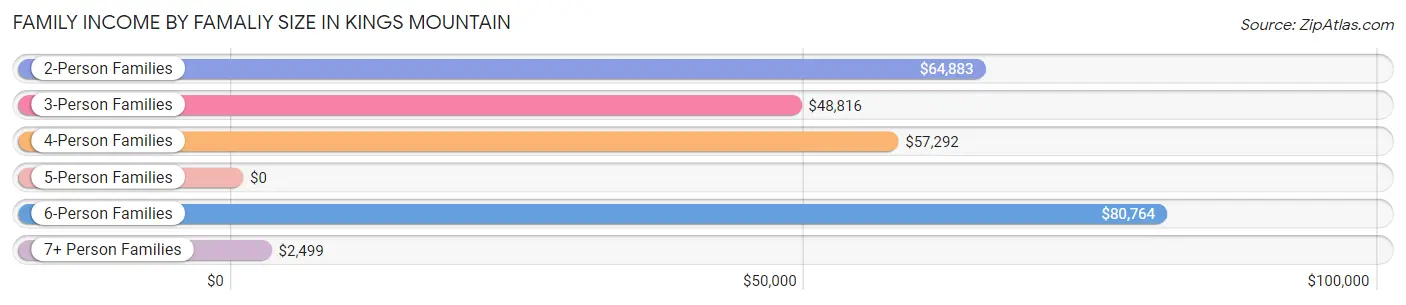
| Income Bracket | # Families | Median Income |
| 2-Person Families | 1,297 (49.7%) | $64,883 |
| 3-Person Families | 626 (24.0%) | $48,816 |
| 4-Person Families | 427 (16.4%) | $57,292 |
| 5-Person Families | 141 (5.4%) | $0 |
| 6-Person Families | 25 (1.0%) | $80,764 |
| 7+ Person Families | 92 (3.5%) | $2,499 |
| Total | 2,608 (100.0%) | $59,531 |
Family Income by Number of Earners in Kings Mountain
The median family income in Kings Mountain is $59,531, with families comprising 3+ earners (329) having the highest median family income of $151,287, while families with no earners (358) have the lowest median family income of $14,085, accounting for 12.6% and 13.7% of families, respectively.
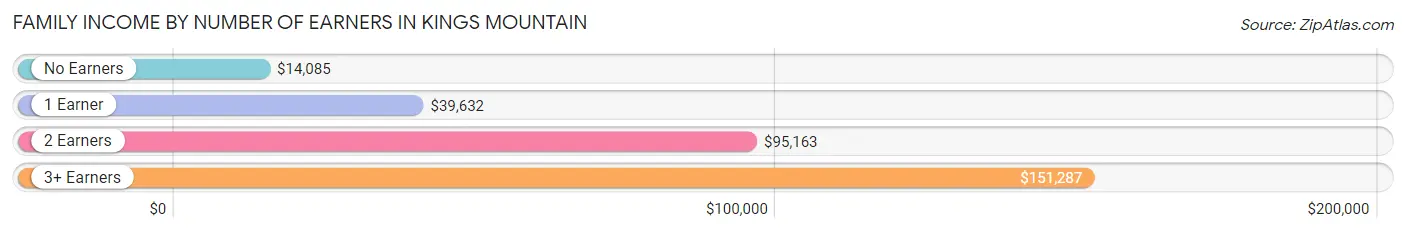
| Number of Earners | # Families | Median Income |
| No Earners | 358 (13.7%) | $14,085 |
| 1 Earner | 1,052 (40.3%) | $39,632 |
| 2 Earners | 869 (33.3%) | $95,163 |
| 3+ Earners | 329 (12.6%) | $151,287 |
| Total | 2,608 (100.0%) | $59,531 |
Household Income in Kings Mountain
Household Income Brackets in Kings Mountain
With 640 households falling in the category, the $35,000 to $49,999 income range is the most frequent in Kings Mountain, accounting for 15.3% of all households. In contrast, only 130 households (3.1%) fall into the $200,000+ income bracket, making it the least populous group.
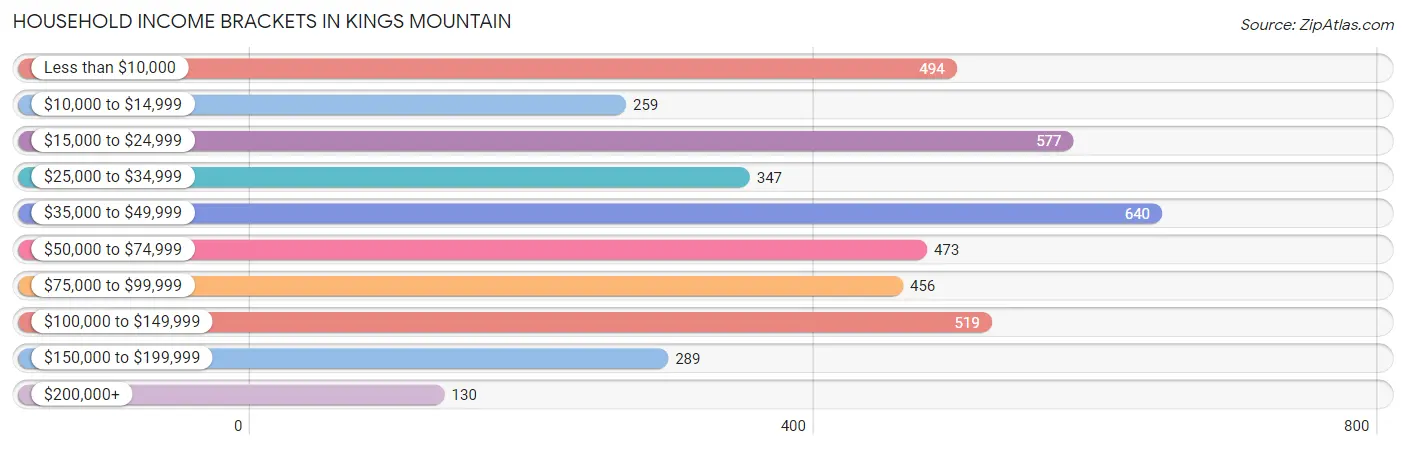
| Income Bracket | # Households | % Households |
| Less than $10,000 | 494 | 11.8% |
| $10,000 to $14,999 | 259 | 6.2% |
| $15,000 to $24,999 | 577 | 13.8% |
| $25,000 to $34,999 | 347 | 8.3% |
| $35,000 to $49,999 | 640 | 15.3% |
| $50,000 to $74,999 | 473 | 11.3% |
| $75,000 to $99,999 | 456 | 10.9% |
| $100,000 to $149,999 | 519 | 12.4% |
| $150,000 to $199,999 | 289 | 6.9% |
| $200,000+ | 130 | 3.1% |
Household Income by Householder Age in Kings Mountain
The median household income in Kings Mountain is $45,301, with the highest median household income of $58,409 found in the 45 to 64 years age bracket for the primary householder. A total of 1,802 households (43.1%) fall into this category. Meanwhile, the 15 to 24 years age bracket for the primary householder has the lowest median household income of $0, with 26 households (0.6%) in this group.
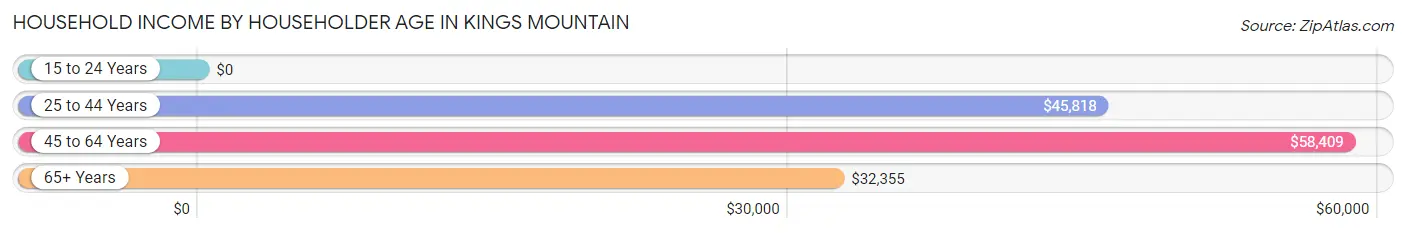
| Income Bracket | # Households | Median Income |
| 15 to 24 Years | 26 (0.6%) | $0 |
| 25 to 44 Years | 1,249 (29.8%) | $45,818 |
| 45 to 64 Years | 1,802 (43.1%) | $58,409 |
| 65+ Years | 1,107 (26.5%) | $32,355 |
| Total | 4,184 (100.0%) | $45,301 |
Poverty in Kings Mountain
Income Below Poverty by Sex and Age in Kings Mountain
With 24.0% poverty level for males and 28.0% for females among the residents of Kings Mountain, under 5 year old males and 15 year old females are the most vulnerable to poverty, with 233 males (66.6%) and 15 females (71.4%) in their respective age groups living below the poverty level.
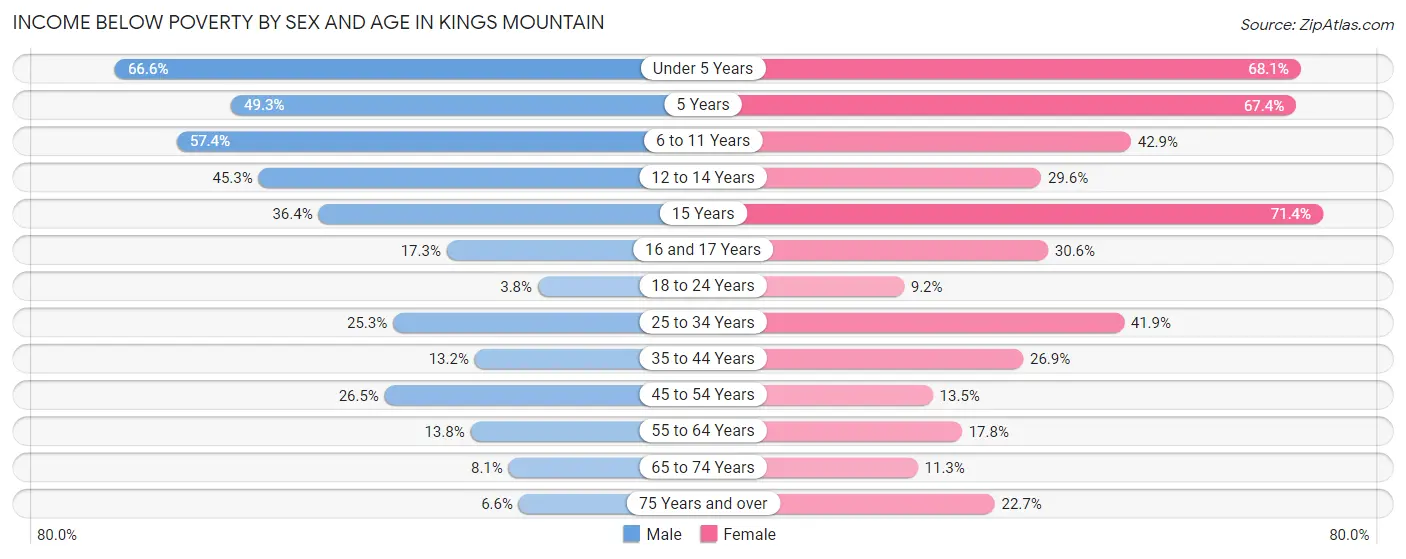
| Age Bracket | Male | Female |
| Under 5 Years | 233 (66.6%) | 280 (68.1%) |
| 5 Years | 36 (49.3%) | 29 (67.4%) |
| 6 to 11 Years | 268 (57.4%) | 251 (42.9%) |
| 12 to 14 Years | 62 (45.3%) | 63 (29.6%) |
| 15 Years | 12 (36.4%) | 15 (71.4%) |
| 16 and 17 Years | 22 (17.3%) | 56 (30.6%) |
| 18 to 24 Years | 14 (3.8%) | 30 (9.2%) |
| 25 to 34 Years | 195 (25.3%) | 296 (41.9%) |
| 35 to 44 Years | 77 (13.2%) | 169 (26.9%) |
| 45 to 54 Years | 130 (26.5%) | 104 (13.5%) |
| 55 to 64 Years | 131 (13.8%) | 151 (17.8%) |
| 65 to 74 Years | 43 (8.1%) | 58 (11.3%) |
| 75 Years and over | 19 (6.6%) | 137 (22.7%) |
| Total | 1,242 (24.0%) | 1,639 (28.0%) |
Income Above Poverty by Sex and Age in Kings Mountain
According to the poverty statistics in Kings Mountain, males aged 18 to 24 years and females aged 18 to 24 years are the age groups that are most secure financially, with 96.2% of males and 90.8% of females in these age groups living above the poverty line.
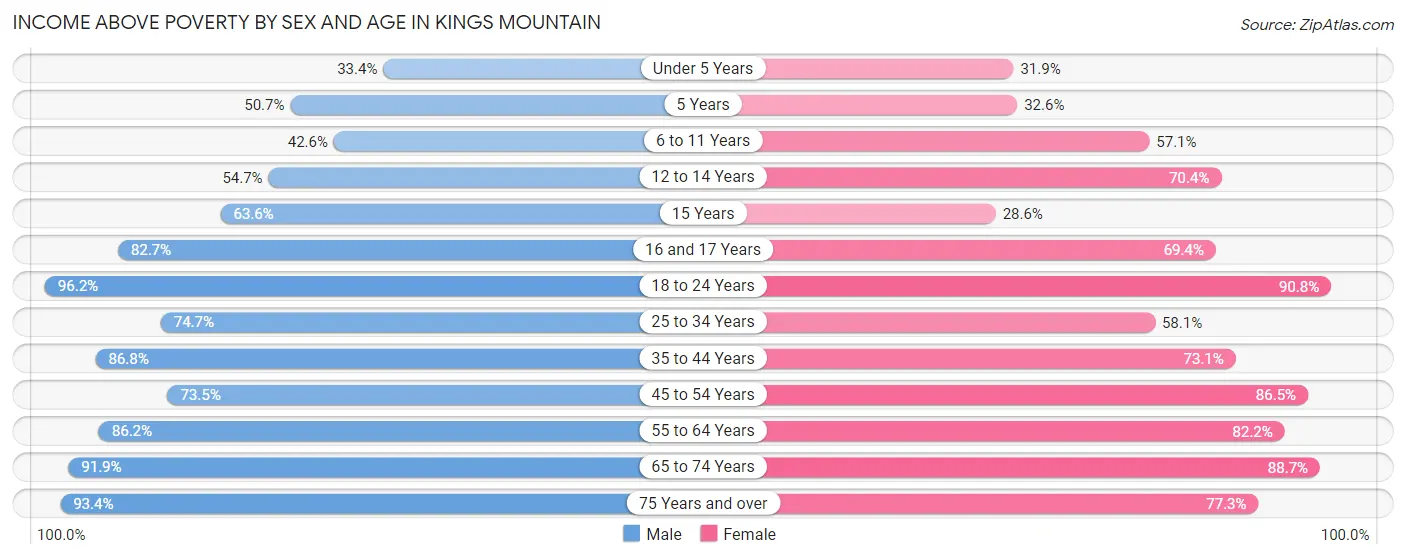
| Age Bracket | Male | Female |
| Under 5 Years | 117 (33.4%) | 131 (31.9%) |
| 5 Years | 37 (50.7%) | 14 (32.6%) |
| 6 to 11 Years | 199 (42.6%) | 334 (57.1%) |
| 12 to 14 Years | 75 (54.7%) | 150 (70.4%) |
| 15 Years | 21 (63.6%) | 6 (28.6%) |
| 16 and 17 Years | 105 (82.7%) | 127 (69.4%) |
| 18 to 24 Years | 356 (96.2%) | 296 (90.8%) |
| 25 to 34 Years | 576 (74.7%) | 411 (58.1%) |
| 35 to 44 Years | 508 (86.8%) | 459 (73.1%) |
| 45 to 54 Years | 360 (73.5%) | 667 (86.5%) |
| 55 to 64 Years | 819 (86.2%) | 697 (82.2%) |
| 65 to 74 Years | 486 (91.9%) | 457 (88.7%) |
| 75 Years and over | 268 (93.4%) | 467 (77.3%) |
| Total | 3,927 (76.0%) | 4,216 (72.0%) |
Income Below Poverty Among Married-Couple Families in Kings Mountain
The poverty statistics for married-couple families in Kings Mountain show that 6.0% or 77 of the total 1,281 families live below the poverty line. Families with 3 or 4 children have the highest poverty rate of 18.6%, comprising of 22 families. On the other hand, families with no children have the lowest poverty rate of 3.9%, which includes 37 families.
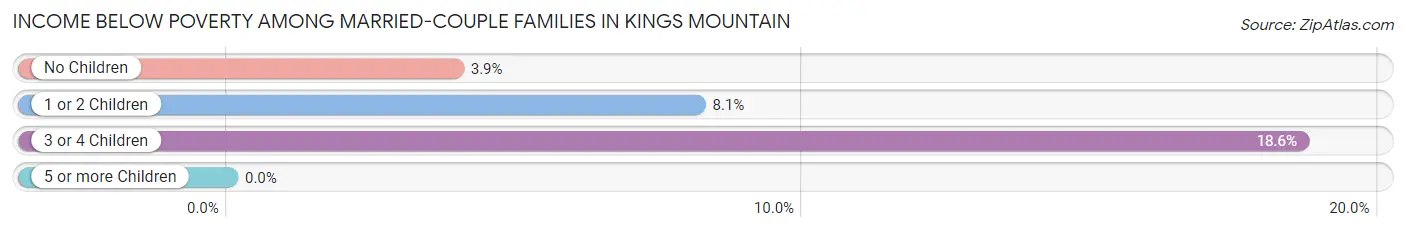
| Children | Above Poverty | Below Poverty |
| No Children | 905 (96.1%) | 37 (3.9%) |
| 1 or 2 Children | 203 (91.9%) | 18 (8.1%) |
| 3 or 4 Children | 96 (81.4%) | 22 (18.6%) |
| 5 or more Children | 0 (0.0%) | 0 (0.0%) |
| Total | 1,204 (94.0%) | 77 (6.0%) |
Income Below Poverty Among Single-Parent Households in Kings Mountain
According to the poverty data in Kings Mountain, 15.5% or 69 single-father households and 37.9% or 334 single-mother households are living below the poverty line. Among single-father households, those with 3 or 4 children have the highest poverty rate, with 69 households (51.9%) experiencing poverty. Likewise, among single-mother households, those with 5 or more children have the highest poverty rate, with 48 households (100.0%) falling below the poverty line.
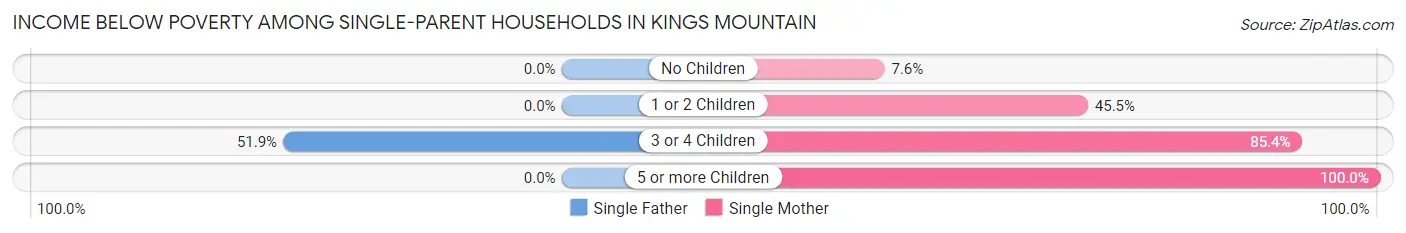
| Children | Single Father | Single Mother |
| No Children | 0 (0.0%) | 27 (7.6%) |
| 1 or 2 Children | 0 (0.0%) | 171 (45.5%) |
| 3 or 4 Children | 69 (51.9%) | 88 (85.4%) |
| 5 or more Children | 0 (0.0%) | 48 (100.0%) |
| Total | 69 (15.5%) | 334 (37.9%) |
Income Below Poverty Among Married-Couple vs Single-Parent Households in Kings Mountain
The poverty data for Kings Mountain shows that 77 of the married-couple family households (6.0%) and 403 of the single-parent households (30.4%) are living below the poverty level. Within the married-couple family households, those with 3 or 4 children have the highest poverty rate, with 22 households (18.6%) falling below the poverty line. Among the single-parent households, those with 5 or more children have the highest poverty rate, with 48 household (100.0%) living below poverty.
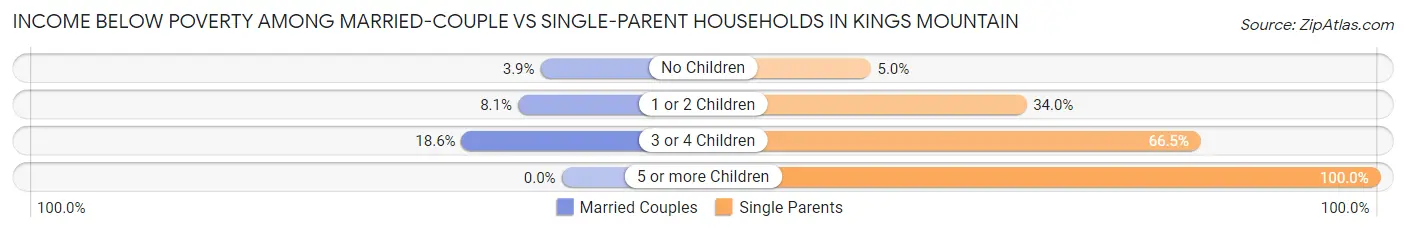
| Children | Married-Couple Families | Single-Parent Households |
| No Children | 37 (3.9%) | 27 (5.0%) |
| 1 or 2 Children | 18 (8.1%) | 171 (34.0%) |
| 3 or 4 Children | 22 (18.6%) | 157 (66.5%) |
| 5 or more Children | 0 (0.0%) | 48 (100.0%) |
| Total | 77 (6.0%) | 403 (30.4%) |
Race in Kings Mountain
The most populous races in Kings Mountain are White / Caucasian (7,661 | 68.1%), Black / African American (2,907 | 25.9%), and Two or more Races (317 | 2.8%).
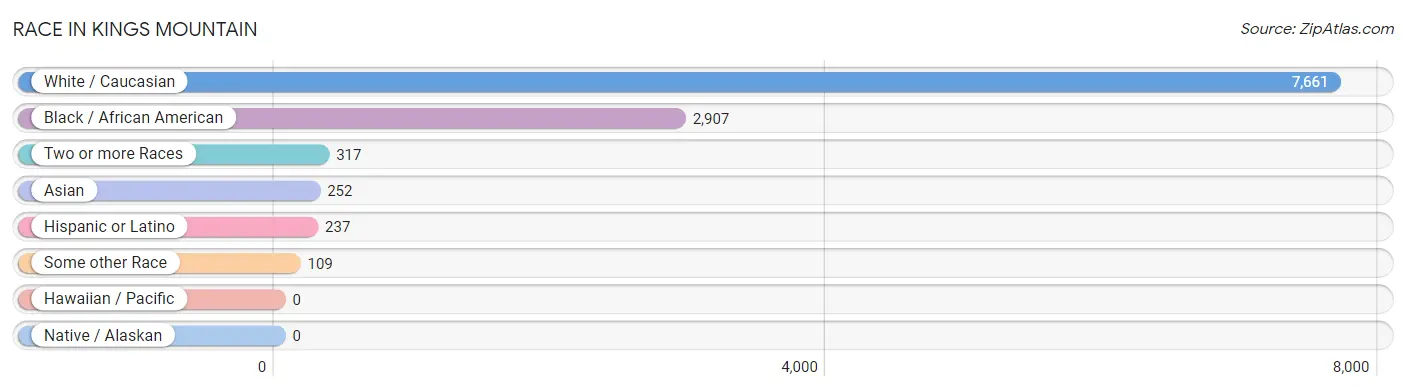
| Race | # Population | % Population |
| Asian | 252 | 2.2% |
| Black / African American | 2,907 | 25.9% |
| Hawaiian / Pacific | 0 | 0.0% |
| Hispanic or Latino | 237 | 2.1% |
| Native / Alaskan | 0 | 0.0% |
| White / Caucasian | 7,661 | 68.1% |
| Two or more Races | 317 | 2.8% |
| Some other Race | 109 | 1.0% |
| Total | 11,246 | 100.0% |
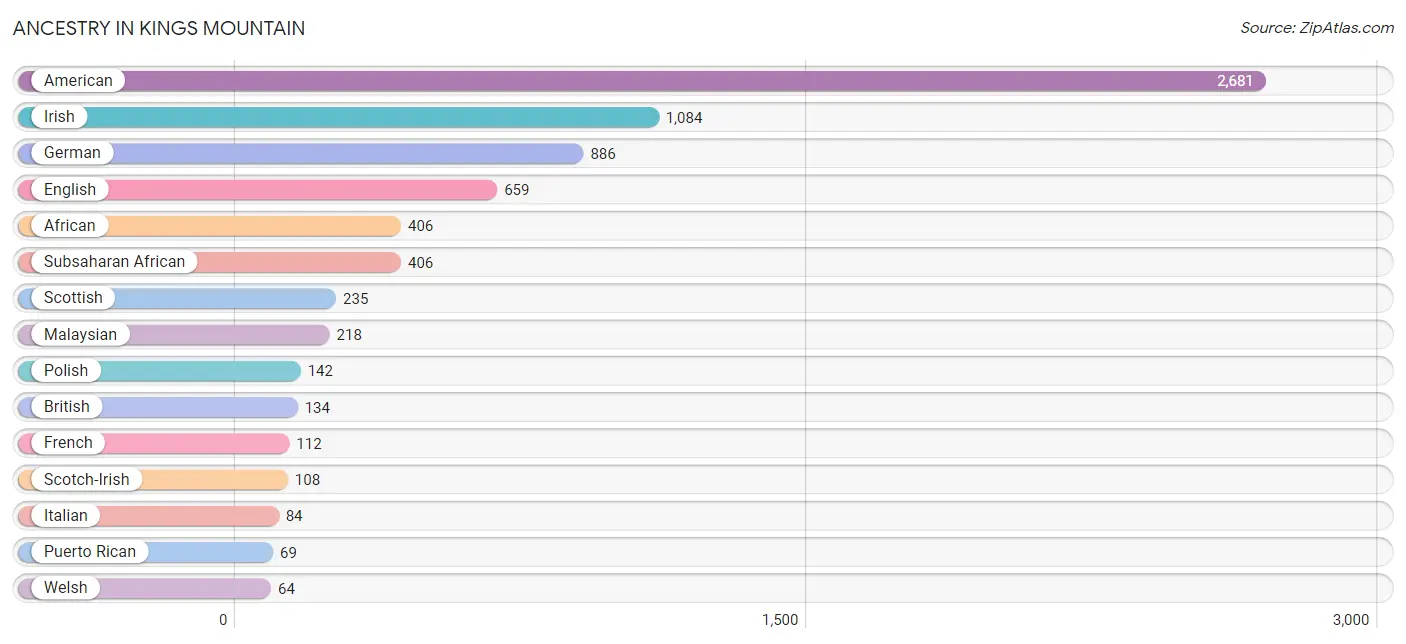
Ancestry in Kings Mountain
The most populous ancestries reported in Kings Mountain are American (2,681 | 23.8%), Irish (1,084 | 9.6%), German (886 | 7.9%), English (659 | 5.9%), and African (406 | 3.6%), together accounting for 50.8% of all Kings Mountain residents.
| Ancestry | # Population | % Population |
| African | 406 | 3.6% |
| American | 2,681 | 23.8% |
| Austrian | 17 | 0.2% |
| Bhutanese | 5 | 0.0% |
| British | 134 | 1.2% |
| Colombian | 56 | 0.5% |
| Cuban | 45 | 0.4% |
| Czech | 10 | 0.1% |
| Dutch | 13 | 0.1% |
| English | 659 | 5.9% |
| European | 35 | 0.3% |
| French | 112 | 1.0% |
| French Canadian | 10 | 0.1% |
| German | 886 | 7.9% |
| Hungarian | 5 | 0.0% |
| Irish | 1,084 | 9.6% |
| Italian | 84 | 0.7% |
| Malaysian | 218 | 1.9% |
| Mexican | 46 | 0.4% |
| Polish | 142 | 1.3% |
| Puerto Rican | 69 | 0.6% |
| Romanian | 2 | 0.0% |
| Scotch-Irish | 108 | 1.0% |
| Scottish | 235 | 2.1% |
| South American | 56 | 0.5% |
| Subsaharan African | 406 | 3.6% |
| Swedish | 16 | 0.1% |
| Thai | 34 | 0.3% |
| Welsh | 64 | 0.6% | View All 29 Rows |
Immigrants in Kings Mountain
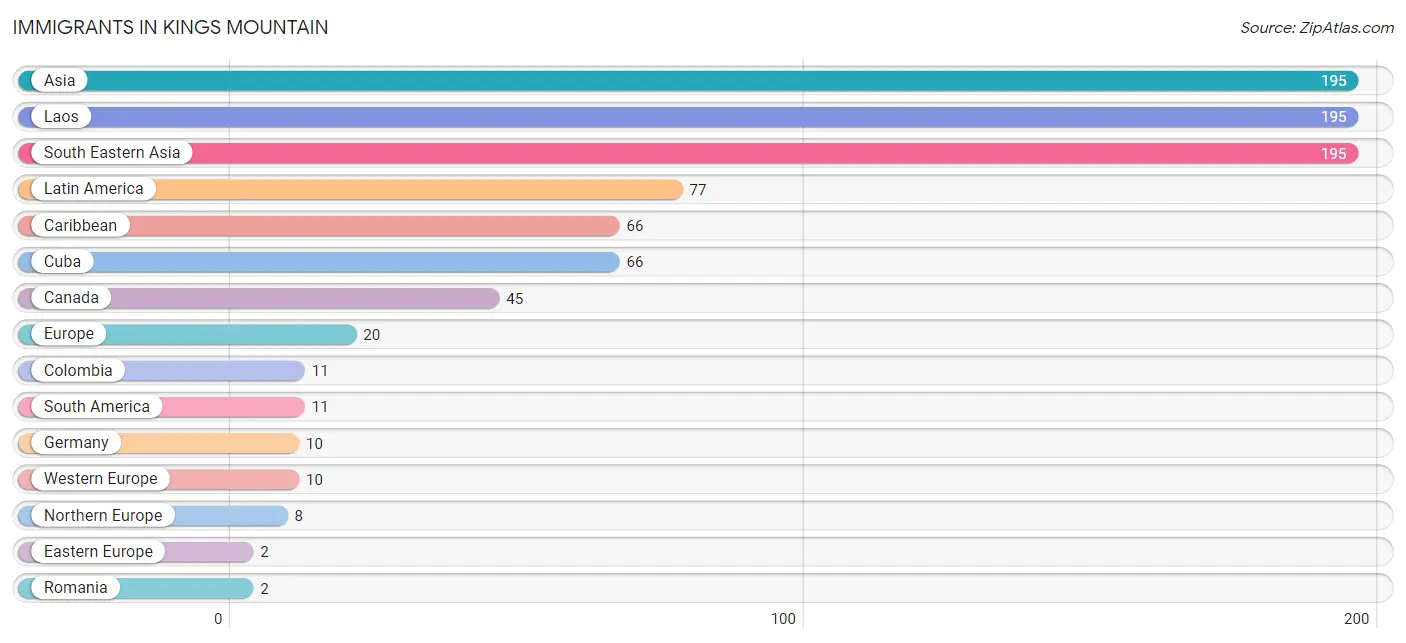
The most numerous immigrant groups reported in Kings Mountain came from Asia (195 | 1.7%), Laos (195 | 1.7%), South Eastern Asia (195 | 1.7%), Latin America (77 | 0.7%), and Caribbean (66 | 0.6%), together accounting for 6.5% of all Kings Mountain residents.
| Immigration Origin | # Population | % Population |
| Asia | 195 | 1.7% |
| Canada | 45 | 0.4% |
| Caribbean | 66 | 0.6% |
| Colombia | 11 | 0.1% |
| Cuba | 66 | 0.6% |
| Eastern Europe | 2 | 0.0% |
| Europe | 20 | 0.2% |
| Germany | 10 | 0.1% |
| Laos | 195 | 1.7% |
| Latin America | 77 | 0.7% |
| Northern Europe | 8 | 0.1% |
| Romania | 2 | 0.0% |
| South America | 11 | 0.1% |
| South Eastern Asia | 195 | 1.7% |
| Western Europe | 10 | 0.1% | View All 15 Rows |
Sex and Age in Kings Mountain
Sex and Age in Kings Mountain
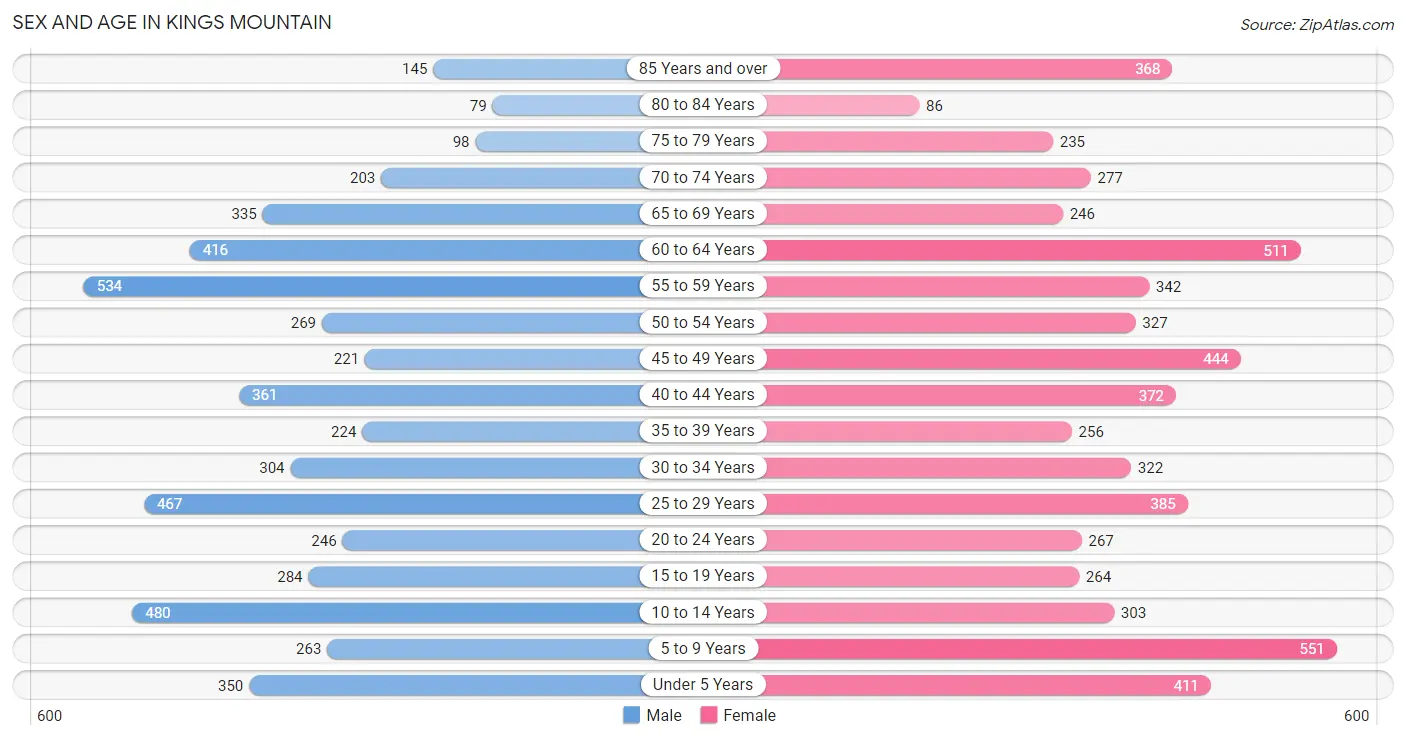
The most populous age groups in Kings Mountain are 55 to 59 Years (534 | 10.1%) for men and 5 to 9 Years (551 | 9.2%) for women.
| Age Bracket | Male | Female |
| Under 5 Years | 350 (6.6%) | 411 (6.9%) |
| 5 to 9 Years | 263 (5.0%) | 551 (9.2%) |
| 10 to 14 Years | 480 (9.1%) | 303 (5.1%) |
| 15 to 19 Years | 284 (5.4%) | 264 (4.4%) |
| 20 to 24 Years | 246 (4.7%) | 267 (4.5%) |
| 25 to 29 Years | 467 (8.8%) | 385 (6.5%) |
| 30 to 34 Years | 304 (5.8%) | 322 (5.4%) |
| 35 to 39 Years | 224 (4.2%) | 256 (4.3%) |
| 40 to 44 Years | 361 (6.8%) | 372 (6.2%) |
| 45 to 49 Years | 221 (4.2%) | 444 (7.4%) |
| 50 to 54 Years | 269 (5.1%) | 327 (5.5%) |
| 55 to 59 Years | 534 (10.1%) | 342 (5.7%) |
| 60 to 64 Years | 416 (7.9%) | 511 (8.6%) |
| 65 to 69 Years | 335 (6.4%) | 246 (4.1%) |
| 70 to 74 Years | 203 (3.8%) | 277 (4.6%) |
| 75 to 79 Years | 98 (1.9%) | 235 (3.9%) |
| 80 to 84 Years | 79 (1.5%) | 86 (1.4%) |
| 85 Years and over | 145 (2.8%) | 368 (6.2%) |
| Total | 5,279 (100.0%) | 5,967 (100.0%) |
Families and Households in Kings Mountain
Median Family Size in Kings Mountain
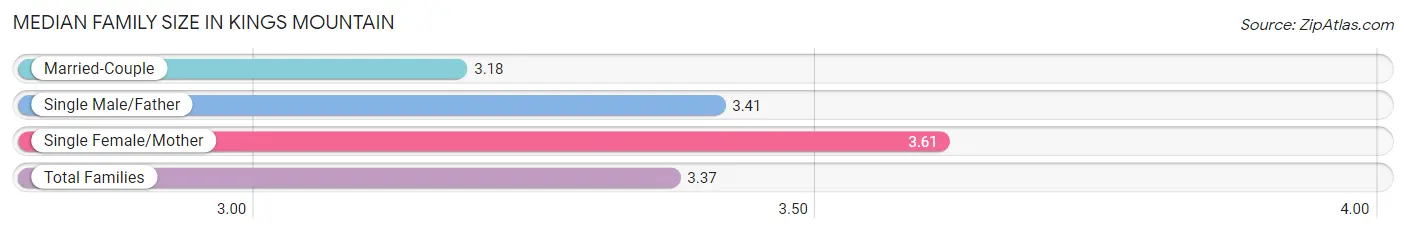
The median family size in Kings Mountain is 3.37 persons per family, with single female/mother families (882 | 33.8%) accounting for the largest median family size of 3.61 persons per family. On the other hand, married-couple families (1,281 | 49.1%) represent the smallest median family size with 3.18 persons per family.
| Family Type | # Families | Family Size |
| Married-Couple | 1,281 (49.1%) | 3.18 |
| Single Male/Father | 445 (17.1%) | 3.41 |
| Single Female/Mother | 882 (33.8%) | 3.61 |
| Total Families | 2,608 (100.0%) | 3.37 |
Median Household Size in Kings Mountain
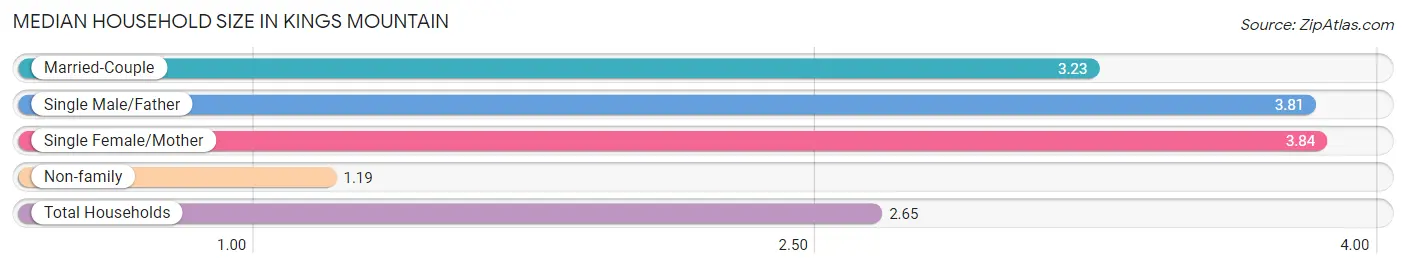
The median household size in Kings Mountain is 2.65 persons per household, with single female/mother households (882 | 21.1%) accounting for the largest median household size of 3.84 persons per household. non-family households (1,576 | 37.7%) represent the smallest median household size with 1.19 persons per household.
| Household Type | # Households | Household Size |
| Married-Couple | 1,281 (30.6%) | 3.23 |
| Single Male/Father | 445 (10.6%) | 3.81 |
| Single Female/Mother | 882 (21.1%) | 3.84 |
| Non-family | 1,576 (37.7%) | 1.19 |
| Total Households | 4,184 (100.0%) | 2.65 |
Household Size by Marriage Status in Kings Mountain
Out of a total of 4,184 households in Kings Mountain, 2,608 (62.3%) are family households, while 1,576 (37.7%) are nonfamily households. The most numerous type of family households are 2-person households, comprising 1,189, and the most common type of nonfamily households are 1-person households, comprising 1,327.
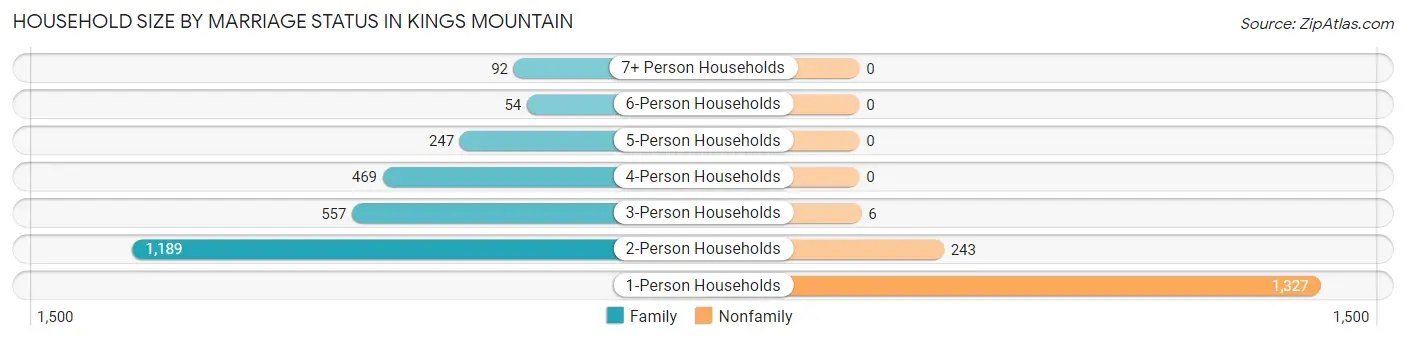
| Household Size | Family Households | Nonfamily Households |
| 1-Person Households | - | 1,327 (31.7%) |
| 2-Person Households | 1,189 (28.4%) | 243 (5.8%) |
| 3-Person Households | 557 (13.3%) | 6 (0.1%) |
| 4-Person Households | 469 (11.2%) | 0 (0.0%) |
| 5-Person Households | 247 (5.9%) | 0 (0.0%) |
| 6-Person Households | 54 (1.3%) | 0 (0.0%) |
| 7+ Person Households | 92 (2.2%) | 0 (0.0%) |
| Total | 2,608 (62.3%) | 1,576 (37.7%) |
Female Fertility in Kings Mountain
Fertility by Age in Kings Mountain
Average fertility rate in Kings Mountain is 113.0 births per 1,000 women. Women in the age bracket of 20 to 34 years have the highest fertility rate with 226.0 births per 1,000 women. Women in the age bracket of 20 to 34 years acount for 83.0% of all women with births.
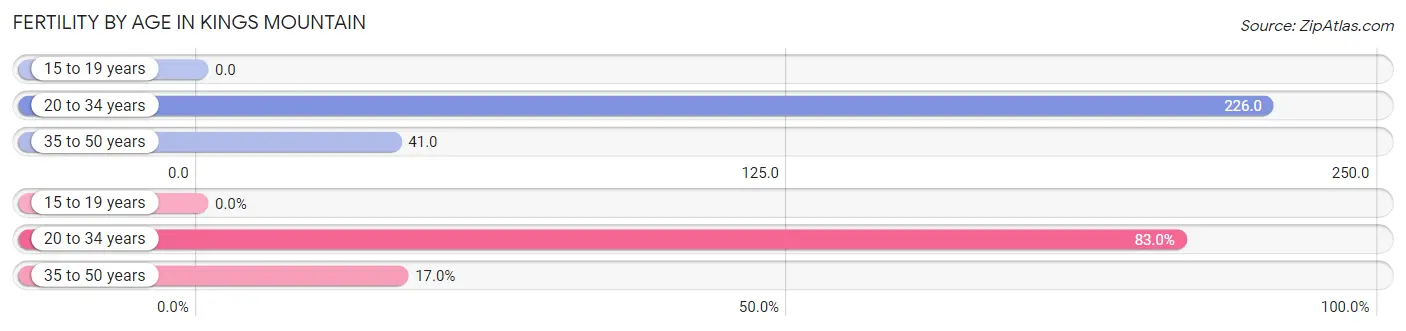
| Age Bracket | Women with Births | Births / 1,000 Women |
| 15 to 19 years | 0 (0.0%) | 0.0 |
| 20 to 34 years | 220 (83.0%) | 226.0 |
| 35 to 50 years | 45 (17.0%) | 41.0 |
| Total | 265 (100.0%) | 113.0 |
Fertility by Age by Marriage Status in Kings Mountain
13.2% of women with births (265) in Kings Mountain are married. The highest percentage of unmarried women with births falls into 35 to 50 years age bracket with 100.0% of them unmarried at the time of birth, while the lowest percentage of unmarried women with births belong to 20 to 34 years age bracket with 84.1% of them unmarried.
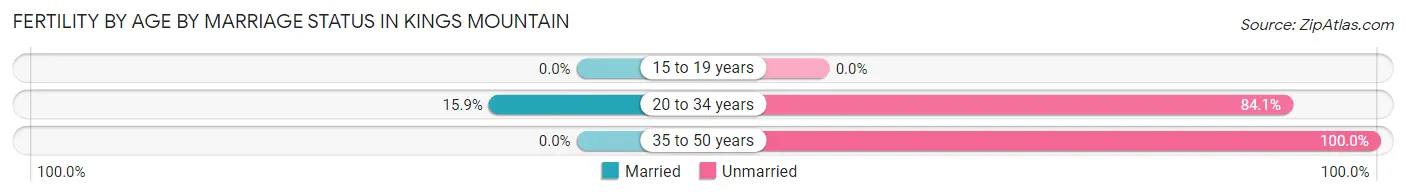
| Age Bracket | Married | Unmarried |
| 15 to 19 years | 0 (0.0%) | 0 (0.0%) |
| 20 to 34 years | 35 (15.9%) | 185 (84.1%) |
| 35 to 50 years | 0 (0.0%) | 45 (100.0%) |
| Total | 35 (13.2%) | 230 (86.8%) |
Fertility by Education in Kings Mountain
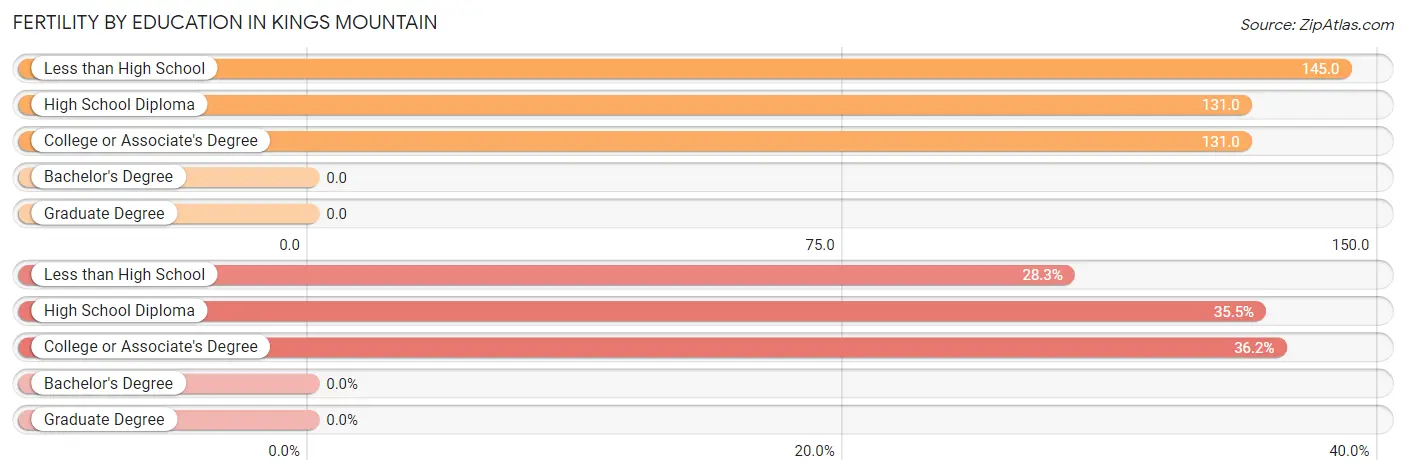
| Educational Attainment | Women with Births | Births / 1,000 Women |
| Less than High School | 75 (28.3%) | 145.0 |
| High School Diploma | 94 (35.5%) | 131.0 |
| College or Associate's Degree | 96 (36.2%) | 131.0 |
| Bachelor's Degree | 0 (0.0%) | 0.0 |
| Graduate Degree | 0 (0.0%) | 0.0 |
| Total | 265 (100.0%) | 113.0 |
Fertility by Education by Marriage Status in Kings Mountain
86.8% of women with births in Kings Mountain are unmarried. Women with the educational attainment of college or associate's degree are most likely to be married with 20.8% of them married at childbirth, while women with the educational attainment of less than high school are least likely to be married with 92.0% of them unmarried at childbirth.
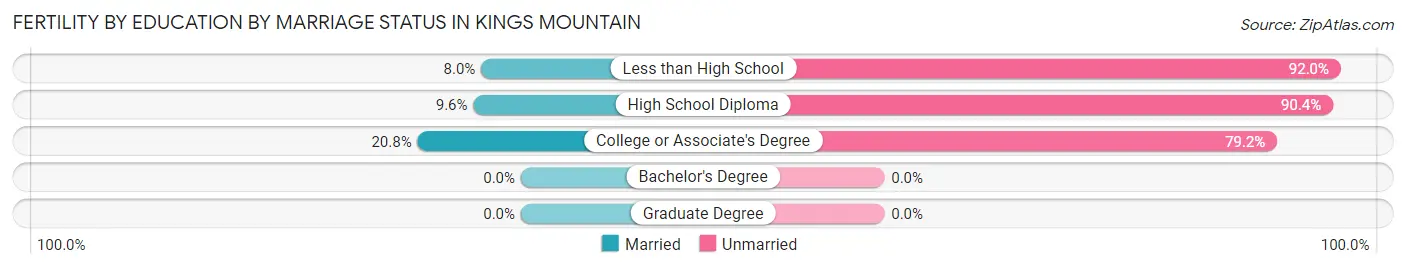
| Educational Attainment | Married | Unmarried |
| Less than High School | 6 (8.0%) | 69 (92.0%) |
| High School Diploma | 9 (9.6%) | 85 (90.4%) |
| College or Associate's Degree | 20 (20.8%) | 76 (79.2%) |
| Bachelor's Degree | 0 (0.0%) | 0 (0.0%) |
| Graduate Degree | 0 (0.0%) | 0 (0.0%) |
| Total | 35 (13.2%) | 230 (86.8%) |
Employment Characteristics in Kings Mountain
Employment by Class of Employer in Kings Mountain
Among the 4,925 employed individuals in Kings Mountain, private company employees (3,777 | 76.7%), local government employees (443 | 9.0%), and not-for-profit organizations (282 | 5.7%) make up the most common classes of employment.
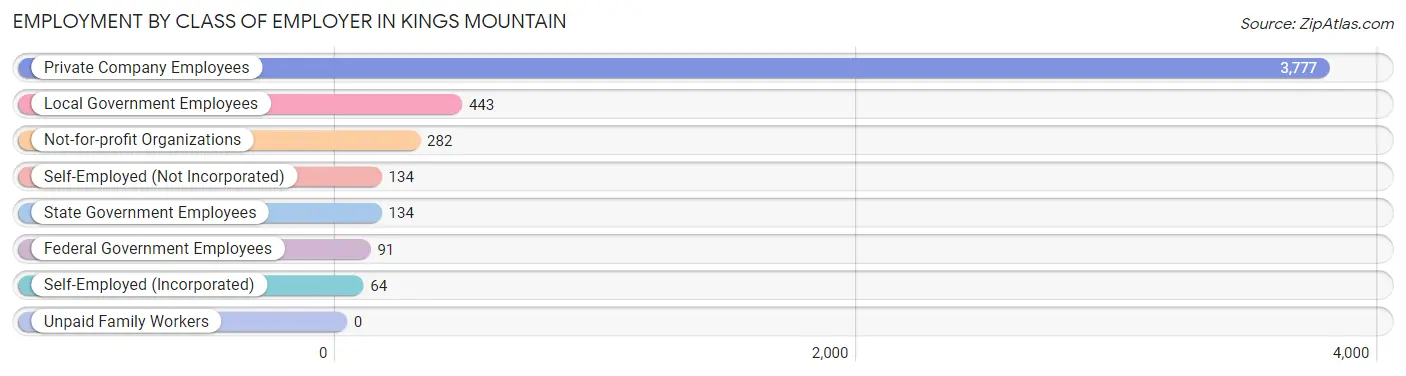
| Employer Class | # Employees | % Employees |
| Private Company Employees | 3,777 | 76.7% |
| Self-Employed (Incorporated) | 64 | 1.3% |
| Self-Employed (Not Incorporated) | 134 | 2.7% |
| Not-for-profit Organizations | 282 | 5.7% |
| Local Government Employees | 443 | 9.0% |
| State Government Employees | 134 | 2.7% |
| Federal Government Employees | 91 | 1.8% |
| Unpaid Family Workers | 0 | 0.0% |
| Total | 4,925 | 100.0% |
Employment Status by Age in Kings Mountain
According to the labor force statistics for Kings Mountain, out of the total population over 16 years of age (8,834), 61.1% or 5,398 individuals are in the labor force, with 6.8% or 367 of them unemployed. The age group with the highest labor force participation rate is 25 to 29 years, with 87.0% or 741 individuals in the labor force. Within the labor force, the 30 to 34 years age range has the highest percentage of unemployed individuals, with 19.7% or 105 of them being unemployed.
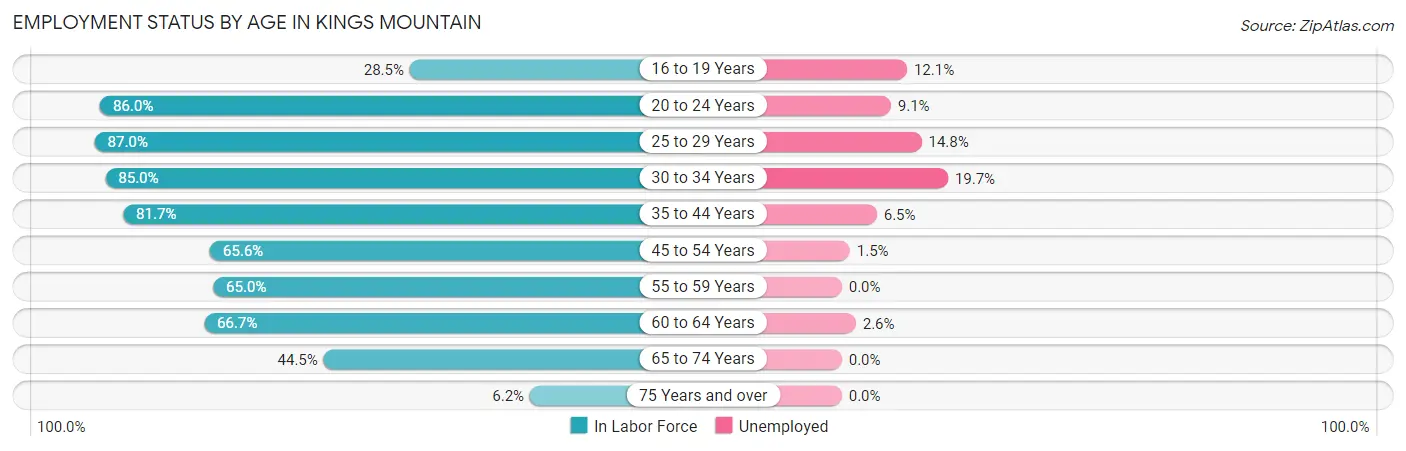
| Age Bracket | In Labor Force | Unemployed |
| 16 to 19 Years | 141 (28.5%) | 17 (12.1%) |
| 20 to 24 Years | 441 (86.0%) | 40 (9.1%) |
| 25 to 29 Years | 741 (87.0%) | 110 (14.8%) |
| 30 to 34 Years | 532 (85.0%) | 105 (19.7%) |
| 35 to 44 Years | 991 (81.7%) | 64 (6.5%) |
| 45 to 54 Years | 827 (65.6%) | 12 (1.5%) |
| 55 to 59 Years | 569 (65.0%) | 0 (0.0%) |
| 60 to 64 Years | 618 (66.7%) | 16 (2.6%) |
| 65 to 74 Years | 472 (44.5%) | 0 (0.0%) |
| 75 Years and over | 63 (6.2%) | 0 (0.0%) |
| Total | 5,398 (61.1%) | 367 (6.8%) |
Employment Status by Educational Attainment in Kings Mountain
According to labor force statistics for Kings Mountain, 74.3% of individuals (4,276) out of the total population between 25 and 64 years of age (5,755) are in the labor force, with 7.2% or 308 of them being unemployed. The group with the highest labor force participation rate are those with the educational attainment of bachelor's degree or higher, with 91.5% or 996 individuals in the labor force. Within the labor force, individuals with less than high school education have the highest percentage of unemployment, with 32.0% or 87 of them being unemployed.
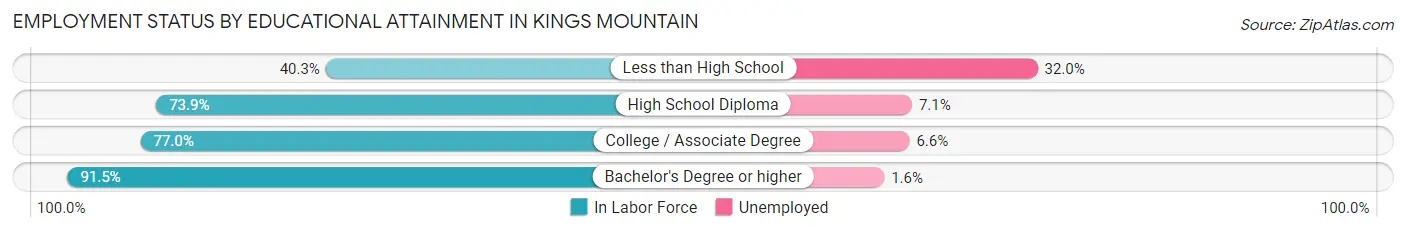
| Educational Attainment | In Labor Force | Unemployed |
| Less than High School | 272 (40.3%) | 216 (32.0%) |
| High School Diploma | 1,502 (73.9%) | 144 (7.1%) |
| College / Associate Degree | 1,508 (77.0%) | 129 (6.6%) |
| Bachelor's Degree or higher | 996 (91.5%) | 17 (1.6%) |
| Total | 4,276 (74.3%) | 414 (7.2%) |
Employment Occupations by Sex in Kings Mountain
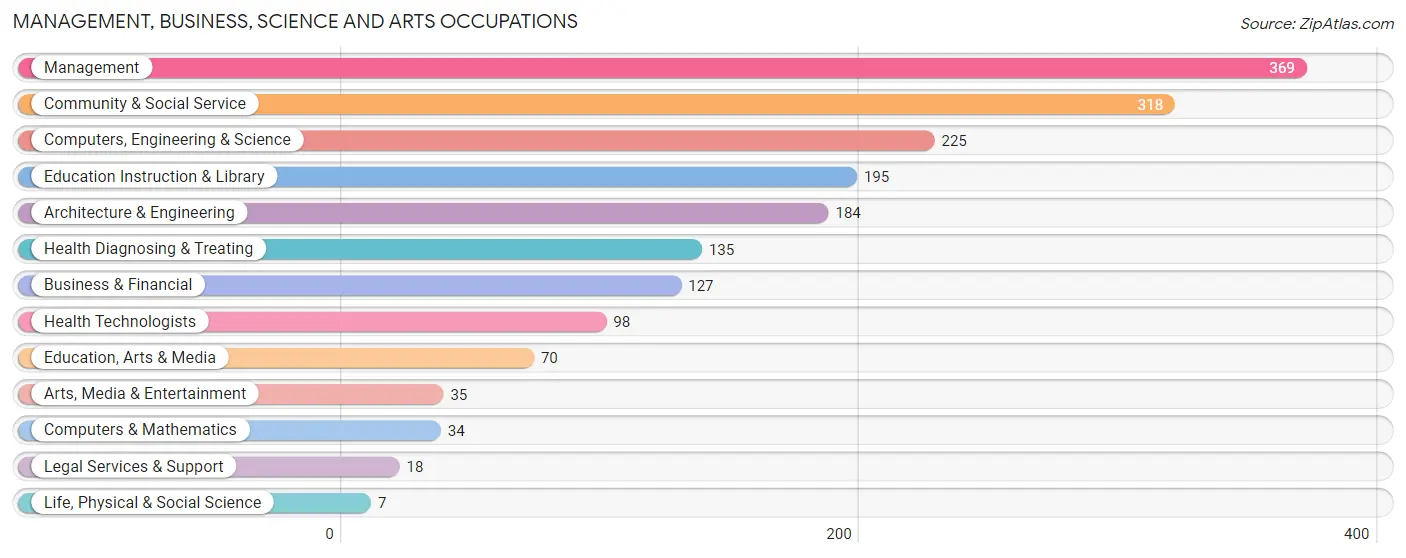
Management, Business, Science and Arts Occupations
The most common Management, Business, Science and Arts occupations in Kings Mountain are Management (369 | 7.4%), Community & Social Service (318 | 6.4%), Computers, Engineering & Science (225 | 4.5%), Education Instruction & Library (195 | 3.9%), and Architecture & Engineering (184 | 3.7%).
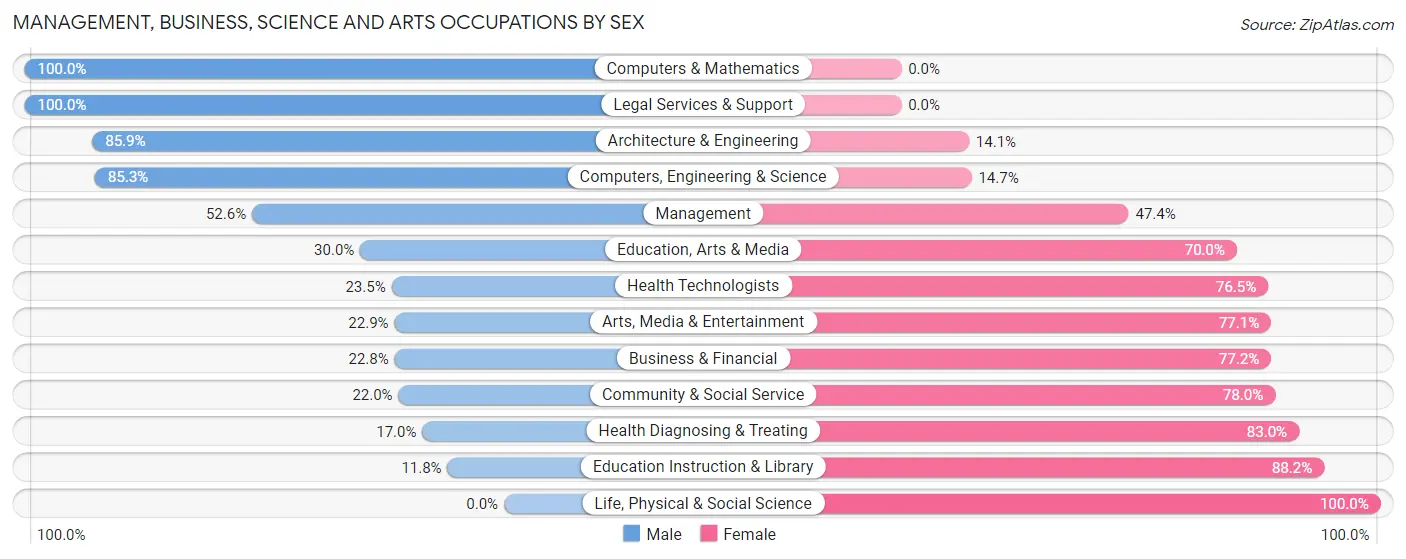
Management, Business, Science and Arts Occupations by Sex
Within the Management, Business, Science and Arts occupations in Kings Mountain, the most male-oriented occupations are Computers & Mathematics (100.0%), Legal Services & Support (100.0%), and Architecture & Engineering (85.9%), while the most female-oriented occupations are Life, Physical & Social Science (100.0%), Education Instruction & Library (88.2%), and Health Diagnosing & Treating (83.0%).
| Occupation | Male | Female |
| Management | 194 (52.6%) | 175 (47.4%) |
| Business & Financial | 29 (22.8%) | 98 (77.2%) |
| Computers, Engineering & Science | 192 (85.3%) | 33 (14.7%) |
| Computers & Mathematics | 34 (100.0%) | 0 (0.0%) |
| Architecture & Engineering | 158 (85.9%) | 26 (14.1%) |
| Life, Physical & Social Science | 0 (0.0%) | 7 (100.0%) |
| Community & Social Service | 70 (22.0%) | 248 (78.0%) |
| Education, Arts & Media | 21 (30.0%) | 49 (70.0%) |
| Legal Services & Support | 18 (100.0%) | 0 (0.0%) |
| Education Instruction & Library | 23 (11.8%) | 172 (88.2%) |
| Arts, Media & Entertainment | 8 (22.9%) | 27 (77.1%) |
| Health Diagnosing & Treating | 23 (17.0%) | 112 (83.0%) |
| Health Technologists | 23 (23.5%) | 75 (76.5%) |
| Total (Category) | 508 (43.3%) | 666 (56.7%) |
| Total (Overall) | 2,566 (51.4%) | 2,425 (48.6%) |
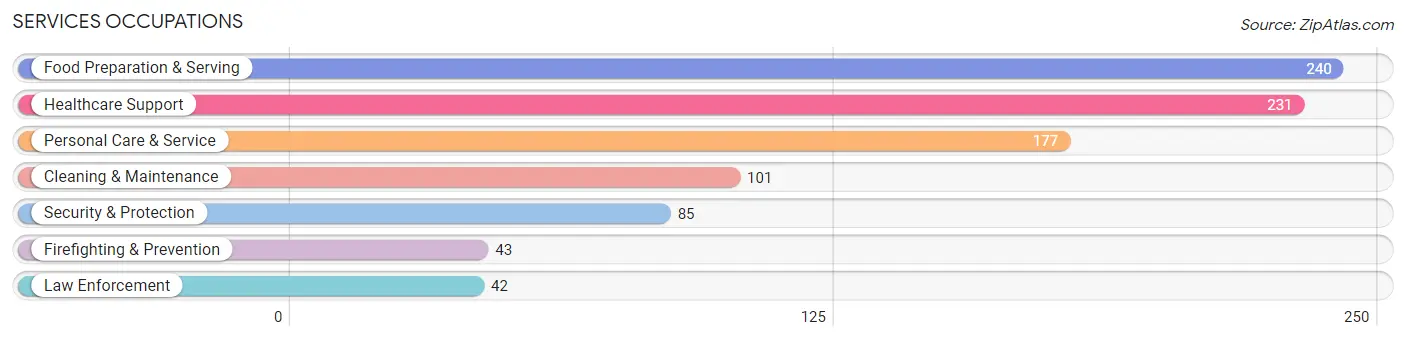
Services Occupations
The most common Services occupations in Kings Mountain are Food Preparation & Serving (240 | 4.8%), Healthcare Support (231 | 4.6%), Personal Care & Service (177 | 3.5%), Cleaning & Maintenance (101 | 2.0%), and Security & Protection (85 | 1.7%).
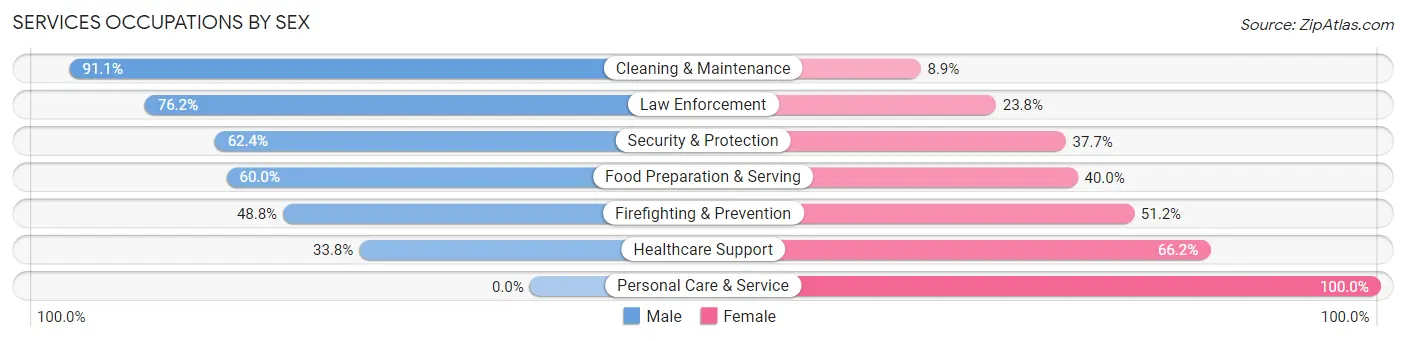
Services Occupations by Sex
Within the Services occupations in Kings Mountain, the most male-oriented occupations are Cleaning & Maintenance (91.1%), Law Enforcement (76.2%), and Security & Protection (62.4%), while the most female-oriented occupations are Personal Care & Service (100.0%), Healthcare Support (66.2%), and Firefighting & Prevention (51.2%).
| Occupation | Male | Female |
| Healthcare Support | 78 (33.8%) | 153 (66.2%) |
| Security & Protection | 53 (62.4%) | 32 (37.7%) |
| Firefighting & Prevention | 21 (48.8%) | 22 (51.2%) |
| Law Enforcement | 32 (76.2%) | 10 (23.8%) |
| Food Preparation & Serving | 144 (60.0%) | 96 (40.0%) |
| Cleaning & Maintenance | 92 (91.1%) | 9 (8.9%) |
| Personal Care & Service | 0 (0.0%) | 177 (100.0%) |
| Total (Category) | 367 (44.0%) | 467 (56.0%) |
| Total (Overall) | 2,566 (51.4%) | 2,425 (48.6%) |
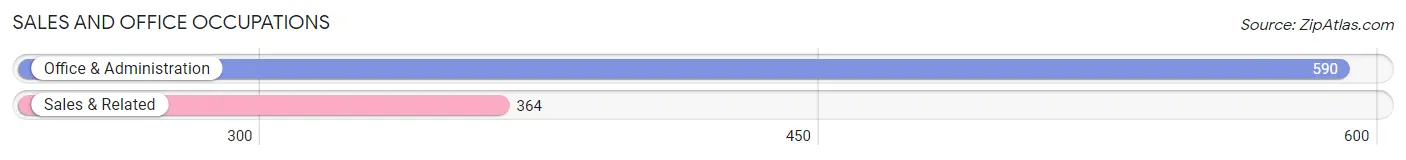
Sales and Office Occupations
The most common Sales and Office occupations in Kings Mountain are Office & Administration (590 | 11.8%), and Sales & Related (364 | 7.3%).
Sales and Office Occupations by Sex
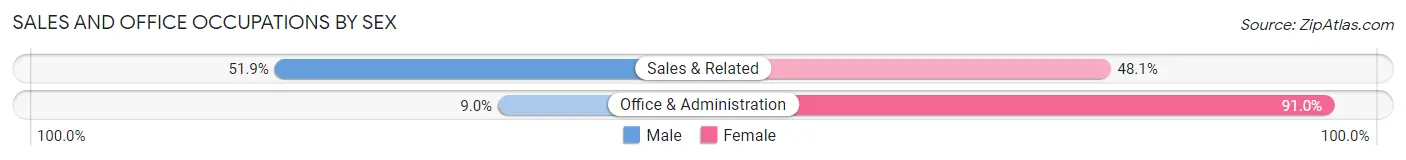
| Occupation | Male | Female |
| Sales & Related | 189 (51.9%) | 175 (48.1%) |
| Office & Administration | 53 (9.0%) | 537 (91.0%) |
| Total (Category) | 242 (25.4%) | 712 (74.6%) |
| Total (Overall) | 2,566 (51.4%) | 2,425 (48.6%) |
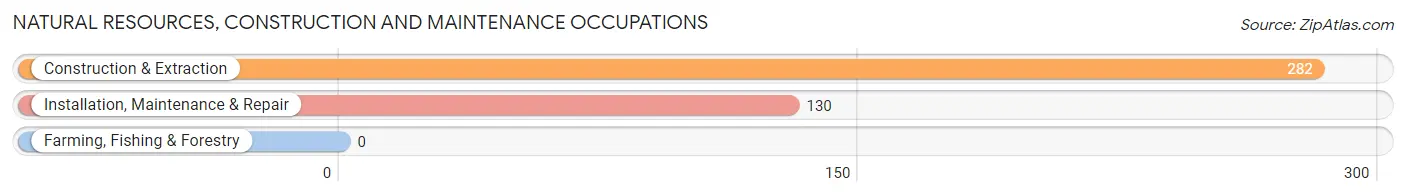
Natural Resources, Construction and Maintenance Occupations
The most common Natural Resources, Construction and Maintenance occupations in Kings Mountain are Construction & Extraction (282 | 5.7%), and Installation, Maintenance & Repair (130 | 2.6%).
Natural Resources, Construction and Maintenance Occupations by Sex
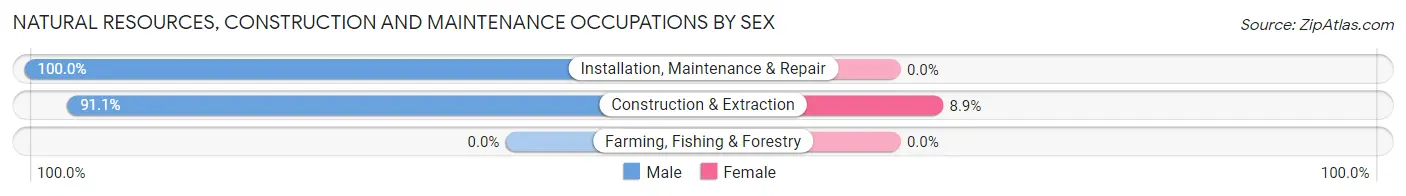
| Occupation | Male | Female |
| Farming, Fishing & Forestry | 0 (0.0%) | 0 (0.0%) |
| Construction & Extraction | 257 (91.1%) | 25 (8.9%) |
| Installation, Maintenance & Repair | 130 (100.0%) | 0 (0.0%) |
| Total (Category) | 387 (93.9%) | 25 (6.1%) |
| Total (Overall) | 2,566 (51.4%) | 2,425 (48.6%) |
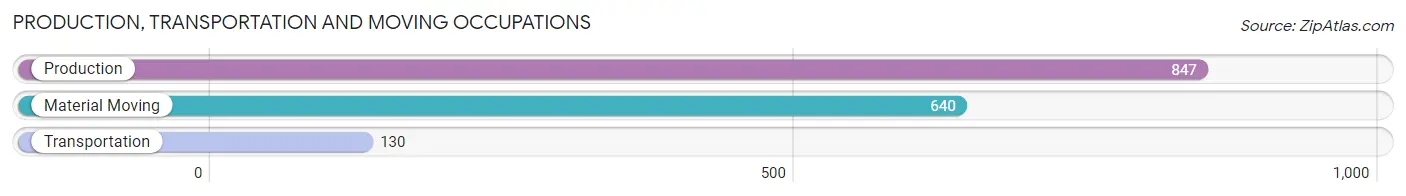
Production, Transportation and Moving Occupations
The most common Production, Transportation and Moving occupations in Kings Mountain are Production (847 | 17.0%), Material Moving (640 | 12.8%), and Transportation (130 | 2.6%).
Production, Transportation and Moving Occupations by Sex
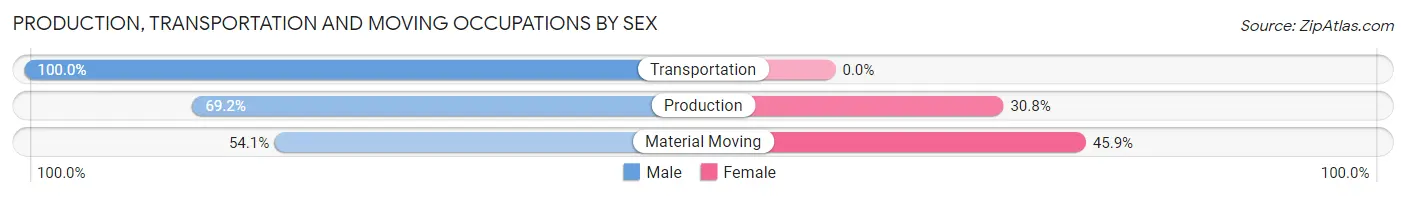
| Occupation | Male | Female |
| Production | 586 (69.2%) | 261 (30.8%) |
| Transportation | 130 (100.0%) | 0 (0.0%) |
| Material Moving | 346 (54.1%) | 294 (45.9%) |
| Total (Category) | 1,062 (65.7%) | 555 (34.3%) |
| Total (Overall) | 2,566 (51.4%) | 2,425 (48.6%) |
Employment Industries by Sex in Kings Mountain
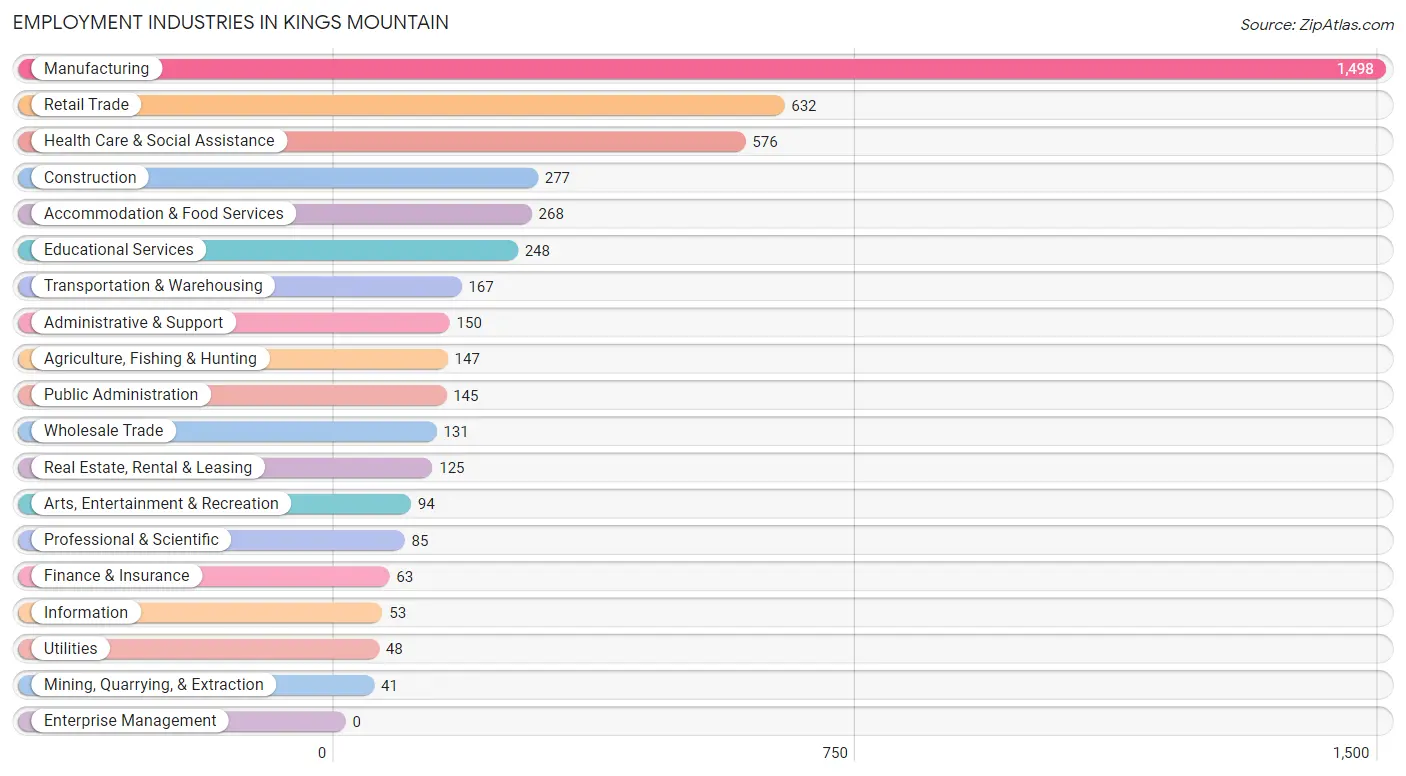
Employment Industries in Kings Mountain
The major employment industries in Kings Mountain include Manufacturing (1,498 | 30.0%), Retail Trade (632 | 12.7%), Health Care & Social Assistance (576 | 11.5%), Construction (277 | 5.6%), and Accommodation & Food Services (268 | 5.4%).
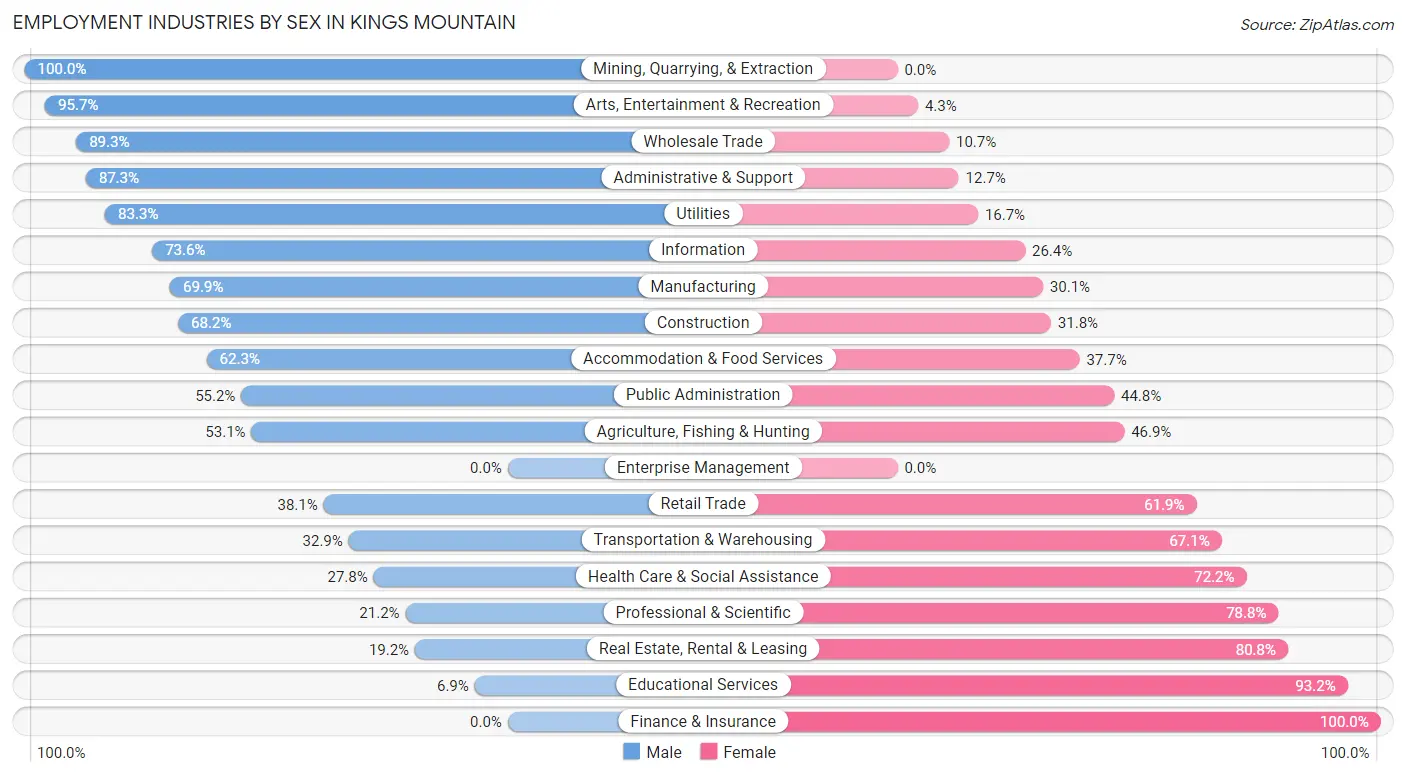
Employment Industries by Sex in Kings Mountain
The Kings Mountain industries that see more men than women are Mining, Quarrying, & Extraction (100.0%), Arts, Entertainment & Recreation (95.7%), and Wholesale Trade (89.3%), whereas the industries that tend to have a higher number of women are Finance & Insurance (100.0%), Educational Services (93.1%), and Real Estate, Rental & Leasing (80.8%).
| Industry | Male | Female |
| Agriculture, Fishing & Hunting | 78 (53.1%) | 69 (46.9%) |
| Mining, Quarrying, & Extraction | 41 (100.0%) | 0 (0.0%) |
| Construction | 189 (68.2%) | 88 (31.8%) |
| Manufacturing | 1,047 (69.9%) | 451 (30.1%) |
| Wholesale Trade | 117 (89.3%) | 14 (10.7%) |
| Retail Trade | 241 (38.1%) | 391 (61.9%) |
| Transportation & Warehousing | 55 (32.9%) | 112 (67.1%) |
| Utilities | 40 (83.3%) | 8 (16.7%) |
| Information | 39 (73.6%) | 14 (26.4%) |
| Finance & Insurance | 0 (0.0%) | 63 (100.0%) |
| Real Estate, Rental & Leasing | 24 (19.2%) | 101 (80.8%) |
| Professional & Scientific | 18 (21.2%) | 67 (78.8%) |
| Enterprise Management | 0 (0.0%) | 0 (0.0%) |
| Administrative & Support | 131 (87.3%) | 19 (12.7%) |
| Educational Services | 17 (6.9%) | 231 (93.1%) |
| Health Care & Social Assistance | 160 (27.8%) | 416 (72.2%) |
| Arts, Entertainment & Recreation | 90 (95.7%) | 4 (4.3%) |
| Accommodation & Food Services | 167 (62.3%) | 101 (37.7%) |
| Public Administration | 80 (55.2%) | 65 (44.8%) |
| Total | 2,566 (51.4%) | 2,425 (48.6%) |
Education in Kings Mountain
School Enrollment in Kings Mountain
The most common levels of schooling among the 2,260 students in Kings Mountain are elementary school (745 | 33.0%), middle school (566 | 25.0%), and high school (501 | 22.2%).
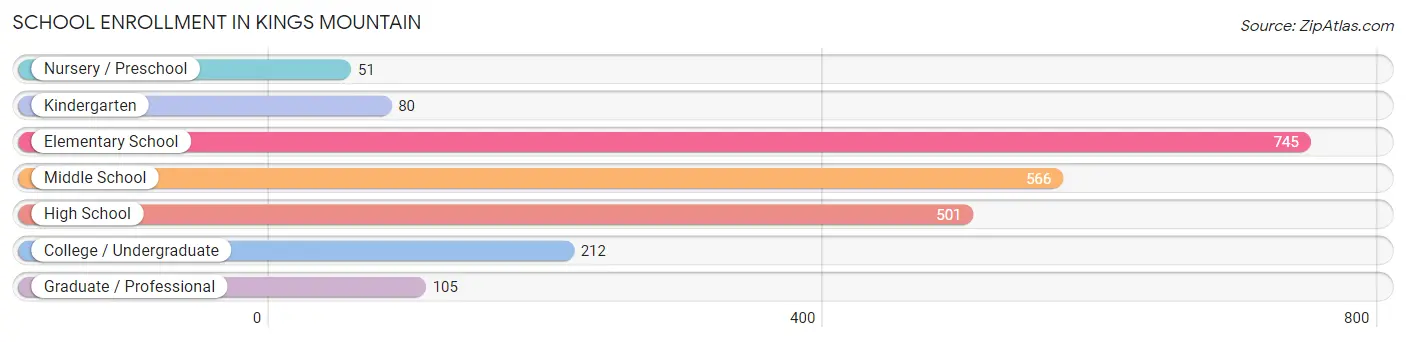
| School Level | # Students | % Students |
| Nursery / Preschool | 51 | 2.3% |
| Kindergarten | 80 | 3.5% |
| Elementary School | 745 | 33.0% |
| Middle School | 566 | 25.0% |
| High School | 501 | 22.2% |
| College / Undergraduate | 212 | 9.4% |
| Graduate / Professional | 105 | 4.6% |
| Total | 2,260 | 100.0% |
School Enrollment by Age by Funding Source in Kings Mountain
Out of a total of 2,260 students who are enrolled in schools in Kings Mountain, 235 (10.4%) attend a private institution, while the remaining 2,025 (89.6%) are enrolled in public schools. The age group of 3 to 4 year olds has the highest likelihood of being enrolled in private schools, with 14 (100.0% in the age bracket) enrolled. Conversely, the age group of 25 to 34 year olds has the lowest likelihood of being enrolled in a private school, with 89 (100.0% in the age bracket) attending a public institution.
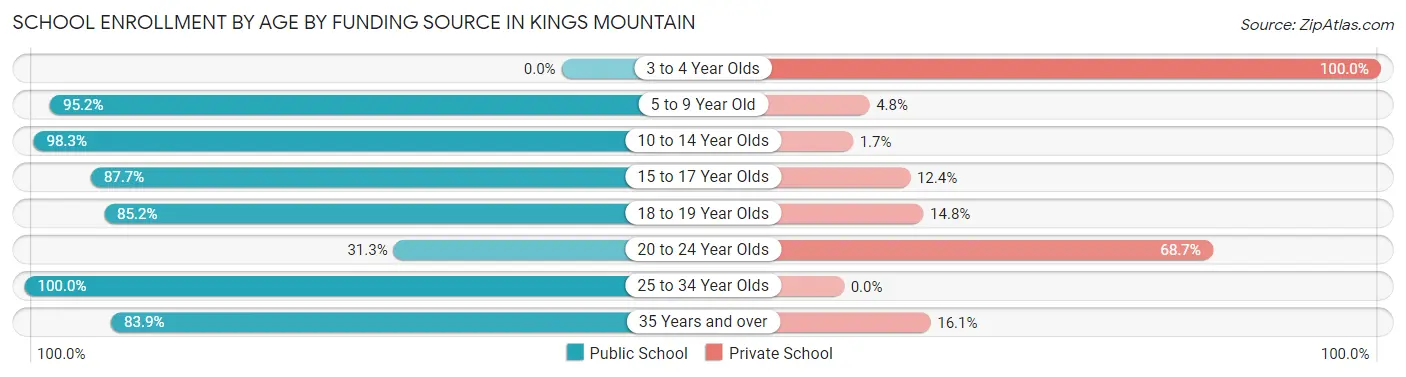
| Age Bracket | Public School | Private School |
| 3 to 4 Year Olds | 0 (0.0%) | 14 (100.0%) |
| 5 to 9 Year Old | 741 (95.2%) | 37 (4.8%) |
| 10 to 14 Year Olds | 759 (98.3%) | 13 (1.7%) |
| 15 to 17 Year Olds | 291 (87.6%) | 41 (12.3%) |
| 18 to 19 Year Olds | 69 (85.2%) | 12 (14.8%) |
| 20 to 24 Year Olds | 51 (31.3%) | 112 (68.7%) |
| 25 to 34 Year Olds | 89 (100.0%) | 0 (0.0%) |
| 35 Years and over | 26 (83.9%) | 5 (16.1%) |
| Total | 2,025 (89.6%) | 235 (10.4%) |
Educational Attainment by Field of Study in Kings Mountain
Business (381 | 27.5%), education (314 | 22.7%), engineering (152 | 11.0%), science & technology (120 | 8.7%), and liberal arts & history (113 | 8.2%) are the most common fields of study among 1,386 individuals in Kings Mountain who have obtained a bachelor's degree or higher.
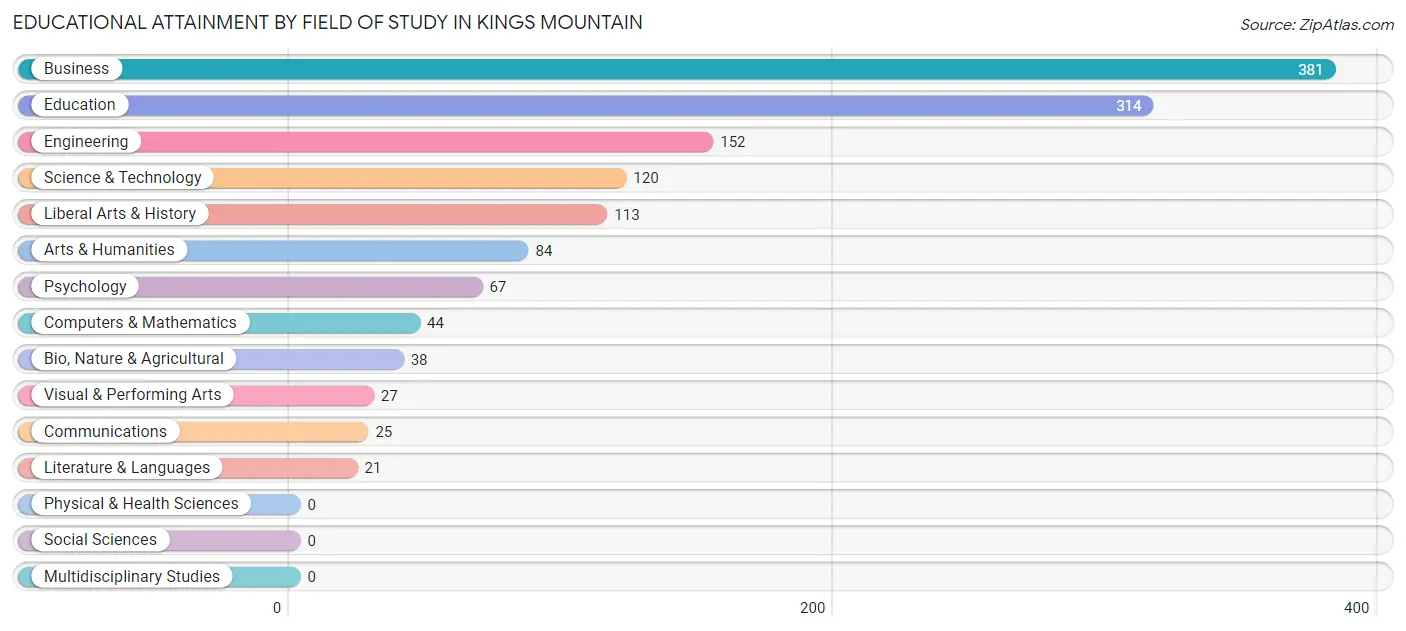
| Field of Study | # Graduates | % Graduates |
| Computers & Mathematics | 44 | 3.2% |
| Bio, Nature & Agricultural | 38 | 2.7% |
| Physical & Health Sciences | 0 | 0.0% |
| Psychology | 67 | 4.8% |
| Social Sciences | 0 | 0.0% |
| Engineering | 152 | 11.0% |
| Multidisciplinary Studies | 0 | 0.0% |
| Science & Technology | 120 | 8.7% |
| Business | 381 | 27.5% |
| Education | 314 | 22.7% |
| Literature & Languages | 21 | 1.5% |
| Liberal Arts & History | 113 | 8.2% |
| Visual & Performing Arts | 27 | 1.9% |
| Communications | 25 | 1.8% |
| Arts & Humanities | 84 | 6.1% |
| Total | 1,386 | 100.0% |
Transportation & Commute in Kings Mountain
Vehicle Availability by Sex in Kings Mountain
The most prevalent vehicle ownership categories in Kings Mountain are males with 2 vehicles (901, accounting for 35.2%) and females with 2 vehicles (763, making up 38.1%).
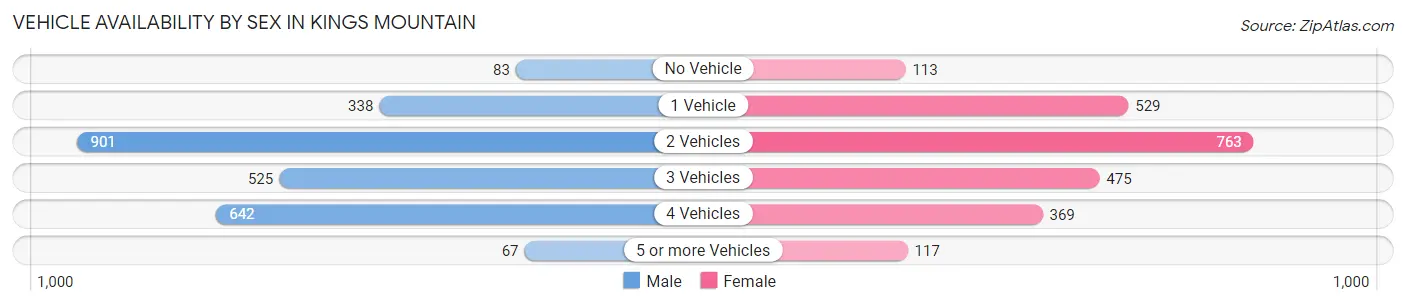
| Vehicles Available | Male | Female |
| No Vehicle | 83 (3.3%) | 113 (4.8%) |
| 1 Vehicle | 338 (13.2%) | 529 (22.4%) |
| 2 Vehicles | 901 (35.2%) | 763 (32.3%) |
| 3 Vehicles | 525 (20.5%) | 475 (20.1%) |
| 4 Vehicles | 642 (25.1%) | 369 (15.6%) |
| 5 or more Vehicles | 67 (2.6%) | 117 (5.0%) |
| Total | 2,556 (100.0%) | 2,366 (100.0%) |
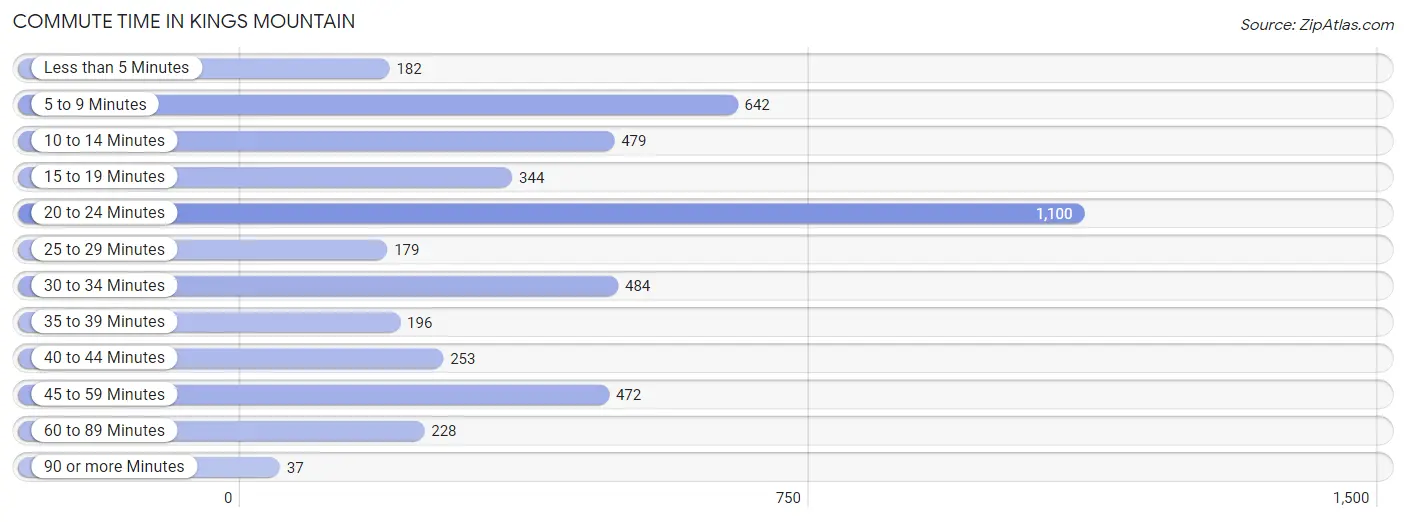
Commute Time in Kings Mountain
The most frequently occuring commute durations in Kings Mountain are 20 to 24 minutes (1,100 commuters, 23.9%), 5 to 9 minutes (642 commuters, 14.0%), and 30 to 34 minutes (484 commuters, 10.5%).
| Commute Time | # Commuters | % Commuters |
| Less than 5 Minutes | 182 | 4.0% |
| 5 to 9 Minutes | 642 | 14.0% |
| 10 to 14 Minutes | 479 | 10.4% |
| 15 to 19 Minutes | 344 | 7.5% |
| 20 to 24 Minutes | 1,100 | 23.9% |
| 25 to 29 Minutes | 179 | 3.9% |
| 30 to 34 Minutes | 484 | 10.5% |
| 35 to 39 Minutes | 196 | 4.3% |
| 40 to 44 Minutes | 253 | 5.5% |
| 45 to 59 Minutes | 472 | 10.3% |
| 60 to 89 Minutes | 228 | 5.0% |
| 90 or more Minutes | 37 | 0.8% |
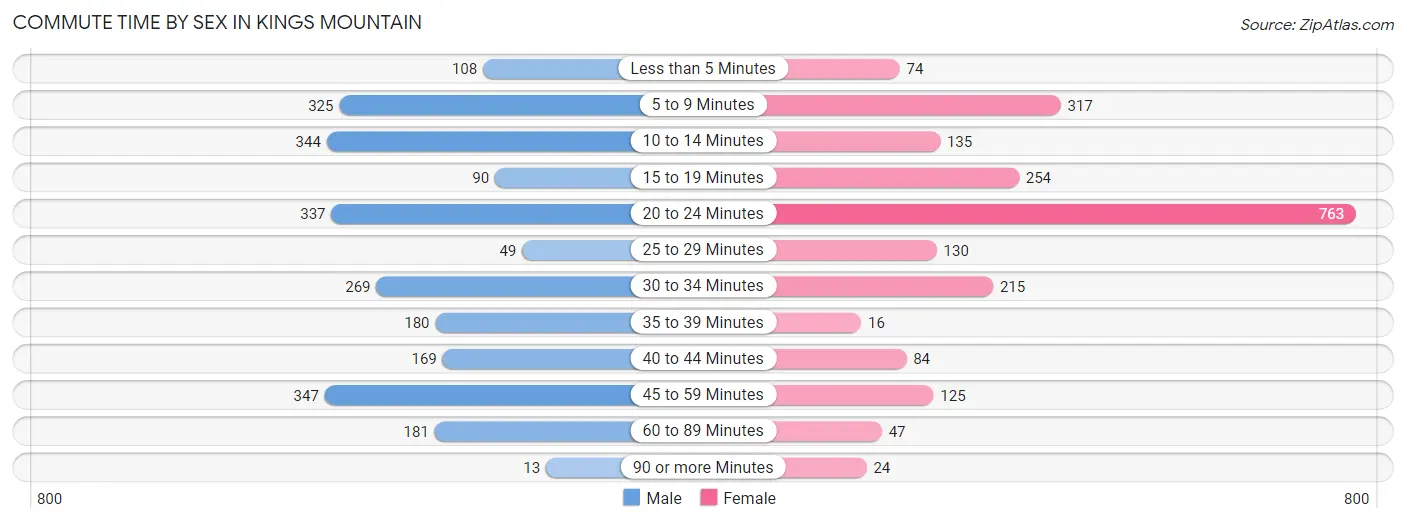
Commute Time by Sex in Kings Mountain
The most common commute times in Kings Mountain are 45 to 59 minutes (347 commuters, 14.4%) for males and 20 to 24 minutes (763 commuters, 34.9%) for females.
| Commute Time | Male | Female |
| Less than 5 Minutes | 108 (4.5%) | 74 (3.4%) |
| 5 to 9 Minutes | 325 (13.5%) | 317 (14.5%) |
| 10 to 14 Minutes | 344 (14.3%) | 135 (6.2%) |
| 15 to 19 Minutes | 90 (3.7%) | 254 (11.6%) |
| 20 to 24 Minutes | 337 (14.0%) | 763 (34.9%) |
| 25 to 29 Minutes | 49 (2.0%) | 130 (5.9%) |
| 30 to 34 Minutes | 269 (11.2%) | 215 (9.8%) |
| 35 to 39 Minutes | 180 (7.5%) | 16 (0.7%) |
| 40 to 44 Minutes | 169 (7.0%) | 84 (3.8%) |
| 45 to 59 Minutes | 347 (14.4%) | 125 (5.7%) |
| 60 to 89 Minutes | 181 (7.5%) | 47 (2.1%) |
| 90 or more Minutes | 13 (0.5%) | 24 (1.1%) |
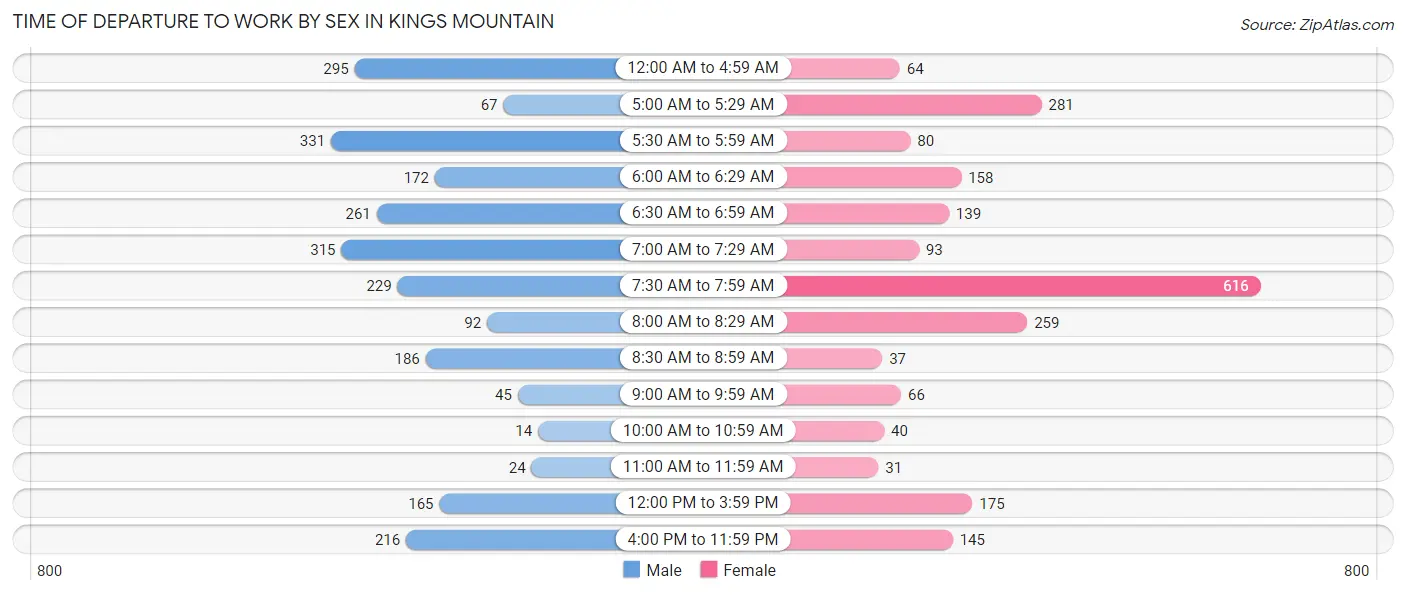
Time of Departure to Work by Sex in Kings Mountain
The most frequent times of departure to work in Kings Mountain are 5:30 AM to 5:59 AM (331, 13.7%) for males and 7:30 AM to 7:59 AM (616, 28.2%) for females.
| Time of Departure | Male | Female |
| 12:00 AM to 4:59 AM | 295 (12.2%) | 64 (2.9%) |
| 5:00 AM to 5:29 AM | 67 (2.8%) | 281 (12.9%) |
| 5:30 AM to 5:59 AM | 331 (13.7%) | 80 (3.7%) |
| 6:00 AM to 6:29 AM | 172 (7.1%) | 158 (7.2%) |
| 6:30 AM to 6:59 AM | 261 (10.8%) | 139 (6.4%) |
| 7:00 AM to 7:29 AM | 315 (13.1%) | 93 (4.3%) |
| 7:30 AM to 7:59 AM | 229 (9.5%) | 616 (28.2%) |
| 8:00 AM to 8:29 AM | 92 (3.8%) | 259 (11.9%) |
| 8:30 AM to 8:59 AM | 186 (7.7%) | 37 (1.7%) |
| 9:00 AM to 9:59 AM | 45 (1.9%) | 66 (3.0%) |
| 10:00 AM to 10:59 AM | 14 (0.6%) | 40 (1.8%) |
| 11:00 AM to 11:59 AM | 24 (1.0%) | 31 (1.4%) |
| 12:00 PM to 3:59 PM | 165 (6.8%) | 175 (8.0%) |
| 4:00 PM to 11:59 PM | 216 (9.0%) | 145 (6.6%) |
| Total | 2,412 (100.0%) | 2,184 (100.0%) |
Housing Occupancy in Kings Mountain
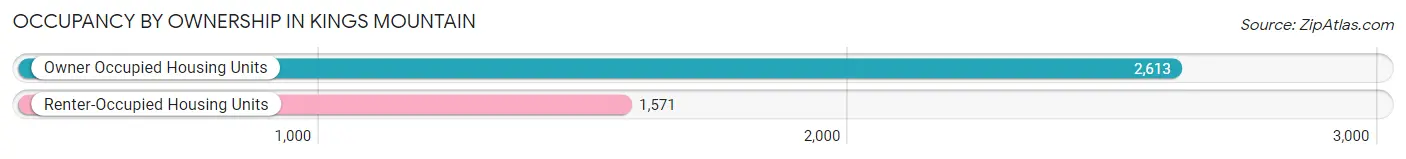
Occupancy by Ownership in Kings Mountain
Of the total 4,184 dwellings in Kings Mountain, owner-occupied units account for 2,613 (62.5%), while renter-occupied units make up 1,571 (37.6%).
| Occupancy | # Housing Units | % Housing Units |
| Owner Occupied Housing Units | 2,613 | 62.5% |
| Renter-Occupied Housing Units | 1,571 | 37.6% |
| Total Occupied Housing Units | 4,184 | 100.0% |
Occupancy by Household Size in Kings Mountain
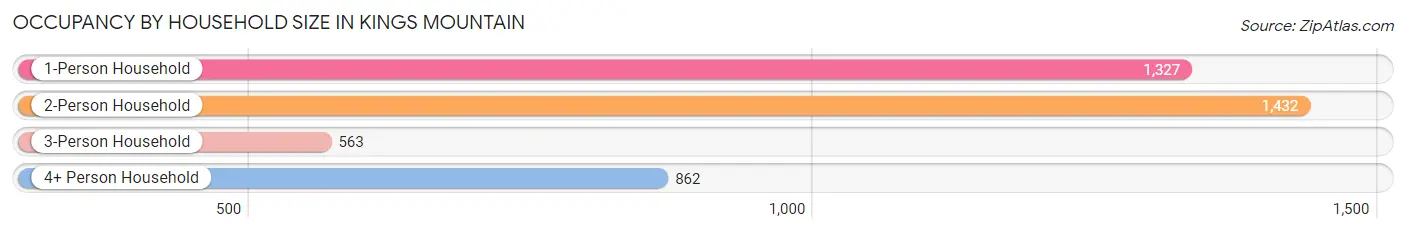
| Household Size | # Housing Units | % Housing Units |
| 1-Person Household | 1,327 | 31.7% |
| 2-Person Household | 1,432 | 34.2% |
| 3-Person Household | 563 | 13.5% |
| 4+ Person Household | 862 | 20.6% |
| Total Housing Units | 4,184 | 100.0% |
Occupancy by Ownership by Household Size in Kings Mountain
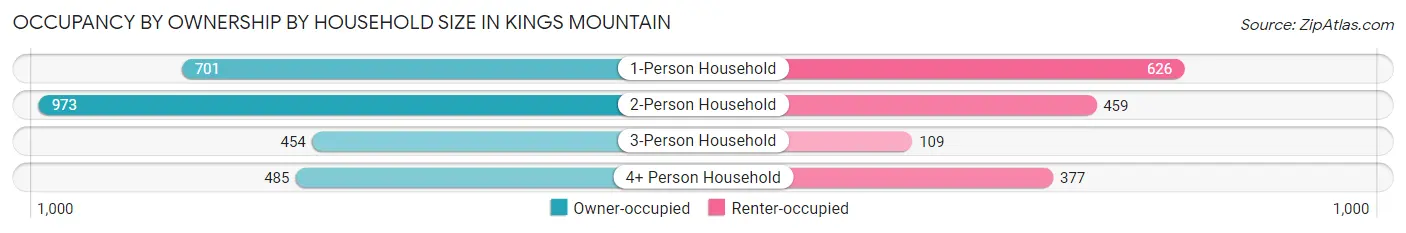
| Household Size | Owner-occupied | Renter-occupied |
| 1-Person Household | 701 (52.8%) | 626 (47.2%) |
| 2-Person Household | 973 (67.9%) | 459 (32.1%) |
| 3-Person Household | 454 (80.6%) | 109 (19.4%) |
| 4+ Person Household | 485 (56.3%) | 377 (43.7%) |
| Total Housing Units | 2,613 (62.5%) | 1,571 (37.6%) |
Occupancy by Educational Attainment in Kings Mountain
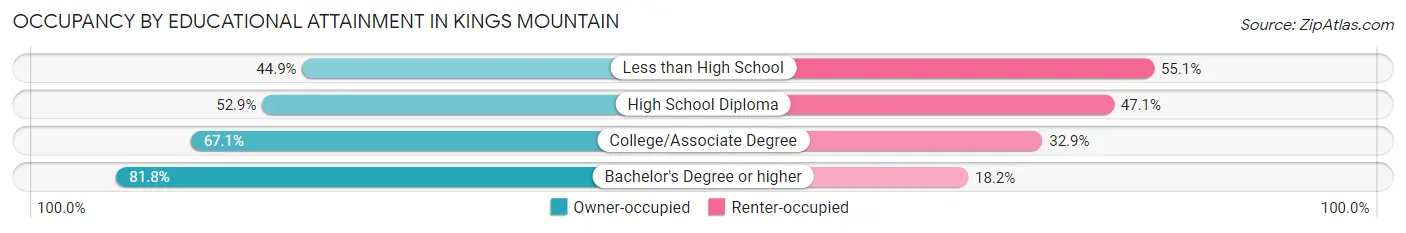
| Household Size | Owner-occupied | Renter-occupied |
| Less than High School | 274 (44.9%) | 336 (55.1%) |
| High School Diploma | 707 (52.9%) | 630 (47.1%) |
| College/Associate Degree | 900 (67.1%) | 442 (32.9%) |
| Bachelor's Degree or higher | 732 (81.8%) | 163 (18.2%) |
Occupancy by Age of Householder in Kings Mountain
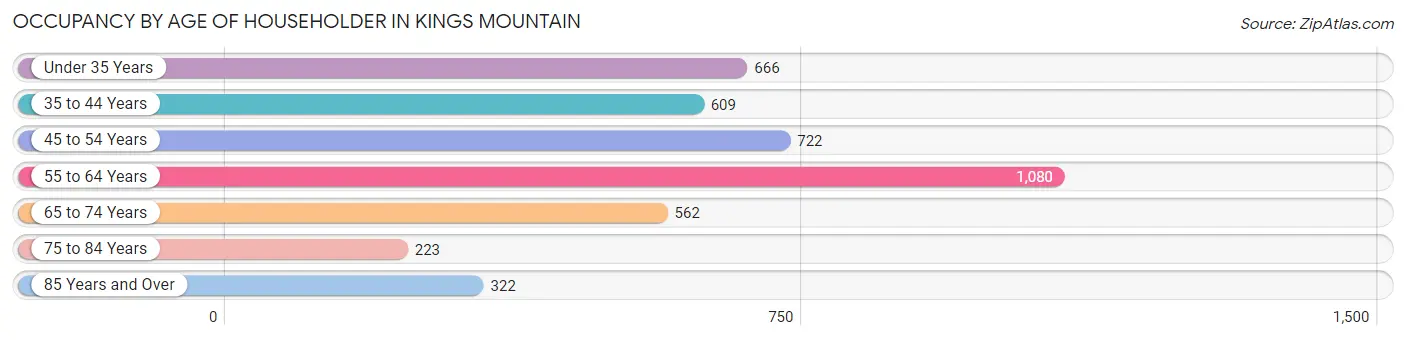
| Age Bracket | # Households | % Households |
| Under 35 Years | 666 | 15.9% |
| 35 to 44 Years | 609 | 14.6% |
| 45 to 54 Years | 722 | 17.3% |
| 55 to 64 Years | 1,080 | 25.8% |
| 65 to 74 Years | 562 | 13.4% |
| 75 to 84 Years | 223 | 5.3% |
| 85 Years and Over | 322 | 7.7% |
| Total | 4,184 | 100.0% |
Housing Finances in Kings Mountain
Median Income by Occupancy in Kings Mountain
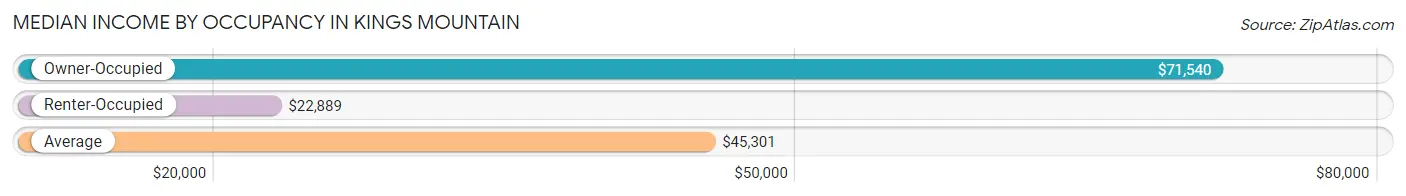
| Occupancy Type | # Households | Median Income |
| Owner-Occupied | 2,613 (62.5%) | $71,540 |
| Renter-Occupied | 1,571 (37.6%) | $22,889 |
| Average | 4,184 (100.0%) | $45,301 |
Occupancy by Householder Income Bracket in Kings Mountain
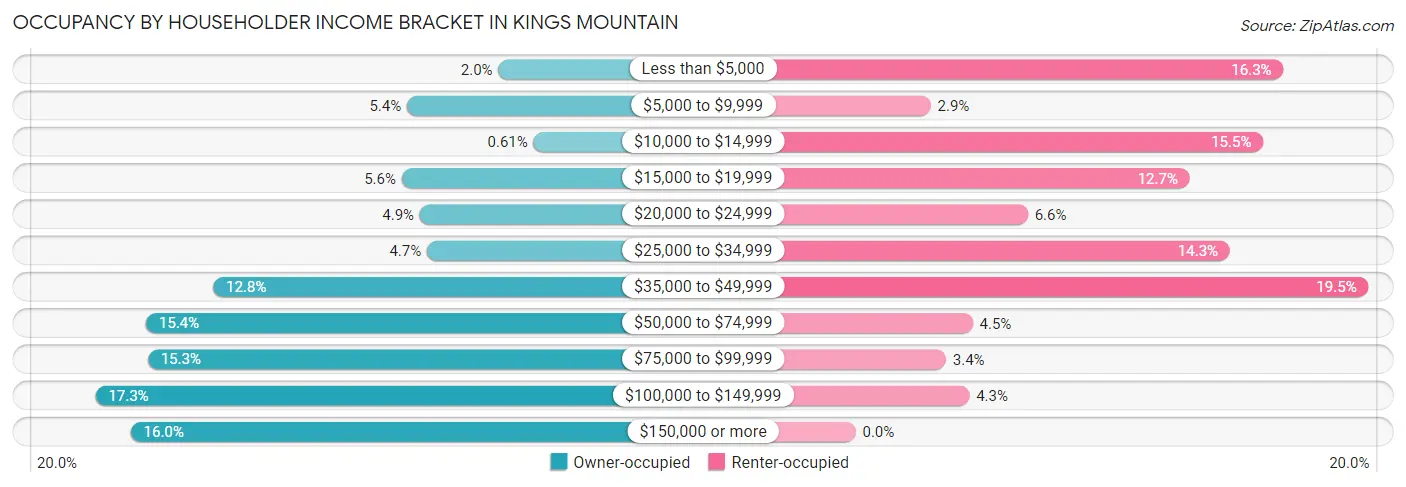
| Income Bracket | Owner-occupied | Renter-occupied |
| Less than $5,000 | 51 (1.9%) | 256 (16.3%) |
| $5,000 to $9,999 | 142 (5.4%) | 45 (2.9%) |
| $10,000 to $14,999 | 16 (0.6%) | 244 (15.5%) |
| $15,000 to $19,999 | 147 (5.6%) | 200 (12.7%) |
| $20,000 to $24,999 | 129 (4.9%) | 103 (6.6%) |
| $25,000 to $34,999 | 122 (4.7%) | 224 (14.3%) |
| $35,000 to $49,999 | 335 (12.8%) | 307 (19.5%) |
| $50,000 to $74,999 | 402 (15.4%) | 70 (4.5%) |
| $75,000 to $99,999 | 400 (15.3%) | 54 (3.4%) |
| $100,000 to $149,999 | 452 (17.3%) | 68 (4.3%) |
| $150,000 or more | 417 (16.0%) | 0 (0.0%) |
| Total | 2,613 (100.0%) | 1,571 (100.0%) |
Monthly Housing Cost Tiers in Kings Mountain
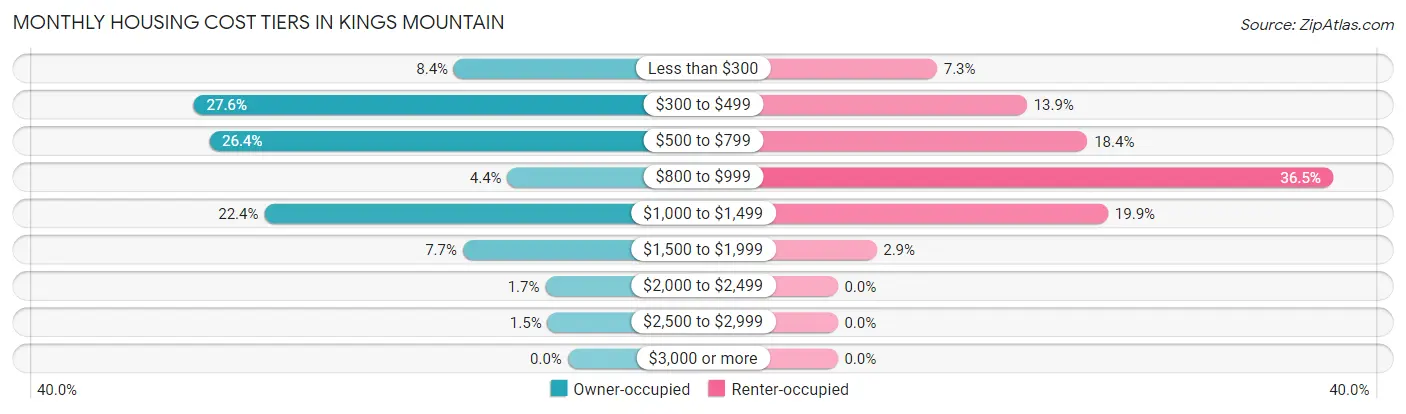
| Monthly Cost | Owner-occupied | Renter-occupied |
| Less than $300 | 219 (8.4%) | 115 (7.3%) |
| $300 to $499 | 720 (27.6%) | 219 (13.9%) |
| $500 to $799 | 690 (26.4%) | 289 (18.4%) |
| $800 to $999 | 116 (4.4%) | 573 (36.5%) |
| $1,000 to $1,499 | 584 (22.4%) | 313 (19.9%) |
| $1,500 to $1,999 | 202 (7.7%) | 45 (2.9%) |
| $2,000 to $2,499 | 43 (1.7%) | 0 (0.0%) |
| $2,500 to $2,999 | 39 (1.5%) | 0 (0.0%) |
| $3,000 or more | 0 (0.0%) | 0 (0.0%) |
| Total | 2,613 (100.0%) | 1,571 (100.0%) |
Physical Housing Characteristics in Kings Mountain
Housing Structures in Kings Mountain
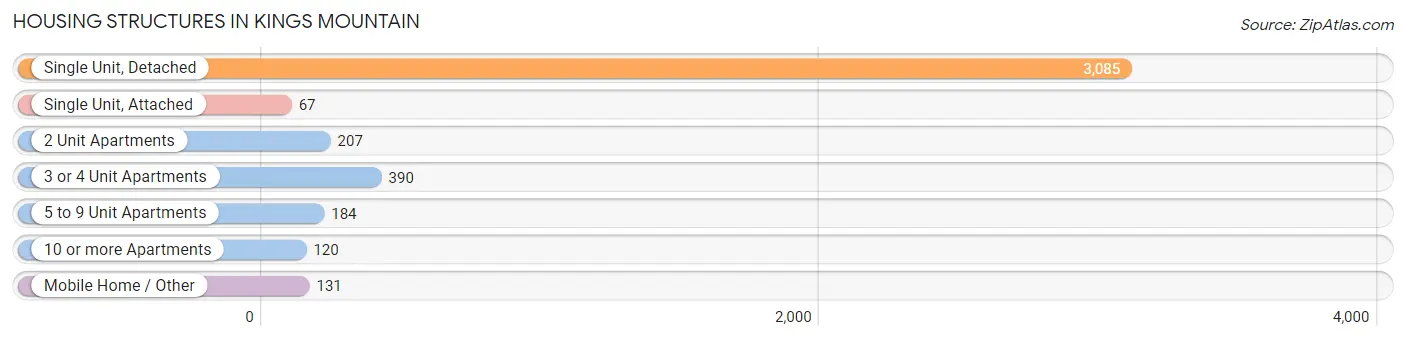
| Structure Type | # Housing Units | % Housing Units |
| Single Unit, Detached | 3,085 | 73.7% |
| Single Unit, Attached | 67 | 1.6% |
| 2 Unit Apartments | 207 | 5.0% |
| 3 or 4 Unit Apartments | 390 | 9.3% |
| 5 to 9 Unit Apartments | 184 | 4.4% |
| 10 or more Apartments | 120 | 2.9% |
| Mobile Home / Other | 131 | 3.1% |
| Total | 4,184 | 100.0% |
Housing Structures by Occupancy in Kings Mountain
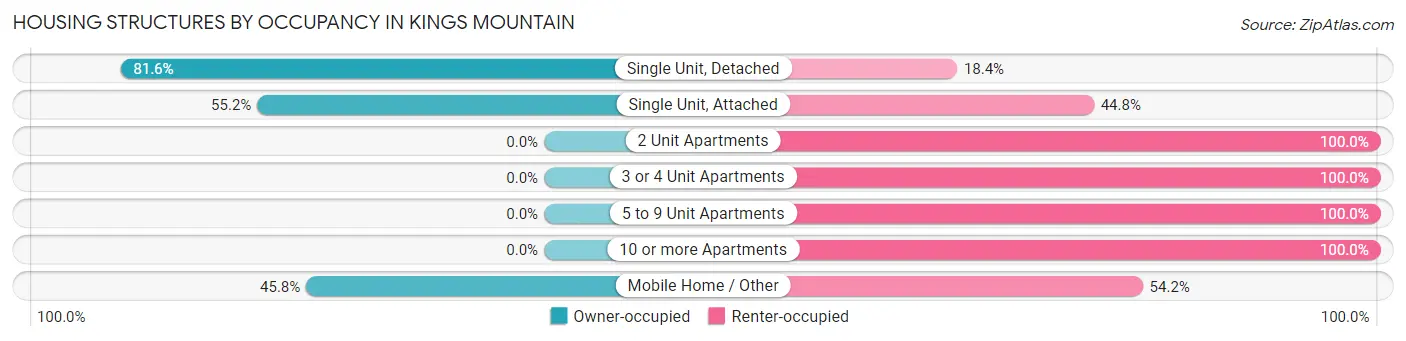
| Structure Type | Owner-occupied | Renter-occupied |
| Single Unit, Detached | 2,516 (81.6%) | 569 (18.4%) |
| Single Unit, Attached | 37 (55.2%) | 30 (44.8%) |
| 2 Unit Apartments | 0 (0.0%) | 207 (100.0%) |
| 3 or 4 Unit Apartments | 0 (0.0%) | 390 (100.0%) |
| 5 to 9 Unit Apartments | 0 (0.0%) | 184 (100.0%) |
| 10 or more Apartments | 0 (0.0%) | 120 (100.0%) |
| Mobile Home / Other | 60 (45.8%) | 71 (54.2%) |
| Total | 2,613 (62.5%) | 1,571 (37.6%) |
Housing Structures by Number of Rooms in Kings Mountain
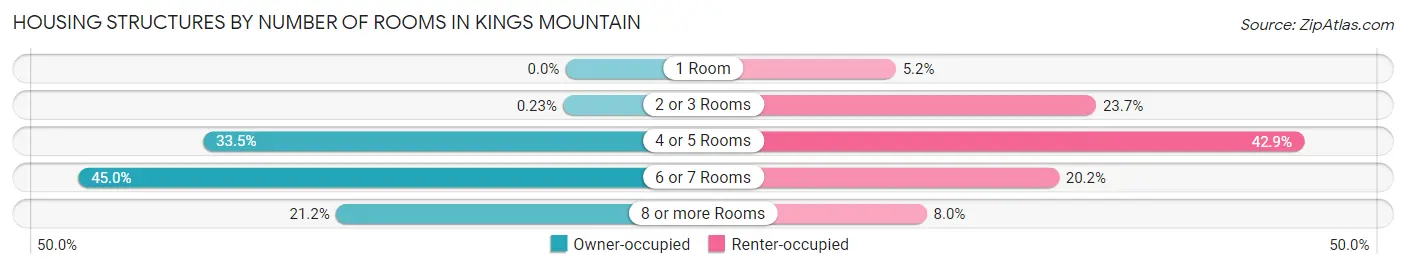
| Number of Rooms | Owner-occupied | Renter-occupied |
| 1 Room | 0 (0.0%) | 81 (5.2%) |
| 2 or 3 Rooms | 6 (0.2%) | 372 (23.7%) |
| 4 or 5 Rooms | 875 (33.5%) | 674 (42.9%) |
| 6 or 7 Rooms | 1,177 (45.0%) | 318 (20.2%) |
| 8 or more Rooms | 555 (21.2%) | 126 (8.0%) |
| Total | 2,613 (100.0%) | 1,571 (100.0%) |
Housing Structure by Heating Type in Kings Mountain
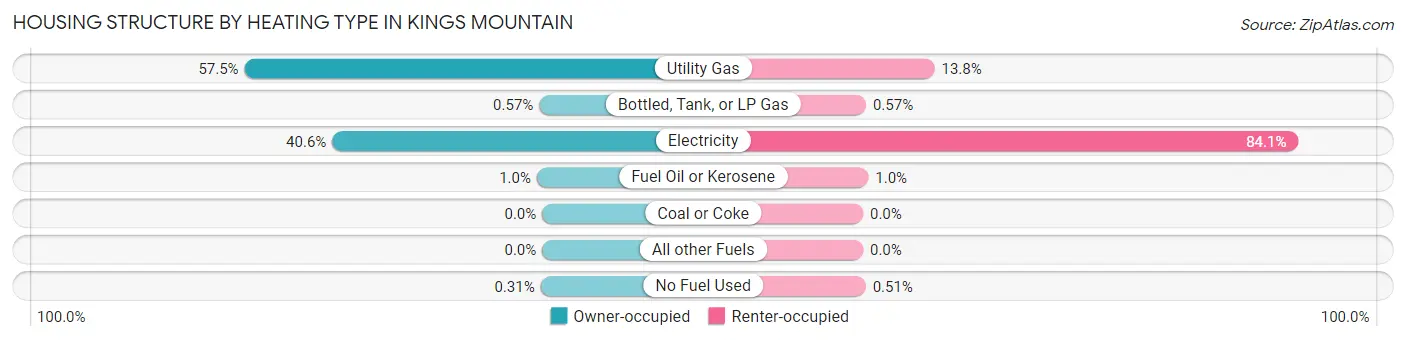
| Heating Type | Owner-occupied | Renter-occupied |
| Utility Gas | 1,503 (57.5%) | 217 (13.8%) |
| Bottled, Tank, or LP Gas | 15 (0.6%) | 9 (0.6%) |
| Electricity | 1,060 (40.6%) | 1,321 (84.1%) |
| Fuel Oil or Kerosene | 27 (1.0%) | 16 (1.0%) |
| Coal or Coke | 0 (0.0%) | 0 (0.0%) |
| All other Fuels | 0 (0.0%) | 0 (0.0%) |
| No Fuel Used | 8 (0.3%) | 8 (0.5%) |
| Total | 2,613 (100.0%) | 1,571 (100.0%) |
Household Vehicle Usage in Kings Mountain
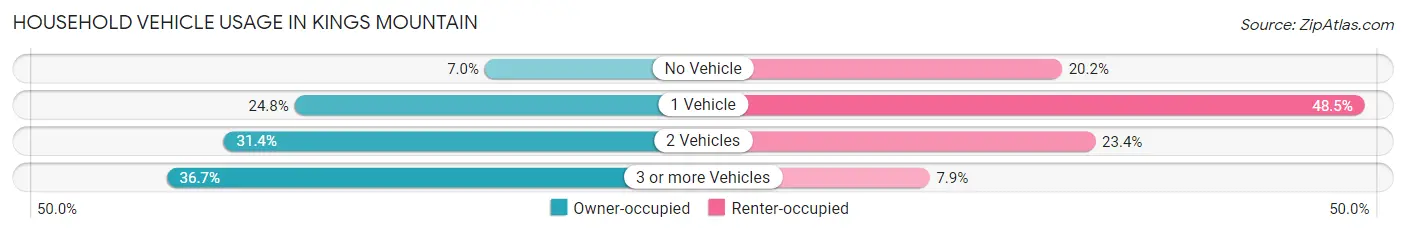
| Vehicles per Household | Owner-occupied | Renter-occupied |
| No Vehicle | 184 (7.0%) | 318 (20.2%) |
| 1 Vehicle | 648 (24.8%) | 762 (48.5%) |
| 2 Vehicles | 821 (31.4%) | 367 (23.4%) |
| 3 or more Vehicles | 960 (36.7%) | 124 (7.9%) |
| Total | 2,613 (100.0%) | 1,571 (100.0%) |
Real Estate & Mortgages in Kings Mountain
Real Estate and Mortgage Overview in Kings Mountain
| Characteristic | Without Mortgage | With Mortgage |
| Housing Units | 1,560 | 1,053 |
| Median Property Value | $131,700 | $191,400 |
| Median Household Income | $61,638 | $272 |
| Monthly Housing Costs | $463 | $0 |
| Real Estate Taxes | $1,044 | $113 |
Property Value by Mortgage Status in Kings Mountain
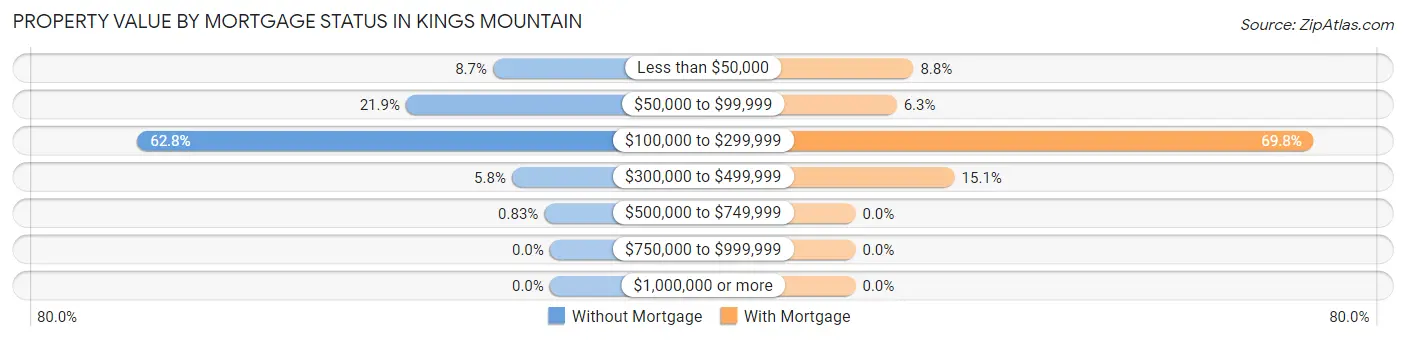
| Property Value | Without Mortgage | With Mortgage |
| Less than $50,000 | 135 (8.6%) | 93 (8.8%) |
| $50,000 to $99,999 | 342 (21.9%) | 66 (6.3%) |
| $100,000 to $299,999 | 980 (62.8%) | 735 (69.8%) |
| $300,000 to $499,999 | 90 (5.8%) | 159 (15.1%) |
| $500,000 to $749,999 | 13 (0.8%) | 0 (0.0%) |
| $750,000 to $999,999 | 0 (0.0%) | 0 (0.0%) |
| $1,000,000 or more | 0 (0.0%) | 0 (0.0%) |
| Total | 1,560 (100.0%) | 1,053 (100.0%) |
Household Income by Mortgage Status in Kings Mountain
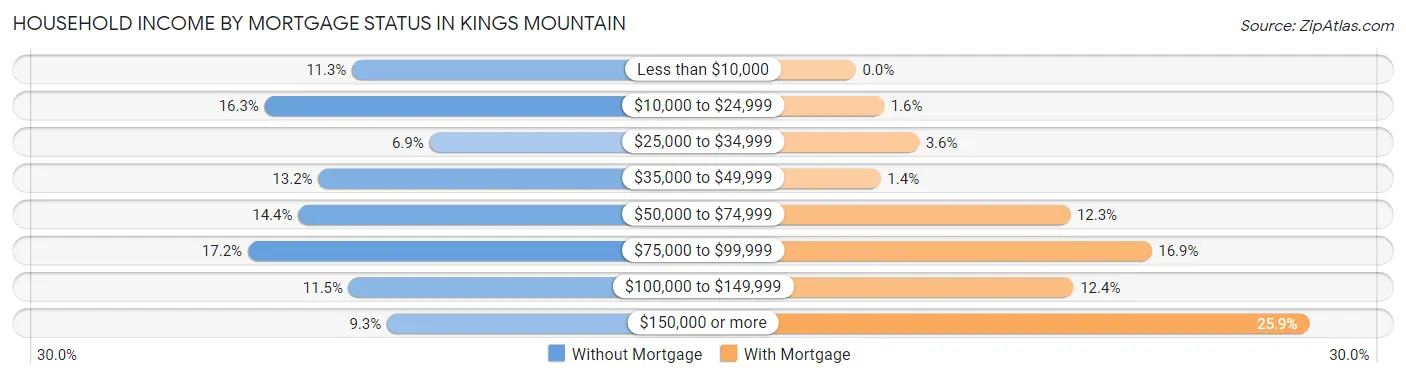
| Household Income | Without Mortgage | With Mortgage |
| Less than $10,000 | 176 (11.3%) | 0 (0.0%) |
| $10,000 to $24,999 | 254 (16.3%) | 17 (1.6%) |
| $25,000 to $34,999 | 107 (6.9%) | 38 (3.6%) |
| $35,000 to $49,999 | 206 (13.2%) | 15 (1.4%) |
| $50,000 to $74,999 | 224 (14.4%) | 129 (12.2%) |
| $75,000 to $99,999 | 269 (17.2%) | 178 (16.9%) |
| $100,000 to $149,999 | 179 (11.5%) | 131 (12.4%) |
| $150,000 or more | 145 (9.3%) | 273 (25.9%) |
| Total | 1,560 (100.0%) | 1,053 (100.0%) |
Property Value to Household Income Ratio in Kings Mountain
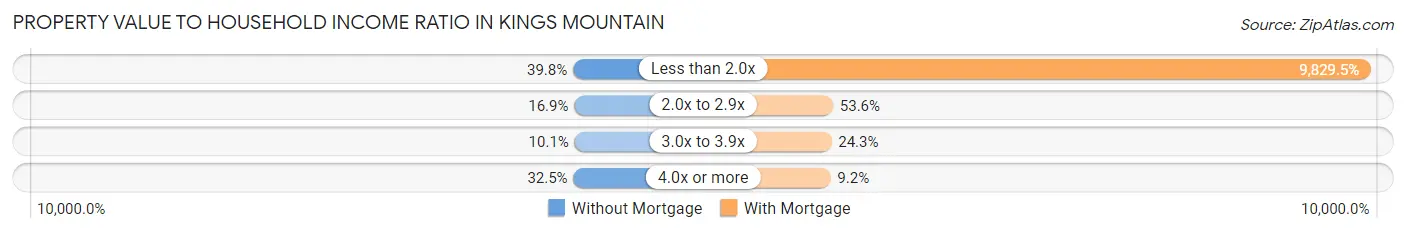
| Value-to-Income Ratio | Without Mortgage | With Mortgage |
| Less than 2.0x | 621 (39.8%) | 103,505 (9,829.5%) |
| 2.0x to 2.9x | 263 (16.9%) | 564 (53.6%) |
| 3.0x to 3.9x | 157 (10.1%) | 256 (24.3%) |
| 4.0x or more | 507 (32.5%) | 97 (9.2%) |
| Total | 1,560 (100.0%) | 1,053 (100.0%) |
Real Estate Taxes by Mortgage Status in Kings Mountain
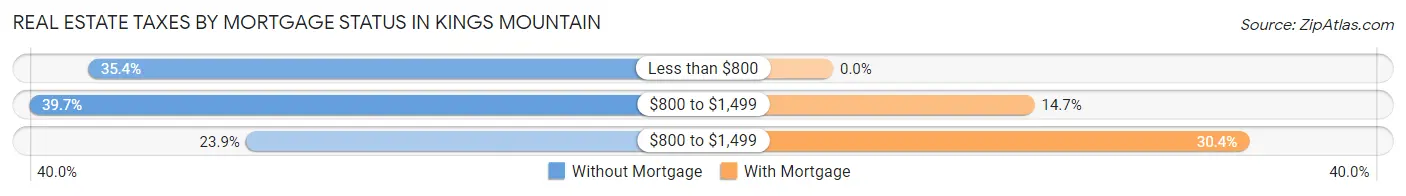
| Property Taxes | Without Mortgage | With Mortgage |
| Less than $800 | 552 (35.4%) | 0 (0.0%) |
| $800 to $1,499 | 619 (39.7%) | 155 (14.7%) |
| $800 to $1,499 | 372 (23.8%) | 320 (30.4%) |
| Total | 1,560 (100.0%) | 1,053 (100.0%) |
Health & Disability in Kings Mountain
Health Insurance Coverage by Age in Kings Mountain
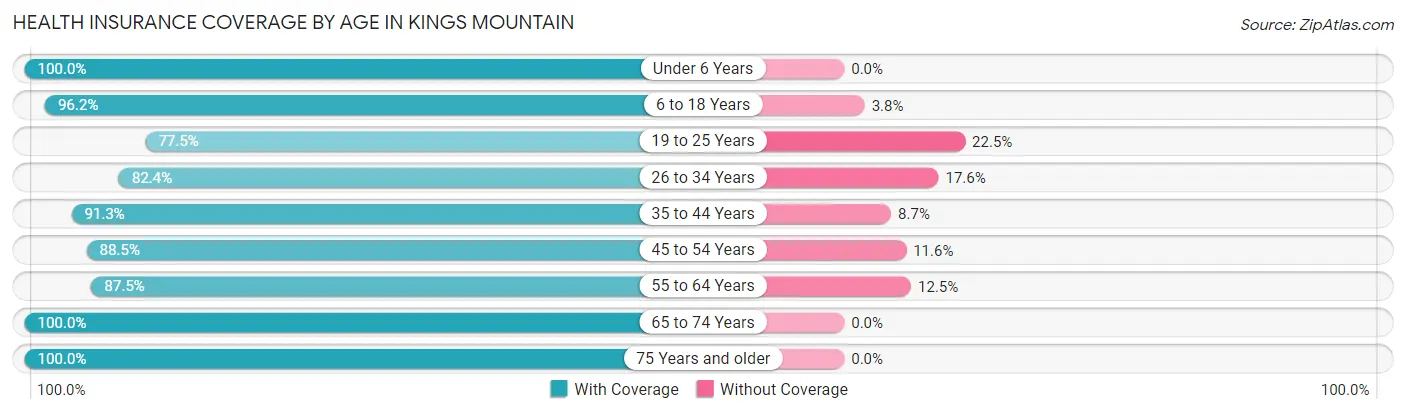
| Age Bracket | With Coverage | Without Coverage |
| Under 6 Years | 889 (100.0%) | 0 (0.0%) |
| 6 to 18 Years | 1,820 (96.2%) | 72 (3.8%) |
| 19 to 25 Years | 725 (77.5%) | 211 (22.5%) |
| 26 to 34 Years | 971 (82.4%) | 207 (17.6%) |
| 35 to 44 Years | 1,107 (91.3%) | 106 (8.7%) |
| 45 to 54 Years | 1,080 (88.4%) | 141 (11.6%) |
| 55 to 64 Years | 1,574 (87.5%) | 224 (12.5%) |
| 65 to 74 Years | 1,044 (100.0%) | 0 (0.0%) |
| 75 Years and older | 891 (100.0%) | 0 (0.0%) |
| Total | 10,101 (91.3%) | 961 (8.7%) |
Health Insurance Coverage by Citizenship Status in Kings Mountain
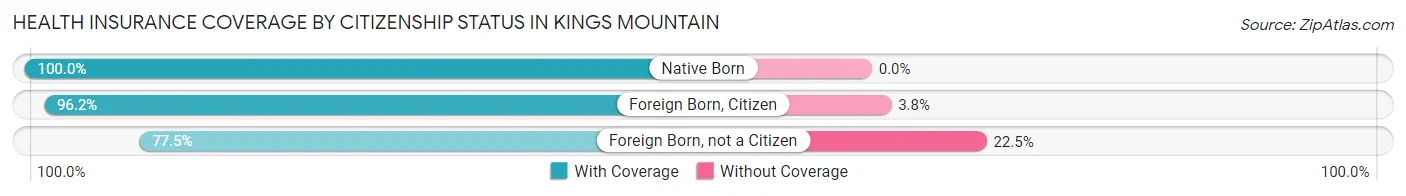
| Citizenship Status | With Coverage | Without Coverage |
| Native Born | 889 (100.0%) | 0 (0.0%) |
| Foreign Born, Citizen | 1,820 (96.2%) | 72 (3.8%) |
| Foreign Born, not a Citizen | 725 (77.5%) | 211 (22.5%) |
Health Insurance Coverage by Household Income in Kings Mountain
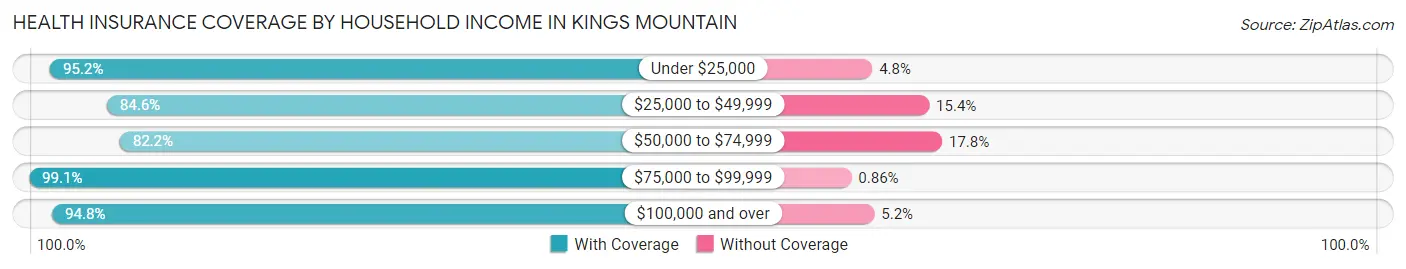
| Household Income | With Coverage | Without Coverage |
| Under $25,000 | 2,480 (95.2%) | 124 (4.8%) |
| $25,000 to $49,999 | 2,318 (84.6%) | 423 (15.4%) |
| $50,000 to $74,999 | 1,156 (82.2%) | 251 (17.8%) |
| $75,000 to $99,999 | 1,383 (99.1%) | 12 (0.9%) |
| $100,000 and over | 2,754 (94.8%) | 150 (5.2%) |
Public vs Private Health Insurance Coverage by Age in Kings Mountain
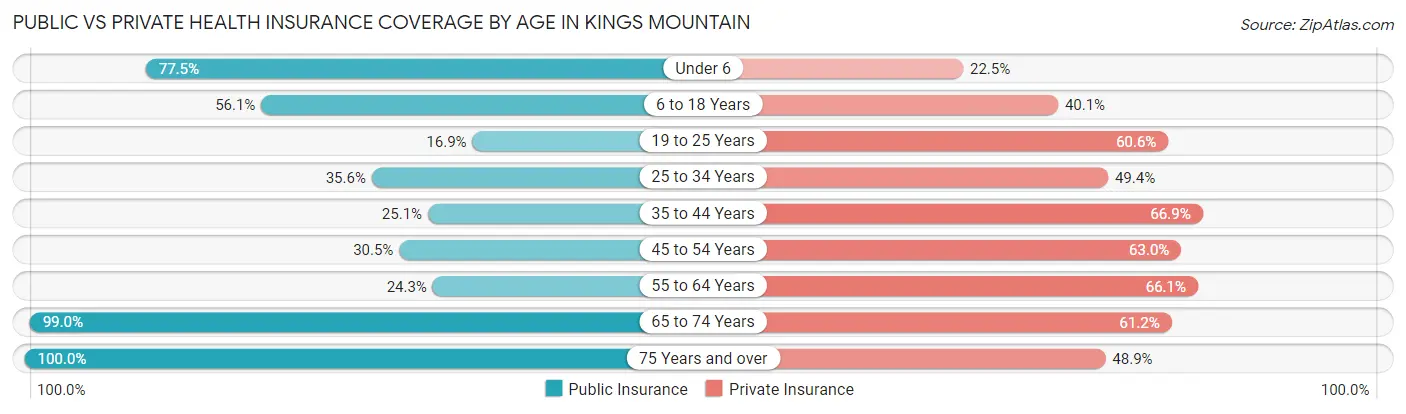
| Age Bracket | Public Insurance | Private Insurance |
| Under 6 | 689 (77.5%) | 200 (22.5%) |
| 6 to 18 Years | 1,061 (56.1%) | 759 (40.1%) |
| 19 to 25 Years | 158 (16.9%) | 567 (60.6%) |
| 25 to 34 Years | 419 (35.6%) | 582 (49.4%) |
| 35 to 44 Years | 305 (25.1%) | 812 (66.9%) |
| 45 to 54 Years | 372 (30.5%) | 769 (63.0%) |
| 55 to 64 Years | 436 (24.2%) | 1,188 (66.1%) |
| 65 to 74 Years | 1,034 (99.0%) | 639 (61.2%) |
| 75 Years and over | 891 (100.0%) | 436 (48.9%) |
| Total | 5,365 (48.5%) | 5,952 (53.8%) |
Disability Status by Sex by Age in Kings Mountain
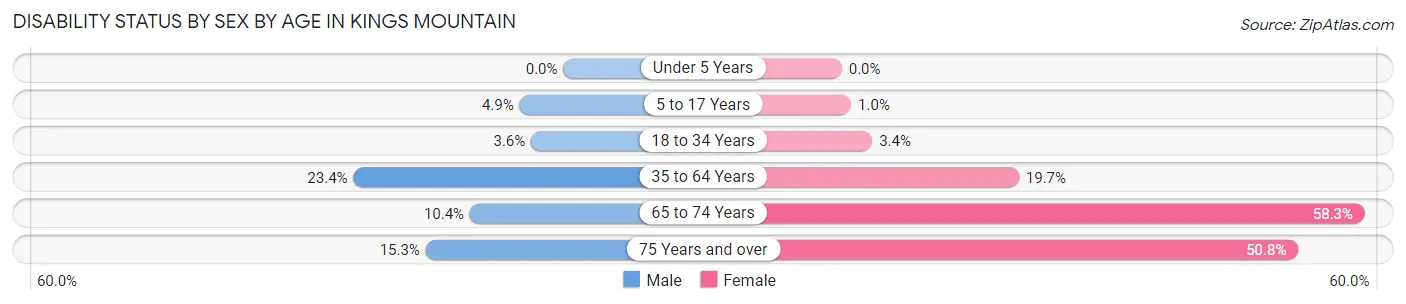
| Age Bracket | Male | Female |
| Under 5 Years | 0 (0.0%) | 0 (0.0%) |
| 5 to 17 Years | 44 (4.9%) | 11 (1.0%) |
| 18 to 34 Years | 41 (3.6%) | 35 (3.4%) |
| 35 to 64 Years | 464 (23.4%) | 443 (19.7%) |
| 65 to 74 Years | 55 (10.4%) | 300 (58.3%) |
| 75 Years and over | 44 (15.3%) | 307 (50.8%) |
Disability Class by Sex by Age in Kings Mountain
Disability Class: Hearing Difficulty
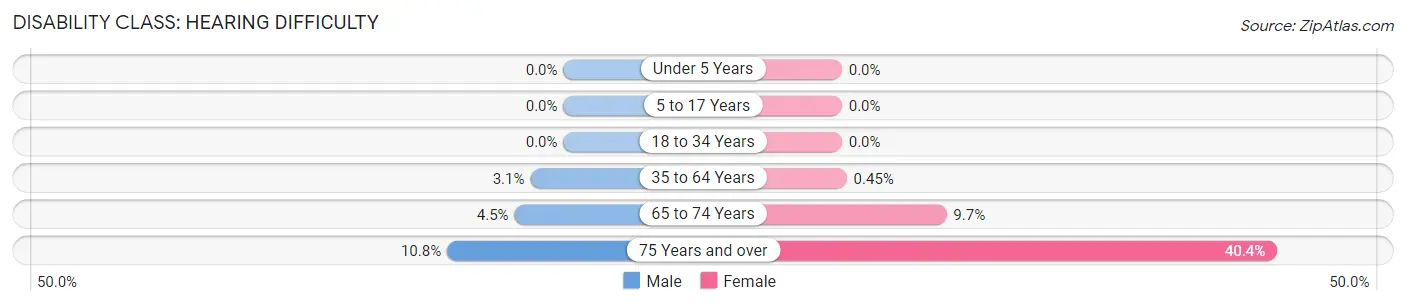
| Age Bracket | Male | Female |
| Under 5 Years | 0 (0.0%) | 0 (0.0%) |
| 5 to 17 Years | 0 (0.0%) | 0 (0.0%) |
| 18 to 34 Years | 0 (0.0%) | 0 (0.0%) |
| 35 to 64 Years | 61 (3.1%) | 10 (0.4%) |
| 65 to 74 Years | 24 (4.5%) | 50 (9.7%) |
| 75 Years and over | 31 (10.8%) | 244 (40.4%) |
Disability Class: Vision Difficulty
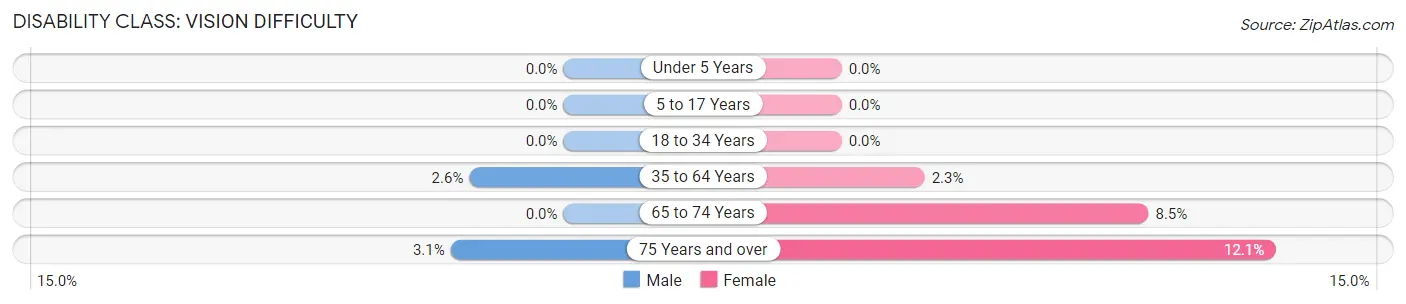
| Age Bracket | Male | Female |
| Under 5 Years | 0 (0.0%) | 0 (0.0%) |
| 5 to 17 Years | 0 (0.0%) | 0 (0.0%) |
| 18 to 34 Years | 0 (0.0%) | 0 (0.0%) |
| 35 to 64 Years | 52 (2.6%) | 52 (2.3%) |
| 65 to 74 Years | 0 (0.0%) | 44 (8.5%) |
| 75 Years and over | 9 (3.1%) | 73 (12.1%) |
Disability Class: Cognitive Difficulty
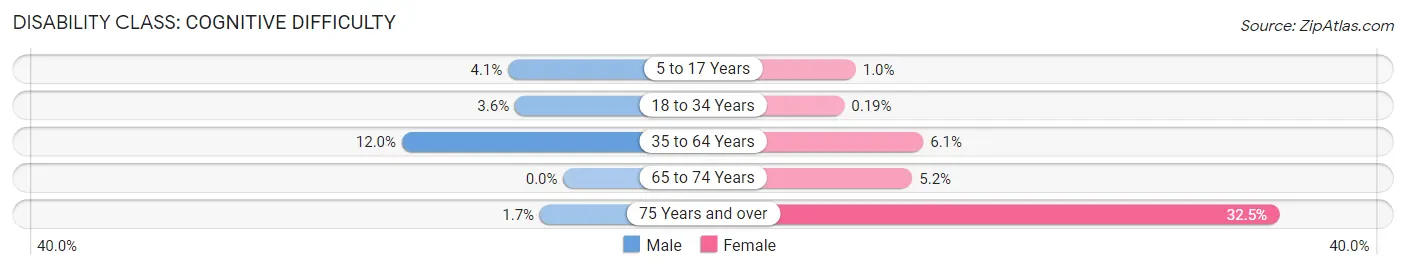
| Age Bracket | Male | Female |
| 5 to 17 Years | 37 (4.1%) | 11 (1.0%) |
| 18 to 34 Years | 41 (3.6%) | 2 (0.2%) |
| 35 to 64 Years | 238 (12.0%) | 136 (6.0%) |
| 65 to 74 Years | 0 (0.0%) | 27 (5.2%) |
| 75 Years and over | 5 (1.7%) | 196 (32.5%) |
Disability Class: Ambulatory Difficulty
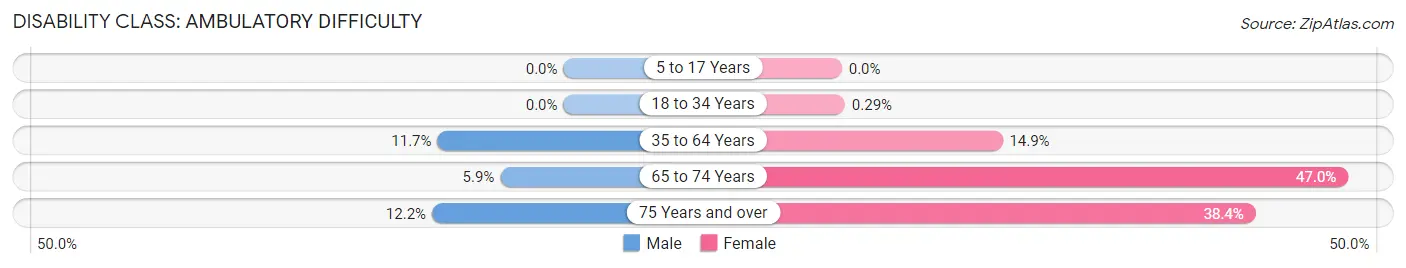
| Age Bracket | Male | Female |
| 5 to 17 Years | 0 (0.0%) | 0 (0.0%) |
| 18 to 34 Years | 0 (0.0%) | 3 (0.3%) |
| 35 to 64 Years | 232 (11.7%) | 335 (14.9%) |
| 65 to 74 Years | 31 (5.9%) | 242 (47.0%) |
| 75 Years and over | 35 (12.2%) | 232 (38.4%) |
Disability Class: Self-Care Difficulty
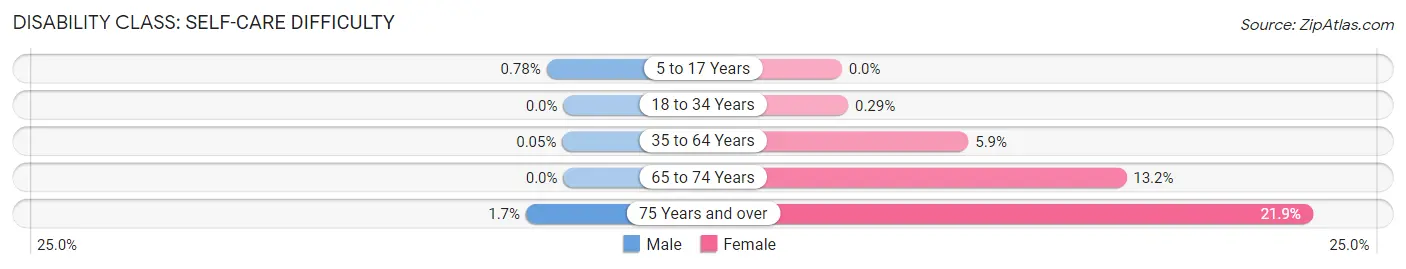
| Age Bracket | Male | Female |
| 5 to 17 Years | 7 (0.8%) | 0 (0.0%) |
| 18 to 34 Years | 0 (0.0%) | 3 (0.3%) |
| 35 to 64 Years | 1 (0.1%) | 132 (5.9%) |
| 65 to 74 Years | 0 (0.0%) | 68 (13.2%) |
| 75 Years and over | 5 (1.7%) | 132 (21.8%) |
Technology Access in Kings Mountain
Computing Device Access in Kings Mountain
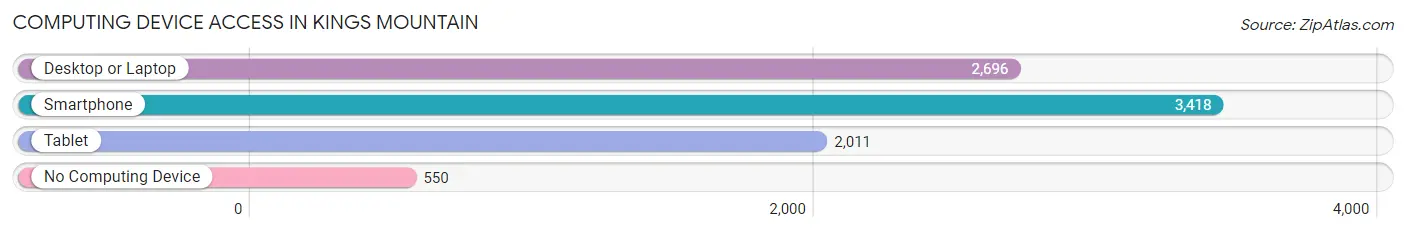
| Device Type | # Households | % Households |
| Desktop or Laptop | 2,696 | 64.4% |
| Smartphone | 3,418 | 81.7% |
| Tablet | 2,011 | 48.1% |
| No Computing Device | 550 | 13.2% |
| Total | 4,184 | 100.0% |
Internet Access in Kings Mountain
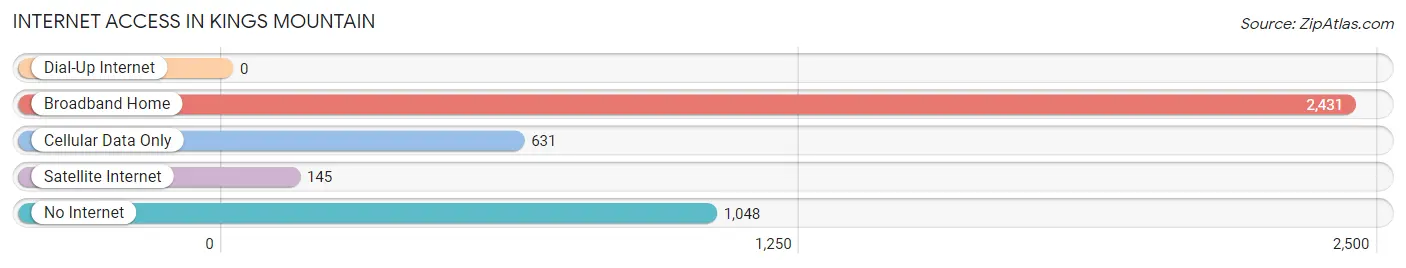
| Internet Type | # Households | % Households |
| Dial-Up Internet | 0 | 0.0% |
| Broadband Home | 2,431 | 58.1% |
| Cellular Data Only | 631 | 15.1% |
| Satellite Internet | 145 | 3.5% |
| No Internet | 1,048 | 25.1% |
| Total | 4,184 | 100.0% |
Kings Mountain Summary
History
Kilngs Mountain, North Carolina is a small city located in the foothills of the Appalachian Mountains in Cleveland County. The city was founded in 1790 by Revolutionary War veteran Major John Frohock, who named it after a nearby mountain. The city was incorporated in 1874 and has since grown to a population of approximately 10,000 people.
The city has a rich history that dates back to the Revolutionary War. During the war, the area was the site of a major battle between the British and American forces. The Battle of Kings Mountain was a decisive victory for the Americans, and it helped turn the tide of the war in their favor.
The city has also been home to several notable figures throughout its history. The most famous of these is the Reverend Billy Graham, who was born in the city in 1918. Graham went on to become one of the most influential religious figures of the 20th century.
Geography
Kings Mountain is located in the foothills of the Appalachian Mountains in Cleveland County, North Carolina. The city is situated at the intersection of Interstate 85 and US Highway 74, making it easily accessible from Charlotte and other nearby cities.
The city is located in a hilly region, with the Kings Mountain National Military Park located nearby. The park is home to a number of historic sites, including the site of the Battle of Kings Mountain.
The city is also home to a number of parks and recreational areas, including Kings Mountain State Park, Kings Mountain National Military Park, and Crowders Mountain State Park.
Economy
The economy of Kings Mountain is largely based on manufacturing and retail. The city is home to several large manufacturing companies, including Kings Mountain Industries, which produces textiles and apparel. Other major employers in the city include Walmart, Lowe’s, and Duke Energy.
The city is also home to a number of small businesses, including restaurants, shops, and other services. The city is also home to a number of educational institutions, including Cleveland Community College and Gardner-Webb University.
Demographics
As of the 2010 census, the population of Kings Mountain was 10,296. The racial makeup of the city was 79.3% White, 15.3% African American, 0.4% Native American, 0.7% Asian, 0.1% Pacific Islander, and 3.2% from other races. Hispanic or Latino of any race were 4.2% of the population.
The median household income in the city was $37,945, and the median family income was $45,945. The per capita income for the city was $20,845. About 16.2% of the population was below the poverty line.
Conclusion
Kings Mountain, North Carolina is a small city located in the foothills of the Appalachian Mountains in Cleveland County. The city has a rich history that dates back to the Revolutionary War, and it is home to a number of notable figures, including the Reverend Billy Graham. The economy of the city is largely based on manufacturing and retail, and it is home to a number of parks and recreational areas. The population of the city is approximately 10,000 people, and the median household income is $37,945.
Common Questions
What is Per Capita Income in Kings Mountain?
Per Capita income in Kings Mountain is $26,335.
What is the Median Family Income in Kings Mountain?
Median Family Income in Kings Mountain is $59,531.
What is the Median Household income in Kings Mountain?
Median Household Income in Kings Mountain is $45,301.
What is Income or Wage Gap in Kings Mountain?
Income or Wage Gap in Kings Mountain is 19.3%.
Women in Kings Mountain earn 80.7 cents for every dollar earned by a man.
What is Inequality or Gini Index in Kings Mountain?
Inequality or Gini Index in Kings Mountain is 0.49.
What is the Total Population of Kings Mountain?
Total Population of Kings Mountain is 11,246.
What is the Total Male Population of Kings Mountain?
Total Male Population of Kings Mountain is 5,279.
What is the Total Female Population of Kings Mountain?
Total Female Population of Kings Mountain is 5,967.
What is the Ratio of Males per 100 Females in Kings Mountain?
There are 88.47 Males per 100 Females in Kings Mountain.
What is the Ratio of Females per 100 Males in Kings Mountain?
There are 113.03 Females per 100 Males in Kings Mountain.
What is the Median Population Age in Kings Mountain?
Median Population Age in Kings Mountain is 41.5 Years.
What is the Average Family Size in Kings Mountain
Average Family Size in Kings Mountain is 3.4 People.
What is the Average Household Size in Kings Mountain
Average Household Size in Kings Mountain is 2.6 People.
How Large is the Labor Force in Kings Mountain?
There are 5,398 People in the Labor Forcein in Kings Mountain.
What is the Percentage of People in the Labor Force in Kings Mountain?
61.1% of People are in the Labor Force in Kings Mountain.
What is the Unemployment Rate in Kings Mountain?
Unemployment Rate in Kings Mountain is 6.8%.