Wakulla, NC Map & Demographics
Wakulla Map
Wakulla Overview
$16,217
PER CAPITA INCOME
0.42
INEQUALITY / GINI INDEX
147
TOTAL POPULATION
57
MALE POPULATION
90
FEMALE POPULATION
63.33
MALES / 100 FEMALES
157.89
FEMALES / 100 MALES
23.6
MEDIAN AGE
4.1
AVG FAMILY SIZE
2.6
AVG HOUSEHOLD SIZE
61
LABOR FORCE [ PEOPLE ]
62.2%
PERCENT IN LABOR FORCE
Income in Wakulla
Income Overview in Wakulla
| Characteristic | Number | Measure |
| Per Capita Income | 147 | $16,217 |
| Median Family Income | 25 | $0 |
| Mean Family Income | 25 | $0 |
| Median Household Income | 56 | $0 |
| Mean Household Income | 56 | $41,320 |
| Income Deficit | 25 | $0 |
| Wage / Income Gap (%) | 147 | 0.00% |
| Wage / Income Gap ($) | 147 | 100.00¢ per $1 |
| Gini / Inequality Index | 147 | 0.42 |
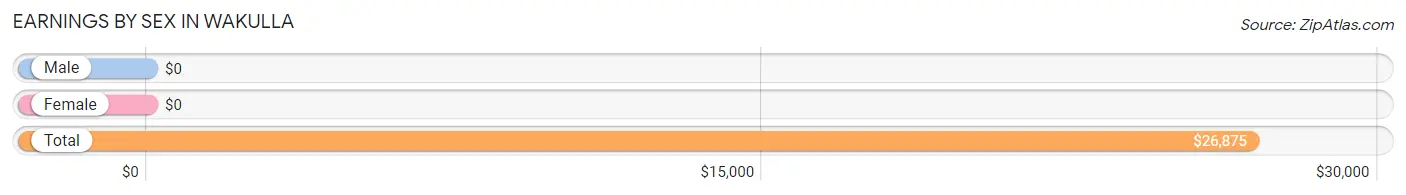
Earnings by Sex in Wakulla
| Sex | Number | Average Earnings |
| Male | 33 (48.5%) | $0 |
| Female | 35 (51.5%) | $0 |
| Total | 68 (100.0%) | $26,875 |
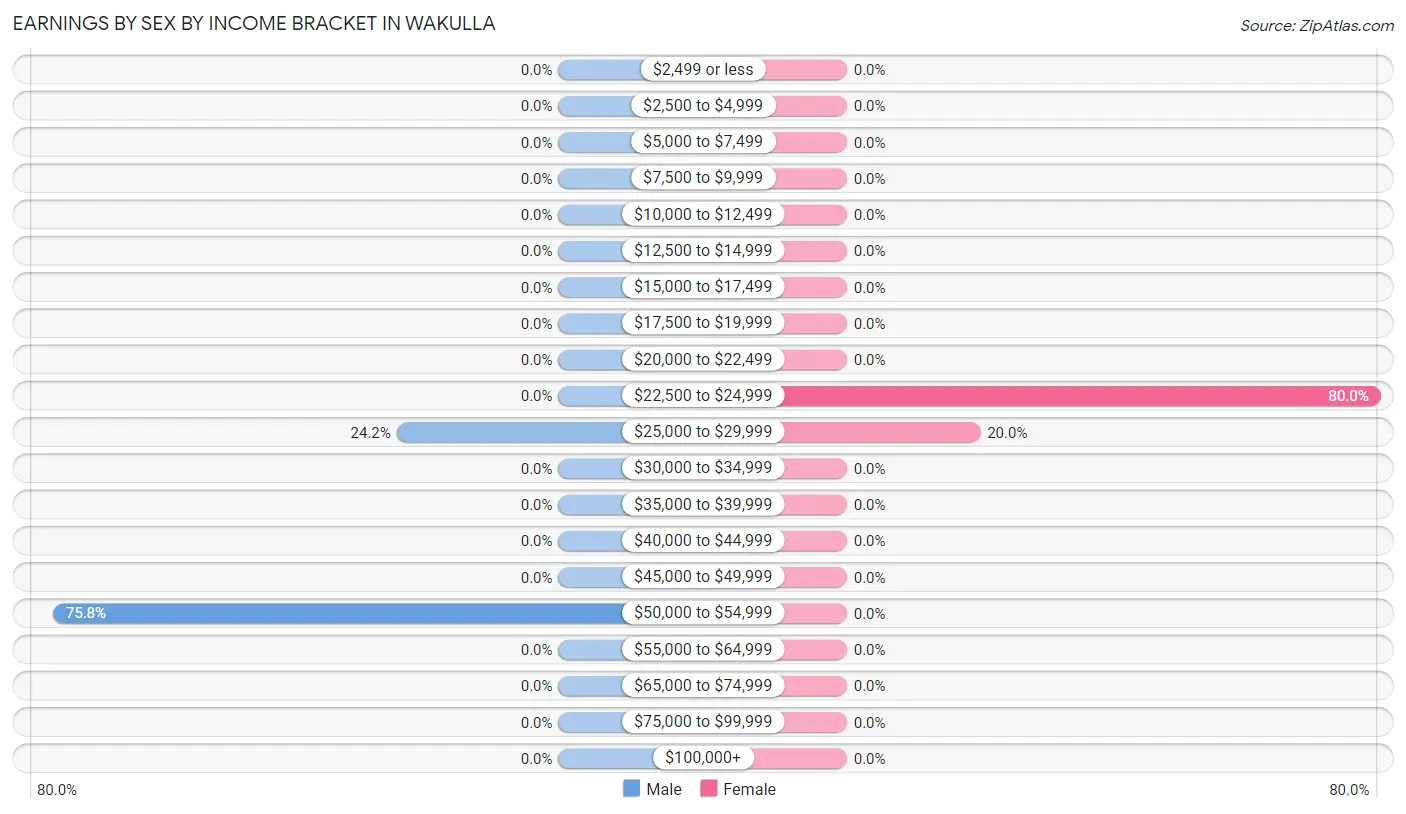
Earnings by Sex by Income Bracket in Wakulla
The most common earnings brackets in Wakulla are $50,000 to $54,999 for men (25 | 75.8%) and $22,500 to $24,999 for women (28 | 80.0%).
| Income | Male | Female |
| $2,499 or less | 0 (0.0%) | 0 (0.0%) |
| $2,500 to $4,999 | 0 (0.0%) | 0 (0.0%) |
| $5,000 to $7,499 | 0 (0.0%) | 0 (0.0%) |
| $7,500 to $9,999 | 0 (0.0%) | 0 (0.0%) |
| $10,000 to $12,499 | 0 (0.0%) | 0 (0.0%) |
| $12,500 to $14,999 | 0 (0.0%) | 0 (0.0%) |
| $15,000 to $17,499 | 0 (0.0%) | 0 (0.0%) |
| $17,500 to $19,999 | 0 (0.0%) | 0 (0.0%) |
| $20,000 to $22,499 | 0 (0.0%) | 0 (0.0%) |
| $22,500 to $24,999 | 0 (0.0%) | 28 (80.0%) |
| $25,000 to $29,999 | 8 (24.2%) | 7 (20.0%) |
| $30,000 to $34,999 | 0 (0.0%) | 0 (0.0%) |
| $35,000 to $39,999 | 0 (0.0%) | 0 (0.0%) |
| $40,000 to $44,999 | 0 (0.0%) | 0 (0.0%) |
| $45,000 to $49,999 | 0 (0.0%) | 0 (0.0%) |
| $50,000 to $54,999 | 25 (75.8%) | 0 (0.0%) |
| $55,000 to $64,999 | 0 (0.0%) | 0 (0.0%) |
| $65,000 to $74,999 | 0 (0.0%) | 0 (0.0%) |
| $75,000 to $99,999 | 0 (0.0%) | 0 (0.0%) |
| $100,000+ | 0 (0.0%) | 0 (0.0%) |
| Total | 33 (100.0%) | 35 (100.0%) |
Earnings by Sex by Educational Attainment in Wakulla
| Educational Attainment | Male Income | Female Income |
| Less than High School | - | - |
| High School Diploma | - | - |
| College or Associate's Degree | - | - |
| Bachelor's Degree | - | - |
| Graduate Degree | - | - |
| Total | - | - |
Family Income in Wakulla
Family Income Brackets in Wakulla
According to the Wakulla family income data, there are 25 families falling into the $75,000 to $99,999 income range, which is the most common income bracket and makes up 100.0% of all families.
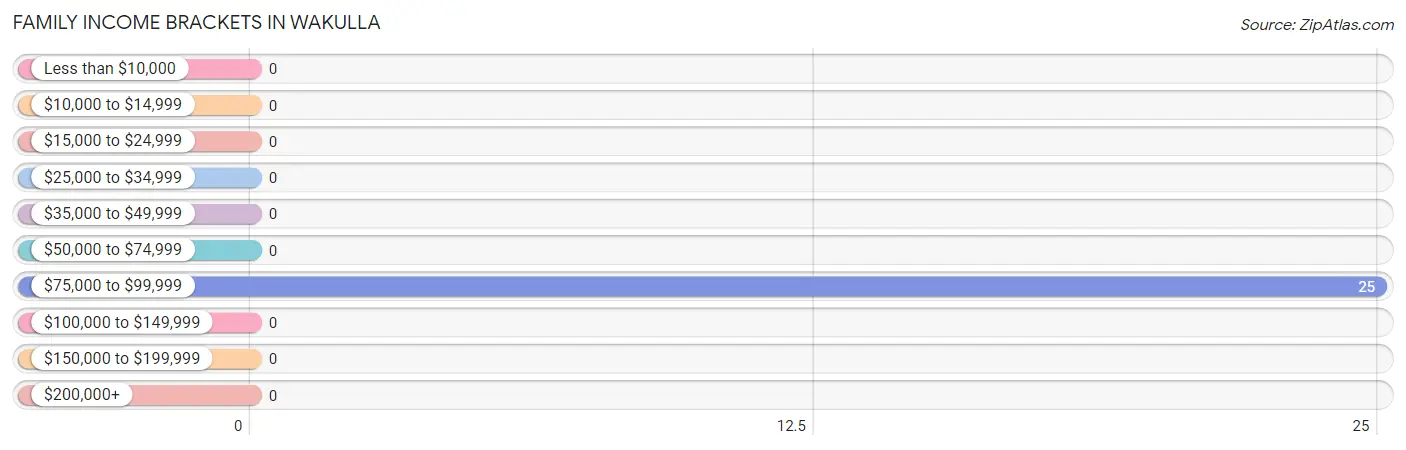
| Income Bracket | # Families | % Families |
| Less than $10,000 | 0 | 0.0% |
| $10,000 to $14,999 | 0 | 0.0% |
| $15,000 to $24,999 | 0 | 0.0% |
| $25,000 to $34,999 | 0 | 0.0% |
| $35,000 to $49,999 | 0 | 0.0% |
| $50,000 to $74,999 | 0 | 0.0% |
| $75,000 to $99,999 | 25 | 100.0% |
| $100,000 to $149,999 | 0 | 0.0% |
| $150,000 to $199,999 | 0 | 0.0% |
| $200,000+ | 0 | 0.0% |
Family Income by Famaliy Size in Wakulla
| Income Bracket | # Families | Median Income |
| 2-Person Families | 0 (0.0%) | $0 |
| 3-Person Families | 0 (0.0%) | $0 |
| 4-Person Families | 25 (100.0%) | $0 |
| 5-Person Families | 0 (0.0%) | $0 |
| 6-Person Families | 0 (0.0%) | $0 |
| 7+ Person Families | 0 (0.0%) | $0 |
| Total | 25 (100.0%) | $0 |
Family Income by Number of Earners in Wakulla
| Number of Earners | # Families | Median Income |
| No Earners | 0 (0.0%) | $0 |
| 1 Earner | 0 (0.0%) | $0 |
| 2 Earners | 25 (100.0%) | $0 |
| 3+ Earners | 0 (0.0%) | $0 |
| Total | 25 (100.0%) | $0 |
Household Income in Wakulla
Household Income Brackets in Wakulla
With 25 households falling in the category, the $75,000 to $99,999 income range is the most frequent in Wakulla, accounting for 44.6% of all households.
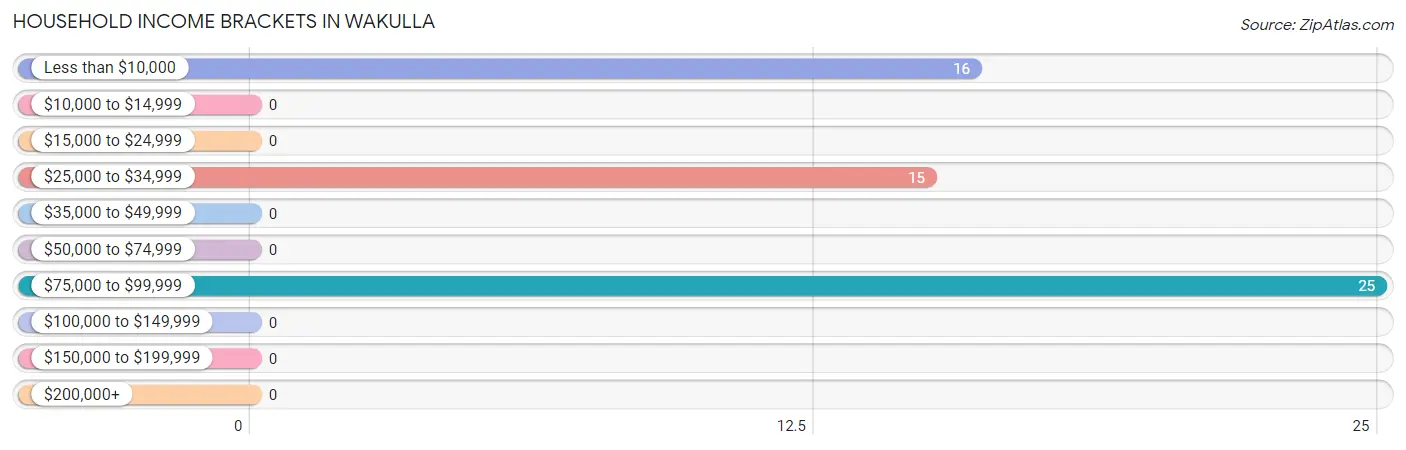
| Income Bracket | # Households | % Households |
| Less than $10,000 | 16 | 28.6% |
| $10,000 to $14,999 | 0 | 0.0% |
| $15,000 to $24,999 | 0 | 0.0% |
| $25,000 to $34,999 | 15 | 26.8% |
| $35,000 to $49,999 | 0 | 0.0% |
| $50,000 to $74,999 | 0 | 0.0% |
| $75,000 to $99,999 | 25 | 44.6% |
| $100,000 to $149,999 | 0 | 0.0% |
| $150,000 to $199,999 | 0 | 0.0% |
| $200,000+ | 0 | 0.0% |
Household Income by Householder Age in Wakulla
| Income Bracket | # Households | Median Income |
| 15 to 24 Years | 16 (28.6%) | $0 |
| 25 to 44 Years | 25 (44.6%) | $0 |
| 45 to 64 Years | 7 (12.5%) | $0 |
| 65+ Years | 8 (14.3%) | $0 |
| Total | 56 (100.0%) | $0 |
Poverty in Wakulla
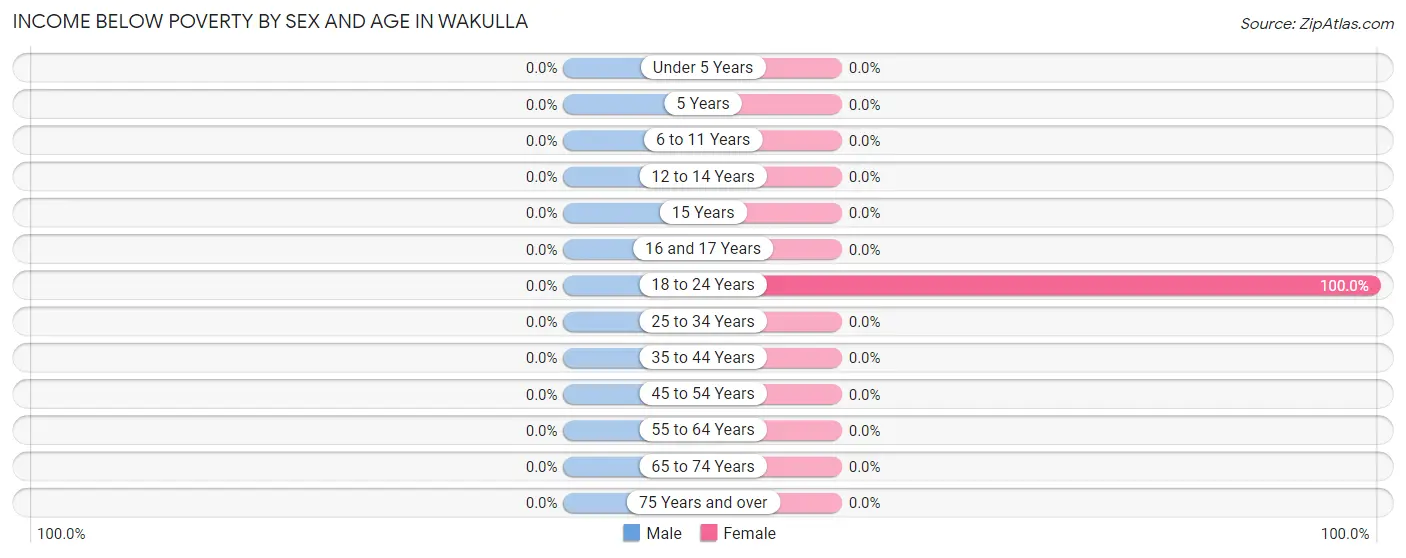
Income Below Poverty by Sex and Age in Wakulla
| Age Bracket | Male | Female |
| Under 5 Years | 0 (0.0%) | 0 (0.0%) |
| 5 Years | 0 (0.0%) | 0 (0.0%) |
| 6 to 11 Years | 0 (0.0%) | 0 (0.0%) |
| 12 to 14 Years | 0 (0.0%) | 0 (0.0%) |
| 15 Years | 0 (0.0%) | 0 (0.0%) |
| 16 and 17 Years | 0 (0.0%) | 0 (0.0%) |
| 18 to 24 Years | 0 (0.0%) | 30 (100.0%) |
| 25 to 34 Years | 0 (0.0%) | 0 (0.0%) |
| 35 to 44 Years | 0 (0.0%) | 0 (0.0%) |
| 45 to 54 Years | 0 (0.0%) | 0 (0.0%) |
| 55 to 64 Years | 0 (0.0%) | 0 (0.0%) |
| 65 to 74 Years | 0 (0.0%) | 0 (0.0%) |
| 75 Years and over | 0 (0.0%) | 0 (0.0%) |
| Total | 0 (0.0%) | 30 (33.3%) |
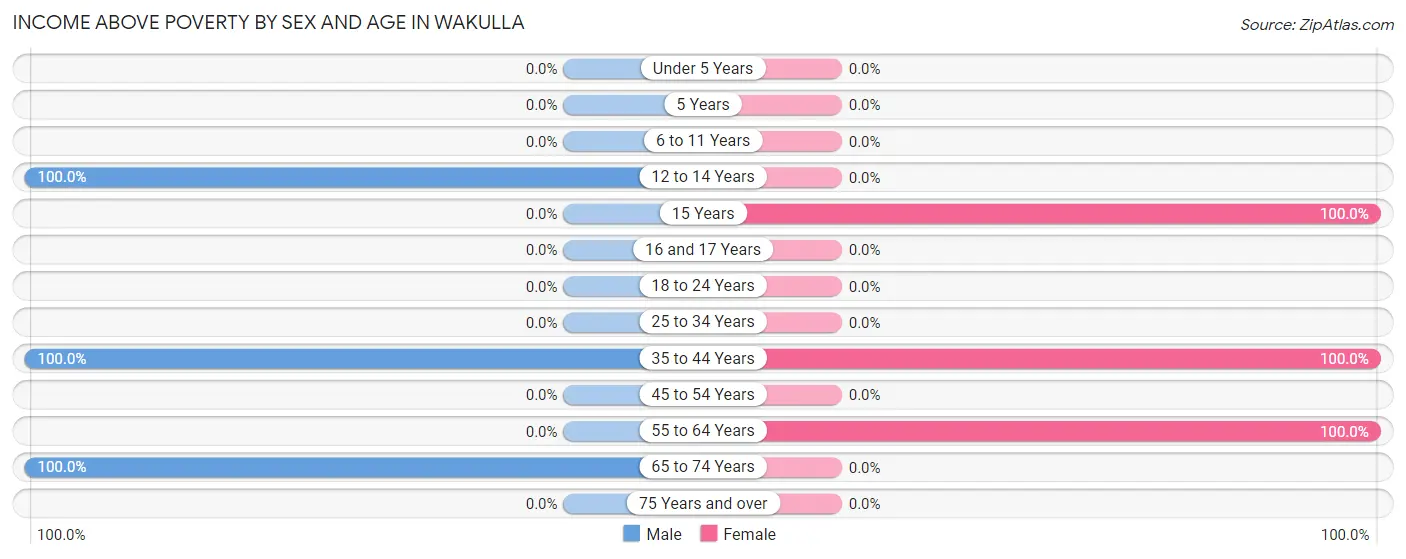
Income Above Poverty by Sex and Age in Wakulla
According to the poverty statistics in Wakulla, males aged 12 to 14 years and females aged 15 years are the age groups that are most secure financially, with 100.0% of males and 100.0% of females in these age groups living above the poverty line.
| Age Bracket | Male | Female |
| Under 5 Years | 0 (0.0%) | 0 (0.0%) |
| 5 Years | 0 (0.0%) | 0 (0.0%) |
| 6 to 11 Years | 0 (0.0%) | 0 (0.0%) |
| 12 to 14 Years | 24 (100.0%) | 0 (0.0%) |
| 15 Years | 0 (0.0%) | 25 (100.0%) |
| 16 and 17 Years | 0 (0.0%) | 0 (0.0%) |
| 18 to 24 Years | 0 (0.0%) | 0 (0.0%) |
| 25 to 34 Years | 0 (0.0%) | 0 (0.0%) |
| 35 to 44 Years | 25 (100.0%) | 28 (100.0%) |
| 45 to 54 Years | 0 (0.0%) | 0 (0.0%) |
| 55 to 64 Years | 0 (0.0%) | 7 (100.0%) |
| 65 to 74 Years | 8 (100.0%) | 0 (0.0%) |
| 75 Years and over | 0 (0.0%) | 0 (0.0%) |
| Total | 57 (100.0%) | 60 (66.7%) |
Income Below Poverty Among Married-Couple Families in Wakulla
| Children | Above Poverty | Below Poverty |
| No Children | 0 (0.0%) | 0 (0.0%) |
| 1 or 2 Children | 25 (100.0%) | 0 (0.0%) |
| 3 or 4 Children | 0 (0.0%) | 0 (0.0%) |
| 5 or more Children | 0 (0.0%) | 0 (0.0%) |
| Total | 25 (100.0%) | 0 (0.0%) |
Income Below Poverty Among Single-Parent Households in Wakulla
| Children | Single Father | Single Mother |
| No Children | 0 (0.0%) | 0 (0.0%) |
| 1 or 2 Children | 0 (0.0%) | 0 (0.0%) |
| 3 or 4 Children | 0 (0.0%) | 0 (0.0%) |
| 5 or more Children | 0 (0.0%) | 0 (0.0%) |
| Total | 0 (0.0%) | 0 (0.0%) |
Income Below Poverty Among Married-Couple vs Single-Parent Households in Wakulla
| Children | Married-Couple Families | Single-Parent Households |
| No Children | 0 (0.0%) | 0 (0.0%) |
| 1 or 2 Children | 0 (0.0%) | 0 (0.0%) |
| 3 or 4 Children | 0 (0.0%) | 0 (0.0%) |
| 5 or more Children | 0 (0.0%) | 0 (0.0%) |
| Total | 0 (0.0%) | 0 (0.0%) |
Race in Wakulla
The most populous races in Wakulla are Native / Alaskan (133 | 90.5%), and White / Caucasian (14 | 9.5%).
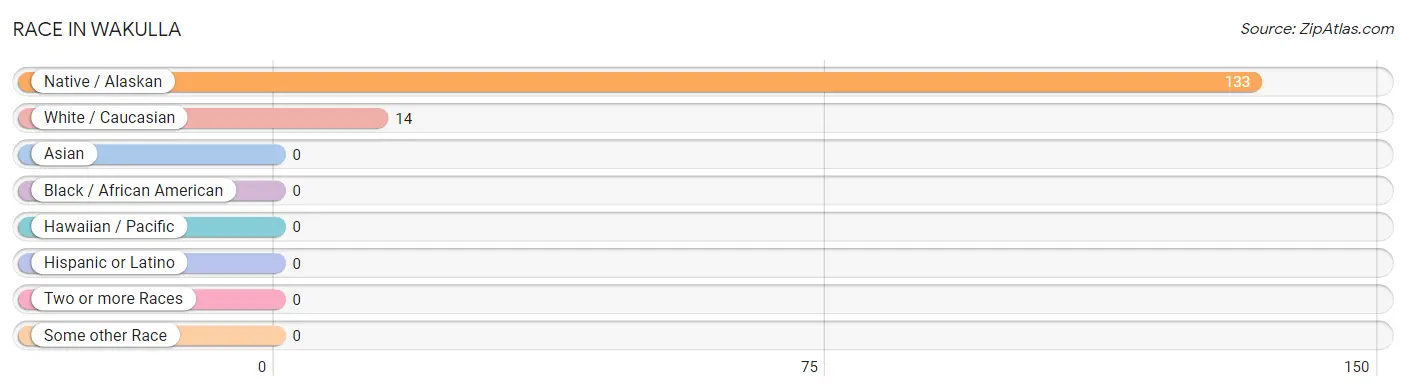
| Race | # Population | % Population |
| Asian | 0 | 0.0% |
| Black / African American | 0 | 0.0% |
| Hawaiian / Pacific | 0 | 0.0% |
| Hispanic or Latino | 0 | 0.0% |
| Native / Alaskan | 133 | 90.5% |
| White / Caucasian | 14 | 9.5% |
| Two or more Races | 0 | 0.0% |
| Some other Race | 0 | 0.0% |
| Total | 147 | 100.0% |
Ancestry in Wakulla
The most populous ancestries reported in Wakulla are , and Lumbee (117 | 79.6%), together accounting for 79.6% of all Wakulla residents.

| Ancestry | # Population | % Population |
| Lumbee | 117 | 79.6% | View All 1 Rows |
Immigrants in Wakulla

| Immigration Origin | # Population | % Population | View All 0 Rows |
Sex and Age in Wakulla
Sex and Age in Wakulla
The most populous age groups in Wakulla are 40 to 44 Years (25 | 43.9%) for men and 20 to 24 Years (30 | 33.3%) for women.
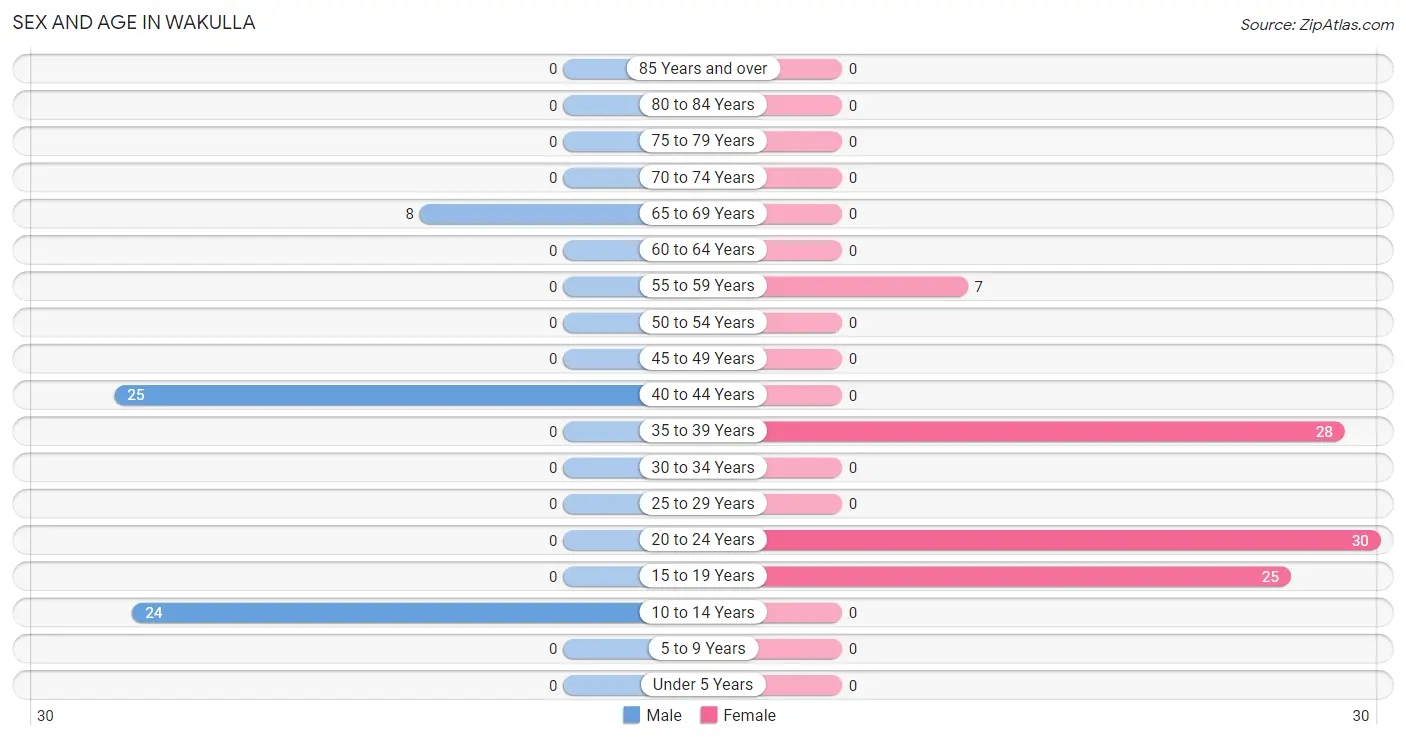
| Age Bracket | Male | Female |
| Under 5 Years | 0 (0.0%) | 0 (0.0%) |
| 5 to 9 Years | 0 (0.0%) | 0 (0.0%) |
| 10 to 14 Years | 24 (42.1%) | 0 (0.0%) |
| 15 to 19 Years | 0 (0.0%) | 25 (27.8%) |
| 20 to 24 Years | 0 (0.0%) | 30 (33.3%) |
| 25 to 29 Years | 0 (0.0%) | 0 (0.0%) |
| 30 to 34 Years | 0 (0.0%) | 0 (0.0%) |
| 35 to 39 Years | 0 (0.0%) | 28 (31.1%) |
| 40 to 44 Years | 25 (43.9%) | 0 (0.0%) |
| 45 to 49 Years | 0 (0.0%) | 0 (0.0%) |
| 50 to 54 Years | 0 (0.0%) | 0 (0.0%) |
| 55 to 59 Years | 0 (0.0%) | 7 (7.8%) |
| 60 to 64 Years | 0 (0.0%) | 0 (0.0%) |
| 65 to 69 Years | 8 (14.0%) | 0 (0.0%) |
| 70 to 74 Years | 0 (0.0%) | 0 (0.0%) |
| 75 to 79 Years | 0 (0.0%) | 0 (0.0%) |
| 80 to 84 Years | 0 (0.0%) | 0 (0.0%) |
| 85 Years and over | 0 (0.0%) | 0 (0.0%) |
| Total | 57 (100.0%) | 90 (100.0%) |
Families and Households in Wakulla
Median Family Size in Wakulla

| Family Type | # Families | Family Size |
| Married-Couple | 25 (100.0%) | 4.08 |
| Single Male/Father | 0 (0.0%) | - |
| Single Female/Mother | 0 (0.0%) | - |
| Total Families | 25 (100.0%) | 4.08 |
Median Household Size in Wakulla
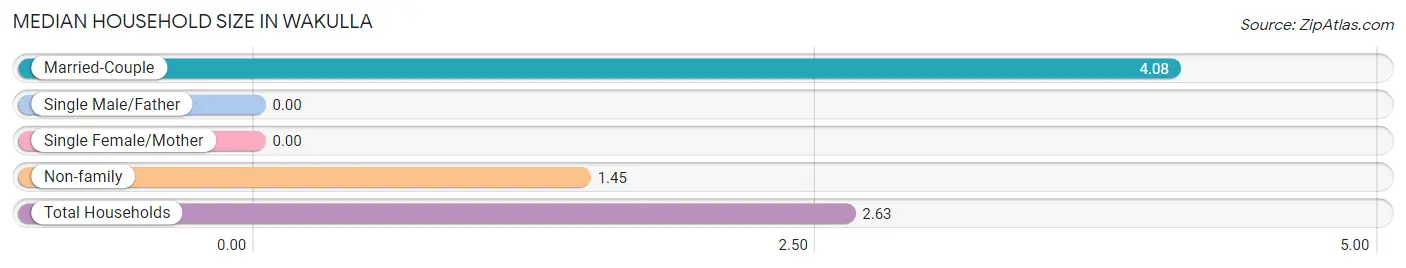
| Household Type | # Households | Household Size |
| Married-Couple | 25 (44.6%) | 4.08 |
| Single Male/Father | 0 (0.0%) | - |
| Single Female/Mother | 0 (0.0%) | - |
| Non-family | 31 (55.4%) | 1.45 |
| Total Households | 56 (100.0%) | 2.63 |
Household Size by Marriage Status in Wakulla
Out of a total of 56 households in Wakulla, 25 (44.6%) are family households, while 31 (55.4%) are nonfamily households. The most numerous type of family households are 4-person households, comprising 25, and the most common type of nonfamily households are 2-person households, comprising 16.
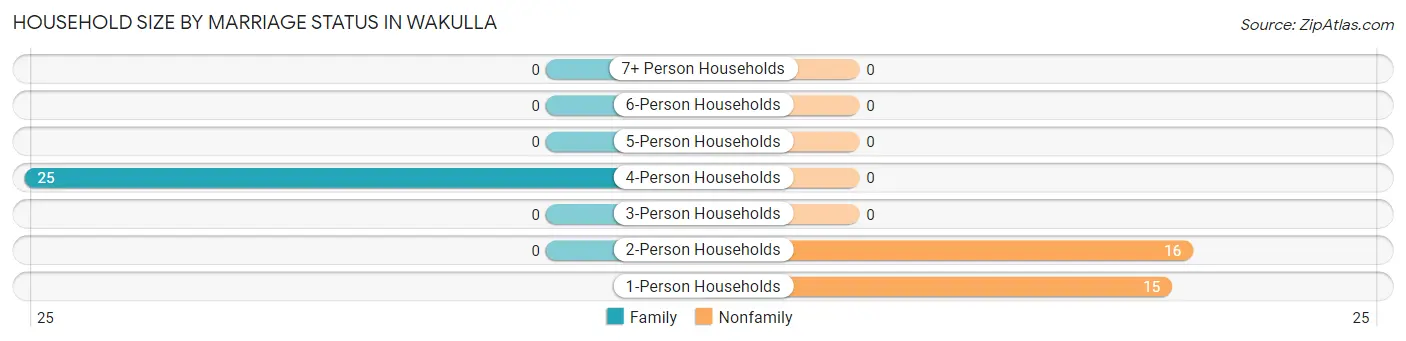
| Household Size | Family Households | Nonfamily Households |
| 1-Person Households | - | 15 (26.8%) |
| 2-Person Households | 0 (0.0%) | 16 (28.6%) |
| 3-Person Households | 0 (0.0%) | 0 (0.0%) |
| 4-Person Households | 25 (44.6%) | 0 (0.0%) |
| 5-Person Households | 0 (0.0%) | 0 (0.0%) |
| 6-Person Households | 0 (0.0%) | 0 (0.0%) |
| 7+ Person Households | 0 (0.0%) | 0 (0.0%) |
| Total | 25 (44.6%) | 31 (55.4%) |
Female Fertility in Wakulla
Fertility by Age in Wakulla
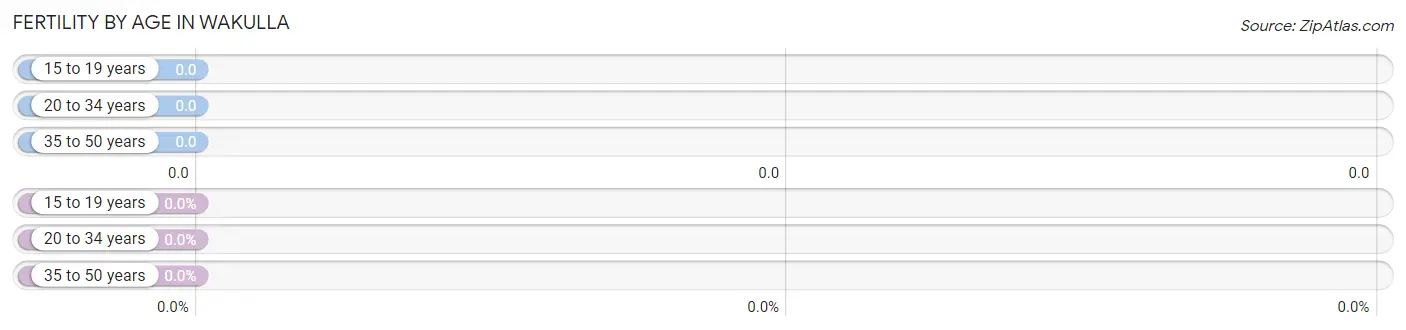
| Age Bracket | Women with Births | Births / 1,000 Women |
| 15 to 19 years | 0 (0.0%) | 0.0 |
| 20 to 34 years | 0 (0.0%) | 0.0 |
| 35 to 50 years | 0 (0.0%) | 0.0 |
| Total | 0 (0.0%) | 0.0 |
Fertility by Age by Marriage Status in Wakulla
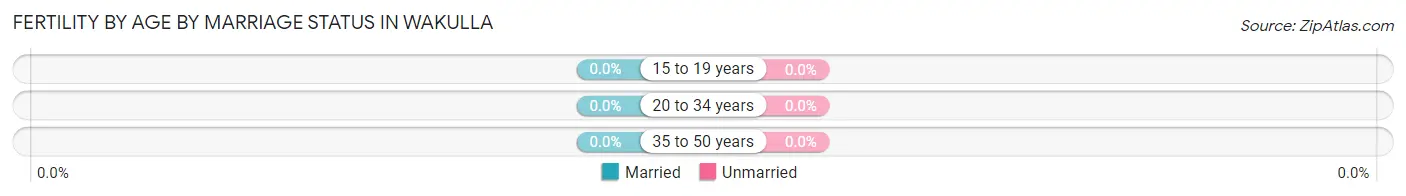
| Age Bracket | Married | Unmarried |
| 15 to 19 years | 0 (0.0%) | 0 (0.0%) |
| 20 to 34 years | 0 (0.0%) | 0 (0.0%) |
| 35 to 50 years | 0 (0.0%) | 0 (0.0%) |
| Total | 0 (0.0%) | 0 (0.0%) |
Fertility by Education in Wakulla
| Educational Attainment | Women with Births | Births / 1,000 Women |
| Less than High School | 0 (0.0%) | 0.0 |
| High School Diploma | 0 (0.0%) | 0.0 |
| College or Associate's Degree | 0 (0.0%) | 0.0 |
| Bachelor's Degree | 0 (0.0%) | 0.0 |
| Graduate Degree | 0 (0.0%) | 0.0 |
| Total | 0 (0.0%) | 0.0 |
Fertility by Education by Marriage Status in Wakulla
| Educational Attainment | Married | Unmarried |
| Less than High School | 0 (0.0%) | 0 (0.0%) |
| High School Diploma | 0 (0.0%) | 0 (0.0%) |
| College or Associate's Degree | 0 (0.0%) | 0 (0.0%) |
| Bachelor's Degree | 0 (0.0%) | 0 (0.0%) |
| Graduate Degree | 0 (0.0%) | 0 (0.0%) |
| Total | 0 (0.0%) | 0 (0.0%) |
Employment Characteristics in Wakulla
Employment by Class of Employer in Wakulla
Among the 61 employed individuals in Wakulla, , and private company employees (61 | 100.0%) make up the most common classes of employment.
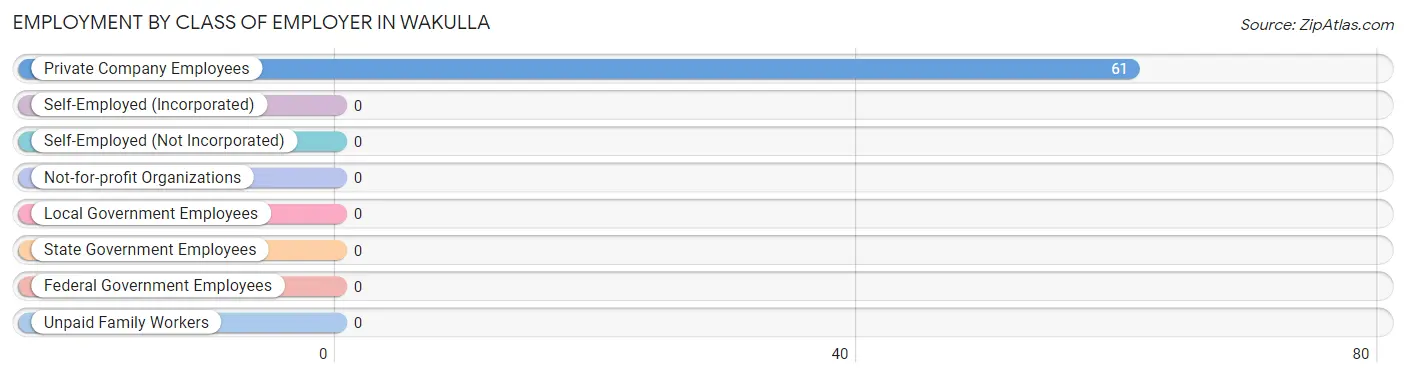
| Employer Class | # Employees | % Employees |
| Private Company Employees | 61 | 100.0% |
| Self-Employed (Incorporated) | 0 | 0.0% |
| Self-Employed (Not Incorporated) | 0 | 0.0% |
| Not-for-profit Organizations | 0 | 0.0% |
| Local Government Employees | 0 | 0.0% |
| State Government Employees | 0 | 0.0% |
| Federal Government Employees | 0 | 0.0% |
| Unpaid Family Workers | 0 | 0.0% |
| Total | 61 | 100.0% |
Employment Status by Age in Wakulla
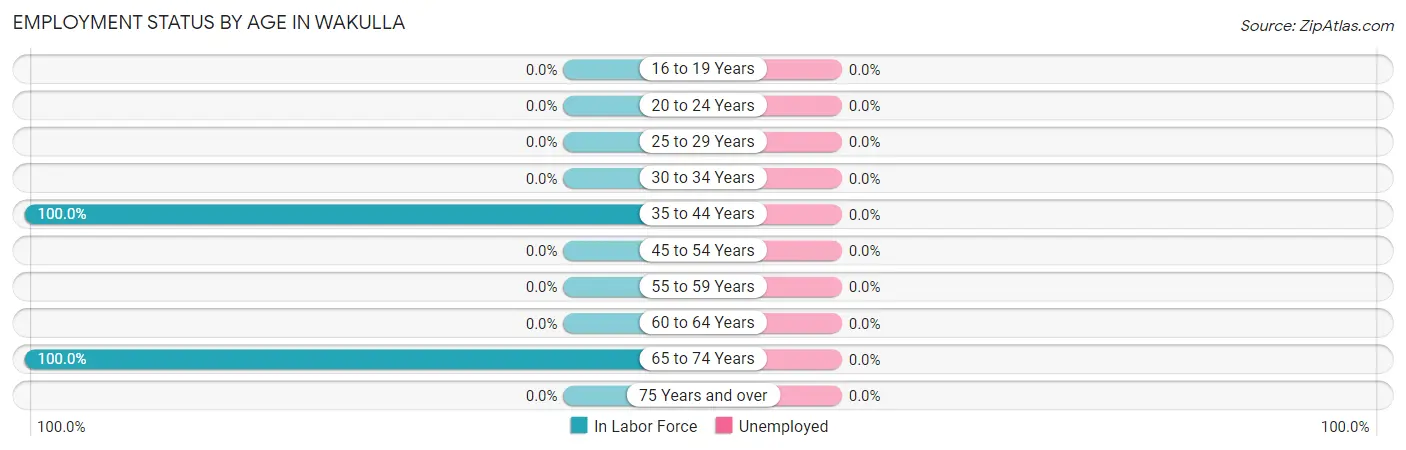
| Age Bracket | In Labor Force | Unemployed |
| 16 to 19 Years | 0 (0.0%) | 0 (0.0%) |
| 20 to 24 Years | 0 (0.0%) | 0 (0.0%) |
| 25 to 29 Years | 0 (0.0%) | 0 (0.0%) |
| 30 to 34 Years | 0 (0.0%) | 0 (0.0%) |
| 35 to 44 Years | 53 (100.0%) | 0 (0.0%) |
| 45 to 54 Years | 0 (0.0%) | 0 (0.0%) |
| 55 to 59 Years | 0 (0.0%) | 0 (0.0%) |
| 60 to 64 Years | 0 (0.0%) | 0 (0.0%) |
| 65 to 74 Years | 8 (100.0%) | 0 (0.0%) |
| 75 Years and over | 0 (0.0%) | 0 (0.0%) |
| Total | 61 (62.2%) | 0 (0.0%) |
Employment Status by Educational Attainment in Wakulla
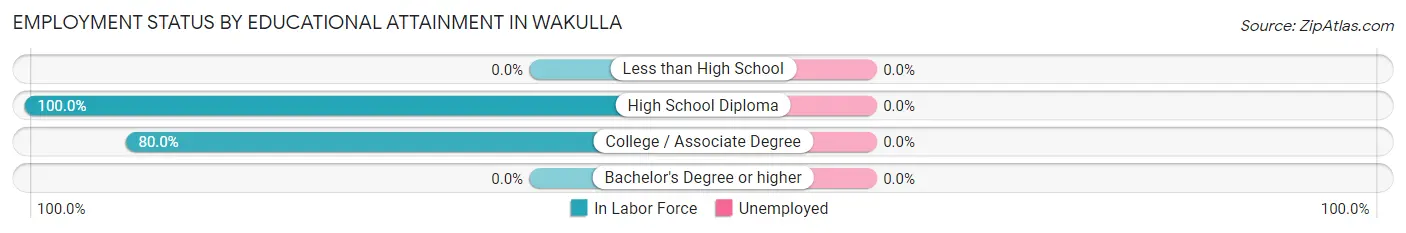
| Educational Attainment | In Labor Force | Unemployed |
| Less than High School | 0 (0.0%) | 0 (0.0%) |
| High School Diploma | 25 (100.0%) | 0 (0.0%) |
| College / Associate Degree | 28 (80.0%) | 0 (0.0%) |
| Bachelor's Degree or higher | 0 (0.0%) | 0 (0.0%) |
| Total | 53 (88.3%) | 0 (0.0%) |
Employment Occupations by Sex in Wakulla
Management, Business, Science and Arts Occupations
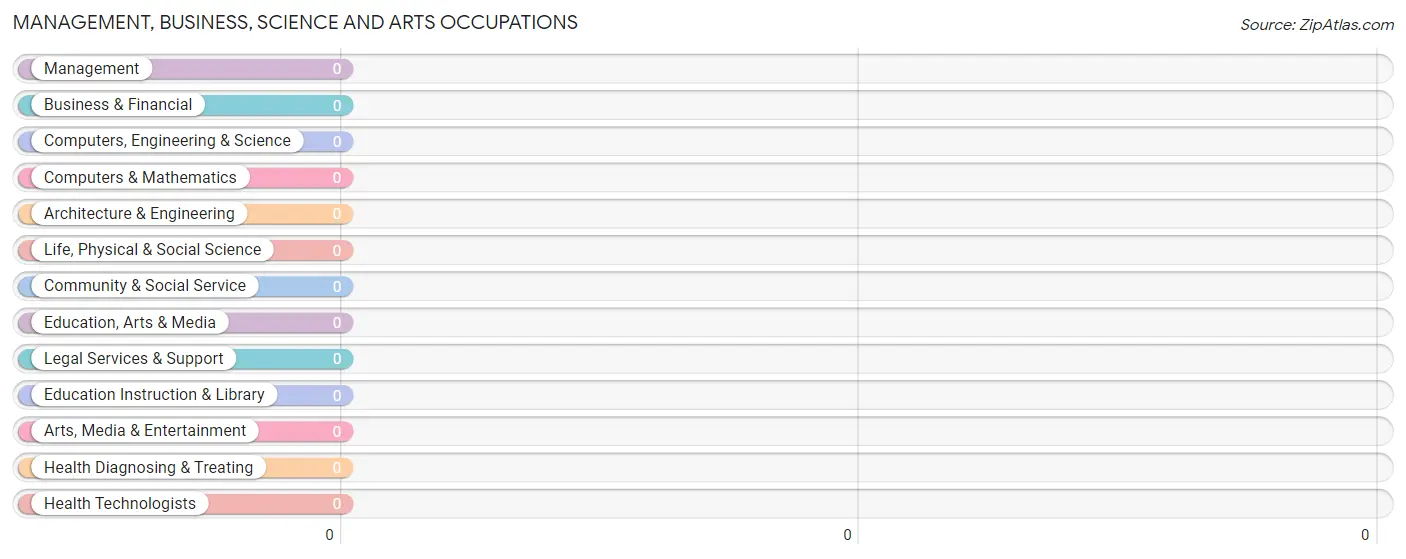
Management, Business, Science and Arts Occupations by Sex
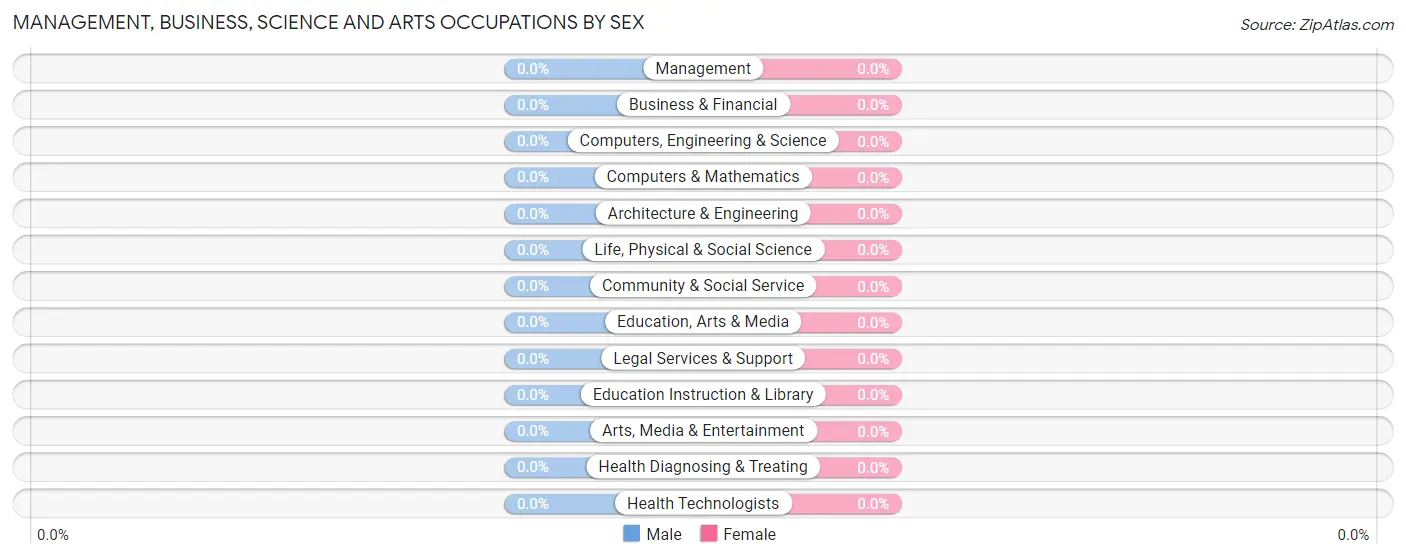
| Occupation | Male | Female |
| Management | 0 (0.0%) | 0 (0.0%) |
| Business & Financial | 0 (0.0%) | 0 (0.0%) |
| Computers, Engineering & Science | 0 (0.0%) | 0 (0.0%) |
| Computers & Mathematics | 0 (0.0%) | 0 (0.0%) |
| Architecture & Engineering | 0 (0.0%) | 0 (0.0%) |
| Life, Physical & Social Science | 0 (0.0%) | 0 (0.0%) |
| Community & Social Service | 0 (0.0%) | 0 (0.0%) |
| Education, Arts & Media | 0 (0.0%) | 0 (0.0%) |
| Legal Services & Support | 0 (0.0%) | 0 (0.0%) |
| Education Instruction & Library | 0 (0.0%) | 0 (0.0%) |
| Arts, Media & Entertainment | 0 (0.0%) | 0 (0.0%) |
| Health Diagnosing & Treating | 0 (0.0%) | 0 (0.0%) |
| Health Technologists | 0 (0.0%) | 0 (0.0%) |
| Total (Category) | 0 (0.0%) | 0 (0.0%) |
| Total (Overall) | 33 (54.1%) | 28 (45.9%) |
Services Occupations
The most common Services occupations in Wakulla are , and Cleaning & Maintenance (25 | 41.0%).
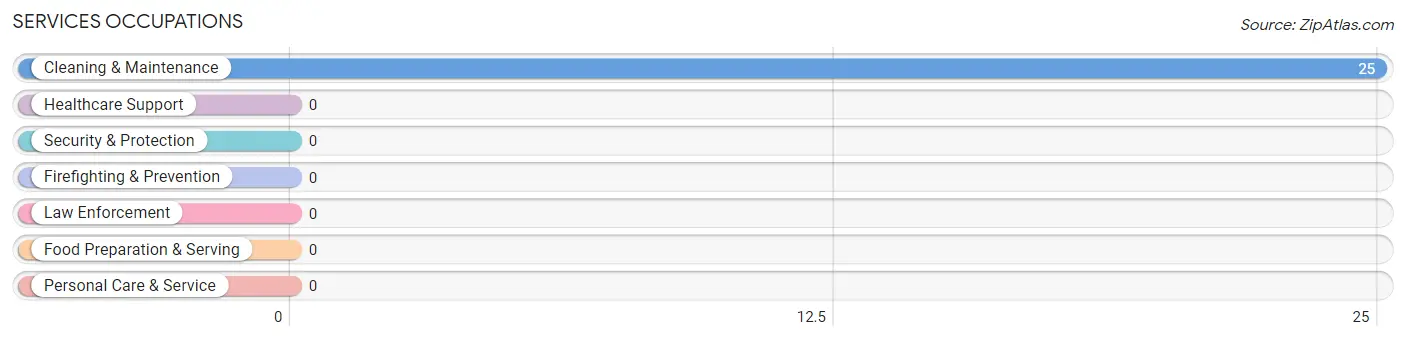
Services Occupations by Sex
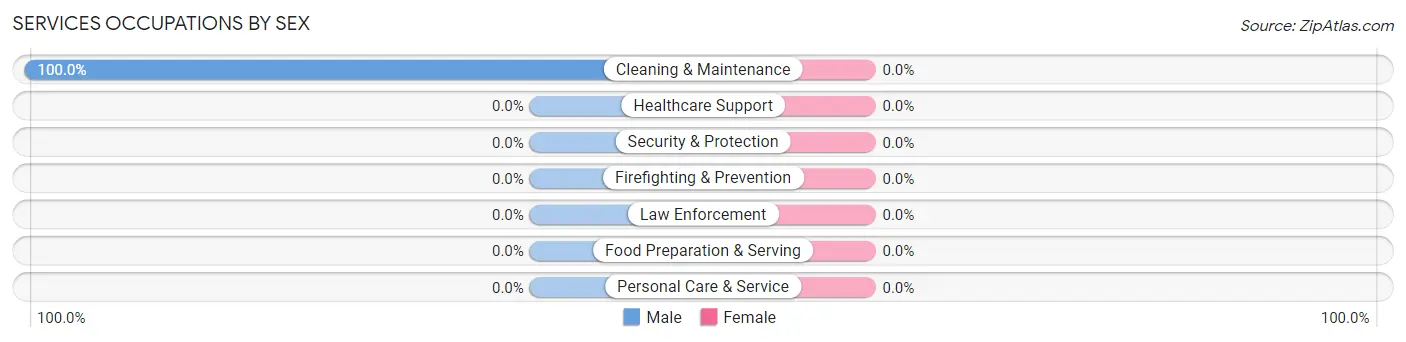
| Occupation | Male | Female |
| Healthcare Support | 0 (0.0%) | 0 (0.0%) |
| Security & Protection | 0 (0.0%) | 0 (0.0%) |
| Firefighting & Prevention | 0 (0.0%) | 0 (0.0%) |
| Law Enforcement | 0 (0.0%) | 0 (0.0%) |
| Food Preparation & Serving | 0 (0.0%) | 0 (0.0%) |
| Cleaning & Maintenance | 25 (100.0%) | 0 (0.0%) |
| Personal Care & Service | 0 (0.0%) | 0 (0.0%) |
| Total (Category) | 25 (100.0%) | 0 (0.0%) |
| Total (Overall) | 33 (54.1%) | 28 (45.9%) |
Sales and Office Occupations
The most common Sales and Office occupations in Wakulla are , and Office & Administration (28 | 45.9%).
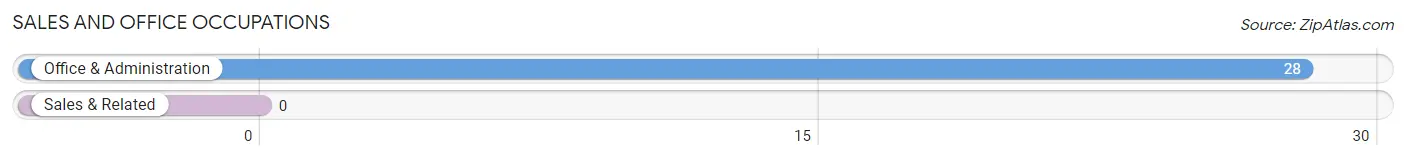
Sales and Office Occupations by Sex
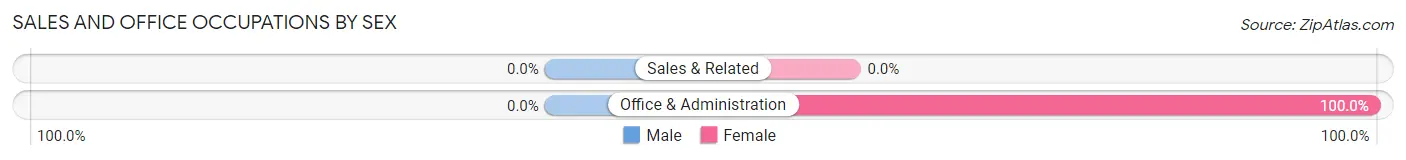
| Occupation | Male | Female |
| Sales & Related | 0 (0.0%) | 0 (0.0%) |
| Office & Administration | 0 (0.0%) | 28 (100.0%) |
| Total (Category) | 0 (0.0%) | 28 (100.0%) |
| Total (Overall) | 33 (54.1%) | 28 (45.9%) |
Natural Resources, Construction and Maintenance Occupations
The most common Natural Resources, Construction and Maintenance occupations in Wakulla are , and Installation, Maintenance & Repair (8 | 13.1%).
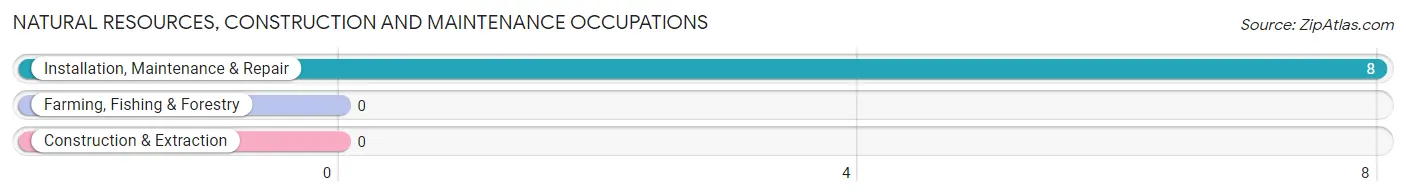
Natural Resources, Construction and Maintenance Occupations by Sex
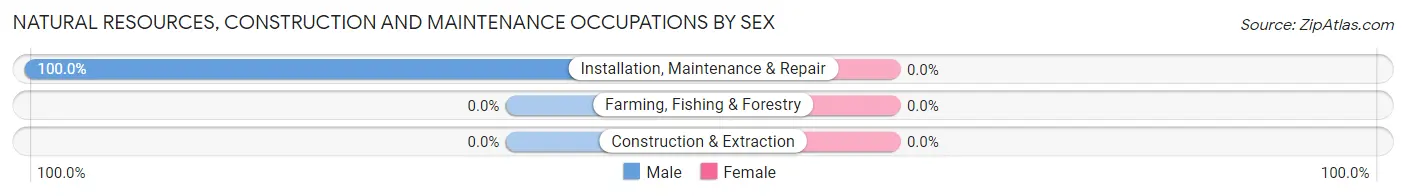
| Occupation | Male | Female |
| Farming, Fishing & Forestry | 0 (0.0%) | 0 (0.0%) |
| Construction & Extraction | 0 (0.0%) | 0 (0.0%) |
| Installation, Maintenance & Repair | 8 (100.0%) | 0 (0.0%) |
| Total (Category) | 8 (100.0%) | 0 (0.0%) |
| Total (Overall) | 33 (54.1%) | 28 (45.9%) |
Production, Transportation and Moving Occupations
Production, Transportation and Moving Occupations by Sex
| Occupation | Male | Female |
| Production | 0 (0.0%) | 0 (0.0%) |
| Transportation | 0 (0.0%) | 0 (0.0%) |
| Material Moving | 0 (0.0%) | 0 (0.0%) |
| Total (Category) | 0 (0.0%) | 0 (0.0%) |
| Total (Overall) | 33 (54.1%) | 28 (45.9%) |
Employment Industries by Sex in Wakulla
Employment Industries in Wakulla
The major employment industries in Wakulla include Finance & Insurance (28 | 45.9%), Administrative & Support (25 | 41.0%), and Manufacturing (8 | 13.1%).
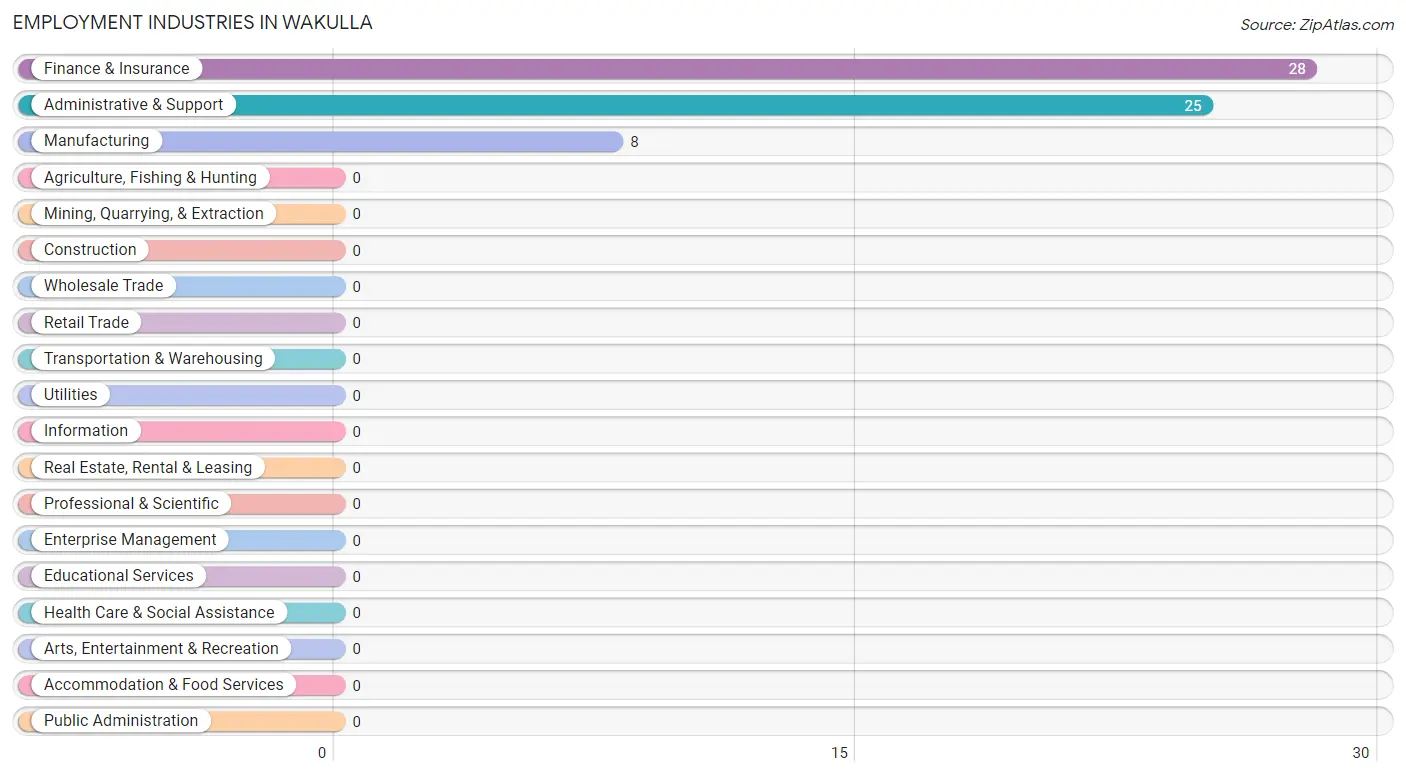
Employment Industries by Sex in Wakulla
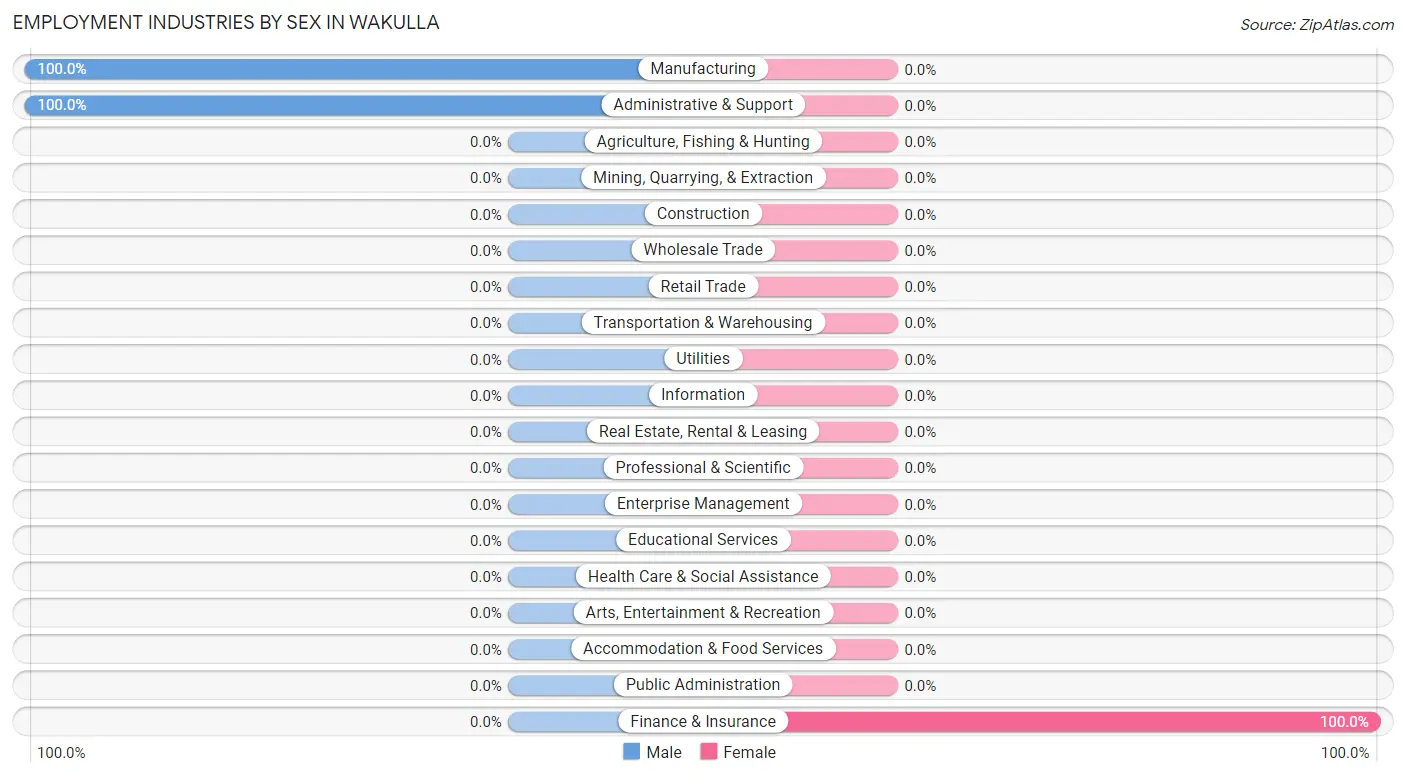
| Industry | Male | Female |
| Agriculture, Fishing & Hunting | 0 (0.0%) | 0 (0.0%) |
| Mining, Quarrying, & Extraction | 0 (0.0%) | 0 (0.0%) |
| Construction | 0 (0.0%) | 0 (0.0%) |
| Manufacturing | 8 (100.0%) | 0 (0.0%) |
| Wholesale Trade | 0 (0.0%) | 0 (0.0%) |
| Retail Trade | 0 (0.0%) | 0 (0.0%) |
| Transportation & Warehousing | 0 (0.0%) | 0 (0.0%) |
| Utilities | 0 (0.0%) | 0 (0.0%) |
| Information | 0 (0.0%) | 0 (0.0%) |
| Finance & Insurance | 0 (0.0%) | 28 (100.0%) |
| Real Estate, Rental & Leasing | 0 (0.0%) | 0 (0.0%) |
| Professional & Scientific | 0 (0.0%) | 0 (0.0%) |
| Enterprise Management | 0 (0.0%) | 0 (0.0%) |
| Administrative & Support | 25 (100.0%) | 0 (0.0%) |
| Educational Services | 0 (0.0%) | 0 (0.0%) |
| Health Care & Social Assistance | 0 (0.0%) | 0 (0.0%) |
| Arts, Entertainment & Recreation | 0 (0.0%) | 0 (0.0%) |
| Accommodation & Food Services | 0 (0.0%) | 0 (0.0%) |
| Public Administration | 0 (0.0%) | 0 (0.0%) |
| Total | 33 (54.1%) | 28 (45.9%) |
Education in Wakulla
School Enrollment in Wakulla
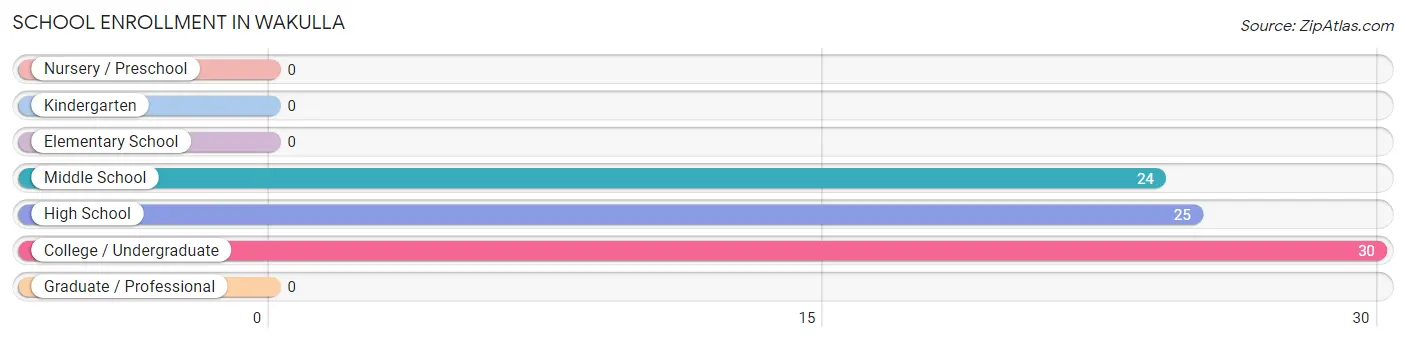
The most common levels of schooling among the 79 students in Wakulla are college / undergraduate (30 | 38.0%), high school (25 | 31.7%), and middle school (24 | 30.4%).
| School Level | # Students | % Students |
| Nursery / Preschool | 0 | 0.0% |
| Kindergarten | 0 | 0.0% |
| Elementary School | 0 | 0.0% |
| Middle School | 24 | 30.4% |
| High School | 25 | 31.7% |
| College / Undergraduate | 30 | 38.0% |
| Graduate / Professional | 0 | 0.0% |
| Total | 79 | 100.0% |
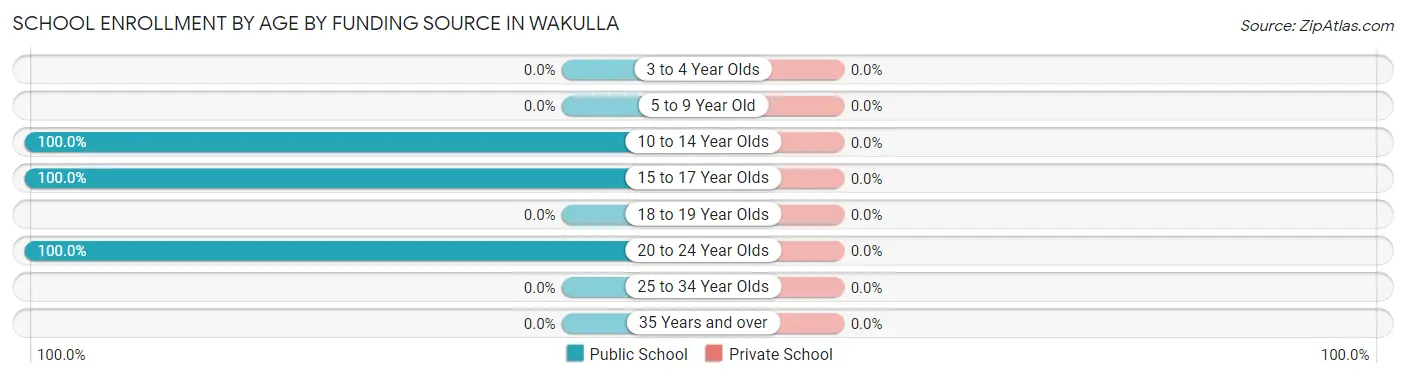
School Enrollment by Age by Funding Source in Wakulla
| Age Bracket | Public School | Private School |
| 3 to 4 Year Olds | 0 (0.0%) | 0 (0.0%) |
| 5 to 9 Year Old | 0 (0.0%) | 0 (0.0%) |
| 10 to 14 Year Olds | 24 (100.0%) | 0 (0.0%) |
| 15 to 17 Year Olds | 25 (100.0%) | 0 (0.0%) |
| 18 to 19 Year Olds | 0 (0.0%) | 0 (0.0%) |
| 20 to 24 Year Olds | 30 (100.0%) | 0 (0.0%) |
| 25 to 34 Year Olds | 0 (0.0%) | 0 (0.0%) |
| 35 Years and over | 0 (0.0%) | 0 (0.0%) |
| Total | 79 (100.0%) | 0 (0.0%) |
Educational Attainment by Field of Study in Wakulla
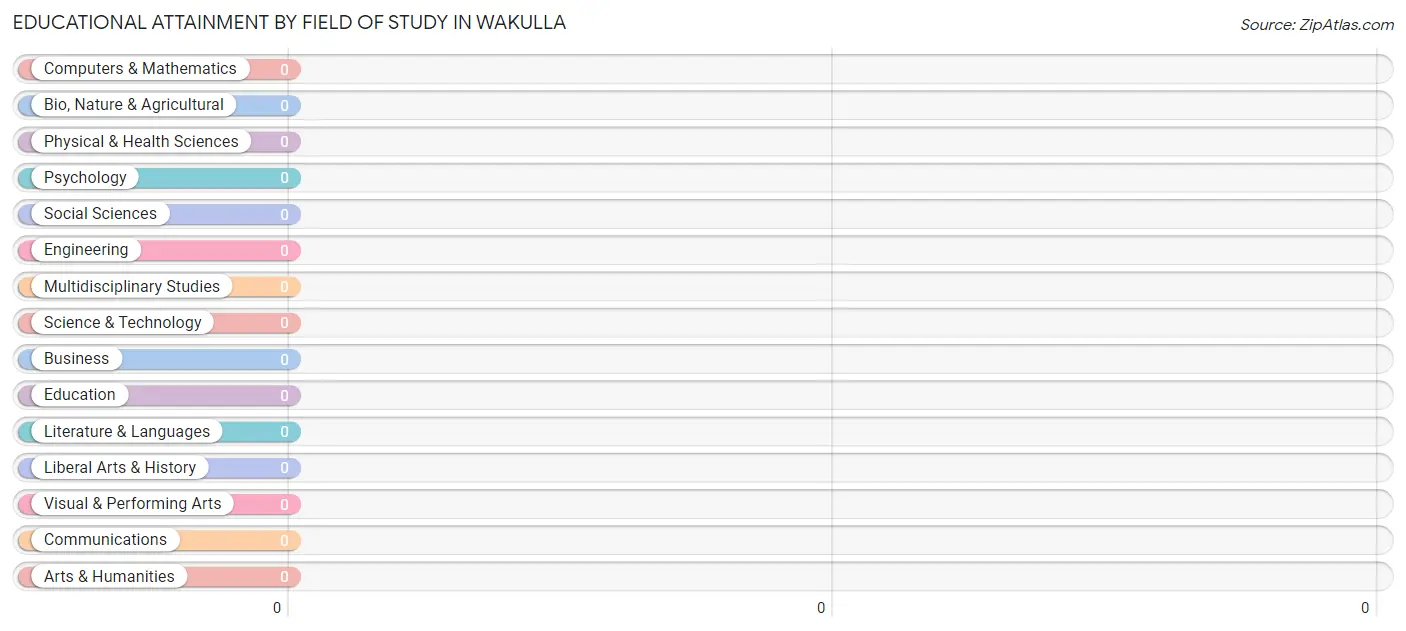
| Field of Study | # Graduates | % Graduates |
| Computers & Mathematics | 0 | 0.0% |
| Bio, Nature & Agricultural | 0 | 0.0% |
| Physical & Health Sciences | 0 | 0.0% |
| Psychology | 0 | 0.0% |
| Social Sciences | 0 | 0.0% |
| Engineering | 0 | 0.0% |
| Multidisciplinary Studies | 0 | 0.0% |
| Science & Technology | 0 | 0.0% |
| Business | 0 | 0.0% |
| Education | 0 | 0.0% |
| Literature & Languages | 0 | 0.0% |
| Liberal Arts & History | 0 | 0.0% |
| Visual & Performing Arts | 0 | 0.0% |
| Communications | 0 | 0.0% |
| Arts & Humanities | 0 | 0.0% |
| Total | 0 | 0.0% |
Transportation & Commute in Wakulla
Vehicle Availability by Sex in Wakulla
The most prevalent vehicle ownership categories in Wakulla are males with 3 vehicles (25, accounting for 75.8%) and females with 3 vehicles (28, making up 89.3%).
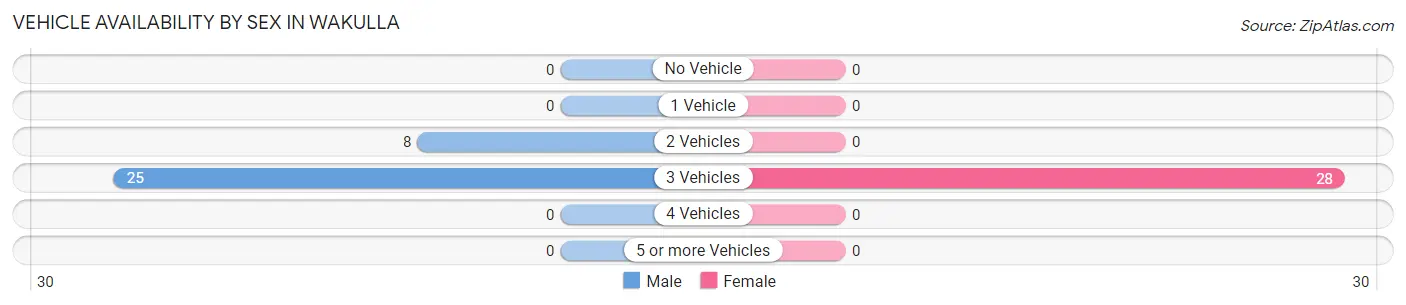
| Vehicles Available | Male | Female |
| No Vehicle | 0 (0.0%) | 0 (0.0%) |
| 1 Vehicle | 0 (0.0%) | 0 (0.0%) |
| 2 Vehicles | 8 (24.2%) | 0 (0.0%) |
| 3 Vehicles | 25 (75.8%) | 28 (100.0%) |
| 4 Vehicles | 0 (0.0%) | 0 (0.0%) |
| 5 or more Vehicles | 0 (0.0%) | 0 (0.0%) |
| Total | 33 (100.0%) | 28 (100.0%) |
Commute Time in Wakulla
The most frequently occuring commute durations in Wakulla are 15 to 19 minutes (28 commuters, 45.9%), 40 to 44 minutes (25 commuters, 41.0%), and 60 to 89 minutes (8 commuters, 13.1%).
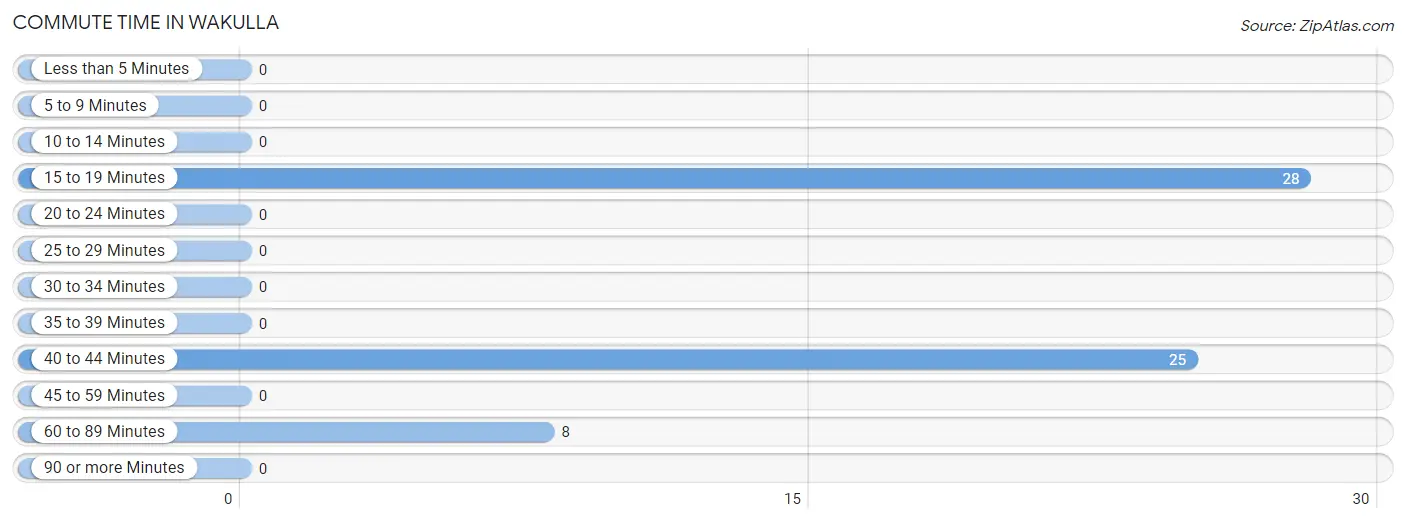
| Commute Time | # Commuters | % Commuters |
| Less than 5 Minutes | 0 | 0.0% |
| 5 to 9 Minutes | 0 | 0.0% |
| 10 to 14 Minutes | 0 | 0.0% |
| 15 to 19 Minutes | 28 | 45.9% |
| 20 to 24 Minutes | 0 | 0.0% |
| 25 to 29 Minutes | 0 | 0.0% |
| 30 to 34 Minutes | 0 | 0.0% |
| 35 to 39 Minutes | 0 | 0.0% |
| 40 to 44 Minutes | 25 | 41.0% |
| 45 to 59 Minutes | 0 | 0.0% |
| 60 to 89 Minutes | 8 | 13.1% |
| 90 or more Minutes | 0 | 0.0% |
Commute Time by Sex in Wakulla
The most common commute times in Wakulla are 40 to 44 minutes (25 commuters, 75.8%) for males and 15 to 19 minutes (28 commuters, 100.0%) for females.
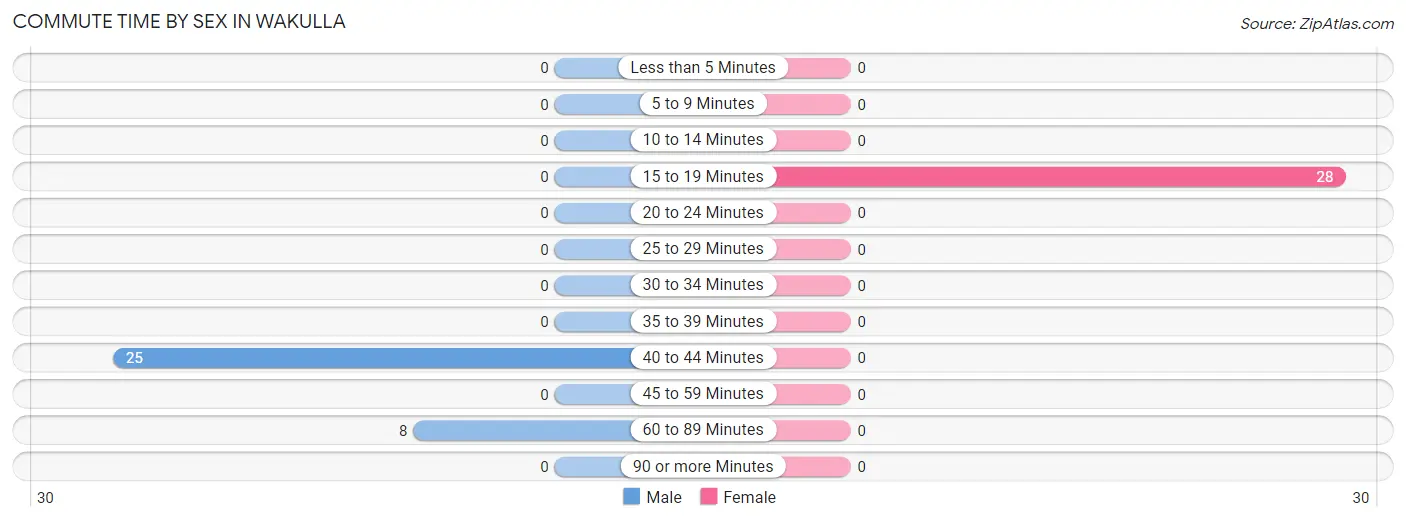
| Commute Time | Male | Female |
| Less than 5 Minutes | 0 (0.0%) | 0 (0.0%) |
| 5 to 9 Minutes | 0 (0.0%) | 0 (0.0%) |
| 10 to 14 Minutes | 0 (0.0%) | 0 (0.0%) |
| 15 to 19 Minutes | 0 (0.0%) | 28 (100.0%) |
| 20 to 24 Minutes | 0 (0.0%) | 0 (0.0%) |
| 25 to 29 Minutes | 0 (0.0%) | 0 (0.0%) |
| 30 to 34 Minutes | 0 (0.0%) | 0 (0.0%) |
| 35 to 39 Minutes | 0 (0.0%) | 0 (0.0%) |
| 40 to 44 Minutes | 25 (75.8%) | 0 (0.0%) |
| 45 to 59 Minutes | 0 (0.0%) | 0 (0.0%) |
| 60 to 89 Minutes | 8 (24.2%) | 0 (0.0%) |
| 90 or more Minutes | 0 (0.0%) | 0 (0.0%) |
Time of Departure to Work by Sex in Wakulla
The most frequent times of departure to work in Wakulla are 5:00 AM to 5:29 AM (25, 75.8%) for males and 8:00 AM to 8:29 AM (28, 100.0%) for females.
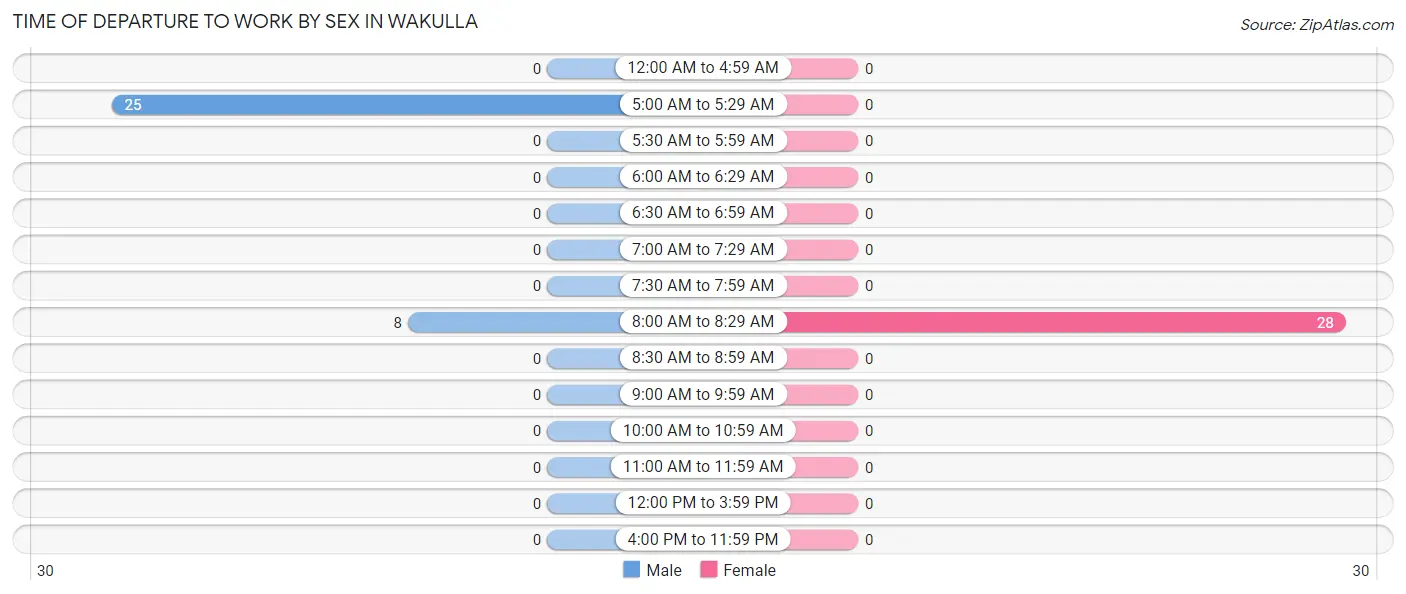
| Time of Departure | Male | Female |
| 12:00 AM to 4:59 AM | 0 (0.0%) | 0 (0.0%) |
| 5:00 AM to 5:29 AM | 25 (75.8%) | 0 (0.0%) |
| 5:30 AM to 5:59 AM | 0 (0.0%) | 0 (0.0%) |
| 6:00 AM to 6:29 AM | 0 (0.0%) | 0 (0.0%) |
| 6:30 AM to 6:59 AM | 0 (0.0%) | 0 (0.0%) |
| 7:00 AM to 7:29 AM | 0 (0.0%) | 0 (0.0%) |
| 7:30 AM to 7:59 AM | 0 (0.0%) | 0 (0.0%) |
| 8:00 AM to 8:29 AM | 8 (24.2%) | 28 (100.0%) |
| 8:30 AM to 8:59 AM | 0 (0.0%) | 0 (0.0%) |
| 9:00 AM to 9:59 AM | 0 (0.0%) | 0 (0.0%) |
| 10:00 AM to 10:59 AM | 0 (0.0%) | 0 (0.0%) |
| 11:00 AM to 11:59 AM | 0 (0.0%) | 0 (0.0%) |
| 12:00 PM to 3:59 PM | 0 (0.0%) | 0 (0.0%) |
| 4:00 PM to 11:59 PM | 0 (0.0%) | 0 (0.0%) |
| Total | 33 (100.0%) | 28 (100.0%) |
Housing Occupancy in Wakulla
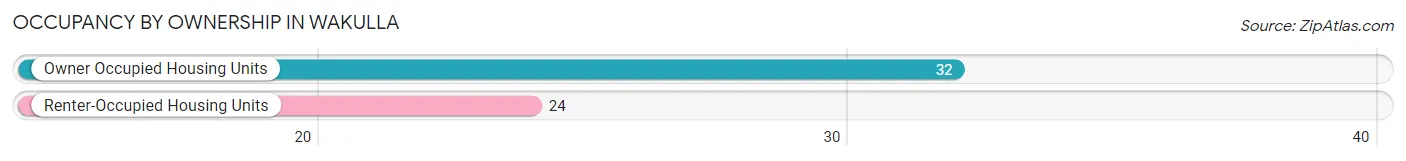
Occupancy by Ownership in Wakulla
Of the total 56 dwellings in Wakulla, owner-occupied units account for 32 (57.1%), while renter-occupied units make up 24 (42.9%).
| Occupancy | # Housing Units | % Housing Units |
| Owner Occupied Housing Units | 32 | 57.1% |
| Renter-Occupied Housing Units | 24 | 42.9% |
| Total Occupied Housing Units | 56 | 100.0% |
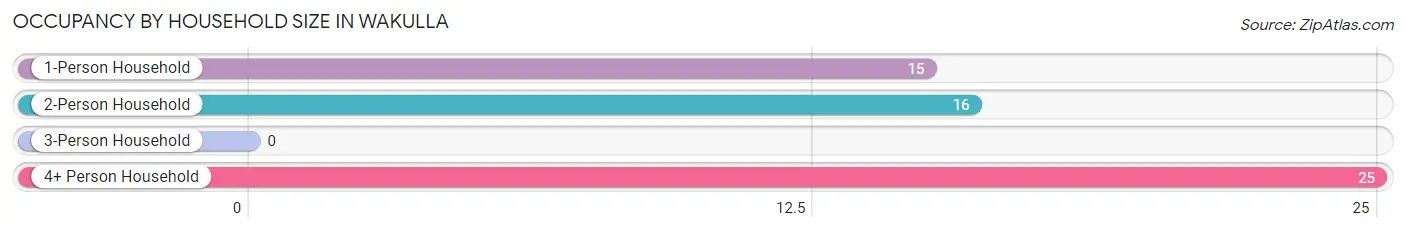
Occupancy by Household Size in Wakulla
| Household Size | # Housing Units | % Housing Units |
| 1-Person Household | 15 | 26.8% |
| 2-Person Household | 16 | 28.6% |
| 3-Person Household | 0 | 0.0% |
| 4+ Person Household | 25 | 44.6% |
| Total Housing Units | 56 | 100.0% |
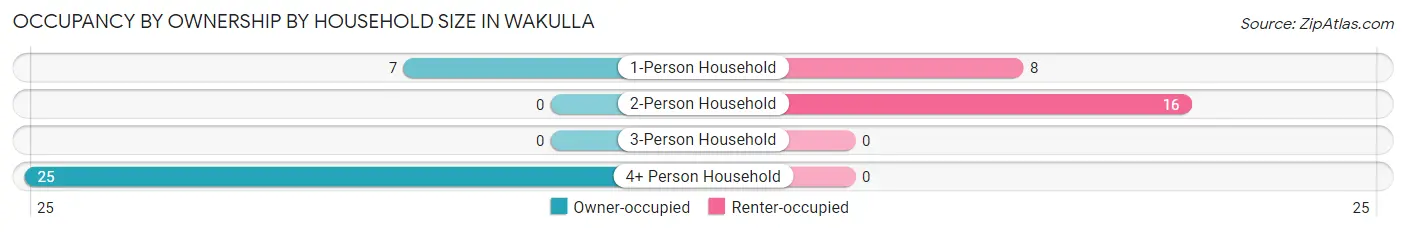
Occupancy by Ownership by Household Size in Wakulla
| Household Size | Owner-occupied | Renter-occupied |
| 1-Person Household | 7 (46.7%) | 8 (53.3%) |
| 2-Person Household | 0 (0.0%) | 16 (100.0%) |
| 3-Person Household | 0 (0.0%) | 0 (0.0%) |
| 4+ Person Household | 25 (100.0%) | 0 (0.0%) |
| Total Housing Units | 32 (57.1%) | 24 (42.9%) |
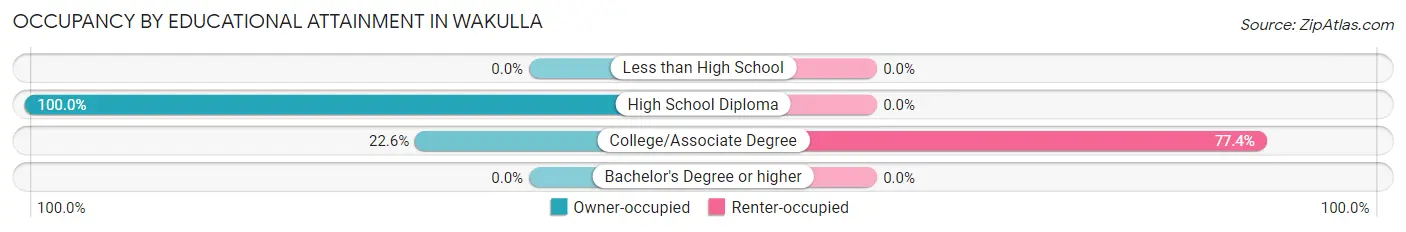
Occupancy by Educational Attainment in Wakulla
| Household Size | Owner-occupied | Renter-occupied |
| Less than High School | 0 (0.0%) | 0 (0.0%) |
| High School Diploma | 25 (100.0%) | 0 (0.0%) |
| College/Associate Degree | 7 (22.6%) | 24 (77.4%) |
| Bachelor's Degree or higher | 0 (0.0%) | 0 (0.0%) |
Occupancy by Age of Householder in Wakulla
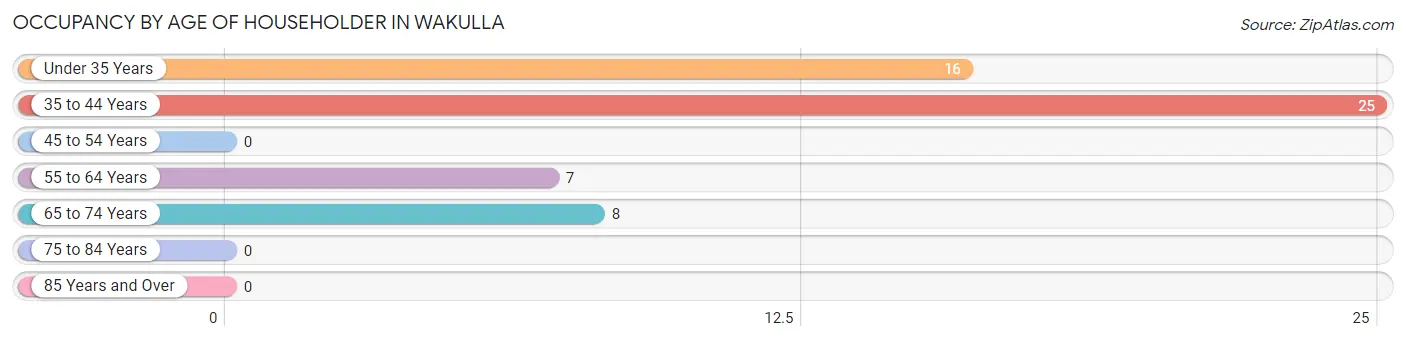
| Age Bracket | # Households | % Households |
| Under 35 Years | 16 | 28.6% |
| 35 to 44 Years | 25 | 44.6% |
| 45 to 54 Years | 0 | 0.0% |
| 55 to 64 Years | 7 | 12.5% |
| 65 to 74 Years | 8 | 14.3% |
| 75 to 84 Years | 0 | 0.0% |
| 85 Years and Over | 0 | 0.0% |
| Total | 56 | 100.0% |
Housing Finances in Wakulla
Median Income by Occupancy in Wakulla
| Occupancy Type | # Households | Median Income |
| Owner-Occupied | 32 (57.1%) | $0 |
| Renter-Occupied | 24 (42.9%) | $0 |
| Average | 56 (100.0%) | $0 |
Occupancy by Householder Income Bracket in Wakulla
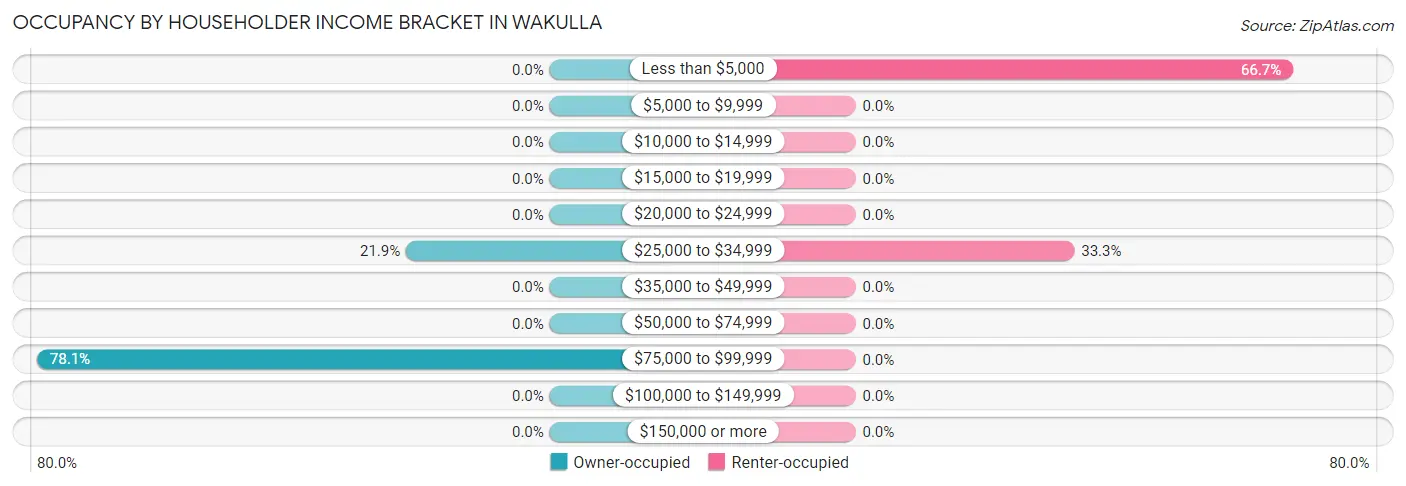
| Income Bracket | Owner-occupied | Renter-occupied |
| Less than $5,000 | 0 (0.0%) | 16 (66.7%) |
| $5,000 to $9,999 | 0 (0.0%) | 0 (0.0%) |
| $10,000 to $14,999 | 0 (0.0%) | 0 (0.0%) |
| $15,000 to $19,999 | 0 (0.0%) | 0 (0.0%) |
| $20,000 to $24,999 | 0 (0.0%) | 0 (0.0%) |
| $25,000 to $34,999 | 7 (21.9%) | 8 (33.3%) |
| $35,000 to $49,999 | 0 (0.0%) | 0 (0.0%) |
| $50,000 to $74,999 | 0 (0.0%) | 0 (0.0%) |
| $75,000 to $99,999 | 25 (78.1%) | 0 (0.0%) |
| $100,000 to $149,999 | 0 (0.0%) | 0 (0.0%) |
| $150,000 or more | 0 (0.0%) | 0 (0.0%) |
| Total | 32 (100.0%) | 24 (100.0%) |
Monthly Housing Cost Tiers in Wakulla
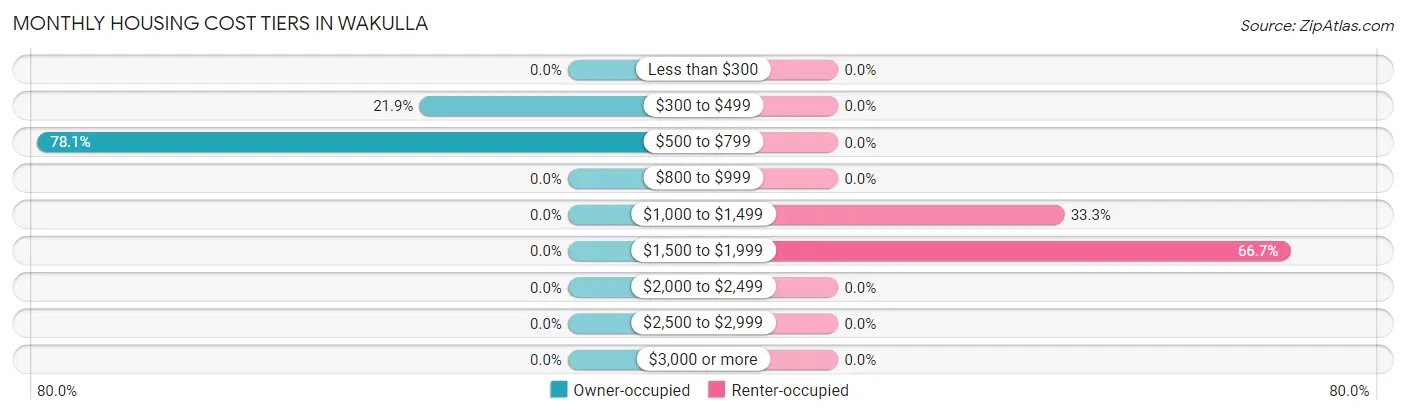
| Monthly Cost | Owner-occupied | Renter-occupied |
| Less than $300 | 0 (0.0%) | 0 (0.0%) |
| $300 to $499 | 7 (21.9%) | 0 (0.0%) |
| $500 to $799 | 25 (78.1%) | 0 (0.0%) |
| $800 to $999 | 0 (0.0%) | 0 (0.0%) |
| $1,000 to $1,499 | 0 (0.0%) | 8 (33.3%) |
| $1,500 to $1,999 | 0 (0.0%) | 16 (66.7%) |
| $2,000 to $2,499 | 0 (0.0%) | 0 (0.0%) |
| $2,500 to $2,999 | 0 (0.0%) | 0 (0.0%) |
| $3,000 or more | 0 (0.0%) | 0 (0.0%) |
| Total | 32 (100.0%) | 24 (100.0%) |
Physical Housing Characteristics in Wakulla
Housing Structures in Wakulla
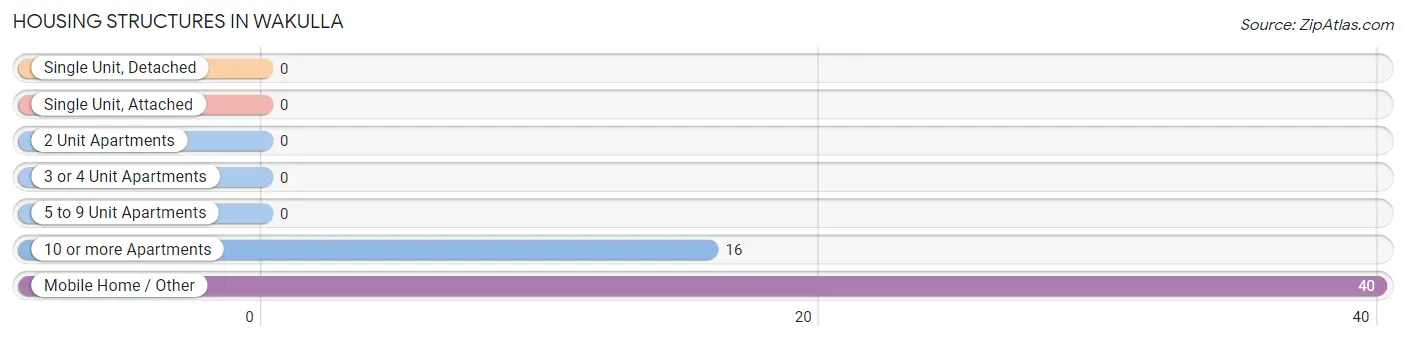
| Structure Type | # Housing Units | % Housing Units |
| Single Unit, Detached | 0 | 0.0% |
| Single Unit, Attached | 0 | 0.0% |
| 2 Unit Apartments | 0 | 0.0% |
| 3 or 4 Unit Apartments | 0 | 0.0% |
| 5 to 9 Unit Apartments | 0 | 0.0% |
| 10 or more Apartments | 16 | 28.6% |
| Mobile Home / Other | 40 | 71.4% |
| Total | 56 | 100.0% |
Housing Structures by Occupancy in Wakulla
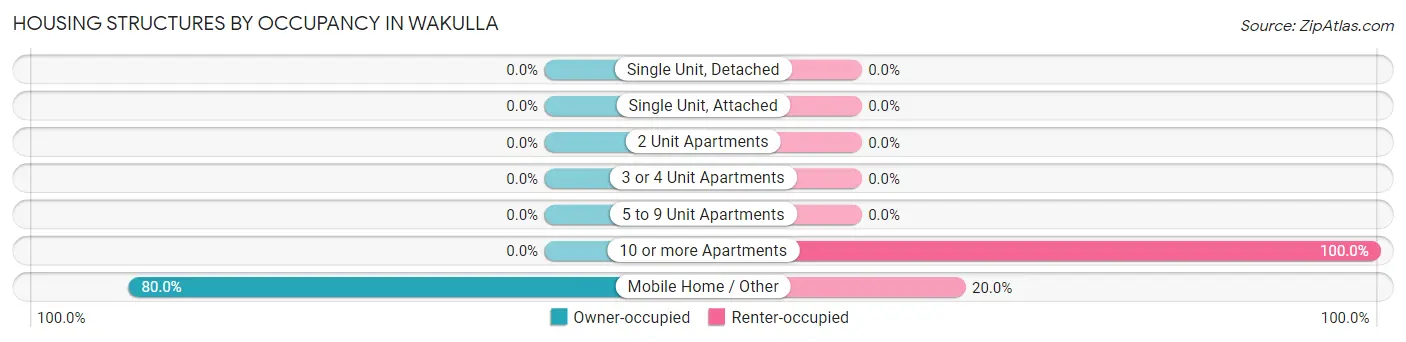
| Structure Type | Owner-occupied | Renter-occupied |
| Single Unit, Detached | 0 (0.0%) | 0 (0.0%) |
| Single Unit, Attached | 0 (0.0%) | 0 (0.0%) |
| 2 Unit Apartments | 0 (0.0%) | 0 (0.0%) |
| 3 or 4 Unit Apartments | 0 (0.0%) | 0 (0.0%) |
| 5 to 9 Unit Apartments | 0 (0.0%) | 0 (0.0%) |
| 10 or more Apartments | 0 (0.0%) | 16 (100.0%) |
| Mobile Home / Other | 32 (80.0%) | 8 (20.0%) |
| Total | 32 (57.1%) | 24 (42.9%) |
Housing Structures by Number of Rooms in Wakulla
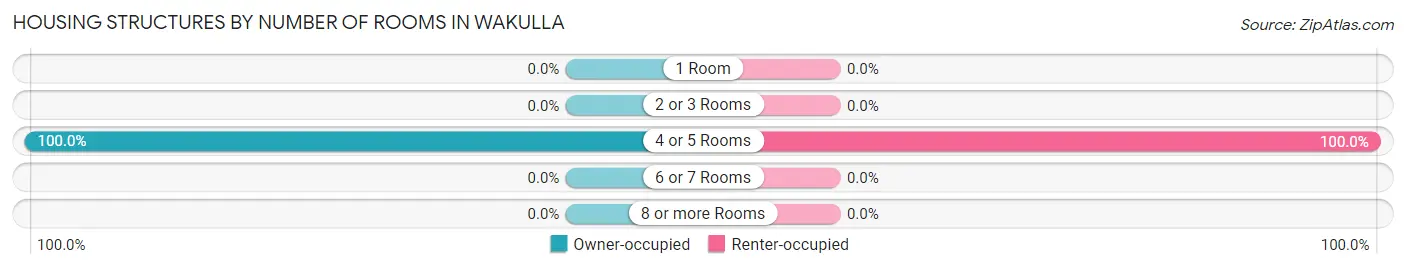
| Number of Rooms | Owner-occupied | Renter-occupied |
| 1 Room | 0 (0.0%) | 0 (0.0%) |
| 2 or 3 Rooms | 0 (0.0%) | 0 (0.0%) |
| 4 or 5 Rooms | 32 (100.0%) | 24 (100.0%) |
| 6 or 7 Rooms | 0 (0.0%) | 0 (0.0%) |
| 8 or more Rooms | 0 (0.0%) | 0 (0.0%) |
| Total | 32 (100.0%) | 24 (100.0%) |
Housing Structure by Heating Type in Wakulla
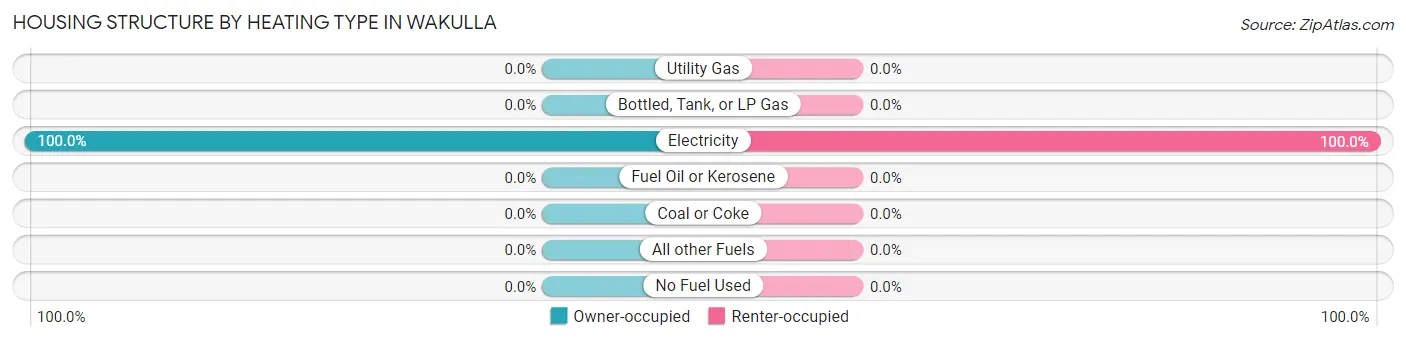
| Heating Type | Owner-occupied | Renter-occupied |
| Utility Gas | 0 (0.0%) | 0 (0.0%) |
| Bottled, Tank, or LP Gas | 0 (0.0%) | 0 (0.0%) |
| Electricity | 32 (100.0%) | 24 (100.0%) |
| Fuel Oil or Kerosene | 0 (0.0%) | 0 (0.0%) |
| Coal or Coke | 0 (0.0%) | 0 (0.0%) |
| All other Fuels | 0 (0.0%) | 0 (0.0%) |
| No Fuel Used | 0 (0.0%) | 0 (0.0%) |
| Total | 32 (100.0%) | 24 (100.0%) |
Household Vehicle Usage in Wakulla
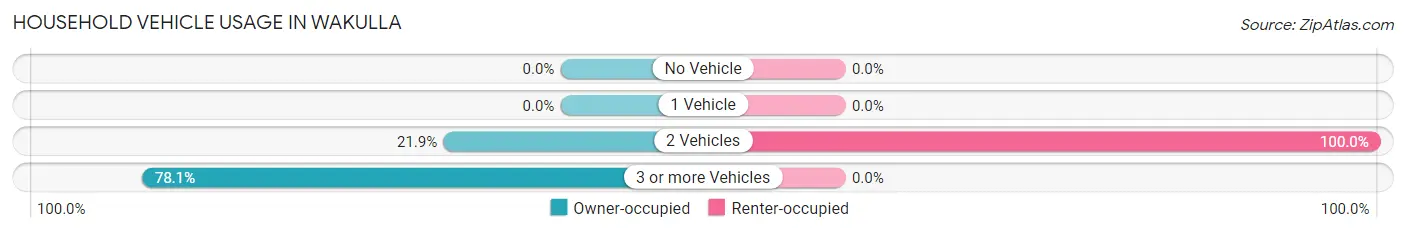
| Vehicles per Household | Owner-occupied | Renter-occupied |
| No Vehicle | 0 (0.0%) | 0 (0.0%) |
| 1 Vehicle | 0 (0.0%) | 0 (0.0%) |
| 2 Vehicles | 7 (21.9%) | 24 (100.0%) |
| 3 or more Vehicles | 25 (78.1%) | 0 (0.0%) |
| Total | 32 (100.0%) | 24 (100.0%) |
Real Estate & Mortgages in Wakulla
Real Estate and Mortgage Overview in Wakulla
| Characteristic | Without Mortgage | With Mortgage |
| Housing Units | 32 | 0 |
| Median Property Value | - | - |
| Median Household Income | - | - |
| Monthly Housing Costs | - | - |
| Real Estate Taxes | - | - |
Property Value by Mortgage Status in Wakulla
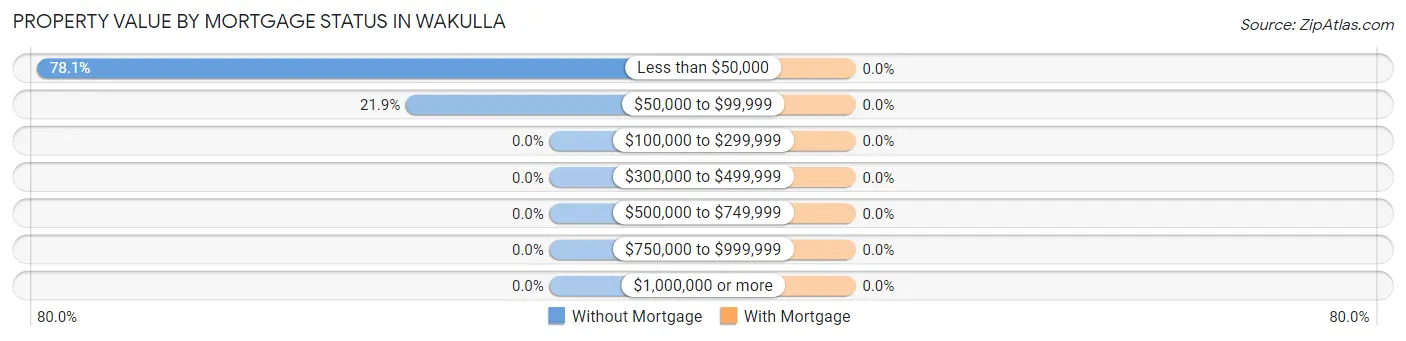
| Property Value | Without Mortgage | With Mortgage |
| Less than $50,000 | 25 (78.1%) | 0 (0.0%) |
| $50,000 to $99,999 | 7 (21.9%) | 0 (0.0%) |
| $100,000 to $299,999 | 0 (0.0%) | 0 (0.0%) |
| $300,000 to $499,999 | 0 (0.0%) | 0 (0.0%) |
| $500,000 to $749,999 | 0 (0.0%) | 0 (0.0%) |
| $750,000 to $999,999 | 0 (0.0%) | 0 (0.0%) |
| $1,000,000 or more | 0 (0.0%) | 0 (0.0%) |
| Total | 32 (100.0%) | 0 (0.0%) |
Household Income by Mortgage Status in Wakulla
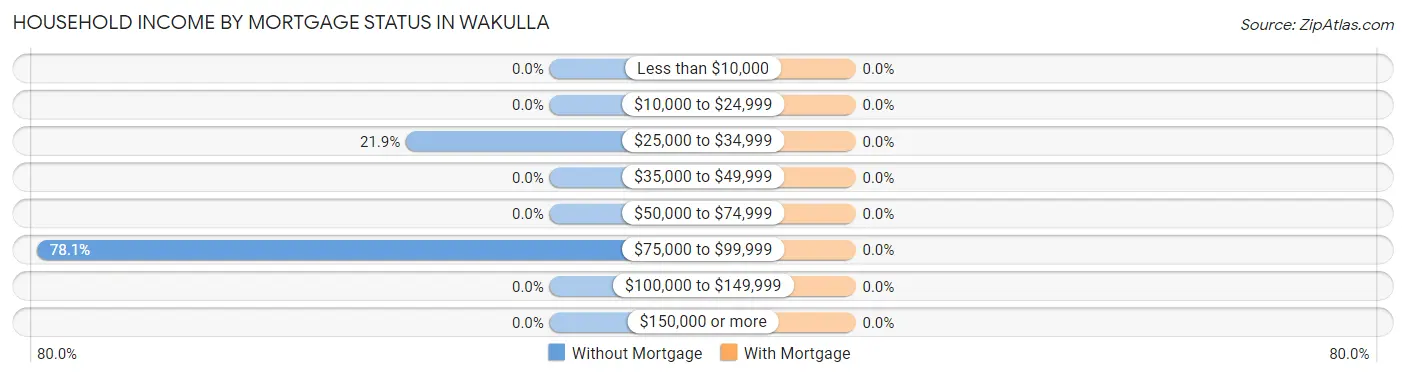
| Household Income | Without Mortgage | With Mortgage |
| Less than $10,000 | 0 (0.0%) | 0 (0.0%) |
| $10,000 to $24,999 | 0 (0.0%) | 0 (0.0%) |
| $25,000 to $34,999 | 7 (21.9%) | 0 (0.0%) |
| $35,000 to $49,999 | 0 (0.0%) | 0 (0.0%) |
| $50,000 to $74,999 | 0 (0.0%) | 0 (0.0%) |
| $75,000 to $99,999 | 25 (78.1%) | 0 (0.0%) |
| $100,000 to $149,999 | 0 (0.0%) | 0 (0.0%) |
| $150,000 or more | 0 (0.0%) | 0 (0.0%) |
| Total | 32 (100.0%) | 0 (0.0%) |
Property Value to Household Income Ratio in Wakulla
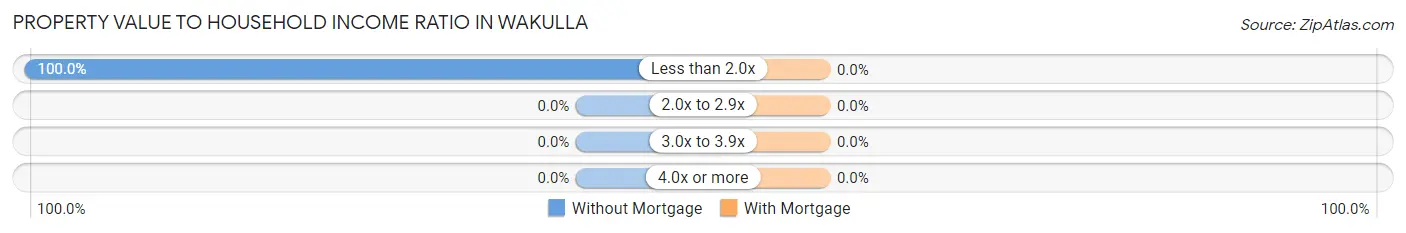
| Value-to-Income Ratio | Without Mortgage | With Mortgage |
| Less than 2.0x | 32 (100.0%) | 0 (0.0%) |
| 2.0x to 2.9x | 0 (0.0%) | 0 (0.0%) |
| 3.0x to 3.9x | 0 (0.0%) | 0 (0.0%) |
| 4.0x or more | 0 (0.0%) | 0 (0.0%) |
| Total | 32 (100.0%) | 0 (0.0%) |
Real Estate Taxes by Mortgage Status in Wakulla
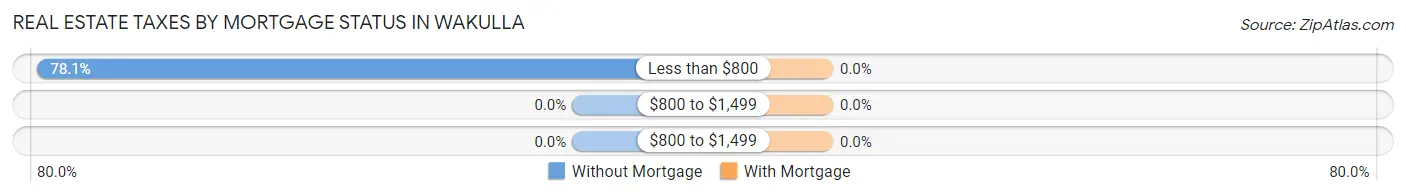
| Property Taxes | Without Mortgage | With Mortgage |
| Less than $800 | 25 (78.1%) | 0 (0.0%) |
| $800 to $1,499 | 0 (0.0%) | 0 (0.0%) |
| $800 to $1,499 | 0 (0.0%) | 0 (0.0%) |
| Total | 32 (100.0%) | 0 (0.0%) |
Health & Disability in Wakulla
Health Insurance Coverage by Age in Wakulla
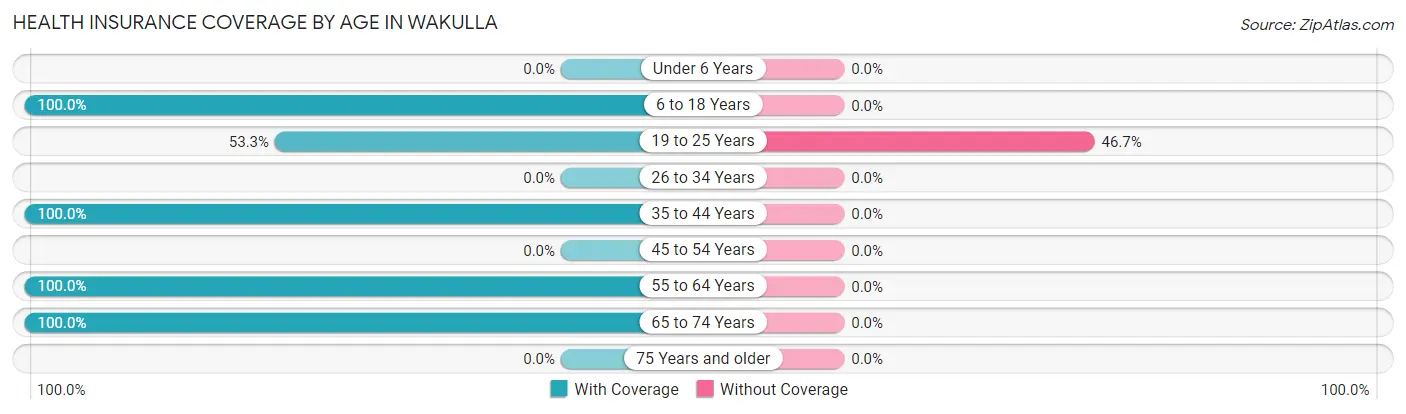
| Age Bracket | With Coverage | Without Coverage |
| Under 6 Years | 0 (0.0%) | 0 (0.0%) |
| 6 to 18 Years | 49 (100.0%) | 0 (0.0%) |
| 19 to 25 Years | 16 (53.3%) | 14 (46.7%) |
| 26 to 34 Years | 0 (0.0%) | 0 (0.0%) |
| 35 to 44 Years | 53 (100.0%) | 0 (0.0%) |
| 45 to 54 Years | 0 (0.0%) | 0 (0.0%) |
| 55 to 64 Years | 7 (100.0%) | 0 (0.0%) |
| 65 to 74 Years | 8 (100.0%) | 0 (0.0%) |
| 75 Years and older | 0 (0.0%) | 0 (0.0%) |
| Total | 133 (90.5%) | 14 (9.5%) |
Health Insurance Coverage by Citizenship Status in Wakulla
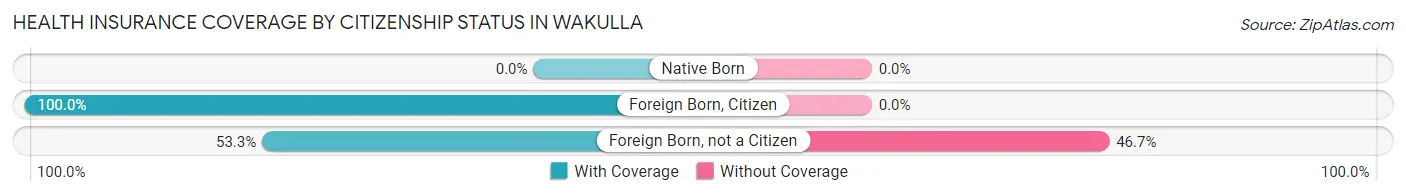
| Citizenship Status | With Coverage | Without Coverage |
| Native Born | 0 (0.0%) | 0 (0.0%) |
| Foreign Born, Citizen | 49 (100.0%) | 0 (0.0%) |
| Foreign Born, not a Citizen | 16 (53.3%) | 14 (46.7%) |
Health Insurance Coverage by Household Income in Wakulla
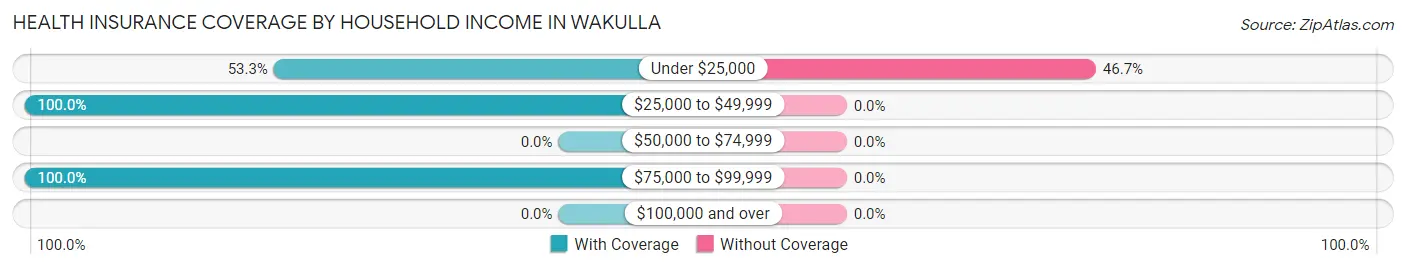
| Household Income | With Coverage | Without Coverage |
| Under $25,000 | 16 (53.3%) | 14 (46.7%) |
| $25,000 to $49,999 | 15 (100.0%) | 0 (0.0%) |
| $50,000 to $74,999 | 0 (0.0%) | 0 (0.0%) |
| $75,000 to $99,999 | 102 (100.0%) | 0 (0.0%) |
| $100,000 and over | 0 (0.0%) | 0 (0.0%) |
Public vs Private Health Insurance Coverage by Age in Wakulla
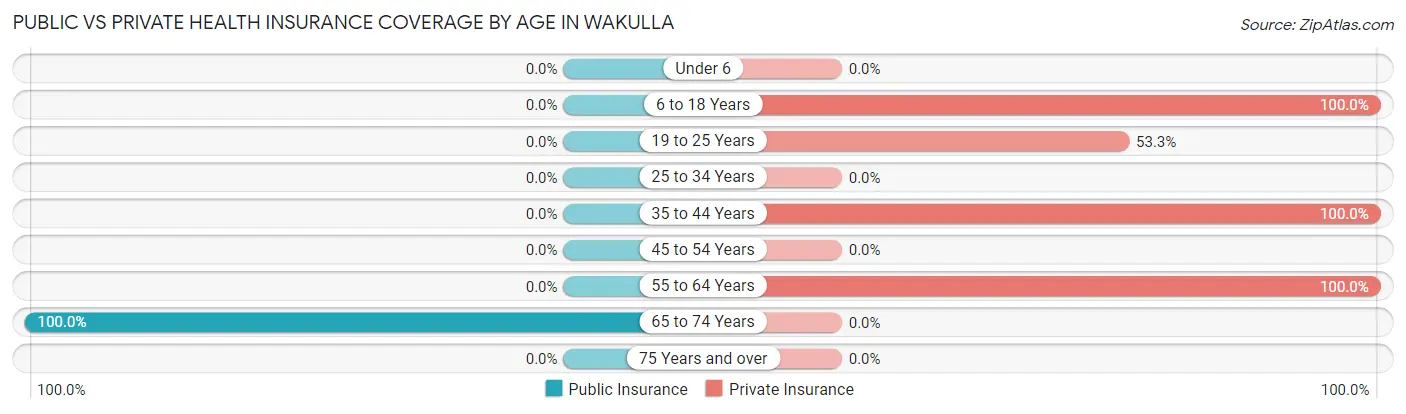
| Age Bracket | Public Insurance | Private Insurance |
| Under 6 | 0 (0.0%) | 0 (0.0%) |
| 6 to 18 Years | 0 (0.0%) | 49 (100.0%) |
| 19 to 25 Years | 0 (0.0%) | 16 (53.3%) |
| 25 to 34 Years | 0 (0.0%) | 0 (0.0%) |
| 35 to 44 Years | 0 (0.0%) | 53 (100.0%) |
| 45 to 54 Years | 0 (0.0%) | 0 (0.0%) |
| 55 to 64 Years | 0 (0.0%) | 7 (100.0%) |
| 65 to 74 Years | 8 (100.0%) | 0 (0.0%) |
| 75 Years and over | 0 (0.0%) | 0 (0.0%) |
| Total | 8 (5.4%) | 125 (85.0%) |
Disability Status by Sex by Age in Wakulla
| Age Bracket | Male | Female |
| Under 5 Years | 0 (0.0%) | 0 (0.0%) |
| 5 to 17 Years | 0 (0.0%) | 0 (0.0%) |
| 18 to 34 Years | 0 (0.0%) | 0 (0.0%) |
| 35 to 64 Years | 0 (0.0%) | 0 (0.0%) |
| 65 to 74 Years | 0 (0.0%) | 0 (0.0%) |
| 75 Years and over | 0 (0.0%) | 0 (0.0%) |
Disability Class by Sex by Age in Wakulla
Disability Class: Hearing Difficulty
| Age Bracket | Male | Female |
| Under 5 Years | 0 (0.0%) | 0 (0.0%) |
| 5 to 17 Years | 0 (0.0%) | 0 (0.0%) |
| 18 to 34 Years | 0 (0.0%) | 0 (0.0%) |
| 35 to 64 Years | 0 (0.0%) | 0 (0.0%) |
| 65 to 74 Years | 0 (0.0%) | 0 (0.0%) |
| 75 Years and over | 0 (0.0%) | 0 (0.0%) |
Disability Class: Vision Difficulty
| Age Bracket | Male | Female |
| Under 5 Years | 0 (0.0%) | 0 (0.0%) |
| 5 to 17 Years | 0 (0.0%) | 0 (0.0%) |
| 18 to 34 Years | 0 (0.0%) | 0 (0.0%) |
| 35 to 64 Years | 0 (0.0%) | 0 (0.0%) |
| 65 to 74 Years | 0 (0.0%) | 0 (0.0%) |
| 75 Years and over | 0 (0.0%) | 0 (0.0%) |
Disability Class: Cognitive Difficulty
| Age Bracket | Male | Female |
| 5 to 17 Years | 0 (0.0%) | 0 (0.0%) |
| 18 to 34 Years | 0 (0.0%) | 0 (0.0%) |
| 35 to 64 Years | 0 (0.0%) | 0 (0.0%) |
| 65 to 74 Years | 0 (0.0%) | 0 (0.0%) |
| 75 Years and over | 0 (0.0%) | 0 (0.0%) |
Disability Class: Ambulatory Difficulty
| Age Bracket | Male | Female |
| 5 to 17 Years | 0 (0.0%) | 0 (0.0%) |
| 18 to 34 Years | 0 (0.0%) | 0 (0.0%) |
| 35 to 64 Years | 0 (0.0%) | 0 (0.0%) |
| 65 to 74 Years | 0 (0.0%) | 0 (0.0%) |
| 75 Years and over | 0 (0.0%) | 0 (0.0%) |
Disability Class: Self-Care Difficulty
| Age Bracket | Male | Female |
| 5 to 17 Years | 0 (0.0%) | 0 (0.0%) |
| 18 to 34 Years | 0 (0.0%) | 0 (0.0%) |
| 35 to 64 Years | 0 (0.0%) | 0 (0.0%) |
| 65 to 74 Years | 0 (0.0%) | 0 (0.0%) |
| 75 Years and over | 0 (0.0%) | 0 (0.0%) |
Technology Access in Wakulla
Computing Device Access in Wakulla
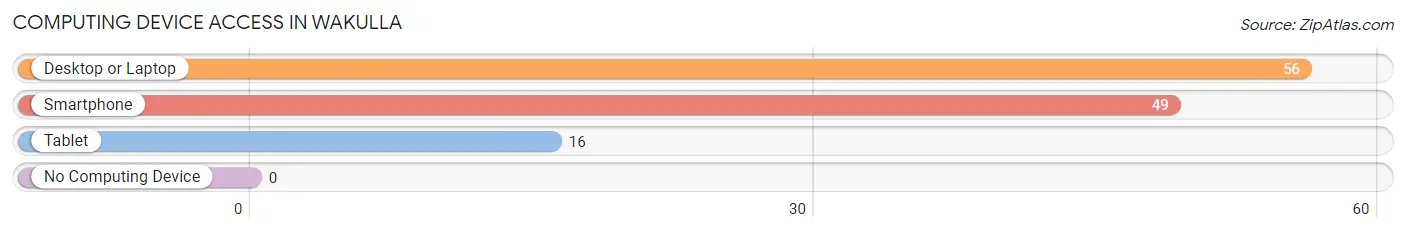
| Device Type | # Households | % Households |
| Desktop or Laptop | 56 | 100.0% |
| Smartphone | 49 | 87.5% |
| Tablet | 16 | 28.6% |
| No Computing Device | 0 | 0.0% |
| Total | 56 | 100.0% |
Internet Access in Wakulla
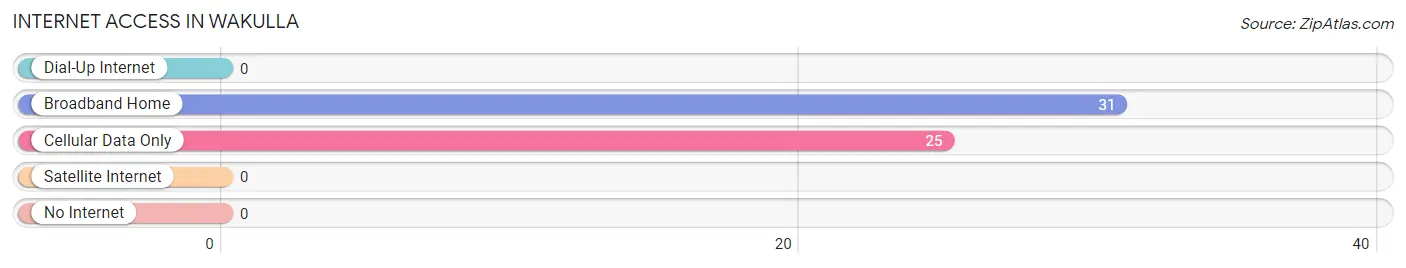
| Internet Type | # Households | % Households |
| Dial-Up Internet | 0 | 0.0% |
| Broadband Home | 31 | 55.4% |
| Cellular Data Only | 25 | 44.6% |
| Satellite Internet | 0 | 0.0% |
| No Internet | 0 | 0.0% |
| Total | 56 | 100.0% |
Wakulla Summary
Wakulla is a small unincorporated community located in the state of North Carolina, in the United States. It is situated in the western part of the state, in the foothills of the Blue Ridge Mountains. Wakulla is located in the county of Wilkes, and is part of the Hickory-Lenoir-Morganton Metropolitan Statistical Area.
History
The area that is now Wakulla was first settled in the late 1700s by a group of settlers from Scotland. The settlers named the area after the Wakulla River, which flows through the area. The river was named after the Native American tribe that lived in the area at the time. The settlers established a small farming community and built a church, which still stands today.
In the early 1800s, the area was home to a number of small mills, which provided employment for the local population. The mills were powered by the Wakulla River, and provided lumber and other goods to the local community.
In the late 1800s, the area began to experience a period of growth and development. The railroad arrived in the area in 1891, and the town of Wakulla was officially incorporated in 1895. The town quickly grew, and by the early 1900s, it had become a thriving community.
Geography
Wakulla is located in the western part of North Carolina, in the foothills of the Blue Ridge Mountains. The town is situated in Wilkes County, and is part of the Hickory-Lenoir-Morganton Metropolitan Statistical Area.
The town is located at an elevation of 1,400 feet above sea level, and is surrounded by rolling hills and forests. The town is located near the headwaters of the Yadkin River, and is close to the Blue Ridge Parkway.
The climate in Wakulla is mild and temperate, with warm summers and cool winters. The average annual temperature is around 60 degrees Fahrenheit, and the average annual precipitation is around 40 inches.
Economy
The economy of Wakulla is largely based on agriculture and tourism. The town is home to a number of small farms, which produce a variety of crops, including corn, soybeans, and tobacco. The town is also home to a number of small businesses, including restaurants, shops, and other services.
Tourism is an important part of the local economy, as the town is located near the Blue Ridge Parkway and other popular attractions. The town is also home to a number of historic sites, including the Wakulla Church, which was built in the late 1700s.
Demographics
As of the 2010 census, the population of Wakulla was 1,845. The racial makeup of the town was 95.3% White, 1.2% African American, 0.7% Native American, 0.3% Asian, 0.1% Pacific Islander, and 2.4% from other races. The median household income was $35,938, and the median family income was $41,250.
Conclusion
Wakulla is a small unincorporated community located in the western part of North Carolina. The town has a long history, and is home to a number of historic sites. The economy of Wakulla is largely based on agriculture and tourism, and the town is home to a diverse population. Wakulla is a great place to visit, and offers a unique experience for visitors.
Common Questions
What is Per Capita Income in Wakulla?
Per Capita income in Wakulla is $16,217.
What is Inequality or Gini Index in Wakulla?
Inequality or Gini Index in Wakulla is 0.42.
What is the Total Population of Wakulla?
Total Population of Wakulla is 147.
What is the Total Male Population of Wakulla?
Total Male Population of Wakulla is 57.
What is the Total Female Population of Wakulla?
Total Female Population of Wakulla is 90.
What is the Ratio of Males per 100 Females in Wakulla?
There are 63.33 Males per 100 Females in Wakulla.
What is the Ratio of Females per 100 Males in Wakulla?
There are 157.89 Females per 100 Males in Wakulla.
What is the Median Population Age in Wakulla?
Median Population Age in Wakulla is 23.6 Years.
What is the Average Family Size in Wakulla
Average Family Size in Wakulla is 4.1 People.
What is the Average Household Size in Wakulla
Average Household Size in Wakulla is 2.6 People.
How Large is the Labor Force in Wakulla?
There are 61 People in the Labor Forcein in Wakulla.
What is the Percentage of People in the Labor Force in Wakulla?
62.2% of People are in the Labor Force in Wakulla.