Whiteville, NC Map & Demographics
Whiteville Map
Whiteville Overview
$24,524
PER CAPITA INCOME
$53,606
AVG FAMILY INCOME
$34,121
AVG HOUSEHOLD INCOME
0.53
INEQUALITY / GINI INDEX
4,761
TOTAL POPULATION
2,216
MALE POPULATION
2,545
FEMALE POPULATION
87.07
MALES / 100 FEMALES
114.85
FEMALES / 100 MALES
38.0
MEDIAN AGE
3.3
AVG FAMILY SIZE
2.4
AVG HOUSEHOLD SIZE
2,067
LABOR FORCE [ PEOPLE ]
54.9%
PERCENT IN LABOR FORCE
4.8%
UNEMPLOYMENT RATE
Whiteville Zip Codes
Whiteville Area Codes
Income in Whiteville
Income Overview in Whiteville
Per Capita Income in Whiteville is $24,524, while median incomes of families and households are $53,606 and $34,121 respectively.
| Characteristic | Number | Measure |
| Per Capita Income | 4,761 | $24,524 |
| Median Family Income | 1,053 | $53,606 |
| Mean Family Income | 1,053 | $74,562 |
| Median Household Income | 1,865 | $34,121 |
| Mean Household Income | 1,865 | $57,049 |
| Income Deficit | 1,053 | $0 |
| Wage / Income Gap (%) | 4,761 | 0.00% |
| Wage / Income Gap ($) | 4,761 | 100.00¢ per $1 |
| Gini / Inequality Index | 4,761 | 0.53 |
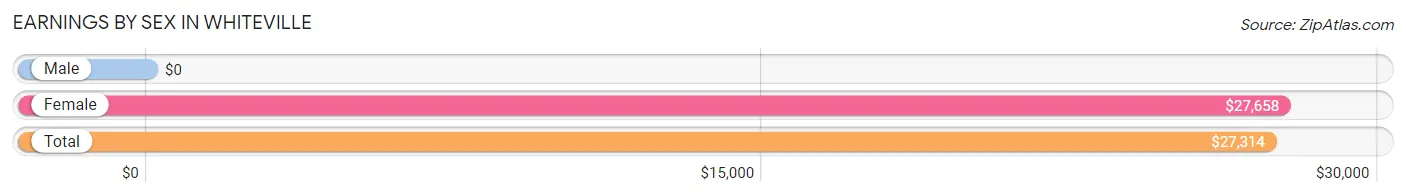
Earnings by Sex in Whiteville
| Sex | Number | Average Earnings |
| Male | 977 (47.0%) | $0 |
| Female | 1,102 (53.0%) | $27,658 |
| Total | 2,079 (100.0%) | $27,314 |
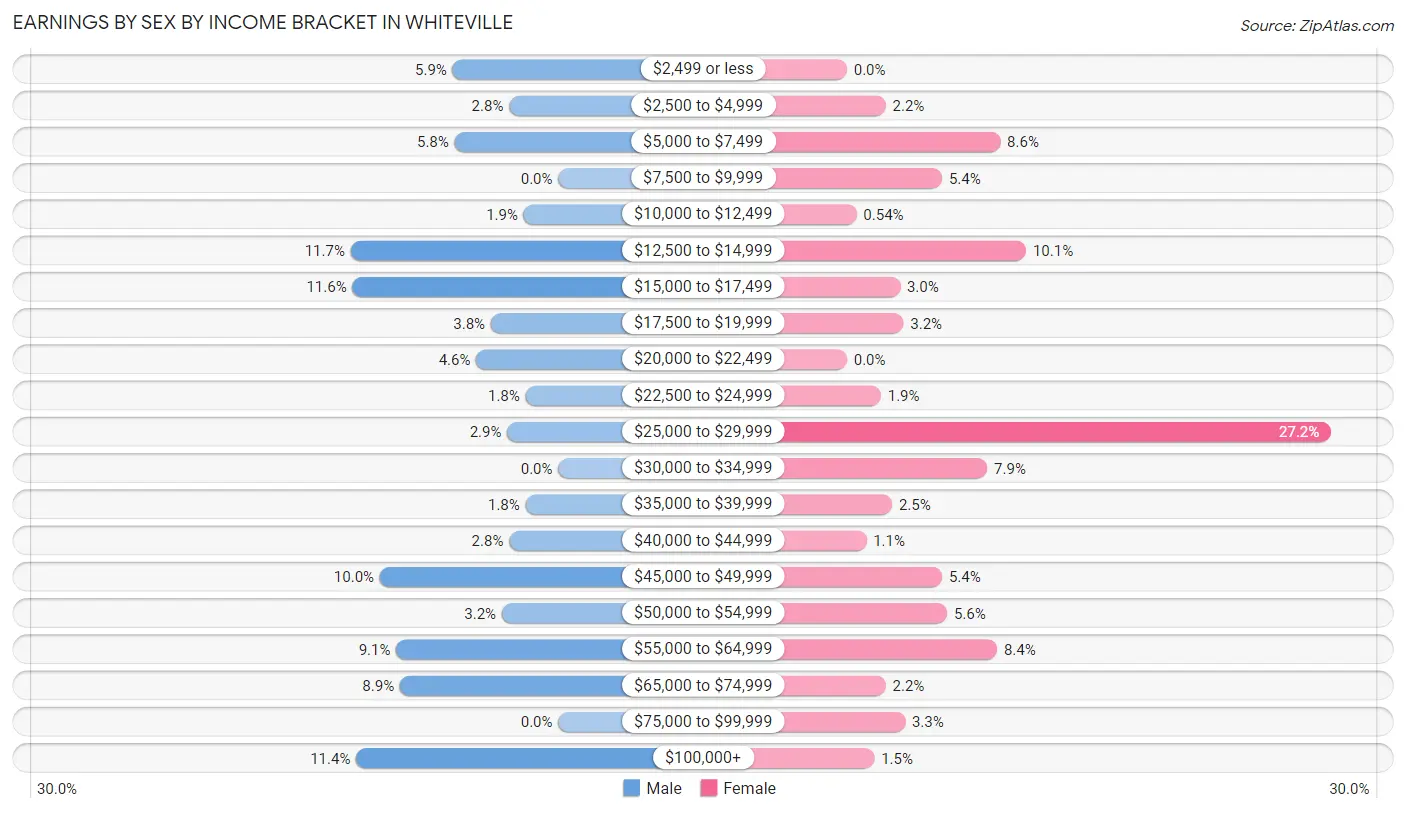
Earnings by Sex by Income Bracket in Whiteville
The most common earnings brackets in Whiteville are $12,500 to $14,999 for men (114 | 11.7%) and $25,000 to $29,999 for women (300 | 27.2%).
| Income | Male | Female |
| $2,499 or less | 58 (5.9%) | 0 (0.0%) |
| $2,500 to $4,999 | 27 (2.8%) | 24 (2.2%) |
| $5,000 to $7,499 | 57 (5.8%) | 95 (8.6%) |
| $7,500 to $9,999 | 0 (0.0%) | 59 (5.3%) |
| $10,000 to $12,499 | 19 (1.9%) | 6 (0.5%) |
| $12,500 to $14,999 | 114 (11.7%) | 111 (10.1%) |
| $15,000 to $17,499 | 113 (11.6%) | 33 (3.0%) |
| $17,500 to $19,999 | 37 (3.8%) | 35 (3.2%) |
| $20,000 to $22,499 | 45 (4.6%) | 0 (0.0%) |
| $22,500 to $24,999 | 18 (1.8%) | 21 (1.9%) |
| $25,000 to $29,999 | 28 (2.9%) | 300 (27.2%) |
| $30,000 to $34,999 | 0 (0.0%) | 87 (7.9%) |
| $35,000 to $39,999 | 18 (1.8%) | 28 (2.5%) |
| $40,000 to $44,999 | 27 (2.8%) | 12 (1.1%) |
| $45,000 to $49,999 | 98 (10.0%) | 59 (5.3%) |
| $50,000 to $54,999 | 31 (3.2%) | 62 (5.6%) |
| $55,000 to $64,999 | 89 (9.1%) | 93 (8.4%) |
| $65,000 to $74,999 | 87 (8.9%) | 24 (2.2%) |
| $75,000 to $99,999 | 0 (0.0%) | 36 (3.3%) |
| $100,000+ | 111 (11.4%) | 17 (1.5%) |
| Total | 977 (100.0%) | 1,102 (100.0%) |
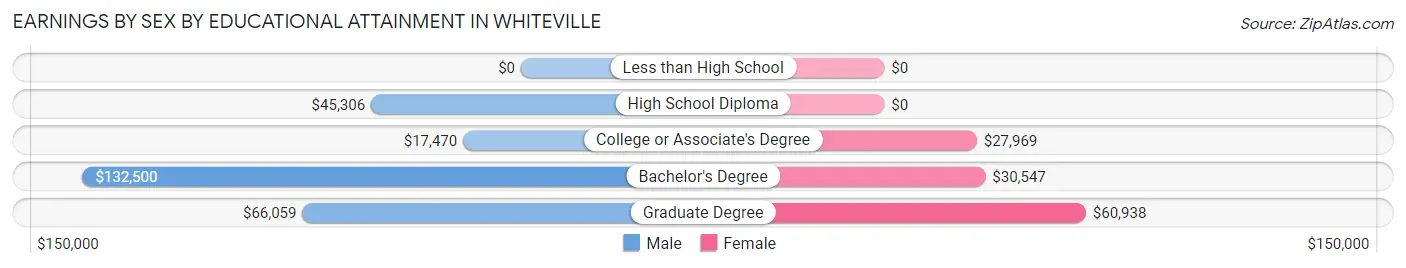
Earnings by Sex by Educational Attainment in Whiteville
Average earnings in Whiteville are $36,719 for men and $28,688 for women, a difference of 21.9%. Men with an educational attainment of bachelor's degree enjoy the highest average annual earnings of $132,500, while those with college or associate's degree education earn the least with $17,470. Women with an educational attainment of graduate degree earn the most with the average annual earnings of $60,938, while those with college or associate's degree education have the smallest earnings of $27,969.
| Educational Attainment | Male Income | Female Income |
| Less than High School | - | - |
| High School Diploma | $45,306 | $0 |
| College or Associate's Degree | $17,470 | $27,969 |
| Bachelor's Degree | $132,500 | $30,547 |
| Graduate Degree | $66,059 | $60,938 |
| Total | $36,719 | $28,688 |
Family Income in Whiteville
Family Income Brackets in Whiteville
According to the Whiteville family income data, there are 200 families falling into the $25,000 to $34,999 income range, which is the most common income bracket and makes up 19.0% of all families. Conversely, the $15,000 to $24,999 income bracket is the least frequent group with only 15 families (1.4%) belonging to this category.
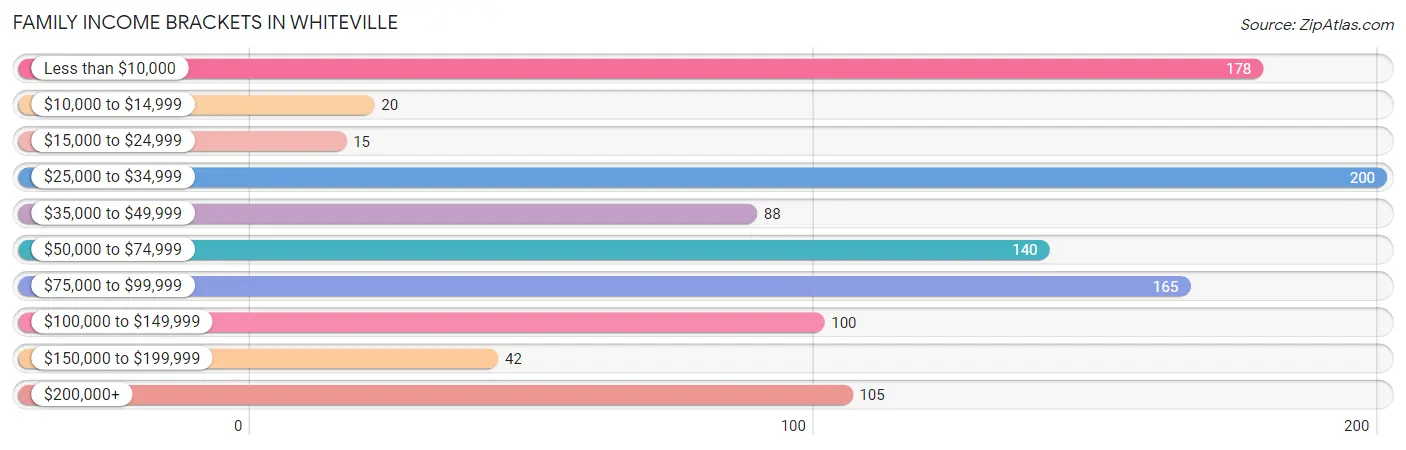
| Income Bracket | # Families | % Families |
| Less than $10,000 | 178 | 16.9% |
| $10,000 to $14,999 | 20 | 1.9% |
| $15,000 to $24,999 | 15 | 1.4% |
| $25,000 to $34,999 | 200 | 19.0% |
| $35,000 to $49,999 | 88 | 8.4% |
| $50,000 to $74,999 | 140 | 13.3% |
| $75,000 to $99,999 | 165 | 15.7% |
| $100,000 to $149,999 | 100 | 9.5% |
| $150,000 to $199,999 | 42 | 4.0% |
| $200,000+ | 105 | 10.0% |
Family Income by Famaliy Size in Whiteville
2-person families (677 | 64.3%) account for the highest median family income in Whiteville with $54,279 per family, while 2-person families (677 | 64.3%) have the highest median income of $27,140 per family member.
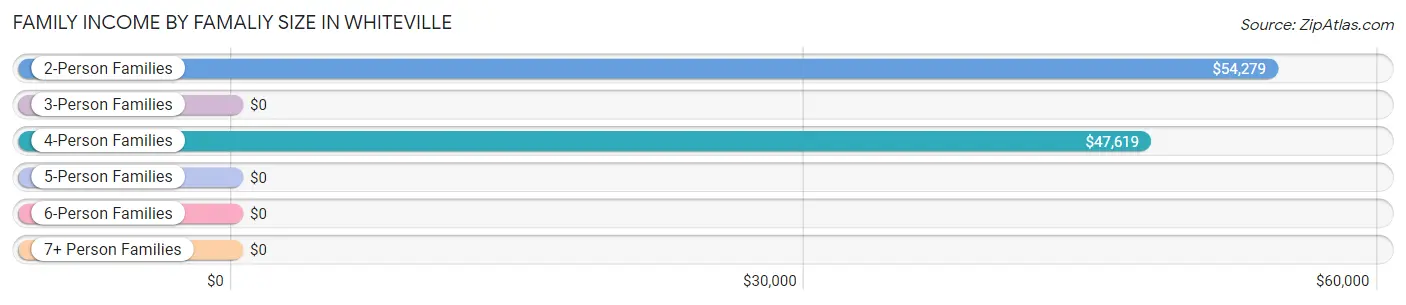
| Income Bracket | # Families | Median Income |
| 2-Person Families | 677 (64.3%) | $54,279 |
| 3-Person Families | 185 (17.6%) | $0 |
| 4-Person Families | 92 (8.7%) | $47,619 |
| 5-Person Families | 99 (9.4%) | $0 |
| 6-Person Families | 0 (0.0%) | $0 |
| 7+ Person Families | 0 (0.0%) | $0 |
| Total | 1,053 (100.0%) | $53,606 |
Family Income by Number of Earners in Whiteville
The median family income in Whiteville is $53,606, with families comprising 3+ earners (55) having the highest median family income of $238,555, while families with no earners (268) have the lowest median family income of $2,499, accounting for 5.2% and 25.5% of families, respectively.
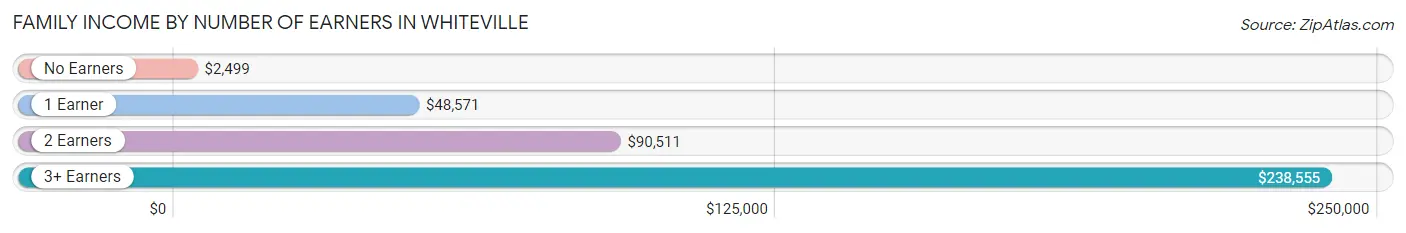
| Number of Earners | # Families | Median Income |
| No Earners | 268 (25.5%) | $2,499 |
| 1 Earner | 362 (34.4%) | $48,571 |
| 2 Earners | 368 (34.9%) | $90,511 |
| 3+ Earners | 55 (5.2%) | $238,555 |
| Total | 1,053 (100.0%) | $53,606 |
Household Income in Whiteville
Household Income Brackets in Whiteville
With 347 households falling in the category, the $25,000 to $34,999 income range is the most frequent in Whiteville, accounting for 18.6% of all households. In contrast, only 43 households (2.3%) fall into the $150,000 to $199,999 income bracket, making it the least populous group.
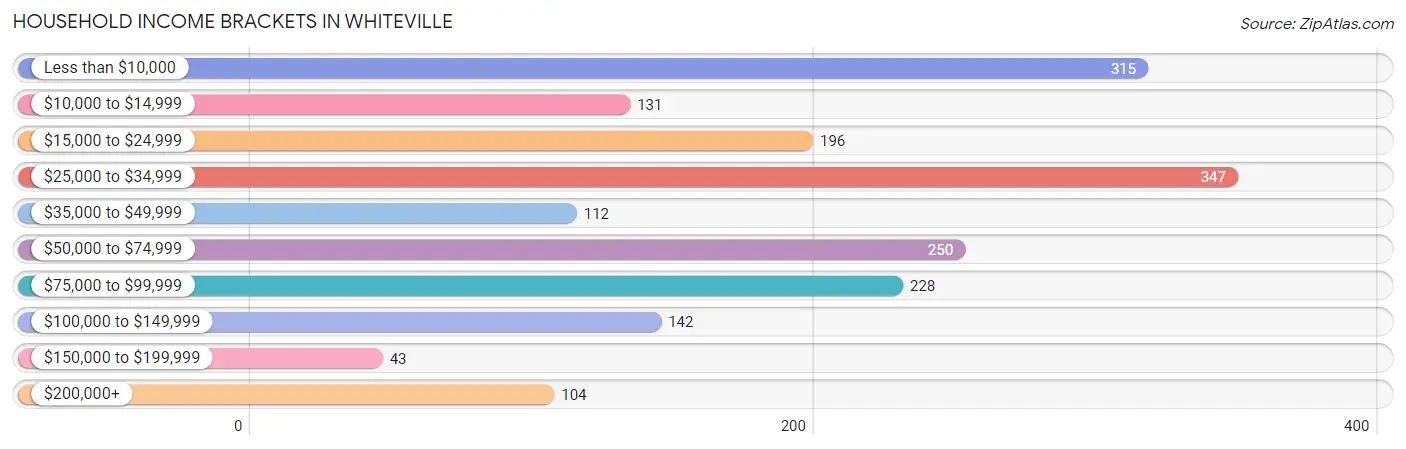
| Income Bracket | # Households | % Households |
| Less than $10,000 | 315 | 16.9% |
| $10,000 to $14,999 | 131 | 7.0% |
| $15,000 to $24,999 | 196 | 10.5% |
| $25,000 to $34,999 | 347 | 18.6% |
| $35,000 to $49,999 | 112 | 6.0% |
| $50,000 to $74,999 | 250 | 13.4% |
| $75,000 to $99,999 | 228 | 12.2% |
| $100,000 to $149,999 | 142 | 7.6% |
| $150,000 to $199,999 | 43 | 2.3% |
| $200,000+ | 104 | 5.6% |
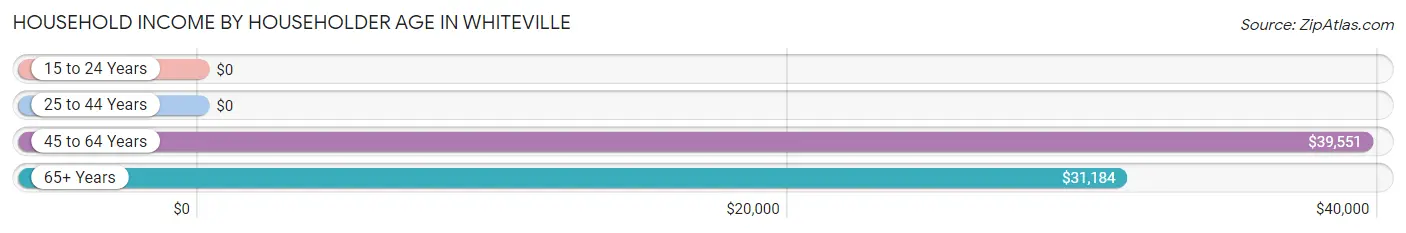
Household Income by Householder Age in Whiteville
The median household income in Whiteville is $34,121, with the highest median household income of $39,551 found in the 45 to 64 years age bracket for the primary householder. A total of 624 households (33.5%) fall into this category. Meanwhile, the 15 to 24 years age bracket for the primary householder has the lowest median household income of $0, with 68 households (3.6%) in this group.
| Income Bracket | # Households | Median Income |
| 15 to 24 Years | 68 (3.6%) | $0 |
| 25 to 44 Years | 493 (26.4%) | $0 |
| 45 to 64 Years | 624 (33.5%) | $39,551 |
| 65+ Years | 680 (36.5%) | $31,184 |
| Total | 1,865 (100.0%) | $34,121 |
Poverty in Whiteville
Income Below Poverty by Sex and Age in Whiteville
With 21.8% poverty level for males and 18.8% for females among the residents of Whiteville, 12 to 14 year old males and 6 to 11 year old females are the most vulnerable to poverty, with 53 males (60.9%) and 98 females (59.8%) in their respective age groups living below the poverty level.
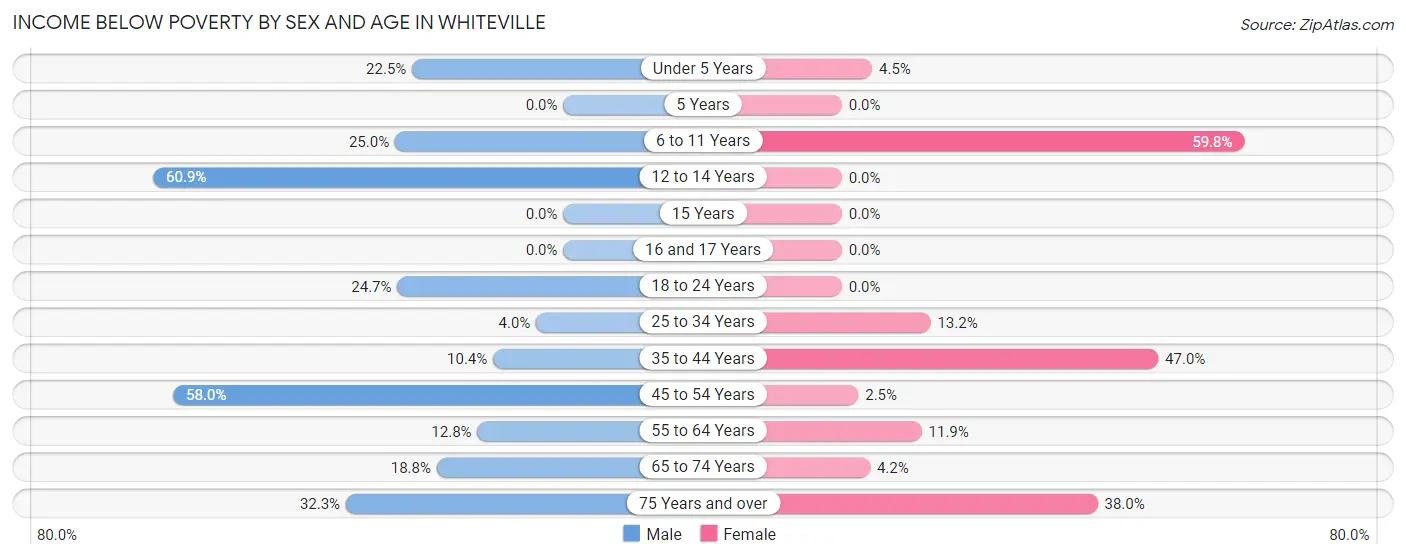
| Age Bracket | Male | Female |
| Under 5 Years | 22 (22.5%) | 9 (4.5%) |
| 5 Years | 0 (0.0%) | 0 (0.0%) |
| 6 to 11 Years | 60 (25.0%) | 98 (59.8%) |
| 12 to 14 Years | 53 (60.9%) | 0 (0.0%) |
| 15 Years | 0 (0.0%) | 0 (0.0%) |
| 16 and 17 Years | 0 (0.0%) | 0 (0.0%) |
| 18 to 24 Years | 35 (24.6%) | 0 (0.0%) |
| 25 to 34 Years | 17 (4.0%) | 22 (13.2%) |
| 35 to 44 Years | 17 (10.4%) | 210 (47.0%) |
| 45 to 54 Years | 113 (58.0%) | 6 (2.5%) |
| 55 to 64 Years | 25 (12.8%) | 48 (11.8%) |
| 65 to 74 Years | 56 (18.8%) | 12 (4.2%) |
| 75 Years and over | 51 (32.3%) | 60 (38.0%) |
| Total | 449 (21.8%) | 465 (18.8%) |
Income Above Poverty by Sex and Age in Whiteville
According to the poverty statistics in Whiteville, males aged 15 years and females aged 5 years are the age groups that are most secure financially, with 100.0% of males and 100.0% of females in these age groups living above the poverty line.
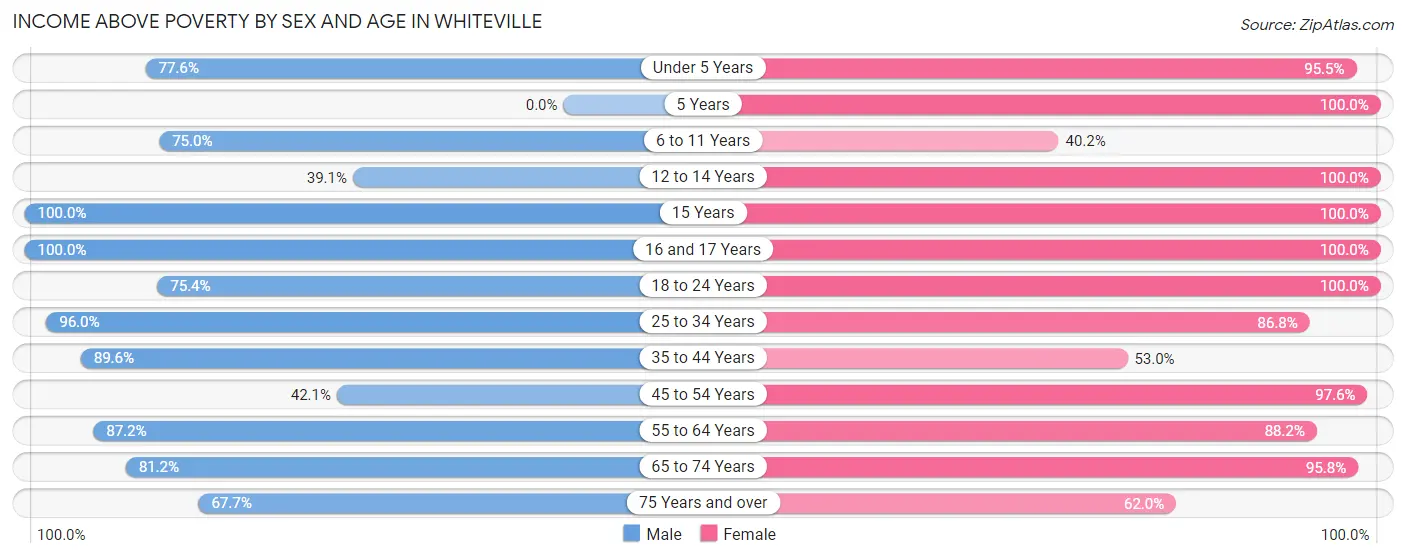
| Age Bracket | Male | Female |
| Under 5 Years | 76 (77.5%) | 191 (95.5%) |
| 5 Years | 0 (0.0%) | 96 (100.0%) |
| 6 to 11 Years | 180 (75.0%) | 66 (40.2%) |
| 12 to 14 Years | 34 (39.1%) | 74 (100.0%) |
| 15 Years | 7 (100.0%) | 23 (100.0%) |
| 16 and 17 Years | 57 (100.0%) | 21 (100.0%) |
| 18 to 24 Years | 107 (75.3%) | 187 (100.0%) |
| 25 to 34 Years | 405 (96.0%) | 145 (86.8%) |
| 35 to 44 Years | 146 (89.6%) | 237 (53.0%) |
| 45 to 54 Years | 82 (42.0%) | 239 (97.6%) |
| 55 to 64 Years | 171 (87.2%) | 357 (88.1%) |
| 65 to 74 Years | 242 (81.2%) | 275 (95.8%) |
| 75 Years and over | 107 (67.7%) | 98 (62.0%) |
| Total | 1,614 (78.2%) | 2,009 (81.2%) |
Income Below Poverty Among Married-Couple Families in Whiteville
The poverty statistics for married-couple families in Whiteville show that 15.7% or 91 of the total 579 families live below the poverty line. Families with 1 or 2 children have the highest poverty rate of 47.1%, comprising of 82 families. On the other hand, families with 3 or 4 children have the lowest poverty rate of 0.0%, which includes 0 families.
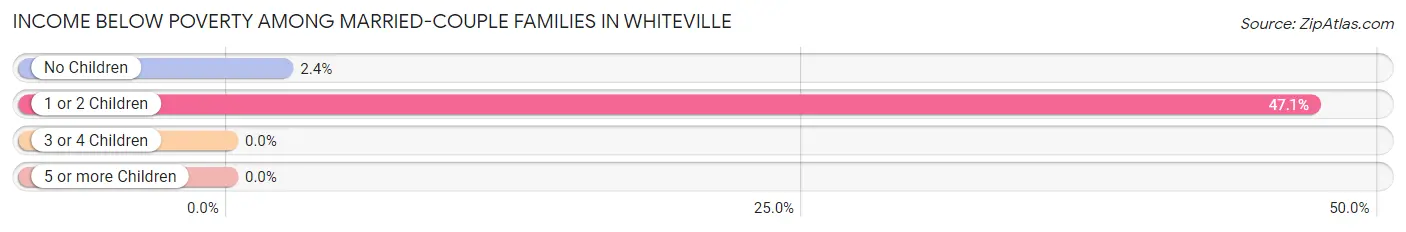
| Children | Above Poverty | Below Poverty |
| No Children | 364 (97.6%) | 9 (2.4%) |
| 1 or 2 Children | 92 (52.9%) | 82 (47.1%) |
| 3 or 4 Children | 32 (100.0%) | 0 (0.0%) |
| 5 or more Children | 0 (0.0%) | 0 (0.0%) |
| Total | 488 (84.3%) | 91 (15.7%) |
Income Below Poverty Among Single-Parent Households in Whiteville
According to the poverty data in Whiteville, 42.0% or 34 single-father households and 23.9% or 94 single-mother households are living below the poverty line. Among single-father households, those with 1 or 2 children have the highest poverty rate, with 20 households (60.6%) experiencing poverty. Likewise, among single-mother households, those with 1 or 2 children have the highest poverty rate, with 88 households (41.9%) falling below the poverty line.
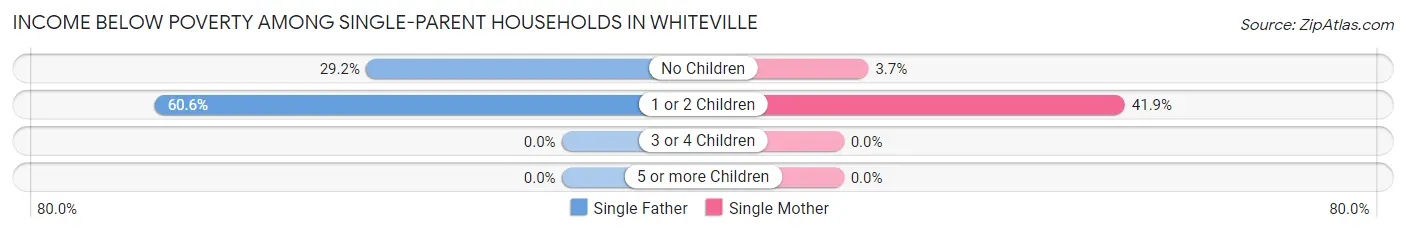
| Children | Single Father | Single Mother |
| No Children | 14 (29.2%) | 6 (3.7%) |
| 1 or 2 Children | 20 (60.6%) | 88 (41.9%) |
| 3 or 4 Children | 0 (0.0%) | 0 (0.0%) |
| 5 or more Children | 0 (0.0%) | 0 (0.0%) |
| Total | 34 (42.0%) | 94 (23.9%) |
Income Below Poverty Among Married-Couple vs Single-Parent Households in Whiteville
The poverty data for Whiteville shows that 91 of the married-couple family households (15.7%) and 128 of the single-parent households (27.0%) are living below the poverty level. Within the married-couple family households, those with 1 or 2 children have the highest poverty rate, with 82 households (47.1%) falling below the poverty line. Among the single-parent households, those with 1 or 2 children have the highest poverty rate, with 108 household (44.4%) living below poverty.
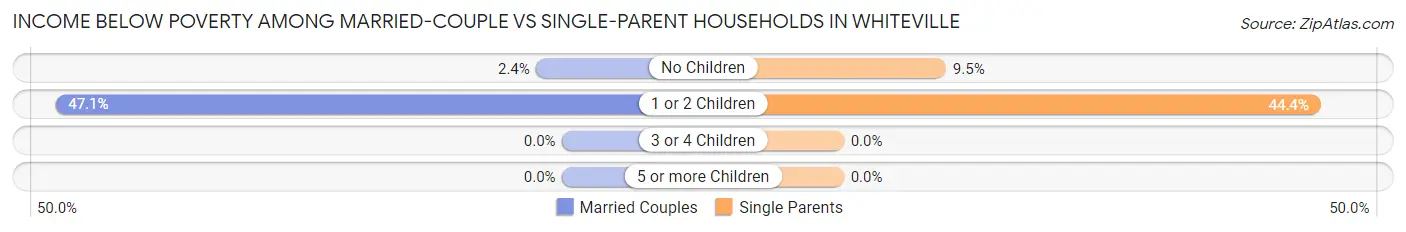
| Children | Married-Couple Families | Single-Parent Households |
| No Children | 9 (2.4%) | 20 (9.5%) |
| 1 or 2 Children | 82 (47.1%) | 108 (44.4%) |
| 3 or 4 Children | 0 (0.0%) | 0 (0.0%) |
| 5 or more Children | 0 (0.0%) | 0 (0.0%) |
| Total | 91 (15.7%) | 128 (27.0%) |
Race in Whiteville
The most populous races in Whiteville are Black / African American (2,133 | 44.8%), White / Caucasian (1,999 | 42.0%), and Two or more Races (527 | 11.1%).
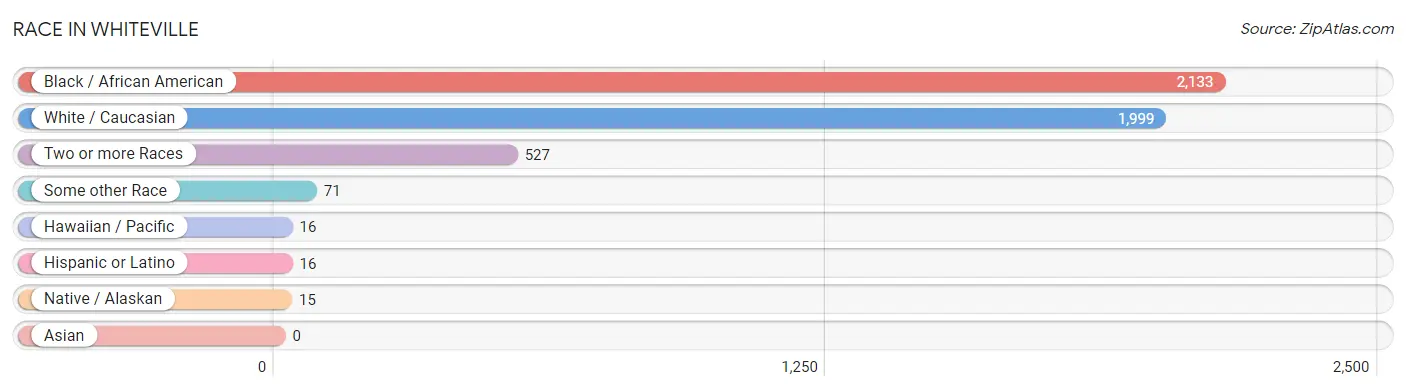
| Race | # Population | % Population |
| Asian | 0 | 0.0% |
| Black / African American | 2,133 | 44.8% |
| Hawaiian / Pacific | 16 | 0.3% |
| Hispanic or Latino | 16 | 0.3% |
| Native / Alaskan | 15 | 0.3% |
| White / Caucasian | 1,999 | 42.0% |
| Two or more Races | 527 | 11.1% |
| Some other Race | 71 | 1.5% |
| Total | 4,761 | 100.0% |
Ancestry in Whiteville
The most populous ancestries reported in Whiteville are American (1,257 | 26.4%), English (244 | 5.1%), Cherokee (223 | 4.7%), Irish (91 | 1.9%), and Scottish (67 | 1.4%), together accounting for 39.5% of all Whiteville residents.
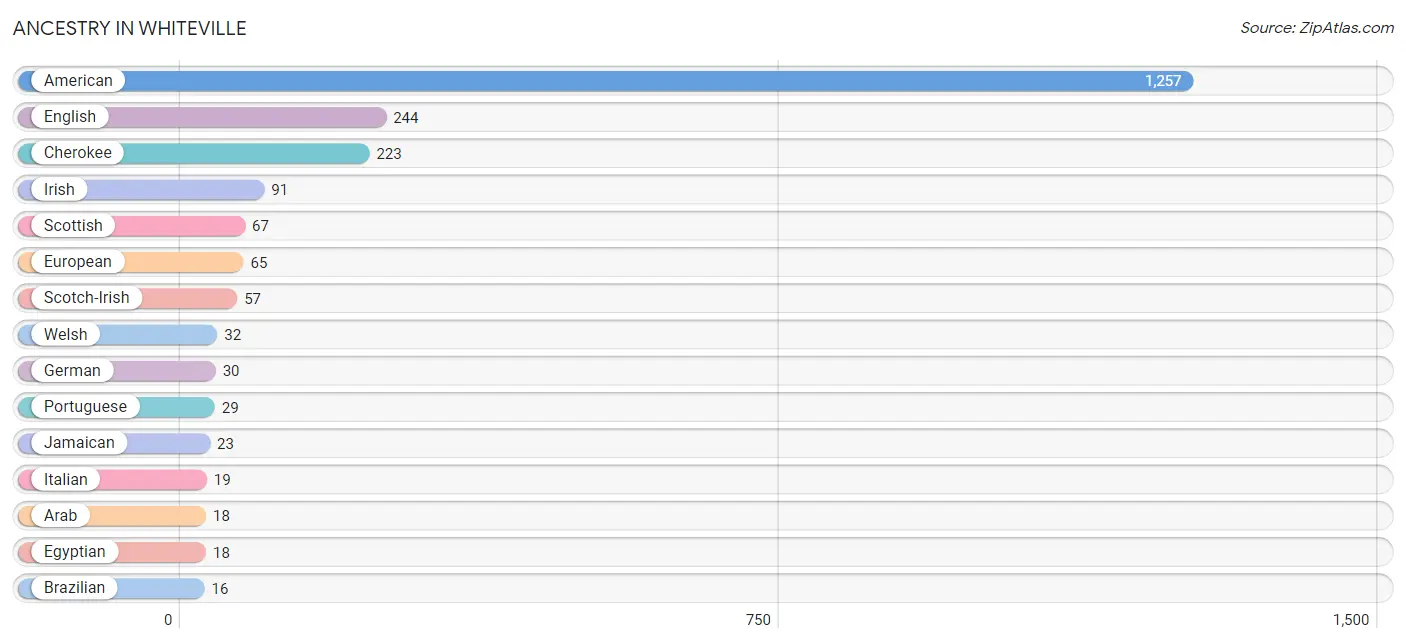
| Ancestry | # Population | % Population |
| African | 13 | 0.3% |
| American | 1,257 | 26.4% |
| Arab | 18 | 0.4% |
| Brazilian | 16 | 0.3% |
| British | 7 | 0.2% |
| Canadian | 15 | 0.3% |
| Cherokee | 223 | 4.7% |
| Dutch | 13 | 0.3% |
| Egyptian | 18 | 0.4% |
| English | 244 | 5.1% |
| European | 65 | 1.4% |
| German | 30 | 0.6% |
| Irish | 91 | 1.9% |
| Italian | 19 | 0.4% |
| Jamaican | 23 | 0.5% |
| Lumbee | 8 | 0.2% |
| Mexican | 16 | 0.3% |
| Norwegian | 16 | 0.3% |
| Polish | 10 | 0.2% |
| Portuguese | 29 | 0.6% |
| Samoan | 16 | 0.3% |
| Scotch-Irish | 57 | 1.2% |
| Scottish | 67 | 1.4% |
| Subsaharan African | 13 | 0.3% |
| Welsh | 32 | 0.7% | View All 25 Rows |
Immigrants in Whiteville
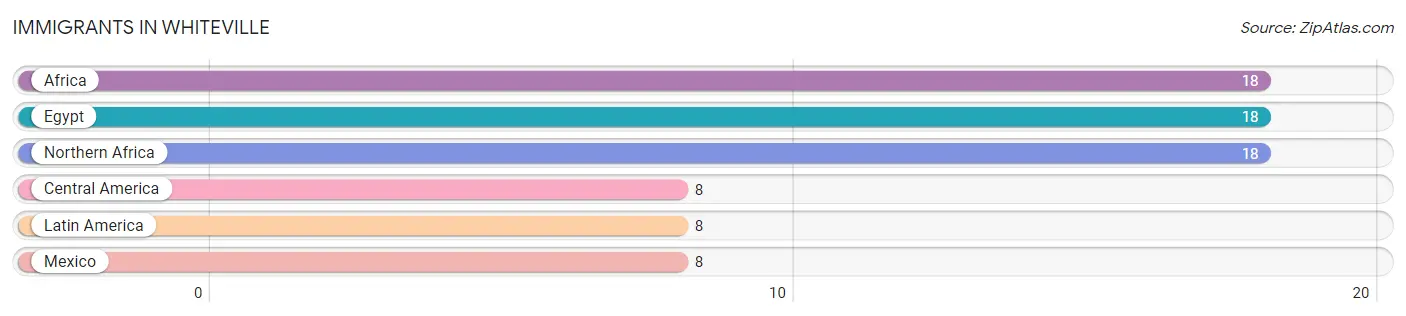
The most numerous immigrant groups reported in Whiteville came from Africa (18 | 0.4%), Egypt (18 | 0.4%), Northern Africa (18 | 0.4%), Central America (8 | 0.2%), and Latin America (8 | 0.2%), together accounting for 1.5% of all Whiteville residents.
| Immigration Origin | # Population | % Population |
| Africa | 18 | 0.4% |
| Central America | 8 | 0.2% |
| Egypt | 18 | 0.4% |
| Latin America | 8 | 0.2% |
| Mexico | 8 | 0.2% |
| Northern Africa | 18 | 0.4% | View All 6 Rows |
Sex and Age in Whiteville
Sex and Age in Whiteville
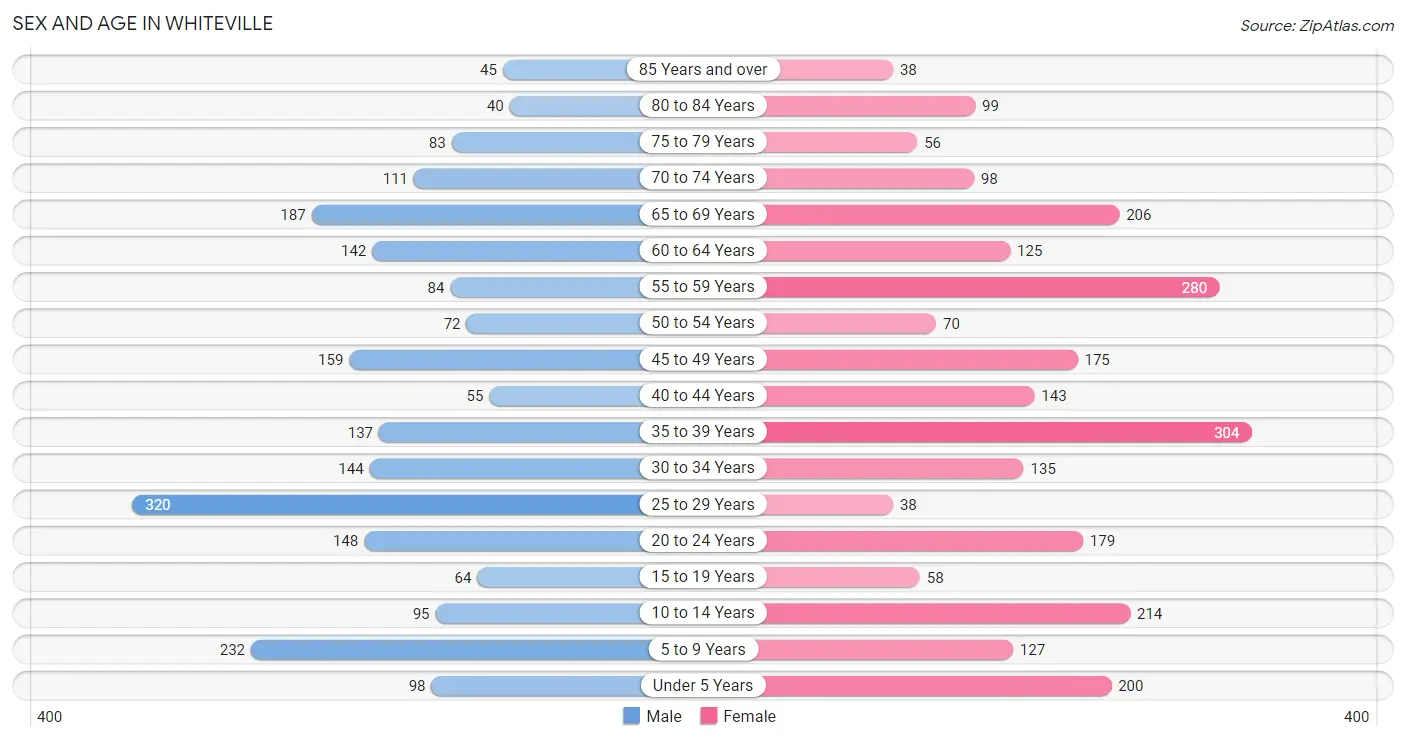
The most populous age groups in Whiteville are 25 to 29 Years (320 | 14.4%) for men and 35 to 39 Years (304 | 11.9%) for women.
| Age Bracket | Male | Female |
| Under 5 Years | 98 (4.4%) | 200 (7.9%) |
| 5 to 9 Years | 232 (10.5%) | 127 (5.0%) |
| 10 to 14 Years | 95 (4.3%) | 214 (8.4%) |
| 15 to 19 Years | 64 (2.9%) | 58 (2.3%) |
| 20 to 24 Years | 148 (6.7%) | 179 (7.0%) |
| 25 to 29 Years | 320 (14.4%) | 38 (1.5%) |
| 30 to 34 Years | 144 (6.5%) | 135 (5.3%) |
| 35 to 39 Years | 137 (6.2%) | 304 (11.9%) |
| 40 to 44 Years | 55 (2.5%) | 143 (5.6%) |
| 45 to 49 Years | 159 (7.2%) | 175 (6.9%) |
| 50 to 54 Years | 72 (3.3%) | 70 (2.8%) |
| 55 to 59 Years | 84 (3.8%) | 280 (11.0%) |
| 60 to 64 Years | 142 (6.4%) | 125 (4.9%) |
| 65 to 69 Years | 187 (8.4%) | 206 (8.1%) |
| 70 to 74 Years | 111 (5.0%) | 98 (3.8%) |
| 75 to 79 Years | 83 (3.7%) | 56 (2.2%) |
| 80 to 84 Years | 40 (1.8%) | 99 (3.9%) |
| 85 Years and over | 45 (2.0%) | 38 (1.5%) |
| Total | 2,216 (100.0%) | 2,545 (100.0%) |
Families and Households in Whiteville
Median Family Size in Whiteville
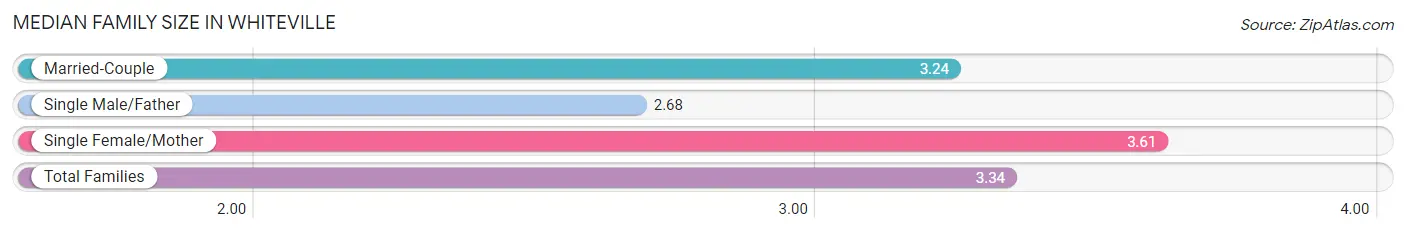
The median family size in Whiteville is 3.34 persons per family, with single female/mother families (393 | 37.3%) accounting for the largest median family size of 3.61 persons per family. On the other hand, single male/father families (81 | 7.7%) represent the smallest median family size with 2.68 persons per family.
| Family Type | # Families | Family Size |
| Married-Couple | 579 (55.0%) | 3.24 |
| Single Male/Father | 81 (7.7%) | 2.68 |
| Single Female/Mother | 393 (37.3%) | 3.61 |
| Total Families | 1,053 (100.0%) | 3.34 |
Median Household Size in Whiteville
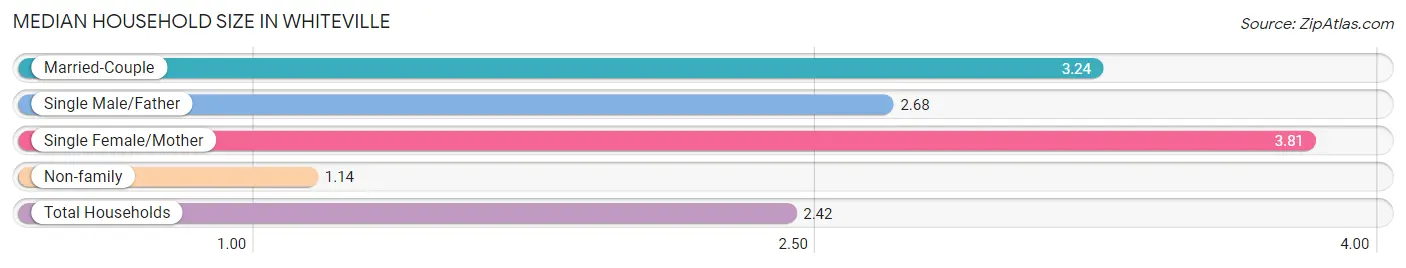
The median household size in Whiteville is 2.42 persons per household, with single female/mother households (393 | 21.1%) accounting for the largest median household size of 3.81 persons per household. non-family households (812 | 43.5%) represent the smallest median household size with 1.14 persons per household.
| Household Type | # Households | Household Size |
| Married-Couple | 579 (31.0%) | 3.24 |
| Single Male/Father | 81 (4.3%) | 2.68 |
| Single Female/Mother | 393 (21.1%) | 3.81 |
| Non-family | 812 (43.5%) | 1.14 |
| Total Households | 1,865 (100.0%) | 2.42 |
Household Size by Marriage Status in Whiteville
Out of a total of 1,865 households in Whiteville, 1,053 (56.5%) are family households, while 812 (43.5%) are nonfamily households. The most numerous type of family households are 2-person households, comprising 677, and the most common type of nonfamily households are 1-person households, comprising 747.
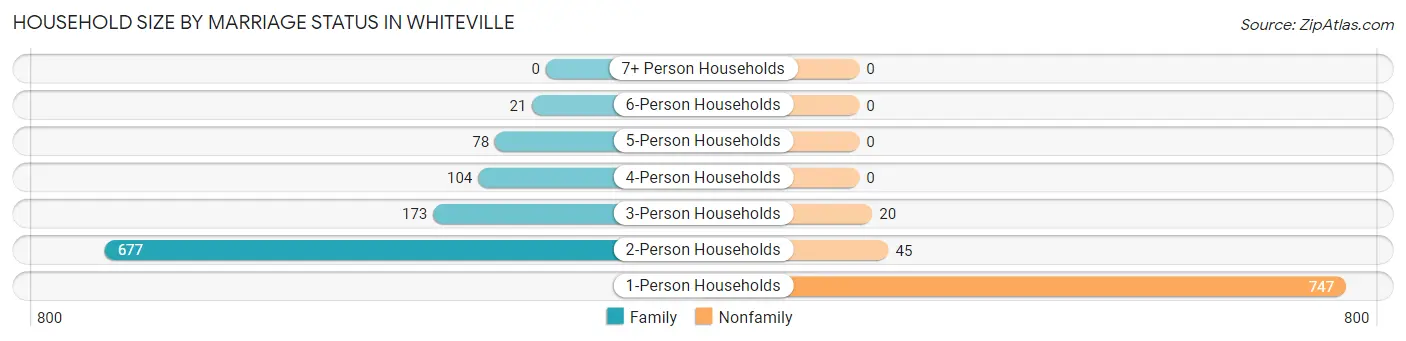
| Household Size | Family Households | Nonfamily Households |
| 1-Person Households | - | 747 (40.1%) |
| 2-Person Households | 677 (36.3%) | 45 (2.4%) |
| 3-Person Households | 173 (9.3%) | 20 (1.1%) |
| 4-Person Households | 104 (5.6%) | 0 (0.0%) |
| 5-Person Households | 78 (4.2%) | 0 (0.0%) |
| 6-Person Households | 21 (1.1%) | 0 (0.0%) |
| 7+ Person Households | 0 (0.0%) | 0 (0.0%) |
| Total | 1,053 (56.5%) | 812 (43.5%) |
Female Fertility in Whiteville
Fertility by Age in Whiteville
| Age Bracket | Women with Births | Births / 1,000 Women |
| 15 to 19 years | 0 (0.0%) | 0.0 |
| 20 to 34 years | 0 (0.0%) | 0.0 |
| 35 to 50 years | 0 (0.0%) | 0.0 |
| Total | 0 (0.0%) | 0.0 |
Fertility by Age by Marriage Status in Whiteville
| Age Bracket | Married | Unmarried |
| 15 to 19 years | 0 (0.0%) | 0 (0.0%) |
| 20 to 34 years | 0 (0.0%) | 0 (0.0%) |
| 35 to 50 years | 0 (0.0%) | 0 (0.0%) |
| Total | 0 (0.0%) | 0 (0.0%) |
Fertility by Education in Whiteville
| Educational Attainment | Women with Births | Births / 1,000 Women |
| Less than High School | 0 (0.0%) | 0.0 |
| High School Diploma | 0 (0.0%) | 0.0 |
| College or Associate's Degree | 0 (0.0%) | 0.0 |
| Bachelor's Degree | 0 (0.0%) | 0.0 |
| Graduate Degree | 0 (0.0%) | 0.0 |
| Total | 0 (0.0%) | 0.0 |
Fertility by Education by Marriage Status in Whiteville
| Educational Attainment | Married | Unmarried |
| Less than High School | 0 (0.0%) | 0 (0.0%) |
| High School Diploma | 0 (0.0%) | 0 (0.0%) |
| College or Associate's Degree | 0 (0.0%) | 0 (0.0%) |
| Bachelor's Degree | 0 (0.0%) | 0 (0.0%) |
| Graduate Degree | 0 (0.0%) | 0 (0.0%) |
| Total | 0 (0.0%) | 0 (0.0%) |
Employment Characteristics in Whiteville
Employment by Class of Employer in Whiteville
Among the 1,923 employed individuals in Whiteville, private company employees (1,229 | 63.9%), not-for-profit organizations (235 | 12.2%), and self-employed (incorporated) (130 | 6.8%) make up the most common classes of employment.
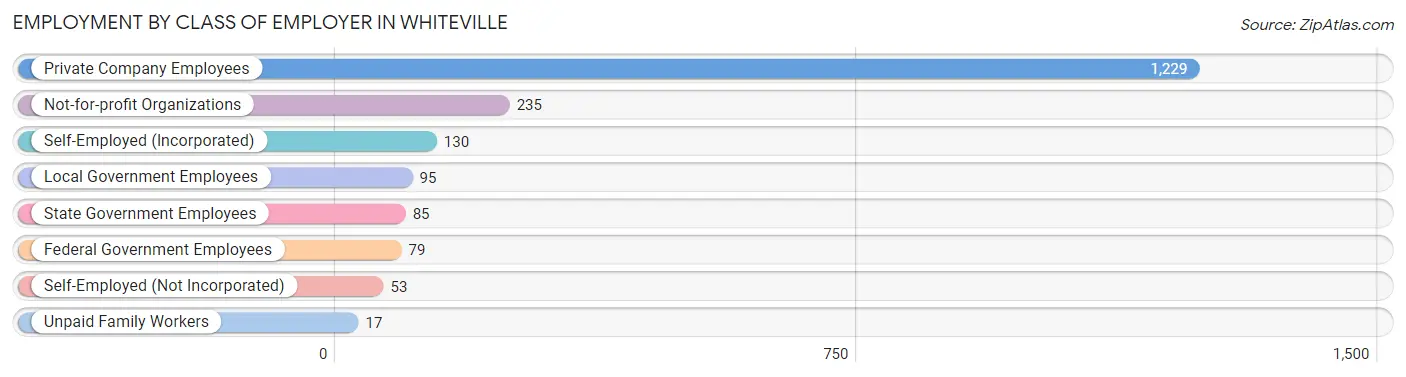
| Employer Class | # Employees | % Employees |
| Private Company Employees | 1,229 | 63.9% |
| Self-Employed (Incorporated) | 130 | 6.8% |
| Self-Employed (Not Incorporated) | 53 | 2.8% |
| Not-for-profit Organizations | 235 | 12.2% |
| Local Government Employees | 95 | 4.9% |
| State Government Employees | 85 | 4.4% |
| Federal Government Employees | 79 | 4.1% |
| Unpaid Family Workers | 17 | 0.9% |
| Total | 1,923 | 100.0% |
Employment Status by Age in Whiteville
According to the labor force statistics for Whiteville, out of the total population over 16 years of age (3,765), 54.9% or 2,067 individuals are in the labor force, with 4.8% or 99 of them unemployed. The age group with the highest labor force participation rate is 25 to 29 years, with 92.5% or 331 individuals in the labor force. Within the labor force, the 35 to 44 years age range has the highest percentage of unemployed individuals, with 9.4% or 41 of them being unemployed.
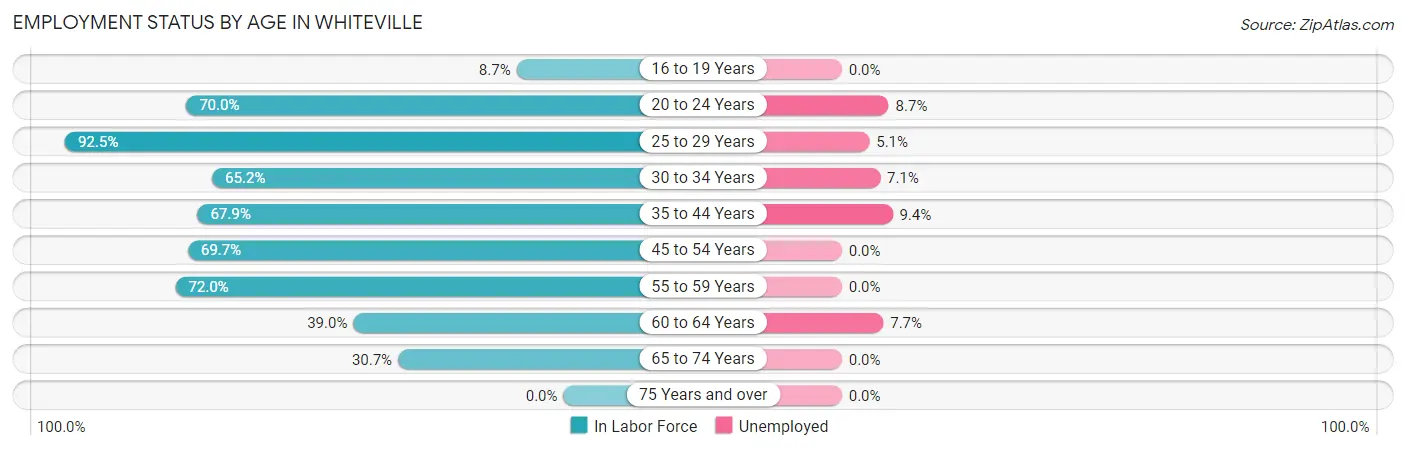
| Age Bracket | In Labor Force | Unemployed |
| 16 to 19 Years | 8 (8.7%) | 0 (0.0%) |
| 20 to 24 Years | 229 (70.0%) | 20 (8.7%) |
| 25 to 29 Years | 331 (92.5%) | 17 (5.1%) |
| 30 to 34 Years | 182 (65.2%) | 13 (7.1%) |
| 35 to 44 Years | 434 (67.9%) | 41 (9.4%) |
| 45 to 54 Years | 332 (69.7%) | 0 (0.0%) |
| 55 to 59 Years | 262 (72.0%) | 0 (0.0%) |
| 60 to 64 Years | 104 (39.0%) | 8 (7.7%) |
| 65 to 74 Years | 185 (30.7%) | 0 (0.0%) |
| 75 Years and over | 0 (0.0%) | 0 (0.0%) |
| Total | 2,067 (54.9%) | 99 (4.8%) |
Employment Status by Educational Attainment in Whiteville
According to labor force statistics for Whiteville, 69.0% of individuals (1,644) out of the total population between 25 and 64 years of age (2,383) are in the labor force, with 4.8% or 79 of them being unemployed. The group with the highest labor force participation rate are those with the educational attainment of college / associate degree, with 83.7% or 728 individuals in the labor force. Within the labor force, individuals with less than high school education have the highest percentage of unemployment, with 24.3% or 17 of them being unemployed.
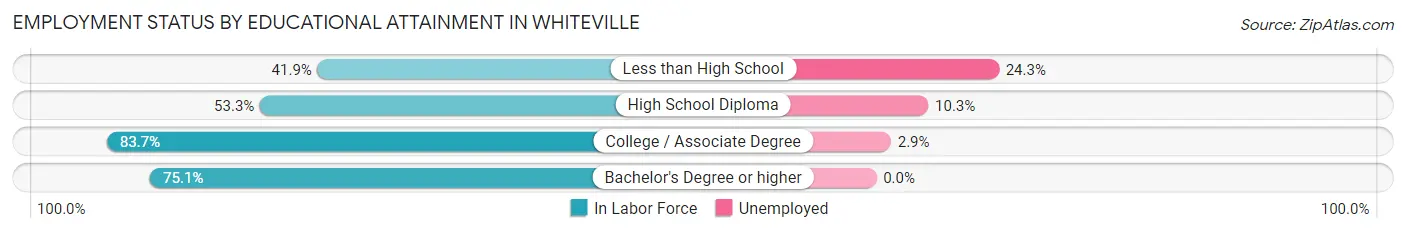
| Educational Attainment | In Labor Force | Unemployed |
| Less than High School | 70 (41.9%) | 41 (24.3%) |
| High School Diploma | 400 (53.3%) | 77 (10.3%) |
| College / Associate Degree | 728 (83.7%) | 25 (2.9%) |
| Bachelor's Degree or higher | 447 (75.1%) | 0 (0.0%) |
| Total | 1,644 (69.0%) | 114 (4.8%) |
Employment Occupations by Sex in Whiteville
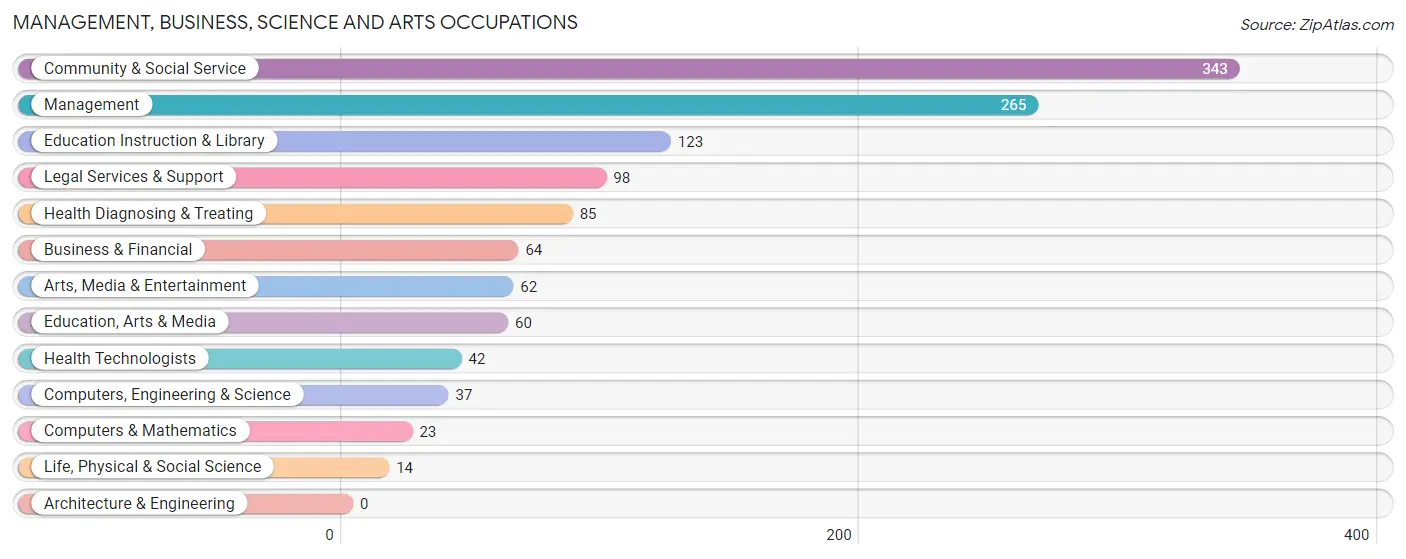
Management, Business, Science and Arts Occupations
The most common Management, Business, Science and Arts occupations in Whiteville are Community & Social Service (343 | 17.4%), Management (265 | 13.5%), Education Instruction & Library (123 | 6.2%), Legal Services & Support (98 | 5.0%), and Health Diagnosing & Treating (85 | 4.3%).
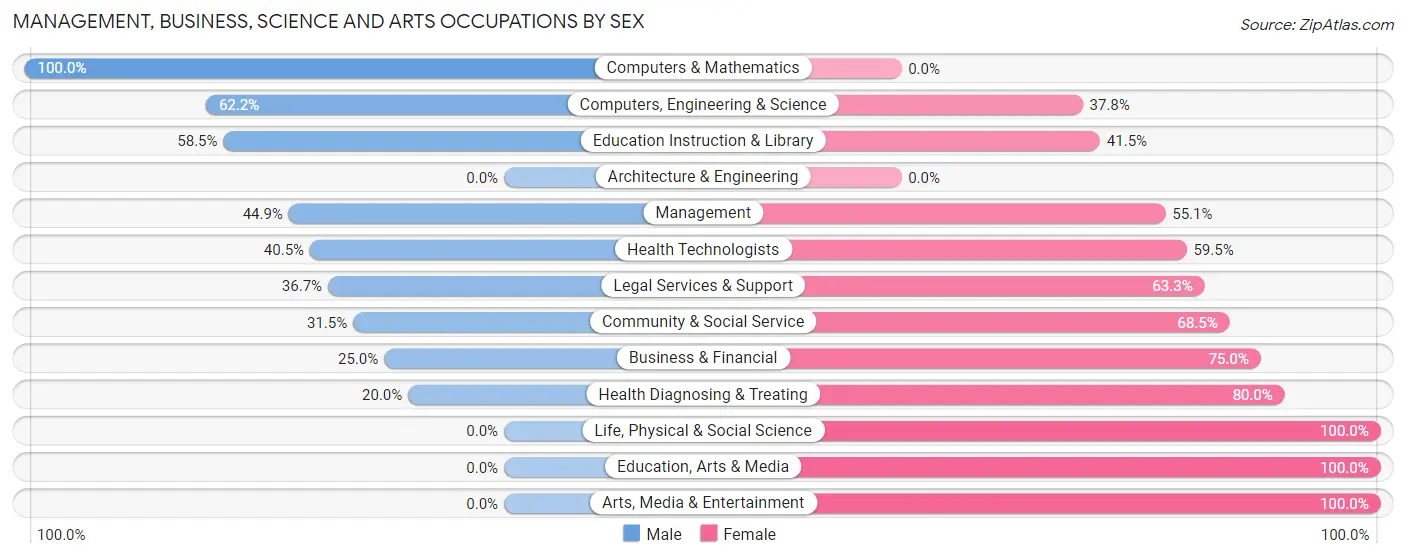
Management, Business, Science and Arts Occupations by Sex
Within the Management, Business, Science and Arts occupations in Whiteville, the most male-oriented occupations are Computers & Mathematics (100.0%), Computers, Engineering & Science (62.2%), and Education Instruction & Library (58.5%), while the most female-oriented occupations are Life, Physical & Social Science (100.0%), Education, Arts & Media (100.0%), and Arts, Media & Entertainment (100.0%).
| Occupation | Male | Female |
| Management | 119 (44.9%) | 146 (55.1%) |
| Business & Financial | 16 (25.0%) | 48 (75.0%) |
| Computers, Engineering & Science | 23 (62.2%) | 14 (37.8%) |
| Computers & Mathematics | 23 (100.0%) | 0 (0.0%) |
| Architecture & Engineering | 0 (0.0%) | 0 (0.0%) |
| Life, Physical & Social Science | 0 (0.0%) | 14 (100.0%) |
| Community & Social Service | 108 (31.5%) | 235 (68.5%) |
| Education, Arts & Media | 0 (0.0%) | 60 (100.0%) |
| Legal Services & Support | 36 (36.7%) | 62 (63.3%) |
| Education Instruction & Library | 72 (58.5%) | 51 (41.5%) |
| Arts, Media & Entertainment | 0 (0.0%) | 62 (100.0%) |
| Health Diagnosing & Treating | 17 (20.0%) | 68 (80.0%) |
| Health Technologists | 17 (40.5%) | 25 (59.5%) |
| Total (Category) | 283 (35.6%) | 511 (64.4%) |
| Total (Overall) | 892 (45.3%) | 1,076 (54.7%) |
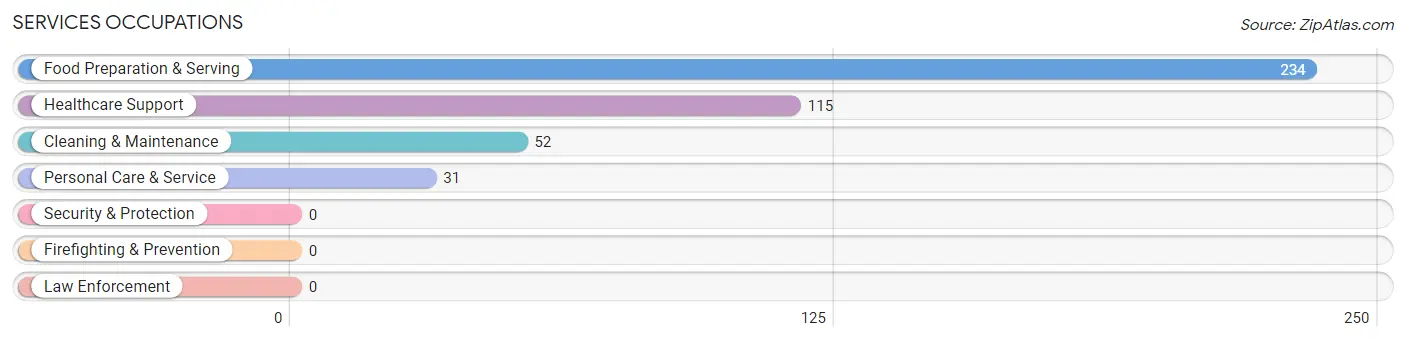
Services Occupations
The most common Services occupations in Whiteville are Food Preparation & Serving (234 | 11.9%), Healthcare Support (115 | 5.8%), Cleaning & Maintenance (52 | 2.6%), and Personal Care & Service (31 | 1.6%).
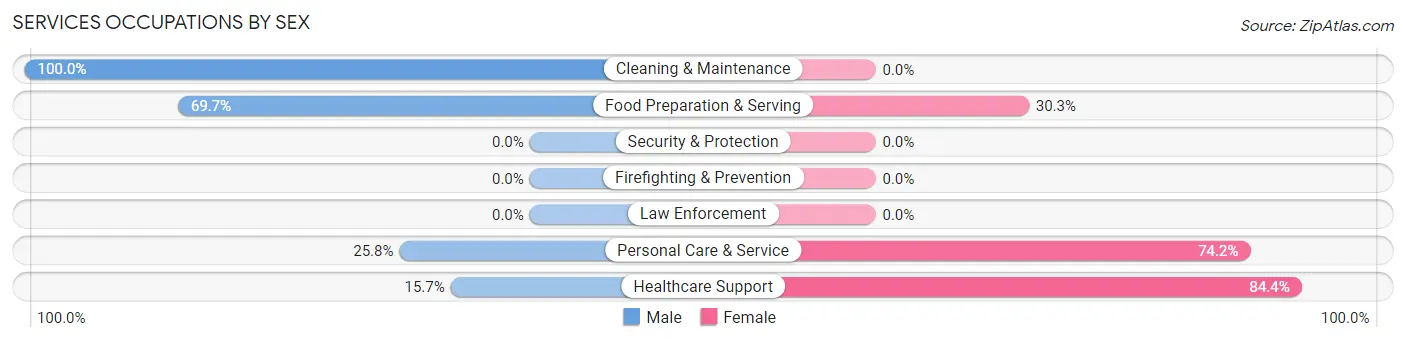
Services Occupations by Sex
Within the Services occupations in Whiteville, the most male-oriented occupations are Cleaning & Maintenance (100.0%), Food Preparation & Serving (69.7%), and Personal Care & Service (25.8%), while the most female-oriented occupations are Healthcare Support (84.4%), Personal Care & Service (74.2%), and Food Preparation & Serving (30.3%).
| Occupation | Male | Female |
| Healthcare Support | 18 (15.7%) | 97 (84.4%) |
| Security & Protection | 0 (0.0%) | 0 (0.0%) |
| Firefighting & Prevention | 0 (0.0%) | 0 (0.0%) |
| Law Enforcement | 0 (0.0%) | 0 (0.0%) |
| Food Preparation & Serving | 163 (69.7%) | 71 (30.3%) |
| Cleaning & Maintenance | 52 (100.0%) | 0 (0.0%) |
| Personal Care & Service | 8 (25.8%) | 23 (74.2%) |
| Total (Category) | 241 (55.8%) | 191 (44.2%) |
| Total (Overall) | 892 (45.3%) | 1,076 (54.7%) |
Sales and Office Occupations
The most common Sales and Office occupations in Whiteville are Sales & Related (219 | 11.1%), and Office & Administration (133 | 6.8%).
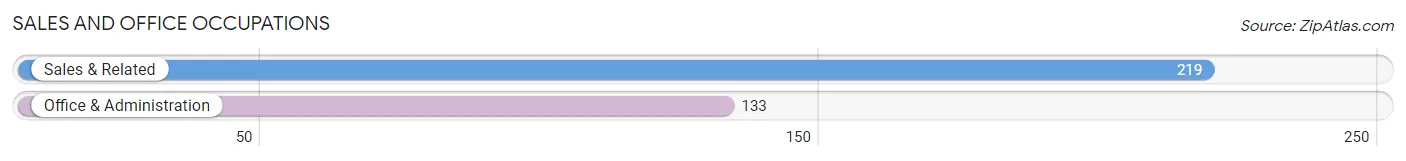
Sales and Office Occupations by Sex
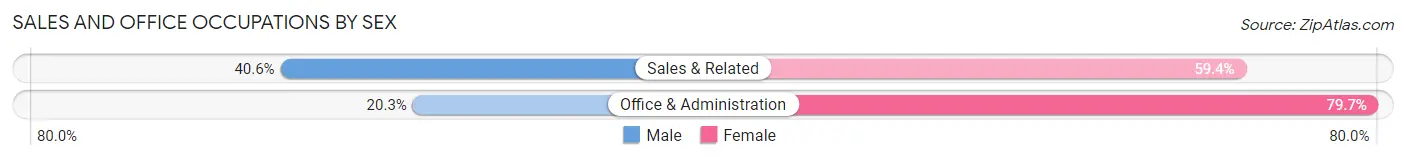
| Occupation | Male | Female |
| Sales & Related | 89 (40.6%) | 130 (59.4%) |
| Office & Administration | 27 (20.3%) | 106 (79.7%) |
| Total (Category) | 116 (33.0%) | 236 (67.0%) |
| Total (Overall) | 892 (45.3%) | 1,076 (54.7%) |
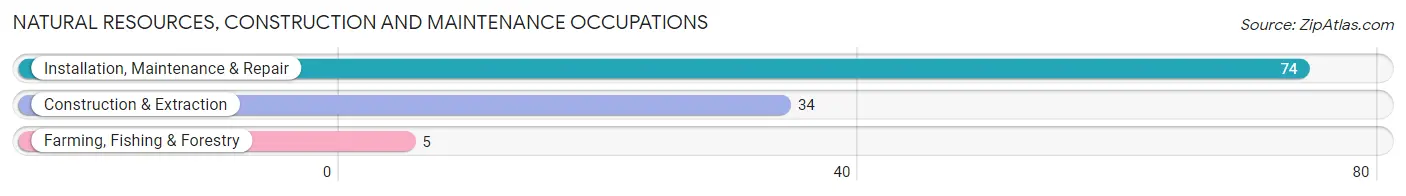
Natural Resources, Construction and Maintenance Occupations
The most common Natural Resources, Construction and Maintenance occupations in Whiteville are Installation, Maintenance & Repair (74 | 3.8%), Construction & Extraction (34 | 1.7%), and Farming, Fishing & Forestry (5 | 0.3%).
Natural Resources, Construction and Maintenance Occupations by Sex
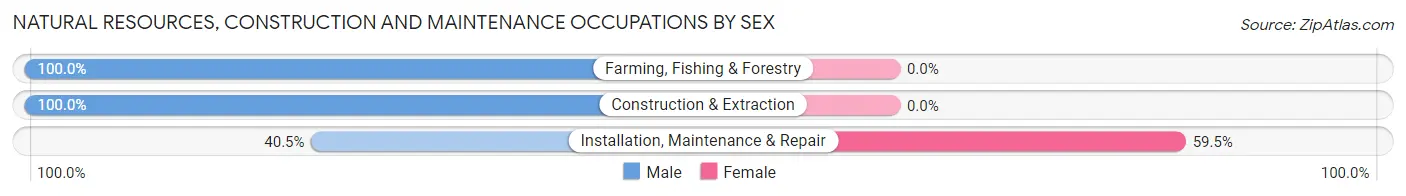
| Occupation | Male | Female |
| Farming, Fishing & Forestry | 5 (100.0%) | 0 (0.0%) |
| Construction & Extraction | 34 (100.0%) | 0 (0.0%) |
| Installation, Maintenance & Repair | 30 (40.5%) | 44 (59.5%) |
| Total (Category) | 69 (61.1%) | 44 (38.9%) |
| Total (Overall) | 892 (45.3%) | 1,076 (54.7%) |
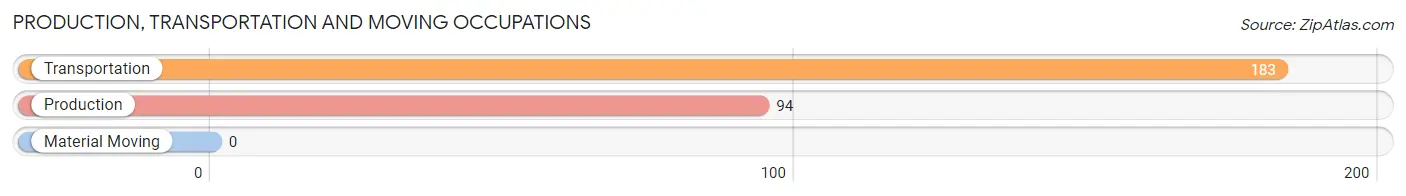
Production, Transportation and Moving Occupations
The most common Production, Transportation and Moving occupations in Whiteville are Transportation (183 | 9.3%), and Production (94 | 4.8%).
Production, Transportation and Moving Occupations by Sex
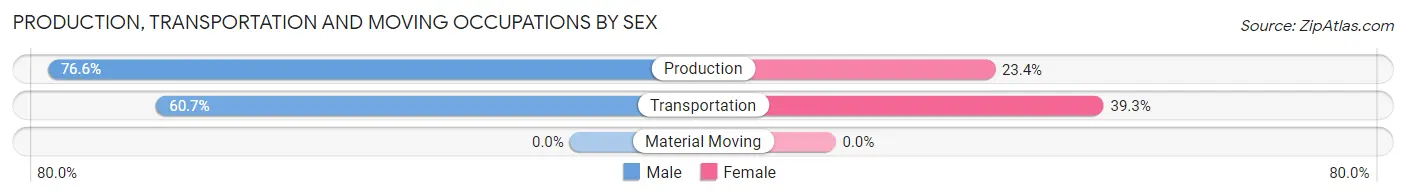
| Occupation | Male | Female |
| Production | 72 (76.6%) | 22 (23.4%) |
| Transportation | 111 (60.7%) | 72 (39.3%) |
| Material Moving | 0 (0.0%) | 0 (0.0%) |
| Total (Category) | 183 (66.1%) | 94 (33.9%) |
| Total (Overall) | 892 (45.3%) | 1,076 (54.7%) |
Employment Industries by Sex in Whiteville
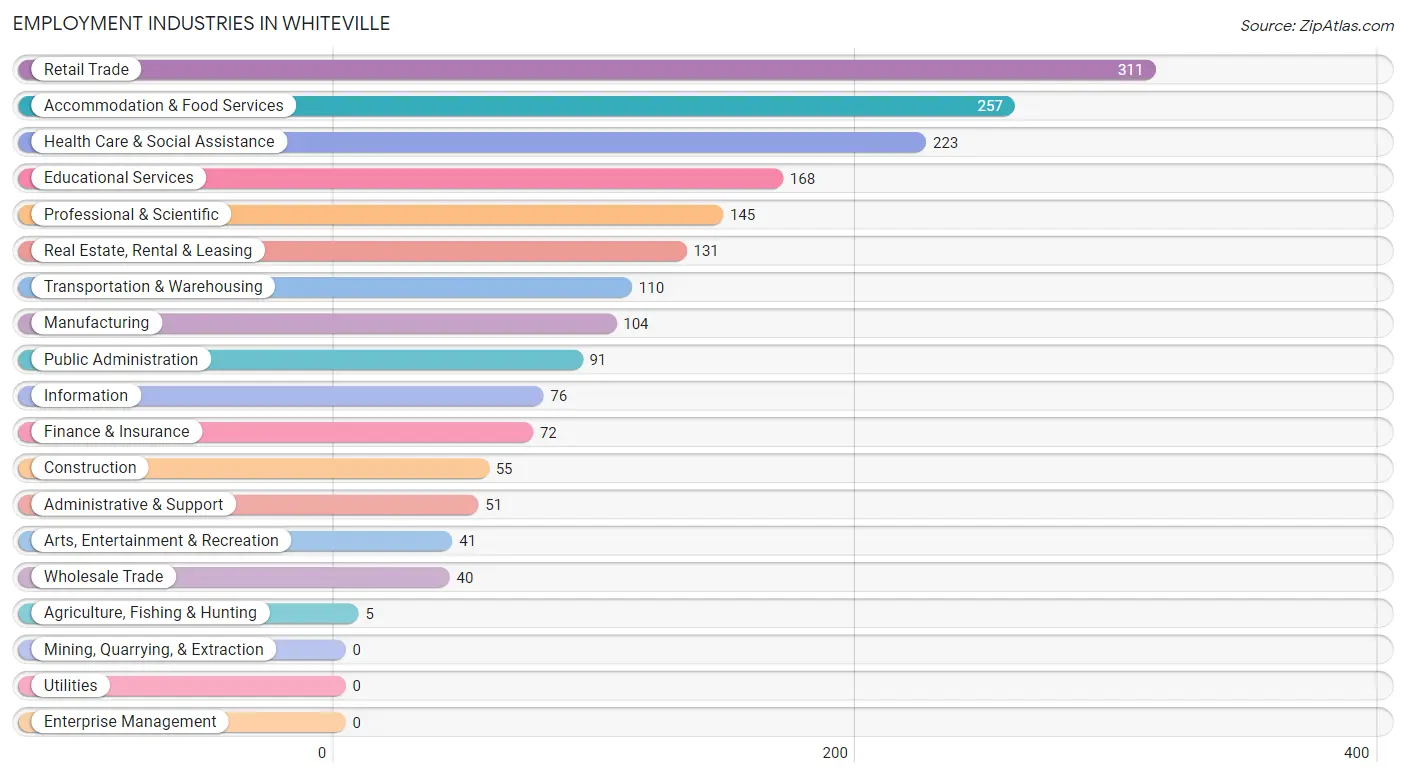
Employment Industries in Whiteville
The major employment industries in Whiteville include Retail Trade (311 | 15.8%), Accommodation & Food Services (257 | 13.1%), Health Care & Social Assistance (223 | 11.3%), Educational Services (168 | 8.5%), and Professional & Scientific (145 | 7.4%).
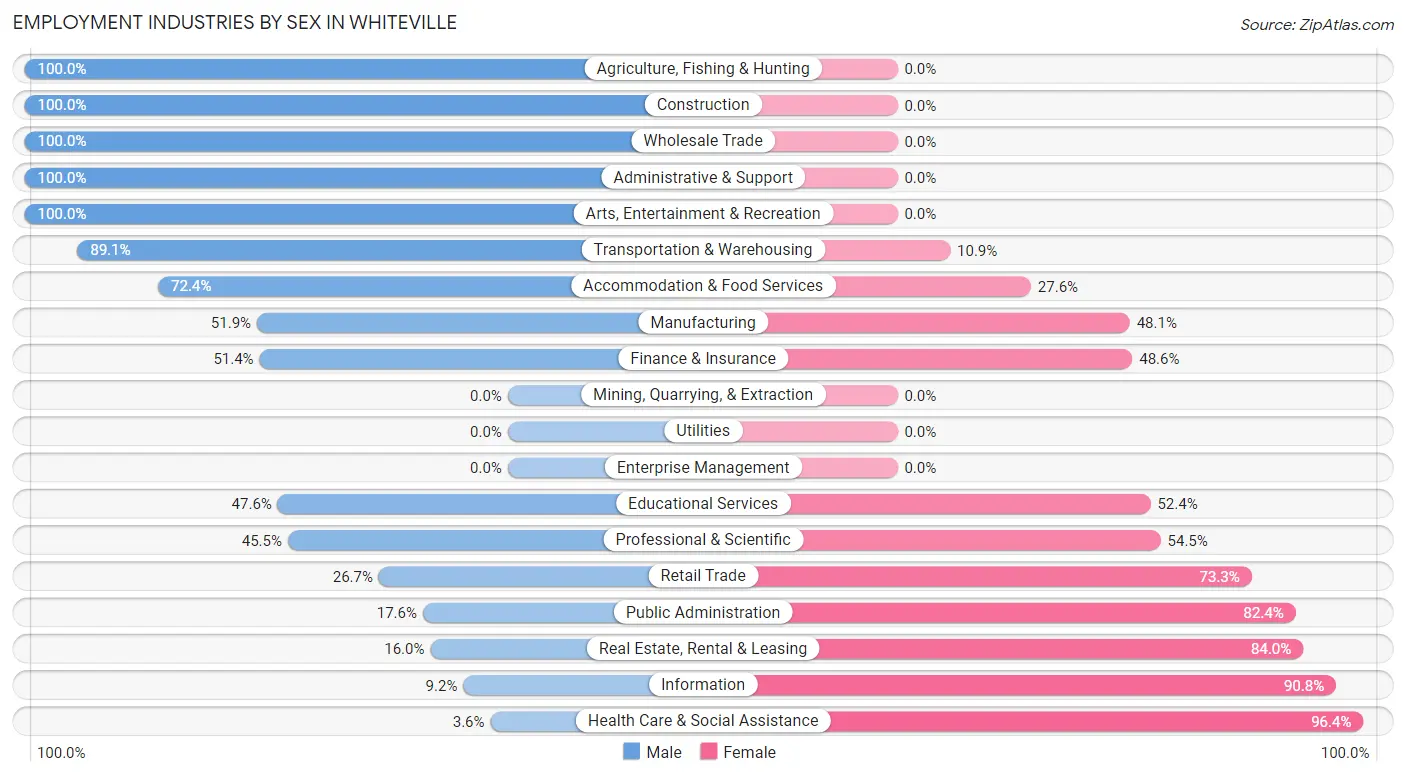
Employment Industries by Sex in Whiteville
The Whiteville industries that see more men than women are Agriculture, Fishing & Hunting (100.0%), Construction (100.0%), and Wholesale Trade (100.0%), whereas the industries that tend to have a higher number of women are Health Care & Social Assistance (96.4%), Information (90.8%), and Real Estate, Rental & Leasing (84.0%).
| Industry | Male | Female |
| Agriculture, Fishing & Hunting | 5 (100.0%) | 0 (0.0%) |
| Mining, Quarrying, & Extraction | 0 (0.0%) | 0 (0.0%) |
| Construction | 55 (100.0%) | 0 (0.0%) |
| Manufacturing | 54 (51.9%) | 50 (48.1%) |
| Wholesale Trade | 40 (100.0%) | 0 (0.0%) |
| Retail Trade | 83 (26.7%) | 228 (73.3%) |
| Transportation & Warehousing | 98 (89.1%) | 12 (10.9%) |
| Utilities | 0 (0.0%) | 0 (0.0%) |
| Information | 7 (9.2%) | 69 (90.8%) |
| Finance & Insurance | 37 (51.4%) | 35 (48.6%) |
| Real Estate, Rental & Leasing | 21 (16.0%) | 110 (84.0%) |
| Professional & Scientific | 66 (45.5%) | 79 (54.5%) |
| Enterprise Management | 0 (0.0%) | 0 (0.0%) |
| Administrative & Support | 51 (100.0%) | 0 (0.0%) |
| Educational Services | 80 (47.6%) | 88 (52.4%) |
| Health Care & Social Assistance | 8 (3.6%) | 215 (96.4%) |
| Arts, Entertainment & Recreation | 41 (100.0%) | 0 (0.0%) |
| Accommodation & Food Services | 186 (72.4%) | 71 (27.6%) |
| Public Administration | 16 (17.6%) | 75 (82.4%) |
| Total | 892 (45.3%) | 1,076 (54.7%) |
Education in Whiteville
School Enrollment in Whiteville
The most common levels of schooling among the 1,087 students in Whiteville are elementary school (263 | 24.2%), college / undergraduate (262 | 24.1%), and middle school (261 | 24.0%).
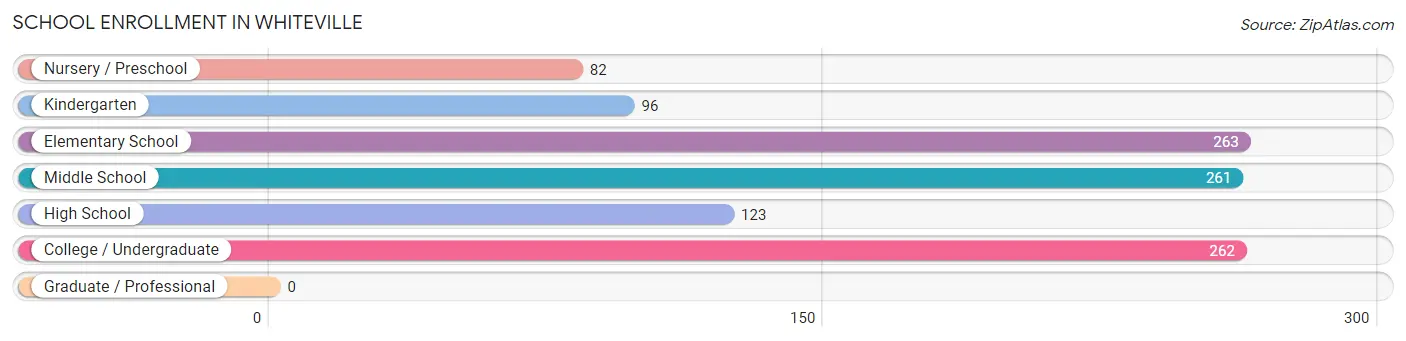
| School Level | # Students | % Students |
| Nursery / Preschool | 82 | 7.5% |
| Kindergarten | 96 | 8.8% |
| Elementary School | 263 | 24.2% |
| Middle School | 261 | 24.0% |
| High School | 123 | 11.3% |
| College / Undergraduate | 262 | 24.1% |
| Graduate / Professional | 0 | 0.0% |
| Total | 1,087 | 100.0% |
School Enrollment by Age by Funding Source in Whiteville
Out of a total of 1,087 students who are enrolled in schools in Whiteville, 188 (17.3%) attend a private institution, while the remaining 899 (82.7%) are enrolled in public schools. The age group of 35 years and over has the highest likelihood of being enrolled in private schools, with 29 (69.1% in the age bracket) enrolled. Conversely, the age group of 5 to 9 year old has the lowest likelihood of being enrolled in a private school, with 352 (100.0% in the age bracket) attending a public institution.
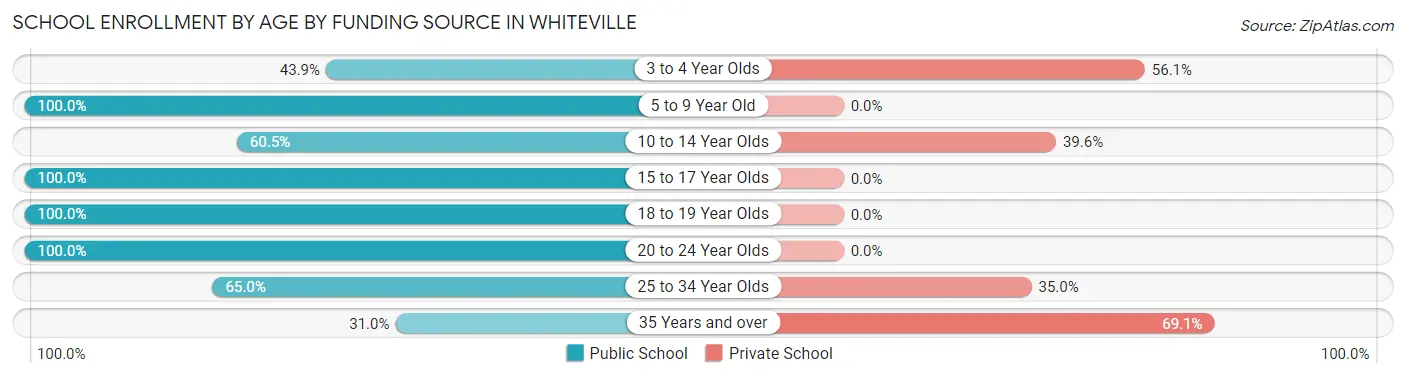
| Age Bracket | Public School | Private School |
| 3 to 4 Year Olds | 36 (43.9%) | 46 (56.1%) |
| 5 to 9 Year Old | 352 (100.0%) | 0 (0.0%) |
| 10 to 14 Year Olds | 162 (60.5%) | 106 (39.6%) |
| 15 to 17 Year Olds | 108 (100.0%) | 0 (0.0%) |
| 18 to 19 Year Olds | 8 (100.0%) | 0 (0.0%) |
| 20 to 24 Year Olds | 207 (100.0%) | 0 (0.0%) |
| 25 to 34 Year Olds | 13 (65.0%) | 7 (35.0%) |
| 35 Years and over | 13 (30.9%) | 29 (69.1%) |
| Total | 899 (82.7%) | 188 (17.3%) |
Educational Attainment by Field of Study in Whiteville
Education (157 | 18.2%), arts & humanities (136 | 15.8%), science & technology (106 | 12.3%), business (95 | 11.0%), and communications (86 | 10.0%) are the most common fields of study among 863 individuals in Whiteville who have obtained a bachelor's degree or higher.
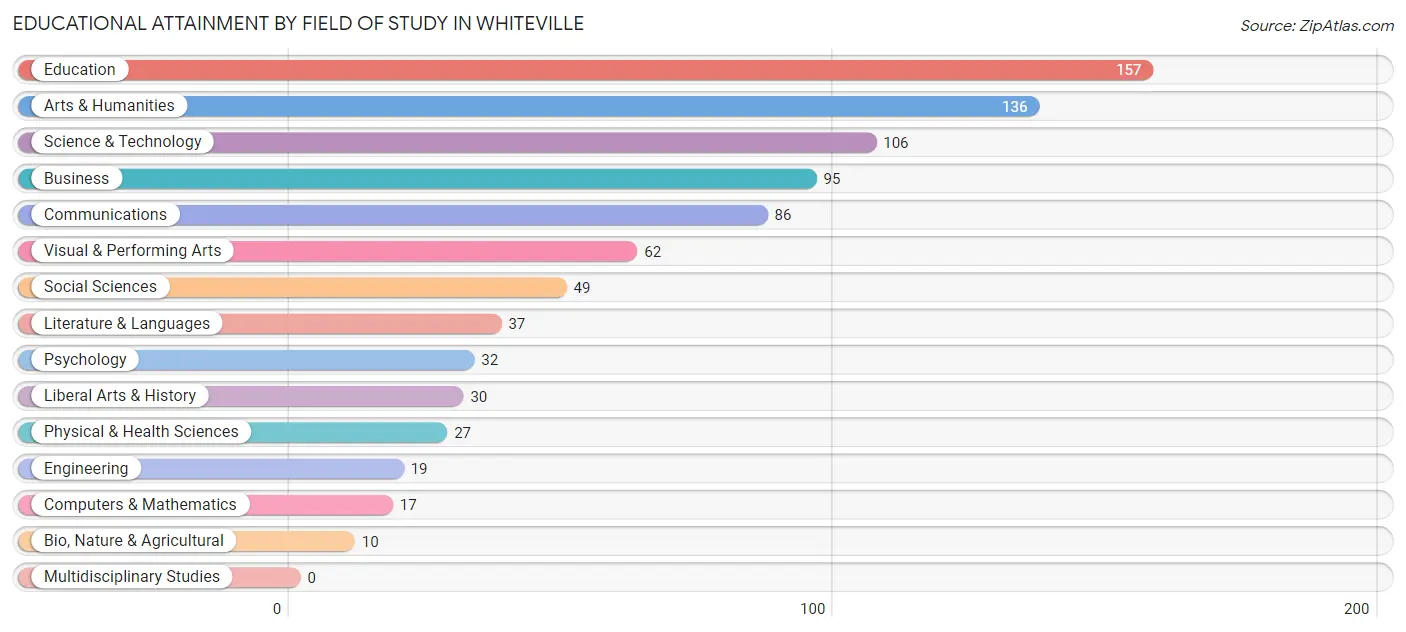
| Field of Study | # Graduates | % Graduates |
| Computers & Mathematics | 17 | 2.0% |
| Bio, Nature & Agricultural | 10 | 1.2% |
| Physical & Health Sciences | 27 | 3.1% |
| Psychology | 32 | 3.7% |
| Social Sciences | 49 | 5.7% |
| Engineering | 19 | 2.2% |
| Multidisciplinary Studies | 0 | 0.0% |
| Science & Technology | 106 | 12.3% |
| Business | 95 | 11.0% |
| Education | 157 | 18.2% |
| Literature & Languages | 37 | 4.3% |
| Liberal Arts & History | 30 | 3.5% |
| Visual & Performing Arts | 62 | 7.2% |
| Communications | 86 | 10.0% |
| Arts & Humanities | 136 | 15.8% |
| Total | 863 | 100.0% |
Transportation & Commute in Whiteville
Vehicle Availability by Sex in Whiteville
The most prevalent vehicle ownership categories in Whiteville are males with 5 or more vehicles (284, accounting for 31.8%) and females with 5 or more vehicles (76, making up 27.6%).
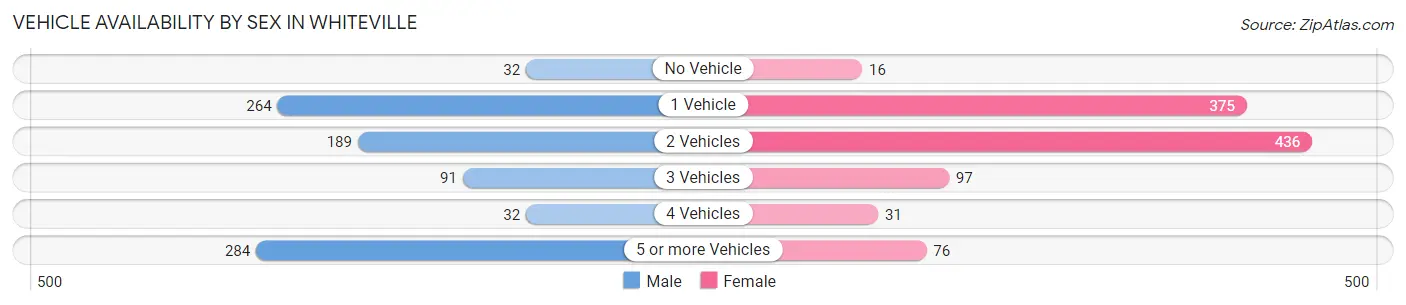
| Vehicles Available | Male | Female |
| No Vehicle | 32 (3.6%) | 16 (1.5%) |
| 1 Vehicle | 264 (29.6%) | 375 (36.4%) |
| 2 Vehicles | 189 (21.2%) | 436 (42.3%) |
| 3 Vehicles | 91 (10.2%) | 97 (9.4%) |
| 4 Vehicles | 32 (3.6%) | 31 (3.0%) |
| 5 or more Vehicles | 284 (31.8%) | 76 (7.4%) |
| Total | 892 (100.0%) | 1,031 (100.0%) |
Commute Time in Whiteville
The most frequently occuring commute durations in Whiteville are 10 to 14 minutes (429 commuters, 22.8%), 45 to 59 minutes (297 commuters, 15.8%), and 5 to 9 minutes (279 commuters, 14.8%).
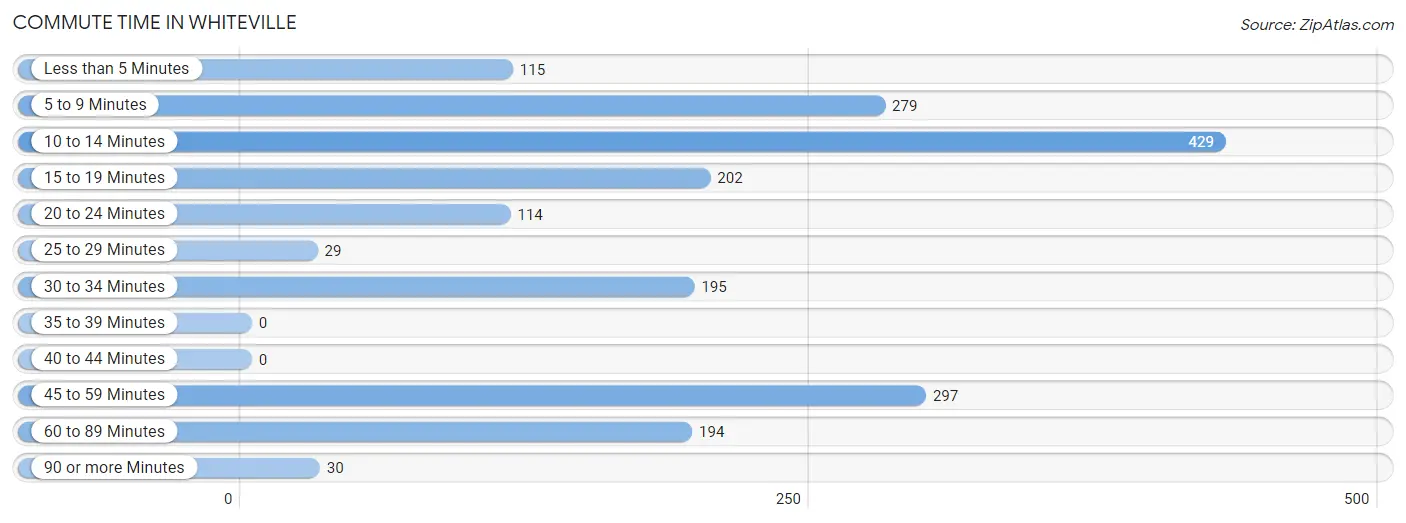
| Commute Time | # Commuters | % Commuters |
| Less than 5 Minutes | 115 | 6.1% |
| 5 to 9 Minutes | 279 | 14.8% |
| 10 to 14 Minutes | 429 | 22.8% |
| 15 to 19 Minutes | 202 | 10.7% |
| 20 to 24 Minutes | 114 | 6.0% |
| 25 to 29 Minutes | 29 | 1.5% |
| 30 to 34 Minutes | 195 | 10.3% |
| 35 to 39 Minutes | 0 | 0.0% |
| 40 to 44 Minutes | 0 | 0.0% |
| 45 to 59 Minutes | 297 | 15.8% |
| 60 to 89 Minutes | 194 | 10.3% |
| 90 or more Minutes | 30 | 1.6% |
Commute Time by Sex in Whiteville
The most common commute times in Whiteville are 10 to 14 minutes (230 commuters, 26.5%) for males and 45 to 59 minutes (282 commuters, 27.8%) for females.
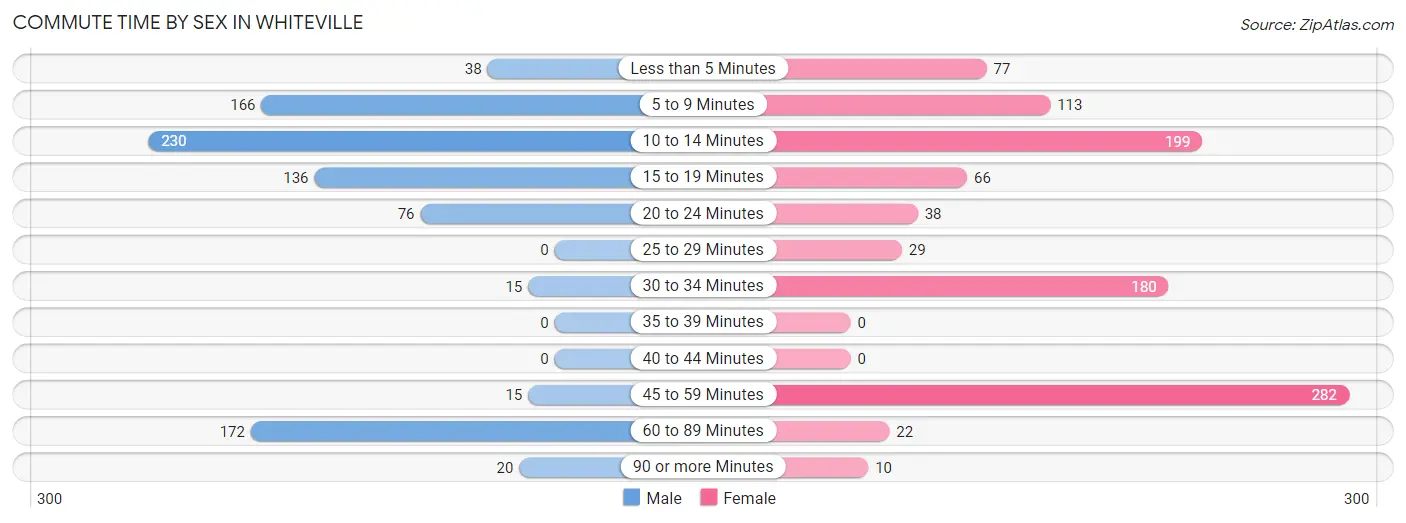
| Commute Time | Male | Female |
| Less than 5 Minutes | 38 (4.4%) | 77 (7.6%) |
| 5 to 9 Minutes | 166 (19.1%) | 113 (11.1%) |
| 10 to 14 Minutes | 230 (26.5%) | 199 (19.6%) |
| 15 to 19 Minutes | 136 (15.7%) | 66 (6.5%) |
| 20 to 24 Minutes | 76 (8.8%) | 38 (3.7%) |
| 25 to 29 Minutes | 0 (0.0%) | 29 (2.9%) |
| 30 to 34 Minutes | 15 (1.7%) | 180 (17.7%) |
| 35 to 39 Minutes | 0 (0.0%) | 0 (0.0%) |
| 40 to 44 Minutes | 0 (0.0%) | 0 (0.0%) |
| 45 to 59 Minutes | 15 (1.7%) | 282 (27.8%) |
| 60 to 89 Minutes | 172 (19.8%) | 22 (2.2%) |
| 90 or more Minutes | 20 (2.3%) | 10 (1.0%) |
Time of Departure to Work by Sex in Whiteville
The most frequent times of departure to work in Whiteville are 7:00 AM to 7:29 AM (156, 18.0%) for males and 8:00 AM to 8:29 AM (434, 42.7%) for females.
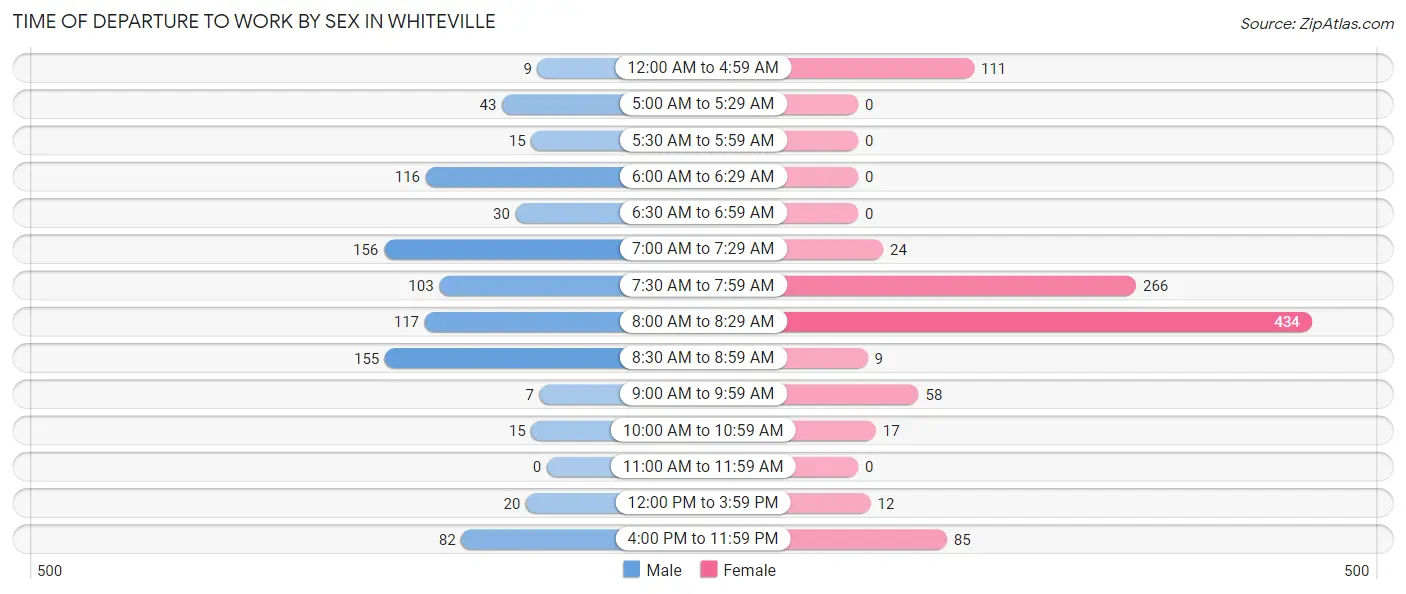
| Time of Departure | Male | Female |
| 12:00 AM to 4:59 AM | 9 (1.0%) | 111 (10.9%) |
| 5:00 AM to 5:29 AM | 43 (5.0%) | 0 (0.0%) |
| 5:30 AM to 5:59 AM | 15 (1.7%) | 0 (0.0%) |
| 6:00 AM to 6:29 AM | 116 (13.4%) | 0 (0.0%) |
| 6:30 AM to 6:59 AM | 30 (3.5%) | 0 (0.0%) |
| 7:00 AM to 7:29 AM | 156 (18.0%) | 24 (2.4%) |
| 7:30 AM to 7:59 AM | 103 (11.9%) | 266 (26.2%) |
| 8:00 AM to 8:29 AM | 117 (13.5%) | 434 (42.7%) |
| 8:30 AM to 8:59 AM | 155 (17.9%) | 9 (0.9%) |
| 9:00 AM to 9:59 AM | 7 (0.8%) | 58 (5.7%) |
| 10:00 AM to 10:59 AM | 15 (1.7%) | 17 (1.7%) |
| 11:00 AM to 11:59 AM | 0 (0.0%) | 0 (0.0%) |
| 12:00 PM to 3:59 PM | 20 (2.3%) | 12 (1.2%) |
| 4:00 PM to 11:59 PM | 82 (9.5%) | 85 (8.4%) |
| Total | 868 (100.0%) | 1,016 (100.0%) |
Housing Occupancy in Whiteville
Occupancy by Ownership in Whiteville
Of the total 1,865 dwellings in Whiteville, owner-occupied units account for 882 (47.3%), while renter-occupied units make up 983 (52.7%).
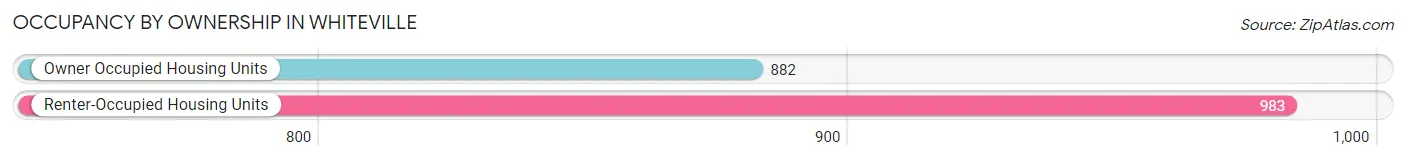
| Occupancy | # Housing Units | % Housing Units |
| Owner Occupied Housing Units | 882 | 47.3% |
| Renter-Occupied Housing Units | 983 | 52.7% |
| Total Occupied Housing Units | 1,865 | 100.0% |
Occupancy by Household Size in Whiteville
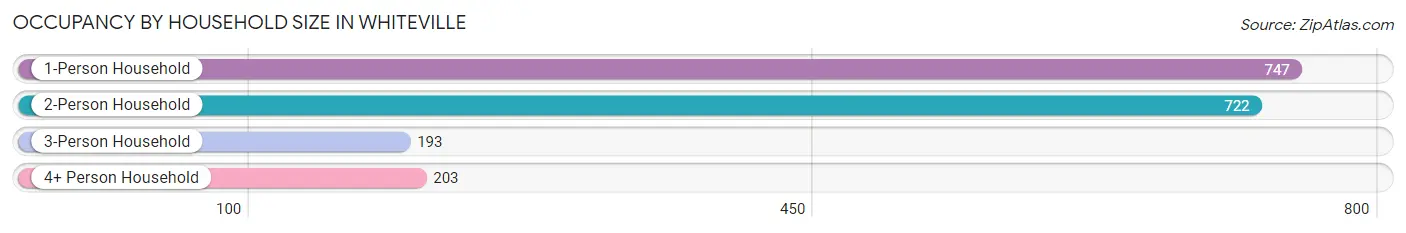
| Household Size | # Housing Units | % Housing Units |
| 1-Person Household | 747 | 40.1% |
| 2-Person Household | 722 | 38.7% |
| 3-Person Household | 193 | 10.3% |
| 4+ Person Household | 203 | 10.9% |
| Total Housing Units | 1,865 | 100.0% |
Occupancy by Ownership by Household Size in Whiteville
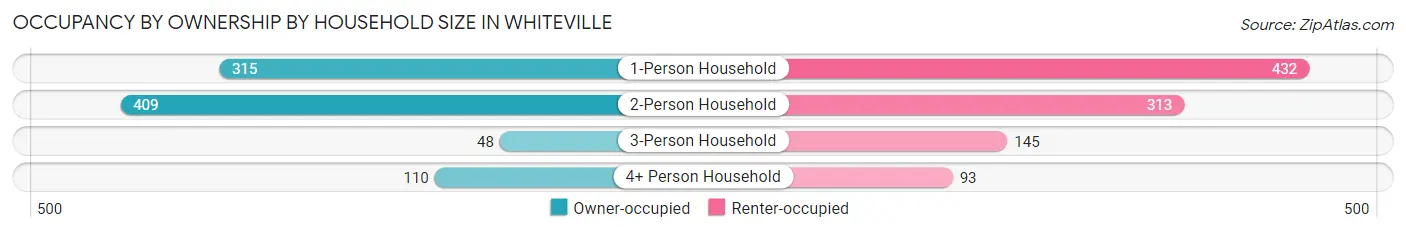
| Household Size | Owner-occupied | Renter-occupied |
| 1-Person Household | 315 (42.2%) | 432 (57.8%) |
| 2-Person Household | 409 (56.7%) | 313 (43.3%) |
| 3-Person Household | 48 (24.9%) | 145 (75.1%) |
| 4+ Person Household | 110 (54.2%) | 93 (45.8%) |
| Total Housing Units | 882 (47.3%) | 983 (52.7%) |
Occupancy by Educational Attainment in Whiteville
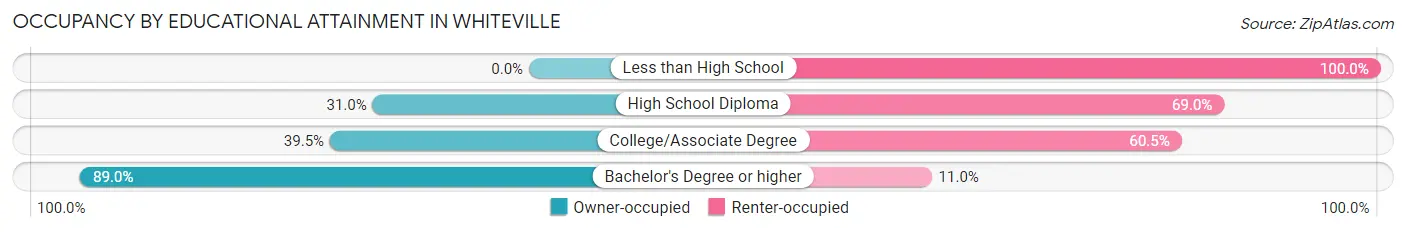
| Household Size | Owner-occupied | Renter-occupied |
| Less than High School | 0 (0.0%) | 97 (100.0%) |
| High School Diploma | 200 (31.0%) | 445 (69.0%) |
| College/Associate Degree | 253 (39.5%) | 388 (60.5%) |
| Bachelor's Degree or higher | 429 (89.0%) | 53 (11.0%) |
Occupancy by Age of Householder in Whiteville
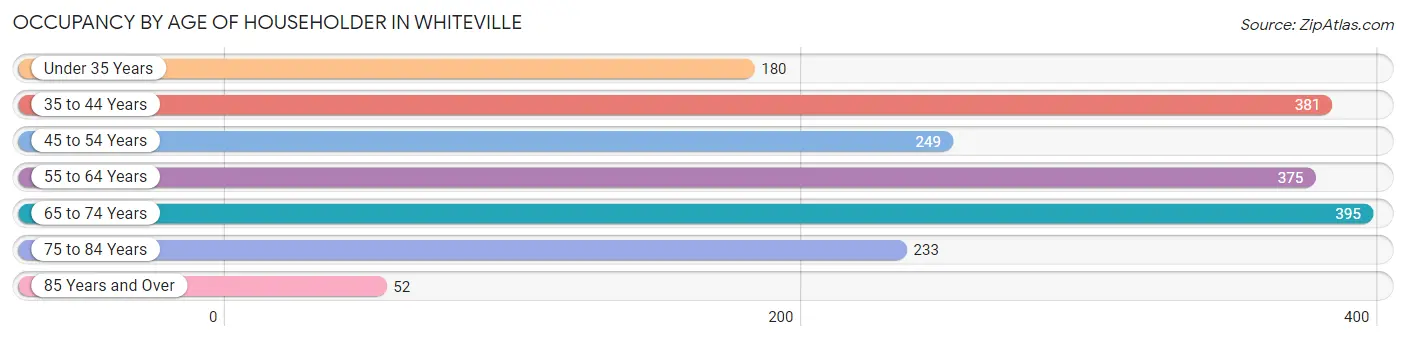
| Age Bracket | # Households | % Households |
| Under 35 Years | 180 | 9.7% |
| 35 to 44 Years | 381 | 20.4% |
| 45 to 54 Years | 249 | 13.4% |
| 55 to 64 Years | 375 | 20.1% |
| 65 to 74 Years | 395 | 21.2% |
| 75 to 84 Years | 233 | 12.5% |
| 85 Years and Over | 52 | 2.8% |
| Total | 1,865 | 100.0% |
Housing Finances in Whiteville
Median Income by Occupancy in Whiteville
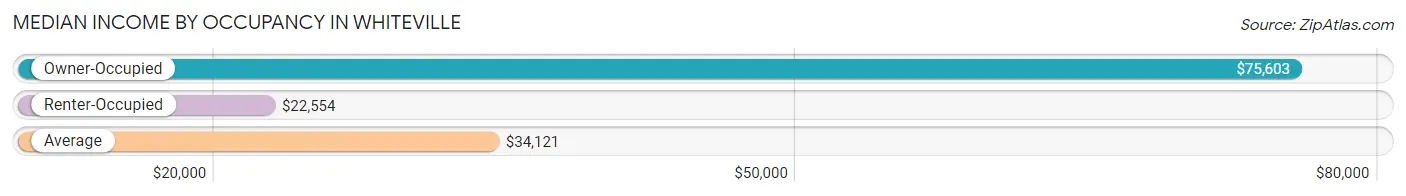
| Occupancy Type | # Households | Median Income |
| Owner-Occupied | 882 (47.3%) | $75,603 |
| Renter-Occupied | 983 (52.7%) | $22,554 |
| Average | 1,865 (100.0%) | $34,121 |
Occupancy by Householder Income Bracket in Whiteville
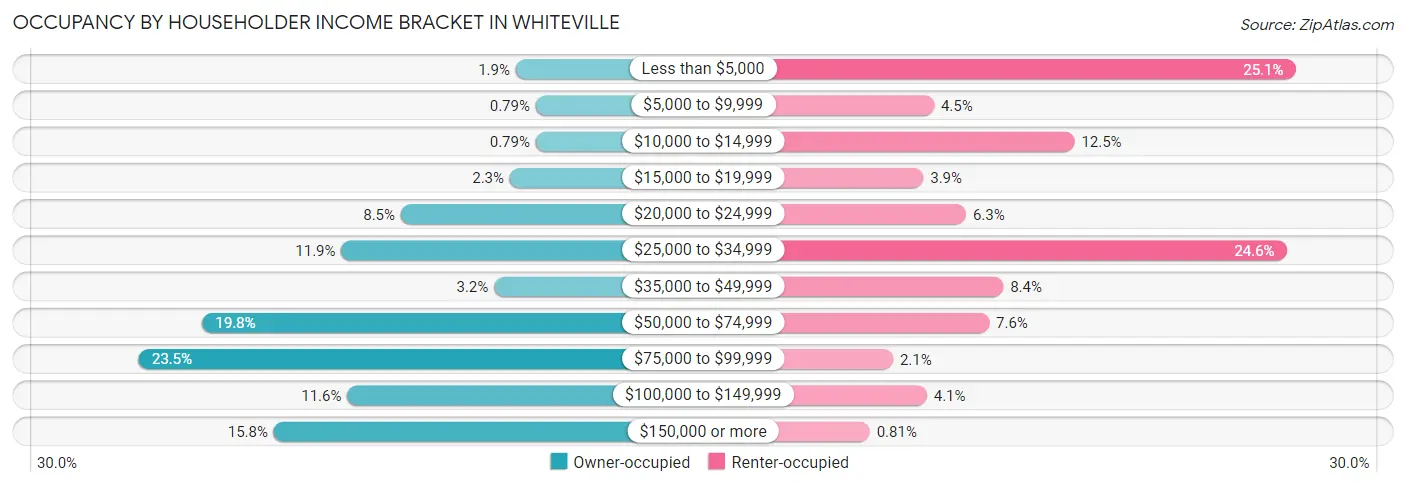
| Income Bracket | Owner-occupied | Renter-occupied |
| Less than $5,000 | 17 (1.9%) | 247 (25.1%) |
| $5,000 to $9,999 | 7 (0.8%) | 44 (4.5%) |
| $10,000 to $14,999 | 7 (0.8%) | 123 (12.5%) |
| $15,000 to $19,999 | 20 (2.3%) | 38 (3.9%) |
| $20,000 to $24,999 | 75 (8.5%) | 62 (6.3%) |
| $25,000 to $34,999 | 105 (11.9%) | 242 (24.6%) |
| $35,000 to $49,999 | 28 (3.2%) | 83 (8.4%) |
| $50,000 to $74,999 | 175 (19.8%) | 75 (7.6%) |
| $75,000 to $99,999 | 207 (23.5%) | 21 (2.1%) |
| $100,000 to $149,999 | 102 (11.6%) | 40 (4.1%) |
| $150,000 or more | 139 (15.8%) | 8 (0.8%) |
| Total | 882 (100.0%) | 983 (100.0%) |
Monthly Housing Cost Tiers in Whiteville
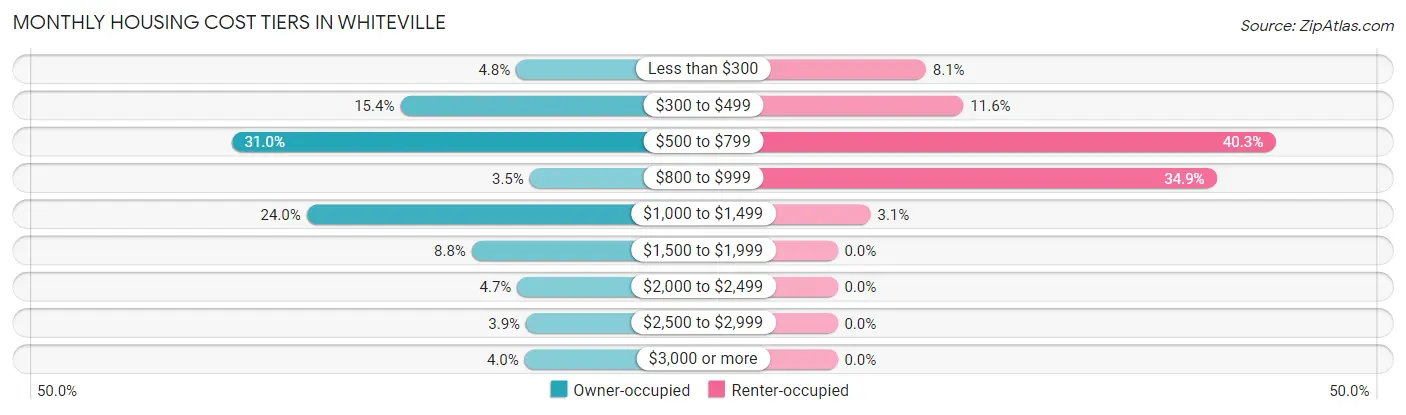
| Monthly Cost | Owner-occupied | Renter-occupied |
| Less than $300 | 42 (4.8%) | 80 (8.1%) |
| $300 to $499 | 136 (15.4%) | 114 (11.6%) |
| $500 to $799 | 273 (30.9%) | 396 (40.3%) |
| $800 to $999 | 31 (3.5%) | 343 (34.9%) |
| $1,000 to $1,499 | 212 (24.0%) | 30 (3.0%) |
| $1,500 to $1,999 | 78 (8.8%) | 0 (0.0%) |
| $2,000 to $2,499 | 41 (4.6%) | 0 (0.0%) |
| $2,500 to $2,999 | 34 (3.8%) | 0 (0.0%) |
| $3,000 or more | 35 (4.0%) | 0 (0.0%) |
| Total | 882 (100.0%) | 983 (100.0%) |
Physical Housing Characteristics in Whiteville
Housing Structures in Whiteville
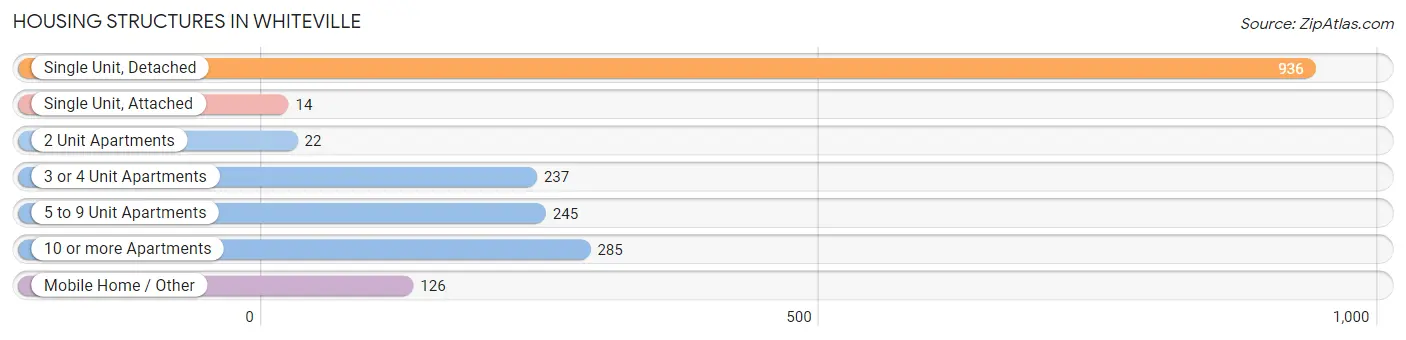
| Structure Type | # Housing Units | % Housing Units |
| Single Unit, Detached | 936 | 50.2% |
| Single Unit, Attached | 14 | 0.7% |
| 2 Unit Apartments | 22 | 1.2% |
| 3 or 4 Unit Apartments | 237 | 12.7% |
| 5 to 9 Unit Apartments | 245 | 13.1% |
| 10 or more Apartments | 285 | 15.3% |
| Mobile Home / Other | 126 | 6.8% |
| Total | 1,865 | 100.0% |
Housing Structures by Occupancy in Whiteville
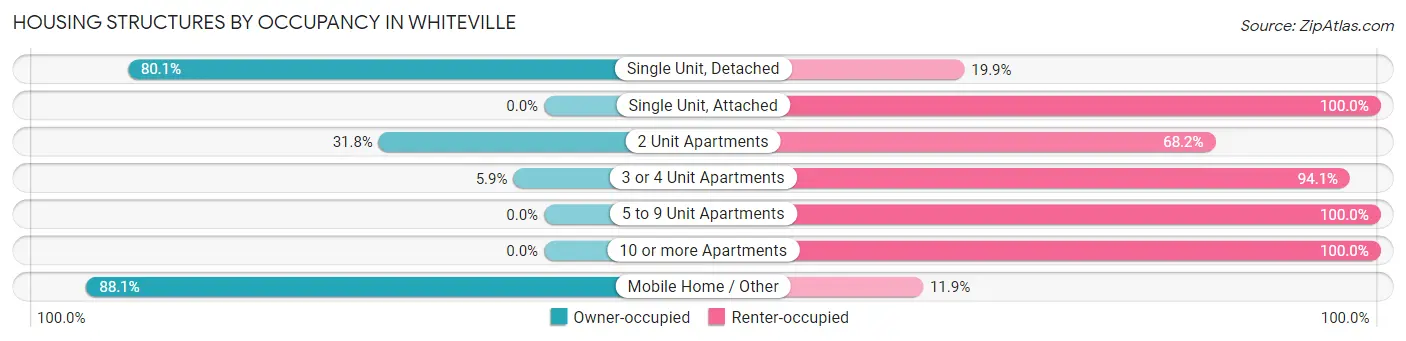
| Structure Type | Owner-occupied | Renter-occupied |
| Single Unit, Detached | 750 (80.1%) | 186 (19.9%) |
| Single Unit, Attached | 0 (0.0%) | 14 (100.0%) |
| 2 Unit Apartments | 7 (31.8%) | 15 (68.2%) |
| 3 or 4 Unit Apartments | 14 (5.9%) | 223 (94.1%) |
| 5 to 9 Unit Apartments | 0 (0.0%) | 245 (100.0%) |
| 10 or more Apartments | 0 (0.0%) | 285 (100.0%) |
| Mobile Home / Other | 111 (88.1%) | 15 (11.9%) |
| Total | 882 (47.3%) | 983 (52.7%) |
Housing Structures by Number of Rooms in Whiteville
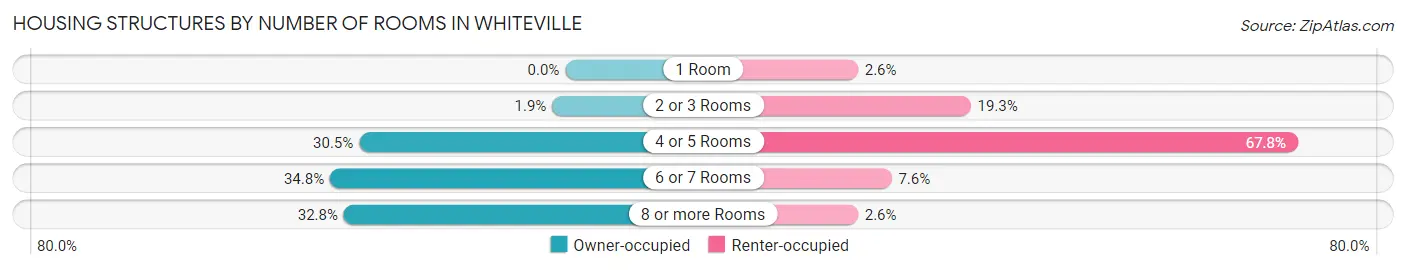
| Number of Rooms | Owner-occupied | Renter-occupied |
| 1 Room | 0 (0.0%) | 26 (2.6%) |
| 2 or 3 Rooms | 17 (1.9%) | 190 (19.3%) |
| 4 or 5 Rooms | 269 (30.5%) | 666 (67.7%) |
| 6 or 7 Rooms | 307 (34.8%) | 75 (7.6%) |
| 8 or more Rooms | 289 (32.8%) | 26 (2.6%) |
| Total | 882 (100.0%) | 983 (100.0%) |
Housing Structure by Heating Type in Whiteville
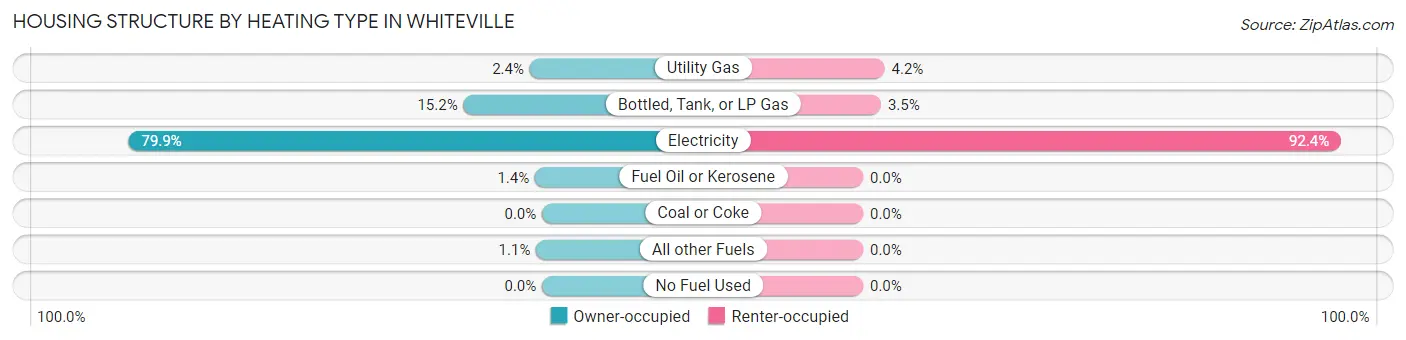
| Heating Type | Owner-occupied | Renter-occupied |
| Utility Gas | 21 (2.4%) | 41 (4.2%) |
| Bottled, Tank, or LP Gas | 134 (15.2%) | 34 (3.5%) |
| Electricity | 705 (79.9%) | 908 (92.4%) |
| Fuel Oil or Kerosene | 12 (1.4%) | 0 (0.0%) |
| Coal or Coke | 0 (0.0%) | 0 (0.0%) |
| All other Fuels | 10 (1.1%) | 0 (0.0%) |
| No Fuel Used | 0 (0.0%) | 0 (0.0%) |
| Total | 882 (100.0%) | 983 (100.0%) |
Household Vehicle Usage in Whiteville
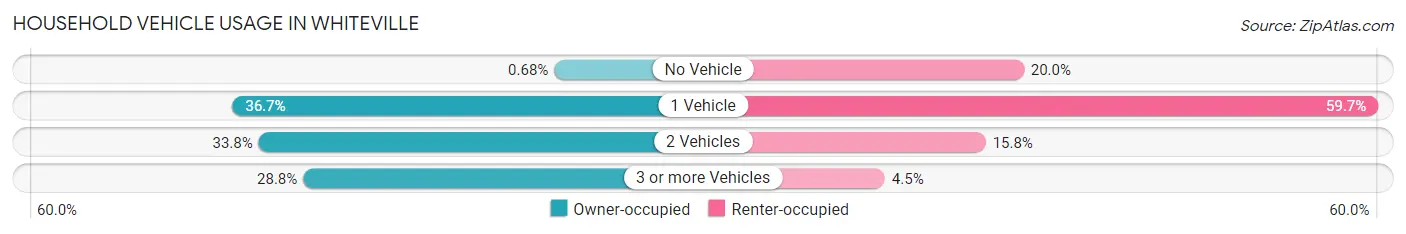
| Vehicles per Household | Owner-occupied | Renter-occupied |
| No Vehicle | 6 (0.7%) | 197 (20.0%) |
| 1 Vehicle | 324 (36.7%) | 587 (59.7%) |
| 2 Vehicles | 298 (33.8%) | 155 (15.8%) |
| 3 or more Vehicles | 254 (28.8%) | 44 (4.5%) |
| Total | 882 (100.0%) | 983 (100.0%) |
Real Estate & Mortgages in Whiteville
Real Estate and Mortgage Overview in Whiteville
| Characteristic | Without Mortgage | With Mortgage |
| Housing Units | 409 | 473 |
| Median Property Value | $157,300 | $134,800 |
| Median Household Income | $54,391 | $66 |
| Monthly Housing Costs | $565 | $35 |
| Real Estate Taxes | $1,672 | $0 |
Property Value by Mortgage Status in Whiteville
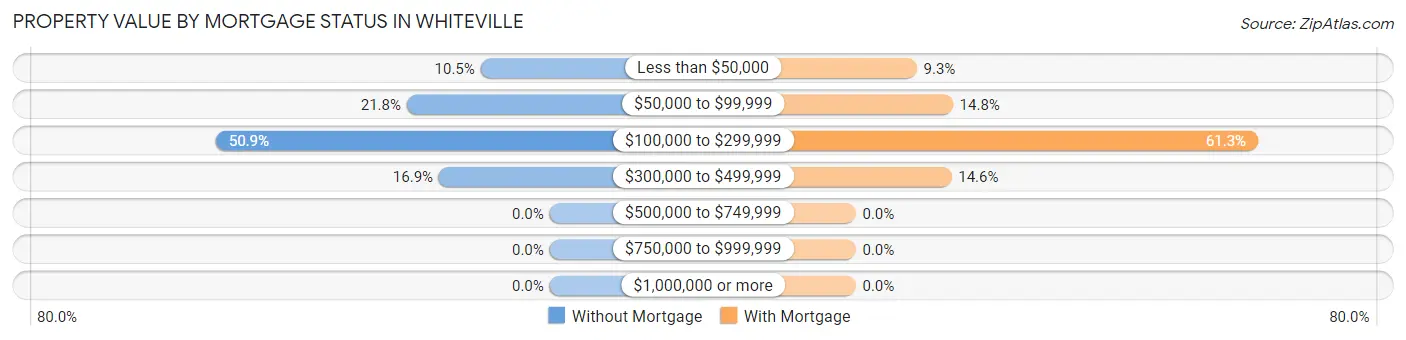
| Property Value | Without Mortgage | With Mortgage |
| Less than $50,000 | 43 (10.5%) | 44 (9.3%) |
| $50,000 to $99,999 | 89 (21.8%) | 70 (14.8%) |
| $100,000 to $299,999 | 208 (50.9%) | 290 (61.3%) |
| $300,000 to $499,999 | 69 (16.9%) | 69 (14.6%) |
| $500,000 to $749,999 | 0 (0.0%) | 0 (0.0%) |
| $750,000 to $999,999 | 0 (0.0%) | 0 (0.0%) |
| $1,000,000 or more | 0 (0.0%) | 0 (0.0%) |
| Total | 409 (100.0%) | 473 (100.0%) |
Household Income by Mortgage Status in Whiteville
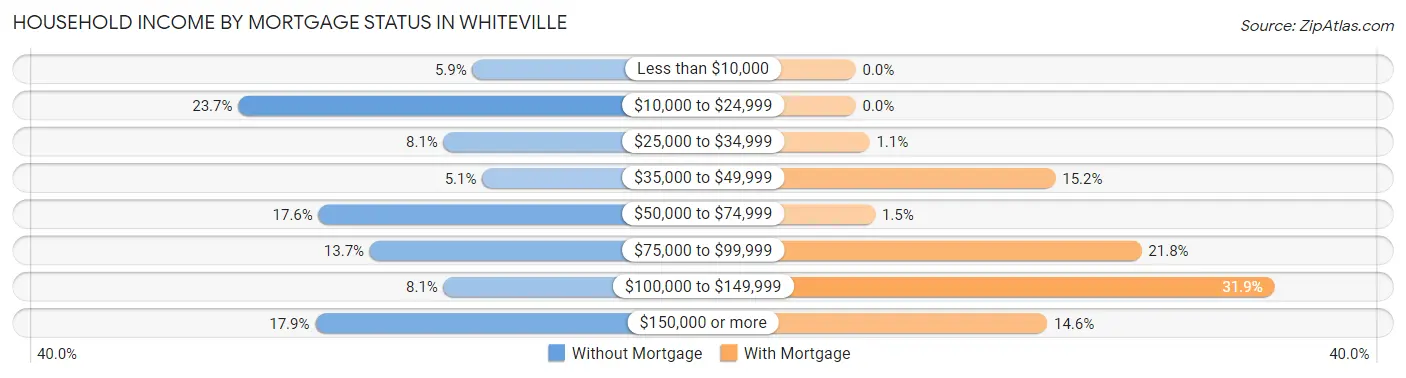
| Household Income | Without Mortgage | With Mortgage |
| Less than $10,000 | 24 (5.9%) | 0 (0.0%) |
| $10,000 to $24,999 | 97 (23.7%) | 0 (0.0%) |
| $25,000 to $34,999 | 33 (8.1%) | 5 (1.1%) |
| $35,000 to $49,999 | 21 (5.1%) | 72 (15.2%) |
| $50,000 to $74,999 | 72 (17.6%) | 7 (1.5%) |
| $75,000 to $99,999 | 56 (13.7%) | 103 (21.8%) |
| $100,000 to $149,999 | 33 (8.1%) | 151 (31.9%) |
| $150,000 or more | 73 (17.8%) | 69 (14.6%) |
| Total | 409 (100.0%) | 473 (100.0%) |
Property Value to Household Income Ratio in Whiteville
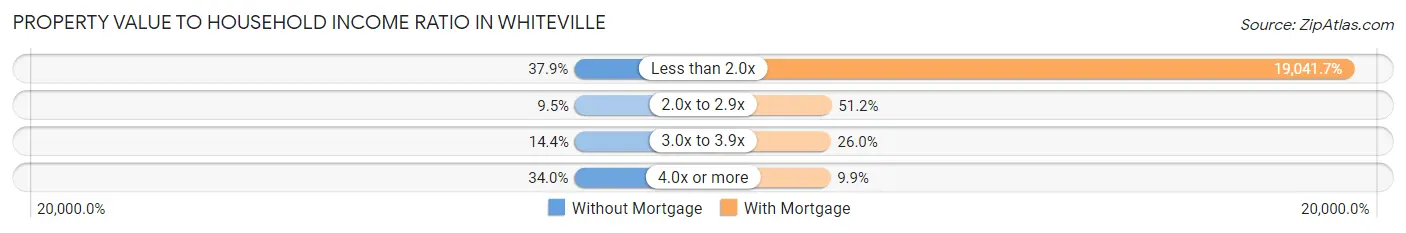
| Value-to-Income Ratio | Without Mortgage | With Mortgage |
| Less than 2.0x | 155 (37.9%) | 90,067 (19,041.7%) |
| 2.0x to 2.9x | 39 (9.5%) | 242 (51.2%) |
| 3.0x to 3.9x | 59 (14.4%) | 123 (26.0%) |
| 4.0x or more | 139 (34.0%) | 47 (9.9%) |
| Total | 409 (100.0%) | 473 (100.0%) |
Real Estate Taxes by Mortgage Status in Whiteville
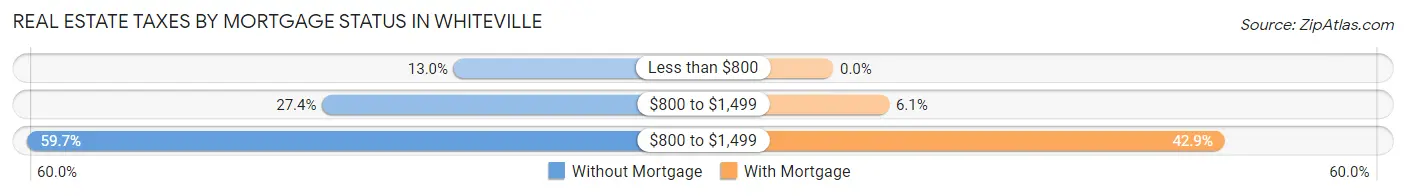
| Property Taxes | Without Mortgage | With Mortgage |
| Less than $800 | 53 (13.0%) | 0 (0.0%) |
| $800 to $1,499 | 112 (27.4%) | 29 (6.1%) |
| $800 to $1,499 | 244 (59.7%) | 203 (42.9%) |
| Total | 409 (100.0%) | 473 (100.0%) |
Health & Disability in Whiteville
Health Insurance Coverage by Age in Whiteville
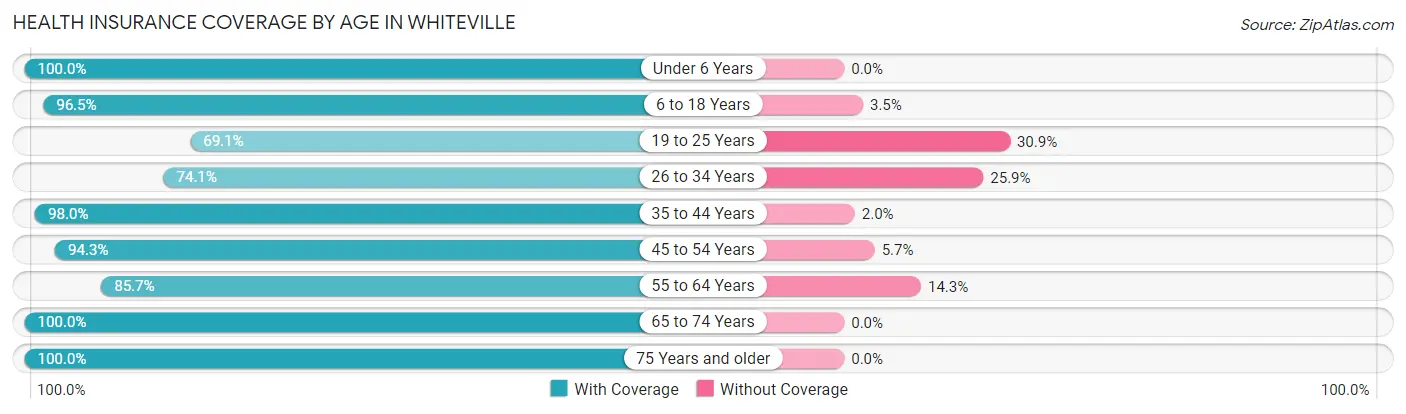
| Age Bracket | With Coverage | Without Coverage |
| Under 6 Years | 394 (100.0%) | 0 (0.0%) |
| 6 to 18 Years | 664 (96.5%) | 24 (3.5%) |
| 19 to 25 Years | 237 (69.1%) | 106 (30.9%) |
| 26 to 34 Years | 420 (74.1%) | 147 (25.9%) |
| 35 to 44 Years | 598 (98.0%) | 12 (2.0%) |
| 45 to 54 Years | 415 (94.3%) | 25 (5.7%) |
| 55 to 64 Years | 515 (85.7%) | 86 (14.3%) |
| 65 to 74 Years | 585 (100.0%) | 0 (0.0%) |
| 75 Years and older | 316 (100.0%) | 0 (0.0%) |
| Total | 4,144 (91.2%) | 400 (8.8%) |
Health Insurance Coverage by Citizenship Status in Whiteville
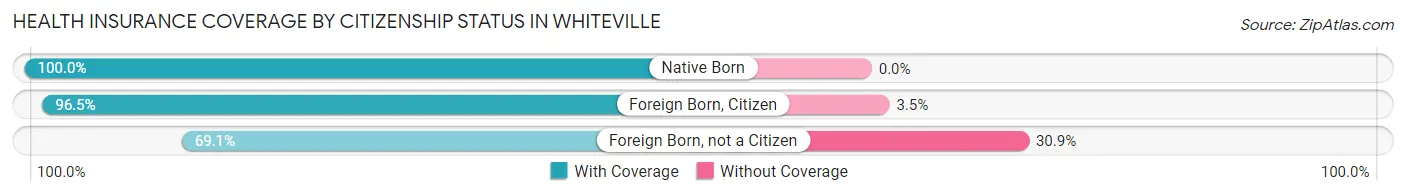
| Citizenship Status | With Coverage | Without Coverage |
| Native Born | 394 (100.0%) | 0 (0.0%) |
| Foreign Born, Citizen | 664 (96.5%) | 24 (3.5%) |
| Foreign Born, not a Citizen | 237 (69.1%) | 106 (30.9%) |
Health Insurance Coverage by Household Income in Whiteville
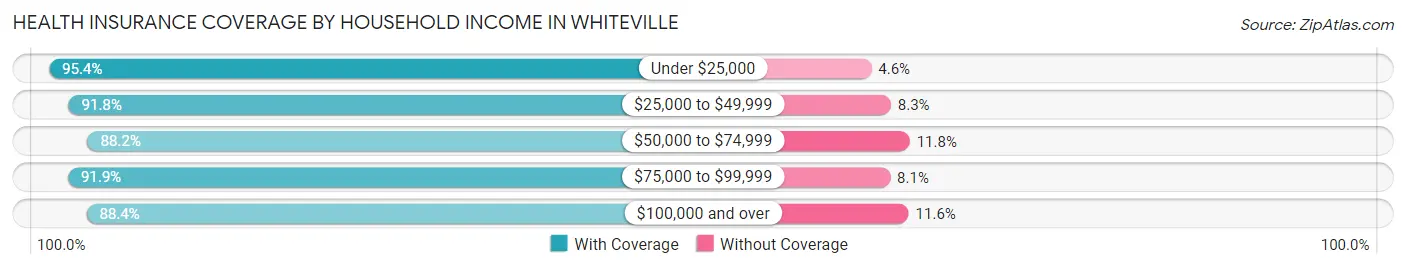
| Household Income | With Coverage | Without Coverage |
| Under $25,000 | 975 (95.4%) | 47 (4.6%) |
| $25,000 to $49,999 | 967 (91.7%) | 87 (8.3%) |
| $50,000 to $74,999 | 793 (88.2%) | 106 (11.8%) |
| $75,000 to $99,999 | 498 (91.9%) | 44 (8.1%) |
| $100,000 and over | 885 (88.4%) | 116 (11.6%) |
Public vs Private Health Insurance Coverage by Age in Whiteville
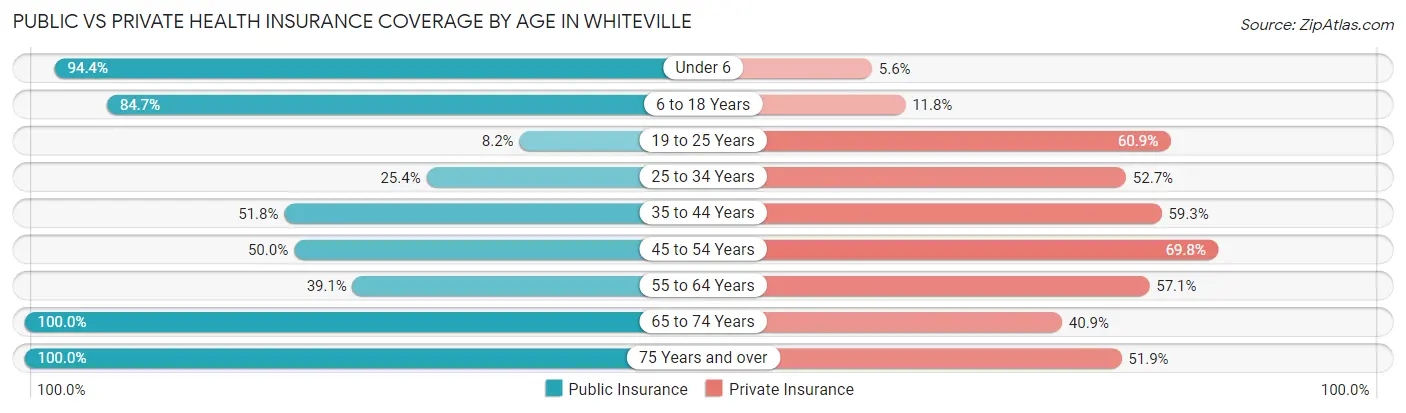
| Age Bracket | Public Insurance | Private Insurance |
| Under 6 | 372 (94.4%) | 22 (5.6%) |
| 6 to 18 Years | 583 (84.7%) | 81 (11.8%) |
| 19 to 25 Years | 28 (8.2%) | 209 (60.9%) |
| 25 to 34 Years | 144 (25.4%) | 299 (52.7%) |
| 35 to 44 Years | 316 (51.8%) | 362 (59.3%) |
| 45 to 54 Years | 220 (50.0%) | 307 (69.8%) |
| 55 to 64 Years | 235 (39.1%) | 343 (57.1%) |
| 65 to 74 Years | 585 (100.0%) | 239 (40.8%) |
| 75 Years and over | 316 (100.0%) | 164 (51.9%) |
| Total | 2,799 (61.6%) | 2,026 (44.6%) |
Disability Status by Sex by Age in Whiteville
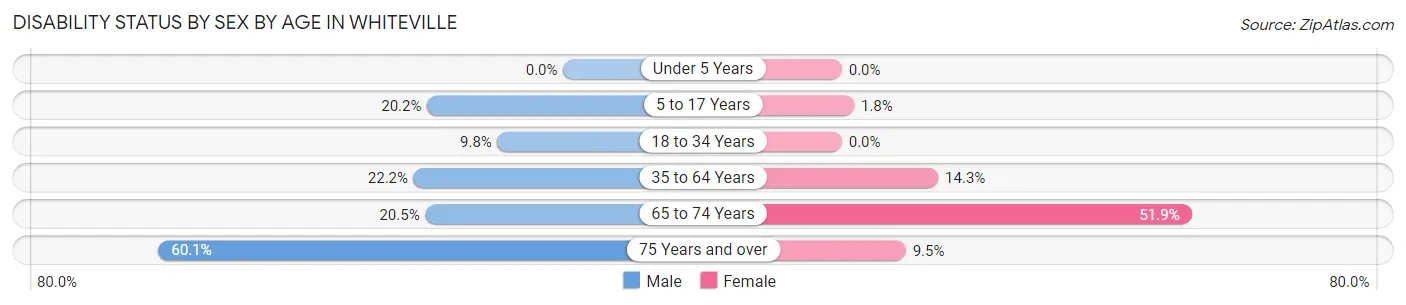
| Age Bracket | Male | Female |
| Under 5 Years | 0 (0.0%) | 0 (0.0%) |
| 5 to 17 Years | 79 (20.2%) | 7 (1.8%) |
| 18 to 34 Years | 55 (9.8%) | 0 (0.0%) |
| 35 to 64 Years | 123 (22.2%) | 157 (14.3%) |
| 65 to 74 Years | 61 (20.5%) | 149 (51.9%) |
| 75 Years and over | 95 (60.1%) | 15 (9.5%) |
Disability Class by Sex by Age in Whiteville
Disability Class: Hearing Difficulty
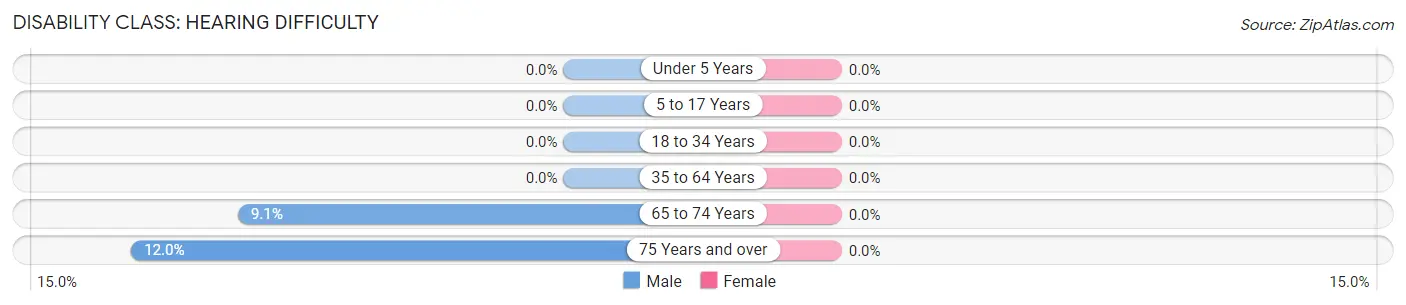
| Age Bracket | Male | Female |
| Under 5 Years | 0 (0.0%) | 0 (0.0%) |
| 5 to 17 Years | 0 (0.0%) | 0 (0.0%) |
| 18 to 34 Years | 0 (0.0%) | 0 (0.0%) |
| 35 to 64 Years | 0 (0.0%) | 0 (0.0%) |
| 65 to 74 Years | 27 (9.1%) | 0 (0.0%) |
| 75 Years and over | 19 (12.0%) | 0 (0.0%) |
Disability Class: Vision Difficulty
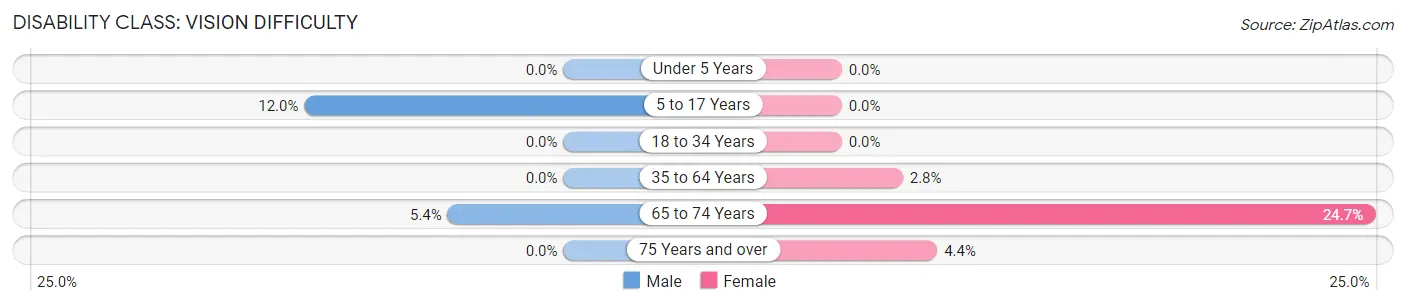
| Age Bracket | Male | Female |
| Under 5 Years | 0 (0.0%) | 0 (0.0%) |
| 5 to 17 Years | 47 (12.0%) | 0 (0.0%) |
| 18 to 34 Years | 0 (0.0%) | 0 (0.0%) |
| 35 to 64 Years | 0 (0.0%) | 31 (2.8%) |
| 65 to 74 Years | 16 (5.4%) | 71 (24.7%) |
| 75 Years and over | 0 (0.0%) | 7 (4.4%) |
Disability Class: Cognitive Difficulty
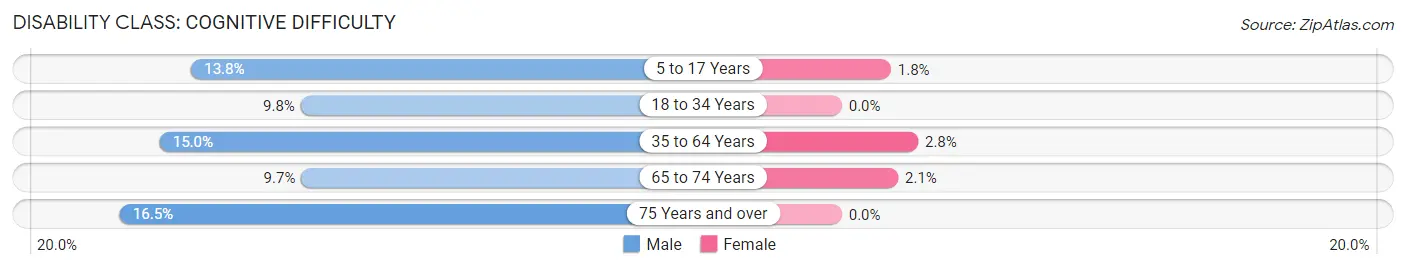
| Age Bracket | Male | Female |
| 5 to 17 Years | 54 (13.8%) | 7 (1.8%) |
| 18 to 34 Years | 55 (9.8%) | 0 (0.0%) |
| 35 to 64 Years | 83 (15.0%) | 31 (2.8%) |
| 65 to 74 Years | 29 (9.7%) | 6 (2.1%) |
| 75 Years and over | 26 (16.5%) | 0 (0.0%) |
Disability Class: Ambulatory Difficulty
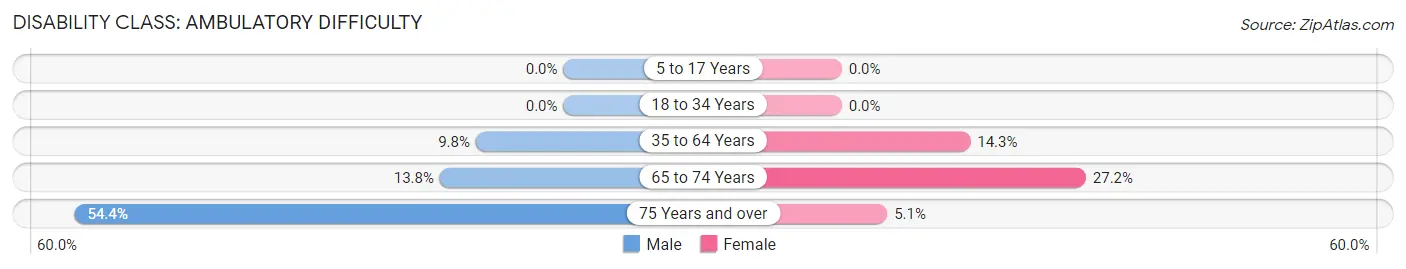
| Age Bracket | Male | Female |
| 5 to 17 Years | 0 (0.0%) | 0 (0.0%) |
| 18 to 34 Years | 0 (0.0%) | 0 (0.0%) |
| 35 to 64 Years | 54 (9.8%) | 157 (14.3%) |
| 65 to 74 Years | 41 (13.8%) | 78 (27.2%) |
| 75 Years and over | 86 (54.4%) | 8 (5.1%) |
Disability Class: Self-Care Difficulty
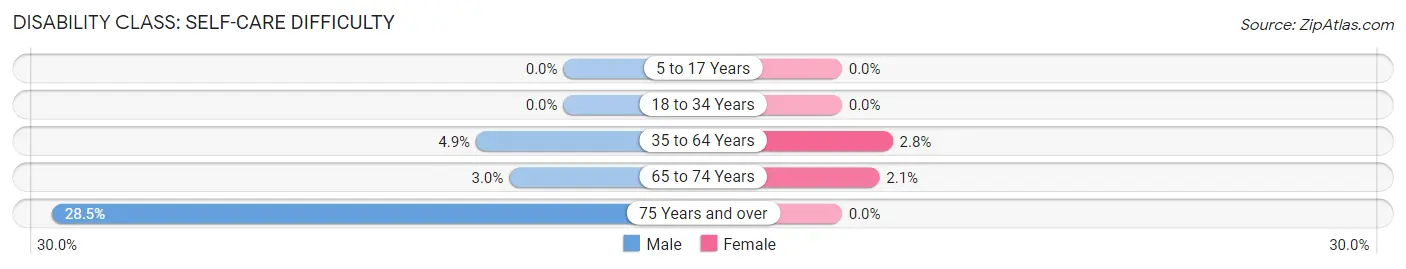
| Age Bracket | Male | Female |
| 5 to 17 Years | 0 (0.0%) | 0 (0.0%) |
| 18 to 34 Years | 0 (0.0%) | 0 (0.0%) |
| 35 to 64 Years | 27 (4.9%) | 31 (2.8%) |
| 65 to 74 Years | 9 (3.0%) | 6 (2.1%) |
| 75 Years and over | 45 (28.5%) | 0 (0.0%) |
Technology Access in Whiteville
Computing Device Access in Whiteville
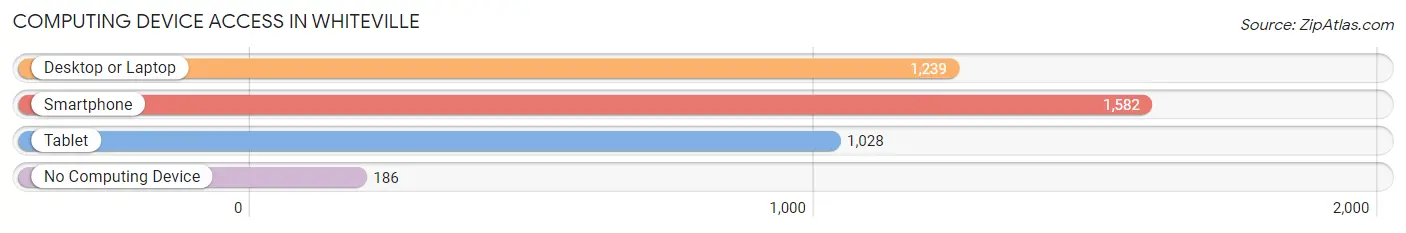
| Device Type | # Households | % Households |
| Desktop or Laptop | 1,239 | 66.4% |
| Smartphone | 1,582 | 84.8% |
| Tablet | 1,028 | 55.1% |
| No Computing Device | 186 | 10.0% |
| Total | 1,865 | 100.0% |
Internet Access in Whiteville
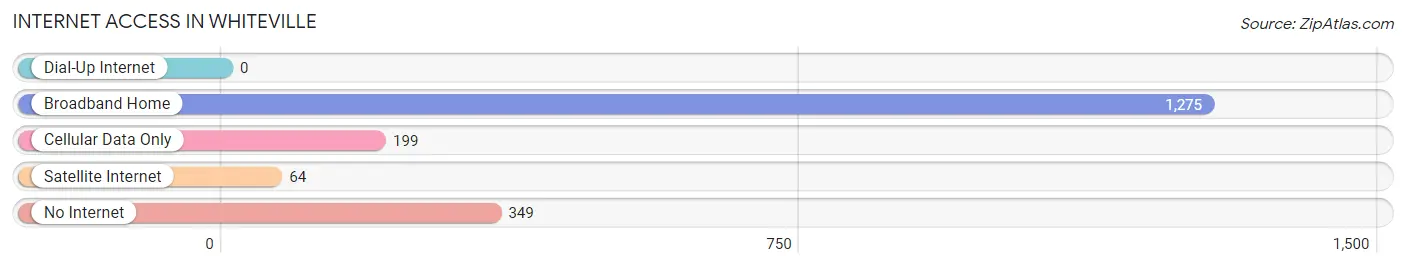
| Internet Type | # Households | % Households |
| Dial-Up Internet | 0 | 0.0% |
| Broadband Home | 1,275 | 68.4% |
| Cellular Data Only | 199 | 10.7% |
| Satellite Internet | 64 | 3.4% |
| No Internet | 349 | 18.7% |
| Total | 1,865 | 100.0% |
Whiteville Summary
History
Whiteville, North Carolina is a small town located in Columbus County, in the southeastern part of the state. It is the county seat of Columbus County and is located about 40 miles northwest of Wilmington. The town was founded in 1808 and was named after the White family, who were among the first settlers in the area.
Whiteville has a rich history that dates back to the early 1800s. The town was originally inhabited by the Tuscarora Indians, who were later displaced by European settlers. The first settlers in the area were the White family, who established a trading post in the area in 1808. The town was officially incorporated in 1810 and was named after the White family.
In the early 1900s, Whiteville experienced a period of growth and development. The town was home to several businesses, including a cotton mill, a lumber mill, and a brick factory. The town also had a railroad station, which connected it to other parts of the state.
In the mid-1900s, Whiteville experienced a period of decline. The cotton mill and the lumber mill closed, and the railroad station was abandoned. The town was also hit hard by the Great Depression, and many of its businesses closed.
In the late 1900s, Whiteville experienced a period of revitalization. The town was designated as a Main Street Community in 1998, and the downtown area was revitalized with new businesses and restaurants. The town also received a grant from the state to build a new library and a new community center.
Today, Whiteville is a small town with a population of about 5,000 people. The town is home to several businesses, including a grocery store, a hardware store, and a few restaurants. The town also has a few parks and recreational areas, including a golf course and a swimming pool.
Geography
Whiteville is located in the southeastern part of North Carolina, in Columbus County. The town is situated on the banks of the Cape Fear River, about 40 miles northwest of Wilmington. The town is surrounded by rural areas, with the nearest major city being Fayetteville, which is about 40 miles to the east.
The town has a total area of 4.2 square miles, all of which is land. The terrain is mostly flat, with some rolling hills in the surrounding area. The climate is humid subtropical, with hot, humid summers and mild winters.
Economy
Whiteville’s economy is largely based on agriculture and manufacturing. The town is home to several farms, which produce a variety of crops, including corn, soybeans, and cotton. The town also has several manufacturing plants, which produce a variety of products, including furniture, textiles, and paper products.
The town is also home to several retail stores, restaurants, and other businesses. The town also has a few hotels and motels, which cater to tourists and visitors.
Demographics
As of the 2010 census, Whiteville had a population of 5,092 people. The racial makeup of the town was 79.2% White, 16.2% African American, 0.5% Native American, 0.7% Asian, 0.1% Pacific Islander, and 3.3% from other races. Hispanic or Latino of any race were 3.3% of the population.
The median household income in Whiteville was $30,938, and the median family income was $37,917. The per capita income was $17,845. About 17.2% of the population was below the poverty line.
Common Questions
What is Per Capita Income in Whiteville?
Per Capita income in Whiteville is $24,524.
What is the Median Family Income in Whiteville?
Median Family Income in Whiteville is $53,606.
What is the Median Household income in Whiteville?
Median Household Income in Whiteville is $34,121.
What is Inequality or Gini Index in Whiteville?
Inequality or Gini Index in Whiteville is 0.53.
What is the Total Population of Whiteville?
Total Population of Whiteville is 4,761.
What is the Total Male Population of Whiteville?
Total Male Population of Whiteville is 2,216.
What is the Total Female Population of Whiteville?
Total Female Population of Whiteville is 2,545.
What is the Ratio of Males per 100 Females in Whiteville?
There are 87.07 Males per 100 Females in Whiteville.
What is the Ratio of Females per 100 Males in Whiteville?
There are 114.85 Females per 100 Males in Whiteville.
What is the Median Population Age in Whiteville?
Median Population Age in Whiteville is 38.0 Years.
What is the Average Family Size in Whiteville
Average Family Size in Whiteville is 3.3 People.
What is the Average Household Size in Whiteville
Average Household Size in Whiteville is 2.4 People.
How Large is the Labor Force in Whiteville?
There are 2,067 People in the Labor Forcein in Whiteville.
What is the Percentage of People in the Labor Force in Whiteville?
54.9% of People are in the Labor Force in Whiteville.
What is the Unemployment Rate in Whiteville?
Unemployment Rate in Whiteville is 4.8%.