Windsor, NC Map & Demographics
Windsor Map
Windsor Overview
$22,814
PER CAPITA INCOME
$63,750
AVG FAMILY INCOME
$46,786
AVG HOUSEHOLD INCOME
53.8%
WAGE / INCOME GAP [ % ]
46.2¢/ $1
WAGE / INCOME GAP [ $ ]
0.58
INEQUALITY / GINI INDEX
3,494
TOTAL POPULATION
2,137
MALE POPULATION
1,357
FEMALE POPULATION
157.48
MALES / 100 FEMALES
63.50
FEMALES / 100 MALES
41.3
MEDIAN AGE
2.9
AVG FAMILY SIZE
2.4
AVG HOUSEHOLD SIZE
713
LABOR FORCE [ PEOPLE ]
22.7%
PERCENT IN LABOR FORCE
2.5%
UNEMPLOYMENT RATE
Windsor Zip Codes
Windsor Area Codes
Income in Windsor
Income Overview in Windsor
Per Capita Income in Windsor is $22,814, while median incomes of families and households are $63,750 and $46,786 respectively.
| Characteristic | Number | Measure |
| Per Capita Income | 3,494 | $22,814 |
| Median Family Income | 627 | $63,750 |
| Mean Family Income | 627 | $103,882 |
| Median Household Income | 882 | $46,786 |
| Mean Household Income | 882 | $82,262 |
| Income Deficit | 627 | $0 |
| Wage / Income Gap (%) | 3,494 | 53.85% |
| Wage / Income Gap ($) | 3,494 | 46.15¢ per $1 |
| Gini / Inequality Index | 3,494 | 0.58 |
Earnings by Sex in Windsor
Average Earnings in Windsor are $21,738, $15,500 for men and $33,586 for women, a difference of 53.8%.
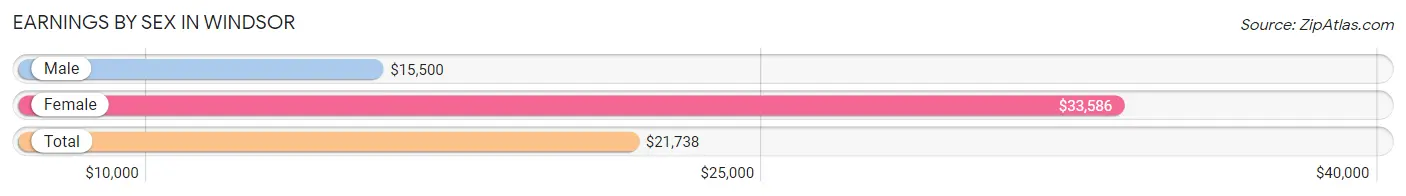
| Sex | Number | Average Earnings |
| Male | 558 (53.7%) | $15,500 |
| Female | 481 (46.3%) | $33,586 |
| Total | 1,039 (100.0%) | $21,738 |
Earnings by Sex by Income Bracket in Windsor
The most common earnings brackets in Windsor are $2,499 or less for men (120 | 21.5%) and $55,000 to $64,999 for women (77 | 16.0%).
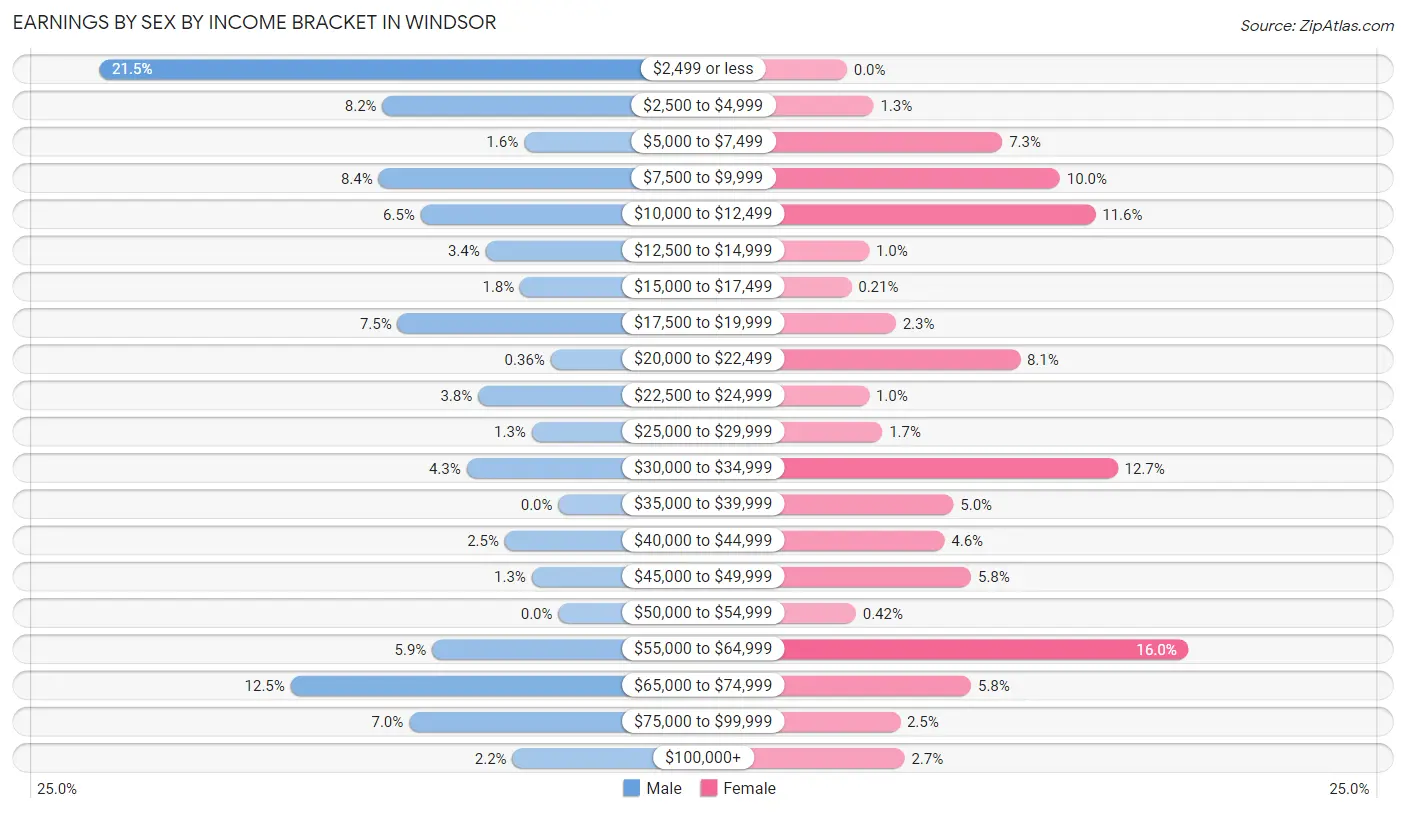
| Income | Male | Female |
| $2,499 or less | 120 (21.5%) | 0 (0.0%) |
| $2,500 to $4,999 | 46 (8.2%) | 6 (1.3%) |
| $5,000 to $7,499 | 9 (1.6%) | 35 (7.3%) |
| $7,500 to $9,999 | 47 (8.4%) | 48 (10.0%) |
| $10,000 to $12,499 | 36 (6.5%) | 56 (11.6%) |
| $12,500 to $14,999 | 19 (3.4%) | 5 (1.0%) |
| $15,000 to $17,499 | 10 (1.8%) | 1 (0.2%) |
| $17,500 to $19,999 | 42 (7.5%) | 11 (2.3%) |
| $20,000 to $22,499 | 2 (0.4%) | 39 (8.1%) |
| $22,500 to $24,999 | 21 (3.8%) | 5 (1.0%) |
| $25,000 to $29,999 | 7 (1.3%) | 8 (1.7%) |
| $30,000 to $34,999 | 24 (4.3%) | 61 (12.7%) |
| $35,000 to $39,999 | 0 (0.0%) | 24 (5.0%) |
| $40,000 to $44,999 | 14 (2.5%) | 22 (4.6%) |
| $45,000 to $49,999 | 7 (1.3%) | 28 (5.8%) |
| $50,000 to $54,999 | 0 (0.0%) | 2 (0.4%) |
| $55,000 to $64,999 | 33 (5.9%) | 77 (16.0%) |
| $65,000 to $74,999 | 70 (12.5%) | 28 (5.8%) |
| $75,000 to $99,999 | 39 (7.0%) | 12 (2.5%) |
| $100,000+ | 12 (2.1%) | 13 (2.7%) |
| Total | 558 (100.0%) | 481 (100.0%) |
Earnings by Sex by Educational Attainment in Windsor
Average earnings in Windsor are $14,896 for men and $37,895 for women, a difference of 60.7%. Men with an educational attainment of high school diploma enjoy the highest average annual earnings of $8,393, while those with high school diploma education earn the least with $8,393. Women with an educational attainment of college or associate's degree earn the most with the average annual earnings of $62,750, while those with bachelor's degree education have the smallest earnings of $33,868.
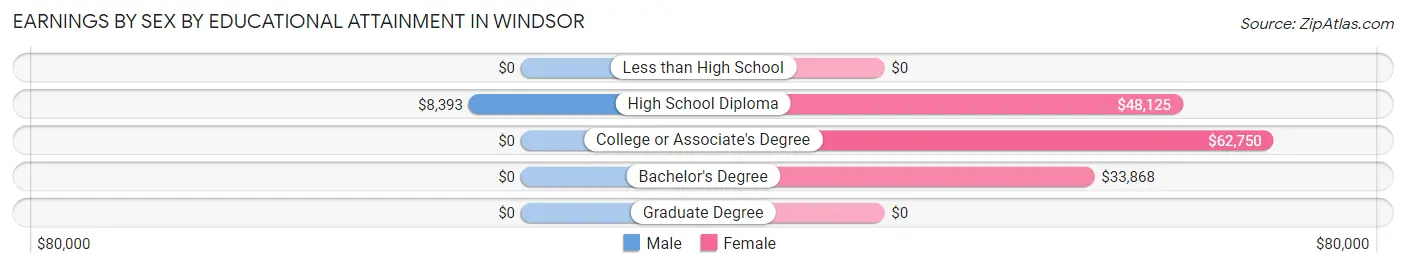
| Educational Attainment | Male Income | Female Income |
| Less than High School | - | - |
| High School Diploma | $8,393 | $48,125 |
| College or Associate's Degree | - | - |
| Bachelor's Degree | - | - |
| Graduate Degree | - | - |
| Total | $14,896 | $37,895 |
Family Income in Windsor
Family Income Brackets in Windsor
According to the Windsor family income data, there are 143 families falling into the $50,000 to $74,999 income range, which is the most common income bracket and makes up 22.8% of all families.
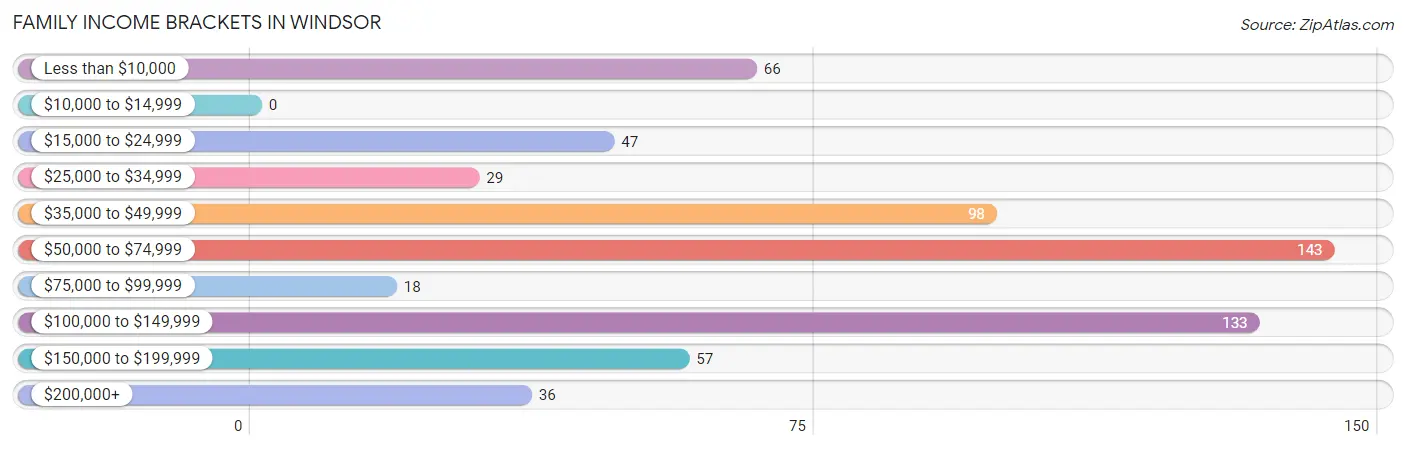
| Income Bracket | # Families | % Families |
| Less than $10,000 | 66 | 10.5% |
| $10,000 to $14,999 | 0 | 0.0% |
| $15,000 to $24,999 | 47 | 7.5% |
| $25,000 to $34,999 | 29 | 4.6% |
| $35,000 to $49,999 | 98 | 15.6% |
| $50,000 to $74,999 | 143 | 22.8% |
| $75,000 to $99,999 | 18 | 2.9% |
| $100,000 to $149,999 | 133 | 21.2% |
| $150,000 to $199,999 | 57 | 9.1% |
| $200,000+ | 36 | 5.7% |
Family Income by Famaliy Size in Windsor
4-person families (180 | 28.7%) account for the highest median family income in Windsor with $100,106 per family, while 2-person families (318 | 50.7%) have the highest median income of $31,022 per family member.
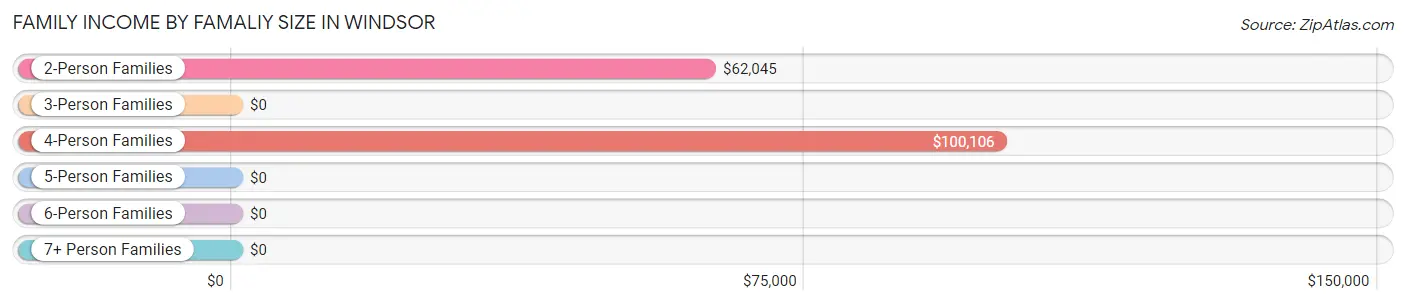
| Income Bracket | # Families | Median Income |
| 2-Person Families | 318 (50.7%) | $62,045 |
| 3-Person Families | 121 (19.3%) | $0 |
| 4-Person Families | 180 (28.7%) | $100,106 |
| 5-Person Families | 0 (0.0%) | $0 |
| 6-Person Families | 8 (1.3%) | $0 |
| 7+ Person Families | 0 (0.0%) | $0 |
| Total | 627 (100.0%) | $63,750 |
Family Income by Number of Earners in Windsor
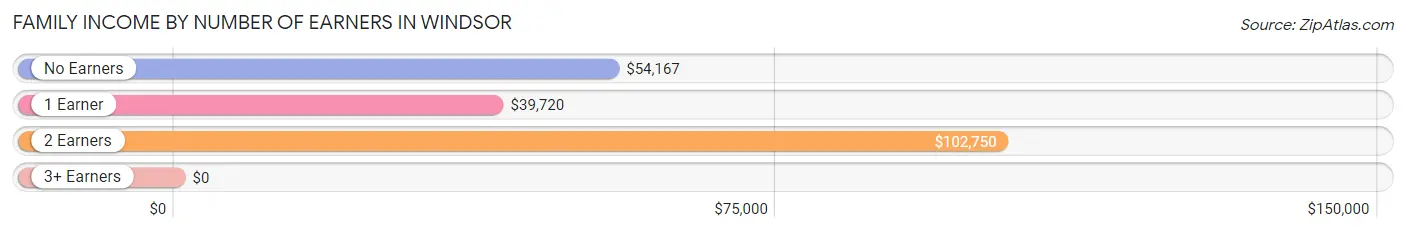
| Number of Earners | # Families | Median Income |
| No Earners | 196 (31.3%) | $54,167 |
| 1 Earner | 221 (35.2%) | $39,720 |
| 2 Earners | 186 (29.7%) | $102,750 |
| 3+ Earners | 24 (3.8%) | $0 |
| Total | 627 (100.0%) | $63,750 |
Household Income in Windsor
Household Income Brackets in Windsor
With 171 households falling in the category, the $50,000 to $74,999 income range is the most frequent in Windsor, accounting for 19.4% of all households. In contrast, only 36 households (4.1%) fall into the $200,000+ income bracket, making it the least populous group.
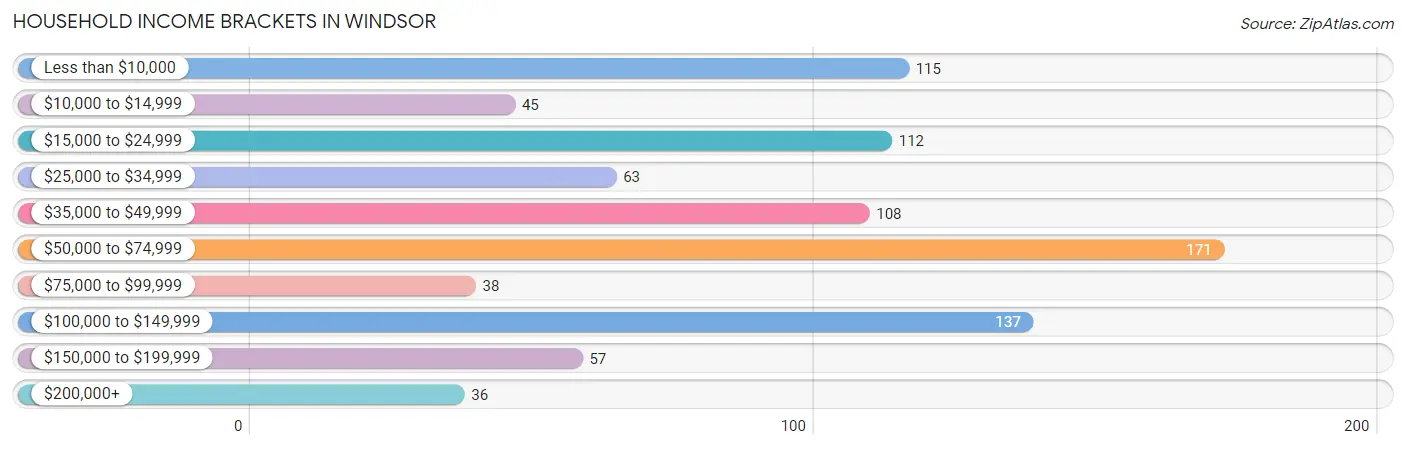
| Income Bracket | # Households | % Households |
| Less than $10,000 | 115 | 13.0% |
| $10,000 to $14,999 | 45 | 5.1% |
| $15,000 to $24,999 | 112 | 12.7% |
| $25,000 to $34,999 | 63 | 7.1% |
| $35,000 to $49,999 | 108 | 12.2% |
| $50,000 to $74,999 | 171 | 19.4% |
| $75,000 to $99,999 | 38 | 4.3% |
| $100,000 to $149,999 | 137 | 15.5% |
| $150,000 to $199,999 | 57 | 6.5% |
| $200,000+ | 36 | 4.1% |
Household Income by Householder Age in Windsor
The median household income in Windsor is $46,786, with the highest median household income of $58,523 found in the 65+ years age bracket for the primary householder. A total of 418 households (47.4%) fall into this category.
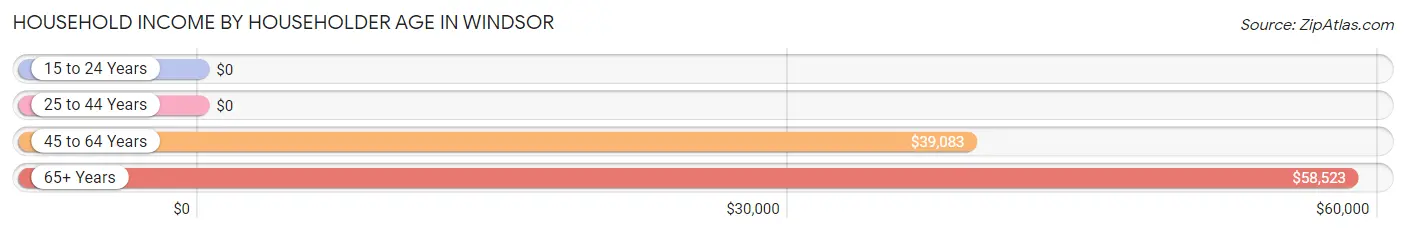
| Income Bracket | # Households | Median Income |
| 15 to 24 Years | 0 (0.0%) | $0 |
| 25 to 44 Years | 243 (27.6%) | $0 |
| 45 to 64 Years | 221 (25.1%) | $39,083 |
| 65+ Years | 418 (47.4%) | $58,523 |
| Total | 882 (100.0%) | $46,786 |
Poverty in Windsor
Income Below Poverty by Sex and Age in Windsor
With 18.6% poverty level for males and 13.8% for females among the residents of Windsor, under 5 year old males and 6 to 11 year old females are the most vulnerable to poverty, with 27 males (100.0%) and 18 females (40.0%) in their respective age groups living below the poverty level.

| Age Bracket | Male | Female |
| Under 5 Years | 27 (100.0%) | 0 (0.0%) |
| 5 Years | 0 (0.0%) | 0 (0.0%) |
| 6 to 11 Years | 55 (91.7%) | 18 (40.0%) |
| 12 to 14 Years | 0 (0.0%) | 0 (0.0%) |
| 15 Years | 0 (0.0%) | 0 (0.0%) |
| 16 and 17 Years | 0 (0.0%) | 0 (0.0%) |
| 18 to 24 Years | 0 (0.0%) | 0 (0.0%) |
| 25 to 34 Years | 0 (0.0%) | 51 (32.1%) |
| 35 to 44 Years | 27 (22.9%) | 38 (31.4%) |
| 45 to 54 Years | 9 (26.5%) | 20 (20.4%) |
| 55 to 64 Years | 30 (31.2%) | 0 (0.0%) |
| 65 to 74 Years | 9 (5.3%) | 29 (12.8%) |
| 75 Years and over | 5 (8.3%) | 18 (10.8%) |
| Total | 162 (18.6%) | 174 (13.8%) |
Income Above Poverty by Sex and Age in Windsor
According to the poverty statistics in Windsor, males aged 12 to 14 years and females aged under 5 years are the age groups that are most secure financially, with 100.0% of males and 100.0% of females in these age groups living above the poverty line.
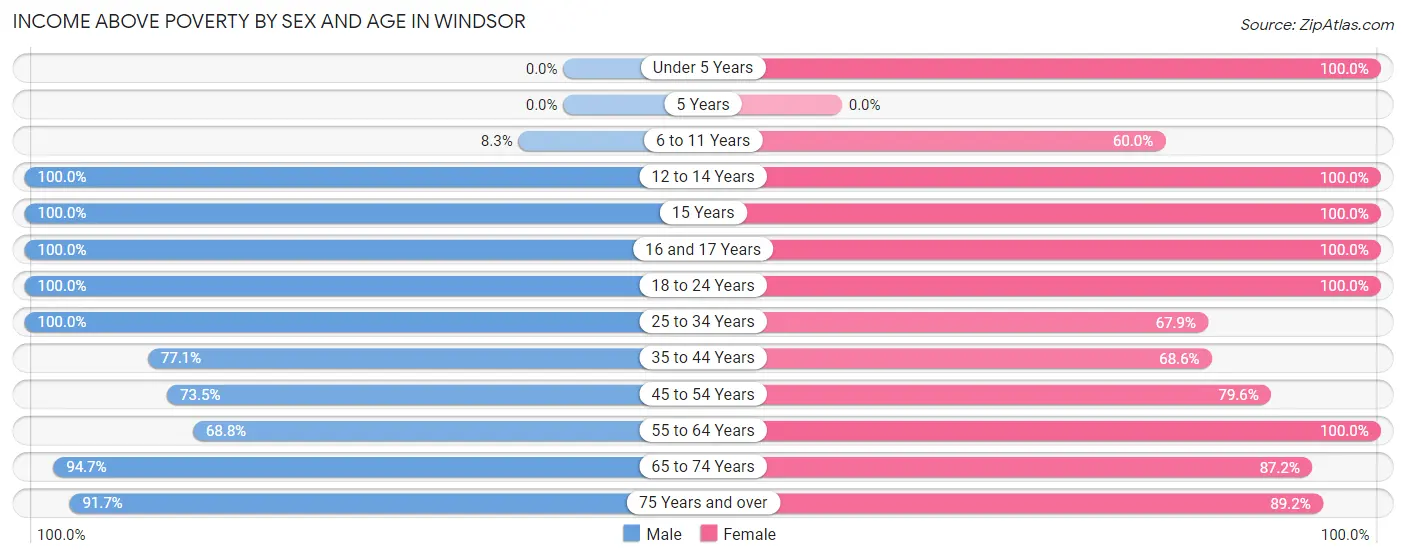
| Age Bracket | Male | Female |
| Under 5 Years | 0 (0.0%) | 109 (100.0%) |
| 5 Years | 0 (0.0%) | 0 (0.0%) |
| 6 to 11 Years | 5 (8.3%) | 27 (60.0%) |
| 12 to 14 Years | 26 (100.0%) | 59 (100.0%) |
| 15 Years | 5 (100.0%) | 24 (100.0%) |
| 16 and 17 Years | 37 (100.0%) | 24 (100.0%) |
| 18 to 24 Years | 83 (100.0%) | 100 (100.0%) |
| 25 to 34 Years | 154 (100.0%) | 108 (67.9%) |
| 35 to 44 Years | 91 (77.1%) | 83 (68.6%) |
| 45 to 54 Years | 25 (73.5%) | 78 (79.6%) |
| 55 to 64 Years | 66 (68.8%) | 124 (100.0%) |
| 65 to 74 Years | 160 (94.7%) | 198 (87.2%) |
| 75 Years and over | 55 (91.7%) | 149 (89.2%) |
| Total | 707 (81.4%) | 1,083 (86.2%) |
Income Below Poverty Among Married-Couple Families in Windsor
The poverty statistics for married-couple families in Windsor show that 11.3% or 38 of the total 335 families live below the poverty line. Families with no children have the highest poverty rate of 15.3%, comprising of 38 families. On the other hand, families with 1 or 2 children have the lowest poverty rate of 0.0%, which includes 0 families.
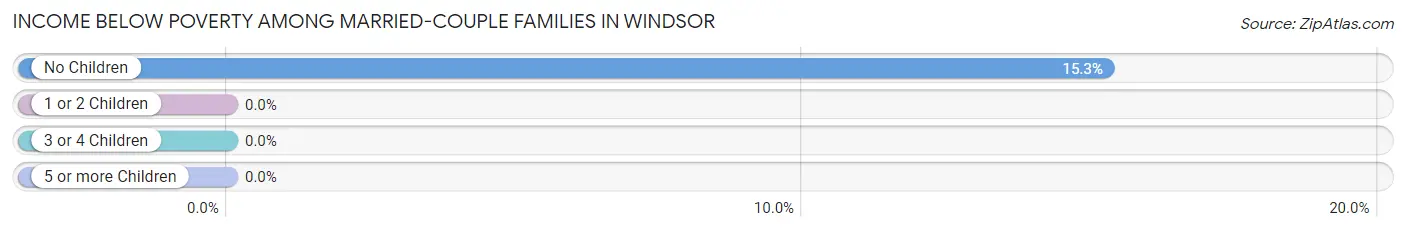
| Children | Above Poverty | Below Poverty |
| No Children | 211 (84.7%) | 38 (15.3%) |
| 1 or 2 Children | 78 (100.0%) | 0 (0.0%) |
| 3 or 4 Children | 8 (100.0%) | 0 (0.0%) |
| 5 or more Children | 0 (0.0%) | 0 (0.0%) |
| Total | 297 (88.7%) | 38 (11.3%) |
Income Below Poverty Among Single-Parent Households in Windsor
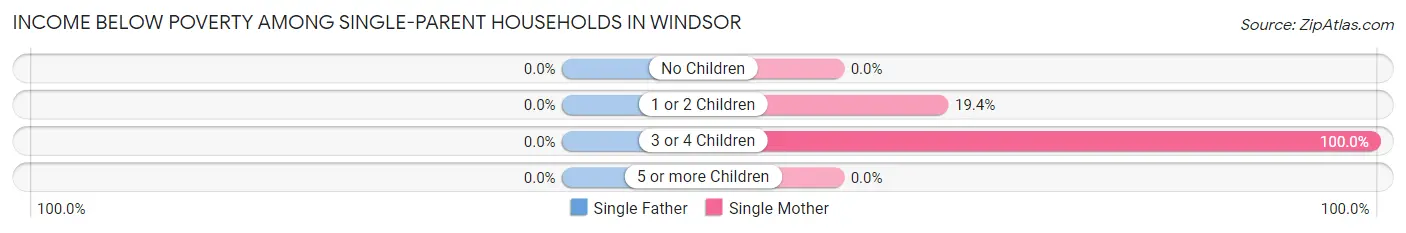
| Children | Single Father | Single Mother |
| No Children | 0 (0.0%) | 0 (0.0%) |
| 1 or 2 Children | 0 (0.0%) | 28 (19.4%) |
| 3 or 4 Children | 0 (0.0%) | 17 (100.0%) |
| 5 or more Children | 0 (0.0%) | 0 (0.0%) |
| Total | 0 (0.0%) | 45 (15.6%) |
Income Below Poverty Among Married-Couple vs Single-Parent Households in Windsor
The poverty data for Windsor shows that 38 of the married-couple family households (11.3%) and 45 of the single-parent households (15.4%) are living below the poverty level. Within the married-couple family households, those with no children have the highest poverty rate, with 38 households (15.3%) falling below the poverty line. Among the single-parent households, those with 3 or 4 children have the highest poverty rate, with 17 household (100.0%) living below poverty.
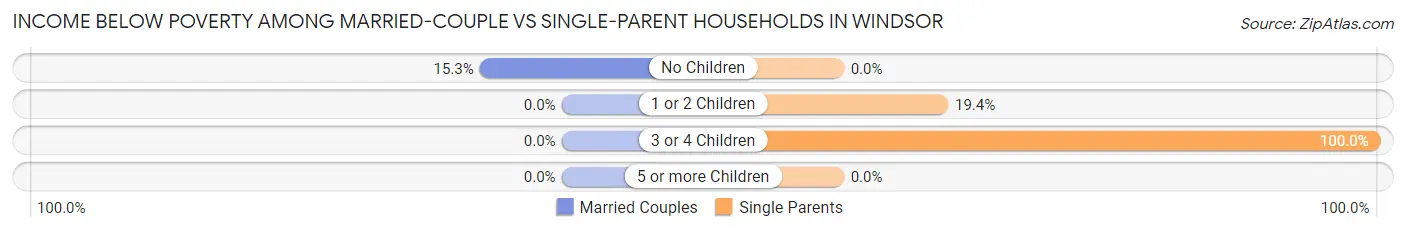
| Children | Married-Couple Families | Single-Parent Households |
| No Children | 38 (15.3%) | 0 (0.0%) |
| 1 or 2 Children | 0 (0.0%) | 28 (19.4%) |
| 3 or 4 Children | 0 (0.0%) | 17 (100.0%) |
| 5 or more Children | 0 (0.0%) | 0 (0.0%) |
| Total | 38 (11.3%) | 45 (15.4%) |
Race in Windsor
The most populous races in Windsor are Black / African American (2,382 | 68.2%), White / Caucasian (784 | 22.4%), and Two or more Races (130 | 3.7%).
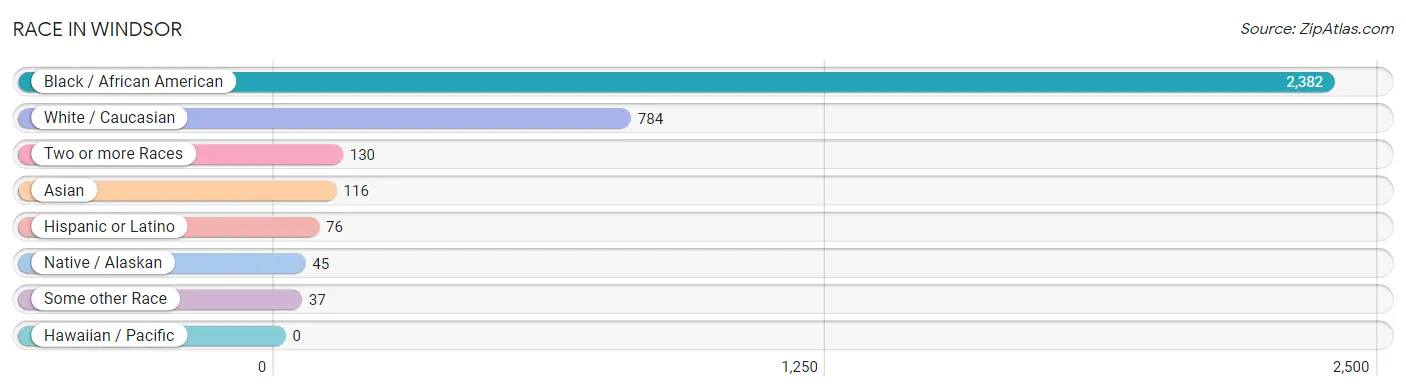
| Race | # Population | % Population |
| Asian | 116 | 3.3% |
| Black / African American | 2,382 | 68.2% |
| Hawaiian / Pacific | 0 | 0.0% |
| Hispanic or Latino | 76 | 2.2% |
| Native / Alaskan | 45 | 1.3% |
| White / Caucasian | 784 | 22.4% |
| Two or more Races | 130 | 3.7% |
| Some other Race | 37 | 1.1% |
| Total | 3,494 | 100.0% |
Ancestry in Windsor
The most populous ancestries reported in Windsor are American (211 | 6.0%), Irish (150 | 4.3%), English (75 | 2.1%), Scotch-Irish (65 | 1.9%), and German (61 | 1.8%), together accounting for 16.1% of all Windsor residents.
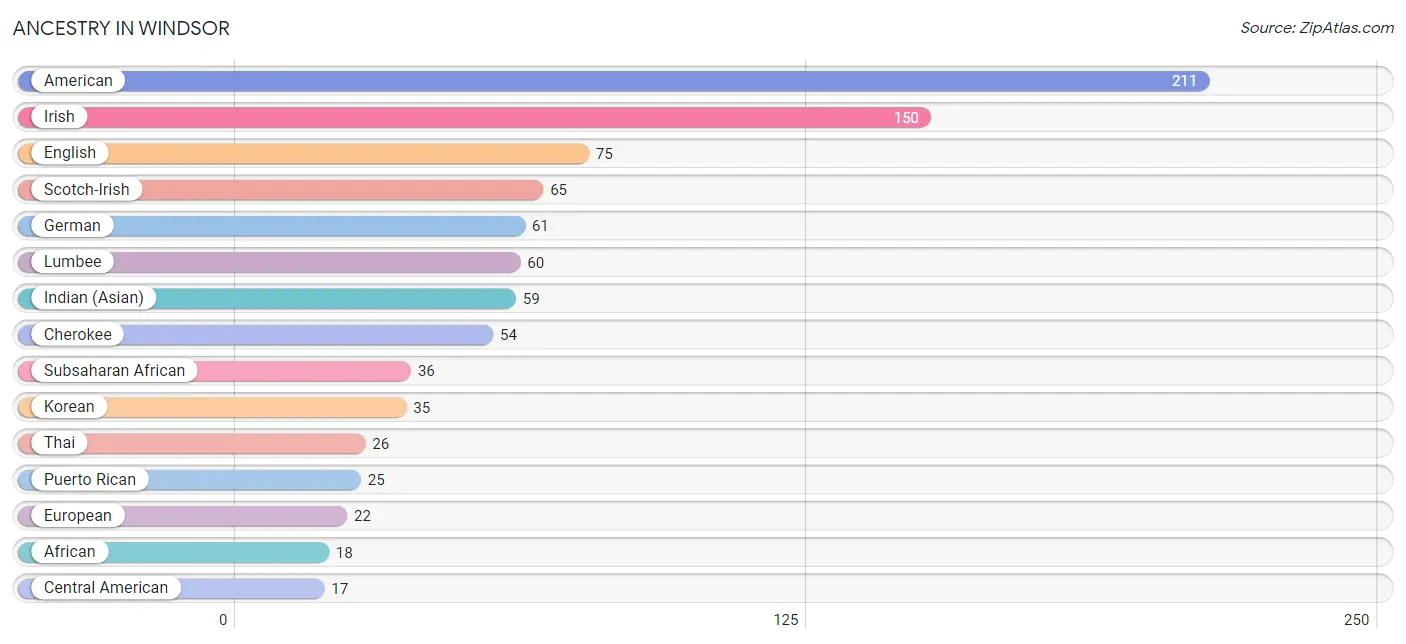
| Ancestry | # Population | % Population |
| African | 18 | 0.5% |
| American | 211 | 6.0% |
| Arab | 10 | 0.3% |
| Cajun | 9 | 0.3% |
| Central American | 17 | 0.5% |
| Central American Indian | 8 | 0.2% |
| Cherokee | 54 | 1.5% |
| Colombian | 8 | 0.2% |
| Creek | 1 | 0.0% |
| Dominican | 10 | 0.3% |
| Dutch | 2 | 0.1% |
| English | 75 | 2.1% |
| European | 22 | 0.6% |
| French | 5 | 0.1% |
| French Canadian | 9 | 0.3% |
| German | 61 | 1.8% |
| Haitian | 9 | 0.3% |
| Indian (Asian) | 59 | 1.7% |
| Irish | 150 | 4.3% |
| Jamaican | 9 | 0.3% |
| Korean | 35 | 1.0% |
| Liberian | 8 | 0.2% |
| Lumbee | 60 | 1.7% |
| Mexican | 16 | 0.5% |
| Moroccan | 10 | 0.3% |
| Nigerian | 10 | 0.3% |
| Panamanian | 9 | 0.3% |
| Puerto Rican | 25 | 0.7% |
| Salvadoran | 8 | 0.2% |
| Scotch-Irish | 65 | 1.9% |
| Scottish | 15 | 0.4% |
| South American | 8 | 0.2% |
| Subsaharan African | 36 | 1.0% |
| Thai | 26 | 0.7% | View All 34 Rows |
Immigrants in Windsor
The most numerous immigrant groups reported in Windsor came from Asia (84 | 2.4%), China (49 | 1.4%), Eastern Asia (49 | 1.4%), Philippines (35 | 1.0%), and South Eastern Asia (35 | 1.0%), together accounting for 7.2% of all Windsor residents.
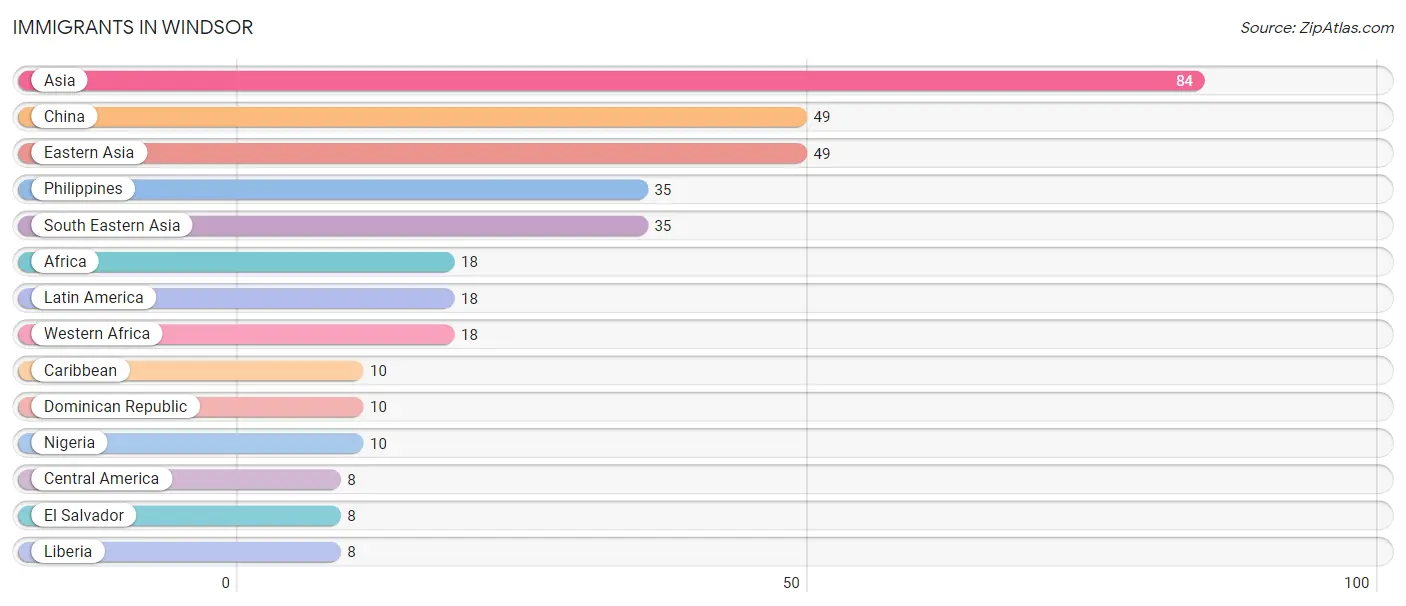
| Immigration Origin | # Population | % Population |
| Africa | 18 | 0.5% |
| Asia | 84 | 2.4% |
| Caribbean | 10 | 0.3% |
| Central America | 8 | 0.2% |
| China | 49 | 1.4% |
| Dominican Republic | 10 | 0.3% |
| Eastern Asia | 49 | 1.4% |
| El Salvador | 8 | 0.2% |
| Latin America | 18 | 0.5% |
| Liberia | 8 | 0.2% |
| Nigeria | 10 | 0.3% |
| Philippines | 35 | 1.0% |
| South Eastern Asia | 35 | 1.0% |
| Western Africa | 18 | 0.5% | View All 14 Rows |
Sex and Age in Windsor
Sex and Age in Windsor
The most populous age groups in Windsor are 30 to 34 Years (320 | 15.0%) for men and 70 to 74 Years (164 | 12.1%) for women.
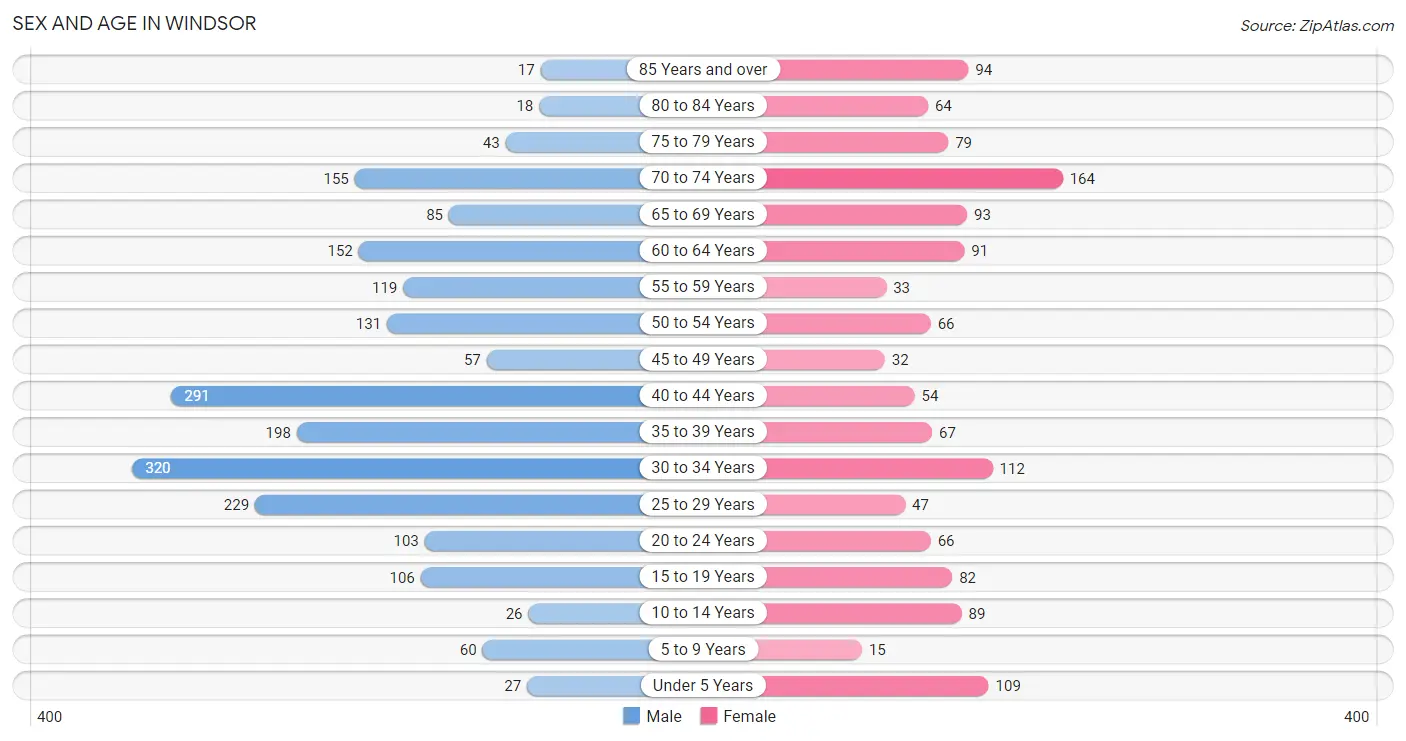
| Age Bracket | Male | Female |
| Under 5 Years | 27 (1.3%) | 109 (8.0%) |
| 5 to 9 Years | 60 (2.8%) | 15 (1.1%) |
| 10 to 14 Years | 26 (1.2%) | 89 (6.6%) |
| 15 to 19 Years | 106 (5.0%) | 82 (6.0%) |
| 20 to 24 Years | 103 (4.8%) | 66 (4.9%) |
| 25 to 29 Years | 229 (10.7%) | 47 (3.5%) |
| 30 to 34 Years | 320 (15.0%) | 112 (8.3%) |
| 35 to 39 Years | 198 (9.3%) | 67 (4.9%) |
| 40 to 44 Years | 291 (13.6%) | 54 (4.0%) |
| 45 to 49 Years | 57 (2.7%) | 32 (2.4%) |
| 50 to 54 Years | 131 (6.1%) | 66 (4.9%) |
| 55 to 59 Years | 119 (5.6%) | 33 (2.4%) |
| 60 to 64 Years | 152 (7.1%) | 91 (6.7%) |
| 65 to 69 Years | 85 (4.0%) | 93 (6.9%) |
| 70 to 74 Years | 155 (7.2%) | 164 (12.1%) |
| 75 to 79 Years | 43 (2.0%) | 79 (5.8%) |
| 80 to 84 Years | 18 (0.8%) | 64 (4.7%) |
| 85 Years and over | 17 (0.8%) | 94 (6.9%) |
| Total | 2,137 (100.0%) | 1,357 (100.0%) |
Families and Households in Windsor
Median Family Size in Windsor
The median family size in Windsor is 2.88 persons per family, with single female/mother families (288 | 45.9%) accounting for the largest median family size of 3.02 persons per family. On the other hand, single male/father families (4 | 0.6%) represent the smallest median family size with 2.00 persons per family.
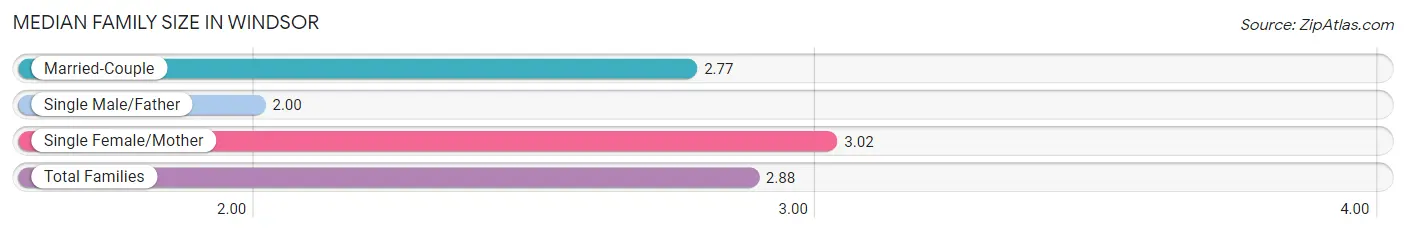
| Family Type | # Families | Family Size |
| Married-Couple | 335 (53.4%) | 2.77 |
| Single Male/Father | 4 (0.6%) | 2.00 |
| Single Female/Mother | 288 (45.9%) | 3.02 |
| Total Families | 627 (100.0%) | 2.88 |
Median Household Size in Windsor
The median household size in Windsor is 2.38 persons per household, with single female/mother households (288 | 32.7%) accounting for the largest median household size of 3.05 persons per household. non-family households (255 | 28.9%) represent the smallest median household size with 1.13 persons per household.
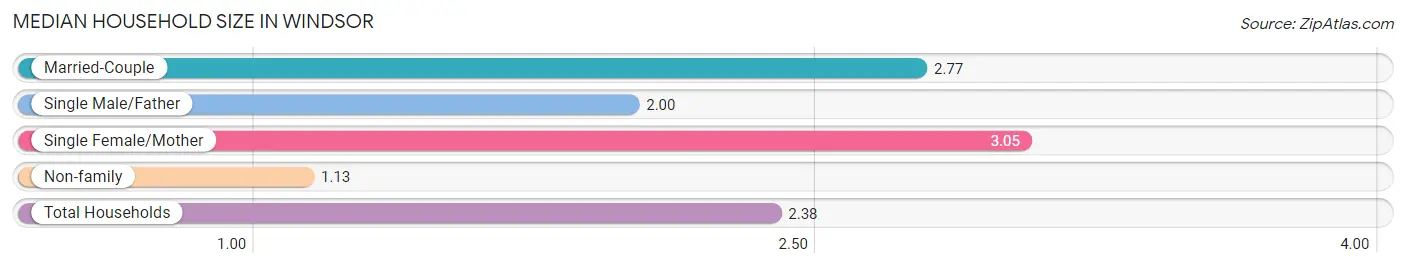
| Household Type | # Households | Household Size |
| Married-Couple | 335 (38.0%) | 2.77 |
| Single Male/Father | 4 (0.4%) | 2.00 |
| Single Female/Mother | 288 (32.7%) | 3.05 |
| Non-family | 255 (28.9%) | 1.13 |
| Total Households | 882 (100.0%) | 2.38 |
Household Size by Marriage Status in Windsor
Out of a total of 882 households in Windsor, 627 (71.1%) are family households, while 255 (28.9%) are nonfamily households. The most numerous type of family households are 2-person households, comprising 314, and the most common type of nonfamily households are 1-person households, comprising 230.
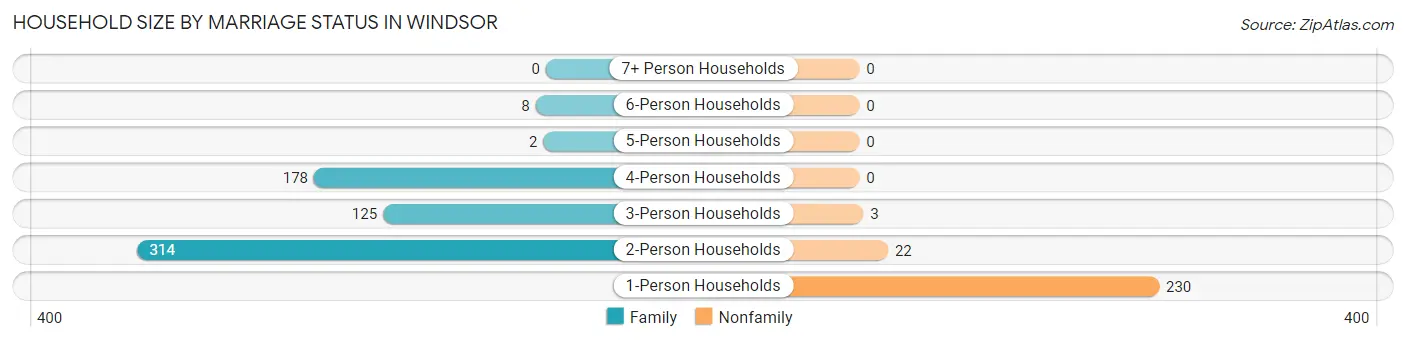
| Household Size | Family Households | Nonfamily Households |
| 1-Person Households | - | 230 (26.1%) |
| 2-Person Households | 314 (35.6%) | 22 (2.5%) |
| 3-Person Households | 125 (14.2%) | 3 (0.3%) |
| 4-Person Households | 178 (20.2%) | 0 (0.0%) |
| 5-Person Households | 2 (0.2%) | 0 (0.0%) |
| 6-Person Households | 8 (0.9%) | 0 (0.0%) |
| 7+ Person Households | 0 (0.0%) | 0 (0.0%) |
| Total | 627 (71.1%) | 255 (28.9%) |
Female Fertility in Windsor
Fertility by Age in Windsor
Average fertility rate in Windsor is 179.0 births per 1,000 women. Women in the age bracket of 20 to 34 years have the highest fertility rate with 258.0 births per 1,000 women. Women in the age bracket of 20 to 34 years acount for 69.9% of all women with births.
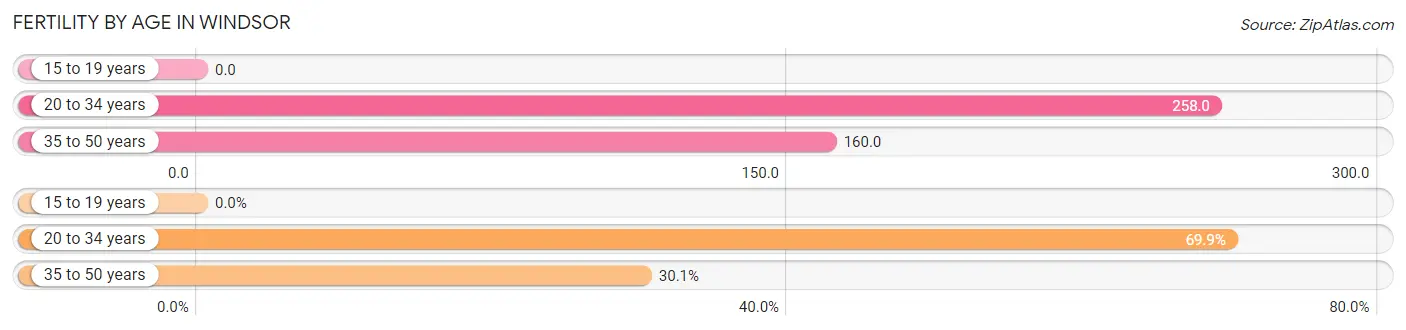
| Age Bracket | Women with Births | Births / 1,000 Women |
| 15 to 19 years | 0 (0.0%) | 0.0 |
| 20 to 34 years | 58 (69.9%) | 258.0 |
| 35 to 50 years | 25 (30.1%) | 160.0 |
| Total | 83 (100.0%) | 179.0 |
Fertility by Age by Marriage Status in Windsor
69.9% of women with births (83) in Windsor are married. The highest percentage of unmarried women with births falls into 35 to 50 years age bracket with 100.0% of them unmarried at the time of birth, while the lowest percentage of unmarried women with births belong to 20 to 34 years age bracket with 0.0% of them unmarried.
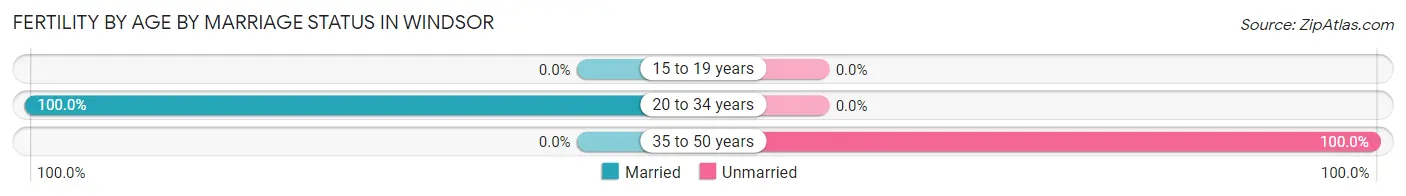
| Age Bracket | Married | Unmarried |
| 15 to 19 years | 0 (0.0%) | 0 (0.0%) |
| 20 to 34 years | 58 (100.0%) | 0 (0.0%) |
| 35 to 50 years | 0 (0.0%) | 25 (100.0%) |
| Total | 58 (69.9%) | 25 (30.1%) |
Fertility by Education in Windsor
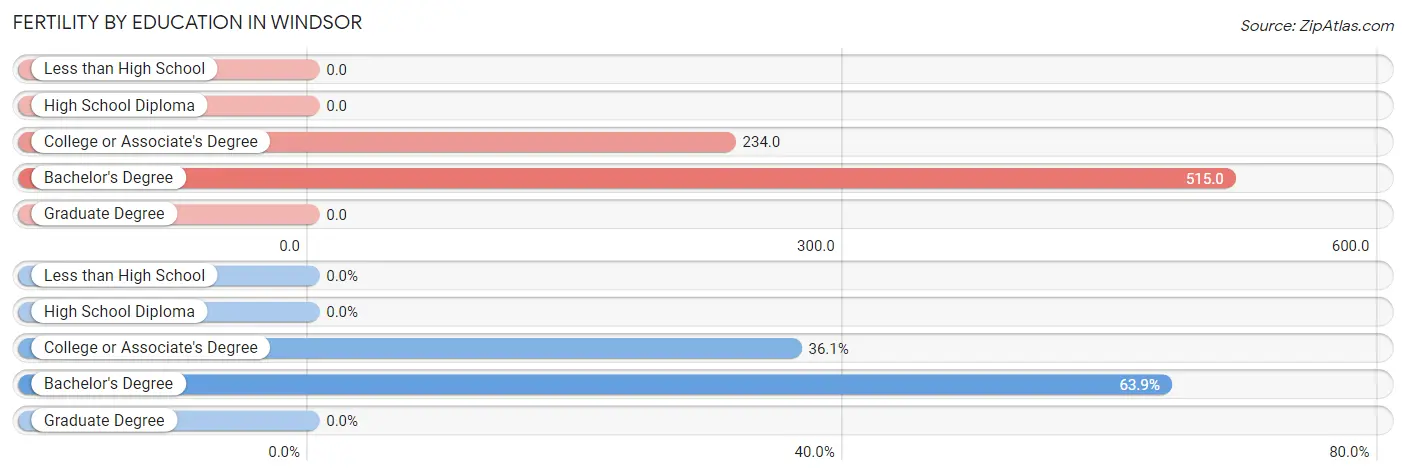
| Educational Attainment | Women with Births | Births / 1,000 Women |
| Less than High School | 0 (0.0%) | 0.0 |
| High School Diploma | 0 (0.0%) | 0.0 |
| College or Associate's Degree | 30 (36.1%) | 234.0 |
| Bachelor's Degree | 53 (63.9%) | 515.0 |
| Graduate Degree | 0 (0.0%) | 0.0 |
| Total | 83 (100.0%) | 179.0 |
Fertility by Education by Marriage Status in Windsor
30.1% of women with births in Windsor are unmarried. Women with the educational attainment of bachelor's degree are most likely to be married with 100.0% of them married at childbirth, while women with the educational attainment of college or associate's degree are least likely to be married with 83.3% of them unmarried at childbirth.
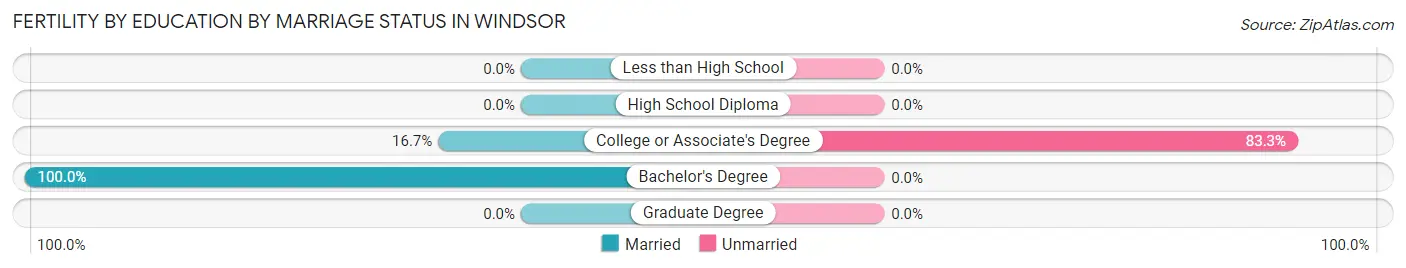
| Educational Attainment | Married | Unmarried |
| Less than High School | 0 (0.0%) | 0 (0.0%) |
| High School Diploma | 0 (0.0%) | 0 (0.0%) |
| College or Associate's Degree | 5 (16.7%) | 25 (83.3%) |
| Bachelor's Degree | 53 (100.0%) | 0 (0.0%) |
| Graduate Degree | 0 (0.0%) | 0 (0.0%) |
| Total | 58 (69.9%) | 25 (30.1%) |
Employment Characteristics in Windsor
Employment by Class of Employer in Windsor
Among the 695 employed individuals in Windsor, private company employees (329 | 47.3%), state government employees (140 | 20.1%), and local government employees (85 | 12.2%) make up the most common classes of employment.
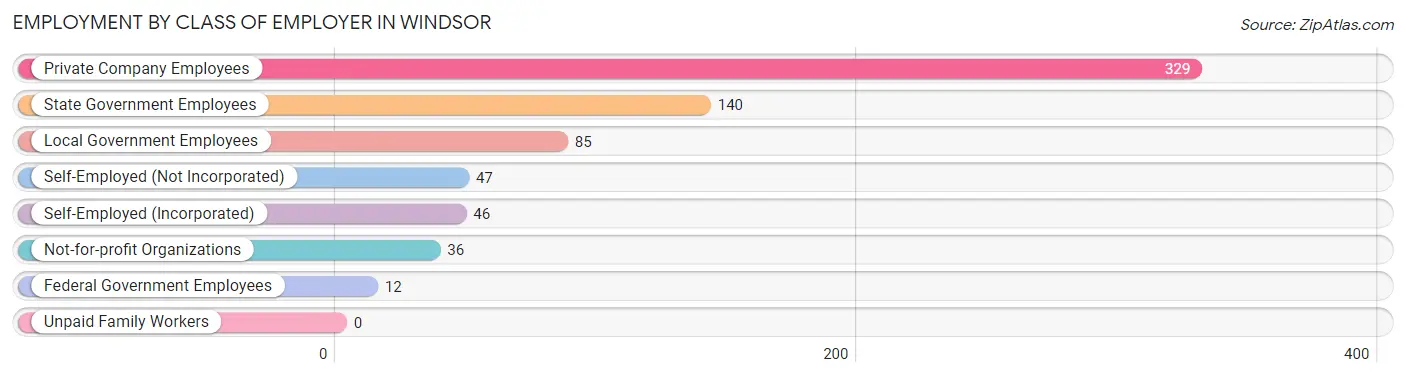
| Employer Class | # Employees | % Employees |
| Private Company Employees | 329 | 47.3% |
| Self-Employed (Incorporated) | 46 | 6.6% |
| Self-Employed (Not Incorporated) | 47 | 6.8% |
| Not-for-profit Organizations | 36 | 5.2% |
| Local Government Employees | 85 | 12.2% |
| State Government Employees | 140 | 20.1% |
| Federal Government Employees | 12 | 1.7% |
| Unpaid Family Workers | 0 | 0.0% |
| Total | 695 | 100.0% |
Employment Status by Age in Windsor
According to the labor force statistics for Windsor, out of the total population over 16 years of age (3,139), 22.7% or 713 individuals are in the labor force, with 2.5% or 18 of them unemployed. The age group with the highest labor force participation rate is 20 to 24 years, with 54.4% or 92 individuals in the labor force. Within the labor force, the 25 to 29 years age range has the highest percentage of unemployed individuals, with 28.1% or 18 of them being unemployed.
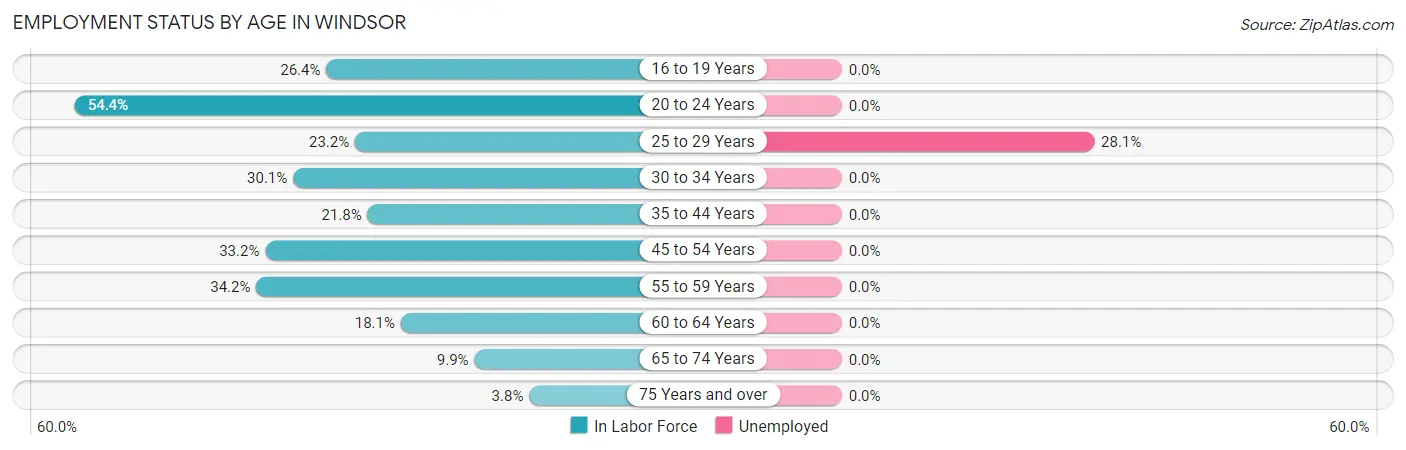
| Age Bracket | In Labor Force | Unemployed |
| 16 to 19 Years | 42 (26.4%) | 0 (0.0%) |
| 20 to 24 Years | 92 (54.4%) | 0 (0.0%) |
| 25 to 29 Years | 64 (23.2%) | 18 (28.1%) |
| 30 to 34 Years | 130 (30.1%) | 0 (0.0%) |
| 35 to 44 Years | 133 (21.8%) | 0 (0.0%) |
| 45 to 54 Years | 95 (33.2%) | 0 (0.0%) |
| 55 to 59 Years | 52 (34.2%) | 0 (0.0%) |
| 60 to 64 Years | 44 (18.1%) | 0 (0.0%) |
| 65 to 74 Years | 49 (9.9%) | 0 (0.0%) |
| 75 Years and over | 12 (3.8%) | 0 (0.0%) |
| Total | 713 (22.7%) | 18 (2.5%) |
Employment Status by Educational Attainment in Windsor
According to labor force statistics for Windsor, 25.9% of individuals (518) out of the total population between 25 and 64 years of age (1,999) are in the labor force, with 3.5% or 18 of them being unemployed. The group with the highest labor force participation rate are those with the educational attainment of bachelor's degree or higher, with 68.6% or 175 individuals in the labor force. Within the labor force, individuals with college / associate degree education have the highest percentage of unemployment, with 9.0% or 18 of them being unemployed.
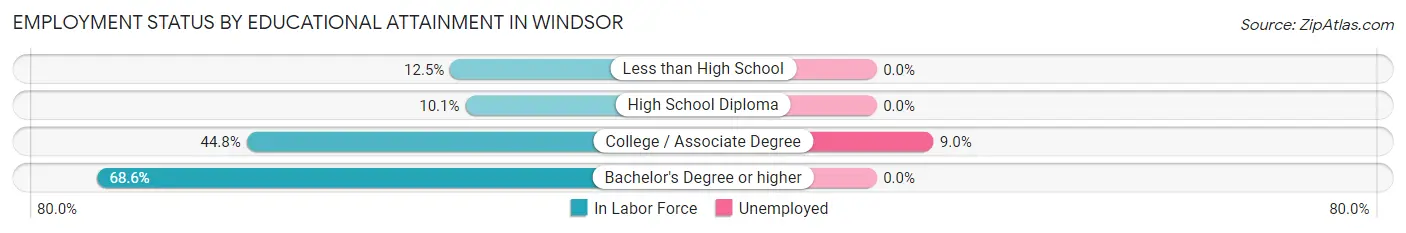
| Educational Attainment | In Labor Force | Unemployed |
| Less than High School | 63 (12.5%) | 0 (0.0%) |
| High School Diploma | 80 (10.1%) | 0 (0.0%) |
| College / Associate Degree | 200 (44.8%) | 40 (9.0%) |
| Bachelor's Degree or higher | 175 (68.6%) | 0 (0.0%) |
| Total | 518 (25.9%) | 70 (3.5%) |
Employment Occupations by Sex in Windsor
Management, Business, Science and Arts Occupations
The most common Management, Business, Science and Arts occupations in Windsor are Management (128 | 18.4%), Computers, Engineering & Science (58 | 8.4%), Life, Physical & Social Science (49 | 7.0%), Community & Social Service (49 | 7.0%), and Education Instruction & Library (35 | 5.0%).
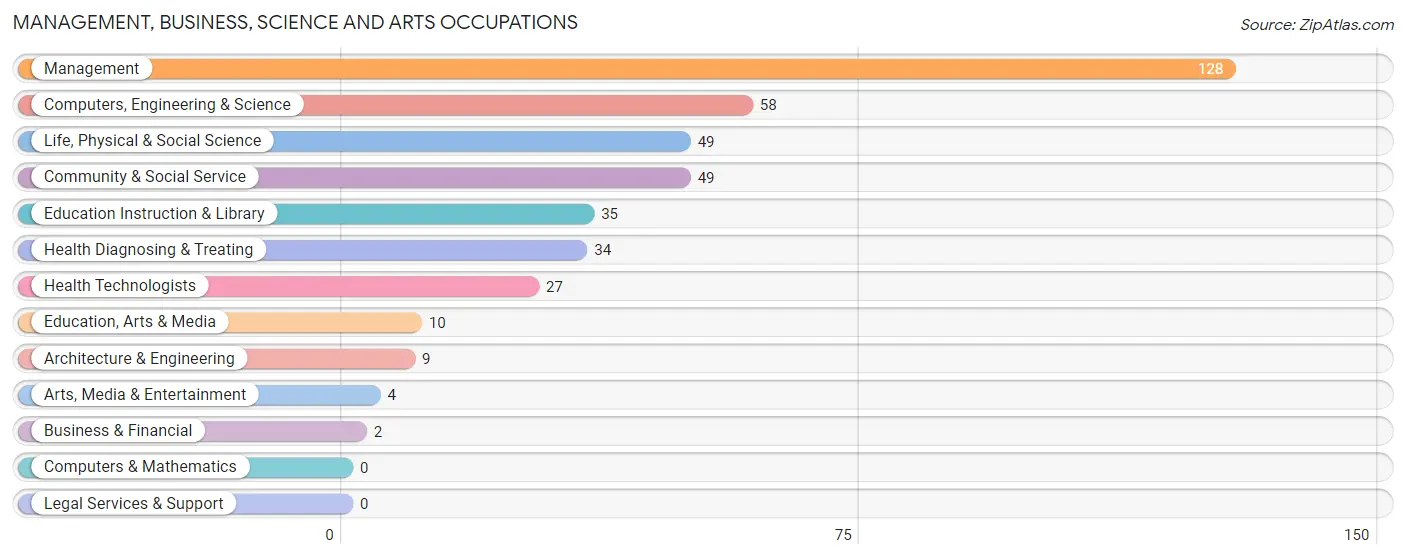
Management, Business, Science and Arts Occupations by Sex
Within the Management, Business, Science and Arts occupations in Windsor, the most male-oriented occupations are Business & Financial (100.0%), Computers, Engineering & Science (100.0%), and Architecture & Engineering (100.0%), while the most female-oriented occupations are Arts, Media & Entertainment (100.0%), Health Diagnosing & Treating (100.0%), and Health Technologists (100.0%).
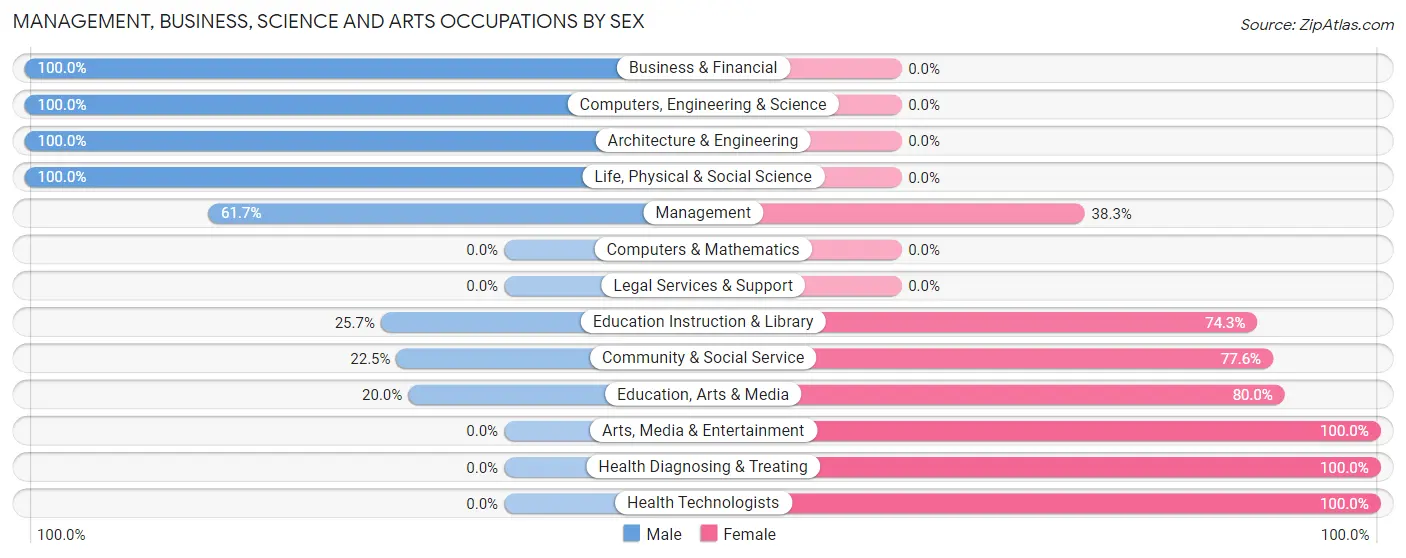
| Occupation | Male | Female |
| Management | 79 (61.7%) | 49 (38.3%) |
| Business & Financial | 2 (100.0%) | 0 (0.0%) |
| Computers, Engineering & Science | 58 (100.0%) | 0 (0.0%) |
| Computers & Mathematics | 0 (0.0%) | 0 (0.0%) |
| Architecture & Engineering | 9 (100.0%) | 0 (0.0%) |
| Life, Physical & Social Science | 49 (100.0%) | 0 (0.0%) |
| Community & Social Service | 11 (22.5%) | 38 (77.5%) |
| Education, Arts & Media | 2 (20.0%) | 8 (80.0%) |
| Legal Services & Support | 0 (0.0%) | 0 (0.0%) |
| Education Instruction & Library | 9 (25.7%) | 26 (74.3%) |
| Arts, Media & Entertainment | 0 (0.0%) | 4 (100.0%) |
| Health Diagnosing & Treating | 0 (0.0%) | 34 (100.0%) |
| Health Technologists | 0 (0.0%) | 27 (100.0%) |
| Total (Category) | 150 (55.3%) | 121 (44.7%) |
| Total (Overall) | 252 (36.3%) | 443 (63.7%) |
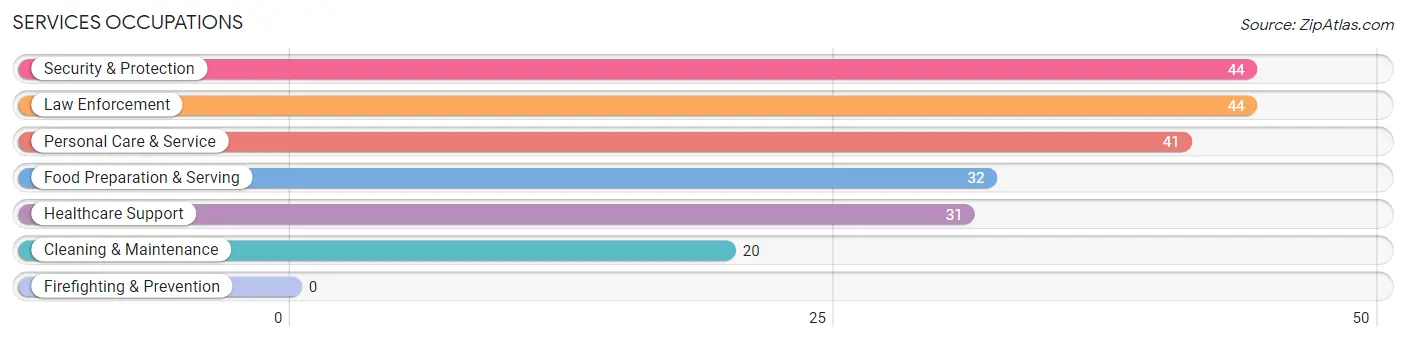
Services Occupations
The most common Services occupations in Windsor are Security & Protection (44 | 6.3%), Law Enforcement (44 | 6.3%), Personal Care & Service (41 | 5.9%), Food Preparation & Serving (32 | 4.6%), and Healthcare Support (31 | 4.5%).
Services Occupations by Sex
Within the Services occupations in Windsor, the most male-oriented occupations are Personal Care & Service (87.8%), and Healthcare Support (29.0%), while the most female-oriented occupations are Security & Protection (100.0%), Law Enforcement (100.0%), and Food Preparation & Serving (100.0%).
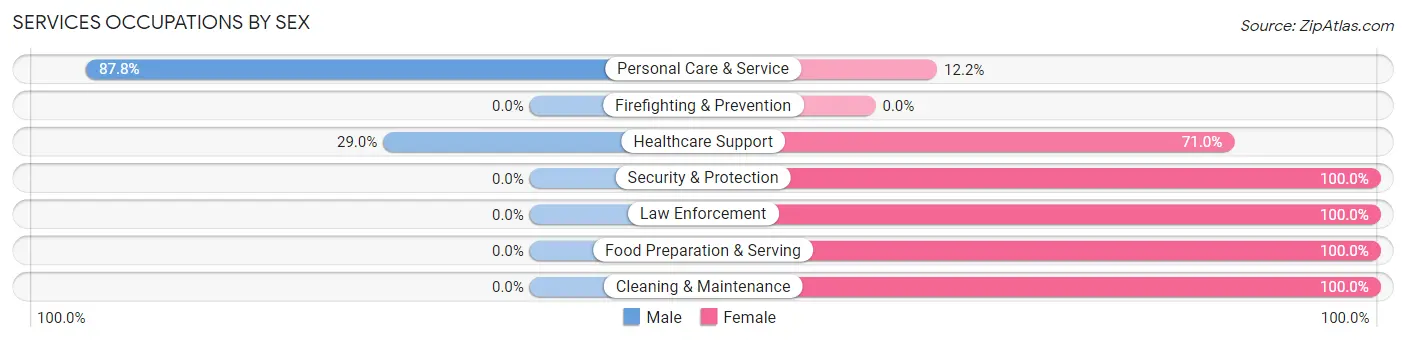
| Occupation | Male | Female |
| Healthcare Support | 9 (29.0%) | 22 (71.0%) |
| Security & Protection | 0 (0.0%) | 44 (100.0%) |
| Firefighting & Prevention | 0 (0.0%) | 0 (0.0%) |
| Law Enforcement | 0 (0.0%) | 44 (100.0%) |
| Food Preparation & Serving | 0 (0.0%) | 32 (100.0%) |
| Cleaning & Maintenance | 0 (0.0%) | 20 (100.0%) |
| Personal Care & Service | 36 (87.8%) | 5 (12.2%) |
| Total (Category) | 45 (26.8%) | 123 (73.2%) |
| Total (Overall) | 252 (36.3%) | 443 (63.7%) |
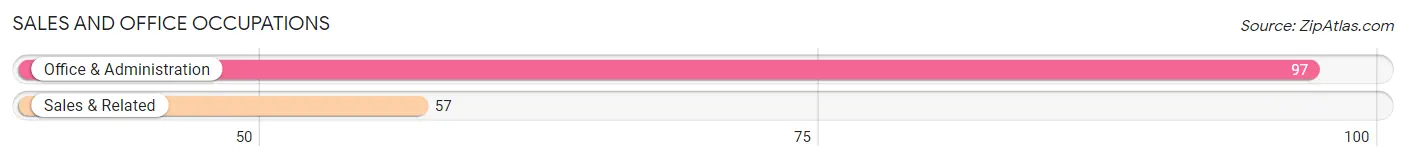
Sales and Office Occupations
The most common Sales and Office occupations in Windsor are Office & Administration (97 | 14.0%), and Sales & Related (57 | 8.2%).
Sales and Office Occupations by Sex
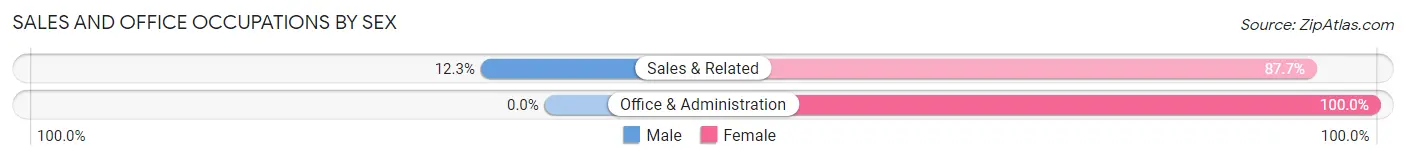
| Occupation | Male | Female |
| Sales & Related | 7 (12.3%) | 50 (87.7%) |
| Office & Administration | 0 (0.0%) | 97 (100.0%) |
| Total (Category) | 7 (4.5%) | 147 (95.5%) |
| Total (Overall) | 252 (36.3%) | 443 (63.7%) |
Natural Resources, Construction and Maintenance Occupations
The most common Natural Resources, Construction and Maintenance occupations in Windsor are Construction & Extraction (6 | 0.9%), and Installation, Maintenance & Repair (5 | 0.7%).
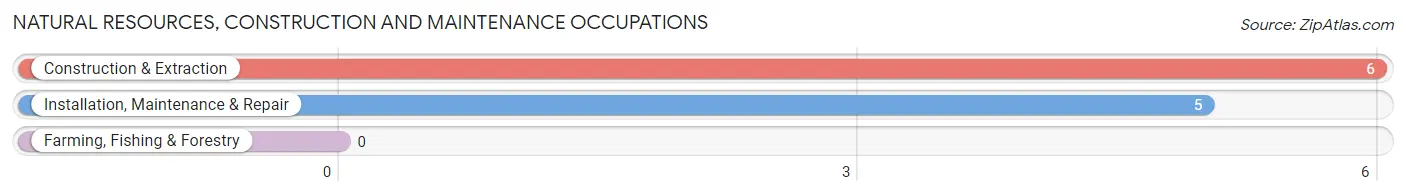
Natural Resources, Construction and Maintenance Occupations by Sex
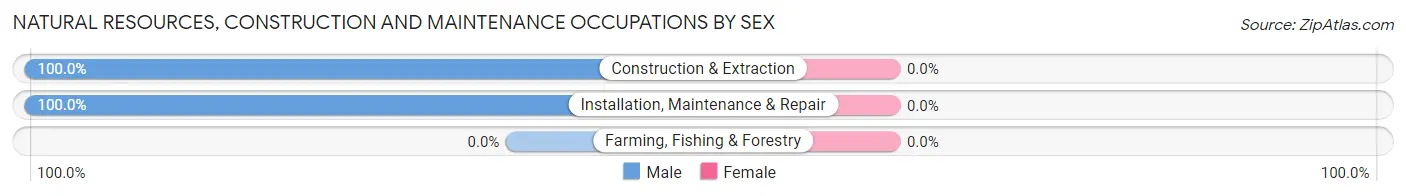
| Occupation | Male | Female |
| Farming, Fishing & Forestry | 0 (0.0%) | 0 (0.0%) |
| Construction & Extraction | 6 (100.0%) | 0 (0.0%) |
| Installation, Maintenance & Repair | 5 (100.0%) | 0 (0.0%) |
| Total (Category) | 11 (100.0%) | 0 (0.0%) |
| Total (Overall) | 252 (36.3%) | 443 (63.7%) |
Production, Transportation and Moving Occupations
The most common Production, Transportation and Moving occupations in Windsor are Production (83 | 11.9%), Transportation (7 | 1.0%), and Material Moving (1 | 0.1%).
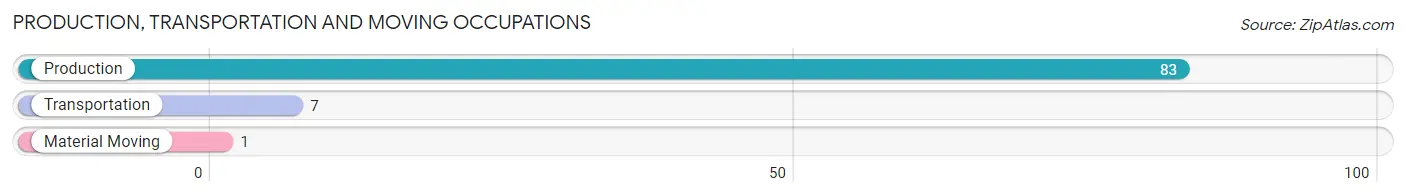
Production, Transportation and Moving Occupations by Sex
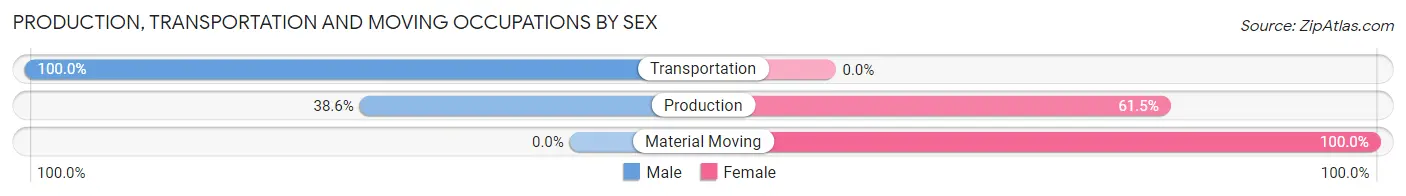
| Occupation | Male | Female |
| Production | 32 (38.6%) | 51 (61.5%) |
| Transportation | 7 (100.0%) | 0 (0.0%) |
| Material Moving | 0 (0.0%) | 1 (100.0%) |
| Total (Category) | 39 (42.9%) | 52 (57.1%) |
| Total (Overall) | 252 (36.3%) | 443 (63.7%) |
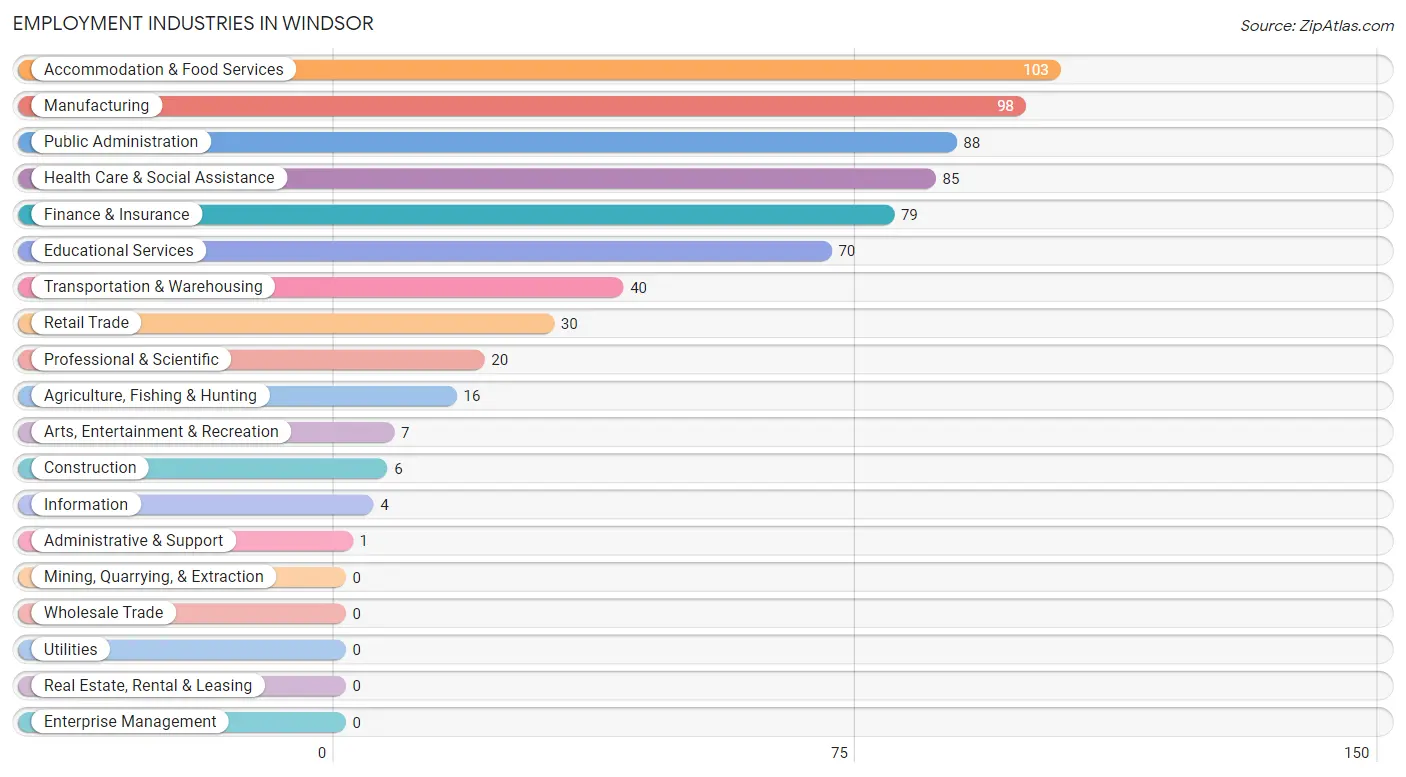
Employment Industries by Sex in Windsor
Employment Industries in Windsor
The major employment industries in Windsor include Accommodation & Food Services (103 | 14.8%), Manufacturing (98 | 14.1%), Public Administration (88 | 12.7%), Health Care & Social Assistance (85 | 12.2%), and Finance & Insurance (79 | 11.4%).
Employment Industries by Sex in Windsor
The Windsor industries that see more men than women are Agriculture, Fishing & Hunting (100.0%), Construction (100.0%), and Administrative & Support (100.0%), whereas the industries that tend to have a higher number of women are Information (100.0%), Educational Services (100.0%), and Public Administration (92.0%).
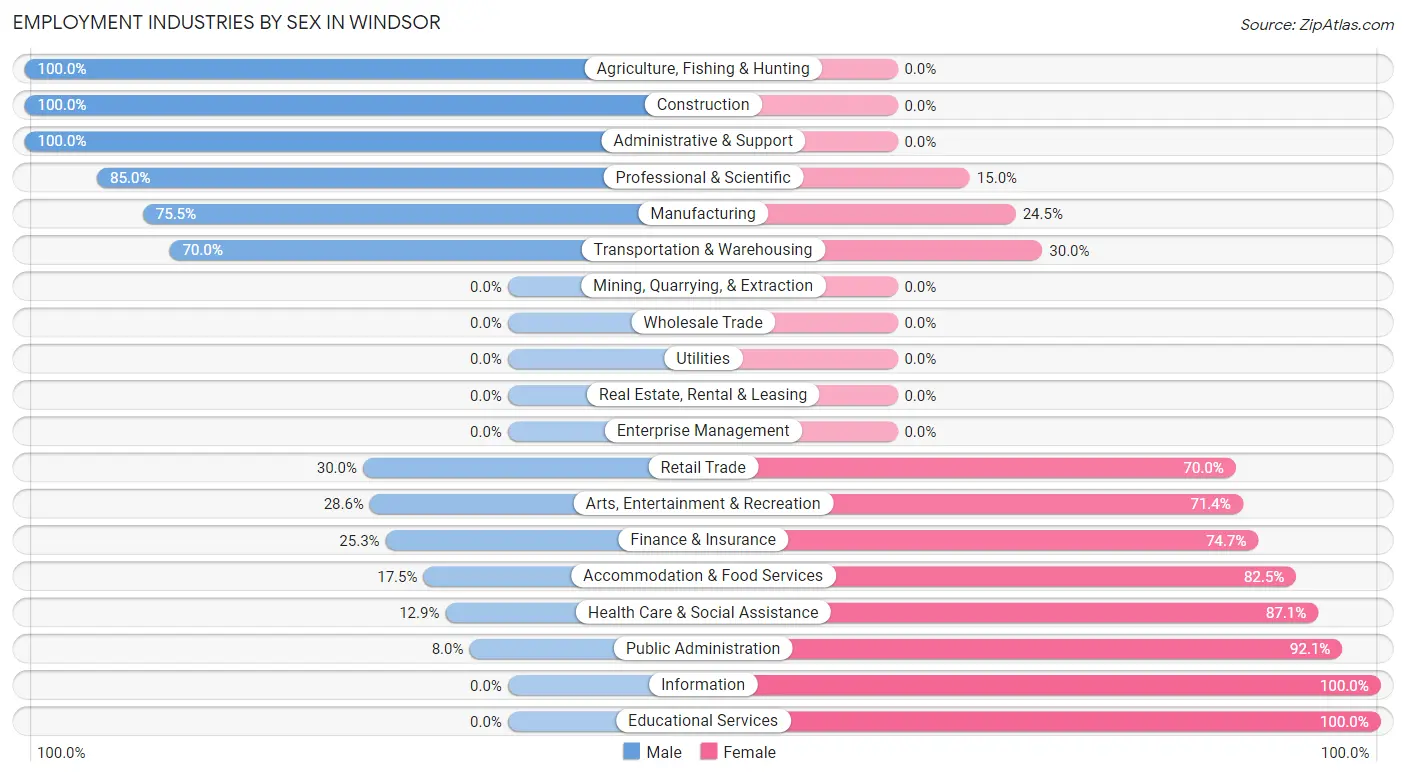
| Industry | Male | Female |
| Agriculture, Fishing & Hunting | 16 (100.0%) | 0 (0.0%) |
| Mining, Quarrying, & Extraction | 0 (0.0%) | 0 (0.0%) |
| Construction | 6 (100.0%) | 0 (0.0%) |
| Manufacturing | 74 (75.5%) | 24 (24.5%) |
| Wholesale Trade | 0 (0.0%) | 0 (0.0%) |
| Retail Trade | 9 (30.0%) | 21 (70.0%) |
| Transportation & Warehousing | 28 (70.0%) | 12 (30.0%) |
| Utilities | 0 (0.0%) | 0 (0.0%) |
| Information | 0 (0.0%) | 4 (100.0%) |
| Finance & Insurance | 20 (25.3%) | 59 (74.7%) |
| Real Estate, Rental & Leasing | 0 (0.0%) | 0 (0.0%) |
| Professional & Scientific | 17 (85.0%) | 3 (15.0%) |
| Enterprise Management | 0 (0.0%) | 0 (0.0%) |
| Administrative & Support | 1 (100.0%) | 0 (0.0%) |
| Educational Services | 0 (0.0%) | 70 (100.0%) |
| Health Care & Social Assistance | 11 (12.9%) | 74 (87.1%) |
| Arts, Entertainment & Recreation | 2 (28.6%) | 5 (71.4%) |
| Accommodation & Food Services | 18 (17.5%) | 85 (82.5%) |
| Public Administration | 7 (8.0%) | 81 (92.0%) |
| Total | 252 (36.3%) | 443 (63.7%) |
Education in Windsor
School Enrollment in Windsor
The most common levels of schooling among the 437 students in Windsor are high school (161 | 36.8%), elementary school (105 | 24.0%), and middle school (83 | 19.0%).
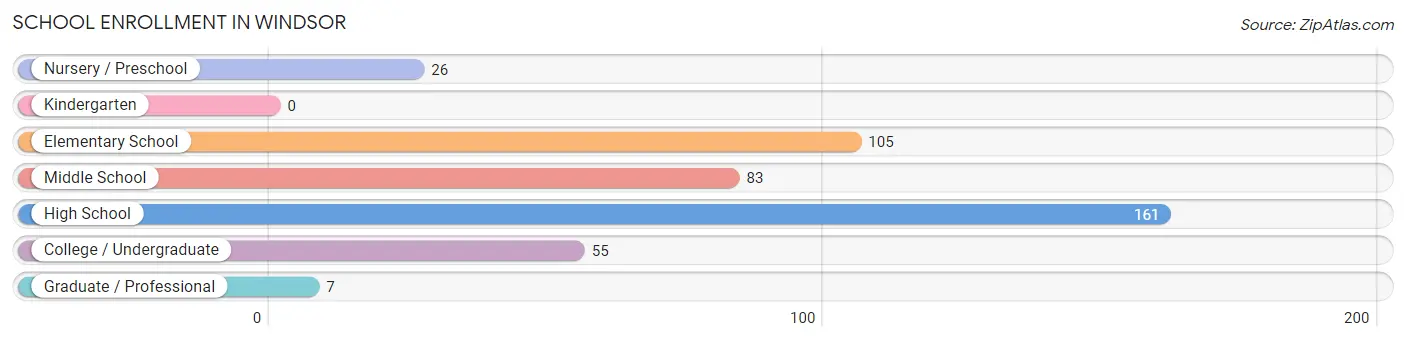
| School Level | # Students | % Students |
| Nursery / Preschool | 26 | 5.9% |
| Kindergarten | 0 | 0.0% |
| Elementary School | 105 | 24.0% |
| Middle School | 83 | 19.0% |
| High School | 161 | 36.8% |
| College / Undergraduate | 55 | 12.6% |
| Graduate / Professional | 7 | 1.6% |
| Total | 437 | 100.0% |
School Enrollment by Age by Funding Source in Windsor
Out of a total of 437 students who are enrolled in schools in Windsor, 78 (17.8%) attend a private institution, while the remaining 359 (82.2%) are enrolled in public schools. The age group of 25 to 34 year olds has the highest likelihood of being enrolled in private schools, with 8 (53.3% in the age bracket) enrolled. Conversely, the age group of 20 to 24 year olds has the lowest likelihood of being enrolled in a private school, with 10 (100.0% in the age bracket) attending a public institution.
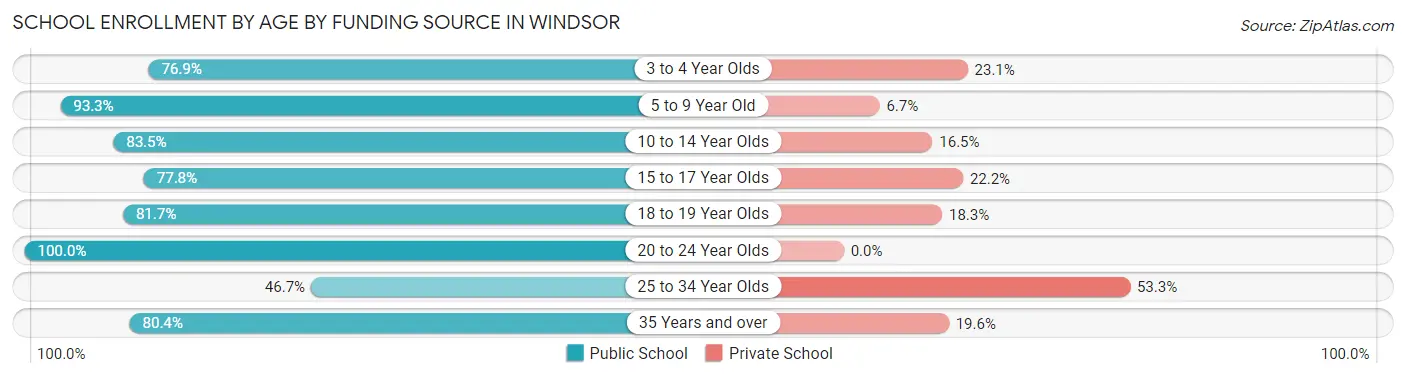
| Age Bracket | Public School | Private School |
| 3 to 4 Year Olds | 20 (76.9%) | 6 (23.1%) |
| 5 to 9 Year Old | 70 (93.3%) | 5 (6.7%) |
| 10 to 14 Year Olds | 96 (83.5%) | 19 (16.5%) |
| 15 to 17 Year Olds | 70 (77.8%) | 20 (22.2%) |
| 18 to 19 Year Olds | 49 (81.7%) | 11 (18.3%) |
| 20 to 24 Year Olds | 10 (100.0%) | 0 (0.0%) |
| 25 to 34 Year Olds | 7 (46.7%) | 8 (53.3%) |
| 35 Years and over | 37 (80.4%) | 9 (19.6%) |
| Total | 359 (82.2%) | 78 (17.8%) |
Educational Attainment by Field of Study in Windsor
Education (146 | 27.5%), business (119 | 22.4%), arts & humanities (81 | 15.2%), bio, nature & agricultural (45 | 8.5%), and science & technology (42 | 7.9%) are the most common fields of study among 531 individuals in Windsor who have obtained a bachelor's degree or higher.
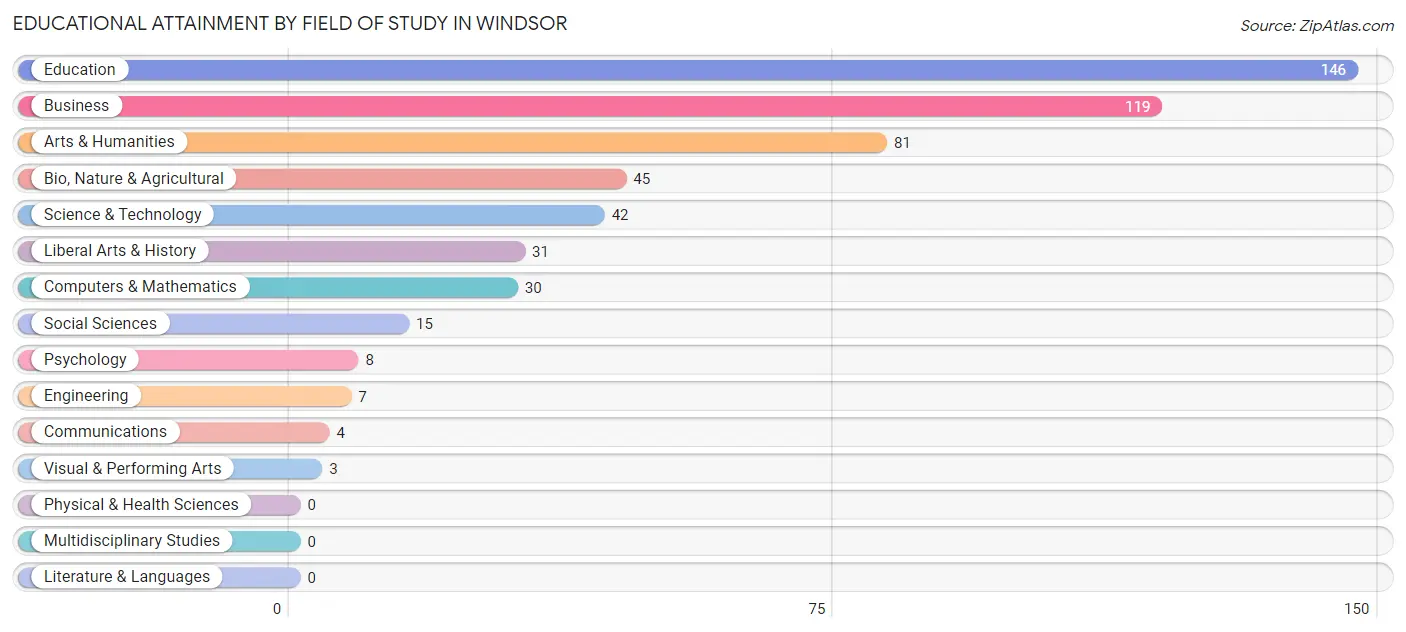
| Field of Study | # Graduates | % Graduates |
| Computers & Mathematics | 30 | 5.7% |
| Bio, Nature & Agricultural | 45 | 8.5% |
| Physical & Health Sciences | 0 | 0.0% |
| Psychology | 8 | 1.5% |
| Social Sciences | 15 | 2.8% |
| Engineering | 7 | 1.3% |
| Multidisciplinary Studies | 0 | 0.0% |
| Science & Technology | 42 | 7.9% |
| Business | 119 | 22.4% |
| Education | 146 | 27.5% |
| Literature & Languages | 0 | 0.0% |
| Liberal Arts & History | 31 | 5.8% |
| Visual & Performing Arts | 3 | 0.6% |
| Communications | 4 | 0.7% |
| Arts & Humanities | 81 | 15.2% |
| Total | 531 | 100.0% |
Transportation & Commute in Windsor
Vehicle Availability by Sex in Windsor
The most prevalent vehicle ownership categories in Windsor are males with 2 vehicles (140, accounting for 55.6%) and females with 2 vehicles (171, making up 31.6%).
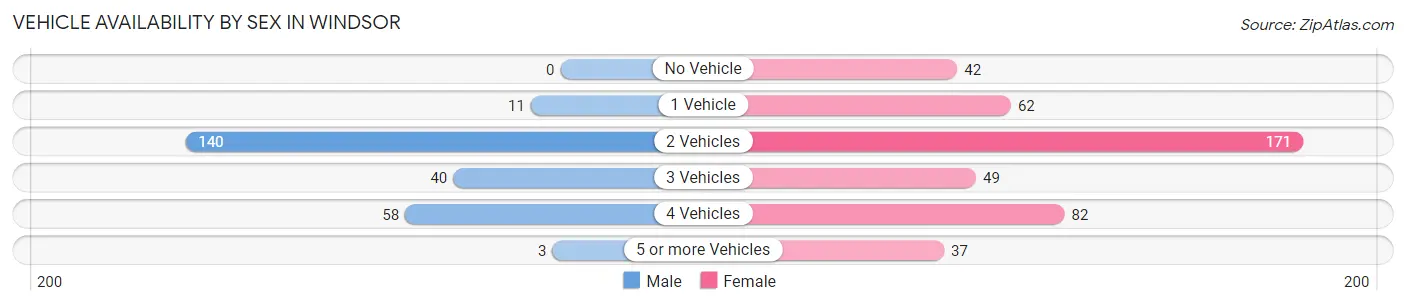
| Vehicles Available | Male | Female |
| No Vehicle | 0 (0.0%) | 42 (9.5%) |
| 1 Vehicle | 11 (4.4%) | 62 (14.0%) |
| 2 Vehicles | 140 (55.6%) | 171 (38.6%) |
| 3 Vehicles | 40 (15.9%) | 49 (11.1%) |
| 4 Vehicles | 58 (23.0%) | 82 (18.5%) |
| 5 or more Vehicles | 3 (1.2%) | 37 (8.4%) |
| Total | 252 (100.0%) | 443 (100.0%) |
Commute Time in Windsor
The most frequently occuring commute durations in Windsor are 5 to 9 minutes (227 commuters, 34.9%), 30 to 34 minutes (95 commuters, 14.6%), and 10 to 14 minutes (94 commuters, 14.4%).
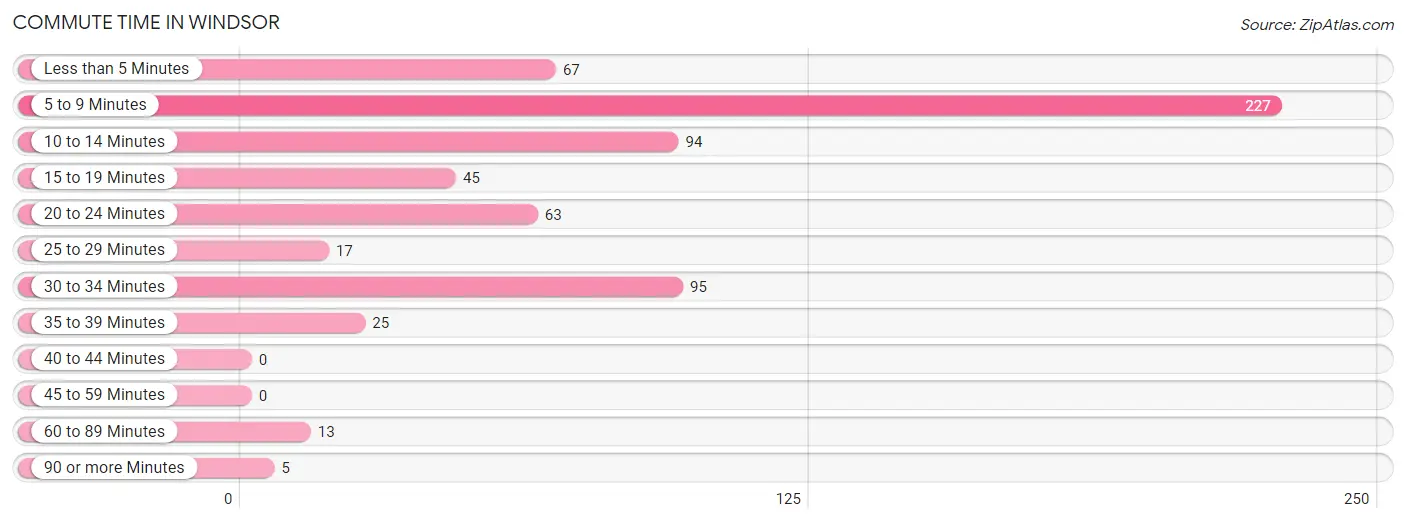
| Commute Time | # Commuters | % Commuters |
| Less than 5 Minutes | 67 | 10.3% |
| 5 to 9 Minutes | 227 | 34.9% |
| 10 to 14 Minutes | 94 | 14.4% |
| 15 to 19 Minutes | 45 | 6.9% |
| 20 to 24 Minutes | 63 | 9.7% |
| 25 to 29 Minutes | 17 | 2.6% |
| 30 to 34 Minutes | 95 | 14.6% |
| 35 to 39 Minutes | 25 | 3.8% |
| 40 to 44 Minutes | 0 | 0.0% |
| 45 to 59 Minutes | 0 | 0.0% |
| 60 to 89 Minutes | 13 | 2.0% |
| 90 or more Minutes | 5 | 0.8% |
Commute Time by Sex in Windsor
The most common commute times in Windsor are 30 to 34 minutes (85 commuters, 36.5%) for males and 5 to 9 minutes (162 commuters, 38.8%) for females.
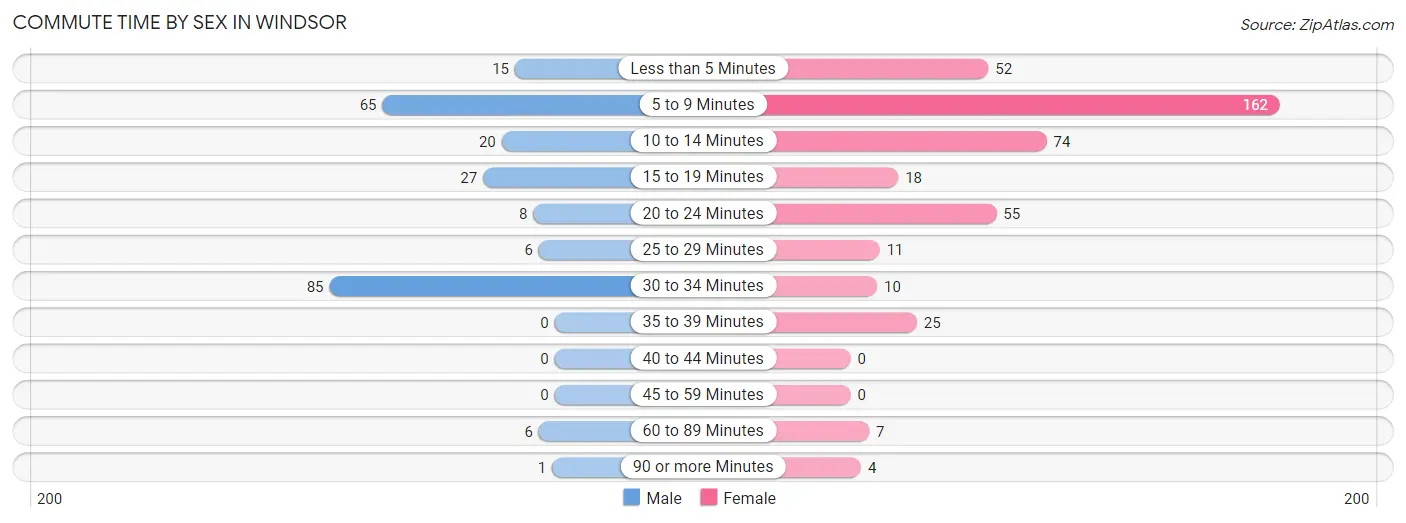
| Commute Time | Male | Female |
| Less than 5 Minutes | 15 (6.4%) | 52 (12.4%) |
| 5 to 9 Minutes | 65 (27.9%) | 162 (38.8%) |
| 10 to 14 Minutes | 20 (8.6%) | 74 (17.7%) |
| 15 to 19 Minutes | 27 (11.6%) | 18 (4.3%) |
| 20 to 24 Minutes | 8 (3.4%) | 55 (13.2%) |
| 25 to 29 Minutes | 6 (2.6%) | 11 (2.6%) |
| 30 to 34 Minutes | 85 (36.5%) | 10 (2.4%) |
| 35 to 39 Minutes | 0 (0.0%) | 25 (6.0%) |
| 40 to 44 Minutes | 0 (0.0%) | 0 (0.0%) |
| 45 to 59 Minutes | 0 (0.0%) | 0 (0.0%) |
| 60 to 89 Minutes | 6 (2.6%) | 7 (1.7%) |
| 90 or more Minutes | 1 (0.4%) | 4 (1.0%) |
Time of Departure to Work by Sex in Windsor
The most frequent times of departure to work in Windsor are 6:00 AM to 6:29 AM (85, 36.5%) for males and 8:00 AM to 8:29 AM (129, 30.9%) for females.
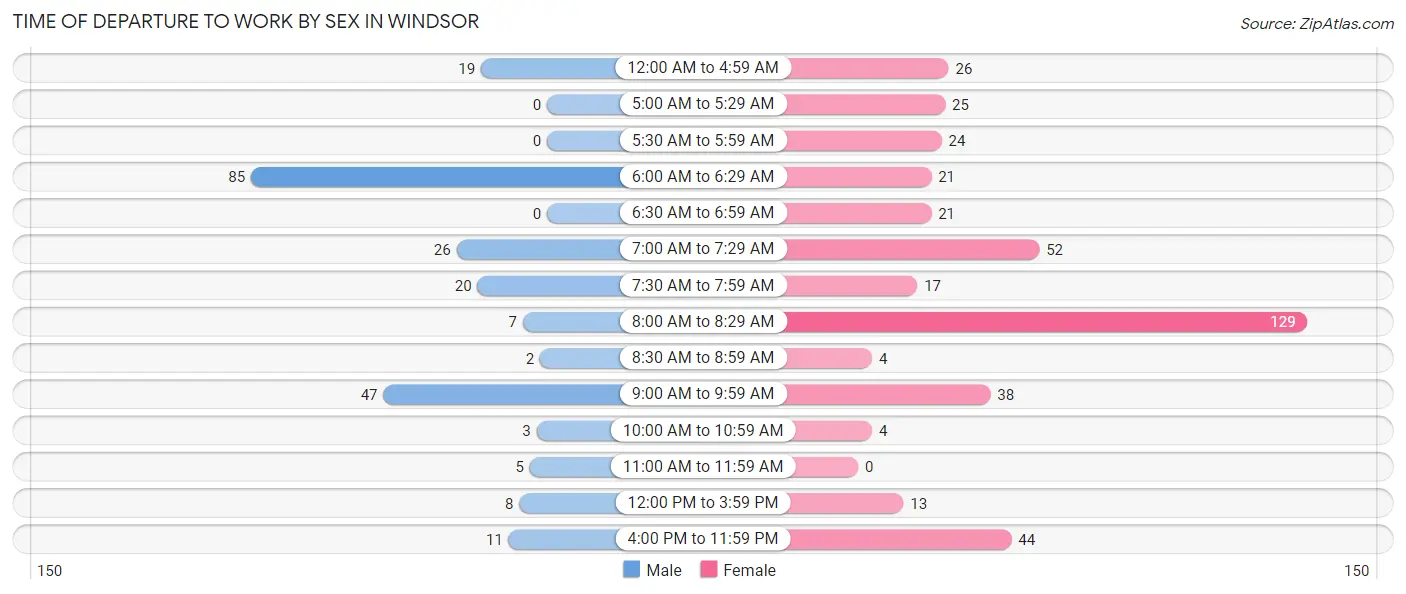
| Time of Departure | Male | Female |
| 12:00 AM to 4:59 AM | 19 (8.2%) | 26 (6.2%) |
| 5:00 AM to 5:29 AM | 0 (0.0%) | 25 (6.0%) |
| 5:30 AM to 5:59 AM | 0 (0.0%) | 24 (5.7%) |
| 6:00 AM to 6:29 AM | 85 (36.5%) | 21 (5.0%) |
| 6:30 AM to 6:59 AM | 0 (0.0%) | 21 (5.0%) |
| 7:00 AM to 7:29 AM | 26 (11.2%) | 52 (12.4%) |
| 7:30 AM to 7:59 AM | 20 (8.6%) | 17 (4.1%) |
| 8:00 AM to 8:29 AM | 7 (3.0%) | 129 (30.9%) |
| 8:30 AM to 8:59 AM | 2 (0.9%) | 4 (1.0%) |
| 9:00 AM to 9:59 AM | 47 (20.2%) | 38 (9.1%) |
| 10:00 AM to 10:59 AM | 3 (1.3%) | 4 (1.0%) |
| 11:00 AM to 11:59 AM | 5 (2.1%) | 0 (0.0%) |
| 12:00 PM to 3:59 PM | 8 (3.4%) | 13 (3.1%) |
| 4:00 PM to 11:59 PM | 11 (4.7%) | 44 (10.5%) |
| Total | 233 (100.0%) | 418 (100.0%) |
Housing Occupancy in Windsor
Occupancy by Ownership in Windsor
Of the total 882 dwellings in Windsor, owner-occupied units account for 565 (64.1%), while renter-occupied units make up 317 (35.9%).
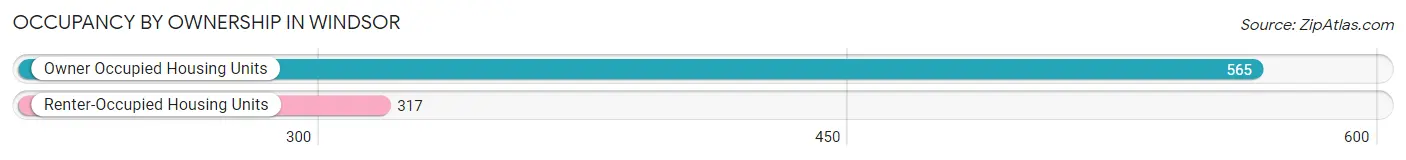
| Occupancy | # Housing Units | % Housing Units |
| Owner Occupied Housing Units | 565 | 64.1% |
| Renter-Occupied Housing Units | 317 | 35.9% |
| Total Occupied Housing Units | 882 | 100.0% |
Occupancy by Household Size in Windsor
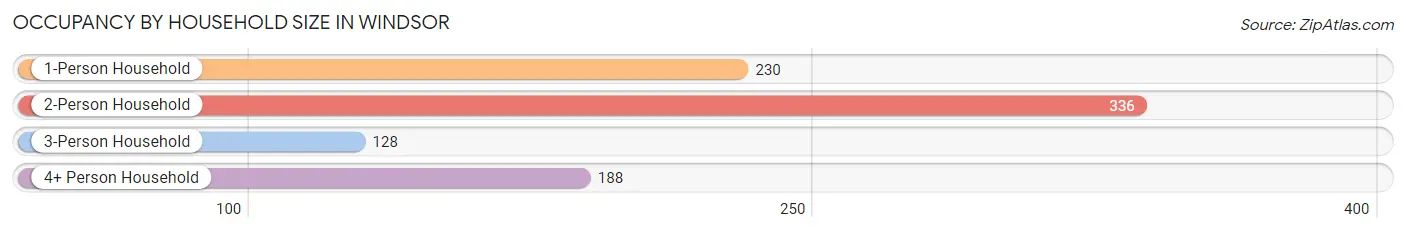
| Household Size | # Housing Units | % Housing Units |
| 1-Person Household | 230 | 26.1% |
| 2-Person Household | 336 | 38.1% |
| 3-Person Household | 128 | 14.5% |
| 4+ Person Household | 188 | 21.3% |
| Total Housing Units | 882 | 100.0% |
Occupancy by Ownership by Household Size in Windsor
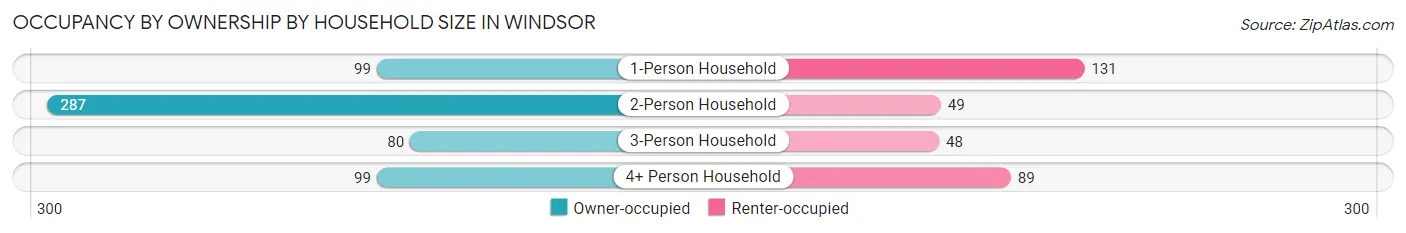
| Household Size | Owner-occupied | Renter-occupied |
| 1-Person Household | 99 (43.0%) | 131 (57.0%) |
| 2-Person Household | 287 (85.4%) | 49 (14.6%) |
| 3-Person Household | 80 (62.5%) | 48 (37.5%) |
| 4+ Person Household | 99 (52.7%) | 89 (47.3%) |
| Total Housing Units | 565 (64.1%) | 317 (35.9%) |
Occupancy by Educational Attainment in Windsor
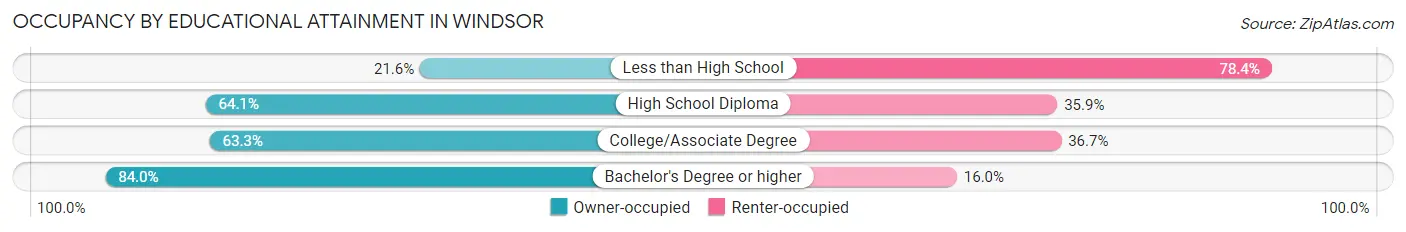
| Household Size | Owner-occupied | Renter-occupied |
| Less than High School | 27 (21.6%) | 98 (78.4%) |
| High School Diploma | 150 (64.1%) | 84 (35.9%) |
| College/Associate Degree | 157 (63.3%) | 91 (36.7%) |
| Bachelor's Degree or higher | 231 (84.0%) | 44 (16.0%) |
Occupancy by Age of Householder in Windsor
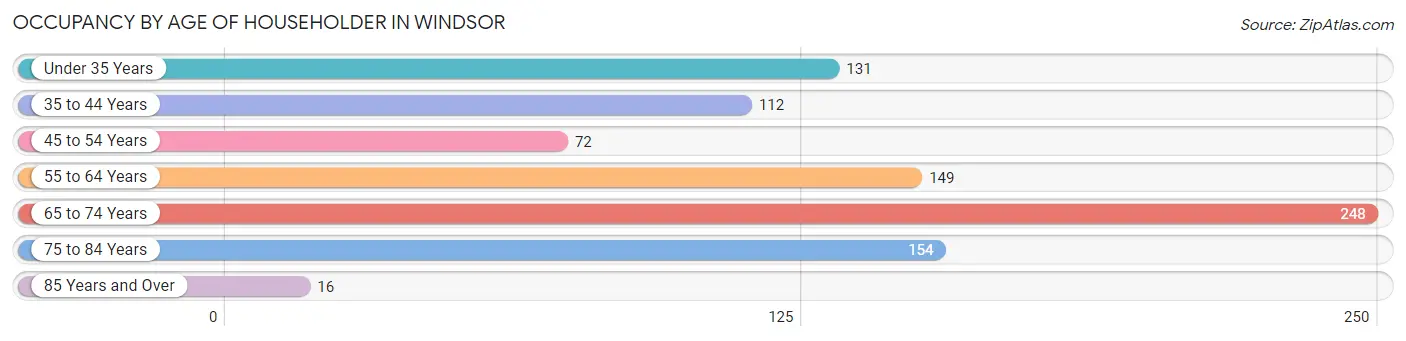
| Age Bracket | # Households | % Households |
| Under 35 Years | 131 | 14.8% |
| 35 to 44 Years | 112 | 12.7% |
| 45 to 54 Years | 72 | 8.2% |
| 55 to 64 Years | 149 | 16.9% |
| 65 to 74 Years | 248 | 28.1% |
| 75 to 84 Years | 154 | 17.5% |
| 85 Years and Over | 16 | 1.8% |
| Total | 882 | 100.0% |
Housing Finances in Windsor
Median Income by Occupancy in Windsor
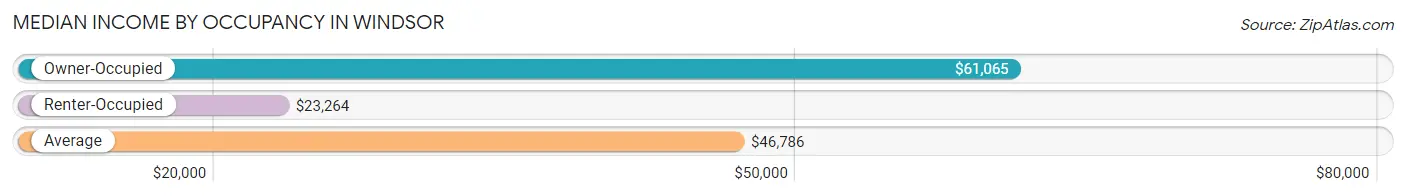
| Occupancy Type | # Households | Median Income |
| Owner-Occupied | 565 (64.1%) | $61,065 |
| Renter-Occupied | 317 (35.9%) | $23,264 |
| Average | 882 (100.0%) | $46,786 |
Occupancy by Householder Income Bracket in Windsor
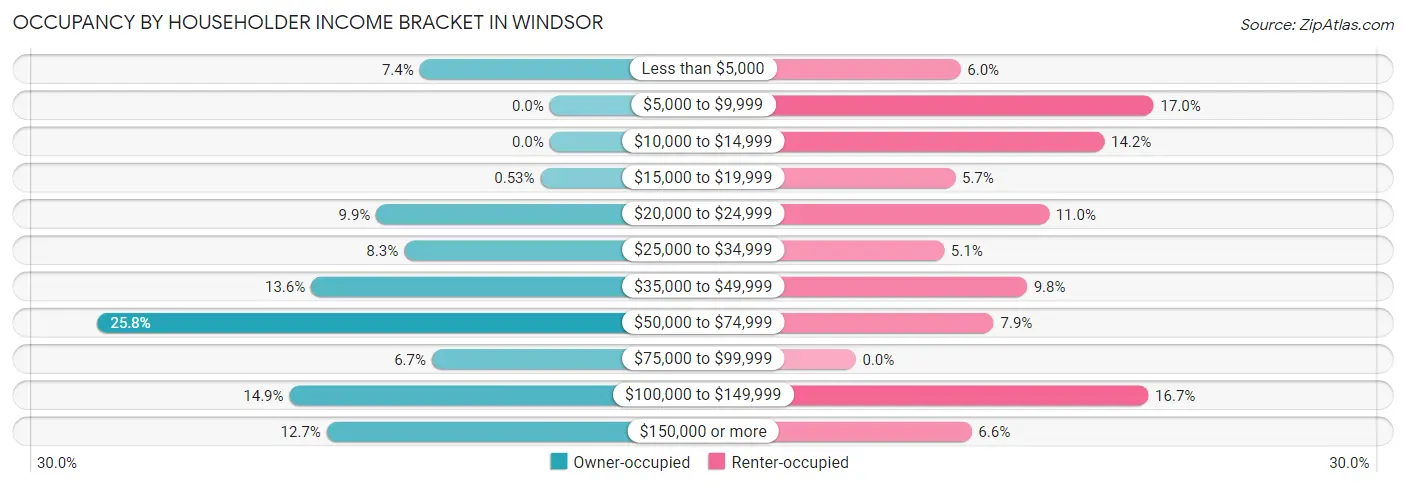
| Income Bracket | Owner-occupied | Renter-occupied |
| Less than $5,000 | 42 (7.4%) | 19 (6.0%) |
| $5,000 to $9,999 | 0 (0.0%) | 54 (17.0%) |
| $10,000 to $14,999 | 0 (0.0%) | 45 (14.2%) |
| $15,000 to $19,999 | 3 (0.5%) | 18 (5.7%) |
| $20,000 to $24,999 | 56 (9.9%) | 35 (11.0%) |
| $25,000 to $34,999 | 47 (8.3%) | 16 (5.1%) |
| $35,000 to $49,999 | 77 (13.6%) | 31 (9.8%) |
| $50,000 to $74,999 | 146 (25.8%) | 25 (7.9%) |
| $75,000 to $99,999 | 38 (6.7%) | 0 (0.0%) |
| $100,000 to $149,999 | 84 (14.9%) | 53 (16.7%) |
| $150,000 or more | 72 (12.7%) | 21 (6.6%) |
| Total | 565 (100.0%) | 317 (100.0%) |
Monthly Housing Cost Tiers in Windsor
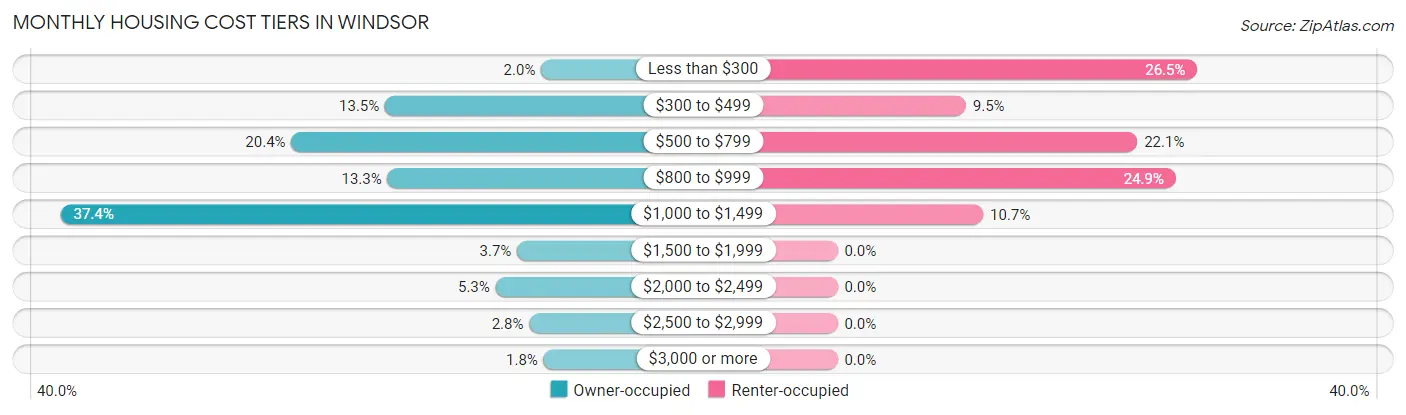
| Monthly Cost | Owner-occupied | Renter-occupied |
| Less than $300 | 11 (1.9%) | 84 (26.5%) |
| $300 to $499 | 76 (13.5%) | 30 (9.5%) |
| $500 to $799 | 115 (20.3%) | 70 (22.1%) |
| $800 to $999 | 75 (13.3%) | 79 (24.9%) |
| $1,000 to $1,499 | 211 (37.3%) | 34 (10.7%) |
| $1,500 to $1,999 | 21 (3.7%) | 0 (0.0%) |
| $2,000 to $2,499 | 30 (5.3%) | 0 (0.0%) |
| $2,500 to $2,999 | 16 (2.8%) | 0 (0.0%) |
| $3,000 or more | 10 (1.8%) | 0 (0.0%) |
| Total | 565 (100.0%) | 317 (100.0%) |
Physical Housing Characteristics in Windsor
Housing Structures in Windsor
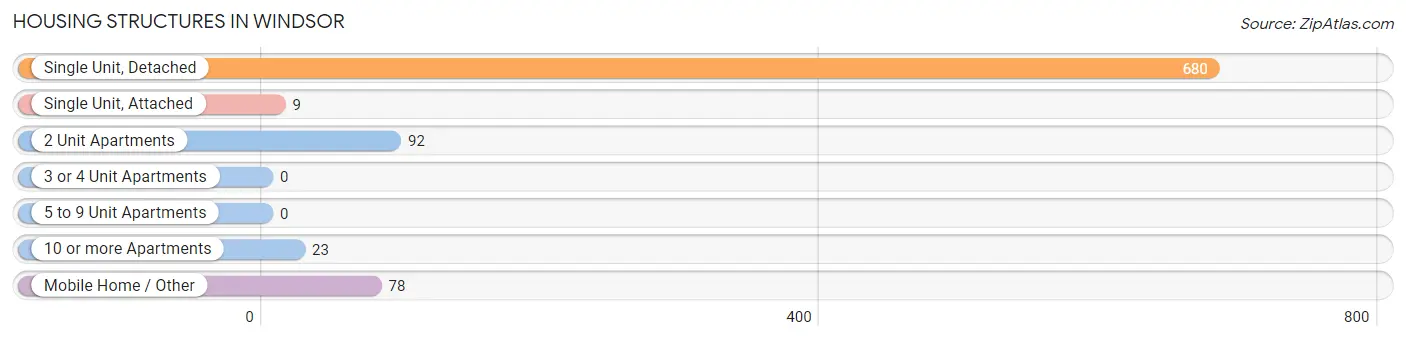
| Structure Type | # Housing Units | % Housing Units |
| Single Unit, Detached | 680 | 77.1% |
| Single Unit, Attached | 9 | 1.0% |
| 2 Unit Apartments | 92 | 10.4% |
| 3 or 4 Unit Apartments | 0 | 0.0% |
| 5 to 9 Unit Apartments | 0 | 0.0% |
| 10 or more Apartments | 23 | 2.6% |
| Mobile Home / Other | 78 | 8.8% |
| Total | 882 | 100.0% |
Housing Structures by Occupancy in Windsor
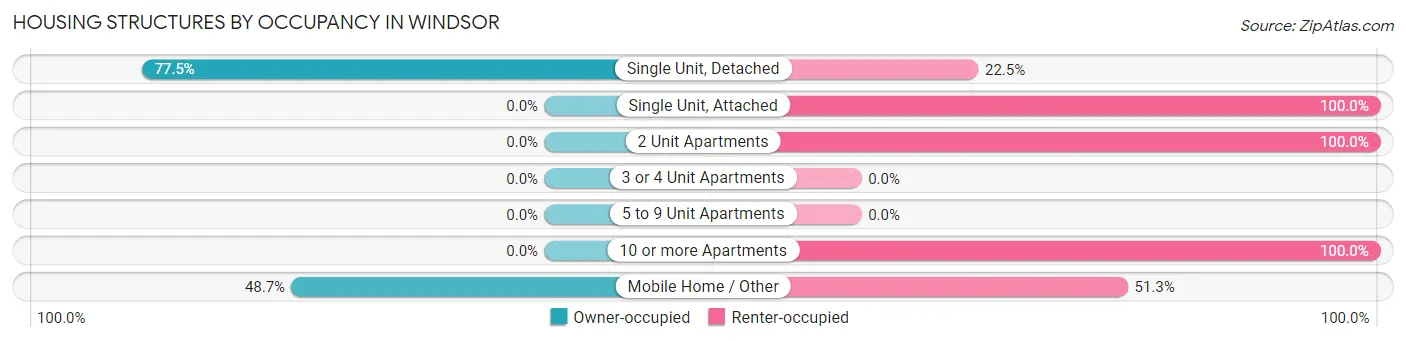
| Structure Type | Owner-occupied | Renter-occupied |
| Single Unit, Detached | 527 (77.5%) | 153 (22.5%) |
| Single Unit, Attached | 0 (0.0%) | 9 (100.0%) |
| 2 Unit Apartments | 0 (0.0%) | 92 (100.0%) |
| 3 or 4 Unit Apartments | 0 (0.0%) | 0 (0.0%) |
| 5 to 9 Unit Apartments | 0 (0.0%) | 0 (0.0%) |
| 10 or more Apartments | 0 (0.0%) | 23 (100.0%) |
| Mobile Home / Other | 38 (48.7%) | 40 (51.3%) |
| Total | 565 (64.1%) | 317 (35.9%) |
Housing Structures by Number of Rooms in Windsor
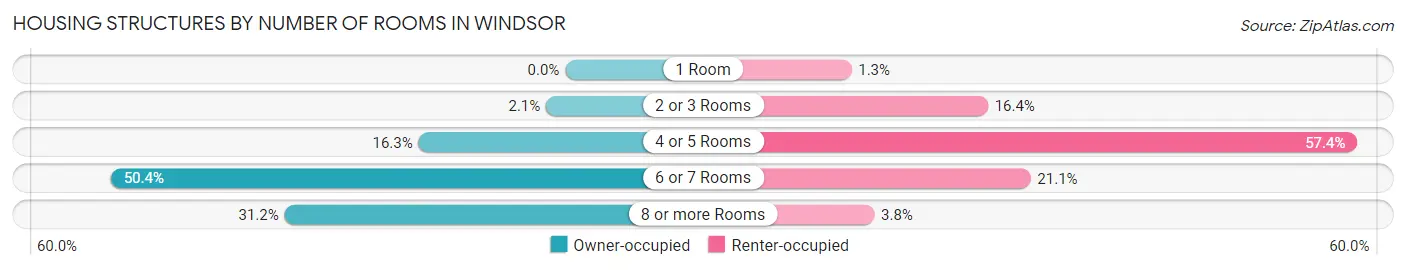
| Number of Rooms | Owner-occupied | Renter-occupied |
| 1 Room | 0 (0.0%) | 4 (1.3%) |
| 2 or 3 Rooms | 12 (2.1%) | 52 (16.4%) |
| 4 or 5 Rooms | 92 (16.3%) | 182 (57.4%) |
| 6 or 7 Rooms | 285 (50.4%) | 67 (21.1%) |
| 8 or more Rooms | 176 (31.1%) | 12 (3.8%) |
| Total | 565 (100.0%) | 317 (100.0%) |
Housing Structure by Heating Type in Windsor
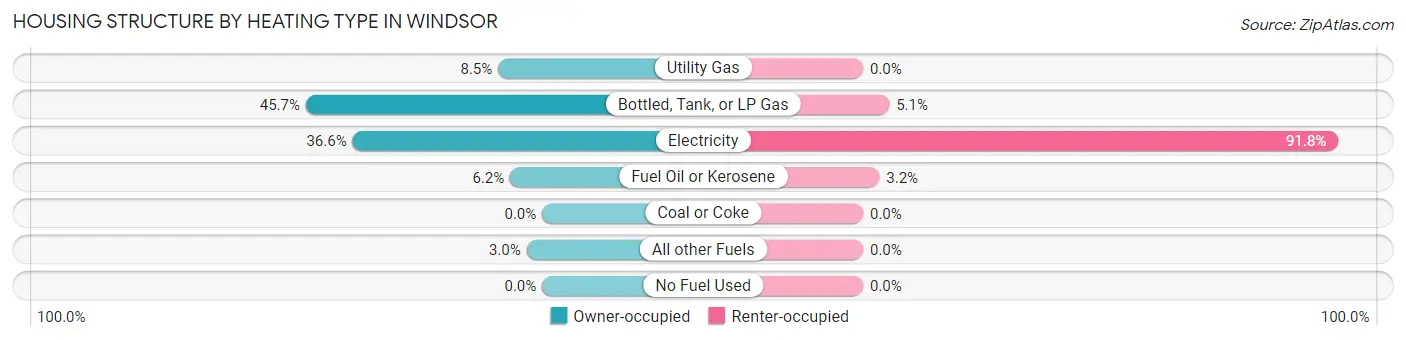
| Heating Type | Owner-occupied | Renter-occupied |
| Utility Gas | 48 (8.5%) | 0 (0.0%) |
| Bottled, Tank, or LP Gas | 258 (45.7%) | 16 (5.1%) |
| Electricity | 207 (36.6%) | 291 (91.8%) |
| Fuel Oil or Kerosene | 35 (6.2%) | 10 (3.2%) |
| Coal or Coke | 0 (0.0%) | 0 (0.0%) |
| All other Fuels | 17 (3.0%) | 0 (0.0%) |
| No Fuel Used | 0 (0.0%) | 0 (0.0%) |
| Total | 565 (100.0%) | 317 (100.0%) |
Household Vehicle Usage in Windsor
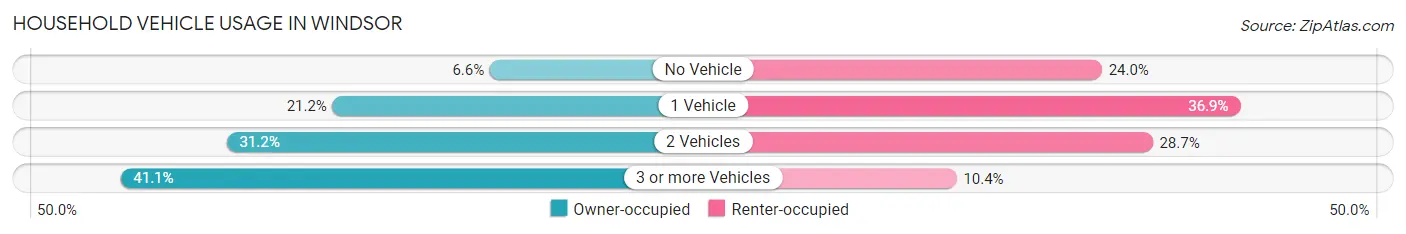
| Vehicles per Household | Owner-occupied | Renter-occupied |
| No Vehicle | 37 (6.6%) | 76 (24.0%) |
| 1 Vehicle | 120 (21.2%) | 117 (36.9%) |
| 2 Vehicles | 176 (31.1%) | 91 (28.7%) |
| 3 or more Vehicles | 232 (41.1%) | 33 (10.4%) |
| Total | 565 (100.0%) | 317 (100.0%) |
Real Estate & Mortgages in Windsor
Real Estate and Mortgage Overview in Windsor
| Characteristic | Without Mortgage | With Mortgage |
| Housing Units | 241 | 324 |
| Median Property Value | $140,500 | $96,000 |
| Median Household Income | $63,925 | $21 |
| Monthly Housing Costs | $665 | $10 |
| Real Estate Taxes | $705 | $0 |
Property Value by Mortgage Status in Windsor
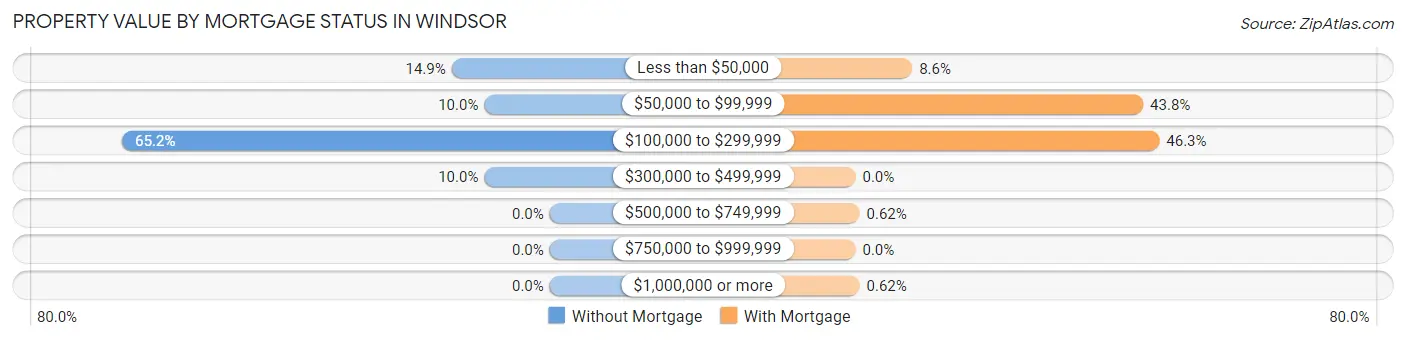
| Property Value | Without Mortgage | With Mortgage |
| Less than $50,000 | 36 (14.9%) | 28 (8.6%) |
| $50,000 to $99,999 | 24 (10.0%) | 142 (43.8%) |
| $100,000 to $299,999 | 157 (65.1%) | 150 (46.3%) |
| $300,000 to $499,999 | 24 (10.0%) | 0 (0.0%) |
| $500,000 to $749,999 | 0 (0.0%) | 2 (0.6%) |
| $750,000 to $999,999 | 0 (0.0%) | 0 (0.0%) |
| $1,000,000 or more | 0 (0.0%) | 2 (0.6%) |
| Total | 241 (100.0%) | 324 (100.0%) |
Household Income by Mortgage Status in Windsor
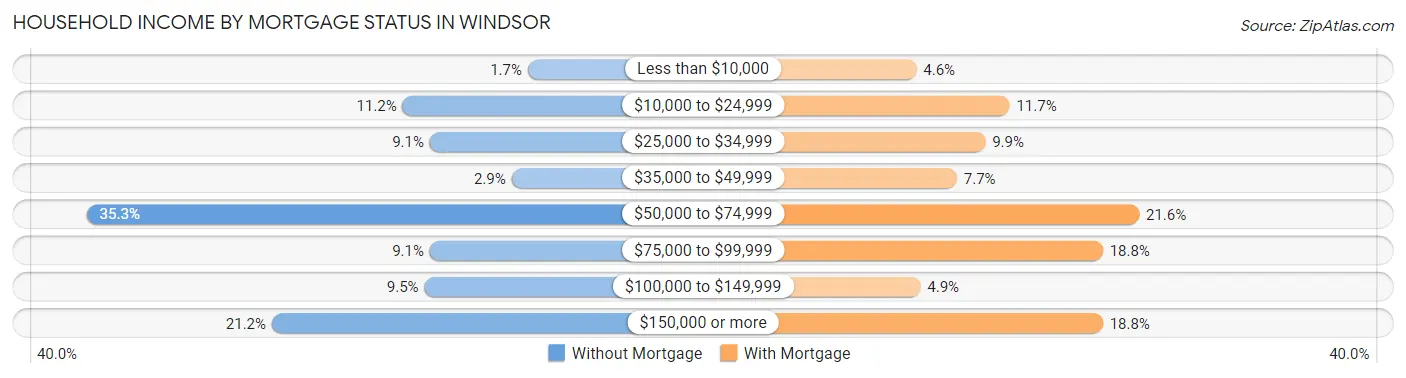
| Household Income | Without Mortgage | With Mortgage |
| Less than $10,000 | 4 (1.7%) | 15 (4.6%) |
| $10,000 to $24,999 | 27 (11.2%) | 38 (11.7%) |
| $25,000 to $34,999 | 22 (9.1%) | 32 (9.9%) |
| $35,000 to $49,999 | 7 (2.9%) | 25 (7.7%) |
| $50,000 to $74,999 | 85 (35.3%) | 70 (21.6%) |
| $75,000 to $99,999 | 22 (9.1%) | 61 (18.8%) |
| $100,000 to $149,999 | 23 (9.5%) | 16 (4.9%) |
| $150,000 or more | 51 (21.2%) | 61 (18.8%) |
| Total | 241 (100.0%) | 324 (100.0%) |
Property Value to Household Income Ratio in Windsor
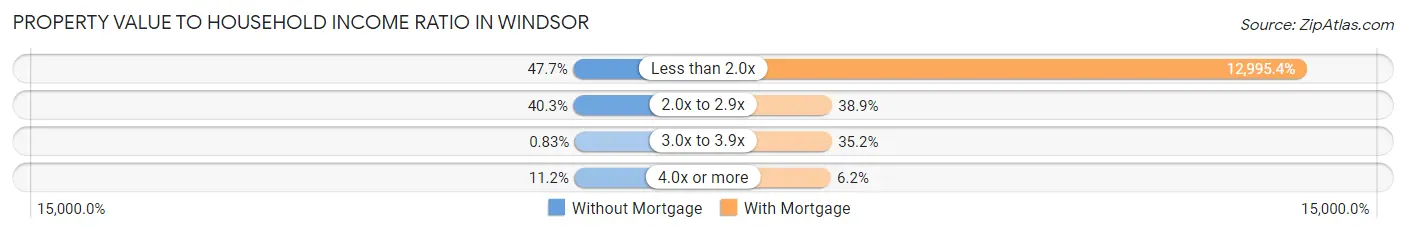
| Value-to-Income Ratio | Without Mortgage | With Mortgage |
| Less than 2.0x | 115 (47.7%) | 42,105 (12,995.4%) |
| 2.0x to 2.9x | 97 (40.3%) | 126 (38.9%) |
| 3.0x to 3.9x | 2 (0.8%) | 114 (35.2%) |
| 4.0x or more | 27 (11.2%) | 20 (6.2%) |
| Total | 241 (100.0%) | 324 (100.0%) |
Real Estate Taxes by Mortgage Status in Windsor
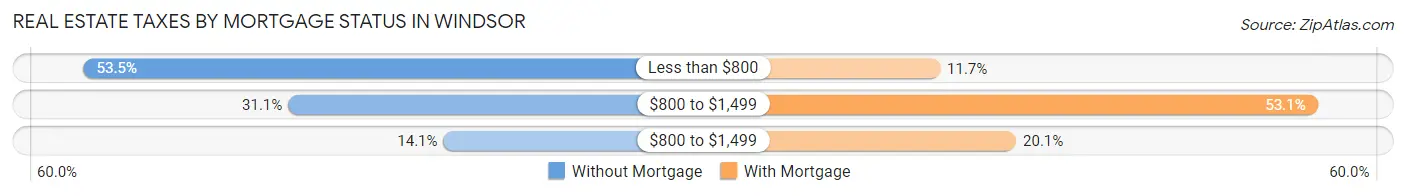
| Property Taxes | Without Mortgage | With Mortgage |
| Less than $800 | 129 (53.5%) | 38 (11.7%) |
| $800 to $1,499 | 75 (31.1%) | 172 (53.1%) |
| $800 to $1,499 | 34 (14.1%) | 65 (20.1%) |
| Total | 241 (100.0%) | 324 (100.0%) |
Health & Disability in Windsor
Health Insurance Coverage by Age in Windsor
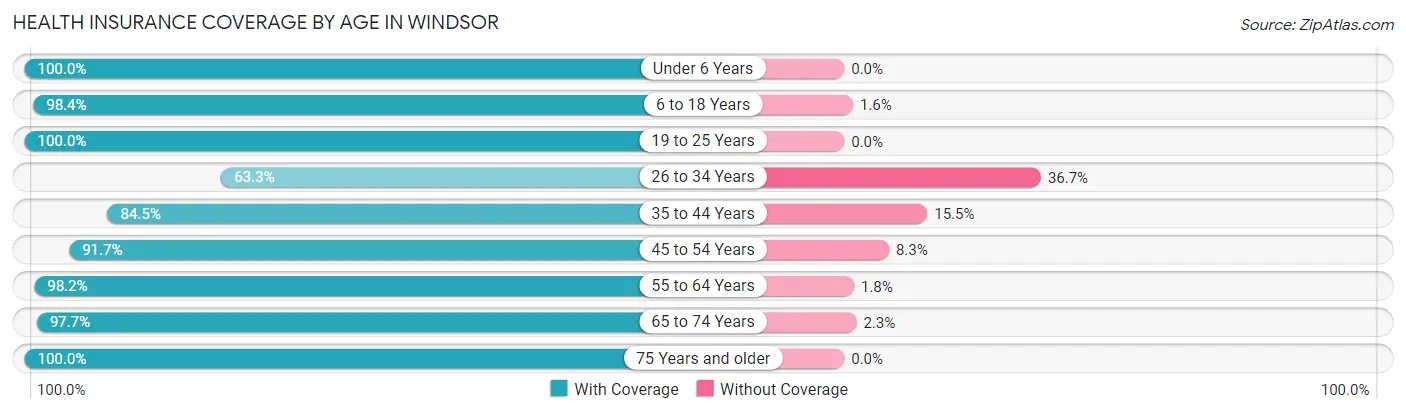
| Age Bracket | With Coverage | Without Coverage |
| Under 6 Years | 136 (100.0%) | 0 (0.0%) |
| 6 to 18 Years | 363 (98.4%) | 6 (1.6%) |
| 19 to 25 Years | 107 (100.0%) | 0 (0.0%) |
| 26 to 34 Years | 190 (63.3%) | 110 (36.7%) |
| 35 to 44 Years | 202 (84.5%) | 37 (15.5%) |
| 45 to 54 Years | 121 (91.7%) | 11 (8.3%) |
| 55 to 64 Years | 216 (98.2%) | 4 (1.8%) |
| 65 to 74 Years | 387 (97.7%) | 9 (2.3%) |
| 75 Years and older | 227 (100.0%) | 0 (0.0%) |
| Total | 1,949 (91.7%) | 177 (8.3%) |
Health Insurance Coverage by Citizenship Status in Windsor
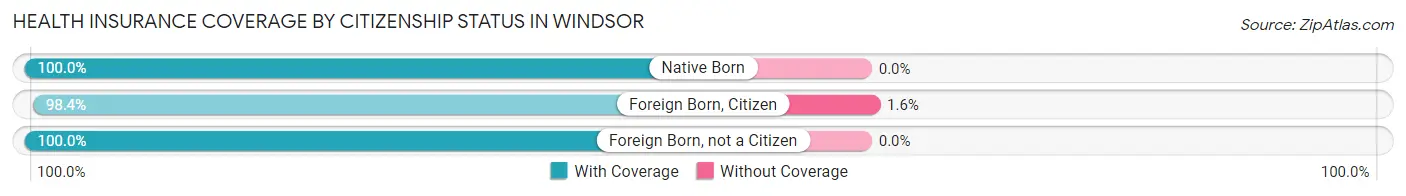
| Citizenship Status | With Coverage | Without Coverage |
| Native Born | 136 (100.0%) | 0 (0.0%) |
| Foreign Born, Citizen | 363 (98.4%) | 6 (1.6%) |
| Foreign Born, not a Citizen | 107 (100.0%) | 0 (0.0%) |
Health Insurance Coverage by Household Income in Windsor
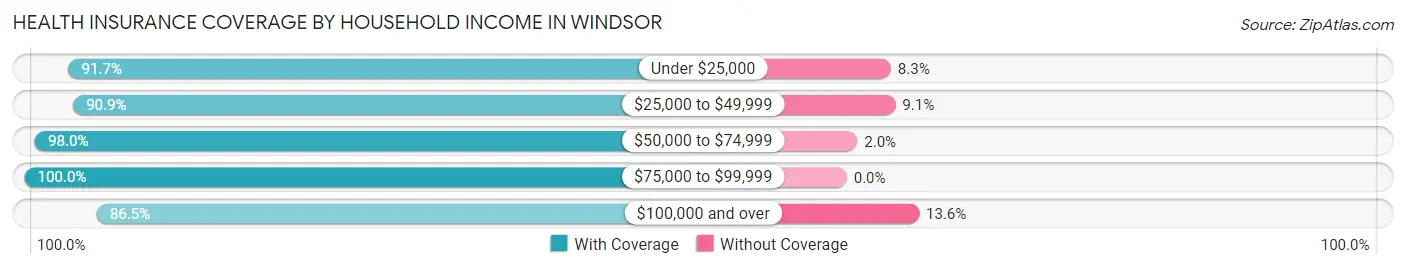
| Household Income | With Coverage | Without Coverage |
| Under $25,000 | 411 (91.7%) | 37 (8.3%) |
| $25,000 to $49,999 | 349 (90.9%) | 35 (9.1%) |
| $50,000 to $74,999 | 496 (98.0%) | 10 (2.0%) |
| $75,000 to $99,999 | 63 (100.0%) | 0 (0.0%) |
| $100,000 and over | 606 (86.5%) | 95 (13.6%) |
Public vs Private Health Insurance Coverage by Age in Windsor
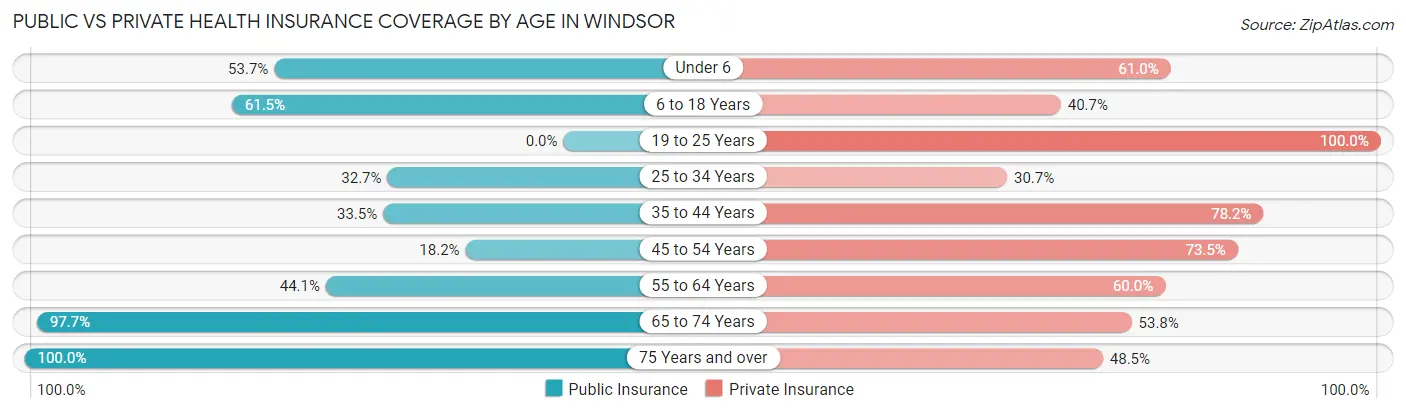
| Age Bracket | Public Insurance | Private Insurance |
| Under 6 | 73 (53.7%) | 83 (61.0%) |
| 6 to 18 Years | 227 (61.5%) | 150 (40.6%) |
| 19 to 25 Years | 0 (0.0%) | 107 (100.0%) |
| 25 to 34 Years | 98 (32.7%) | 92 (30.7%) |
| 35 to 44 Years | 80 (33.5%) | 187 (78.2%) |
| 45 to 54 Years | 24 (18.2%) | 97 (73.5%) |
| 55 to 64 Years | 97 (44.1%) | 132 (60.0%) |
| 65 to 74 Years | 387 (97.7%) | 213 (53.8%) |
| 75 Years and over | 227 (100.0%) | 110 (48.5%) |
| Total | 1,213 (57.1%) | 1,171 (55.1%) |
Disability Status by Sex by Age in Windsor
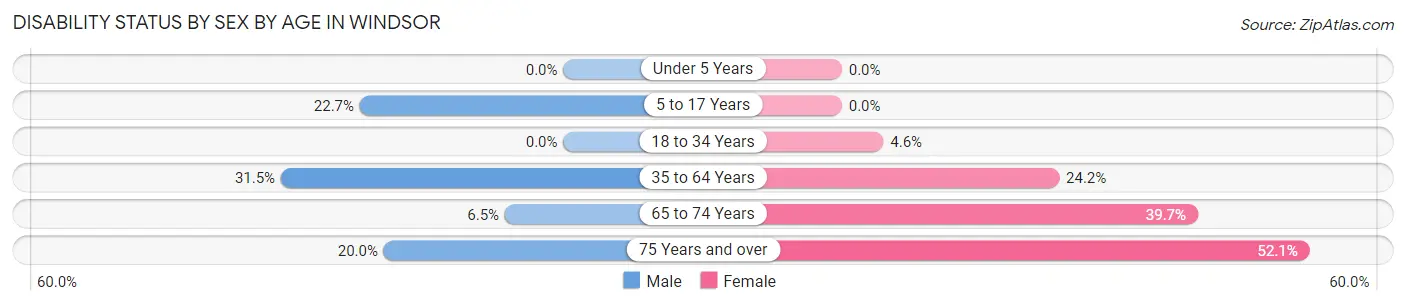
| Age Bracket | Male | Female |
| Under 5 Years | 0 (0.0%) | 0 (0.0%) |
| 5 to 17 Years | 29 (22.7%) | 0 (0.0%) |
| 18 to 34 Years | 0 (0.0%) | 12 (4.6%) |
| 35 to 64 Years | 78 (31.5%) | 83 (24.2%) |
| 65 to 74 Years | 11 (6.5%) | 90 (39.7%) |
| 75 Years and over | 12 (20.0%) | 87 (52.1%) |
Disability Class by Sex by Age in Windsor
Disability Class: Hearing Difficulty
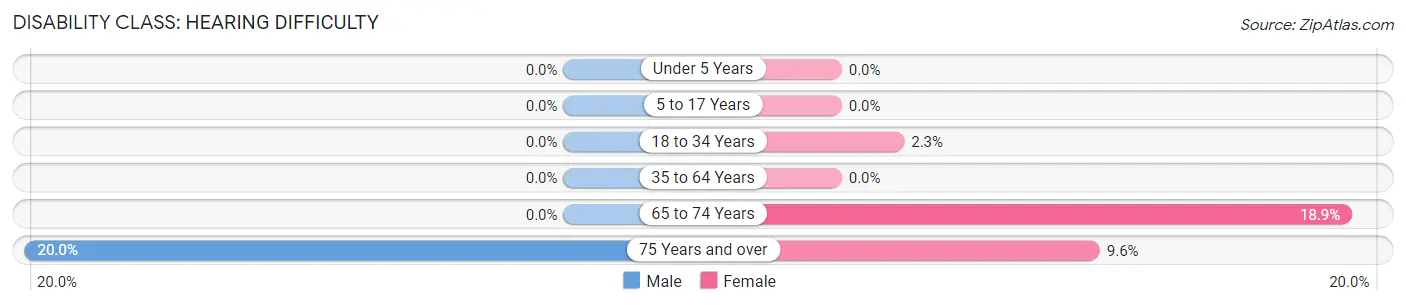
| Age Bracket | Male | Female |
| Under 5 Years | 0 (0.0%) | 0 (0.0%) |
| 5 to 17 Years | 0 (0.0%) | 0 (0.0%) |
| 18 to 34 Years | 0 (0.0%) | 6 (2.3%) |
| 35 to 64 Years | 0 (0.0%) | 0 (0.0%) |
| 65 to 74 Years | 0 (0.0%) | 43 (18.9%) |
| 75 Years and over | 12 (20.0%) | 16 (9.6%) |
Disability Class: Vision Difficulty
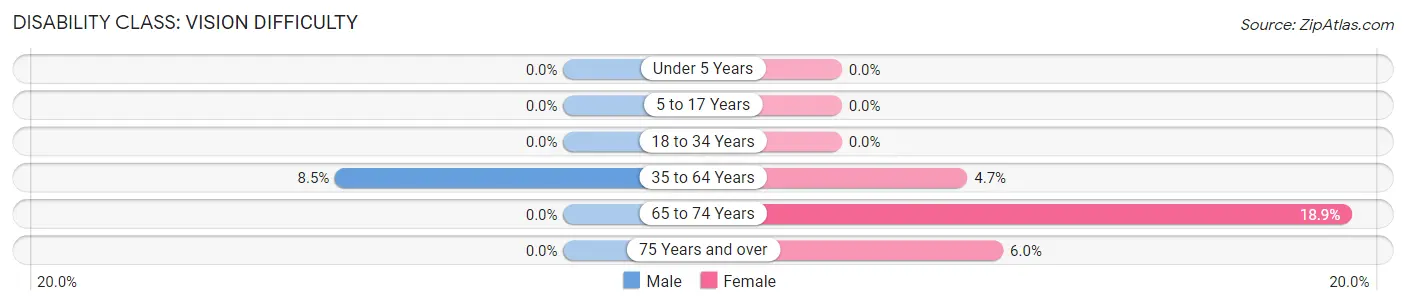
| Age Bracket | Male | Female |
| Under 5 Years | 0 (0.0%) | 0 (0.0%) |
| 5 to 17 Years | 0 (0.0%) | 0 (0.0%) |
| 18 to 34 Years | 0 (0.0%) | 0 (0.0%) |
| 35 to 64 Years | 21 (8.5%) | 16 (4.7%) |
| 65 to 74 Years | 0 (0.0%) | 43 (18.9%) |
| 75 Years and over | 0 (0.0%) | 10 (6.0%) |
Disability Class: Cognitive Difficulty
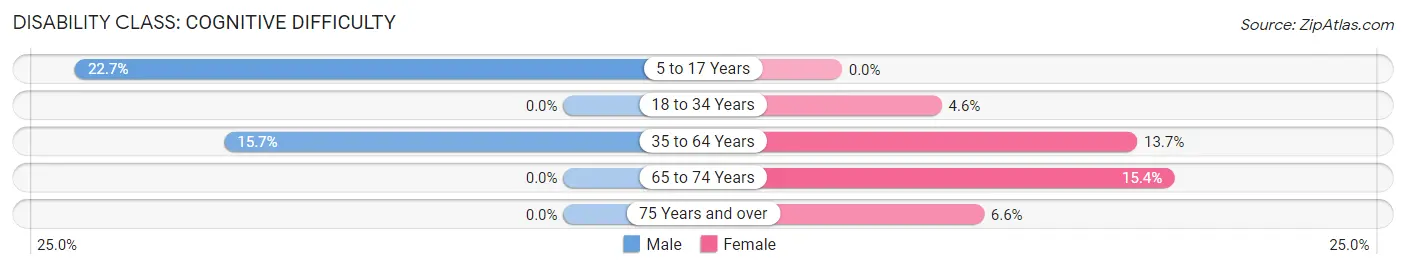
| Age Bracket | Male | Female |
| 5 to 17 Years | 29 (22.7%) | 0 (0.0%) |
| 18 to 34 Years | 0 (0.0%) | 12 (4.6%) |
| 35 to 64 Years | 39 (15.7%) | 47 (13.7%) |
| 65 to 74 Years | 0 (0.0%) | 35 (15.4%) |
| 75 Years and over | 0 (0.0%) | 11 (6.6%) |
Disability Class: Ambulatory Difficulty
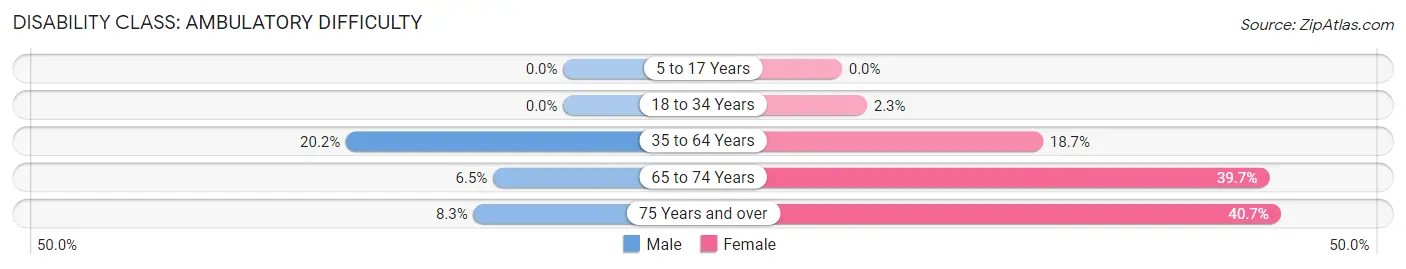
| Age Bracket | Male | Female |
| 5 to 17 Years | 0 (0.0%) | 0 (0.0%) |
| 18 to 34 Years | 0 (0.0%) | 6 (2.3%) |
| 35 to 64 Years | 50 (20.2%) | 64 (18.7%) |
| 65 to 74 Years | 11 (6.5%) | 90 (39.7%) |
| 75 Years and over | 5 (8.3%) | 68 (40.7%) |
Disability Class: Self-Care Difficulty
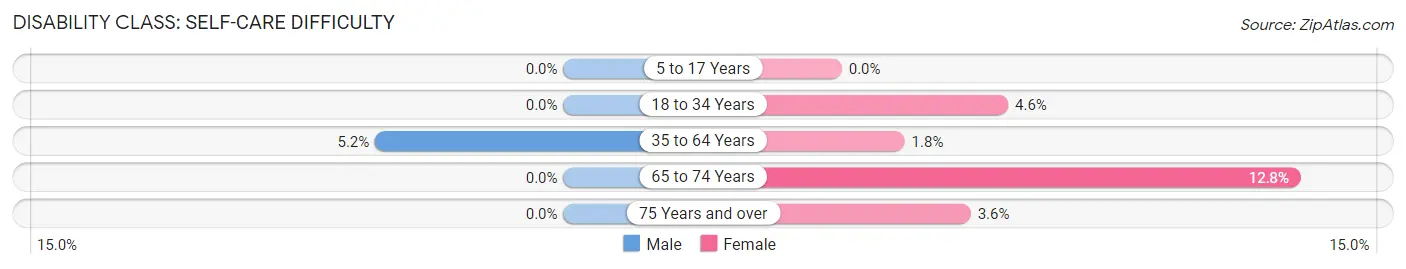
| Age Bracket | Male | Female |
| 5 to 17 Years | 0 (0.0%) | 0 (0.0%) |
| 18 to 34 Years | 0 (0.0%) | 12 (4.6%) |
| 35 to 64 Years | 13 (5.2%) | 6 (1.8%) |
| 65 to 74 Years | 0 (0.0%) | 29 (12.8%) |
| 75 Years and over | 0 (0.0%) | 6 (3.6%) |
Technology Access in Windsor
Computing Device Access in Windsor
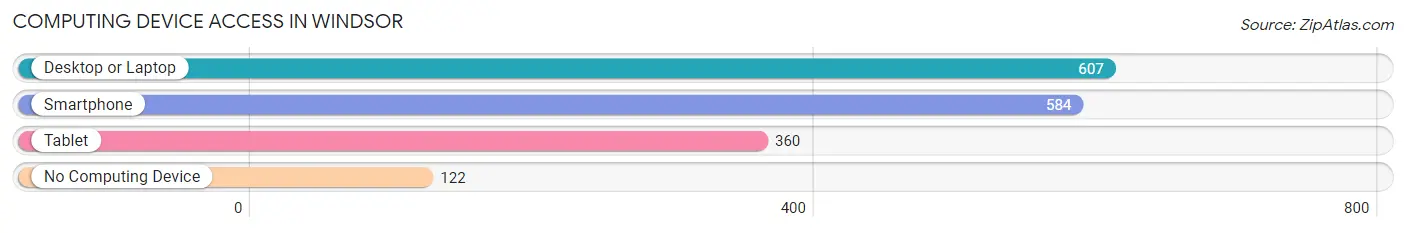
| Device Type | # Households | % Households |
| Desktop or Laptop | 607 | 68.8% |
| Smartphone | 584 | 66.2% |
| Tablet | 360 | 40.8% |
| No Computing Device | 122 | 13.8% |
| Total | 882 | 100.0% |
Internet Access in Windsor
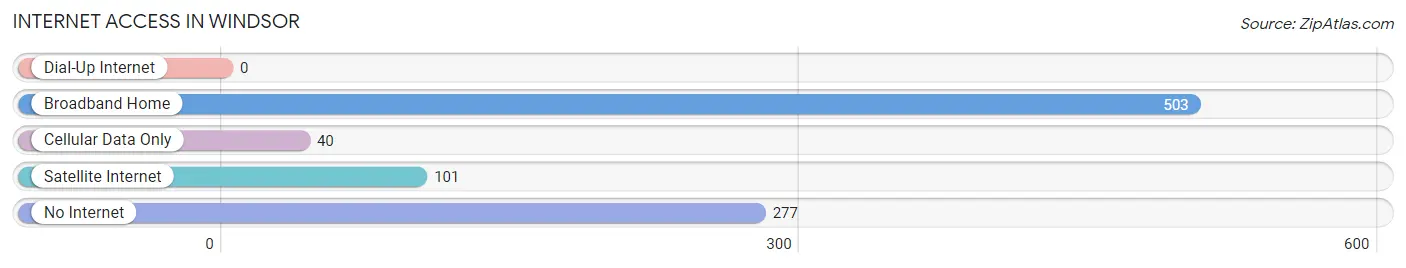
| Internet Type | # Households | % Households |
| Dial-Up Internet | 0 | 0.0% |
| Broadband Home | 503 | 57.0% |
| Cellular Data Only | 40 | 4.5% |
| Satellite Internet | 101 | 11.5% |
| No Internet | 277 | 31.4% |
| Total | 882 | 100.0% |
Windsor Summary
Windsor is a small town located in Bertie County, North Carolina. It is situated on the banks of the Cashie River, approximately 30 miles east of the state capital of Raleigh. The town has a population of approximately 2,000 people and is the county seat of Bertie County.
Geography
Windsor is located in the Coastal Plain region of North Carolina, which is characterized by flat terrain and sandy soils. The town is situated on the banks of the Cashie River, which flows through the town and provides a source of recreation for the local population. The town is located approximately 30 miles east of Raleigh, the state capital, and is accessible via US Highway 13.
Climate
Windsor has a humid subtropical climate, with hot, humid summers and mild winters. The average annual temperature is around 70 degrees Fahrenheit, with temperatures reaching as high as 95 degrees in the summer months and as low as 40 degrees in the winter months. The town receives an average of 48 inches of precipitation per year, with most of it falling in the summer months.
Demographics
As of the 2010 census, Windsor had a population of 2,068 people. The racial makeup of the town was 57.3% White, 37.2% African American, 0.3% Native American, 0.7% Asian, 0.1% Pacific Islander, and 4.4% from other races. The median household income was $25,938, and the median family income was $31,250.
Economy
Windsor’s economy is largely based on agriculture, with the town being home to several farms and agricultural businesses. The town is also home to a number of small businesses, including restaurants, retail stores, and service providers. The town is also home to a number of manufacturing companies, including a furniture factory and a textile mill.
History
Windsor was founded in 1750 by a group of settlers from Virginia. The town was originally known as “New Town”, but was later renamed Windsor in honor of the Duke of Windsor. The town was incorporated in 1787 and became the county seat of Bertie County in 1791.
In the 19th century, Windsor was a center of the tobacco industry, with the town being home to several tobacco warehouses. The town was also home to a number of other industries, including a cotton mill, a sawmill, and a gristmill.
In the 20th century, Windsor experienced a period of decline, as the tobacco industry moved away from the town and other industries began to decline. The town has since experienced a resurgence, with the opening of several new businesses and the revitalization of the downtown area.
Common Questions
What is Per Capita Income in Windsor?
Per Capita income in Windsor is $22,814.
What is the Median Family Income in Windsor?
Median Family Income in Windsor is $63,750.
What is the Median Household income in Windsor?
Median Household Income in Windsor is $46,786.
What is Income or Wage Gap in Windsor?
Income or Wage Gap in Windsor is 53.8%.
Women in Windsor earn 46.2 cents for every dollar earned by a man.
What is Inequality or Gini Index in Windsor?
Inequality or Gini Index in Windsor is 0.58.
What is the Total Population of Windsor?
Total Population of Windsor is 3,494.
What is the Total Male Population of Windsor?
Total Male Population of Windsor is 2,137.
What is the Total Female Population of Windsor?
Total Female Population of Windsor is 1,357.
What is the Ratio of Males per 100 Females in Windsor?
There are 157.48 Males per 100 Females in Windsor.
What is the Ratio of Females per 100 Males in Windsor?
There are 63.50 Females per 100 Males in Windsor.
What is the Median Population Age in Windsor?
Median Population Age in Windsor is 41.3 Years.
What is the Average Family Size in Windsor
Average Family Size in Windsor is 2.9 People.
What is the Average Household Size in Windsor
Average Household Size in Windsor is 2.4 People.
How Large is the Labor Force in Windsor?
There are 713 People in the Labor Forcein in Windsor.
What is the Percentage of People in the Labor Force in Windsor?
22.7% of People are in the Labor Force in Windsor.
What is the Unemployment Rate in Windsor?
Unemployment Rate in Windsor is 2.5%.