Shannon, NC Map & Demographics
Shannon Map
Shannon Overview
$14,475
PER CAPITA INCOME
$28,359
AVG HOUSEHOLD INCOME
0.41
INEQUALITY / GINI INDEX
245
TOTAL POPULATION
132
MALE POPULATION
113
FEMALE POPULATION
116.81
MALES / 100 FEMALES
85.61
FEMALES / 100 MALES
49.6
MEDIAN AGE
4.0
AVG FAMILY SIZE
2.4
AVG HOUSEHOLD SIZE
84
LABOR FORCE [ PEOPLE ]
43.8%
PERCENT IN LABOR FORCE
Shannon Zip Codes
Income in Shannon
Income Overview in Shannon
| Characteristic | Number | Measure |
| Per Capita Income | 245 | $14,475 |
| Median Family Income | 29 | $0 |
| Mean Family Income | 29 | $63,045 |
| Median Household Income | 104 | $28,359 |
| Mean Household Income | 104 | $33,074 |
| Income Deficit | 29 | $0 |
| Wage / Income Gap (%) | 245 | 0.00% |
| Wage / Income Gap ($) | 245 | 100.00¢ per $1 |
| Gini / Inequality Index | 245 | 0.41 |
Earnings by Sex in Shannon
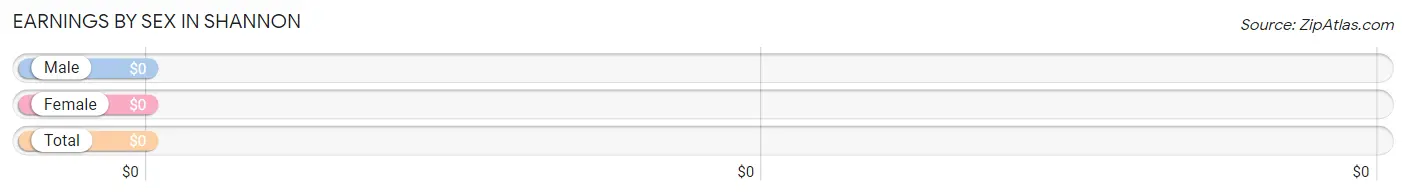
| Sex | Number | Average Earnings |
| Male | 19 (22.6%) | $0 |
| Female | 65 (77.4%) | $0 |
| Total | 84 (100.0%) | $0 |
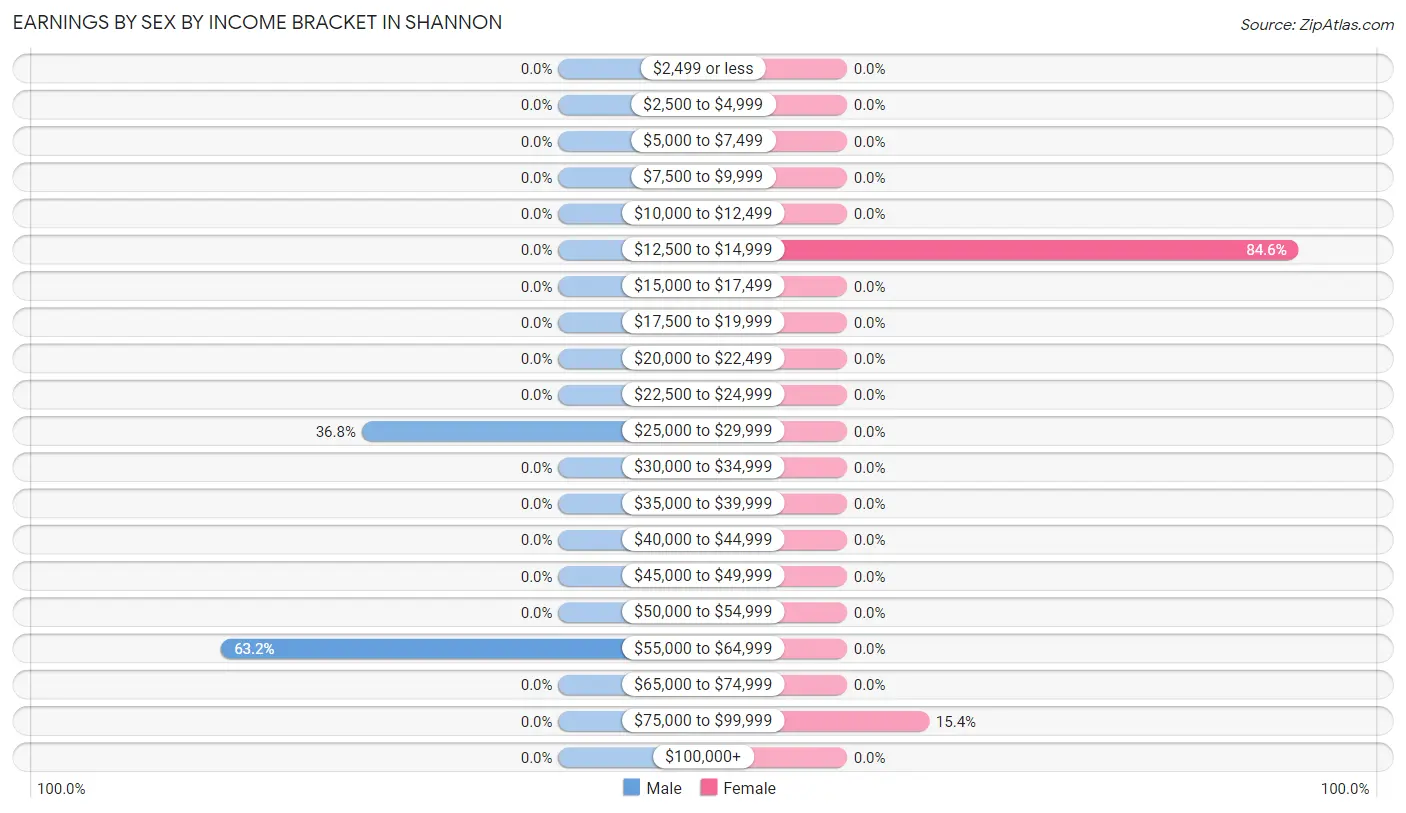
Earnings by Sex by Income Bracket in Shannon
The most common earnings brackets in Shannon are $55,000 to $64,999 for men (12 | 63.2%) and $12,500 to $14,999 for women (55 | 84.6%).
| Income | Male | Female |
| $2,499 or less | 0 (0.0%) | 0 (0.0%) |
| $2,500 to $4,999 | 0 (0.0%) | 0 (0.0%) |
| $5,000 to $7,499 | 0 (0.0%) | 0 (0.0%) |
| $7,500 to $9,999 | 0 (0.0%) | 0 (0.0%) |
| $10,000 to $12,499 | 0 (0.0%) | 0 (0.0%) |
| $12,500 to $14,999 | 0 (0.0%) | 55 (84.6%) |
| $15,000 to $17,499 | 0 (0.0%) | 0 (0.0%) |
| $17,500 to $19,999 | 0 (0.0%) | 0 (0.0%) |
| $20,000 to $22,499 | 0 (0.0%) | 0 (0.0%) |
| $22,500 to $24,999 | 0 (0.0%) | 0 (0.0%) |
| $25,000 to $29,999 | 7 (36.8%) | 0 (0.0%) |
| $30,000 to $34,999 | 0 (0.0%) | 0 (0.0%) |
| $35,000 to $39,999 | 0 (0.0%) | 0 (0.0%) |
| $40,000 to $44,999 | 0 (0.0%) | 0 (0.0%) |
| $45,000 to $49,999 | 0 (0.0%) | 0 (0.0%) |
| $50,000 to $54,999 | 0 (0.0%) | 0 (0.0%) |
| $55,000 to $64,999 | 12 (63.2%) | 0 (0.0%) |
| $65,000 to $74,999 | 0 (0.0%) | 0 (0.0%) |
| $75,000 to $99,999 | 0 (0.0%) | 10 (15.4%) |
| $100,000+ | 0 (0.0%) | 0 (0.0%) |
| Total | 19 (100.0%) | 65 (100.0%) |
Earnings by Sex by Educational Attainment in Shannon
| Educational Attainment | Male Income | Female Income |
| Less than High School | - | - |
| High School Diploma | - | - |
| College or Associate's Degree | - | - |
| Bachelor's Degree | - | - |
| Graduate Degree | - | - |
| Total | - | - |
Family Income in Shannon
Family Income Brackets in Shannon
According to the Shannon family income data, there are 10 families falling into the $15,000 to $24,999 income range, which is the most common income bracket and makes up 34.5% of all families.
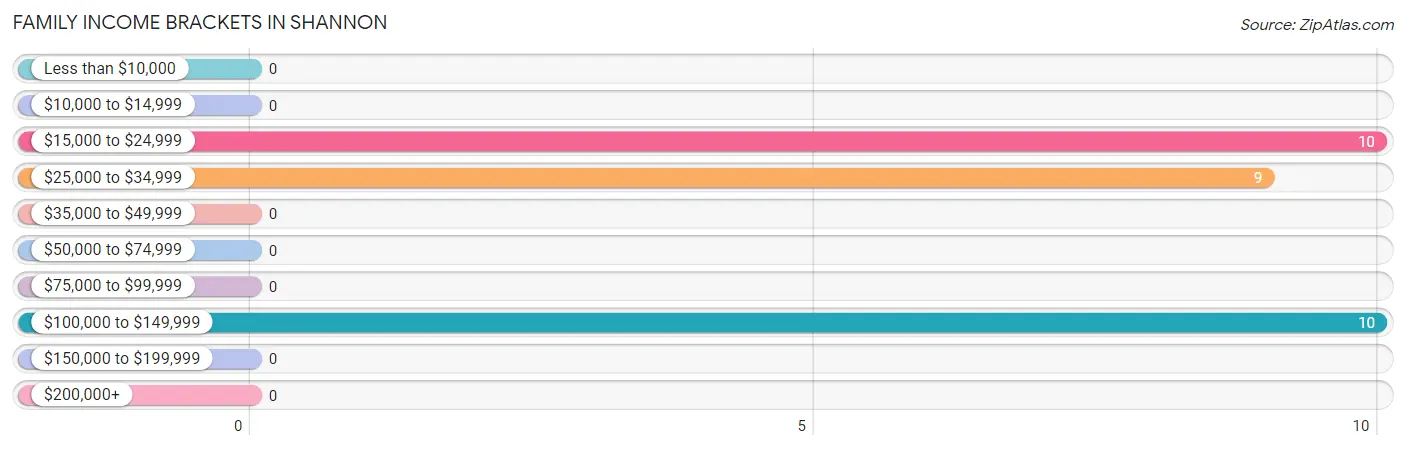
| Income Bracket | # Families | % Families |
| Less than $10,000 | 0 | 0.0% |
| $10,000 to $14,999 | 0 | 0.0% |
| $15,000 to $24,999 | 10 | 34.5% |
| $25,000 to $34,999 | 9 | 31.0% |
| $35,000 to $49,999 | 0 | 0.0% |
| $50,000 to $74,999 | 0 | 0.0% |
| $75,000 to $99,999 | 0 | 0.0% |
| $100,000 to $149,999 | 10 | 34.5% |
| $150,000 to $199,999 | 0 | 0.0% |
| $200,000+ | 0 | 0.0% |
Family Income by Famaliy Size in Shannon
| Income Bracket | # Families | Median Income |
| 2-Person Families | 10 (34.5%) | $0 |
| 3-Person Families | 0 (0.0%) | $0 |
| 4-Person Families | 19 (65.5%) | $0 |
| 5-Person Families | 0 (0.0%) | $0 |
| 6-Person Families | 0 (0.0%) | $0 |
| 7+ Person Families | 0 (0.0%) | $0 |
| Total | 29 (100.0%) | $0 |
Family Income by Number of Earners in Shannon
| Number of Earners | # Families | Median Income |
| No Earners | 10 (34.5%) | $0 |
| 1 Earner | 9 (31.0%) | $0 |
| 2 Earners | 10 (34.5%) | $0 |
| 3+ Earners | 0 (0.0%) | $0 |
| Total | 29 (100.0%) | $0 |
Household Income in Shannon
Household Income Brackets in Shannon
With 64 households falling in the category, the $25,000 to $34,999 income range is the most frequent in Shannon, accounting for 61.5% of all households.
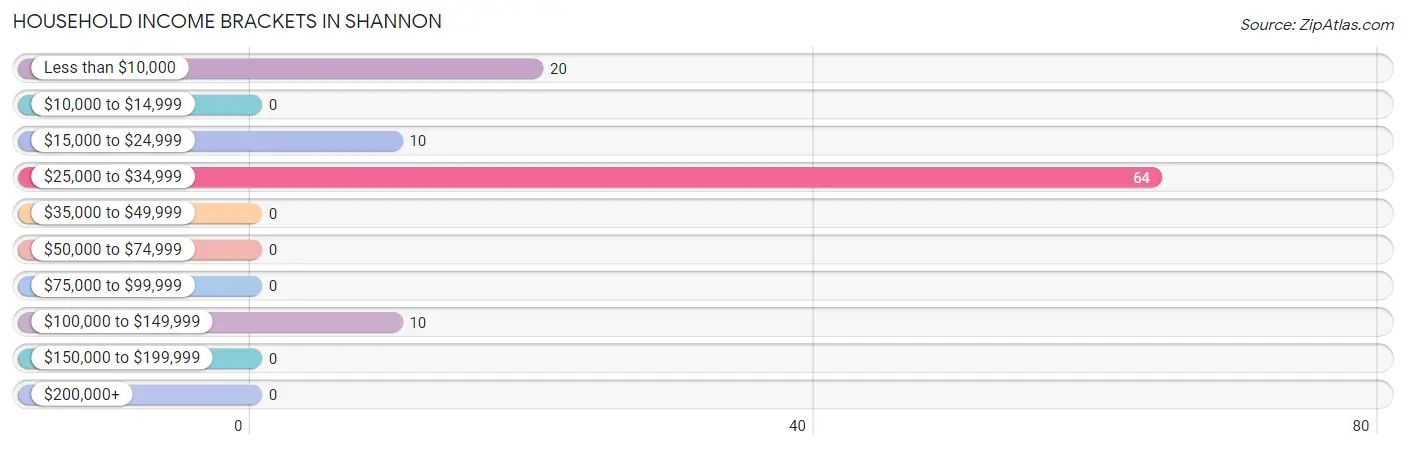
| Income Bracket | # Households | % Households |
| Less than $10,000 | 20 | 19.2% |
| $10,000 to $14,999 | 0 | 0.0% |
| $15,000 to $24,999 | 10 | 9.6% |
| $25,000 to $34,999 | 64 | 61.5% |
| $35,000 to $49,999 | 0 | 0.0% |
| $50,000 to $74,999 | 0 | 0.0% |
| $75,000 to $99,999 | 0 | 0.0% |
| $100,000 to $149,999 | 10 | 9.6% |
| $150,000 to $199,999 | 0 | 0.0% |
| $200,000+ | 0 | 0.0% |
Household Income by Householder Age in Shannon
| Income Bracket | # Households | Median Income |
| 15 to 24 Years | 0 (0.0%) | $0 |
| 25 to 44 Years | 9 (8.6%) | $0 |
| 45 to 64 Years | 65 (62.5%) | $0 |
| 65+ Years | 30 (28.8%) | $0 |
| Total | 104 (100.0%) | $28,359 |
Poverty in Shannon
Income Below Poverty by Sex and Age in Shannon
With 38.6% poverty level for males and 65.5% for females among the residents of Shannon, under 5 year old males and 25 to 34 year old females are the most vulnerable to poverty, with 19 males (100.0%) and 9 females (100.0%) in their respective age groups living below the poverty level.
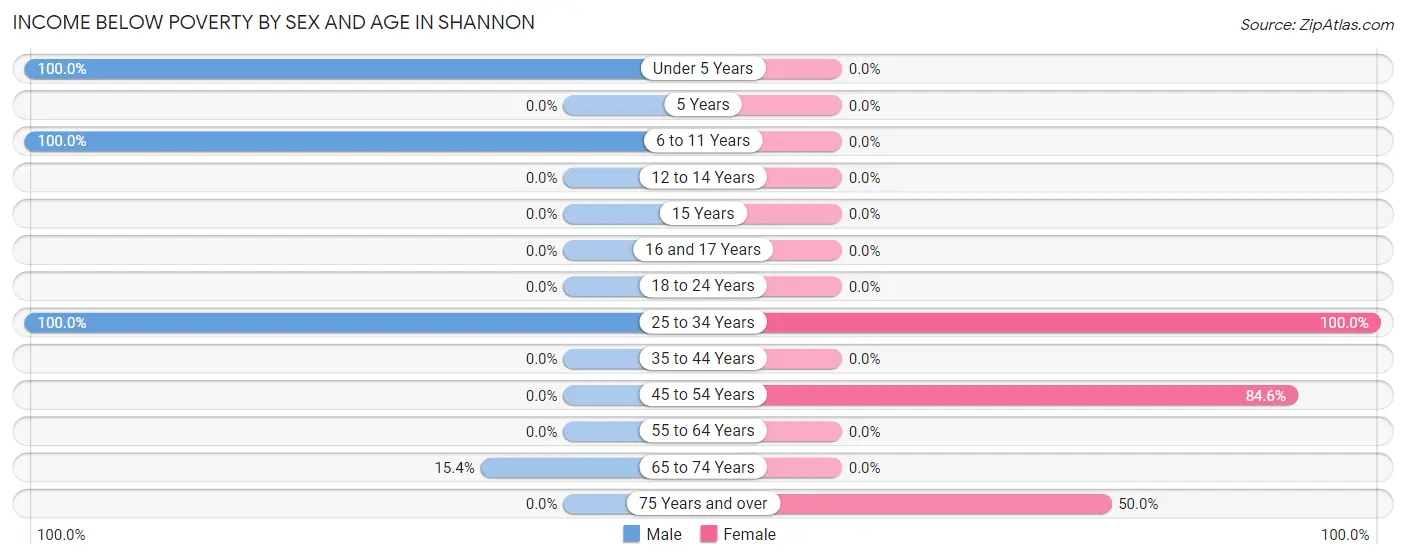
| Age Bracket | Male | Female |
| Under 5 Years | 19 (100.0%) | 0 (0.0%) |
| 5 Years | 0 (0.0%) | 0 (0.0%) |
| 6 to 11 Years | 15 (100.0%) | 0 (0.0%) |
| 12 to 14 Years | 0 (0.0%) | 0 (0.0%) |
| 15 Years | 0 (0.0%) | 0 (0.0%) |
| 16 and 17 Years | 0 (0.0%) | 0 (0.0%) |
| 18 to 24 Years | 0 (0.0%) | 0 (0.0%) |
| 25 to 34 Years | 7 (100.0%) | 9 (100.0%) |
| 35 to 44 Years | 0 (0.0%) | 0 (0.0%) |
| 45 to 54 Years | 0 (0.0%) | 55 (84.6%) |
| 55 to 64 Years | 0 (0.0%) | 0 (0.0%) |
| 65 to 74 Years | 10 (15.4%) | 0 (0.0%) |
| 75 Years and over | 0 (0.0%) | 10 (50.0%) |
| Total | 51 (38.6%) | 74 (65.5%) |
Income Above Poverty by Sex and Age in Shannon
According to the poverty statistics in Shannon, males aged 45 to 54 years and females aged 12 to 14 years are the age groups that are most secure financially, with 100.0% of males and 100.0% of females in these age groups living above the poverty line.
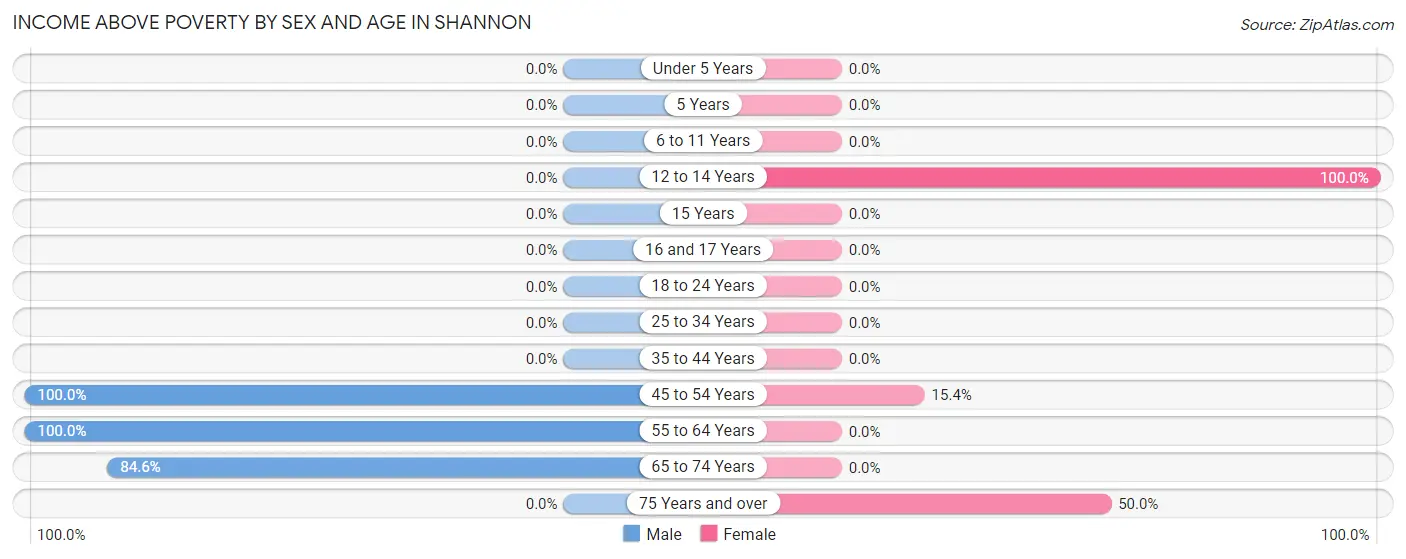
| Age Bracket | Male | Female |
| Under 5 Years | 0 (0.0%) | 0 (0.0%) |
| 5 Years | 0 (0.0%) | 0 (0.0%) |
| 6 to 11 Years | 0 (0.0%) | 0 (0.0%) |
| 12 to 14 Years | 0 (0.0%) | 19 (100.0%) |
| 15 Years | 0 (0.0%) | 0 (0.0%) |
| 16 and 17 Years | 0 (0.0%) | 0 (0.0%) |
| 18 to 24 Years | 0 (0.0%) | 0 (0.0%) |
| 25 to 34 Years | 0 (0.0%) | 0 (0.0%) |
| 35 to 44 Years | 0 (0.0%) | 0 (0.0%) |
| 45 to 54 Years | 12 (100.0%) | 10 (15.4%) |
| 55 to 64 Years | 14 (100.0%) | 0 (0.0%) |
| 65 to 74 Years | 55 (84.6%) | 0 (0.0%) |
| 75 Years and over | 0 (0.0%) | 10 (50.0%) |
| Total | 81 (61.4%) | 39 (34.5%) |
Income Below Poverty Among Married-Couple Families in Shannon
The poverty statistics for married-couple families in Shannon show that 47.4% or 9 of the total 19 families live below the poverty line. Families with 1 or 2 children have the highest poverty rate of 47.4%, comprising of 9 families. On the other hand, families with 1 or 2 children have the lowest poverty rate of 47.4%, which includes 9 families.
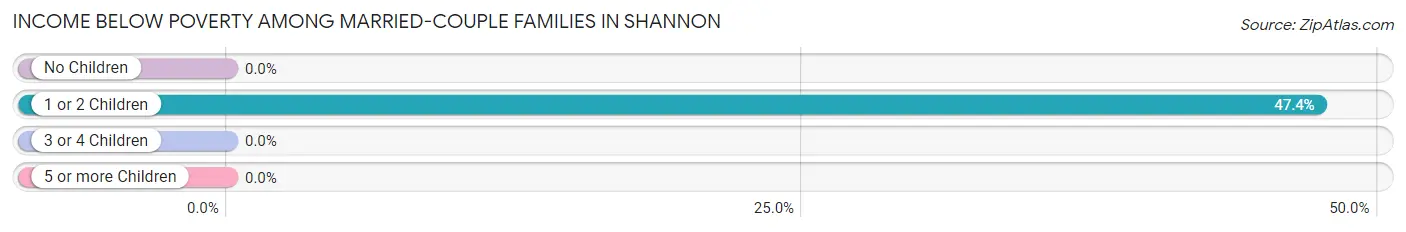
| Children | Above Poverty | Below Poverty |
| No Children | 0 (0.0%) | 0 (0.0%) |
| 1 or 2 Children | 10 (52.6%) | 9 (47.4%) |
| 3 or 4 Children | 0 (0.0%) | 0 (0.0%) |
| 5 or more Children | 0 (0.0%) | 0 (0.0%) |
| Total | 10 (52.6%) | 9 (47.4%) |
Income Below Poverty Among Single-Parent Households in Shannon
| Children | Single Father | Single Mother |
| No Children | 0 (0.0%) | 0 (0.0%) |
| 1 or 2 Children | 0 (0.0%) | 0 (0.0%) |
| 3 or 4 Children | 0 (0.0%) | 0 (0.0%) |
| 5 or more Children | 0 (0.0%) | 0 (0.0%) |
| Total | 0 (0.0%) | 0 (0.0%) |
Income Below Poverty Among Married-Couple vs Single-Parent Households in Shannon
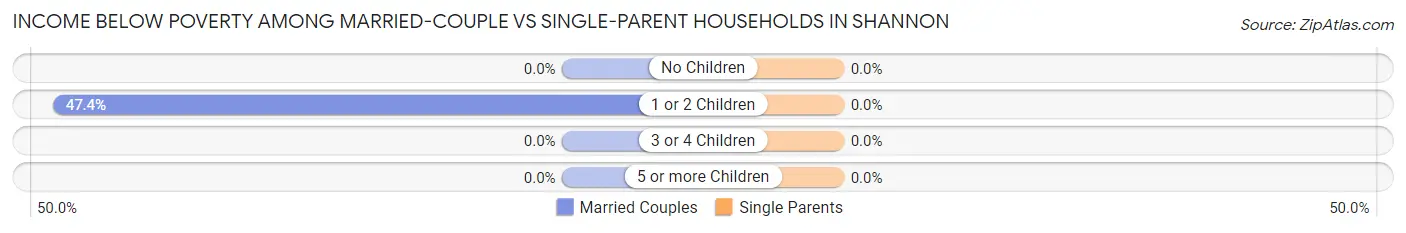
| Children | Married-Couple Families | Single-Parent Households |
| No Children | 0 (0.0%) | 0 (0.0%) |
| 1 or 2 Children | 9 (47.4%) | 0 (0.0%) |
| 3 or 4 Children | 0 (0.0%) | 0 (0.0%) |
| 5 or more Children | 0 (0.0%) | 0 (0.0%) |
| Total | 9 (47.4%) | 0 (0.0%) |
Race in Shannon
The most populous races in Shannon are Black / African American (120 | 49.0%), Native / Alaskan (55 | 22.5%), and Hispanic or Latino (50 | 20.4%).
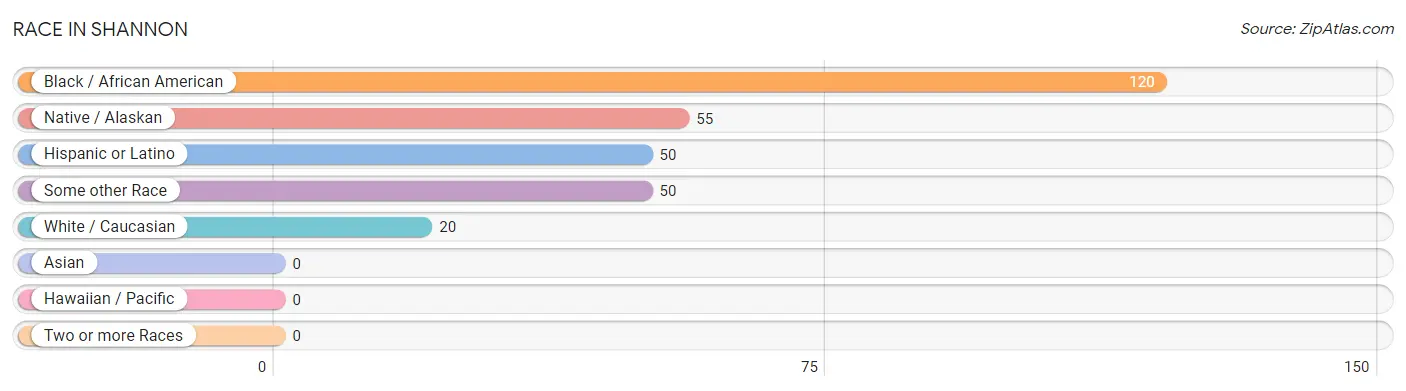
| Race | # Population | % Population |
| Asian | 0 | 0.0% |
| Black / African American | 120 | 49.0% |
| Hawaiian / Pacific | 0 | 0.0% |
| Hispanic or Latino | 50 | 20.4% |
| Native / Alaskan | 55 | 22.5% |
| White / Caucasian | 20 | 8.2% |
| Two or more Races | 0 | 0.0% |
| Some other Race | 50 | 20.4% |
| Total | 245 | 100.0% |
Ancestry in Shannon
The most populous ancestries reported in Shannon are American (110 | 44.9%), Lumbee (55 | 22.5%), and Mexican (50 | 20.4%), together accounting for 87.8% of all Shannon residents.
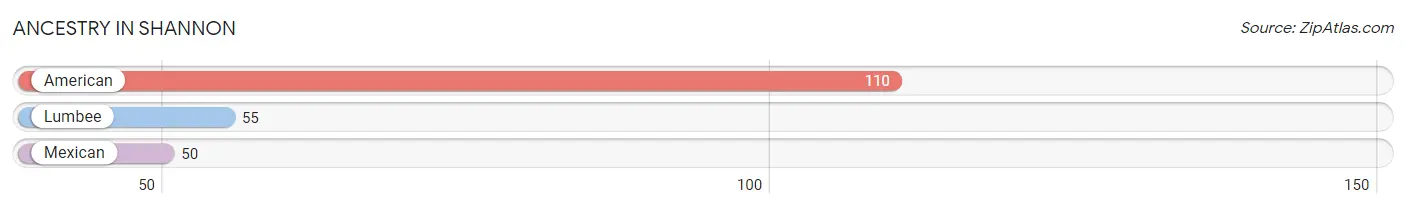
| Ancestry | # Population | % Population |
| American | 110 | 44.9% |
| Lumbee | 55 | 22.5% |
| Mexican | 50 | 20.4% | View All 3 Rows |
Immigrants in Shannon
The most numerous immigrant groups reported in Shannon came from Central America (31 | 12.7%), Latin America (31 | 12.7%), and Mexico (31 | 12.7%), together accounting for 38.0% of all Shannon residents.
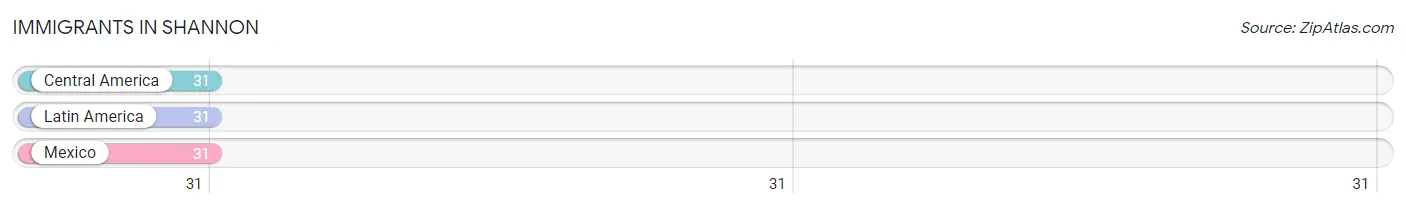
| Immigration Origin | # Population | % Population |
| Central America | 31 | 12.7% |
| Latin America | 31 | 12.7% |
| Mexico | 31 | 12.7% | View All 3 Rows |
Sex and Age in Shannon
Sex and Age in Shannon
The most populous age groups in Shannon are 65 to 69 Years (65 | 49.2%) for men and 45 to 49 Years (65 | 57.5%) for women.
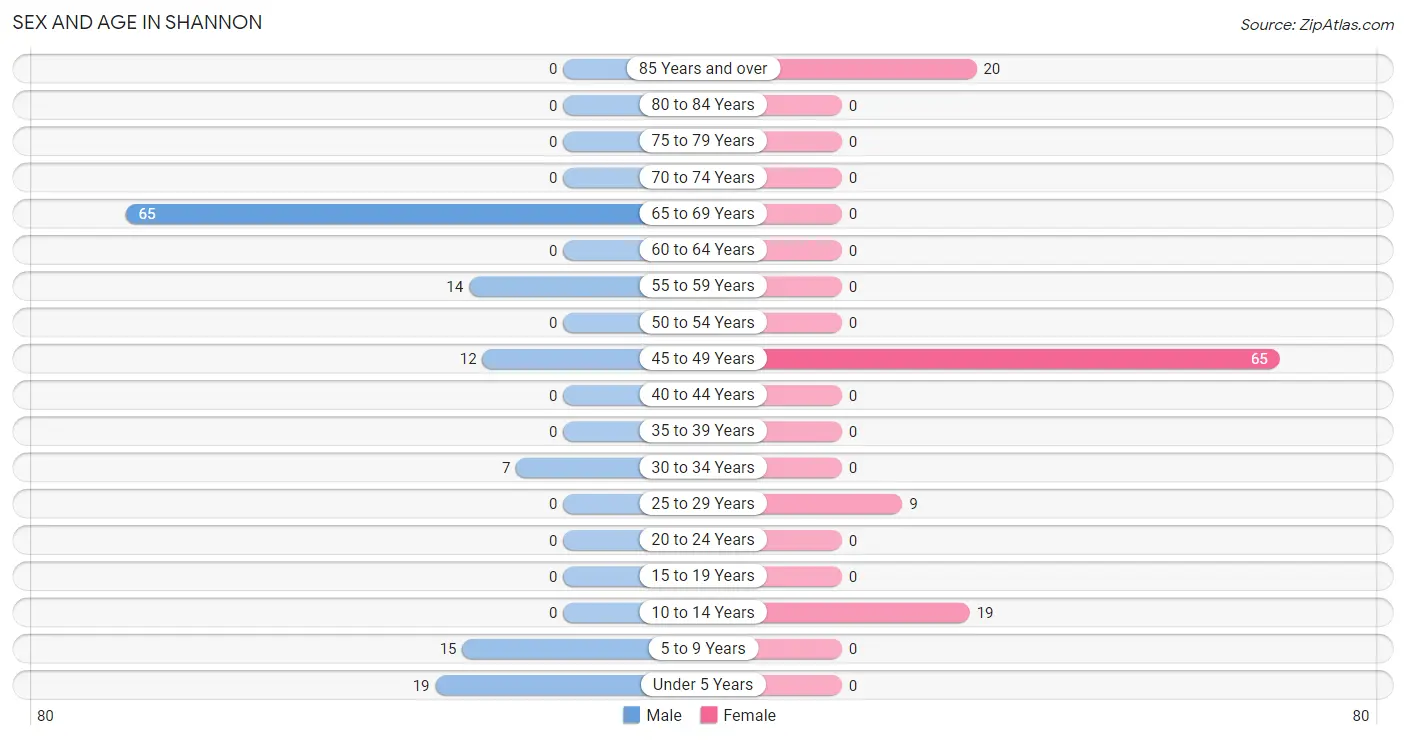
| Age Bracket | Male | Female |
| Under 5 Years | 19 (14.4%) | 0 (0.0%) |
| 5 to 9 Years | 15 (11.4%) | 0 (0.0%) |
| 10 to 14 Years | 0 (0.0%) | 19 (16.8%) |
| 15 to 19 Years | 0 (0.0%) | 0 (0.0%) |
| 20 to 24 Years | 0 (0.0%) | 0 (0.0%) |
| 25 to 29 Years | 0 (0.0%) | 9 (8.0%) |
| 30 to 34 Years | 7 (5.3%) | 0 (0.0%) |
| 35 to 39 Years | 0 (0.0%) | 0 (0.0%) |
| 40 to 44 Years | 0 (0.0%) | 0 (0.0%) |
| 45 to 49 Years | 12 (9.1%) | 65 (57.5%) |
| 50 to 54 Years | 0 (0.0%) | 0 (0.0%) |
| 55 to 59 Years | 14 (10.6%) | 0 (0.0%) |
| 60 to 64 Years | 0 (0.0%) | 0 (0.0%) |
| 65 to 69 Years | 65 (49.2%) | 0 (0.0%) |
| 70 to 74 Years | 0 (0.0%) | 0 (0.0%) |
| 75 to 79 Years | 0 (0.0%) | 0 (0.0%) |
| 80 to 84 Years | 0 (0.0%) | 0 (0.0%) |
| 85 Years and over | 0 (0.0%) | 20 (17.7%) |
| Total | 132 (100.0%) | 113 (100.0%) |
Families and Households in Shannon
Median Family Size in Shannon
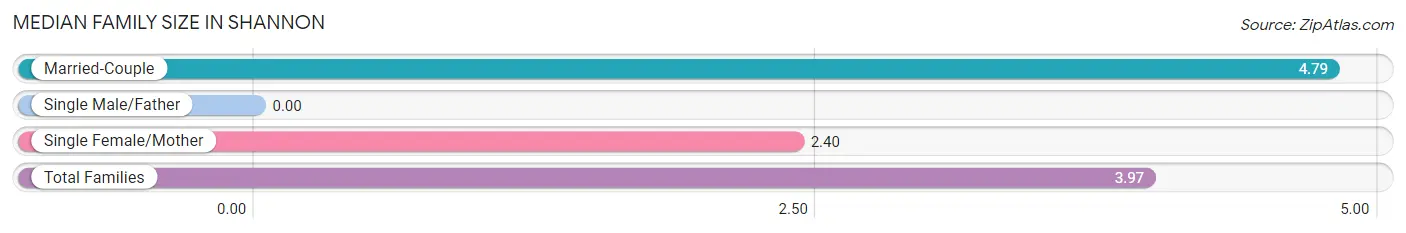
| Family Type | # Families | Family Size |
| Married-Couple | 19 (65.5%) | 4.79 |
| Single Male/Father | 0 (0.0%) | - |
| Single Female/Mother | 10 (34.5%) | 2.40 |
| Total Families | 29 (100.0%) | 3.97 |
Median Household Size in Shannon
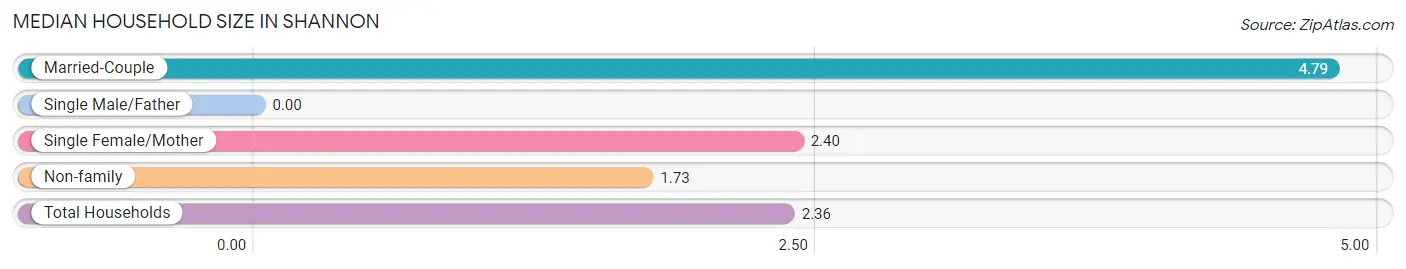
| Household Type | # Households | Household Size |
| Married-Couple | 19 (18.3%) | 4.79 |
| Single Male/Father | 0 (0.0%) | - |
| Single Female/Mother | 10 (9.6%) | 2.40 |
| Non-family | 75 (72.1%) | 1.73 |
| Total Households | 104 (100.0%) | 2.36 |
Household Size by Marriage Status in Shannon
Out of a total of 104 households in Shannon, 29 (27.9%) are family households, while 75 (72.1%) are nonfamily households. The most numerous type of family households are 4-person households, comprising 19, and the most common type of nonfamily households are 2-person households, comprising 55.

| Household Size | Family Households | Nonfamily Households |
| 1-Person Households | - | 20 (19.2%) |
| 2-Person Households | 10 (9.6%) | 55 (52.9%) |
| 3-Person Households | 0 (0.0%) | 0 (0.0%) |
| 4-Person Households | 19 (18.3%) | 0 (0.0%) |
| 5-Person Households | 0 (0.0%) | 0 (0.0%) |
| 6-Person Households | 0 (0.0%) | 0 (0.0%) |
| 7+ Person Households | 0 (0.0%) | 0 (0.0%) |
| Total | 29 (27.9%) | 75 (72.1%) |
Female Fertility in Shannon
Fertility by Age in Shannon
| Age Bracket | Women with Births | Births / 1,000 Women |
| 15 to 19 years | 0 (0.0%) | 0.0 |
| 20 to 34 years | 0 (0.0%) | 0.0 |
| 35 to 50 years | 0 (0.0%) | 0.0 |
| Total | 0 (0.0%) | 0.0 |
Fertility by Age by Marriage Status in Shannon
| Age Bracket | Married | Unmarried |
| 15 to 19 years | 0 (0.0%) | 0 (0.0%) |
| 20 to 34 years | 0 (0.0%) | 0 (0.0%) |
| 35 to 50 years | 0 (0.0%) | 0 (0.0%) |
| Total | 0 (0.0%) | 0 (0.0%) |
Fertility by Education in Shannon
| Educational Attainment | Women with Births | Births / 1,000 Women |
| Less than High School | 0 (0.0%) | 0.0 |
| High School Diploma | 0 (0.0%) | 0.0 |
| College or Associate's Degree | 0 (0.0%) | 0.0 |
| Bachelor's Degree | 0 (0.0%) | 0.0 |
| Graduate Degree | 0 (0.0%) | 0.0 |
| Total | 0 (0.0%) | 0.0 |
Fertility by Education by Marriage Status in Shannon
| Educational Attainment | Married | Unmarried |
| Less than High School | 0 (0.0%) | 0 (0.0%) |
| High School Diploma | 0 (0.0%) | 0 (0.0%) |
| College or Associate's Degree | 0 (0.0%) | 0 (0.0%) |
| Bachelor's Degree | 0 (0.0%) | 0 (0.0%) |
| Graduate Degree | 0 (0.0%) | 0 (0.0%) |
| Total | 0 (0.0%) | 0 (0.0%) |
Employment Characteristics in Shannon
Employment by Class of Employer in Shannon
Among the 84 employed individuals in Shannon, private company employees (74 | 88.1%), and not-for-profit organizations (10 | 11.9%) make up the most common classes of employment.
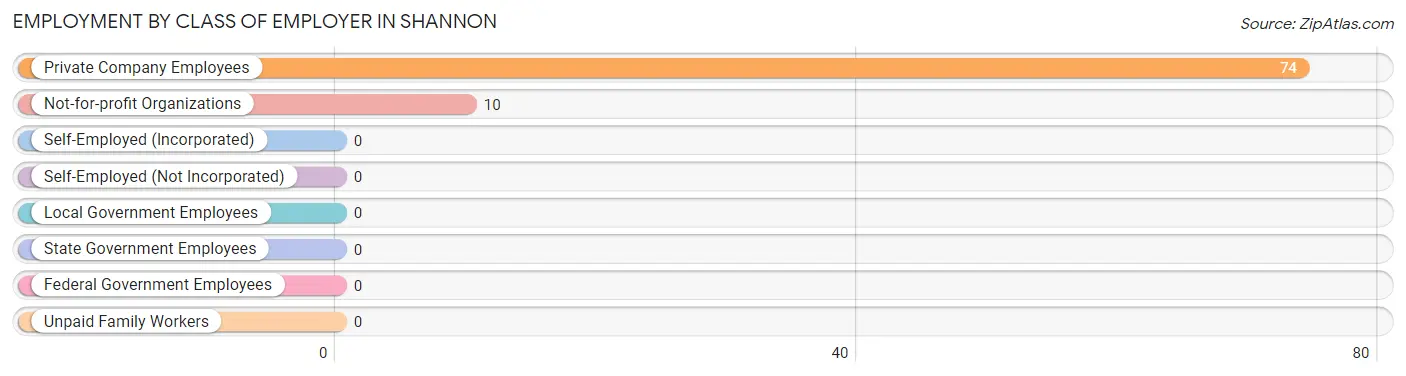
| Employer Class | # Employees | % Employees |
| Private Company Employees | 74 | 88.1% |
| Self-Employed (Incorporated) | 0 | 0.0% |
| Self-Employed (Not Incorporated) | 0 | 0.0% |
| Not-for-profit Organizations | 10 | 11.9% |
| Local Government Employees | 0 | 0.0% |
| State Government Employees | 0 | 0.0% |
| Federal Government Employees | 0 | 0.0% |
| Unpaid Family Workers | 0 | 0.0% |
| Total | 84 | 100.0% |
Employment Status by Age in Shannon
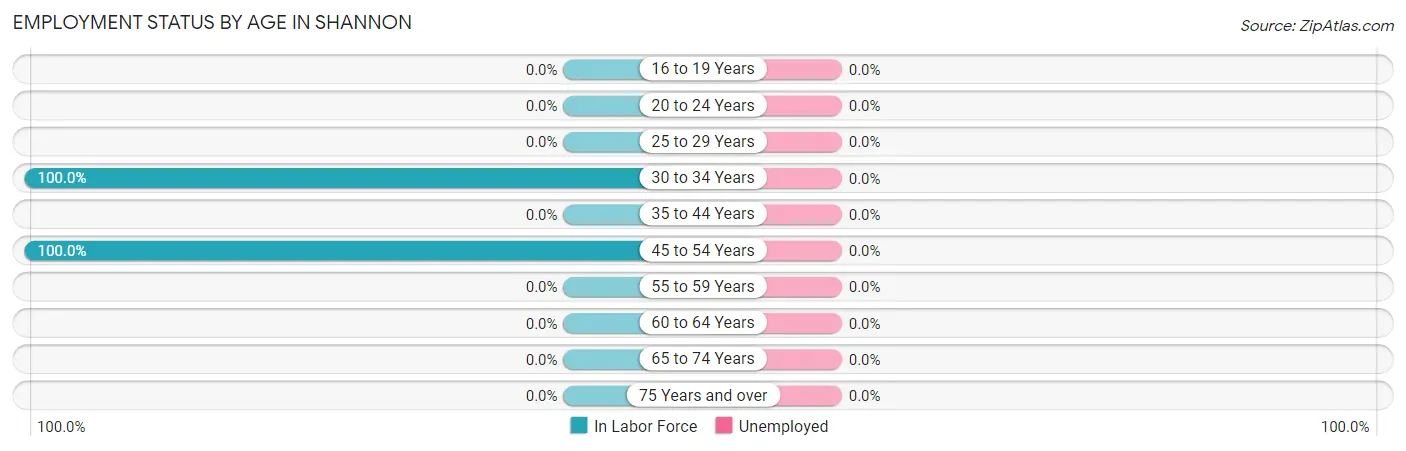
| Age Bracket | In Labor Force | Unemployed |
| 16 to 19 Years | 0 (0.0%) | 0 (0.0%) |
| 20 to 24 Years | 0 (0.0%) | 0 (0.0%) |
| 25 to 29 Years | 0 (0.0%) | 0 (0.0%) |
| 30 to 34 Years | 7 (100.0%) | 0 (0.0%) |
| 35 to 44 Years | 0 (0.0%) | 0 (0.0%) |
| 45 to 54 Years | 77 (100.0%) | 0 (0.0%) |
| 55 to 59 Years | 0 (0.0%) | 0 (0.0%) |
| 60 to 64 Years | 0 (0.0%) | 0 (0.0%) |
| 65 to 74 Years | 0 (0.0%) | 0 (0.0%) |
| 75 Years and over | 0 (0.0%) | 0 (0.0%) |
| Total | 84 (43.8%) | 0 (0.0%) |
Employment Status by Educational Attainment in Shannon
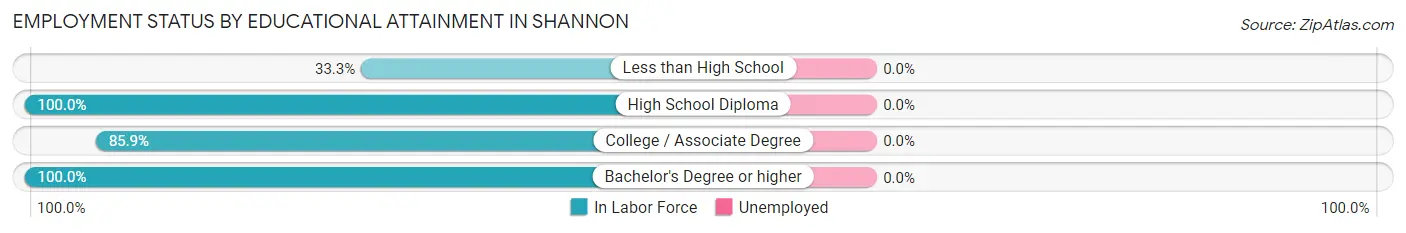
| Educational Attainment | In Labor Force | Unemployed |
| Less than High School | 7 (33.3%) | 0 (0.0%) |
| High School Diploma | 12 (100.0%) | 0 (0.0%) |
| College / Associate Degree | 55 (85.9%) | 0 (0.0%) |
| Bachelor's Degree or higher | 10 (100.0%) | 0 (0.0%) |
| Total | 84 (78.5%) | 0 (0.0%) |
Employment Occupations by Sex in Shannon
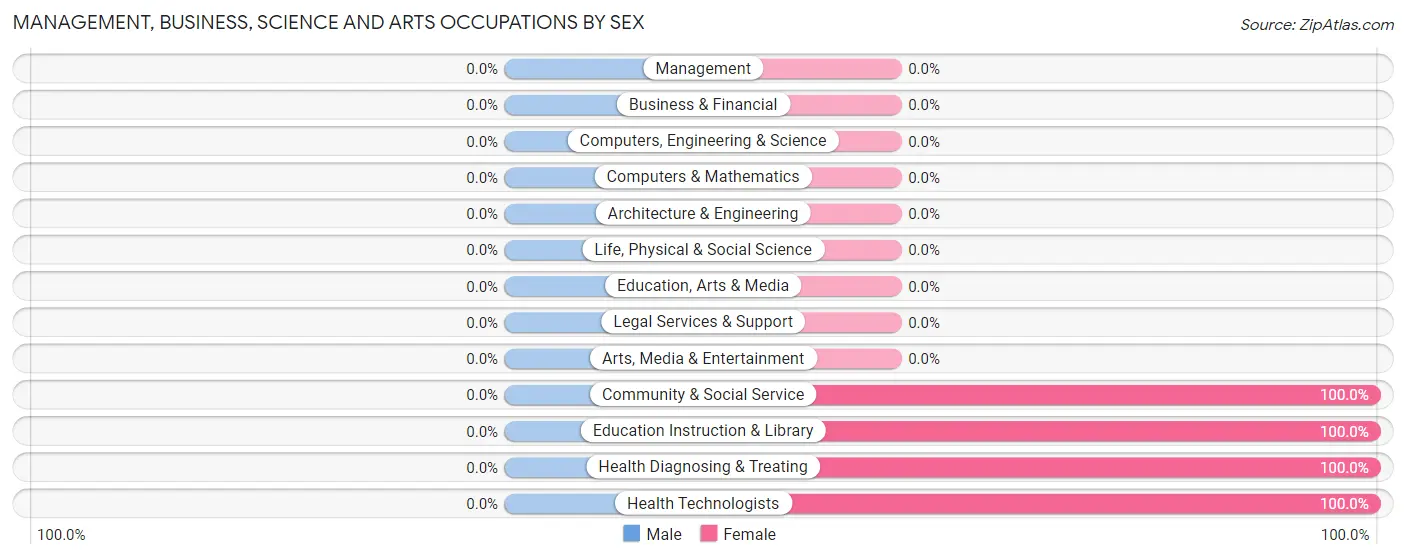
Management, Business, Science and Arts Occupations
The most common Management, Business, Science and Arts occupations in Shannon are Community & Social Service (55 | 65.5%), Education Instruction & Library (55 | 65.5%), Health Diagnosing & Treating (10 | 11.9%), and Health Technologists (10 | 11.9%).
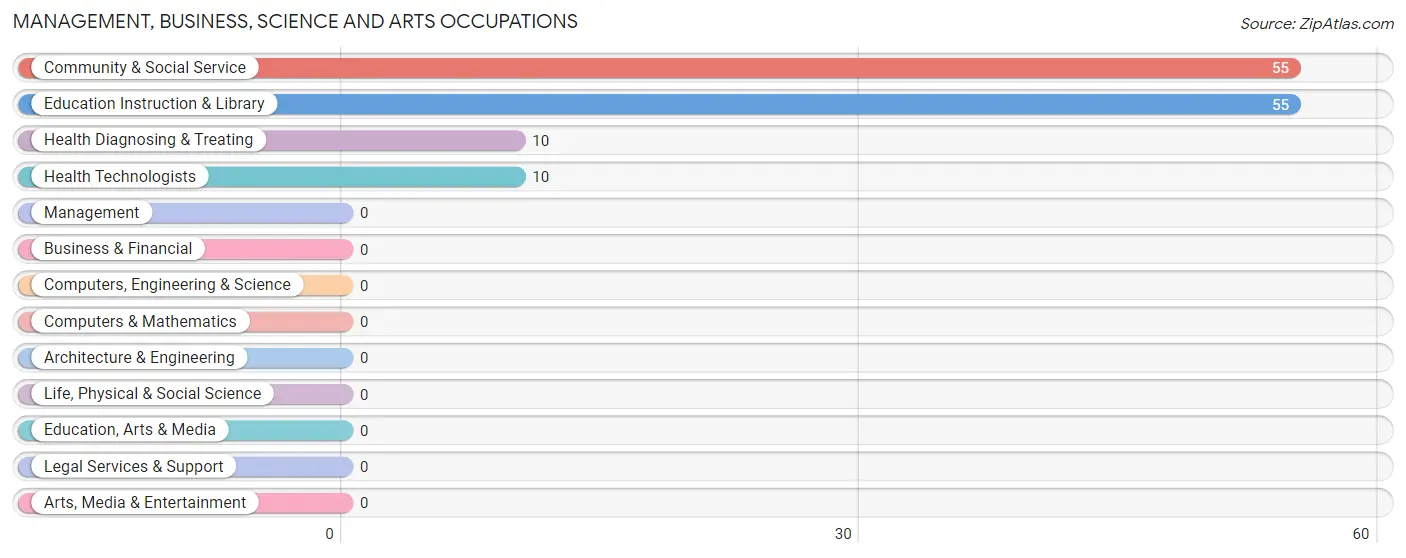
Management, Business, Science and Arts Occupations by Sex
| Occupation | Male | Female |
| Management | 0 (0.0%) | 0 (0.0%) |
| Business & Financial | 0 (0.0%) | 0 (0.0%) |
| Computers, Engineering & Science | 0 (0.0%) | 0 (0.0%) |
| Computers & Mathematics | 0 (0.0%) | 0 (0.0%) |
| Architecture & Engineering | 0 (0.0%) | 0 (0.0%) |
| Life, Physical & Social Science | 0 (0.0%) | 0 (0.0%) |
| Community & Social Service | 0 (0.0%) | 55 (100.0%) |
| Education, Arts & Media | 0 (0.0%) | 0 (0.0%) |
| Legal Services & Support | 0 (0.0%) | 0 (0.0%) |
| Education Instruction & Library | 0 (0.0%) | 55 (100.0%) |
| Arts, Media & Entertainment | 0 (0.0%) | 0 (0.0%) |
| Health Diagnosing & Treating | 0 (0.0%) | 10 (100.0%) |
| Health Technologists | 0 (0.0%) | 10 (100.0%) |
| Total (Category) | 0 (0.0%) | 65 (100.0%) |
| Total (Overall) | 19 (22.6%) | 65 (77.4%) |
Services Occupations
The most common Services occupations in Shannon are , and Cleaning & Maintenance (7 | 8.3%).
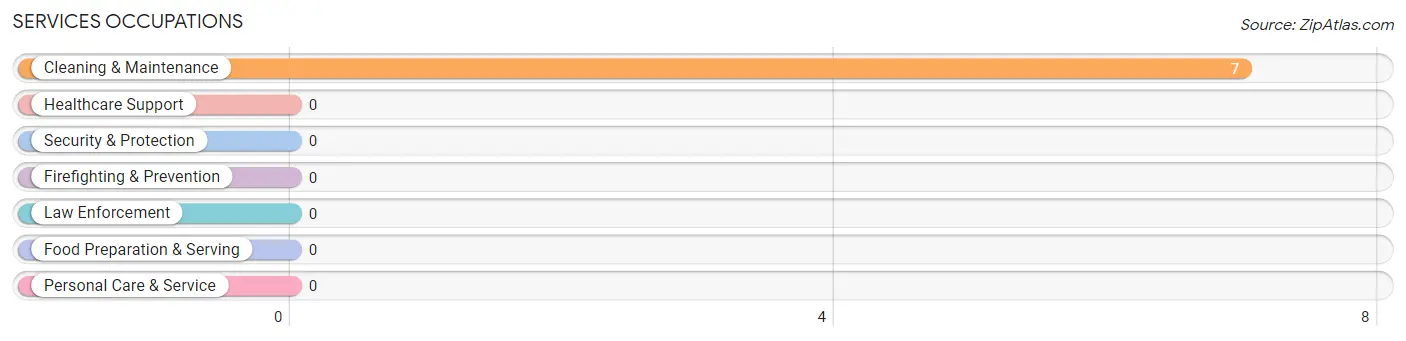
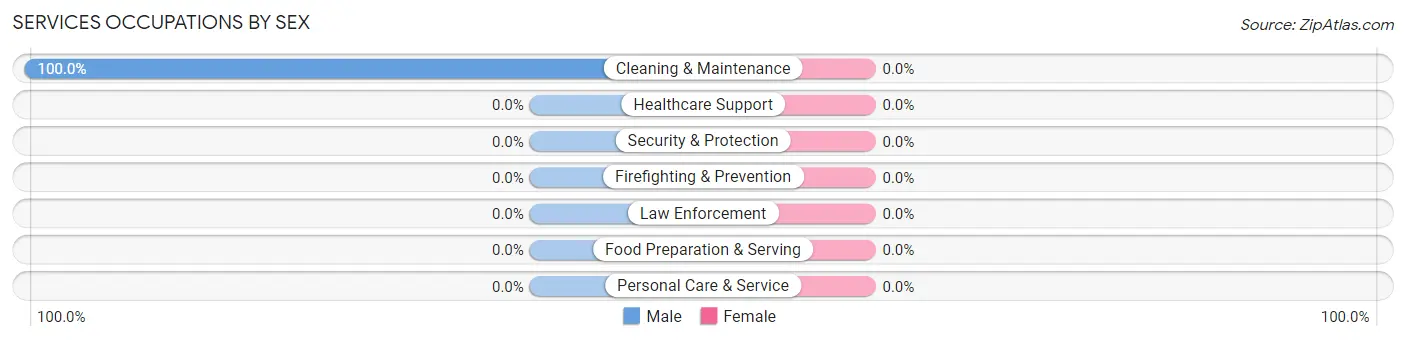
Services Occupations by Sex
| Occupation | Male | Female |
| Healthcare Support | 0 (0.0%) | 0 (0.0%) |
| Security & Protection | 0 (0.0%) | 0 (0.0%) |
| Firefighting & Prevention | 0 (0.0%) | 0 (0.0%) |
| Law Enforcement | 0 (0.0%) | 0 (0.0%) |
| Food Preparation & Serving | 0 (0.0%) | 0 (0.0%) |
| Cleaning & Maintenance | 7 (100.0%) | 0 (0.0%) |
| Personal Care & Service | 0 (0.0%) | 0 (0.0%) |
| Total (Category) | 7 (100.0%) | 0 (0.0%) |
| Total (Overall) | 19 (22.6%) | 65 (77.4%) |
Sales and Office Occupations
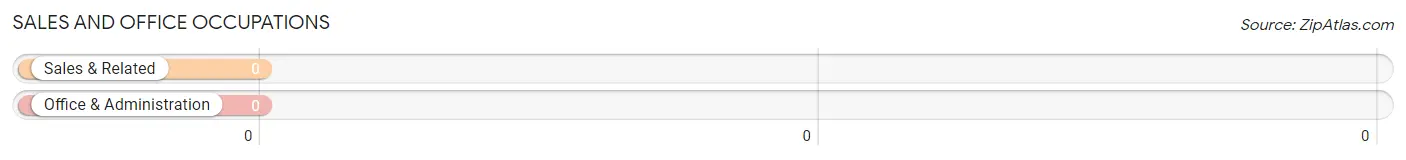
Sales and Office Occupations by Sex
| Occupation | Male | Female |
| Sales & Related | 0 (0.0%) | 0 (0.0%) |
| Office & Administration | 0 (0.0%) | 0 (0.0%) |
| Total (Category) | 0 (0.0%) | 0 (0.0%) |
| Total (Overall) | 19 (22.6%) | 65 (77.4%) |
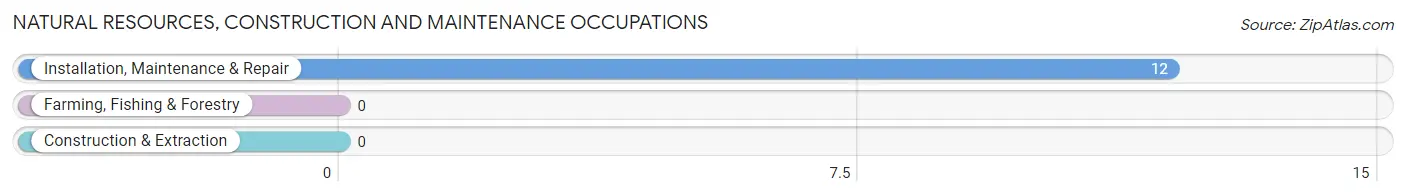
Natural Resources, Construction and Maintenance Occupations
The most common Natural Resources, Construction and Maintenance occupations in Shannon are , and Installation, Maintenance & Repair (12 | 14.3%).
Natural Resources, Construction and Maintenance Occupations by Sex
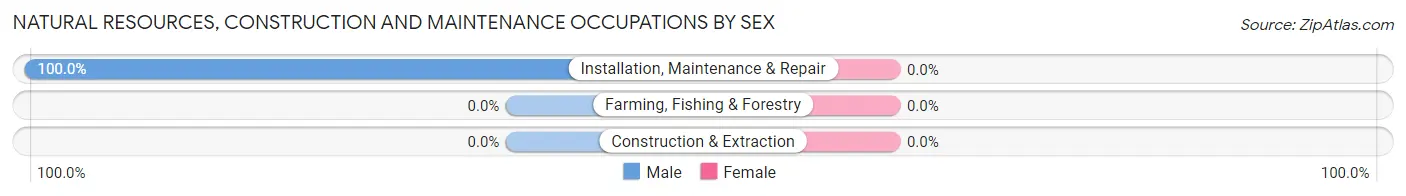
| Occupation | Male | Female |
| Farming, Fishing & Forestry | 0 (0.0%) | 0 (0.0%) |
| Construction & Extraction | 0 (0.0%) | 0 (0.0%) |
| Installation, Maintenance & Repair | 12 (100.0%) | 0 (0.0%) |
| Total (Category) | 12 (100.0%) | 0 (0.0%) |
| Total (Overall) | 19 (22.6%) | 65 (77.4%) |
Production, Transportation and Moving Occupations
Production, Transportation and Moving Occupations by Sex
| Occupation | Male | Female |
| Production | 0 (0.0%) | 0 (0.0%) |
| Transportation | 0 (0.0%) | 0 (0.0%) |
| Material Moving | 0 (0.0%) | 0 (0.0%) |
| Total (Category) | 0 (0.0%) | 0 (0.0%) |
| Total (Overall) | 19 (22.6%) | 65 (77.4%) |
Employment Industries by Sex in Shannon
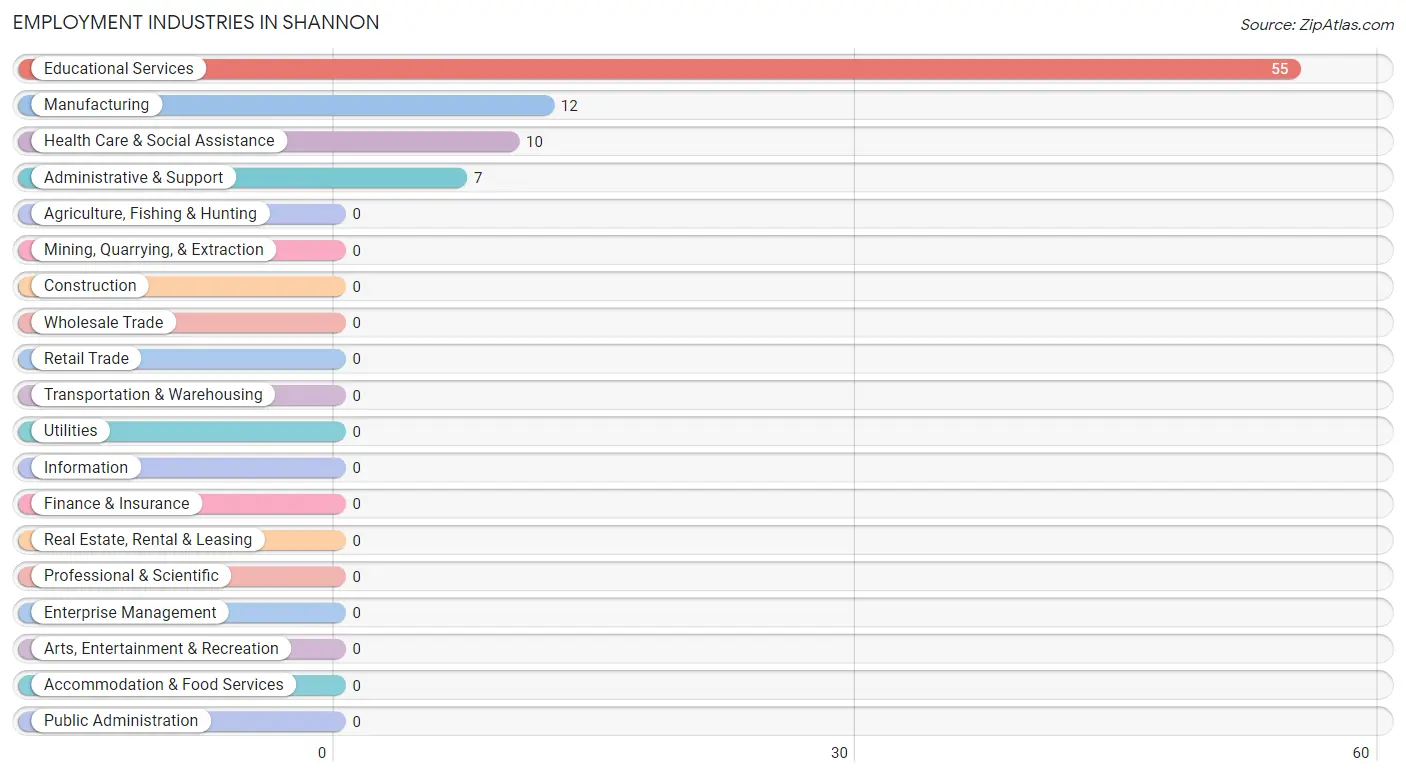
Employment Industries in Shannon
The major employment industries in Shannon include Educational Services (55 | 65.5%), Manufacturing (12 | 14.3%), Health Care & Social Assistance (10 | 11.9%), and Administrative & Support (7 | 8.3%).
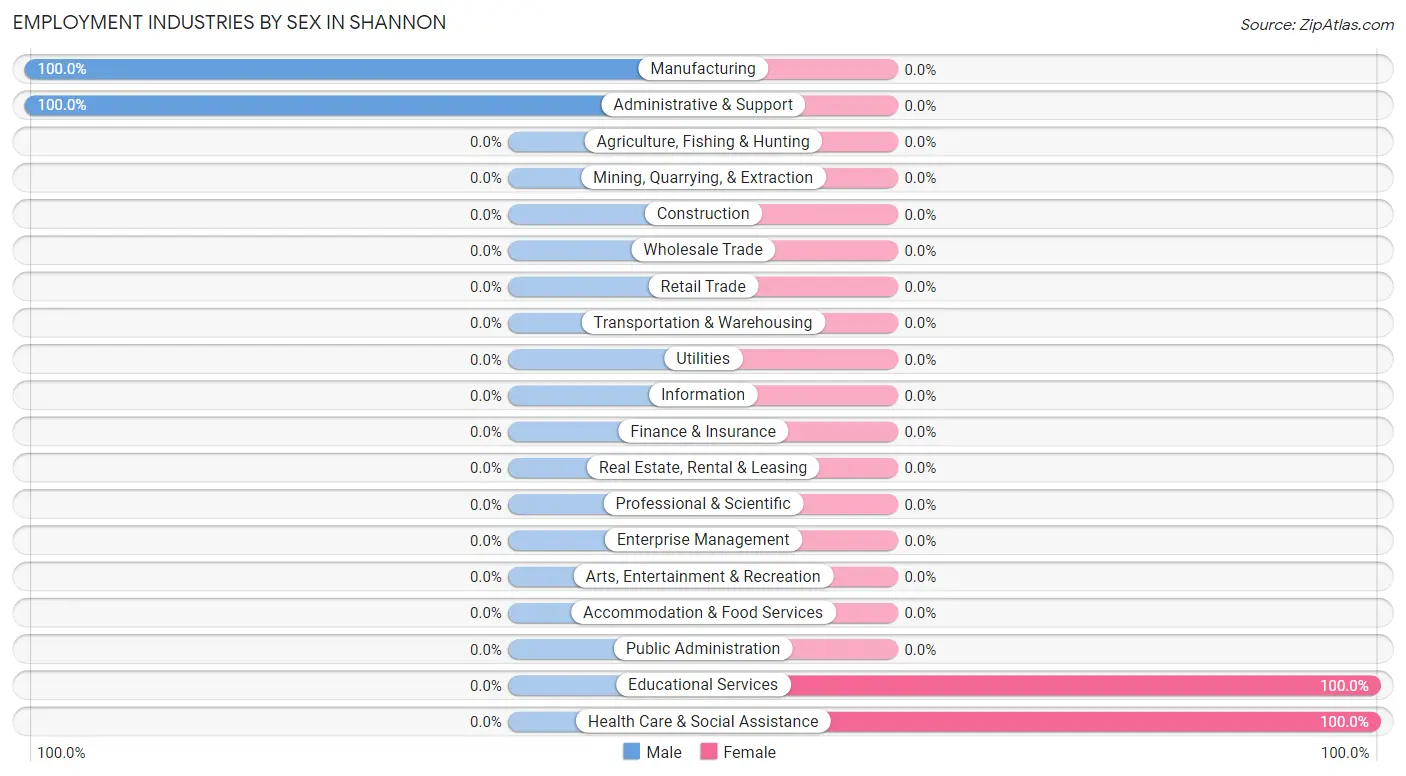
Employment Industries by Sex in Shannon
The Shannon industries that see more men than women are Manufacturing (100.0%), and Administrative & Support (100.0%), whereas the industries that tend to have a higher number of women are Educational Services (100.0%), and Health Care & Social Assistance (100.0%).
| Industry | Male | Female |
| Agriculture, Fishing & Hunting | 0 (0.0%) | 0 (0.0%) |
| Mining, Quarrying, & Extraction | 0 (0.0%) | 0 (0.0%) |
| Construction | 0 (0.0%) | 0 (0.0%) |
| Manufacturing | 12 (100.0%) | 0 (0.0%) |
| Wholesale Trade | 0 (0.0%) | 0 (0.0%) |
| Retail Trade | 0 (0.0%) | 0 (0.0%) |
| Transportation & Warehousing | 0 (0.0%) | 0 (0.0%) |
| Utilities | 0 (0.0%) | 0 (0.0%) |
| Information | 0 (0.0%) | 0 (0.0%) |
| Finance & Insurance | 0 (0.0%) | 0 (0.0%) |
| Real Estate, Rental & Leasing | 0 (0.0%) | 0 (0.0%) |
| Professional & Scientific | 0 (0.0%) | 0 (0.0%) |
| Enterprise Management | 0 (0.0%) | 0 (0.0%) |
| Administrative & Support | 7 (100.0%) | 0 (0.0%) |
| Educational Services | 0 (0.0%) | 55 (100.0%) |
| Health Care & Social Assistance | 0 (0.0%) | 10 (100.0%) |
| Arts, Entertainment & Recreation | 0 (0.0%) | 0 (0.0%) |
| Accommodation & Food Services | 0 (0.0%) | 0 (0.0%) |
| Public Administration | 0 (0.0%) | 0 (0.0%) |
| Total | 19 (22.6%) | 65 (77.4%) |
Education in Shannon
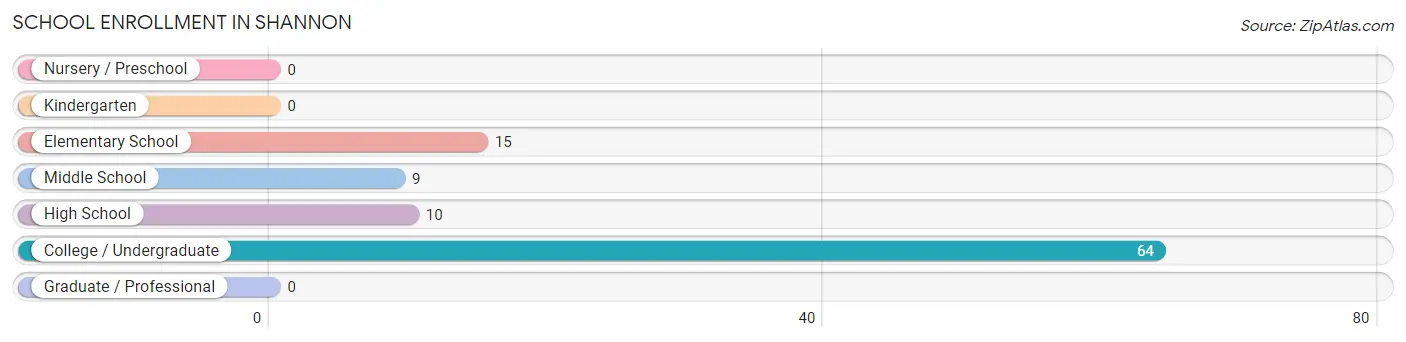
School Enrollment in Shannon
The most common levels of schooling among the 98 students in Shannon are college / undergraduate (64 | 65.3%), elementary school (15 | 15.3%), and high school (10 | 10.2%).
| School Level | # Students | % Students |
| Nursery / Preschool | 0 | 0.0% |
| Kindergarten | 0 | 0.0% |
| Elementary School | 15 | 15.3% |
| Middle School | 9 | 9.2% |
| High School | 10 | 10.2% |
| College / Undergraduate | 64 | 65.3% |
| Graduate / Professional | 0 | 0.0% |
| Total | 98 | 100.0% |
School Enrollment by Age by Funding Source in Shannon
Out of a total of 98 students who are enrolled in schools in Shannon, 55 (56.1%) attend a private institution, while the remaining 43 (43.9%) are enrolled in public schools. The age group of 35 years and over has the highest likelihood of being enrolled in private schools, with 55 (100.0% in the age bracket) enrolled. Conversely, the age group of 5 to 9 year old has the lowest likelihood of being enrolled in a private school, with 15 (100.0% in the age bracket) attending a public institution.
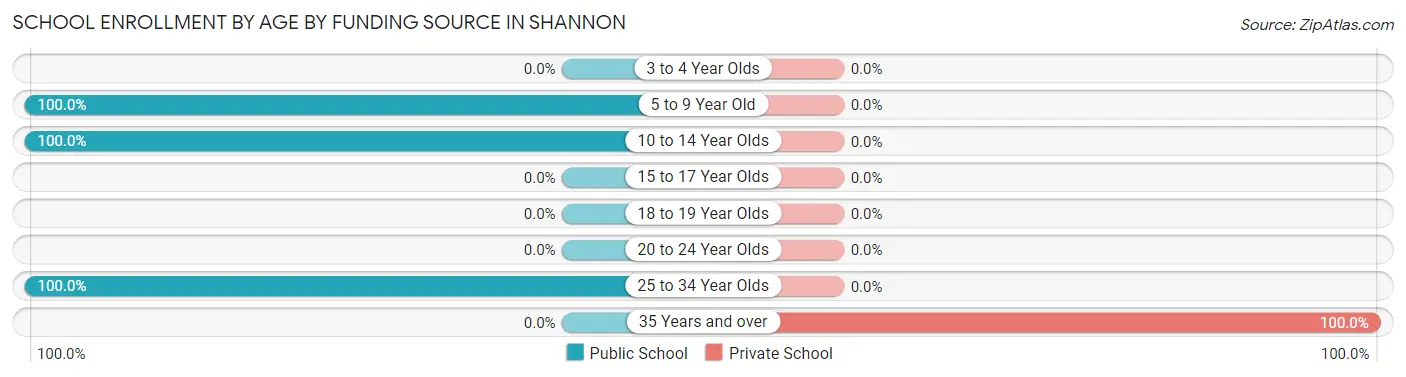
| Age Bracket | Public School | Private School |
| 3 to 4 Year Olds | 0 (0.0%) | 0 (0.0%) |
| 5 to 9 Year Old | 15 (100.0%) | 0 (0.0%) |
| 10 to 14 Year Olds | 19 (100.0%) | 0 (0.0%) |
| 15 to 17 Year Olds | 0 (0.0%) | 0 (0.0%) |
| 18 to 19 Year Olds | 0 (0.0%) | 0 (0.0%) |
| 20 to 24 Year Olds | 0 (0.0%) | 0 (0.0%) |
| 25 to 34 Year Olds | 9 (100.0%) | 0 (0.0%) |
| 35 Years and over | 0 (0.0%) | 55 (100.0%) |
| Total | 43 (43.9%) | 55 (56.1%) |
Educational Attainment by Field of Study in Shannon
, and science & technology (10 | 100.0%) are the most common fields of study among 10 individuals in Shannon who have obtained a bachelor's degree or higher.
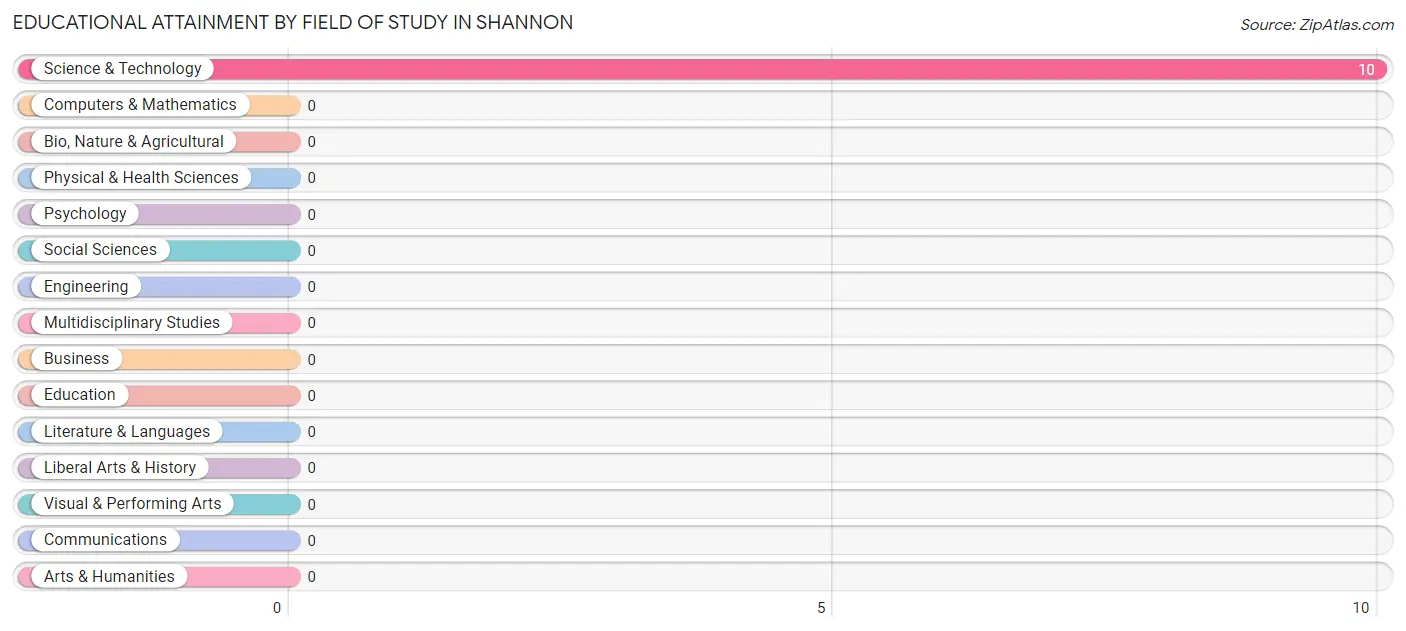
| Field of Study | # Graduates | % Graduates |
| Computers & Mathematics | 0 | 0.0% |
| Bio, Nature & Agricultural | 0 | 0.0% |
| Physical & Health Sciences | 0 | 0.0% |
| Psychology | 0 | 0.0% |
| Social Sciences | 0 | 0.0% |
| Engineering | 0 | 0.0% |
| Multidisciplinary Studies | 0 | 0.0% |
| Science & Technology | 10 | 100.0% |
| Business | 0 | 0.0% |
| Education | 0 | 0.0% |
| Literature & Languages | 0 | 0.0% |
| Liberal Arts & History | 0 | 0.0% |
| Visual & Performing Arts | 0 | 0.0% |
| Communications | 0 | 0.0% |
| Arts & Humanities | 0 | 0.0% |
| Total | 10 | 100.0% |
Transportation & Commute in Shannon
Vehicle Availability by Sex in Shannon
The most prevalent vehicle ownership categories in Shannon are males with 3 vehicles (19, accounting for 100.0%) and females with 3 vehicles (10, making up 29.2%).
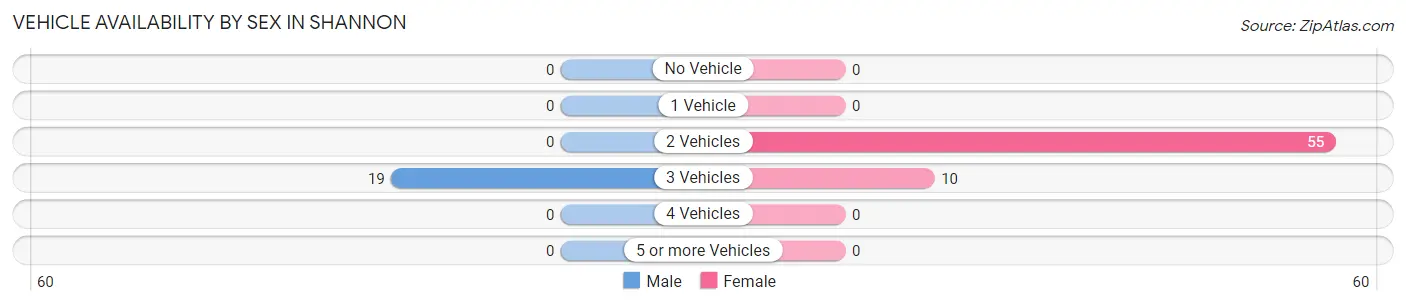
| Vehicles Available | Male | Female |
| No Vehicle | 0 (0.0%) | 0 (0.0%) |
| 1 Vehicle | 0 (0.0%) | 0 (0.0%) |
| 2 Vehicles | 0 (0.0%) | 55 (84.6%) |
| 3 Vehicles | 19 (100.0%) | 10 (15.4%) |
| 4 Vehicles | 0 (0.0%) | 0 (0.0%) |
| 5 or more Vehicles | 0 (0.0%) | 0 (0.0%) |
| Total | 19 (100.0%) | 65 (100.0%) |
Commute Time in Shannon
The most frequently occuring commute durations in Shannon are 20 to 24 minutes (62 commuters, 73.8%), 40 to 44 minutes (12 commuters, 14.3%), and 30 to 34 minutes (10 commuters, 11.9%).
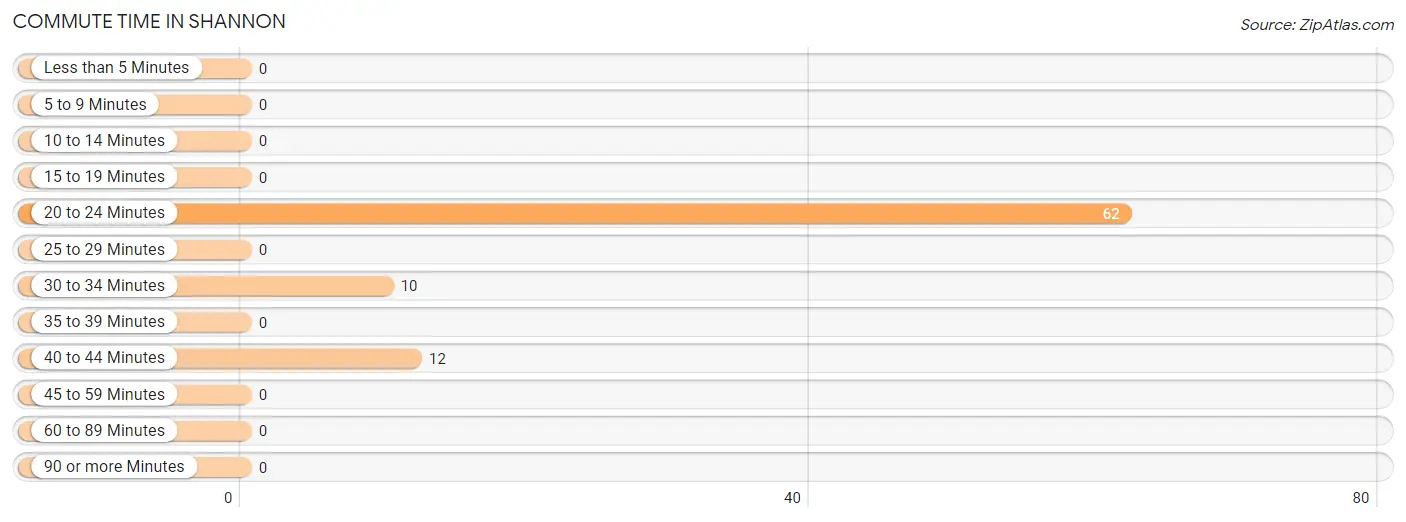
| Commute Time | # Commuters | % Commuters |
| Less than 5 Minutes | 0 | 0.0% |
| 5 to 9 Minutes | 0 | 0.0% |
| 10 to 14 Minutes | 0 | 0.0% |
| 15 to 19 Minutes | 0 | 0.0% |
| 20 to 24 Minutes | 62 | 73.8% |
| 25 to 29 Minutes | 0 | 0.0% |
| 30 to 34 Minutes | 10 | 11.9% |
| 35 to 39 Minutes | 0 | 0.0% |
| 40 to 44 Minutes | 12 | 14.3% |
| 45 to 59 Minutes | 0 | 0.0% |
| 60 to 89 Minutes | 0 | 0.0% |
| 90 or more Minutes | 0 | 0.0% |
Commute Time by Sex in Shannon
The most common commute times in Shannon are 40 to 44 minutes (12 commuters, 63.2%) for males and 20 to 24 minutes (55 commuters, 84.6%) for females.
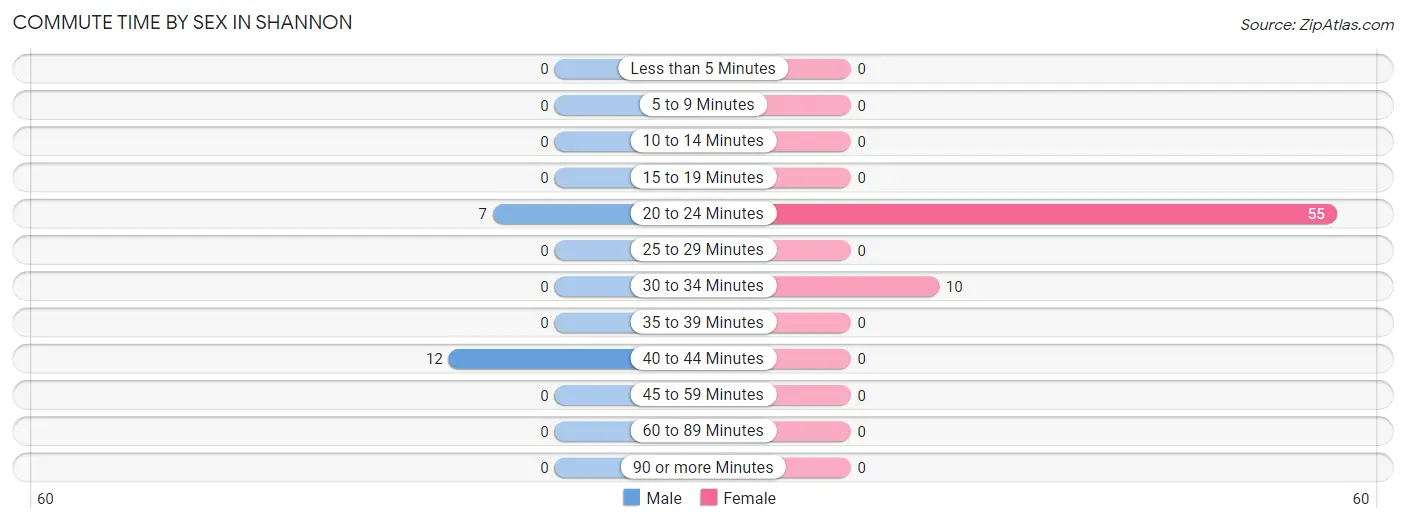
| Commute Time | Male | Female |
| Less than 5 Minutes | 0 (0.0%) | 0 (0.0%) |
| 5 to 9 Minutes | 0 (0.0%) | 0 (0.0%) |
| 10 to 14 Minutes | 0 (0.0%) | 0 (0.0%) |
| 15 to 19 Minutes | 0 (0.0%) | 0 (0.0%) |
| 20 to 24 Minutes | 7 (36.8%) | 55 (84.6%) |
| 25 to 29 Minutes | 0 (0.0%) | 0 (0.0%) |
| 30 to 34 Minutes | 0 (0.0%) | 10 (15.4%) |
| 35 to 39 Minutes | 0 (0.0%) | 0 (0.0%) |
| 40 to 44 Minutes | 12 (63.2%) | 0 (0.0%) |
| 45 to 59 Minutes | 0 (0.0%) | 0 (0.0%) |
| 60 to 89 Minutes | 0 (0.0%) | 0 (0.0%) |
| 90 or more Minutes | 0 (0.0%) | 0 (0.0%) |
Time of Departure to Work by Sex in Shannon
The most frequent times of departure to work in Shannon are 12:00 PM to 3:59 PM (12, 63.2%) for males and 6:30 AM to 6:59 AM (55, 84.6%) for females.
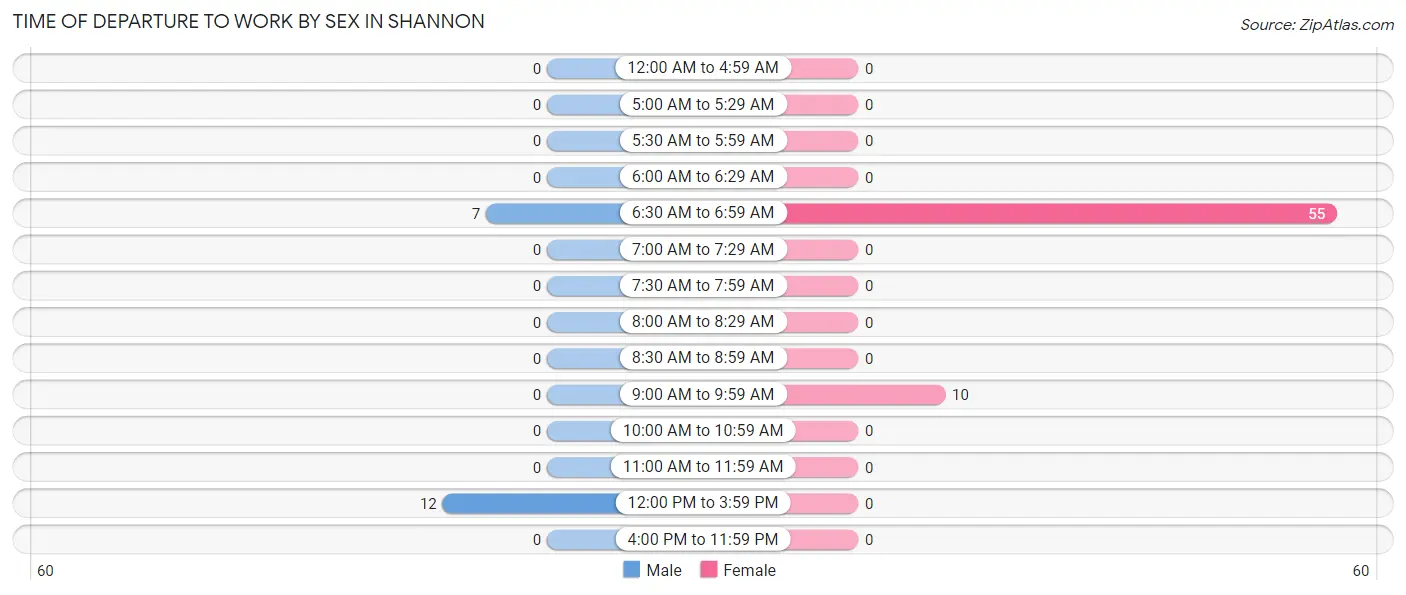
| Time of Departure | Male | Female |
| 12:00 AM to 4:59 AM | 0 (0.0%) | 0 (0.0%) |
| 5:00 AM to 5:29 AM | 0 (0.0%) | 0 (0.0%) |
| 5:30 AM to 5:59 AM | 0 (0.0%) | 0 (0.0%) |
| 6:00 AM to 6:29 AM | 0 (0.0%) | 0 (0.0%) |
| 6:30 AM to 6:59 AM | 7 (36.8%) | 55 (84.6%) |
| 7:00 AM to 7:29 AM | 0 (0.0%) | 0 (0.0%) |
| 7:30 AM to 7:59 AM | 0 (0.0%) | 0 (0.0%) |
| 8:00 AM to 8:29 AM | 0 (0.0%) | 0 (0.0%) |
| 8:30 AM to 8:59 AM | 0 (0.0%) | 0 (0.0%) |
| 9:00 AM to 9:59 AM | 0 (0.0%) | 10 (15.4%) |
| 10:00 AM to 10:59 AM | 0 (0.0%) | 0 (0.0%) |
| 11:00 AM to 11:59 AM | 0 (0.0%) | 0 (0.0%) |
| 12:00 PM to 3:59 PM | 12 (63.2%) | 0 (0.0%) |
| 4:00 PM to 11:59 PM | 0 (0.0%) | 0 (0.0%) |
| Total | 19 (100.0%) | 65 (100.0%) |
Housing Occupancy in Shannon
Occupancy by Ownership in Shannon
Of the total 104 dwellings in Shannon, owner-occupied units account for 104 (100.0%), while renter-occupied units make up 0 (0.0%).
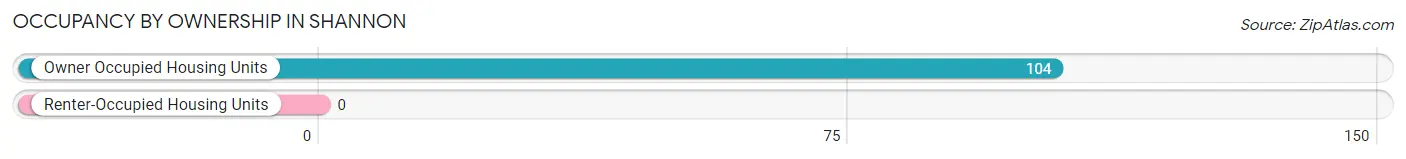
| Occupancy | # Housing Units | % Housing Units |
| Owner Occupied Housing Units | 104 | 100.0% |
| Renter-Occupied Housing Units | 0 | 0.0% |
| Total Occupied Housing Units | 104 | 100.0% |
Occupancy by Household Size in Shannon
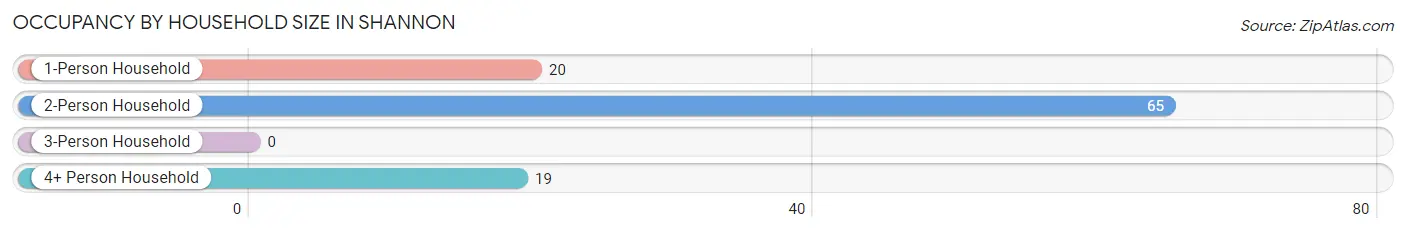
| Household Size | # Housing Units | % Housing Units |
| 1-Person Household | 20 | 19.2% |
| 2-Person Household | 65 | 62.5% |
| 3-Person Household | 0 | 0.0% |
| 4+ Person Household | 19 | 18.3% |
| Total Housing Units | 104 | 100.0% |
Occupancy by Ownership by Household Size in Shannon
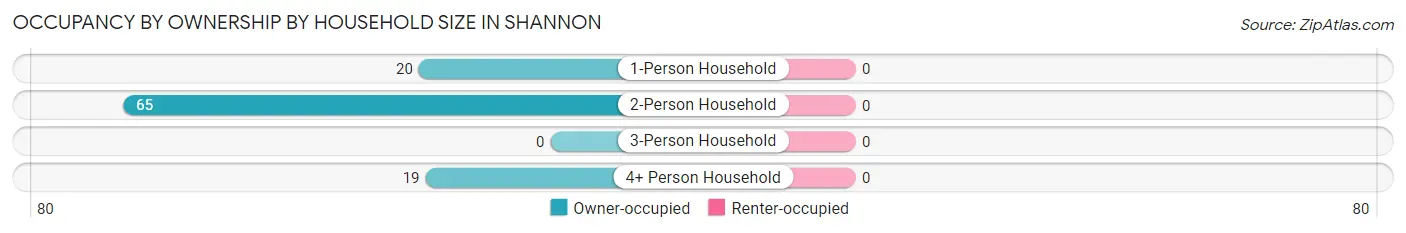
| Household Size | Owner-occupied | Renter-occupied |
| 1-Person Household | 20 (100.0%) | 0 (0.0%) |
| 2-Person Household | 65 (100.0%) | 0 (0.0%) |
| 3-Person Household | 0 (0.0%) | 0 (0.0%) |
| 4+ Person Household | 19 (100.0%) | 0 (0.0%) |
| Total Housing Units | 104 (100.0%) | 0 (0.0%) |
Occupancy by Educational Attainment in Shannon
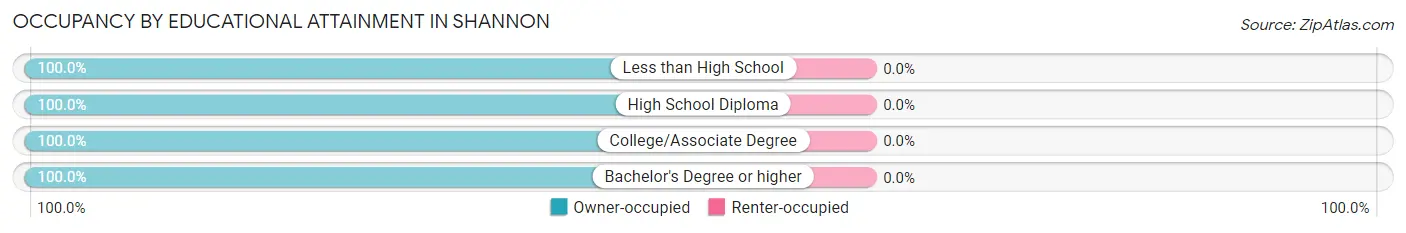
| Household Size | Owner-occupied | Renter-occupied |
| Less than High School | 10 (100.0%) | 0 (0.0%) |
| High School Diploma | 20 (100.0%) | 0 (0.0%) |
| College/Associate Degree | 64 (100.0%) | 0 (0.0%) |
| Bachelor's Degree or higher | 10 (100.0%) | 0 (0.0%) |
Occupancy by Age of Householder in Shannon
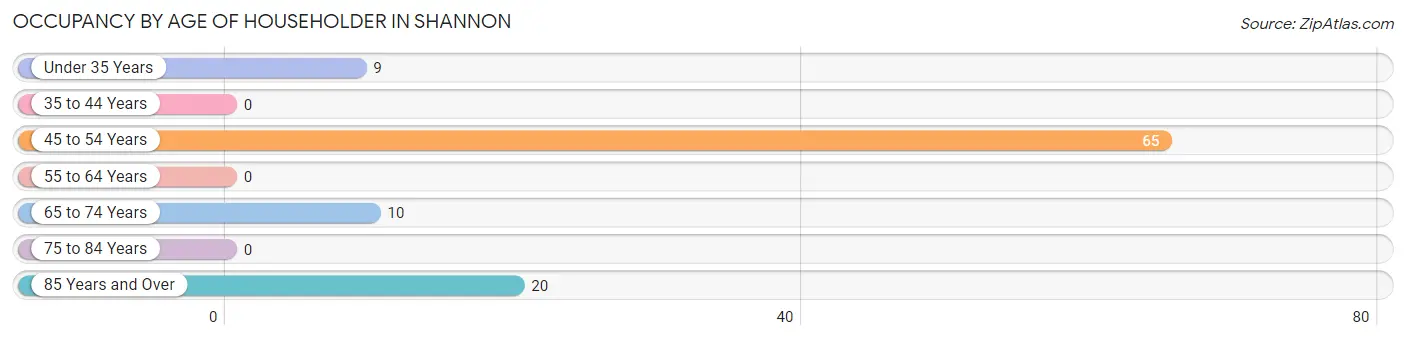
| Age Bracket | # Households | % Households |
| Under 35 Years | 9 | 8.6% |
| 35 to 44 Years | 0 | 0.0% |
| 45 to 54 Years | 65 | 62.5% |
| 55 to 64 Years | 0 | 0.0% |
| 65 to 74 Years | 10 | 9.6% |
| 75 to 84 Years | 0 | 0.0% |
| 85 Years and Over | 20 | 19.2% |
| Total | 104 | 100.0% |
Housing Finances in Shannon
Median Income by Occupancy in Shannon
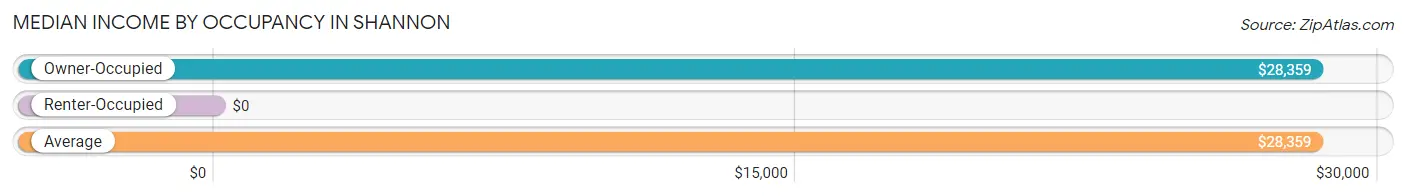
| Occupancy Type | # Households | Median Income |
| Owner-Occupied | 104 (100.0%) | $28,359 |
| Renter-Occupied | 0 (0.0%) | $0 |
| Average | 104 (100.0%) | $28,359 |
Occupancy by Householder Income Bracket in Shannon
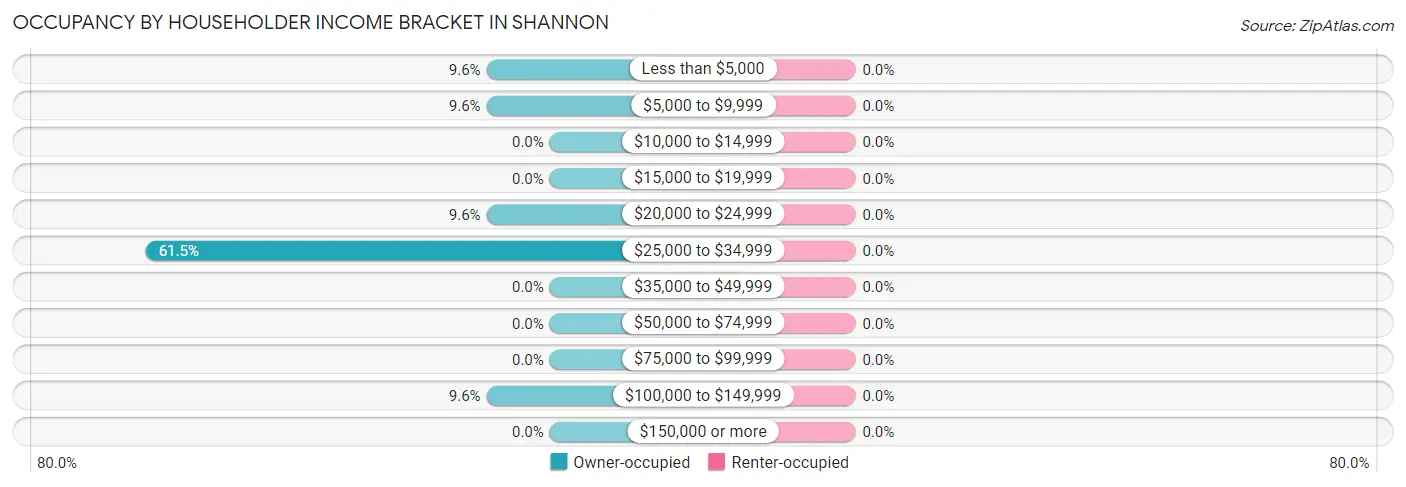
| Income Bracket | Owner-occupied | Renter-occupied |
| Less than $5,000 | 10 (9.6%) | 0 (0.0%) |
| $5,000 to $9,999 | 10 (9.6%) | 0 (0.0%) |
| $10,000 to $14,999 | 0 (0.0%) | 0 (0.0%) |
| $15,000 to $19,999 | 0 (0.0%) | 0 (0.0%) |
| $20,000 to $24,999 | 10 (9.6%) | 0 (0.0%) |
| $25,000 to $34,999 | 64 (61.5%) | 0 (0.0%) |
| $35,000 to $49,999 | 0 (0.0%) | 0 (0.0%) |
| $50,000 to $74,999 | 0 (0.0%) | 0 (0.0%) |
| $75,000 to $99,999 | 0 (0.0%) | 0 (0.0%) |
| $100,000 to $149,999 | 10 (9.6%) | 0 (0.0%) |
| $150,000 or more | 0 (0.0%) | 0 (0.0%) |
| Total | 104 (100.0%) | 0 (0.0%) |
Monthly Housing Cost Tiers in Shannon
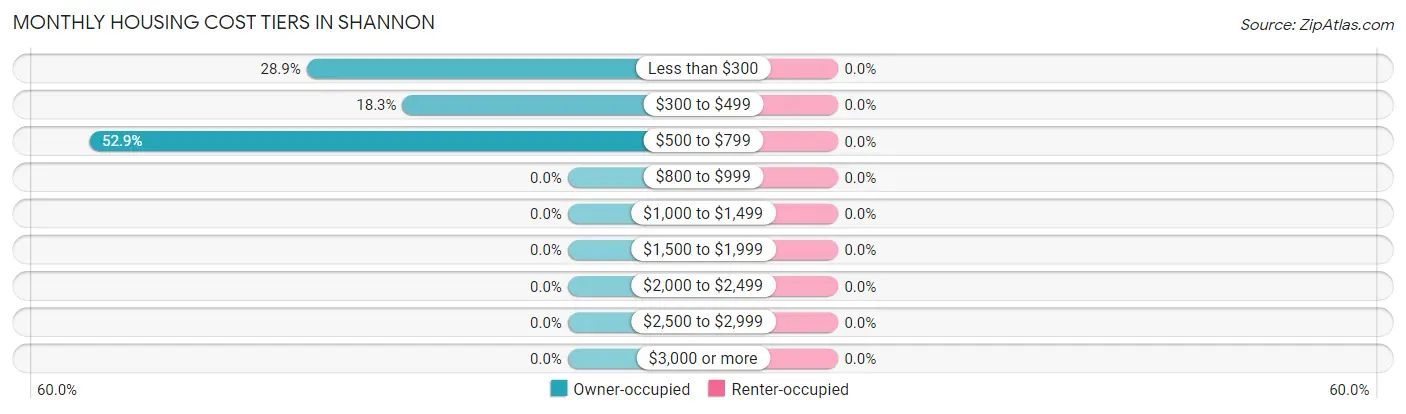
| Monthly Cost | Owner-occupied | Renter-occupied |
| Less than $300 | 30 (28.8%) | 0 (0.0%) |
| $300 to $499 | 19 (18.3%) | 0 (0.0%) |
| $500 to $799 | 55 (52.9%) | 0 (0.0%) |
| $800 to $999 | 0 (0.0%) | 0 (0.0%) |
| $1,000 to $1,499 | 0 (0.0%) | 0 (0.0%) |
| $1,500 to $1,999 | 0 (0.0%) | 0 (0.0%) |
| $2,000 to $2,499 | 0 (0.0%) | 0 (0.0%) |
| $2,500 to $2,999 | 0 (0.0%) | 0 (0.0%) |
| $3,000 or more | 0 (0.0%) | 0 (0.0%) |
| Total | 104 (100.0%) | 0 (0.0%) |
Physical Housing Characteristics in Shannon
Housing Structures in Shannon
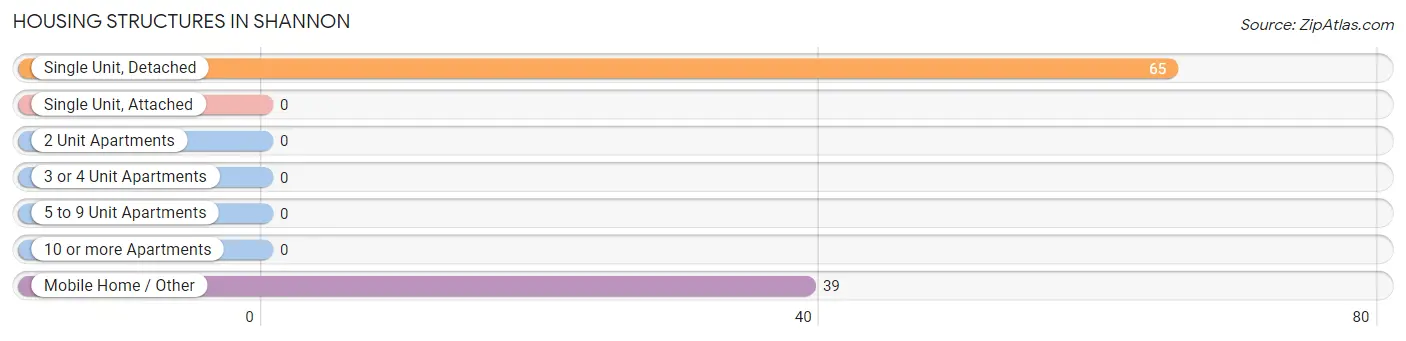
| Structure Type | # Housing Units | % Housing Units |
| Single Unit, Detached | 65 | 62.5% |
| Single Unit, Attached | 0 | 0.0% |
| 2 Unit Apartments | 0 | 0.0% |
| 3 or 4 Unit Apartments | 0 | 0.0% |
| 5 to 9 Unit Apartments | 0 | 0.0% |
| 10 or more Apartments | 0 | 0.0% |
| Mobile Home / Other | 39 | 37.5% |
| Total | 104 | 100.0% |
Housing Structures by Occupancy in Shannon
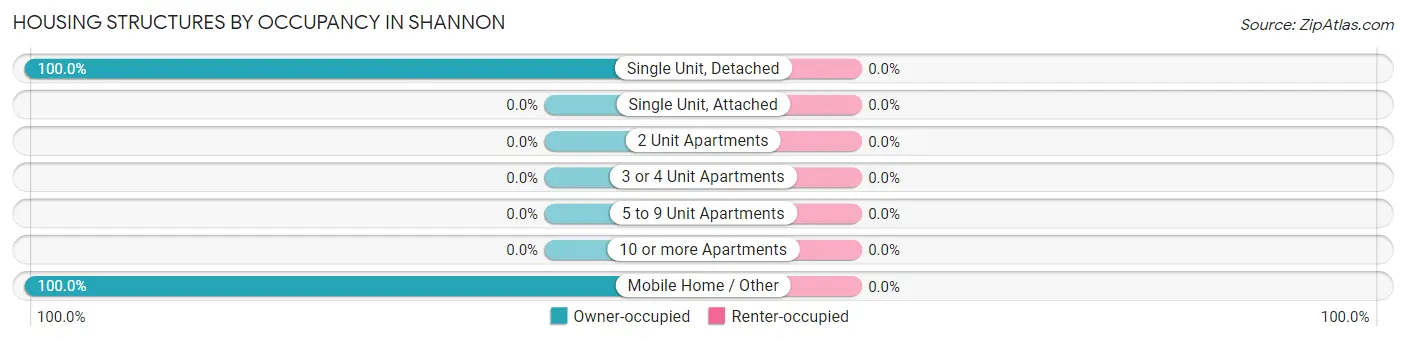
| Structure Type | Owner-occupied | Renter-occupied |
| Single Unit, Detached | 65 (100.0%) | 0 (0.0%) |
| Single Unit, Attached | 0 (0.0%) | 0 (0.0%) |
| 2 Unit Apartments | 0 (0.0%) | 0 (0.0%) |
| 3 or 4 Unit Apartments | 0 (0.0%) | 0 (0.0%) |
| 5 to 9 Unit Apartments | 0 (0.0%) | 0 (0.0%) |
| 10 or more Apartments | 0 (0.0%) | 0 (0.0%) |
| Mobile Home / Other | 39 (100.0%) | 0 (0.0%) |
| Total | 104 (100.0%) | 0 (0.0%) |
Housing Structures by Number of Rooms in Shannon
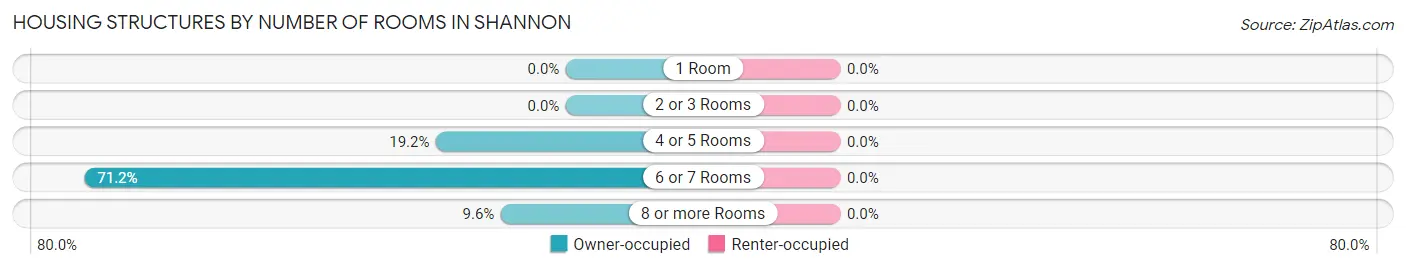
| Number of Rooms | Owner-occupied | Renter-occupied |
| 1 Room | 0 (0.0%) | 0 (0.0%) |
| 2 or 3 Rooms | 0 (0.0%) | 0 (0.0%) |
| 4 or 5 Rooms | 20 (19.2%) | 0 (0.0%) |
| 6 or 7 Rooms | 74 (71.2%) | 0 (0.0%) |
| 8 or more Rooms | 10 (9.6%) | 0 (0.0%) |
| Total | 104 (100.0%) | 0 (0.0%) |
Housing Structure by Heating Type in Shannon
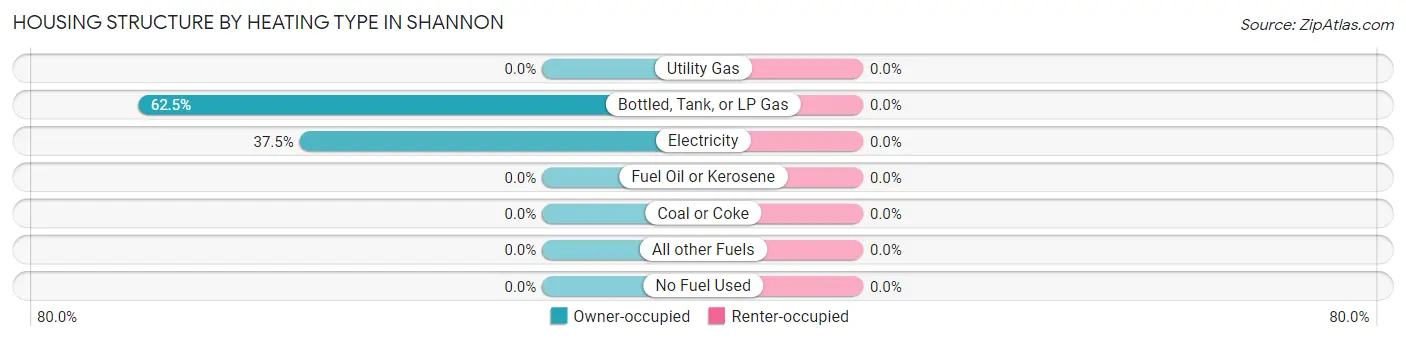
| Heating Type | Owner-occupied | Renter-occupied |
| Utility Gas | 0 (0.0%) | 0 (0.0%) |
| Bottled, Tank, or LP Gas | 65 (62.5%) | 0 (0.0%) |
| Electricity | 39 (37.5%) | 0 (0.0%) |
| Fuel Oil or Kerosene | 0 (0.0%) | 0 (0.0%) |
| Coal or Coke | 0 (0.0%) | 0 (0.0%) |
| All other Fuels | 0 (0.0%) | 0 (0.0%) |
| No Fuel Used | 0 (0.0%) | 0 (0.0%) |
| Total | 104 (100.0%) | 0 (0.0%) |
Household Vehicle Usage in Shannon
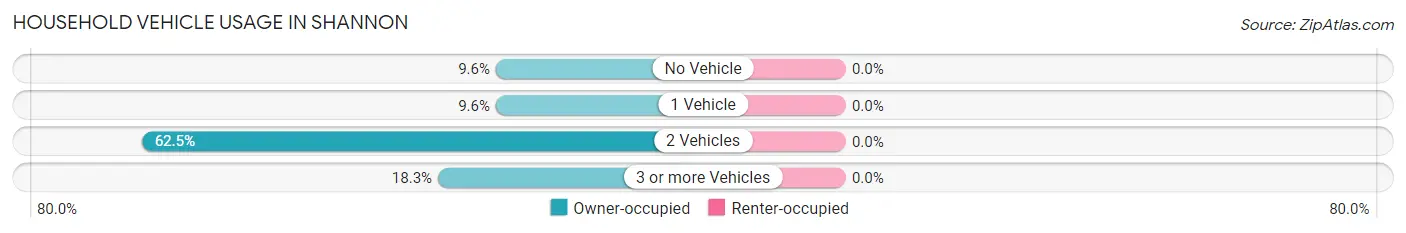
| Vehicles per Household | Owner-occupied | Renter-occupied |
| No Vehicle | 10 (9.6%) | 0 (0.0%) |
| 1 Vehicle | 10 (9.6%) | 0 (0.0%) |
| 2 Vehicles | 65 (62.5%) | 0 (0.0%) |
| 3 or more Vehicles | 19 (18.3%) | 0 (0.0%) |
| Total | 104 (100.0%) | 0 (0.0%) |
Real Estate & Mortgages in Shannon
Real Estate and Mortgage Overview in Shannon
| Characteristic | Without Mortgage | With Mortgage |
| Housing Units | 104 | 0 |
| Median Property Value | $85,800 | $0 |
| Median Household Income | $28,359 | $0 |
| Monthly Housing Costs | $505 | $0 |
| Real Estate Taxes | $855 | $0 |
Property Value by Mortgage Status in Shannon
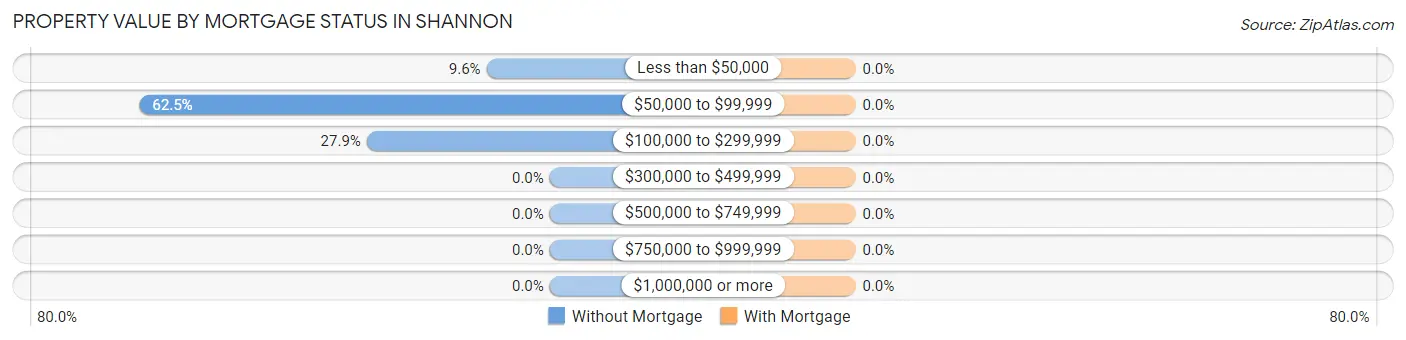
| Property Value | Without Mortgage | With Mortgage |
| Less than $50,000 | 10 (9.6%) | 0 (0.0%) |
| $50,000 to $99,999 | 65 (62.5%) | 0 (0.0%) |
| $100,000 to $299,999 | 29 (27.9%) | 0 (0.0%) |
| $300,000 to $499,999 | 0 (0.0%) | 0 (0.0%) |
| $500,000 to $749,999 | 0 (0.0%) | 0 (0.0%) |
| $750,000 to $999,999 | 0 (0.0%) | 0 (0.0%) |
| $1,000,000 or more | 0 (0.0%) | 0 (0.0%) |
| Total | 104 (100.0%) | 0 (0.0%) |
Household Income by Mortgage Status in Shannon
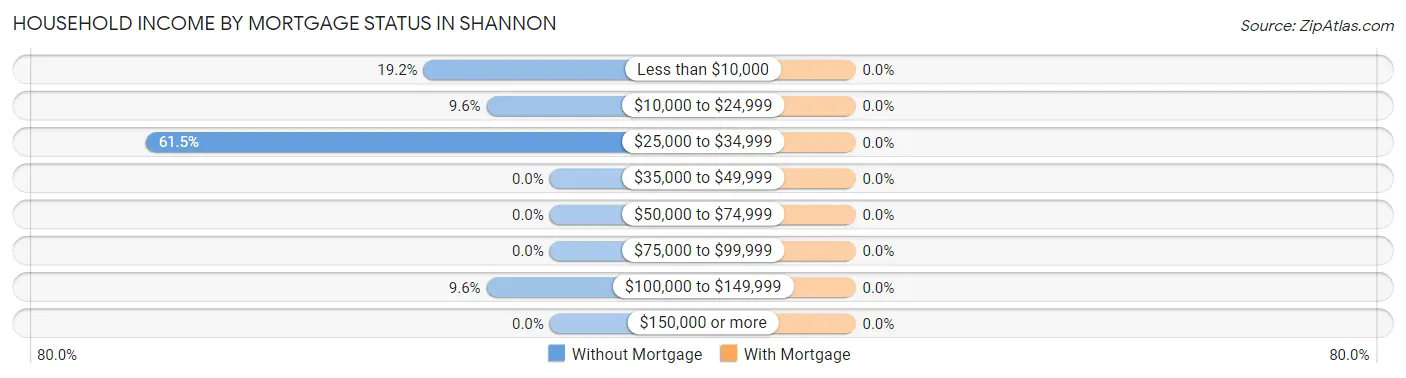
| Household Income | Without Mortgage | With Mortgage |
| Less than $10,000 | 20 (19.2%) | 0 (0.0%) |
| $10,000 to $24,999 | 10 (9.6%) | 0 (0.0%) |
| $25,000 to $34,999 | 64 (61.5%) | 0 (0.0%) |
| $35,000 to $49,999 | 0 (0.0%) | 0 (0.0%) |
| $50,000 to $74,999 | 0 (0.0%) | 0 (0.0%) |
| $75,000 to $99,999 | 0 (0.0%) | 0 (0.0%) |
| $100,000 to $149,999 | 10 (9.6%) | 0 (0.0%) |
| $150,000 or more | 0 (0.0%) | 0 (0.0%) |
| Total | 104 (100.0%) | 0 (0.0%) |
Property Value to Household Income Ratio in Shannon
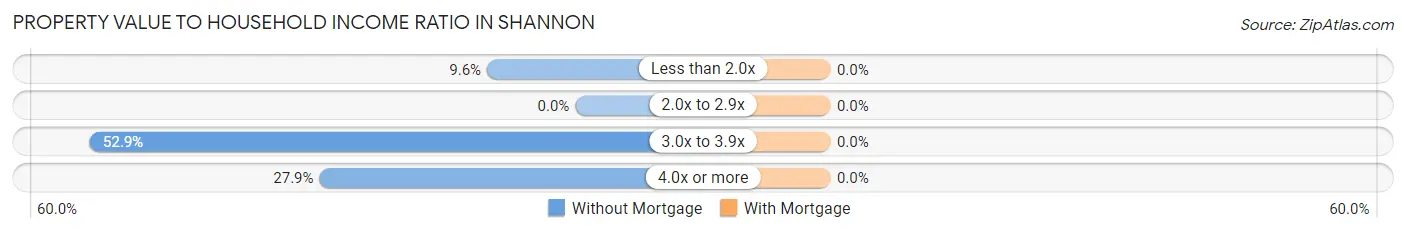
| Value-to-Income Ratio | Without Mortgage | With Mortgage |
| Less than 2.0x | 10 (9.6%) | 0 (0.0%) |
| 2.0x to 2.9x | 0 (0.0%) | 0 (0.0%) |
| 3.0x to 3.9x | 55 (52.9%) | 0 (0.0%) |
| 4.0x or more | 29 (27.9%) | 0 (0.0%) |
| Total | 104 (100.0%) | 0 (0.0%) |
Real Estate Taxes by Mortgage Status in Shannon
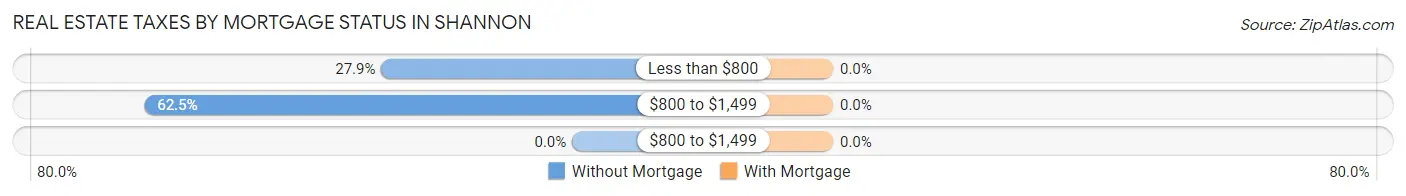
| Property Taxes | Without Mortgage | With Mortgage |
| Less than $800 | 29 (27.9%) | 0 (0.0%) |
| $800 to $1,499 | 65 (62.5%) | 0 (0.0%) |
| $800 to $1,499 | 0 (0.0%) | 0 (0.0%) |
| Total | 104 (100.0%) | 0 (0.0%) |
Health & Disability in Shannon
Health Insurance Coverage by Age in Shannon
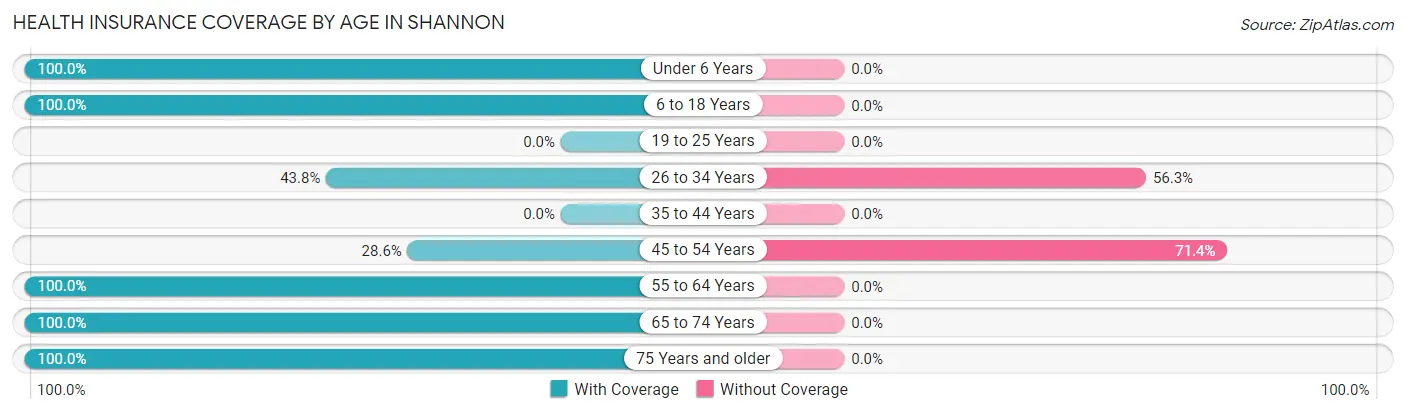
| Age Bracket | With Coverage | Without Coverage |
| Under 6 Years | 19 (100.0%) | 0 (0.0%) |
| 6 to 18 Years | 34 (100.0%) | 0 (0.0%) |
| 19 to 25 Years | 0 (0.0%) | 0 (0.0%) |
| 26 to 34 Years | 7 (43.8%) | 9 (56.2%) |
| 35 to 44 Years | 0 (0.0%) | 0 (0.0%) |
| 45 to 54 Years | 22 (28.6%) | 55 (71.4%) |
| 55 to 64 Years | 14 (100.0%) | 0 (0.0%) |
| 65 to 74 Years | 65 (100.0%) | 0 (0.0%) |
| 75 Years and older | 20 (100.0%) | 0 (0.0%) |
| Total | 181 (73.9%) | 64 (26.1%) |
Health Insurance Coverage by Citizenship Status in Shannon
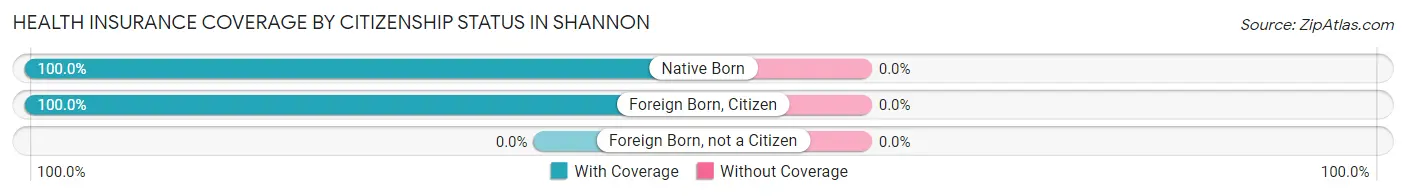
| Citizenship Status | With Coverage | Without Coverage |
| Native Born | 19 (100.0%) | 0 (0.0%) |
| Foreign Born, Citizen | 34 (100.0%) | 0 (0.0%) |
| Foreign Born, not a Citizen | 0 (0.0%) | 0 (0.0%) |
Health Insurance Coverage by Household Income in Shannon
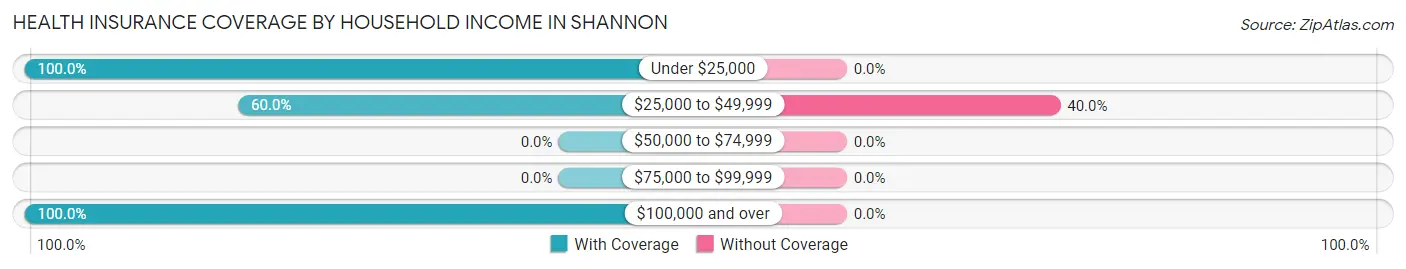
| Household Income | With Coverage | Without Coverage |
| Under $25,000 | 44 (100.0%) | 0 (0.0%) |
| $25,000 to $49,999 | 96 (60.0%) | 64 (40.0%) |
| $50,000 to $74,999 | 0 (0.0%) | 0 (0.0%) |
| $75,000 to $99,999 | 0 (0.0%) | 0 (0.0%) |
| $100,000 and over | 41 (100.0%) | 0 (0.0%) |
Public vs Private Health Insurance Coverage by Age in Shannon
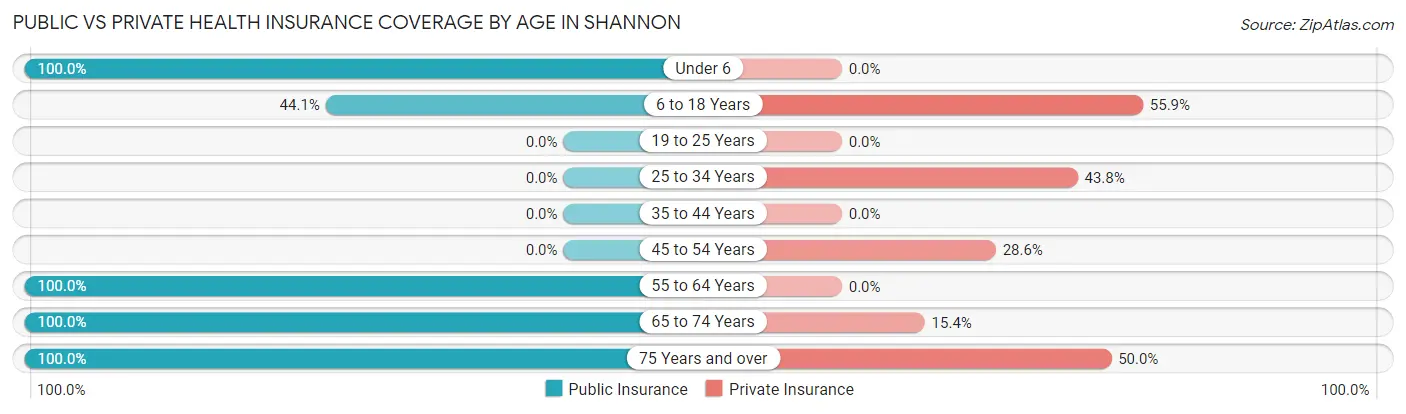
| Age Bracket | Public Insurance | Private Insurance |
| Under 6 | 19 (100.0%) | 0 (0.0%) |
| 6 to 18 Years | 15 (44.1%) | 19 (55.9%) |
| 19 to 25 Years | 0 (0.0%) | 0 (0.0%) |
| 25 to 34 Years | 0 (0.0%) | 7 (43.8%) |
| 35 to 44 Years | 0 (0.0%) | 0 (0.0%) |
| 45 to 54 Years | 0 (0.0%) | 22 (28.6%) |
| 55 to 64 Years | 14 (100.0%) | 0 (0.0%) |
| 65 to 74 Years | 65 (100.0%) | 10 (15.4%) |
| 75 Years and over | 20 (100.0%) | 10 (50.0%) |
| Total | 133 (54.3%) | 68 (27.8%) |
Disability Status by Sex by Age in Shannon
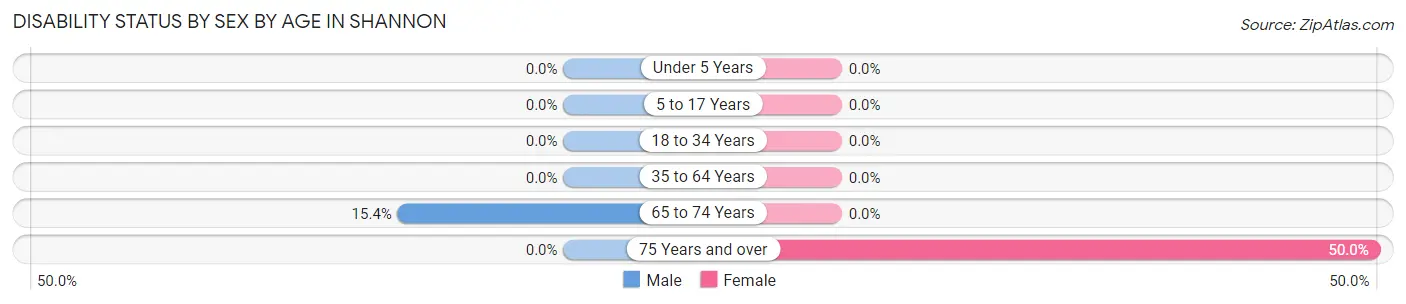
| Age Bracket | Male | Female |
| Under 5 Years | 0 (0.0%) | 0 (0.0%) |
| 5 to 17 Years | 0 (0.0%) | 0 (0.0%) |
| 18 to 34 Years | 0 (0.0%) | 0 (0.0%) |
| 35 to 64 Years | 0 (0.0%) | 0 (0.0%) |
| 65 to 74 Years | 10 (15.4%) | 0 (0.0%) |
| 75 Years and over | 0 (0.0%) | 10 (50.0%) |
Disability Class by Sex by Age in Shannon
Disability Class: Hearing Difficulty
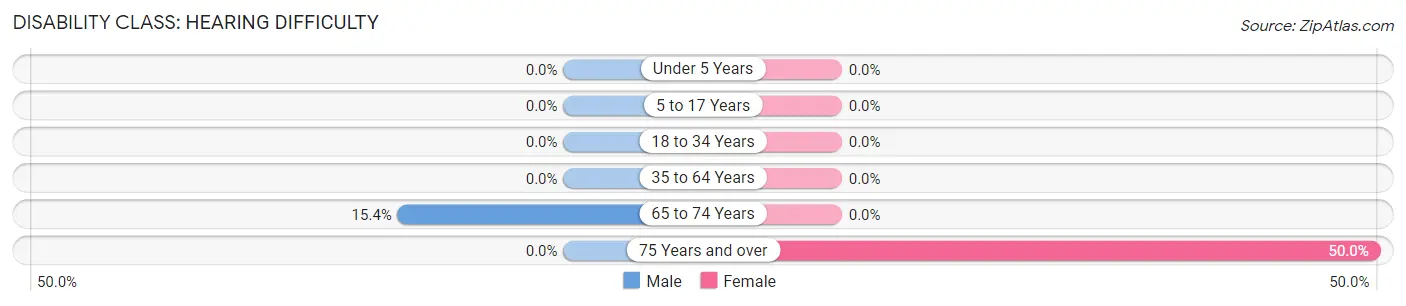
| Age Bracket | Male | Female |
| Under 5 Years | 0 (0.0%) | 0 (0.0%) |
| 5 to 17 Years | 0 (0.0%) | 0 (0.0%) |
| 18 to 34 Years | 0 (0.0%) | 0 (0.0%) |
| 35 to 64 Years | 0 (0.0%) | 0 (0.0%) |
| 65 to 74 Years | 10 (15.4%) | 0 (0.0%) |
| 75 Years and over | 0 (0.0%) | 10 (50.0%) |
Disability Class: Vision Difficulty
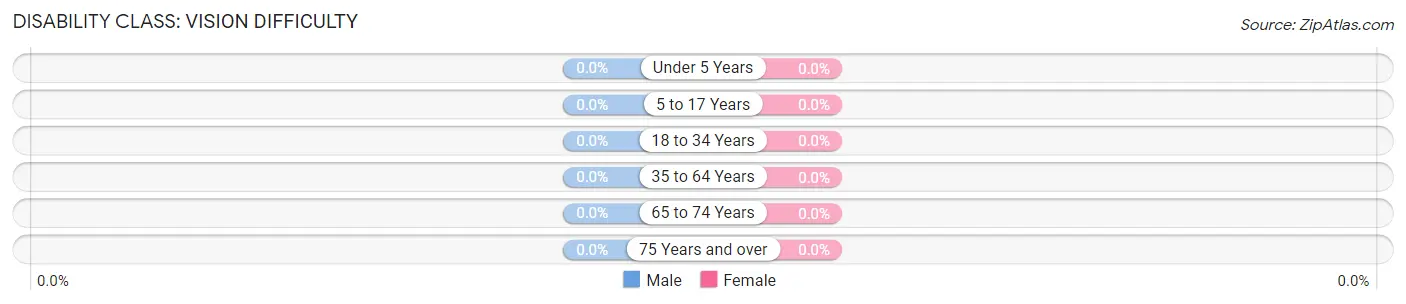
| Age Bracket | Male | Female |
| Under 5 Years | 0 (0.0%) | 0 (0.0%) |
| 5 to 17 Years | 0 (0.0%) | 0 (0.0%) |
| 18 to 34 Years | 0 (0.0%) | 0 (0.0%) |
| 35 to 64 Years | 0 (0.0%) | 0 (0.0%) |
| 65 to 74 Years | 0 (0.0%) | 0 (0.0%) |
| 75 Years and over | 0 (0.0%) | 0 (0.0%) |
Disability Class: Cognitive Difficulty

| Age Bracket | Male | Female |
| 5 to 17 Years | 0 (0.0%) | 0 (0.0%) |
| 18 to 34 Years | 0 (0.0%) | 0 (0.0%) |
| 35 to 64 Years | 0 (0.0%) | 0 (0.0%) |
| 65 to 74 Years | 0 (0.0%) | 0 (0.0%) |
| 75 Years and over | 0 (0.0%) | 10 (50.0%) |
Disability Class: Ambulatory Difficulty
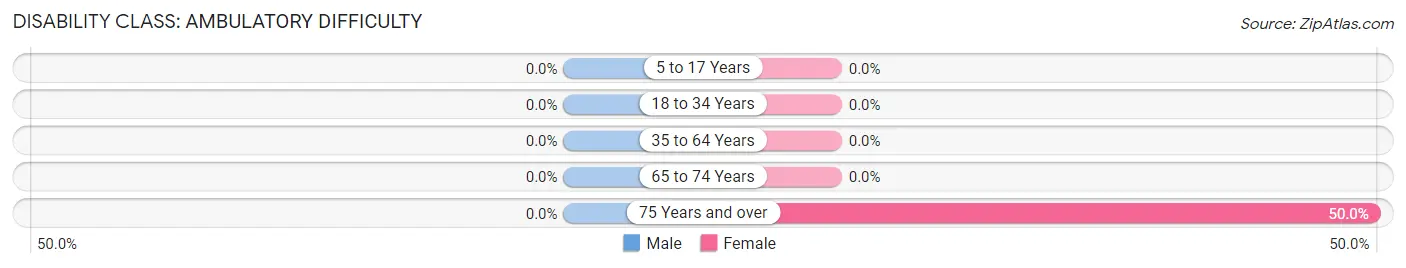
| Age Bracket | Male | Female |
| 5 to 17 Years | 0 (0.0%) | 0 (0.0%) |
| 18 to 34 Years | 0 (0.0%) | 0 (0.0%) |
| 35 to 64 Years | 0 (0.0%) | 0 (0.0%) |
| 65 to 74 Years | 0 (0.0%) | 0 (0.0%) |
| 75 Years and over | 0 (0.0%) | 10 (50.0%) |
Disability Class: Self-Care Difficulty
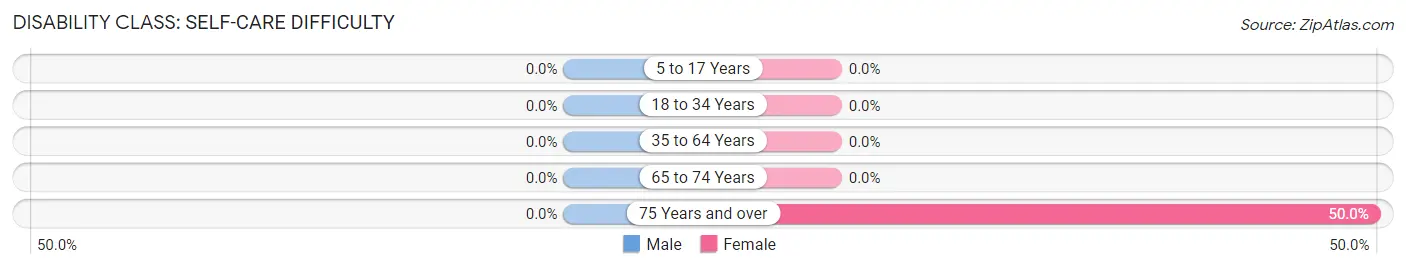
| Age Bracket | Male | Female |
| 5 to 17 Years | 0 (0.0%) | 0 (0.0%) |
| 18 to 34 Years | 0 (0.0%) | 0 (0.0%) |
| 35 to 64 Years | 0 (0.0%) | 0 (0.0%) |
| 65 to 74 Years | 0 (0.0%) | 0 (0.0%) |
| 75 Years and over | 0 (0.0%) | 10 (50.0%) |
Technology Access in Shannon
Computing Device Access in Shannon
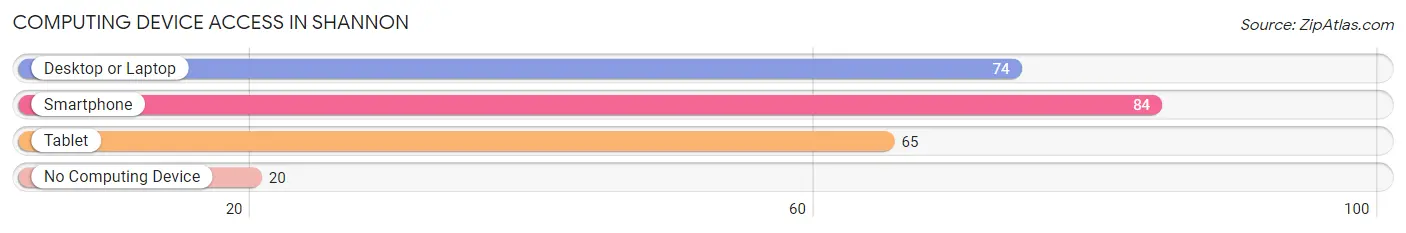
| Device Type | # Households | % Households |
| Desktop or Laptop | 74 | 71.2% |
| Smartphone | 84 | 80.8% |
| Tablet | 65 | 62.5% |
| No Computing Device | 20 | 19.2% |
| Total | 104 | 100.0% |
Internet Access in Shannon
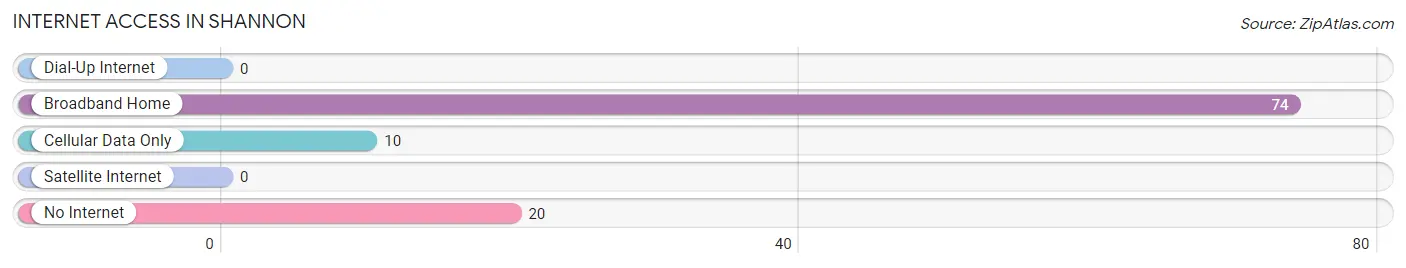
| Internet Type | # Households | % Households |
| Dial-Up Internet | 0 | 0.0% |
| Broadband Home | 74 | 71.2% |
| Cellular Data Only | 10 | 9.6% |
| Satellite Internet | 0 | 0.0% |
| No Internet | 20 | 19.2% |
| Total | 104 | 100.0% |
Shannon Summary
Shannon, North Carolina is a small town located in Moore County, North Carolina. It is situated in the Sandhills region of the state, and is part of the Fayetteville-Lumberton-Laurinburg Metropolitan Statistical Area. The town has a population of approximately 1,000 people, and is known for its rural charm and friendly atmosphere.
History
Shannon was founded in 1887 by a group of settlers from Scotland. The town was named after the Shannon River in Ireland, and was originally intended to be a farming community. The town quickly grew, and by the early 1900s, it had become a thriving center of commerce and industry. The town was home to several businesses, including a cotton mill, a sawmill, and a grist mill.
In the early 1900s, Shannon was also home to a number of churches, including the First Presbyterian Church, which was founded in 1887. The town also had a school, which was established in 1891.
Geography
Shannon is located in the Sandhills region of North Carolina, which is characterized by rolling hills and sandy soils. The town is situated in the western part of Moore County, and is bordered by the towns of Pinehurst, Southern Pines, and Aberdeen. The town is located approximately 25 miles south of Fayetteville, and is approximately 50 miles from the state capital of Raleigh.
The town is situated at an elevation of approximately 400 feet above sea level, and is located in the Piedmont region of the state. The town is located in the Cape Fear River Basin, and is situated near the headwaters of the Deep River.
Economy
Shannon’s economy is largely based on agriculture and tourism. The town is home to several farms, which produce a variety of crops, including corn, soybeans, and cotton. The town is also home to several tourist attractions, including the Sandhills State Park, which is located just outside of town.
The town is also home to several small businesses, including restaurants, retail stores, and service providers. The town is also home to a number of manufacturing companies, which produce a variety of products, including furniture, textiles, and paper products.
Demographics
As of the 2010 census, Shannon had a population of 1,000 people. The town is predominantly white, with approximately 95% of the population identifying as Caucasian. The town also has a small African American population, with approximately 4% of the population identifying as African American. The town also has a small Hispanic population, with approximately 1% of the population identifying as Hispanic or Latino.
The median household income in Shannon is approximately $35,000, and the median home value is approximately $150,000. The town has a low unemployment rate, with approximately 4% of the population unemployed. The town also has a low poverty rate, with approximately 8% of the population living below the poverty line.
Conclusion
Shannon, North Carolina is a small town located in Moore County, North Carolina. It is situated in the Sandhills region of the state, and is part of the Fayetteville-Lumberton-Laurinburg Metropolitan Statistical Area. The town has a population of approximately 1,000 people, and is known for its rural charm and friendly atmosphere. The town’s economy is largely based on agriculture and tourism, and the town is home to several small businesses, including restaurants, retail stores, and service providers. The town is predominantly white, with approximately 95% of the population identifying as Caucasian. The median household income in Shannon is approximately $35,000, and the median home value is approximately $150,000.
Common Questions
What is Per Capita Income in Shannon?
Per Capita income in Shannon is $14,475.
What is the Median Household income in Shannon?
Median Household Income in Shannon is $28,359.
What is Inequality or Gini Index in Shannon?
Inequality or Gini Index in Shannon is 0.41.
What is the Total Population of Shannon?
Total Population of Shannon is 245.
What is the Total Male Population of Shannon?
Total Male Population of Shannon is 132.
What is the Total Female Population of Shannon?
Total Female Population of Shannon is 113.
What is the Ratio of Males per 100 Females in Shannon?
There are 116.81 Males per 100 Females in Shannon.
What is the Ratio of Females per 100 Males in Shannon?
There are 85.61 Females per 100 Males in Shannon.
What is the Median Population Age in Shannon?
Median Population Age in Shannon is 49.6 Years.
What is the Average Family Size in Shannon
Average Family Size in Shannon is 4.0 People.
What is the Average Household Size in Shannon
Average Household Size in Shannon is 2.4 People.
How Large is the Labor Force in Shannon?
There are 84 People in the Labor Forcein in Shannon.
What is the Percentage of People in the Labor Force in Shannon?
43.8% of People are in the Labor Force in Shannon.