Scotland Neck, NC Map & Demographics
Scotland Neck Map
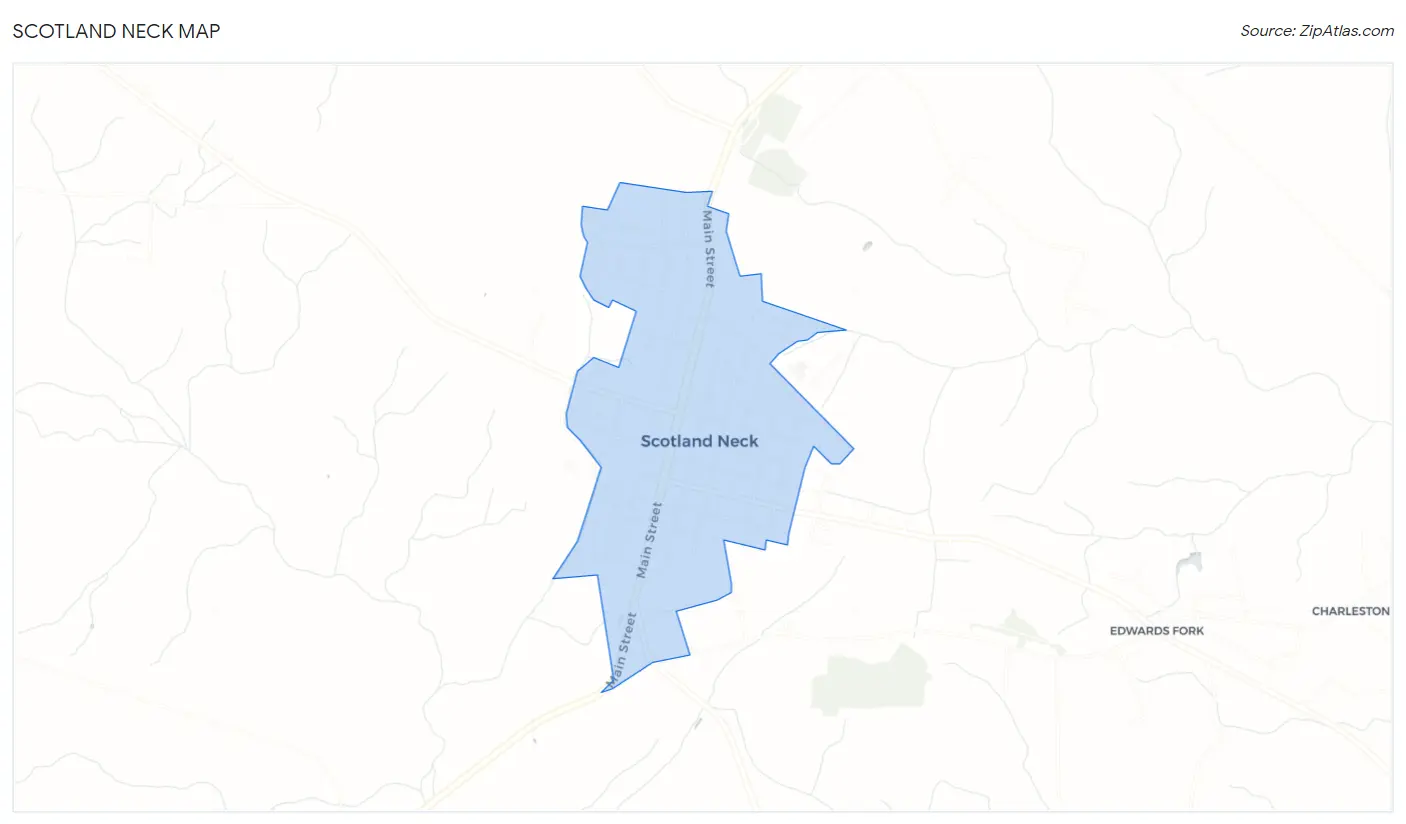
Scotland Neck Overview
$19,716
PER CAPITA INCOME
$46,058
AVG FAMILY INCOME
$17,271
AVG HOUSEHOLD INCOME
48.1%
WAGE / INCOME GAP [ % ]
51.9¢/ $1
WAGE / INCOME GAP [ $ ]
0.56
INEQUALITY / GINI INDEX
1,861
TOTAL POPULATION
903
MALE POPULATION
958
FEMALE POPULATION
94.26
MALES / 100 FEMALES
106.09
FEMALES / 100 MALES
52.9
MEDIAN AGE
3.3
AVG FAMILY SIZE
1.9
AVG HOUSEHOLD SIZE
646
LABOR FORCE [ PEOPLE ]
39.1%
PERCENT IN LABOR FORCE
10.7%
UNEMPLOYMENT RATE
Scotland Neck Zip Codes
Scotland Neck Area Codes
Income in Scotland Neck
Income Overview in Scotland Neck
Per Capita Income in Scotland Neck is $19,716, while median incomes of families and households are $46,058 and $17,271 respectively.
| Characteristic | Number | Measure |
| Per Capita Income | 1,861 | $19,716 |
| Median Family Income | 322 | $46,058 |
| Mean Family Income | 322 | $66,480 |
| Median Household Income | 943 | $17,271 |
| Mean Household Income | 943 | $34,048 |
| Income Deficit | 322 | $0 |
| Wage / Income Gap (%) | 1,861 | 48.14% |
| Wage / Income Gap ($) | 1,861 | 51.86¢ per $1 |
| Gini / Inequality Index | 1,861 | 0.56 |
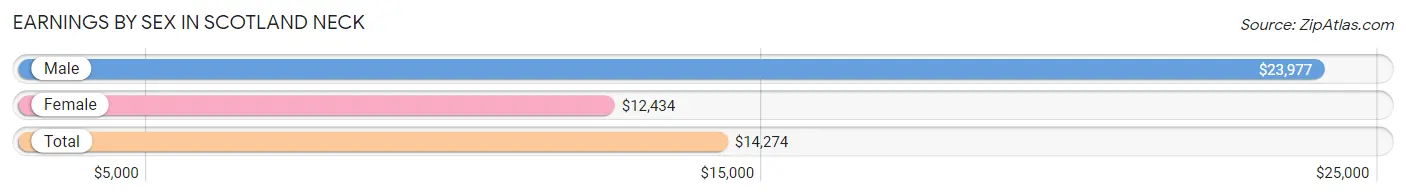
Earnings by Sex in Scotland Neck
Average Earnings in Scotland Neck are $14,274, $23,977 for men and $12,434 for women, a difference of 48.1%.
| Sex | Number | Average Earnings |
| Male | 378 (55.6%) | $23,977 |
| Female | 302 (44.4%) | $12,434 |
| Total | 680 (100.0%) | $14,274 |
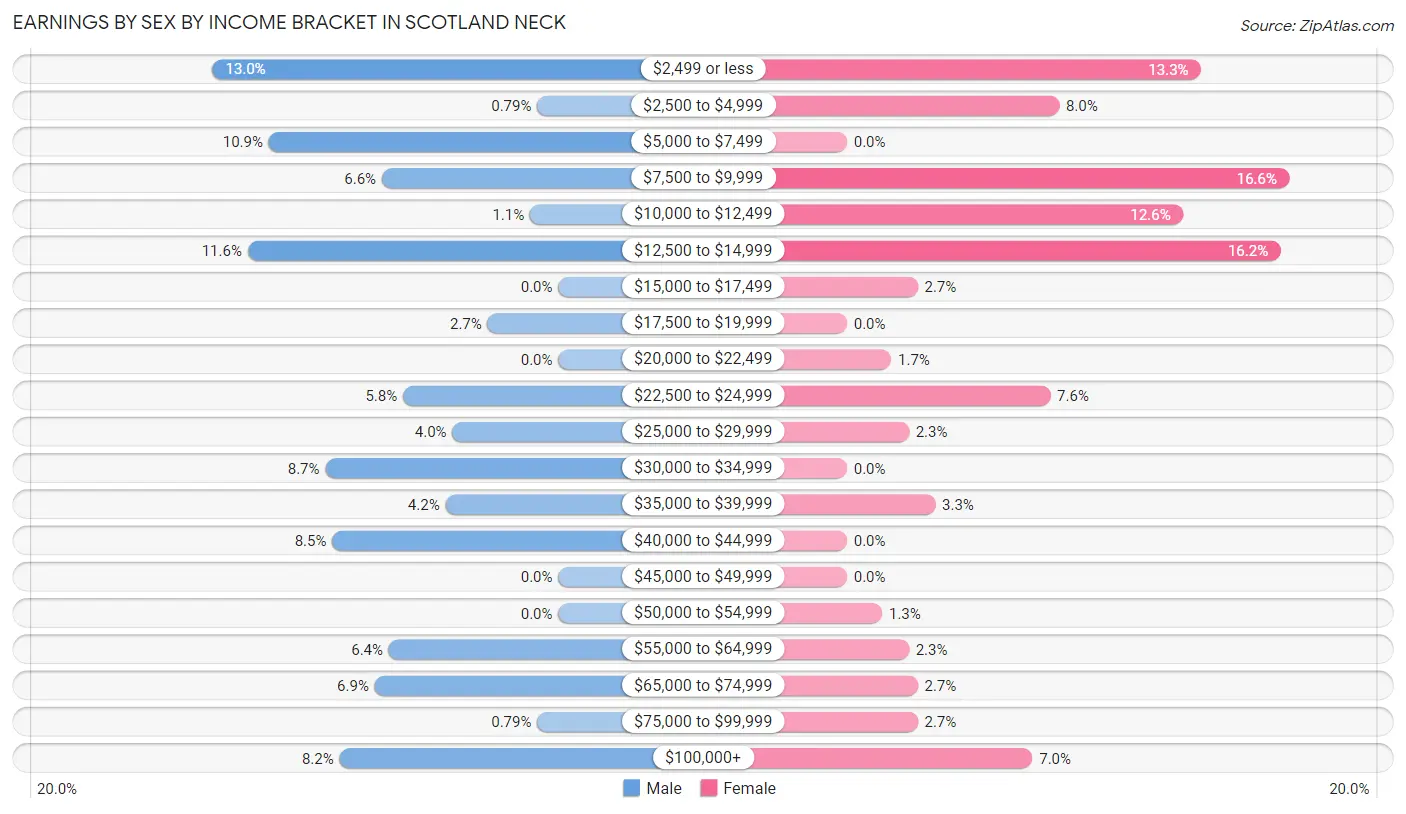
Earnings by Sex by Income Bracket in Scotland Neck
The most common earnings brackets in Scotland Neck are $2,499 or less for men (49 | 13.0%) and $7,500 to $9,999 for women (50 | 16.6%).
| Income | Male | Female |
| $2,499 or less | 49 (13.0%) | 40 (13.3%) |
| $2,500 to $4,999 | 3 (0.8%) | 24 (8.0%) |
| $5,000 to $7,499 | 41 (10.8%) | 0 (0.0%) |
| $7,500 to $9,999 | 25 (6.6%) | 50 (16.6%) |
| $10,000 to $12,499 | 4 (1.1%) | 38 (12.6%) |
| $12,500 to $14,999 | 44 (11.6%) | 49 (16.2%) |
| $15,000 to $17,499 | 0 (0.0%) | 8 (2.6%) |
| $17,500 to $19,999 | 10 (2.6%) | 0 (0.0%) |
| $20,000 to $22,499 | 0 (0.0%) | 5 (1.7%) |
| $22,500 to $24,999 | 22 (5.8%) | 23 (7.6%) |
| $25,000 to $29,999 | 15 (4.0%) | 7 (2.3%) |
| $30,000 to $34,999 | 33 (8.7%) | 0 (0.0%) |
| $35,000 to $39,999 | 16 (4.2%) | 10 (3.3%) |
| $40,000 to $44,999 | 32 (8.5%) | 0 (0.0%) |
| $45,000 to $49,999 | 0 (0.0%) | 0 (0.0%) |
| $50,000 to $54,999 | 0 (0.0%) | 4 (1.3%) |
| $55,000 to $64,999 | 24 (6.4%) | 7 (2.3%) |
| $65,000 to $74,999 | 26 (6.9%) | 8 (2.6%) |
| $75,000 to $99,999 | 3 (0.8%) | 8 (2.6%) |
| $100,000+ | 31 (8.2%) | 21 (7.0%) |
| Total | 378 (100.0%) | 302 (100.0%) |
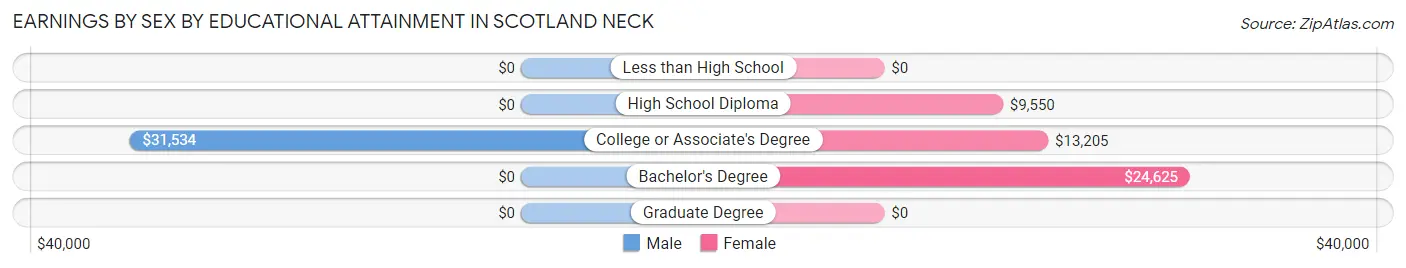
Earnings by Sex by Educational Attainment in Scotland Neck
Average earnings in Scotland Neck are $30,189 for men and $12,628 for women, a difference of 58.2%. Men with an educational attainment of college or associate's degree enjoy the highest average annual earnings of $31,534, while those with college or associate's degree education earn the least with $31,534. Women with an educational attainment of bachelor's degree earn the most with the average annual earnings of $24,625, while those with high school diploma education have the smallest earnings of $9,550.
| Educational Attainment | Male Income | Female Income |
| Less than High School | - | - |
| High School Diploma | - | - |
| College or Associate's Degree | $31,534 | $13,205 |
| Bachelor's Degree | - | - |
| Graduate Degree | - | - |
| Total | $30,189 | $12,628 |
Family Income in Scotland Neck
Family Income Brackets in Scotland Neck
According to the Scotland Neck family income data, there are 78 families falling into the $15,000 to $24,999 income range, which is the most common income bracket and makes up 24.2% of all families. Conversely, the $25,000 to $34,999 income bracket is the least frequent group with only 10 families (3.1%) belonging to this category.
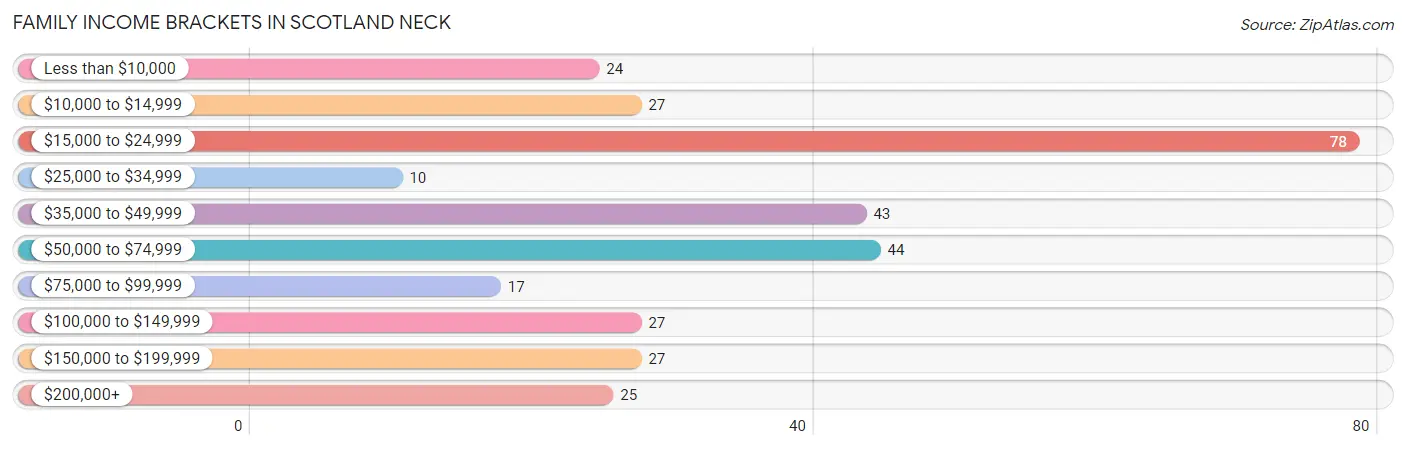
| Income Bracket | # Families | % Families |
| Less than $10,000 | 24 | 7.5% |
| $10,000 to $14,999 | 27 | 8.4% |
| $15,000 to $24,999 | 78 | 24.2% |
| $25,000 to $34,999 | 10 | 3.1% |
| $35,000 to $49,999 | 43 | 13.4% |
| $50,000 to $74,999 | 44 | 13.7% |
| $75,000 to $99,999 | 17 | 5.3% |
| $100,000 to $149,999 | 27 | 8.4% |
| $150,000 to $199,999 | 27 | 8.4% |
| $200,000+ | 25 | 7.8% |
Family Income by Famaliy Size in Scotland Neck
2-person families (135 | 41.9%) account for the highest median family income in Scotland Neck with $38,594 per family, while 2-person families (135 | 41.9%) have the highest median income of $19,297 per family member.
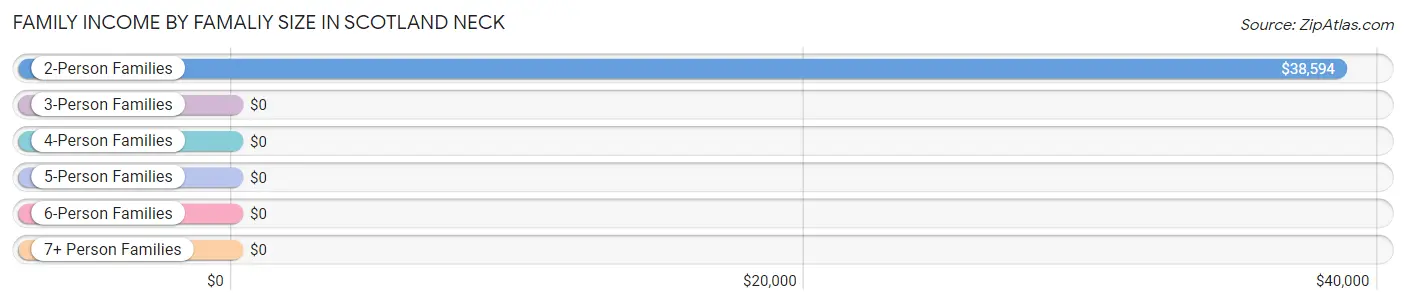
| Income Bracket | # Families | Median Income |
| 2-Person Families | 135 (41.9%) | $38,594 |
| 3-Person Families | 44 (13.7%) | $0 |
| 4-Person Families | 130 (40.4%) | $0 |
| 5-Person Families | 5 (1.5%) | $0 |
| 6-Person Families | 8 (2.5%) | $0 |
| 7+ Person Families | 0 (0.0%) | $0 |
| Total | 322 (100.0%) | $46,058 |
Family Income by Number of Earners in Scotland Neck
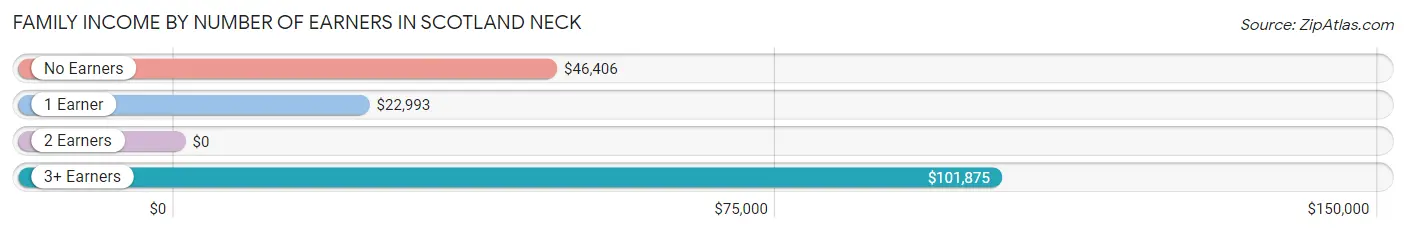
| Number of Earners | # Families | Median Income |
| No Earners | 54 (16.8%) | $46,406 |
| 1 Earner | 135 (41.9%) | $22,993 |
| 2 Earners | 111 (34.5%) | $0 |
| 3+ Earners | 22 (6.8%) | $101,875 |
| Total | 322 (100.0%) | $46,058 |
Household Income in Scotland Neck
Household Income Brackets in Scotland Neck
With 216 households falling in the category, the $10,000 to $14,999 income range is the most frequent in Scotland Neck, accounting for 22.9% of all households. In contrast, only 17 households (1.8%) fall into the $75,000 to $99,999 income bracket, making it the least populous group.
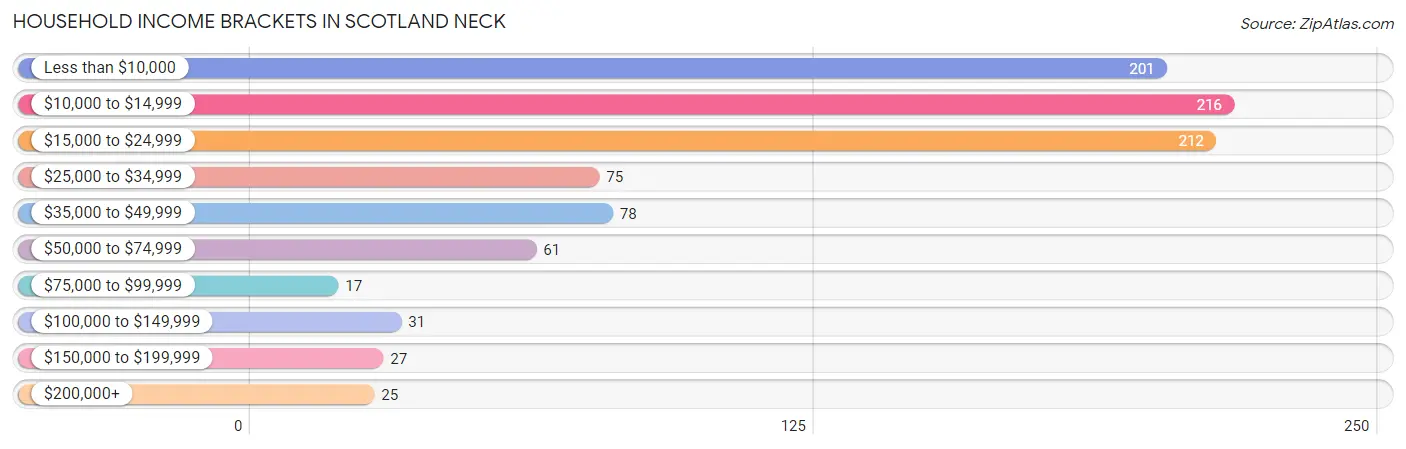
| Income Bracket | # Households | % Households |
| Less than $10,000 | 201 | 21.3% |
| $10,000 to $14,999 | 216 | 22.9% |
| $15,000 to $24,999 | 212 | 22.5% |
| $25,000 to $34,999 | 75 | 8.0% |
| $35,000 to $49,999 | 78 | 8.3% |
| $50,000 to $74,999 | 61 | 6.5% |
| $75,000 to $99,999 | 17 | 1.8% |
| $100,000 to $149,999 | 31 | 3.3% |
| $150,000 to $199,999 | 27 | 2.9% |
| $200,000+ | 25 | 2.7% |
Household Income by Householder Age in Scotland Neck
The median household income in Scotland Neck is $17,271, with the highest median household income of $56,250 found in the 25 to 44 years age bracket for the primary householder. A total of 125 households (13.3%) fall into this category. Meanwhile, the 15 to 24 years age bracket for the primary householder has the lowest median household income of $0, with 9 households (0.9%) in this group.
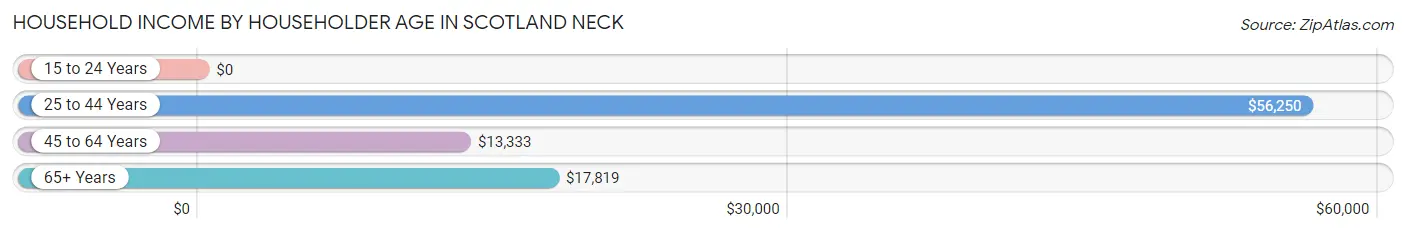
| Income Bracket | # Households | Median Income |
| 15 to 24 Years | 9 (0.9%) | $0 |
| 25 to 44 Years | 125 (13.3%) | $56,250 |
| 45 to 64 Years | 382 (40.5%) | $13,333 |
| 65+ Years | 427 (45.3%) | $17,819 |
| Total | 943 (100.0%) | $17,271 |
Poverty in Scotland Neck
Income Below Poverty by Sex and Age in Scotland Neck
With 46.0% poverty level for males and 44.8% for females among the residents of Scotland Neck, 12 to 14 year old males and 15 year old females are the most vulnerable to poverty, with 44 males (100.0%) and 19 females (100.0%) in their respective age groups living below the poverty level.
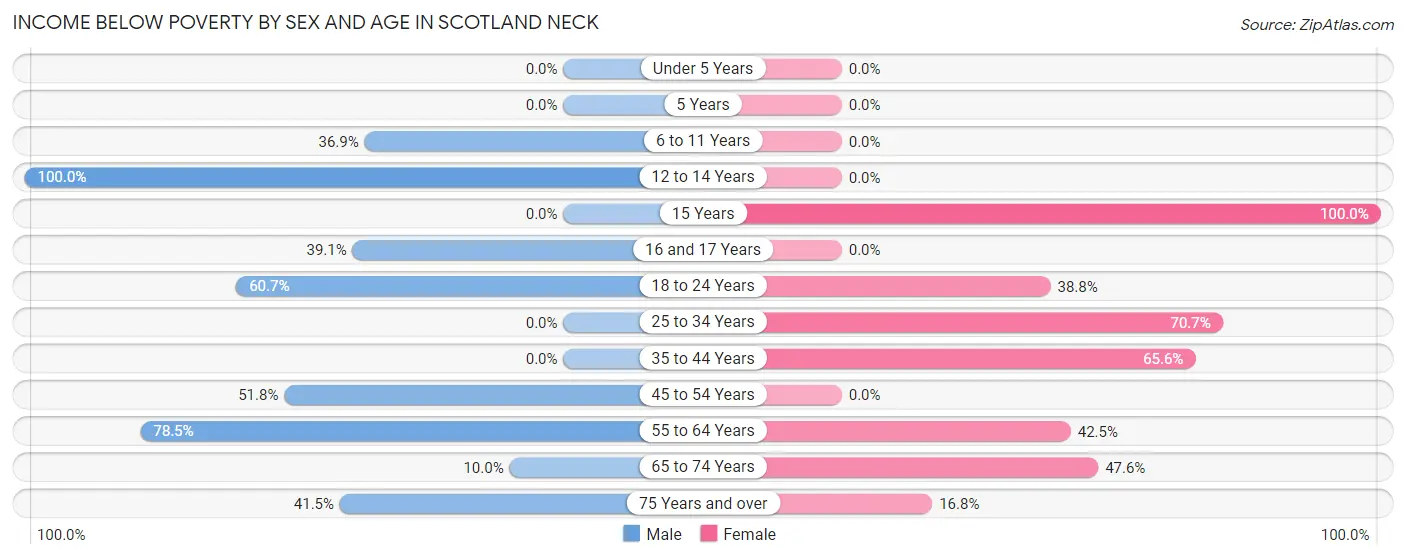
| Age Bracket | Male | Female |
| Under 5 Years | 0 (0.0%) | 0 (0.0%) |
| 5 Years | 0 (0.0%) | 0 (0.0%) |
| 6 to 11 Years | 31 (36.9%) | 0 (0.0%) |
| 12 to 14 Years | 44 (100.0%) | 0 (0.0%) |
| 15 Years | 0 (0.0%) | 19 (100.0%) |
| 16 and 17 Years | 9 (39.1%) | 0 (0.0%) |
| 18 to 24 Years | 34 (60.7%) | 31 (38.8%) |
| 25 to 34 Years | 0 (0.0%) | 53 (70.7%) |
| 35 to 44 Years | 0 (0.0%) | 162 (65.6%) |
| 45 to 54 Years | 43 (51.8%) | 0 (0.0%) |
| 55 to 64 Years | 179 (78.5%) | 51 (42.5%) |
| 65 to 74 Years | 8 (10.0%) | 79 (47.6%) |
| 75 Years and over | 56 (41.5%) | 22 (16.8%) |
| Total | 404 (46.0%) | 417 (44.8%) |
Income Above Poverty by Sex and Age in Scotland Neck
According to the poverty statistics in Scotland Neck, males aged under 5 years and females aged under 5 years are the age groups that are most secure financially, with 100.0% of males and 100.0% of females in these age groups living above the poverty line.
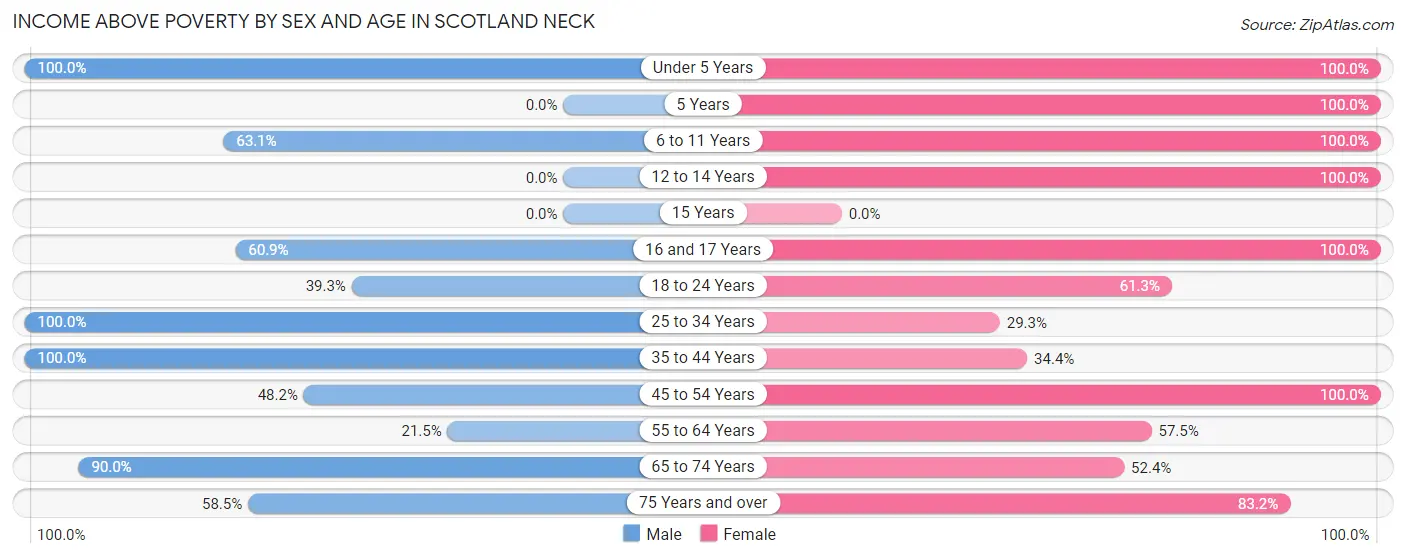
| Age Bracket | Male | Female |
| Under 5 Years | 14 (100.0%) | 4 (100.0%) |
| 5 Years | 0 (0.0%) | 15 (100.0%) |
| 6 to 11 Years | 53 (63.1%) | 17 (100.0%) |
| 12 to 14 Years | 0 (0.0%) | 13 (100.0%) |
| 15 Years | 0 (0.0%) | 0 (0.0%) |
| 16 and 17 Years | 14 (60.9%) | 4 (100.0%) |
| 18 to 24 Years | 22 (39.3%) | 49 (61.3%) |
| 25 to 34 Years | 74 (100.0%) | 22 (29.3%) |
| 35 to 44 Years | 57 (100.0%) | 85 (34.4%) |
| 45 to 54 Years | 40 (48.2%) | 39 (100.0%) |
| 55 to 64 Years | 49 (21.5%) | 69 (57.5%) |
| 65 to 74 Years | 72 (90.0%) | 87 (52.4%) |
| 75 Years and over | 79 (58.5%) | 109 (83.2%) |
| Total | 474 (54.0%) | 513 (55.2%) |
Income Below Poverty Among Married-Couple Families in Scotland Neck
The poverty statistics for married-couple families in Scotland Neck show that 2.4% or 4 of the total 165 families live below the poverty line. Families with no children have the highest poverty rate of 4.1%, comprising of 4 families. On the other hand, families with 1 or 2 children have the lowest poverty rate of 0.0%, which includes 0 families.
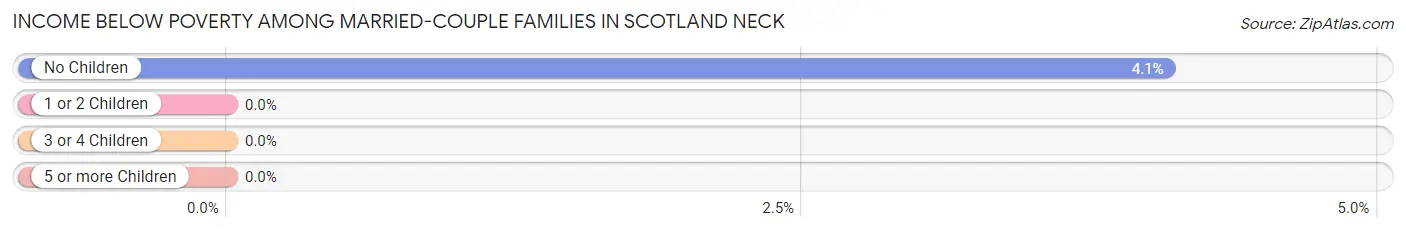
| Children | Above Poverty | Below Poverty |
| No Children | 94 (95.9%) | 4 (4.1%) |
| 1 or 2 Children | 59 (100.0%) | 0 (0.0%) |
| 3 or 4 Children | 8 (100.0%) | 0 (0.0%) |
| 5 or more Children | 0 (0.0%) | 0 (0.0%) |
| Total | 161 (97.6%) | 4 (2.4%) |
Income Below Poverty Among Single-Parent Households in Scotland Neck
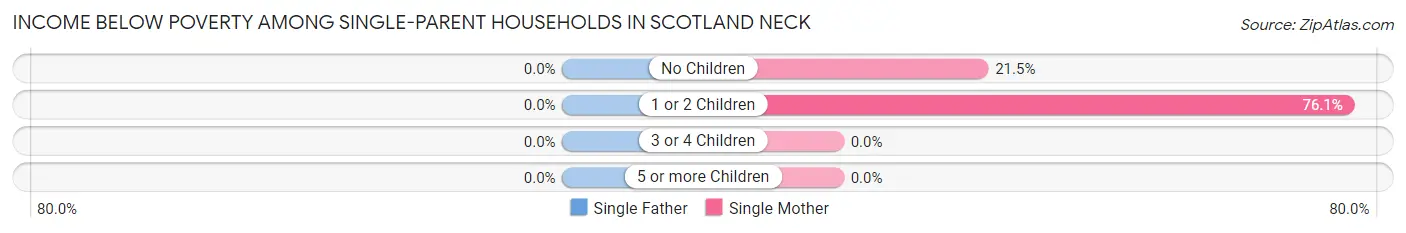
| Children | Single Father | Single Mother |
| No Children | 0 (0.0%) | 14 (21.5%) |
| 1 or 2 Children | 0 (0.0%) | 67 (76.1%) |
| 3 or 4 Children | 0 (0.0%) | 0 (0.0%) |
| 5 or more Children | 0 (0.0%) | 0 (0.0%) |
| Total | 0 (0.0%) | 81 (52.9%) |
Income Below Poverty Among Married-Couple vs Single-Parent Households in Scotland Neck
The poverty data for Scotland Neck shows that 4 of the married-couple family households (2.4%) and 81 of the single-parent households (51.6%) are living below the poverty level. Within the married-couple family households, those with no children have the highest poverty rate, with 4 households (4.1%) falling below the poverty line. Among the single-parent households, those with 1 or 2 children have the highest poverty rate, with 67 household (76.1%) living below poverty.
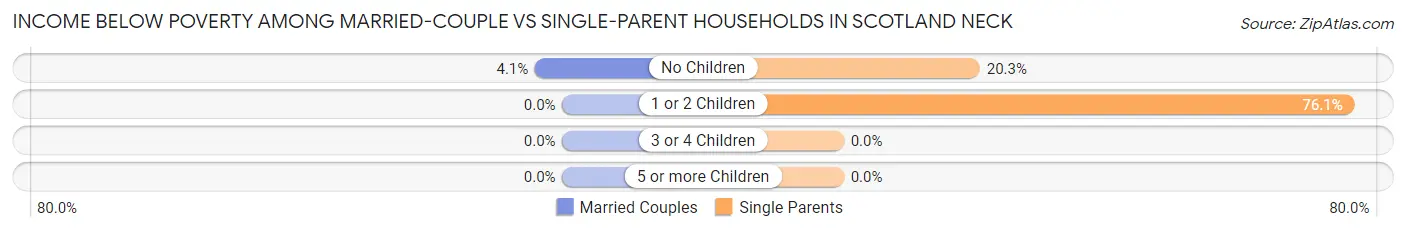
| Children | Married-Couple Families | Single-Parent Households |
| No Children | 4 (4.1%) | 14 (20.3%) |
| 1 or 2 Children | 0 (0.0%) | 67 (76.1%) |
| 3 or 4 Children | 0 (0.0%) | 0 (0.0%) |
| 5 or more Children | 0 (0.0%) | 0 (0.0%) |
| Total | 4 (2.4%) | 81 (51.6%) |
Race in Scotland Neck
The most populous races in Scotland Neck are Black / African American (1,294 | 69.5%), White / Caucasian (540 | 29.0%), and Hispanic or Latino (15 | 0.8%).
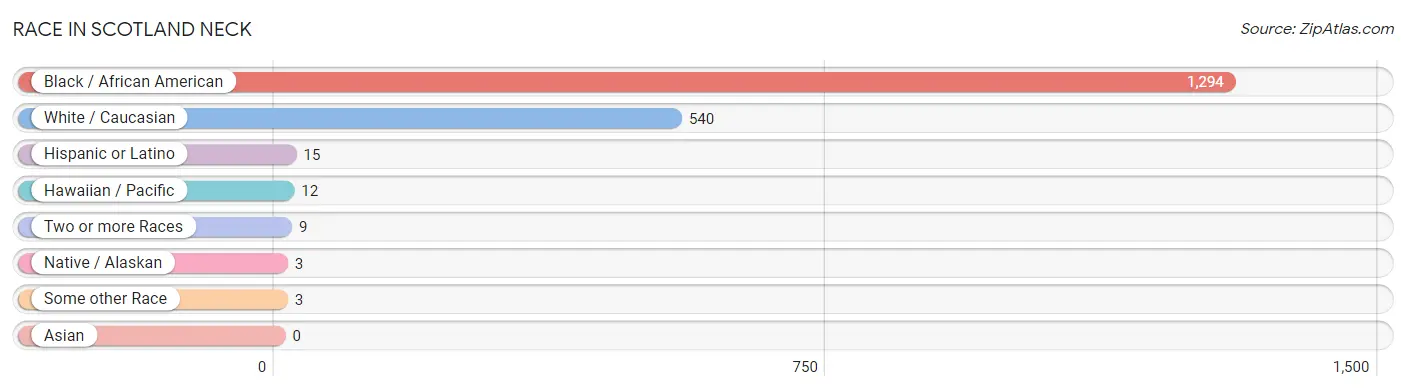
| Race | # Population | % Population |
| Asian | 0 | 0.0% |
| Black / African American | 1,294 | 69.5% |
| Hawaiian / Pacific | 12 | 0.6% |
| Hispanic or Latino | 15 | 0.8% |
| Native / Alaskan | 3 | 0.2% |
| White / Caucasian | 540 | 29.0% |
| Two or more Races | 9 | 0.5% |
| Some other Race | 3 | 0.2% |
| Total | 1,861 | 100.0% |
Ancestry in Scotland Neck
The most populous ancestries reported in Scotland Neck are American (388 | 20.8%), English (92 | 4.9%), Irish (65 | 3.5%), European (60 | 3.2%), and German (59 | 3.2%), together accounting for 35.7% of all Scotland Neck residents.
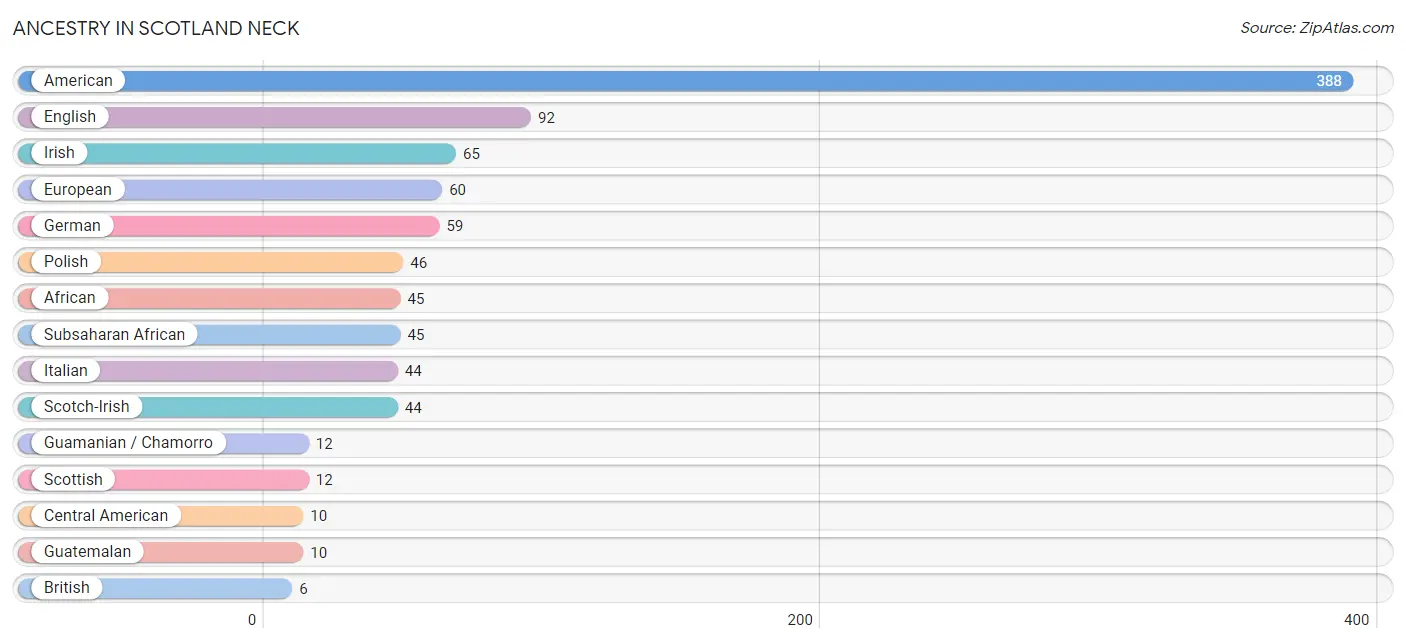
| Ancestry | # Population | % Population |
| African | 45 | 2.4% |
| American | 388 | 20.8% |
| British | 6 | 0.3% |
| Central American | 10 | 0.5% |
| English | 92 | 4.9% |
| European | 60 | 3.2% |
| French | 3 | 0.2% |
| French Canadian | 4 | 0.2% |
| German | 59 | 3.2% |
| Guamanian / Chamorro | 12 | 0.6% |
| Guatemalan | 10 | 0.5% |
| Irish | 65 | 3.5% |
| Italian | 44 | 2.4% |
| Mexican | 2 | 0.1% |
| Polish | 46 | 2.5% |
| Puerto Rican | 3 | 0.2% |
| Scotch-Irish | 44 | 2.4% |
| Scottish | 12 | 0.6% |
| Subsaharan African | 45 | 2.4% |
| Welsh | 3 | 0.2% | View All 20 Rows |
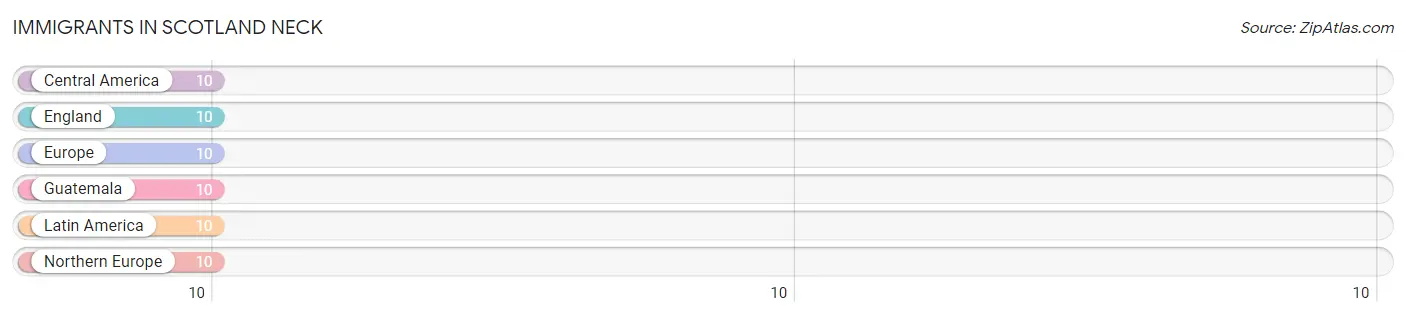
Immigrants in Scotland Neck
The most numerous immigrant groups reported in Scotland Neck came from Central America (10 | 0.5%), England (10 | 0.5%), Europe (10 | 0.5%), Guatemala (10 | 0.5%), and Latin America (10 | 0.5%), together accounting for 2.7% of all Scotland Neck residents.
| Immigration Origin | # Population | % Population |
| Central America | 10 | 0.5% |
| England | 10 | 0.5% |
| Europe | 10 | 0.5% |
| Guatemala | 10 | 0.5% |
| Latin America | 10 | 0.5% |
| Northern Europe | 10 | 0.5% | View All 6 Rows |
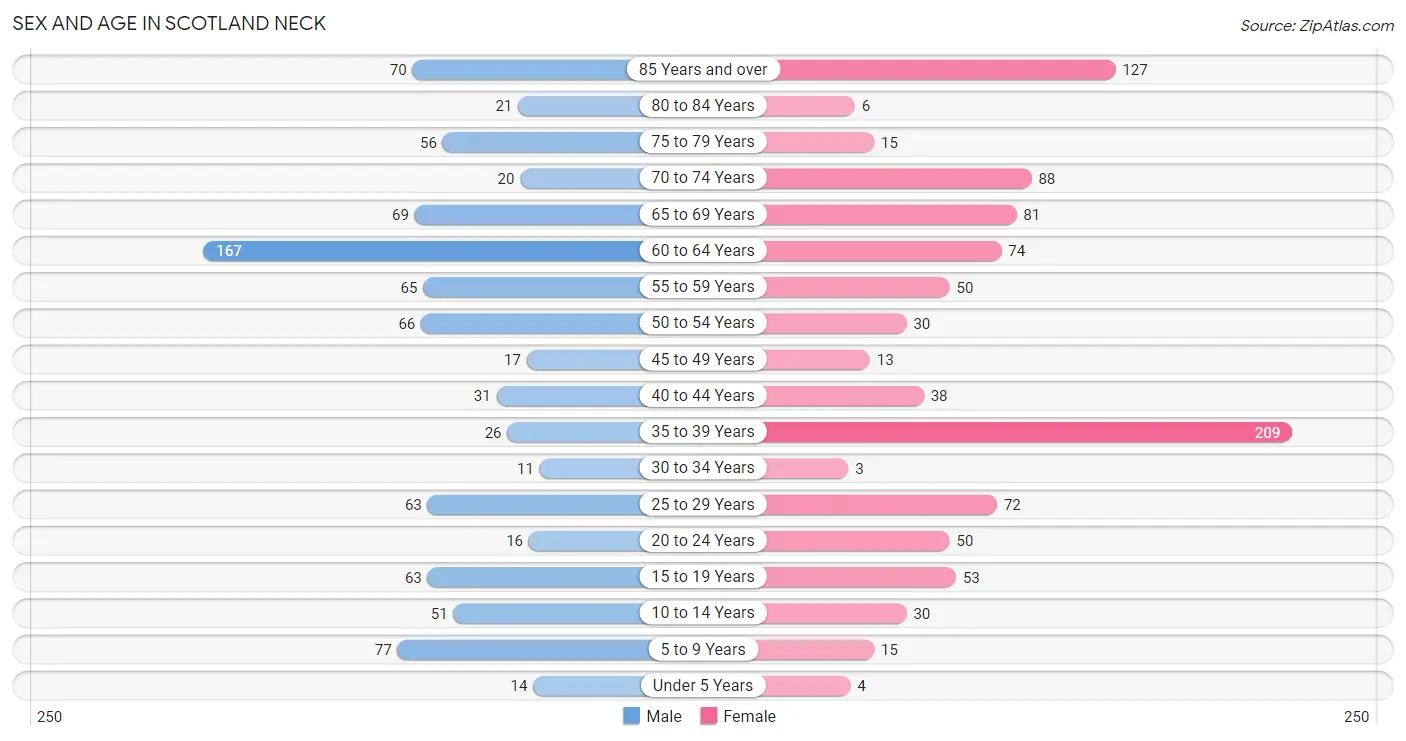
Sex and Age in Scotland Neck
Sex and Age in Scotland Neck
The most populous age groups in Scotland Neck are 60 to 64 Years (167 | 18.5%) for men and 35 to 39 Years (209 | 21.8%) for women.
| Age Bracket | Male | Female |
| Under 5 Years | 14 (1.5%) | 4 (0.4%) |
| 5 to 9 Years | 77 (8.5%) | 15 (1.6%) |
| 10 to 14 Years | 51 (5.7%) | 30 (3.1%) |
| 15 to 19 Years | 63 (7.0%) | 53 (5.5%) |
| 20 to 24 Years | 16 (1.8%) | 50 (5.2%) |
| 25 to 29 Years | 63 (7.0%) | 72 (7.5%) |
| 30 to 34 Years | 11 (1.2%) | 3 (0.3%) |
| 35 to 39 Years | 26 (2.9%) | 209 (21.8%) |
| 40 to 44 Years | 31 (3.4%) | 38 (4.0%) |
| 45 to 49 Years | 17 (1.9%) | 13 (1.4%) |
| 50 to 54 Years | 66 (7.3%) | 30 (3.1%) |
| 55 to 59 Years | 65 (7.2%) | 50 (5.2%) |
| 60 to 64 Years | 167 (18.5%) | 74 (7.7%) |
| 65 to 69 Years | 69 (7.6%) | 81 (8.5%) |
| 70 to 74 Years | 20 (2.2%) | 88 (9.2%) |
| 75 to 79 Years | 56 (6.2%) | 15 (1.6%) |
| 80 to 84 Years | 21 (2.3%) | 6 (0.6%) |
| 85 Years and over | 70 (7.7%) | 127 (13.3%) |
| Total | 903 (100.0%) | 958 (100.0%) |
Families and Households in Scotland Neck
Median Family Size in Scotland Neck
The median family size in Scotland Neck is 3.26 persons per family, with married-couple families (165 | 51.2%) accounting for the largest median family size of 3.48 persons per family. On the other hand, single male/father families (4 | 1.2%) represent the smallest median family size with 2.00 persons per family.
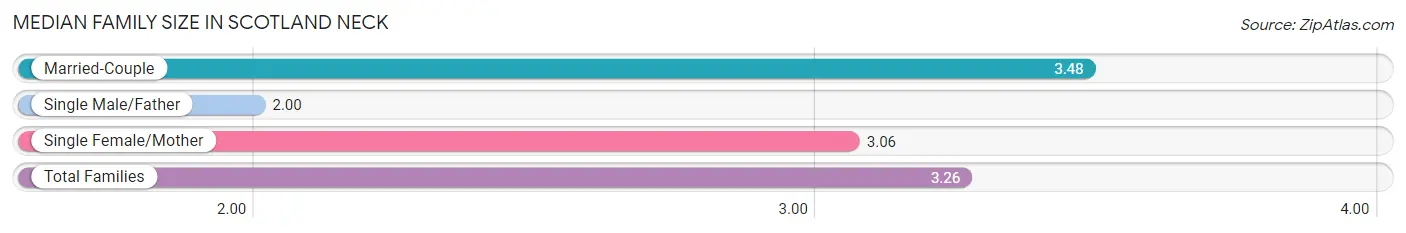
| Family Type | # Families | Family Size |
| Married-Couple | 165 (51.2%) | 3.48 |
| Single Male/Father | 4 (1.2%) | 2.00 |
| Single Female/Mother | 153 (47.5%) | 3.06 |
| Total Families | 322 (100.0%) | 3.26 |
Median Household Size in Scotland Neck
The median household size in Scotland Neck is 1.92 persons per household, with married-couple households (165 | 17.5%) accounting for the largest median household size of 3.48 persons per household. non-family households (621 | 65.8%) represent the smallest median household size with 1.22 persons per household.
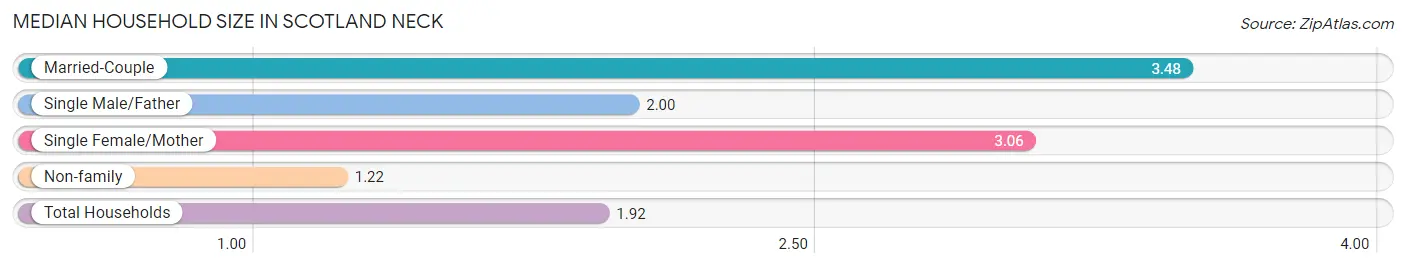
| Household Type | # Households | Household Size |
| Married-Couple | 165 (17.5%) | 3.48 |
| Single Male/Father | 4 (0.4%) | 2.00 |
| Single Female/Mother | 153 (16.2%) | 3.06 |
| Non-family | 621 (65.8%) | 1.22 |
| Total Households | 943 (100.0%) | 1.92 |
Household Size by Marriage Status in Scotland Neck
Out of a total of 943 households in Scotland Neck, 322 (34.2%) are family households, while 621 (65.8%) are nonfamily households. The most numerous type of family households are 2-person households, comprising 135, and the most common type of nonfamily households are 1-person households, comprising 497.
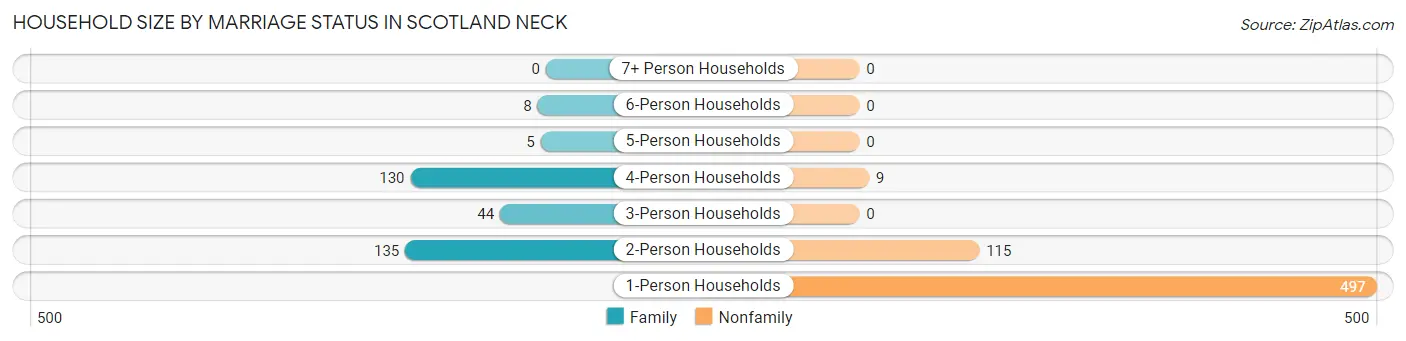
| Household Size | Family Households | Nonfamily Households |
| 1-Person Households | - | 497 (52.7%) |
| 2-Person Households | 135 (14.3%) | 115 (12.2%) |
| 3-Person Households | 44 (4.7%) | 0 (0.0%) |
| 4-Person Households | 130 (13.8%) | 9 (0.9%) |
| 5-Person Households | 5 (0.5%) | 0 (0.0%) |
| 6-Person Households | 8 (0.9%) | 0 (0.0%) |
| 7+ Person Households | 0 (0.0%) | 0 (0.0%) |
| Total | 322 (34.2%) | 621 (65.8%) |
Female Fertility in Scotland Neck
Fertility by Age in Scotland Neck
Average fertility rate in Scotland Neck is 34.0 births per 1,000 women. Women in the age bracket of 15 to 19 years have the highest fertility rate with 94.0 births per 1,000 women. Women in the age bracket of 20 to 34 years acount for 66.7% of all women with births.
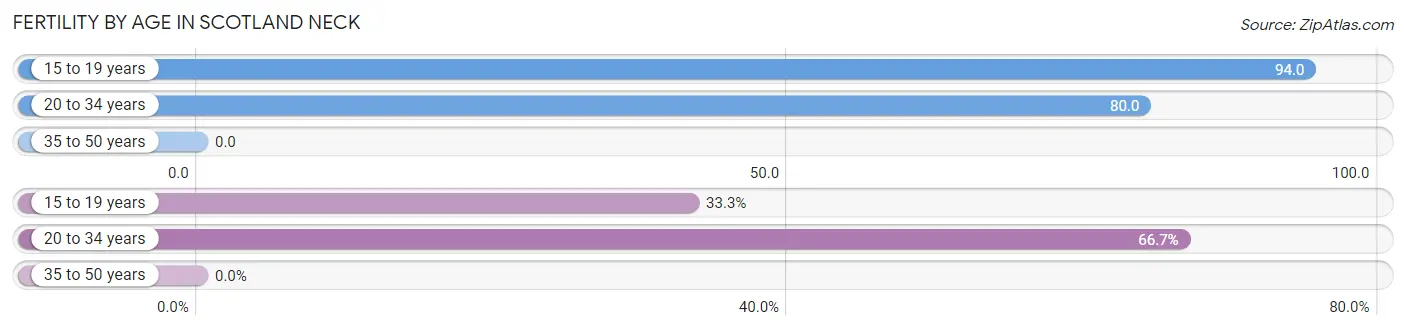
| Age Bracket | Women with Births | Births / 1,000 Women |
| 15 to 19 years | 5 (33.3%) | 94.0 |
| 20 to 34 years | 10 (66.7%) | 80.0 |
| 35 to 50 years | 0 (0.0%) | 0.0 |
| Total | 15 (100.0%) | 34.0 |
Fertility by Age by Marriage Status in Scotland Neck
33.3% of women with births (15) in Scotland Neck are married. The highest percentage of unmarried women with births falls into 20 to 34 years age bracket with 100.0% of them unmarried at the time of birth, while the lowest percentage of unmarried women with births belong to 15 to 19 years age bracket with 0.0% of them unmarried.
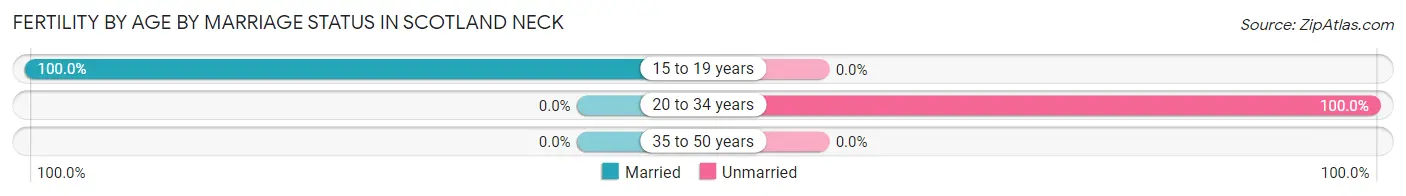
| Age Bracket | Married | Unmarried |
| 15 to 19 years | 5 (100.0%) | 0 (0.0%) |
| 20 to 34 years | 0 (0.0%) | 10 (100.0%) |
| 35 to 50 years | 0 (0.0%) | 0 (0.0%) |
| Total | 5 (33.3%) | 10 (66.7%) |
Fertility by Education in Scotland Neck
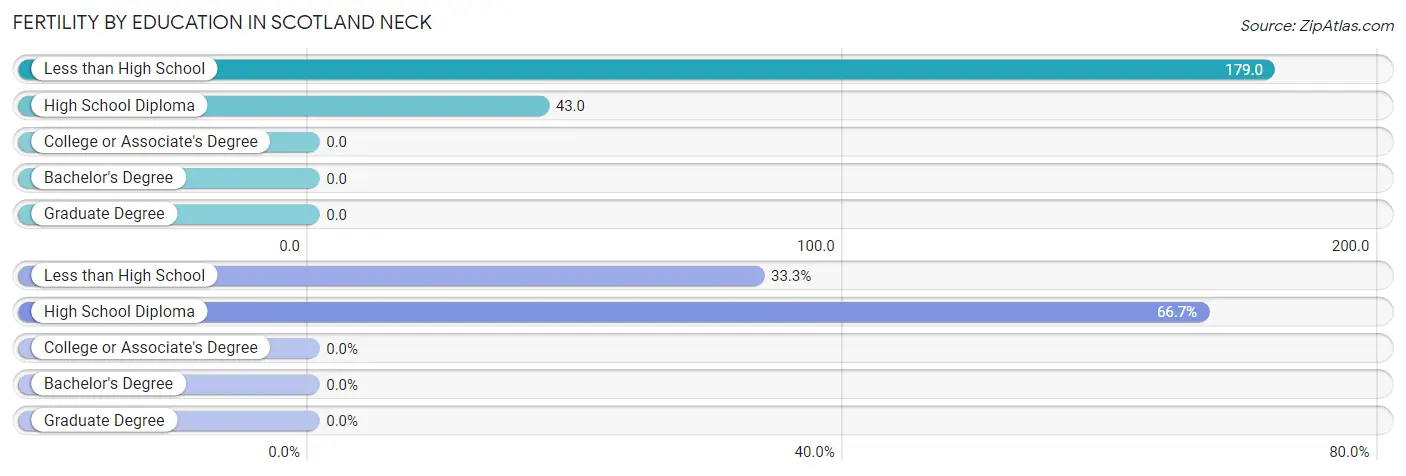
| Educational Attainment | Women with Births | Births / 1,000 Women |
| Less than High School | 5 (33.3%) | 179.0 |
| High School Diploma | 10 (66.7%) | 43.0 |
| College or Associate's Degree | 0 (0.0%) | 0.0 |
| Bachelor's Degree | 0 (0.0%) | 0.0 |
| Graduate Degree | 0 (0.0%) | 0.0 |
| Total | 15 (100.0%) | 34.0 |
Fertility by Education by Marriage Status in Scotland Neck
66.7% of women with births in Scotland Neck are unmarried. Women with the educational attainment of less than high school are most likely to be married with 100.0% of them married at childbirth, while women with the educational attainment of high school diploma are least likely to be married with 100.0% of them unmarried at childbirth.
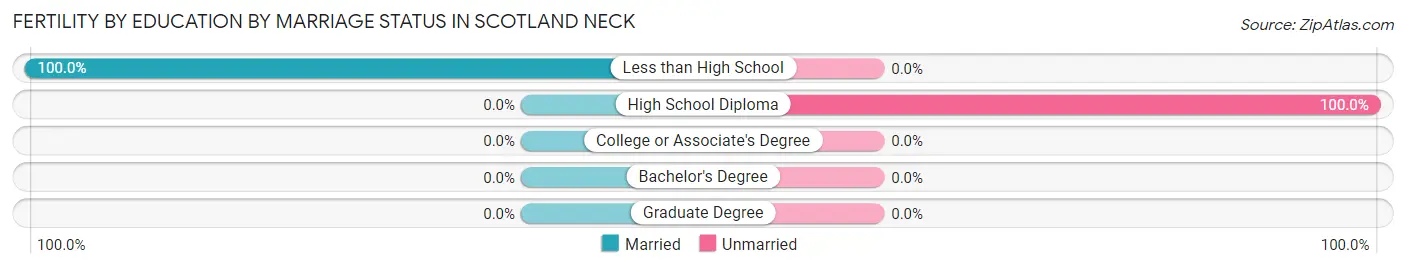
| Educational Attainment | Married | Unmarried |
| Less than High School | 5 (100.0%) | 0 (0.0%) |
| High School Diploma | 0 (0.0%) | 10 (100.0%) |
| College or Associate's Degree | 0 (0.0%) | 0 (0.0%) |
| Bachelor's Degree | 0 (0.0%) | 0 (0.0%) |
| Graduate Degree | 0 (0.0%) | 0 (0.0%) |
| Total | 5 (33.3%) | 10 (66.7%) |
Employment Characteristics in Scotland Neck
Employment by Class of Employer in Scotland Neck
Among the 552 employed individuals in Scotland Neck, private company employees (420 | 76.1%), not-for-profit organizations (38 | 6.9%), and federal government employees (33 | 6.0%) make up the most common classes of employment.
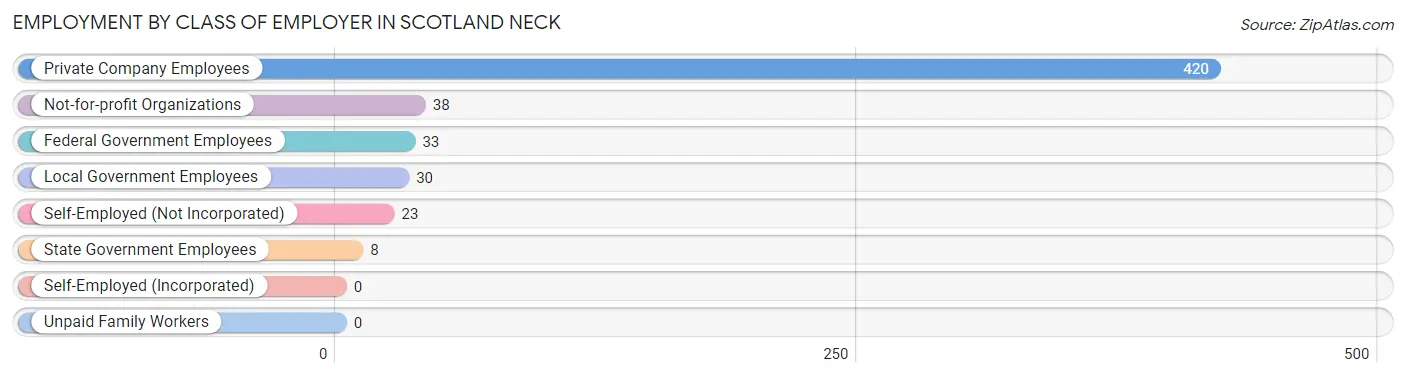
| Employer Class | # Employees | % Employees |
| Private Company Employees | 420 | 76.1% |
| Self-Employed (Incorporated) | 0 | 0.0% |
| Self-Employed (Not Incorporated) | 23 | 4.2% |
| Not-for-profit Organizations | 38 | 6.9% |
| Local Government Employees | 30 | 5.4% |
| State Government Employees | 8 | 1.5% |
| Federal Government Employees | 33 | 6.0% |
| Unpaid Family Workers | 0 | 0.0% |
| Total | 552 | 100.0% |
Employment Status by Age in Scotland Neck
According to the labor force statistics for Scotland Neck, out of the total population over 16 years of age (1,651), 39.1% or 646 individuals are in the labor force, with 10.7% or 69 of them unemployed. The age group with the highest labor force participation rate is 30 to 34 years, with 78.6% or 11 individuals in the labor force. Within the labor force, the 16 to 19 years age range has the highest percentage of unemployed individuals, with 71.4% or 30 of them being unemployed.
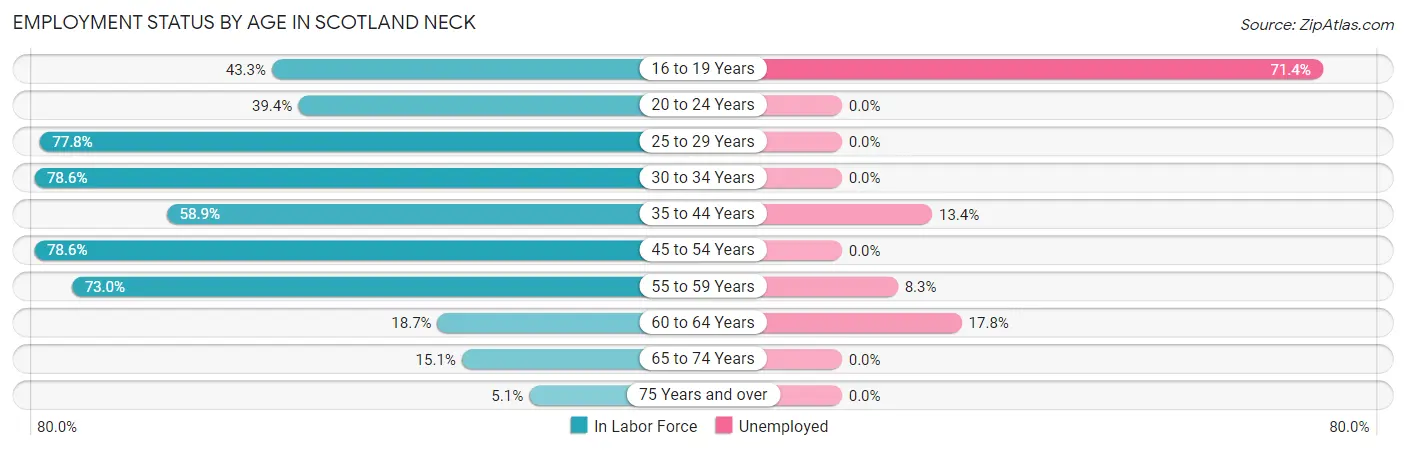
| Age Bracket | In Labor Force | Unemployed |
| 16 to 19 Years | 42 (43.3%) | 30 (71.4%) |
| 20 to 24 Years | 26 (39.4%) | 0 (0.0%) |
| 25 to 29 Years | 105 (77.8%) | 0 (0.0%) |
| 30 to 34 Years | 11 (78.6%) | 0 (0.0%) |
| 35 to 44 Years | 179 (58.9%) | 24 (13.4%) |
| 45 to 54 Years | 99 (78.6%) | 0 (0.0%) |
| 55 to 59 Years | 84 (73.0%) | 7 (8.3%) |
| 60 to 64 Years | 45 (18.7%) | 8 (17.8%) |
| 65 to 74 Years | 39 (15.1%) | 0 (0.0%) |
| 75 Years and over | 15 (5.1%) | 0 (0.0%) |
| Total | 646 (39.1%) | 69 (10.7%) |
Employment Status by Educational Attainment in Scotland Neck
According to labor force statistics for Scotland Neck, 55.9% of individuals (523) out of the total population between 25 and 64 years of age (935) are in the labor force, with 7.5% or 39 of them being unemployed. The group with the highest labor force participation rate are those with the educational attainment of bachelor's degree or higher, with 100.0% or 85 individuals in the labor force. Within the labor force, individuals with college / associate degree education have the highest percentage of unemployment, with 14.1% or 24 of them being unemployed.
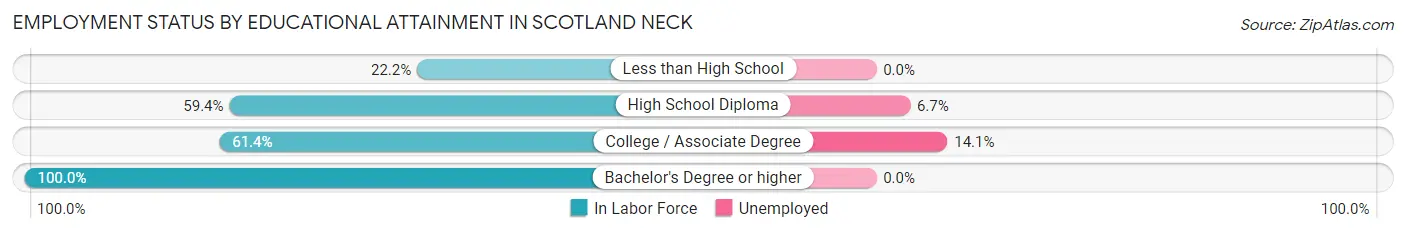
| Educational Attainment | In Labor Force | Unemployed |
| Less than High School | 43 (22.2%) | 0 (0.0%) |
| High School Diploma | 225 (59.4%) | 25 (6.7%) |
| College / Associate Degree | 170 (61.4%) | 39 (14.1%) |
| Bachelor's Degree or higher | 85 (100.0%) | 0 (0.0%) |
| Total | 523 (55.9%) | 70 (7.5%) |
Employment Occupations by Sex in Scotland Neck
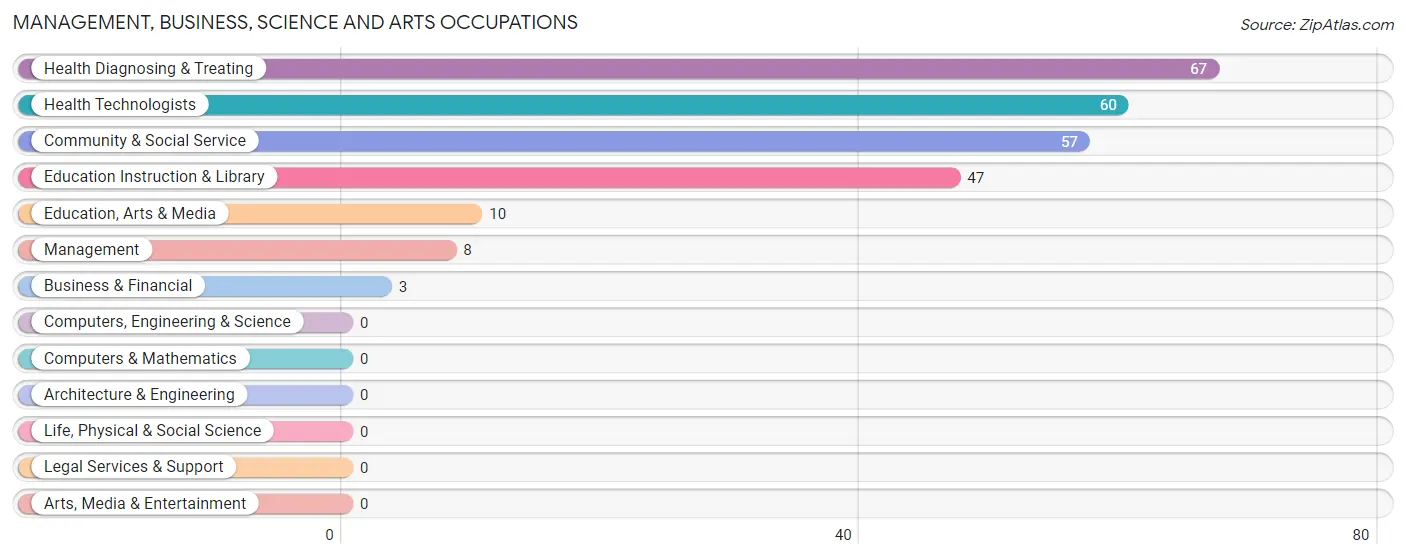
Management, Business, Science and Arts Occupations
The most common Management, Business, Science and Arts occupations in Scotland Neck are Health Diagnosing & Treating (67 | 11.6%), Health Technologists (60 | 10.4%), Community & Social Service (57 | 9.9%), Education Instruction & Library (47 | 8.2%), and Education, Arts & Media (10 | 1.7%).
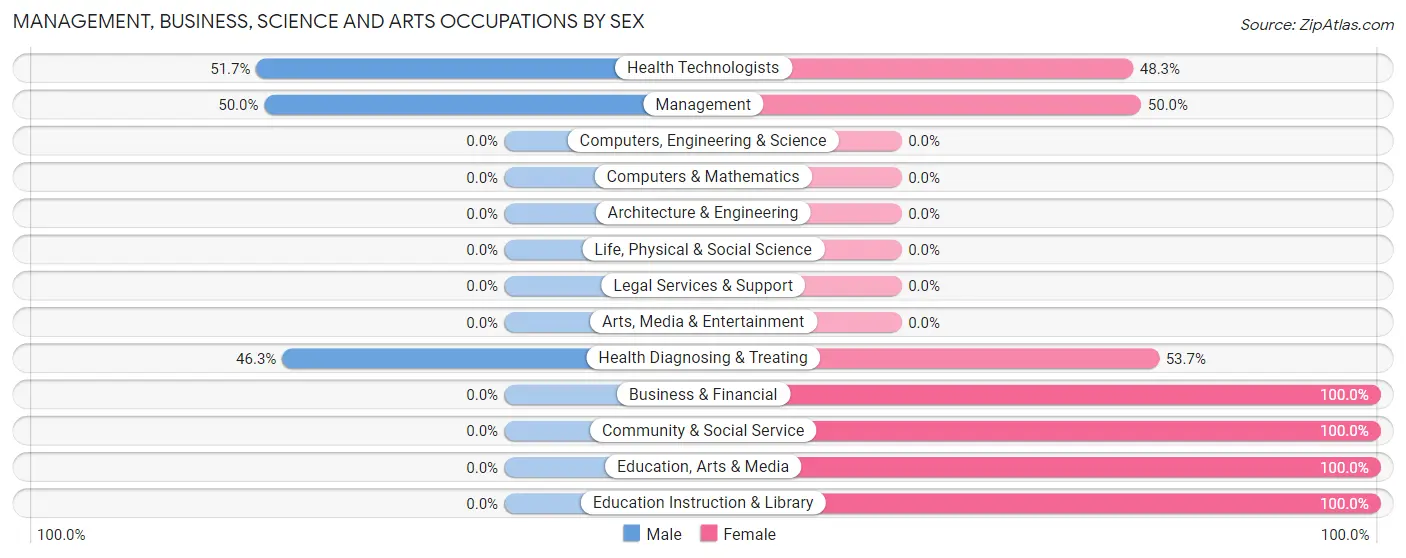
Management, Business, Science and Arts Occupations by Sex
Within the Management, Business, Science and Arts occupations in Scotland Neck, the most male-oriented occupations are Health Technologists (51.7%), Management (50.0%), and Health Diagnosing & Treating (46.3%), while the most female-oriented occupations are Business & Financial (100.0%), Community & Social Service (100.0%), and Education, Arts & Media (100.0%).
| Occupation | Male | Female |
| Management | 4 (50.0%) | 4 (50.0%) |
| Business & Financial | 0 (0.0%) | 3 (100.0%) |
| Computers, Engineering & Science | 0 (0.0%) | 0 (0.0%) |
| Computers & Mathematics | 0 (0.0%) | 0 (0.0%) |
| Architecture & Engineering | 0 (0.0%) | 0 (0.0%) |
| Life, Physical & Social Science | 0 (0.0%) | 0 (0.0%) |
| Community & Social Service | 0 (0.0%) | 57 (100.0%) |
| Education, Arts & Media | 0 (0.0%) | 10 (100.0%) |
| Legal Services & Support | 0 (0.0%) | 0 (0.0%) |
| Education Instruction & Library | 0 (0.0%) | 47 (100.0%) |
| Arts, Media & Entertainment | 0 (0.0%) | 0 (0.0%) |
| Health Diagnosing & Treating | 31 (46.3%) | 36 (53.7%) |
| Health Technologists | 31 (51.7%) | 29 (48.3%) |
| Total (Category) | 35 (25.9%) | 100 (74.1%) |
| Total (Overall) | 343 (59.6%) | 233 (40.5%) |
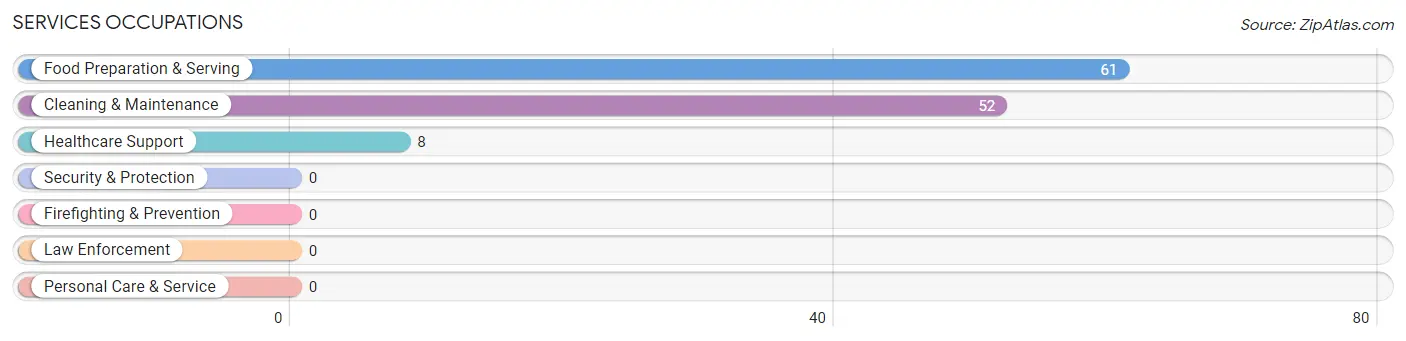
Services Occupations
The most common Services occupations in Scotland Neck are Food Preparation & Serving (61 | 10.6%), Cleaning & Maintenance (52 | 9.0%), and Healthcare Support (8 | 1.4%).
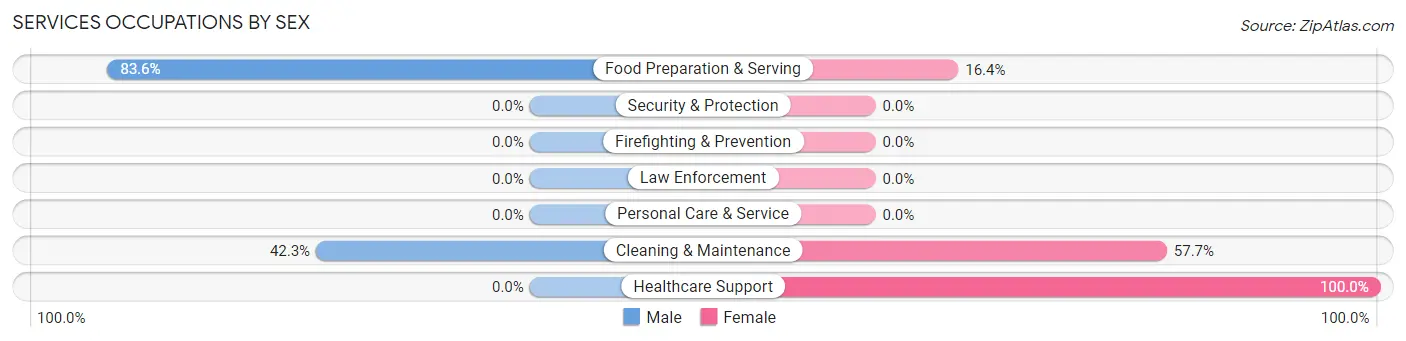
Services Occupations by Sex
Within the Services occupations in Scotland Neck, the most male-oriented occupations are Food Preparation & Serving (83.6%), and Cleaning & Maintenance (42.3%), while the most female-oriented occupations are Healthcare Support (100.0%), Cleaning & Maintenance (57.7%), and Food Preparation & Serving (16.4%).
| Occupation | Male | Female |
| Healthcare Support | 0 (0.0%) | 8 (100.0%) |
| Security & Protection | 0 (0.0%) | 0 (0.0%) |
| Firefighting & Prevention | 0 (0.0%) | 0 (0.0%) |
| Law Enforcement | 0 (0.0%) | 0 (0.0%) |
| Food Preparation & Serving | 51 (83.6%) | 10 (16.4%) |
| Cleaning & Maintenance | 22 (42.3%) | 30 (57.7%) |
| Personal Care & Service | 0 (0.0%) | 0 (0.0%) |
| Total (Category) | 73 (60.3%) | 48 (39.7%) |
| Total (Overall) | 343 (59.6%) | 233 (40.5%) |
Sales and Office Occupations
The most common Sales and Office occupations in Scotland Neck are Sales & Related (39 | 6.8%), and Office & Administration (19 | 3.3%).

Sales and Office Occupations by Sex

| Occupation | Male | Female |
| Sales & Related | 35 (89.7%) | 4 (10.3%) |
| Office & Administration | 19 (100.0%) | 0 (0.0%) |
| Total (Category) | 54 (93.1%) | 4 (6.9%) |
| Total (Overall) | 343 (59.6%) | 233 (40.5%) |
Natural Resources, Construction and Maintenance Occupations
The most common Natural Resources, Construction and Maintenance occupations in Scotland Neck are Farming, Fishing & Forestry (51 | 8.8%), Construction & Extraction (12 | 2.1%), and Installation, Maintenance & Repair (12 | 2.1%).
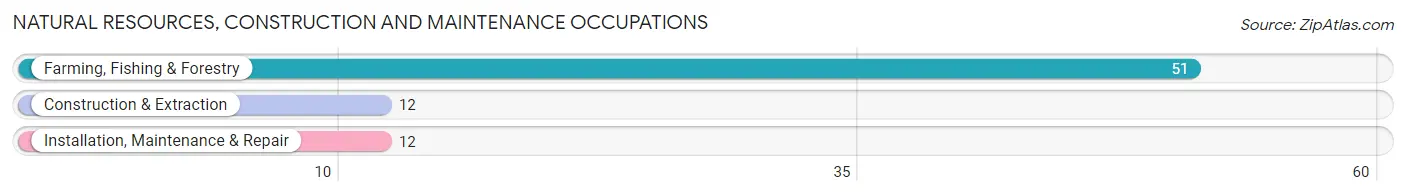
Natural Resources, Construction and Maintenance Occupations by Sex
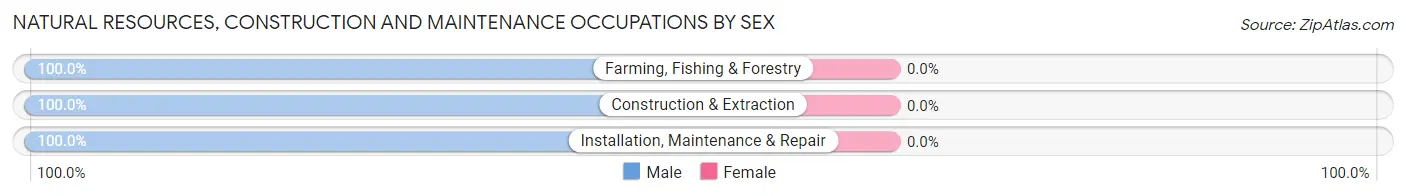
| Occupation | Male | Female |
| Farming, Fishing & Forestry | 51 (100.0%) | 0 (0.0%) |
| Construction & Extraction | 12 (100.0%) | 0 (0.0%) |
| Installation, Maintenance & Repair | 12 (100.0%) | 0 (0.0%) |
| Total (Category) | 75 (100.0%) | 0 (0.0%) |
| Total (Overall) | 343 (59.6%) | 233 (40.5%) |
Production, Transportation and Moving Occupations
The most common Production, Transportation and Moving occupations in Scotland Neck are Production (116 | 20.1%), Material Moving (42 | 7.3%), and Transportation (29 | 5.0%).
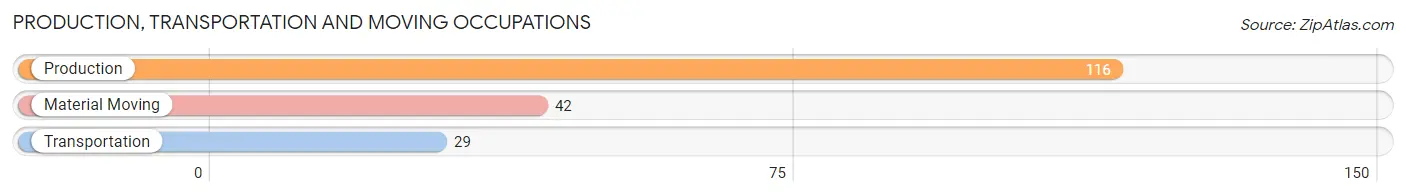
Production, Transportation and Moving Occupations by Sex
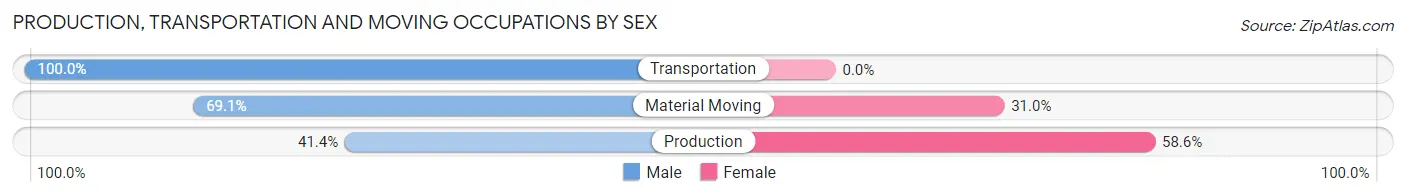
| Occupation | Male | Female |
| Production | 48 (41.4%) | 68 (58.6%) |
| Transportation | 29 (100.0%) | 0 (0.0%) |
| Material Moving | 29 (69.1%) | 13 (30.9%) |
| Total (Category) | 106 (56.7%) | 81 (43.3%) |
| Total (Overall) | 343 (59.6%) | 233 (40.5%) |
Employment Industries by Sex in Scotland Neck
Employment Industries in Scotland Neck
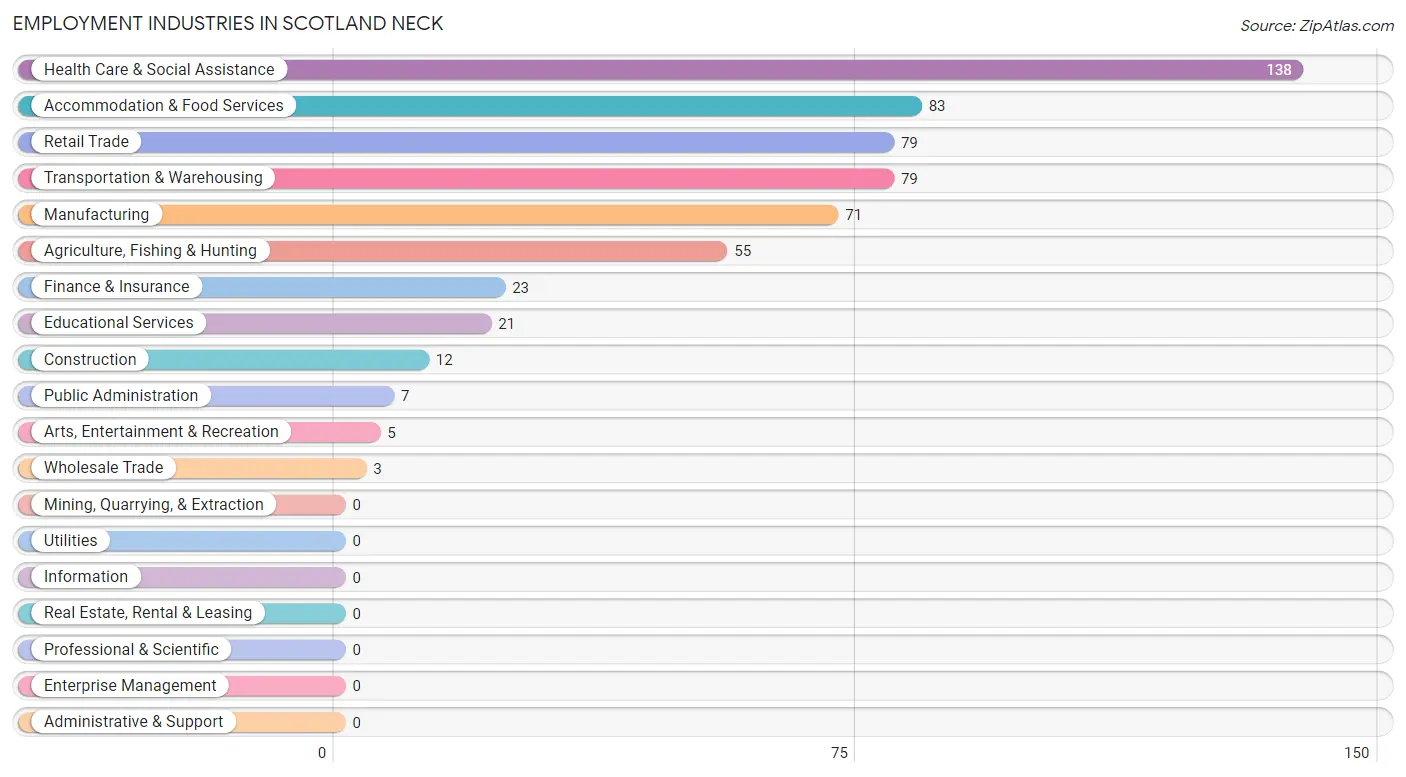
The major employment industries in Scotland Neck include Health Care & Social Assistance (138 | 24.0%), Accommodation & Food Services (83 | 14.4%), Retail Trade (79 | 13.7%), Transportation & Warehousing (79 | 13.7%), and Manufacturing (71 | 12.3%).
Employment Industries by Sex in Scotland Neck
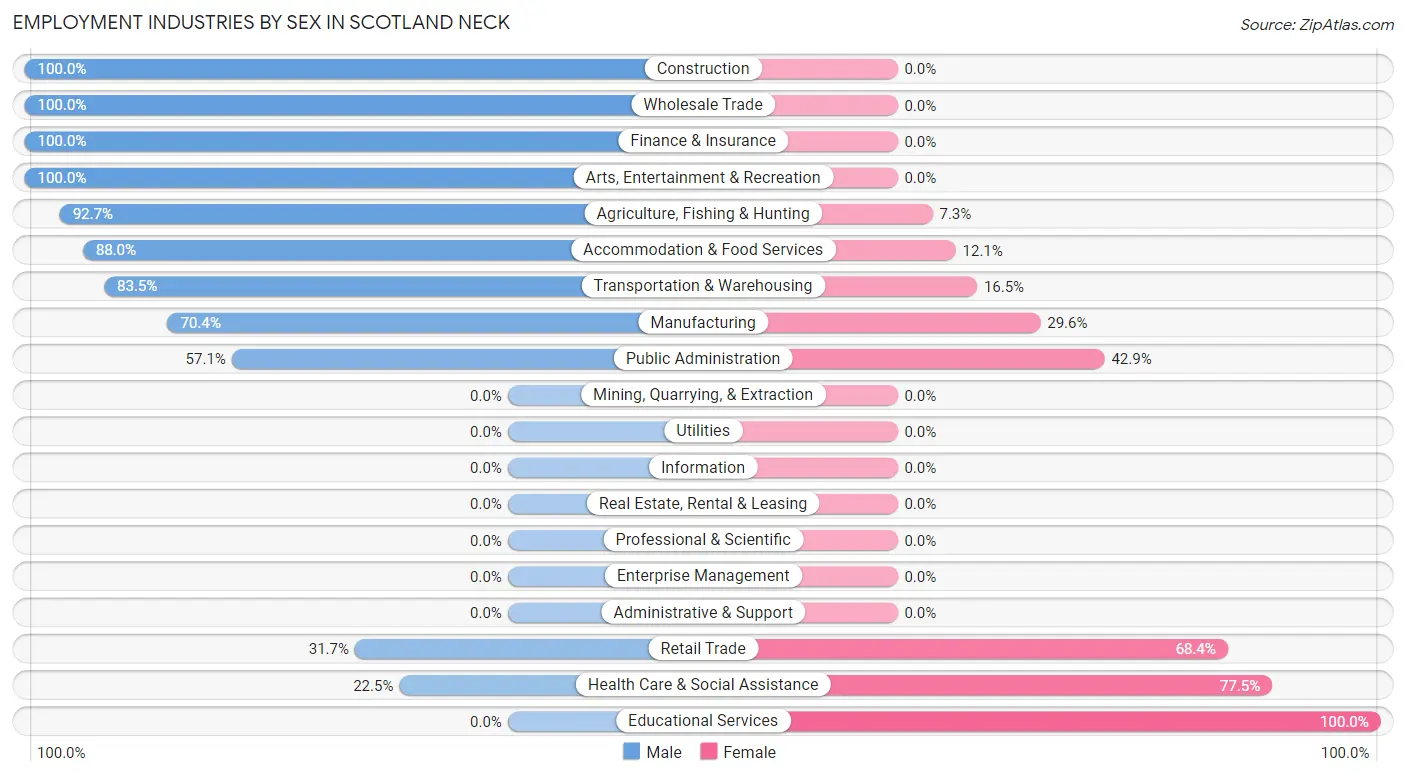
The Scotland Neck industries that see more men than women are Construction (100.0%), Wholesale Trade (100.0%), and Finance & Insurance (100.0%), whereas the industries that tend to have a higher number of women are Educational Services (100.0%), Health Care & Social Assistance (77.5%), and Retail Trade (68.3%).
| Industry | Male | Female |
| Agriculture, Fishing & Hunting | 51 (92.7%) | 4 (7.3%) |
| Mining, Quarrying, & Extraction | 0 (0.0%) | 0 (0.0%) |
| Construction | 12 (100.0%) | 0 (0.0%) |
| Manufacturing | 50 (70.4%) | 21 (29.6%) |
| Wholesale Trade | 3 (100.0%) | 0 (0.0%) |
| Retail Trade | 25 (31.7%) | 54 (68.3%) |
| Transportation & Warehousing | 66 (83.5%) | 13 (16.5%) |
| Utilities | 0 (0.0%) | 0 (0.0%) |
| Information | 0 (0.0%) | 0 (0.0%) |
| Finance & Insurance | 23 (100.0%) | 0 (0.0%) |
| Real Estate, Rental & Leasing | 0 (0.0%) | 0 (0.0%) |
| Professional & Scientific | 0 (0.0%) | 0 (0.0%) |
| Enterprise Management | 0 (0.0%) | 0 (0.0%) |
| Administrative & Support | 0 (0.0%) | 0 (0.0%) |
| Educational Services | 0 (0.0%) | 21 (100.0%) |
| Health Care & Social Assistance | 31 (22.5%) | 107 (77.5%) |
| Arts, Entertainment & Recreation | 5 (100.0%) | 0 (0.0%) |
| Accommodation & Food Services | 73 (87.9%) | 10 (12.0%) |
| Public Administration | 4 (57.1%) | 3 (42.9%) |
| Total | 343 (59.6%) | 233 (40.5%) |
Education in Scotland Neck
School Enrollment in Scotland Neck
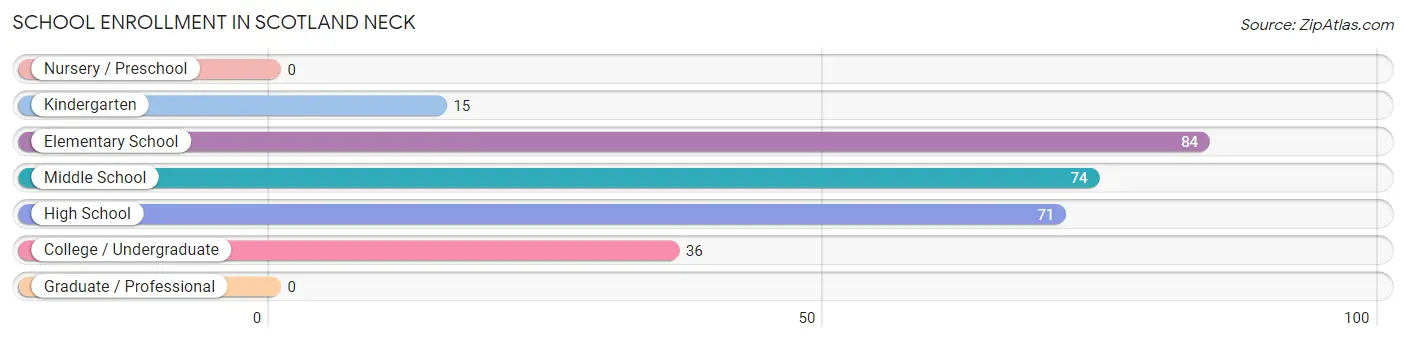
The most common levels of schooling among the 280 students in Scotland Neck are elementary school (84 | 30.0%), middle school (74 | 26.4%), and high school (71 | 25.4%).
| School Level | # Students | % Students |
| Nursery / Preschool | 0 | 0.0% |
| Kindergarten | 15 | 5.4% |
| Elementary School | 84 | 30.0% |
| Middle School | 74 | 26.4% |
| High School | 71 | 25.4% |
| College / Undergraduate | 36 | 12.9% |
| Graduate / Professional | 0 | 0.0% |
| Total | 280 | 100.0% |
School Enrollment by Age by Funding Source in Scotland Neck
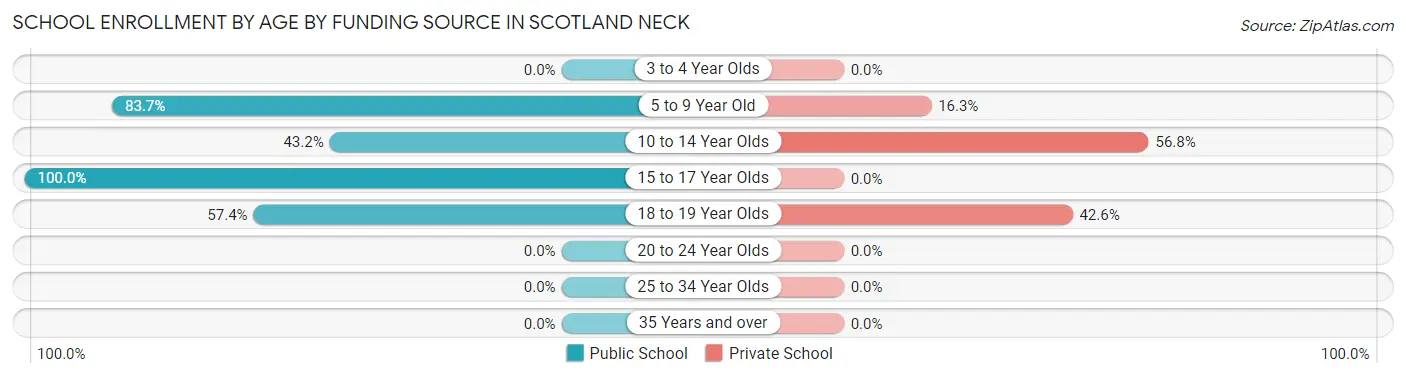
Out of a total of 280 students who are enrolled in schools in Scotland Neck, 87 (31.1%) attend a private institution, while the remaining 193 (68.9%) are enrolled in public schools. The age group of 10 to 14 year olds has the highest likelihood of being enrolled in private schools, with 46 (56.8% in the age bracket) enrolled. Conversely, the age group of 15 to 17 year olds has the lowest likelihood of being enrolled in a private school, with 46 (100.0% in the age bracket) attending a public institution.
| Age Bracket | Public School | Private School |
| 3 to 4 Year Olds | 0 (0.0%) | 0 (0.0%) |
| 5 to 9 Year Old | 77 (83.7%) | 15 (16.3%) |
| 10 to 14 Year Olds | 35 (43.2%) | 46 (56.8%) |
| 15 to 17 Year Olds | 46 (100.0%) | 0 (0.0%) |
| 18 to 19 Year Olds | 35 (57.4%) | 26 (42.6%) |
| 20 to 24 Year Olds | 0 (0.0%) | 0 (0.0%) |
| 25 to 34 Year Olds | 0 (0.0%) | 0 (0.0%) |
| 35 Years and over | 0 (0.0%) | 0 (0.0%) |
| Total | 193 (68.9%) | 87 (31.1%) |
Educational Attainment by Field of Study in Scotland Neck
Bio, nature & agricultural (47 | 28.5%), business (30 | 18.2%), psychology (26 | 15.8%), communications (21 | 12.7%), and education (20 | 12.1%) are the most common fields of study among 165 individuals in Scotland Neck who have obtained a bachelor's degree or higher.
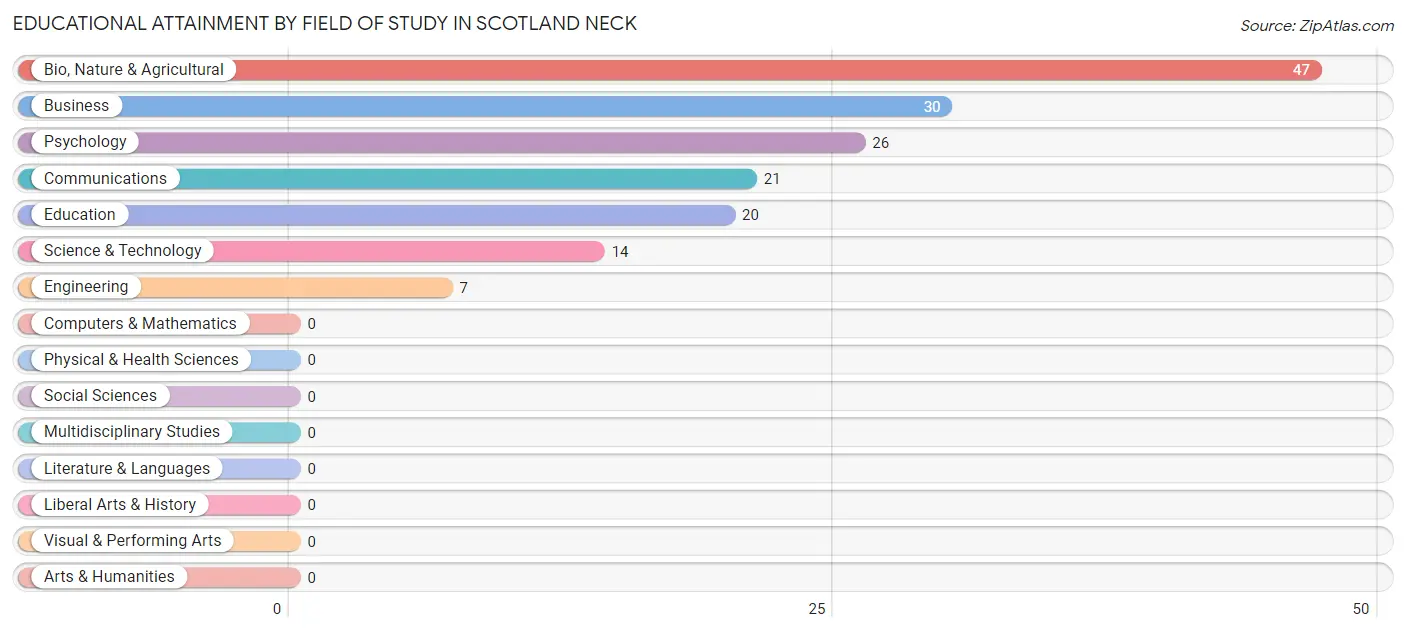
| Field of Study | # Graduates | % Graduates |
| Computers & Mathematics | 0 | 0.0% |
| Bio, Nature & Agricultural | 47 | 28.5% |
| Physical & Health Sciences | 0 | 0.0% |
| Psychology | 26 | 15.8% |
| Social Sciences | 0 | 0.0% |
| Engineering | 7 | 4.2% |
| Multidisciplinary Studies | 0 | 0.0% |
| Science & Technology | 14 | 8.5% |
| Business | 30 | 18.2% |
| Education | 20 | 12.1% |
| Literature & Languages | 0 | 0.0% |
| Liberal Arts & History | 0 | 0.0% |
| Visual & Performing Arts | 0 | 0.0% |
| Communications | 21 | 12.7% |
| Arts & Humanities | 0 | 0.0% |
| Total | 165 | 100.0% |
Transportation & Commute in Scotland Neck
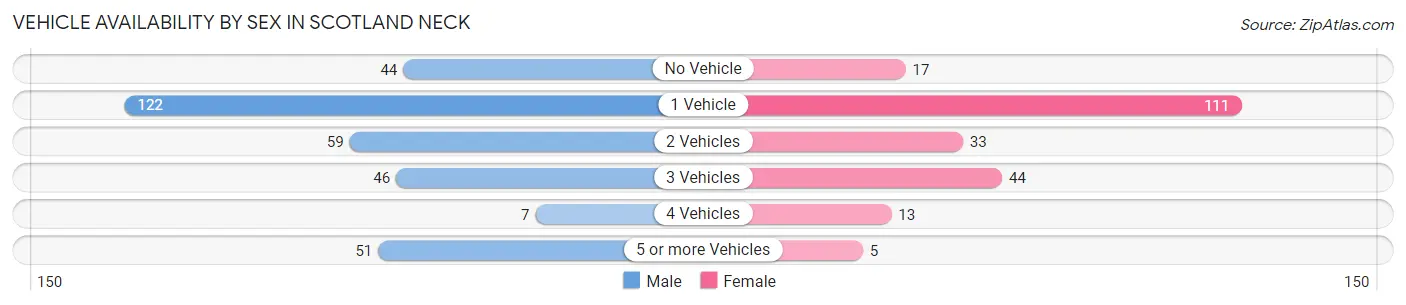
Vehicle Availability by Sex in Scotland Neck
The most prevalent vehicle ownership categories in Scotland Neck are males with 1 vehicle (122, accounting for 37.1%) and females with 1 vehicle (111, making up 54.7%).
| Vehicles Available | Male | Female |
| No Vehicle | 44 (13.4%) | 17 (7.6%) |
| 1 Vehicle | 122 (37.1%) | 111 (49.8%) |
| 2 Vehicles | 59 (17.9%) | 33 (14.8%) |
| 3 Vehicles | 46 (14.0%) | 44 (19.7%) |
| 4 Vehicles | 7 (2.1%) | 13 (5.8%) |
| 5 or more Vehicles | 51 (15.5%) | 5 (2.2%) |
| Total | 329 (100.0%) | 223 (100.0%) |
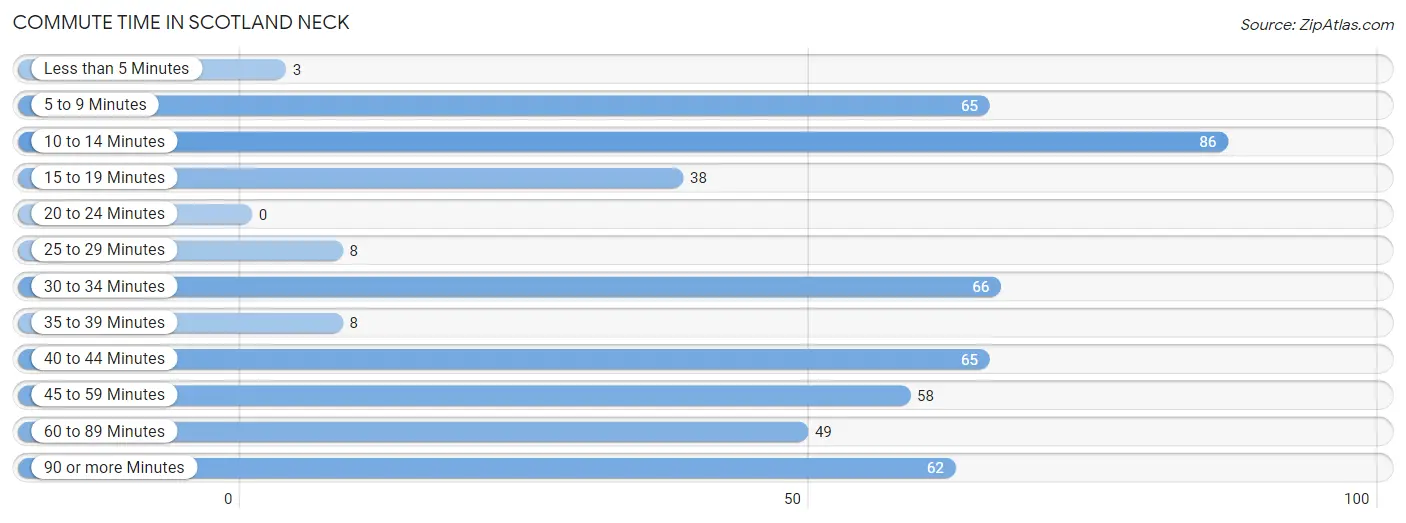
Commute Time in Scotland Neck
The most frequently occuring commute durations in Scotland Neck are 10 to 14 minutes (86 commuters, 16.9%), 30 to 34 minutes (66 commuters, 13.0%), and 5 to 9 minutes (65 commuters, 12.8%).
| Commute Time | # Commuters | % Commuters |
| Less than 5 Minutes | 3 | 0.6% |
| 5 to 9 Minutes | 65 | 12.8% |
| 10 to 14 Minutes | 86 | 16.9% |
| 15 to 19 Minutes | 38 | 7.5% |
| 20 to 24 Minutes | 0 | 0.0% |
| 25 to 29 Minutes | 8 | 1.6% |
| 30 to 34 Minutes | 66 | 13.0% |
| 35 to 39 Minutes | 8 | 1.6% |
| 40 to 44 Minutes | 65 | 12.8% |
| 45 to 59 Minutes | 58 | 11.4% |
| 60 to 89 Minutes | 49 | 9.7% |
| 90 or more Minutes | 62 | 12.2% |
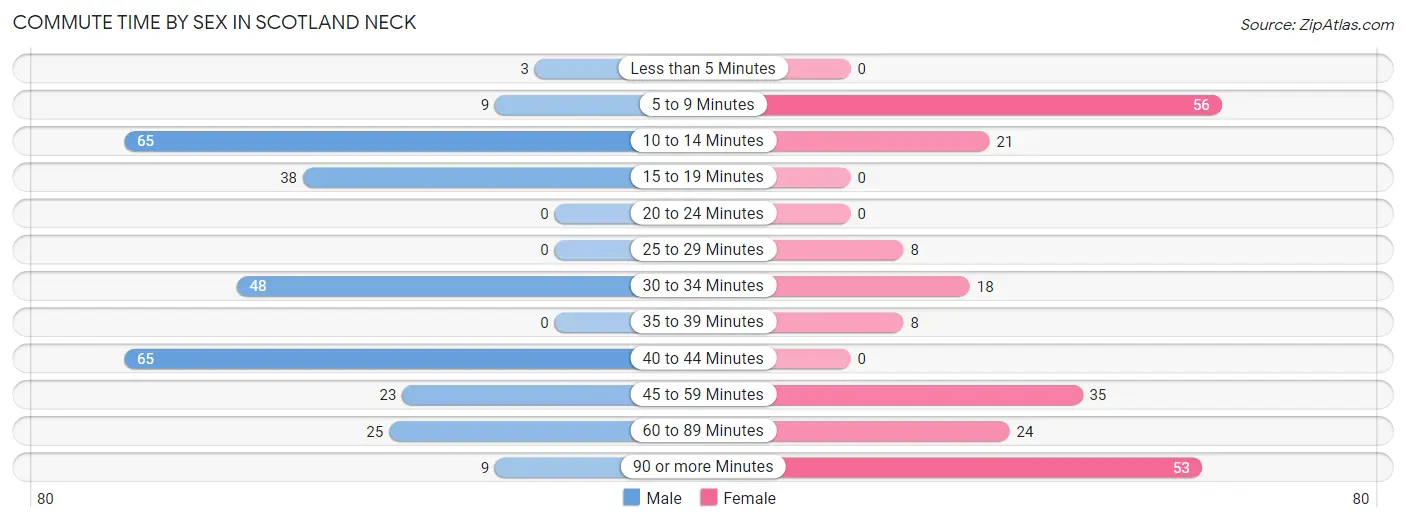
Commute Time by Sex in Scotland Neck
The most common commute times in Scotland Neck are 10 to 14 minutes (65 commuters, 22.8%) for males and 5 to 9 minutes (56 commuters, 25.1%) for females.
| Commute Time | Male | Female |
| Less than 5 Minutes | 3 (1.1%) | 0 (0.0%) |
| 5 to 9 Minutes | 9 (3.2%) | 56 (25.1%) |
| 10 to 14 Minutes | 65 (22.8%) | 21 (9.4%) |
| 15 to 19 Minutes | 38 (13.3%) | 0 (0.0%) |
| 20 to 24 Minutes | 0 (0.0%) | 0 (0.0%) |
| 25 to 29 Minutes | 0 (0.0%) | 8 (3.6%) |
| 30 to 34 Minutes | 48 (16.8%) | 18 (8.1%) |
| 35 to 39 Minutes | 0 (0.0%) | 8 (3.6%) |
| 40 to 44 Minutes | 65 (22.8%) | 0 (0.0%) |
| 45 to 59 Minutes | 23 (8.1%) | 35 (15.7%) |
| 60 to 89 Minutes | 25 (8.8%) | 24 (10.8%) |
| 90 or more Minutes | 9 (3.2%) | 53 (23.8%) |
Time of Departure to Work by Sex in Scotland Neck
The most frequent times of departure to work in Scotland Neck are 8:00 AM to 8:29 AM (66, 23.2%) for males and 6:30 AM to 6:59 AM (94, 42.1%) for females.
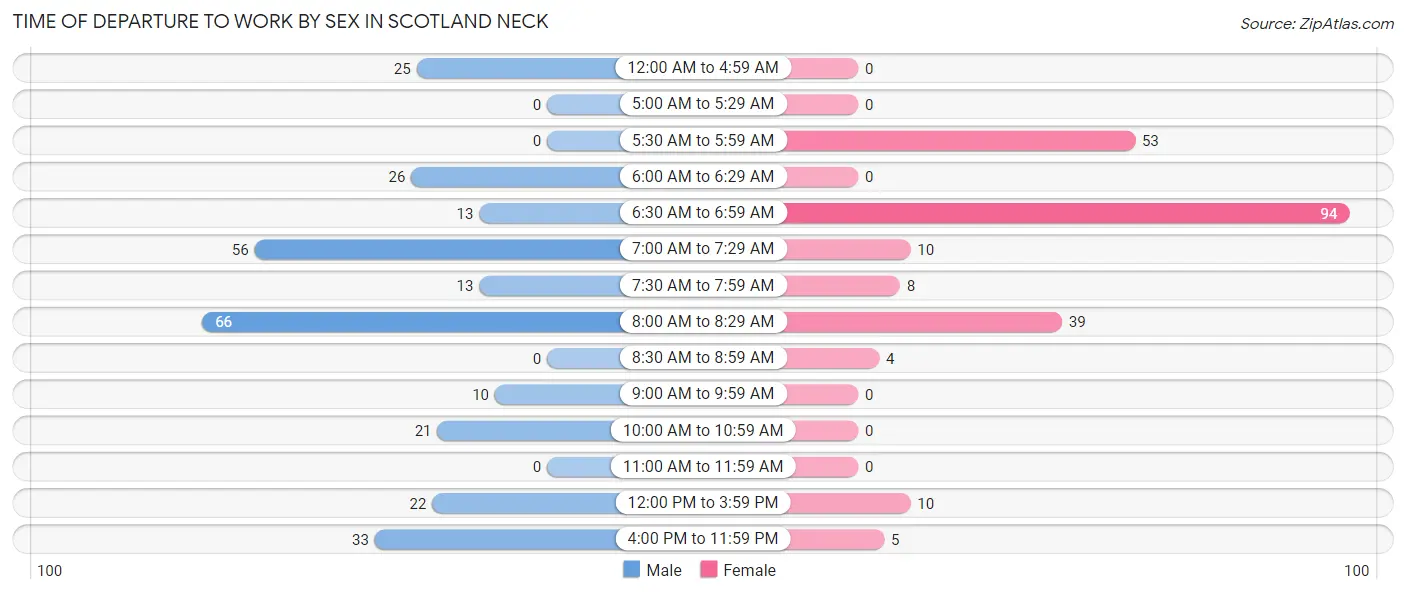
| Time of Departure | Male | Female |
| 12:00 AM to 4:59 AM | 25 (8.8%) | 0 (0.0%) |
| 5:00 AM to 5:29 AM | 0 (0.0%) | 0 (0.0%) |
| 5:30 AM to 5:59 AM | 0 (0.0%) | 53 (23.8%) |
| 6:00 AM to 6:29 AM | 26 (9.1%) | 0 (0.0%) |
| 6:30 AM to 6:59 AM | 13 (4.6%) | 94 (42.1%) |
| 7:00 AM to 7:29 AM | 56 (19.7%) | 10 (4.5%) |
| 7:30 AM to 7:59 AM | 13 (4.6%) | 8 (3.6%) |
| 8:00 AM to 8:29 AM | 66 (23.2%) | 39 (17.5%) |
| 8:30 AM to 8:59 AM | 0 (0.0%) | 4 (1.8%) |
| 9:00 AM to 9:59 AM | 10 (3.5%) | 0 (0.0%) |
| 10:00 AM to 10:59 AM | 21 (7.4%) | 0 (0.0%) |
| 11:00 AM to 11:59 AM | 0 (0.0%) | 0 (0.0%) |
| 12:00 PM to 3:59 PM | 22 (7.7%) | 10 (4.5%) |
| 4:00 PM to 11:59 PM | 33 (11.6%) | 5 (2.2%) |
| Total | 285 (100.0%) | 223 (100.0%) |
Housing Occupancy in Scotland Neck
Occupancy by Ownership in Scotland Neck
Of the total 943 dwellings in Scotland Neck, owner-occupied units account for 418 (44.3%), while renter-occupied units make up 525 (55.7%).
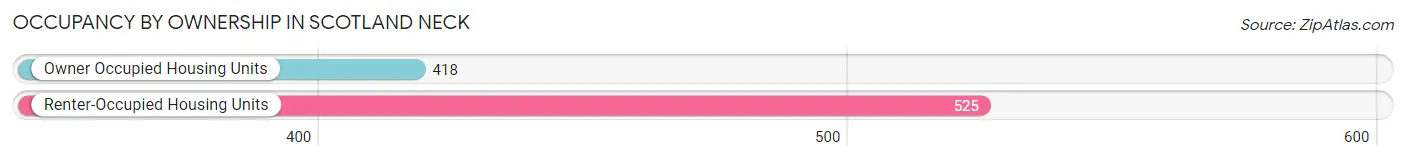
| Occupancy | # Housing Units | % Housing Units |
| Owner Occupied Housing Units | 418 | 44.3% |
| Renter-Occupied Housing Units | 525 | 55.7% |
| Total Occupied Housing Units | 943 | 100.0% |
Occupancy by Household Size in Scotland Neck
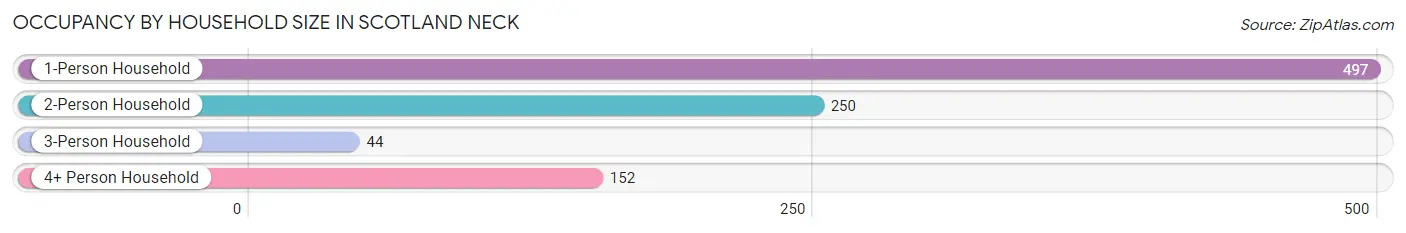
| Household Size | # Housing Units | % Housing Units |
| 1-Person Household | 497 | 52.7% |
| 2-Person Household | 250 | 26.5% |
| 3-Person Household | 44 | 4.7% |
| 4+ Person Household | 152 | 16.1% |
| Total Housing Units | 943 | 100.0% |
Occupancy by Ownership by Household Size in Scotland Neck
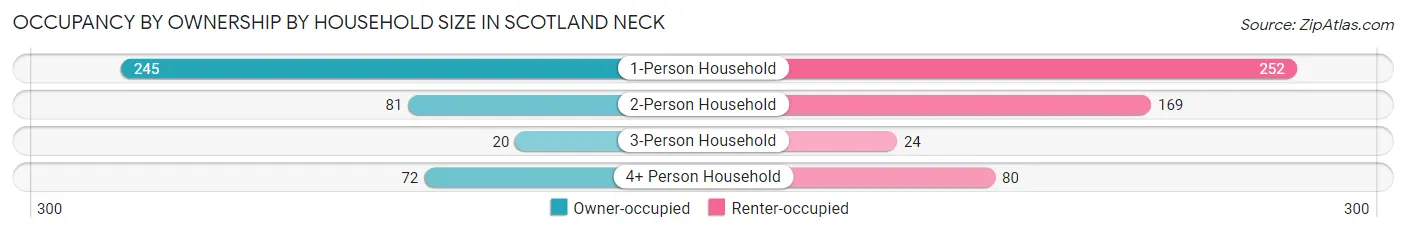
| Household Size | Owner-occupied | Renter-occupied |
| 1-Person Household | 245 (49.3%) | 252 (50.7%) |
| 2-Person Household | 81 (32.4%) | 169 (67.6%) |
| 3-Person Household | 20 (45.5%) | 24 (54.5%) |
| 4+ Person Household | 72 (47.4%) | 80 (52.6%) |
| Total Housing Units | 418 (44.3%) | 525 (55.7%) |
Occupancy by Educational Attainment in Scotland Neck
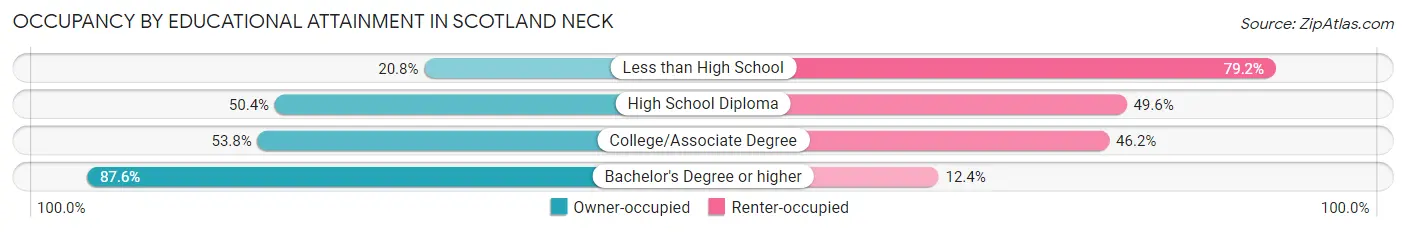
| Household Size | Owner-occupied | Renter-occupied |
| Less than High School | 71 (20.8%) | 271 (79.2%) |
| High School Diploma | 135 (50.4%) | 133 (49.6%) |
| College/Associate Degree | 127 (53.8%) | 109 (46.2%) |
| Bachelor's Degree or higher | 85 (87.6%) | 12 (12.4%) |
Occupancy by Age of Householder in Scotland Neck
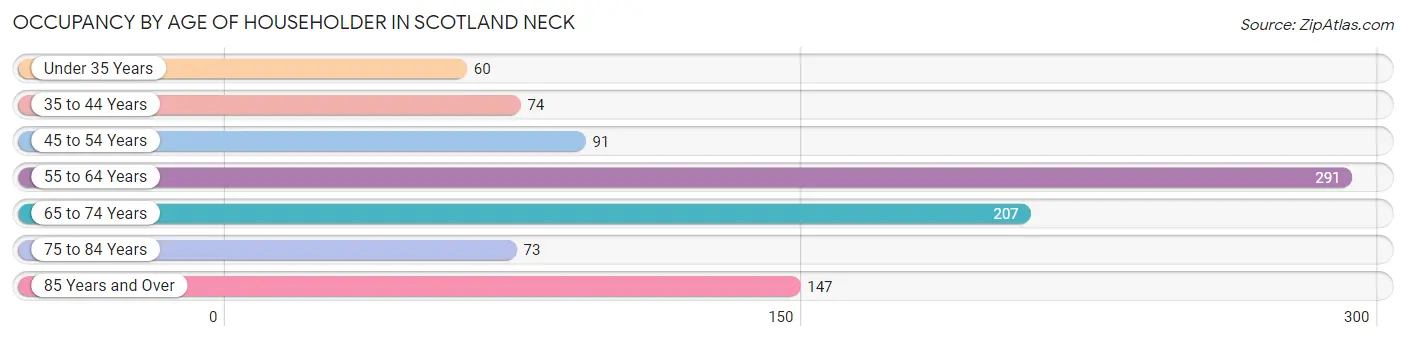
| Age Bracket | # Households | % Households |
| Under 35 Years | 60 | 6.4% |
| 35 to 44 Years | 74 | 7.9% |
| 45 to 54 Years | 91 | 9.7% |
| 55 to 64 Years | 291 | 30.9% |
| 65 to 74 Years | 207 | 22.0% |
| 75 to 84 Years | 73 | 7.7% |
| 85 Years and Over | 147 | 15.6% |
| Total | 943 | 100.0% |
Housing Finances in Scotland Neck
Median Income by Occupancy in Scotland Neck
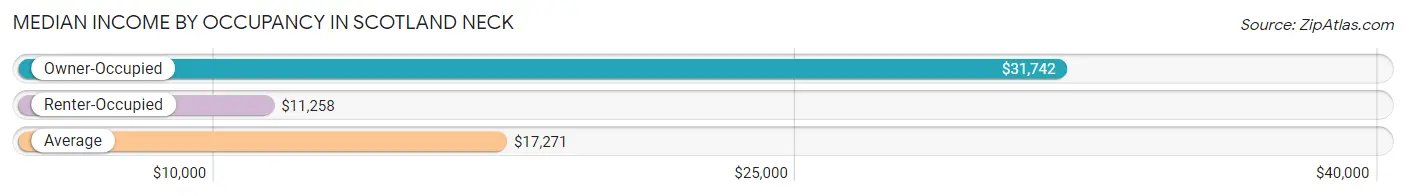
| Occupancy Type | # Households | Median Income |
| Owner-Occupied | 418 (44.3%) | $31,742 |
| Renter-Occupied | 525 (55.7%) | $11,258 |
| Average | 943 (100.0%) | $17,271 |
Occupancy by Householder Income Bracket in Scotland Neck
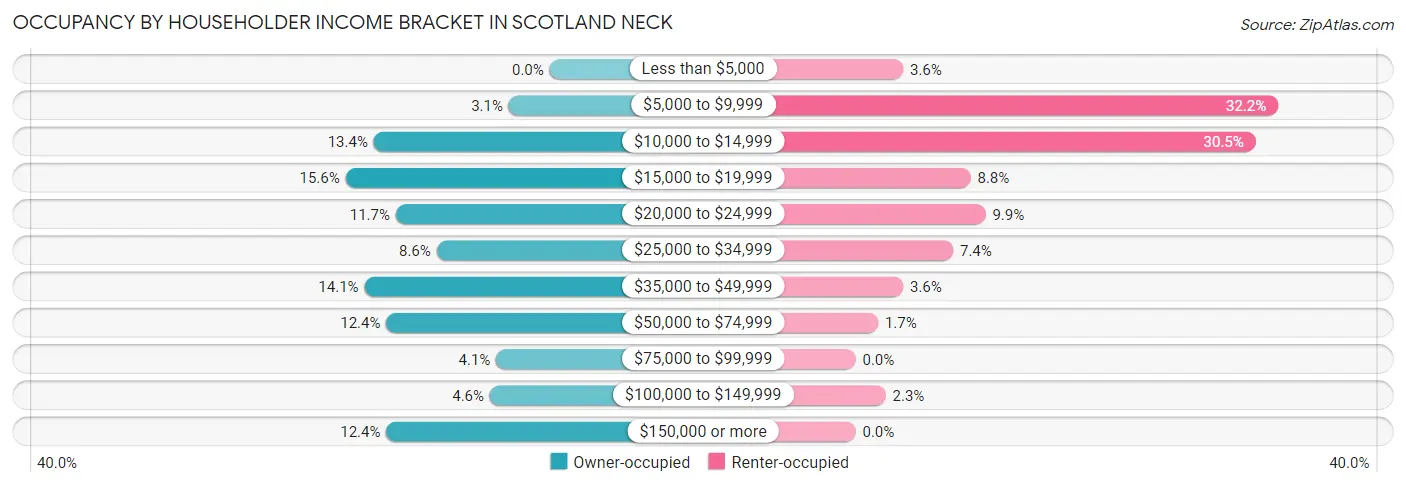
| Income Bracket | Owner-occupied | Renter-occupied |
| Less than $5,000 | 0 (0.0%) | 19 (3.6%) |
| $5,000 to $9,999 | 13 (3.1%) | 169 (32.2%) |
| $10,000 to $14,999 | 56 (13.4%) | 160 (30.5%) |
| $15,000 to $19,999 | 65 (15.5%) | 46 (8.8%) |
| $20,000 to $24,999 | 49 (11.7%) | 52 (9.9%) |
| $25,000 to $34,999 | 36 (8.6%) | 39 (7.4%) |
| $35,000 to $49,999 | 59 (14.1%) | 19 (3.6%) |
| $50,000 to $74,999 | 52 (12.4%) | 9 (1.7%) |
| $75,000 to $99,999 | 17 (4.1%) | 0 (0.0%) |
| $100,000 to $149,999 | 19 (4.5%) | 12 (2.3%) |
| $150,000 or more | 52 (12.4%) | 0 (0.0%) |
| Total | 418 (100.0%) | 525 (100.0%) |
Monthly Housing Cost Tiers in Scotland Neck
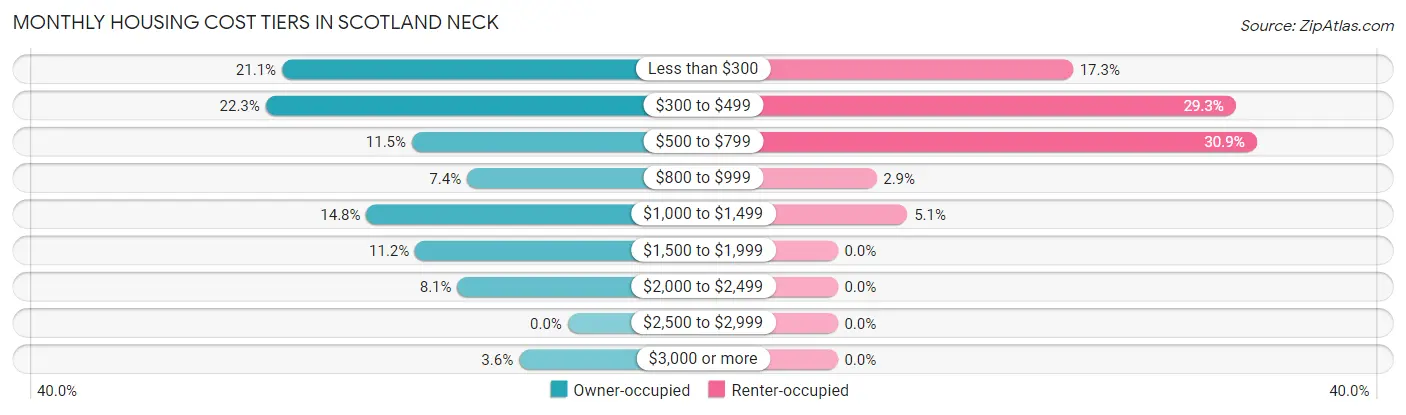
| Monthly Cost | Owner-occupied | Renter-occupied |
| Less than $300 | 88 (21.0%) | 91 (17.3%) |
| $300 to $499 | 93 (22.3%) | 154 (29.3%) |
| $500 to $799 | 48 (11.5%) | 162 (30.9%) |
| $800 to $999 | 31 (7.4%) | 15 (2.9%) |
| $1,000 to $1,499 | 62 (14.8%) | 27 (5.1%) |
| $1,500 to $1,999 | 47 (11.2%) | 0 (0.0%) |
| $2,000 to $2,499 | 34 (8.1%) | 0 (0.0%) |
| $2,500 to $2,999 | 0 (0.0%) | 0 (0.0%) |
| $3,000 or more | 15 (3.6%) | 0 (0.0%) |
| Total | 418 (100.0%) | 525 (100.0%) |
Physical Housing Characteristics in Scotland Neck
Housing Structures in Scotland Neck
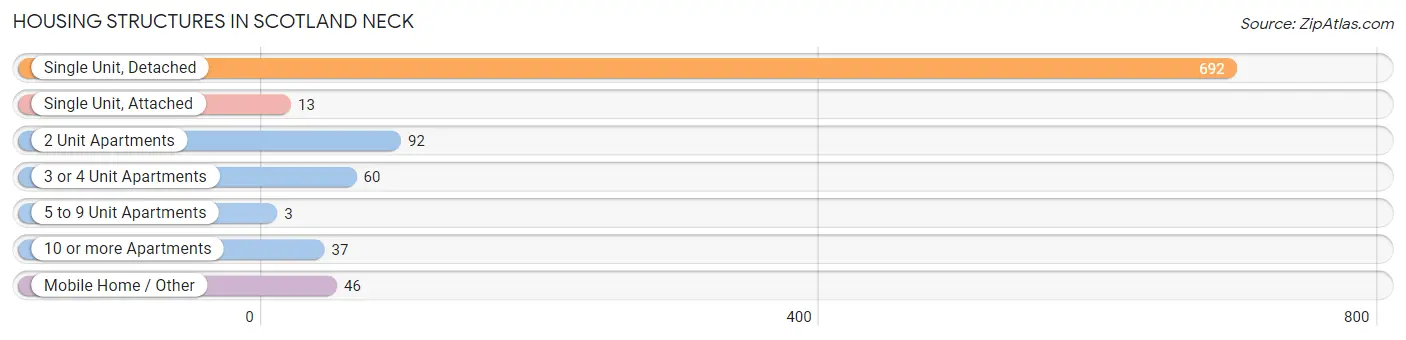
| Structure Type | # Housing Units | % Housing Units |
| Single Unit, Detached | 692 | 73.4% |
| Single Unit, Attached | 13 | 1.4% |
| 2 Unit Apartments | 92 | 9.8% |
| 3 or 4 Unit Apartments | 60 | 6.4% |
| 5 to 9 Unit Apartments | 3 | 0.3% |
| 10 or more Apartments | 37 | 3.9% |
| Mobile Home / Other | 46 | 4.9% |
| Total | 943 | 100.0% |
Housing Structures by Occupancy in Scotland Neck
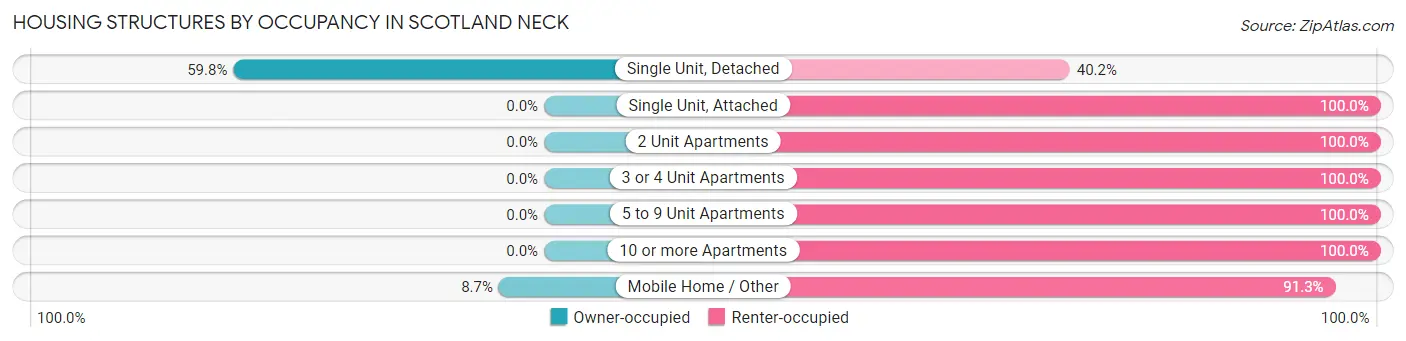
| Structure Type | Owner-occupied | Renter-occupied |
| Single Unit, Detached | 414 (59.8%) | 278 (40.2%) |
| Single Unit, Attached | 0 (0.0%) | 13 (100.0%) |
| 2 Unit Apartments | 0 (0.0%) | 92 (100.0%) |
| 3 or 4 Unit Apartments | 0 (0.0%) | 60 (100.0%) |
| 5 to 9 Unit Apartments | 0 (0.0%) | 3 (100.0%) |
| 10 or more Apartments | 0 (0.0%) | 37 (100.0%) |
| Mobile Home / Other | 4 (8.7%) | 42 (91.3%) |
| Total | 418 (44.3%) | 525 (55.7%) |
Housing Structures by Number of Rooms in Scotland Neck
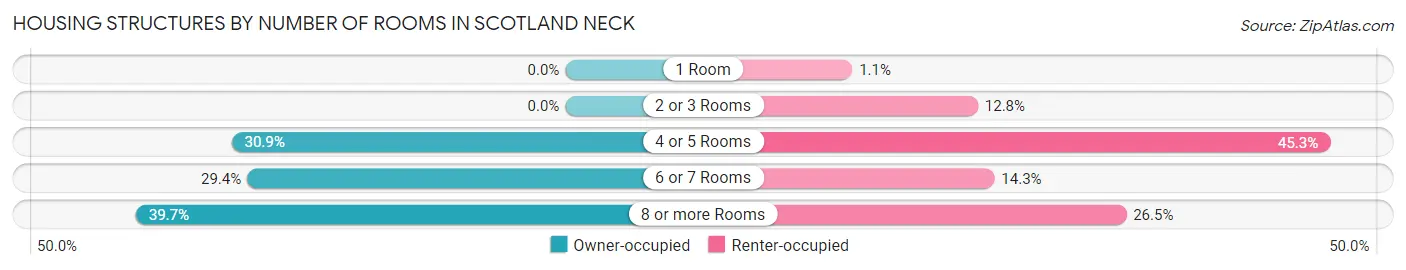
| Number of Rooms | Owner-occupied | Renter-occupied |
| 1 Room | 0 (0.0%) | 6 (1.1%) |
| 2 or 3 Rooms | 0 (0.0%) | 67 (12.8%) |
| 4 or 5 Rooms | 129 (30.9%) | 238 (45.3%) |
| 6 or 7 Rooms | 123 (29.4%) | 75 (14.3%) |
| 8 or more Rooms | 166 (39.7%) | 139 (26.5%) |
| Total | 418 (100.0%) | 525 (100.0%) |
Housing Structure by Heating Type in Scotland Neck
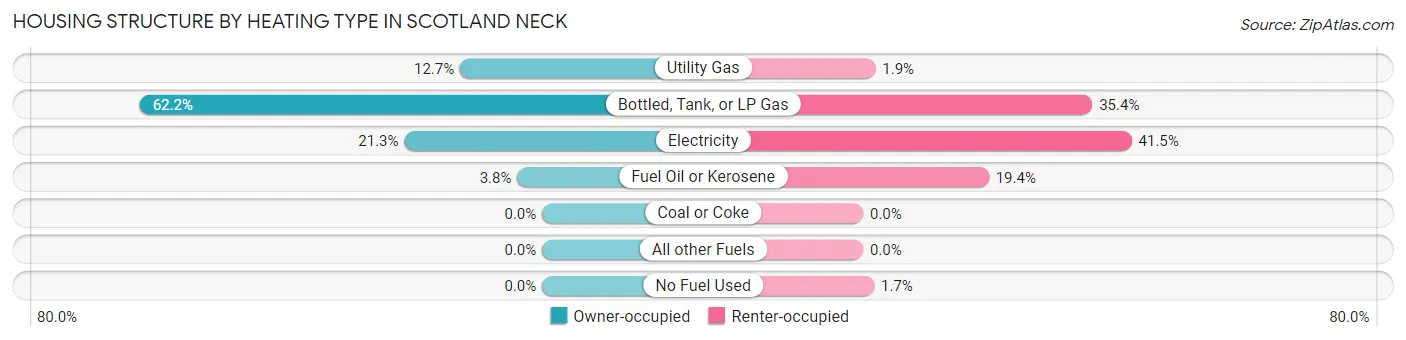
| Heating Type | Owner-occupied | Renter-occupied |
| Utility Gas | 53 (12.7%) | 10 (1.9%) |
| Bottled, Tank, or LP Gas | 260 (62.2%) | 186 (35.4%) |
| Electricity | 89 (21.3%) | 218 (41.5%) |
| Fuel Oil or Kerosene | 16 (3.8%) | 102 (19.4%) |
| Coal or Coke | 0 (0.0%) | 0 (0.0%) |
| All other Fuels | 0 (0.0%) | 0 (0.0%) |
| No Fuel Used | 0 (0.0%) | 9 (1.7%) |
| Total | 418 (100.0%) | 525 (100.0%) |
Household Vehicle Usage in Scotland Neck
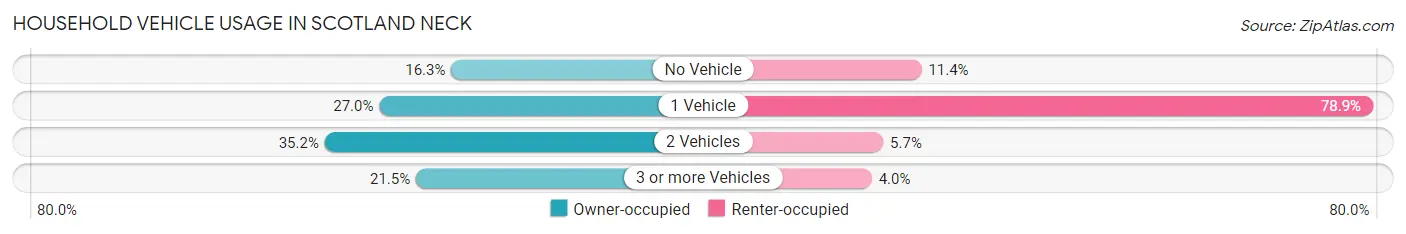
| Vehicles per Household | Owner-occupied | Renter-occupied |
| No Vehicle | 68 (16.3%) | 60 (11.4%) |
| 1 Vehicle | 113 (27.0%) | 414 (78.9%) |
| 2 Vehicles | 147 (35.2%) | 30 (5.7%) |
| 3 or more Vehicles | 90 (21.5%) | 21 (4.0%) |
| Total | 418 (100.0%) | 525 (100.0%) |
Real Estate & Mortgages in Scotland Neck
Real Estate and Mortgage Overview in Scotland Neck
| Characteristic | Without Mortgage | With Mortgage |
| Housing Units | 234 | 184 |
| Median Property Value | $57,400 | $101,800 |
| Median Household Income | $23,750 | $52 |
| Monthly Housing Costs | $388 | $15 |
| Real Estate Taxes | $684 | $0 |
Property Value by Mortgage Status in Scotland Neck
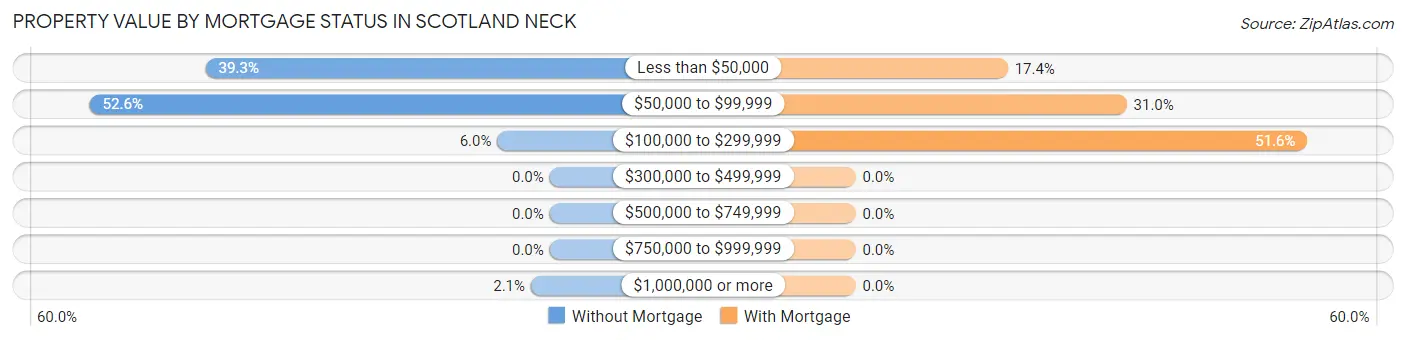
| Property Value | Without Mortgage | With Mortgage |
| Less than $50,000 | 92 (39.3%) | 32 (17.4%) |
| $50,000 to $99,999 | 123 (52.6%) | 57 (31.0%) |
| $100,000 to $299,999 | 14 (6.0%) | 95 (51.6%) |
| $300,000 to $499,999 | 0 (0.0%) | 0 (0.0%) |
| $500,000 to $749,999 | 0 (0.0%) | 0 (0.0%) |
| $750,000 to $999,999 | 0 (0.0%) | 0 (0.0%) |
| $1,000,000 or more | 5 (2.1%) | 0 (0.0%) |
| Total | 234 (100.0%) | 184 (100.0%) |
Household Income by Mortgage Status in Scotland Neck
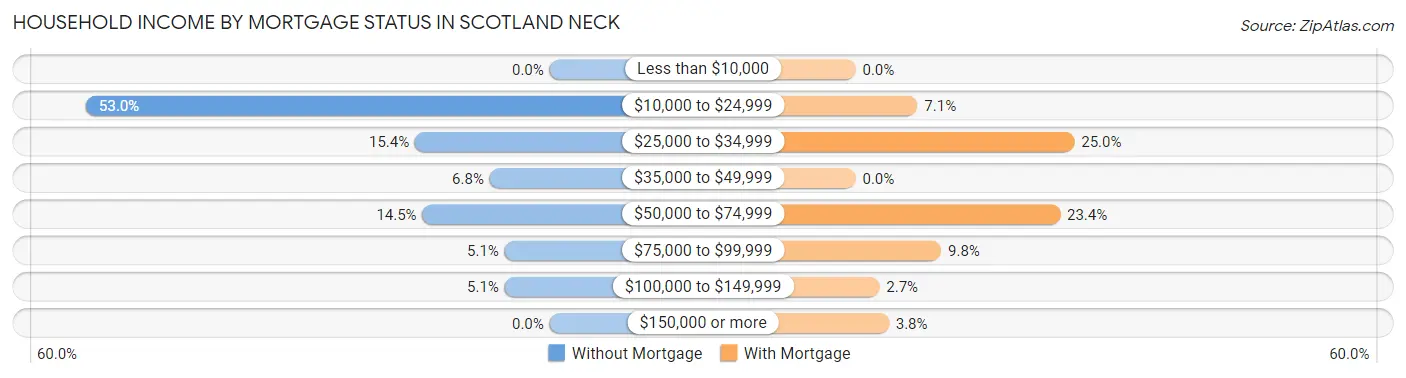
| Household Income | Without Mortgage | With Mortgage |
| Less than $10,000 | 0 (0.0%) | 0 (0.0%) |
| $10,000 to $24,999 | 124 (53.0%) | 13 (7.1%) |
| $25,000 to $34,999 | 36 (15.4%) | 46 (25.0%) |
| $35,000 to $49,999 | 16 (6.8%) | 0 (0.0%) |
| $50,000 to $74,999 | 34 (14.5%) | 43 (23.4%) |
| $75,000 to $99,999 | 12 (5.1%) | 18 (9.8%) |
| $100,000 to $149,999 | 12 (5.1%) | 5 (2.7%) |
| $150,000 or more | 0 (0.0%) | 7 (3.8%) |
| Total | 234 (100.0%) | 184 (100.0%) |
Property Value to Household Income Ratio in Scotland Neck
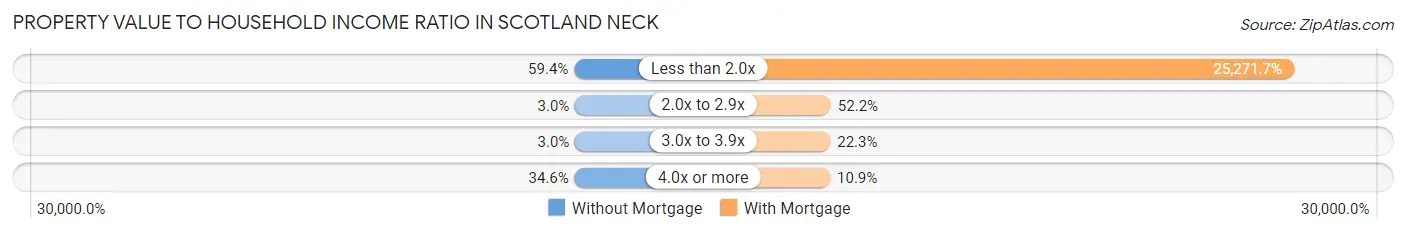
| Value-to-Income Ratio | Without Mortgage | With Mortgage |
| Less than 2.0x | 139 (59.4%) | 46,500 (25,271.7%) |
| 2.0x to 2.9x | 7 (3.0%) | 96 (52.2%) |
| 3.0x to 3.9x | 7 (3.0%) | 41 (22.3%) |
| 4.0x or more | 81 (34.6%) | 20 (10.9%) |
| Total | 234 (100.0%) | 184 (100.0%) |
Real Estate Taxes by Mortgage Status in Scotland Neck

| Property Taxes | Without Mortgage | With Mortgage |
| Less than $800 | 139 (59.4%) | 0 (0.0%) |
| $800 to $1,499 | 54 (23.1%) | 38 (20.6%) |
| $800 to $1,499 | 41 (17.5%) | 73 (39.7%) |
| Total | 234 (100.0%) | 184 (100.0%) |
Health & Disability in Scotland Neck
Health Insurance Coverage by Age in Scotland Neck
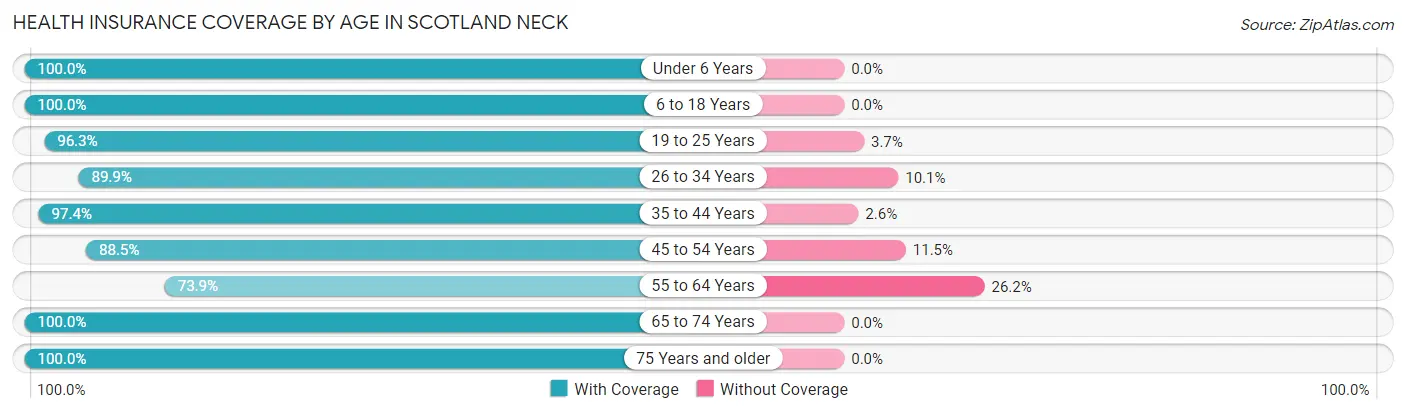
| Age Bracket | With Coverage | Without Coverage |
| Under 6 Years | 33 (100.0%) | 0 (0.0%) |
| 6 to 18 Years | 204 (100.0%) | 0 (0.0%) |
| 19 to 25 Years | 131 (96.3%) | 5 (3.7%) |
| 26 to 34 Years | 134 (89.9%) | 15 (10.1%) |
| 35 to 44 Years | 296 (97.4%) | 8 (2.6%) |
| 45 to 54 Years | 108 (88.5%) | 14 (11.5%) |
| 55 to 64 Years | 257 (73.9%) | 91 (26.2%) |
| 65 to 74 Years | 246 (100.0%) | 0 (0.0%) |
| 75 Years and older | 266 (100.0%) | 0 (0.0%) |
| Total | 1,675 (92.6%) | 133 (7.4%) |
Health Insurance Coverage by Citizenship Status in Scotland Neck

| Citizenship Status | With Coverage | Without Coverage |
| Native Born | 33 (100.0%) | 0 (0.0%) |
| Foreign Born, Citizen | 204 (100.0%) | 0 (0.0%) |
| Foreign Born, not a Citizen | 131 (96.3%) | 5 (3.7%) |
Health Insurance Coverage by Household Income in Scotland Neck
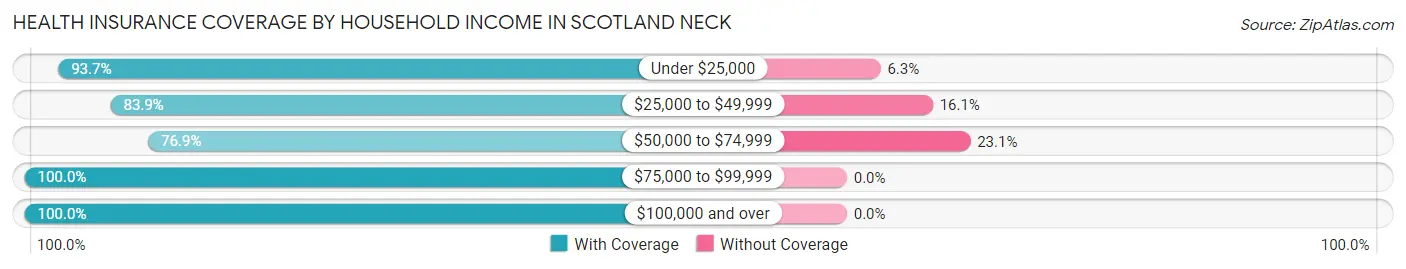
| Household Income | With Coverage | Without Coverage |
| Under $25,000 | 965 (93.7%) | 65 (6.3%) |
| $25,000 to $49,999 | 193 (83.9%) | 37 (16.1%) |
| $50,000 to $74,999 | 103 (76.9%) | 31 (23.1%) |
| $75,000 to $99,999 | 62 (100.0%) | 0 (0.0%) |
| $100,000 and over | 352 (100.0%) | 0 (0.0%) |
Public vs Private Health Insurance Coverage by Age in Scotland Neck
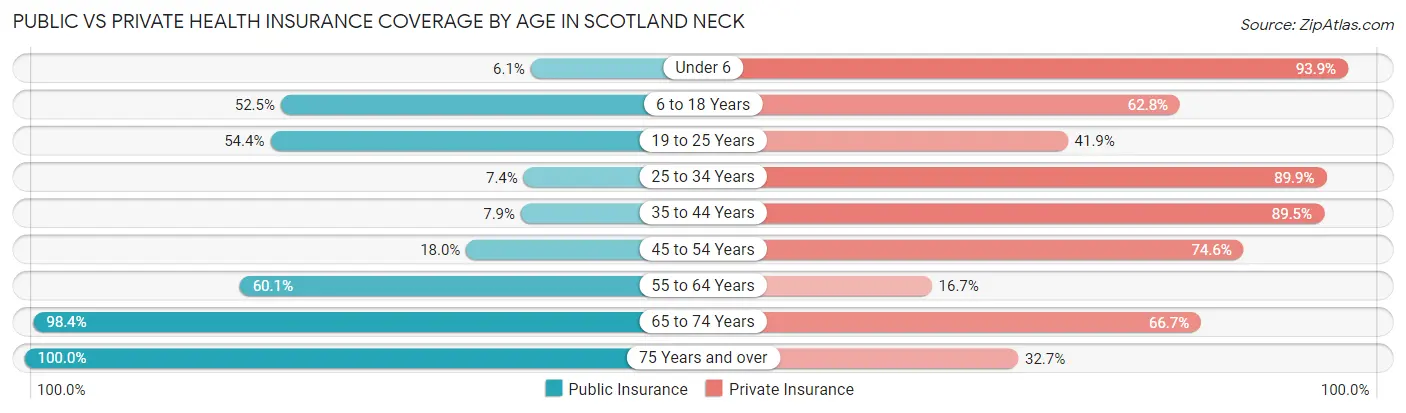
| Age Bracket | Public Insurance | Private Insurance |
| Under 6 | 2 (6.1%) | 31 (93.9%) |
| 6 to 18 Years | 107 (52.4%) | 128 (62.7%) |
| 19 to 25 Years | 74 (54.4%) | 57 (41.9%) |
| 25 to 34 Years | 11 (7.4%) | 134 (89.9%) |
| 35 to 44 Years | 24 (7.9%) | 272 (89.5%) |
| 45 to 54 Years | 22 (18.0%) | 91 (74.6%) |
| 55 to 64 Years | 209 (60.1%) | 58 (16.7%) |
| 65 to 74 Years | 242 (98.4%) | 164 (66.7%) |
| 75 Years and over | 266 (100.0%) | 87 (32.7%) |
| Total | 957 (52.9%) | 1,022 (56.5%) |
Disability Status by Sex by Age in Scotland Neck
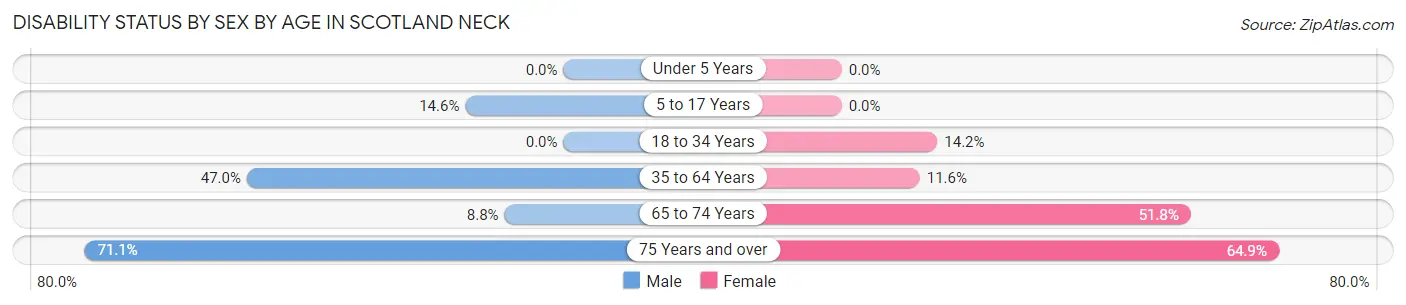
| Age Bracket | Male | Female |
| Under 5 Years | 0 (0.0%) | 0 (0.0%) |
| 5 to 17 Years | 22 (14.6%) | 0 (0.0%) |
| 18 to 34 Years | 0 (0.0%) | 22 (14.2%) |
| 35 to 64 Years | 173 (47.0%) | 47 (11.6%) |
| 65 to 74 Years | 7 (8.7%) | 86 (51.8%) |
| 75 Years and over | 96 (71.1%) | 85 (64.9%) |
Disability Class by Sex by Age in Scotland Neck
Disability Class: Hearing Difficulty
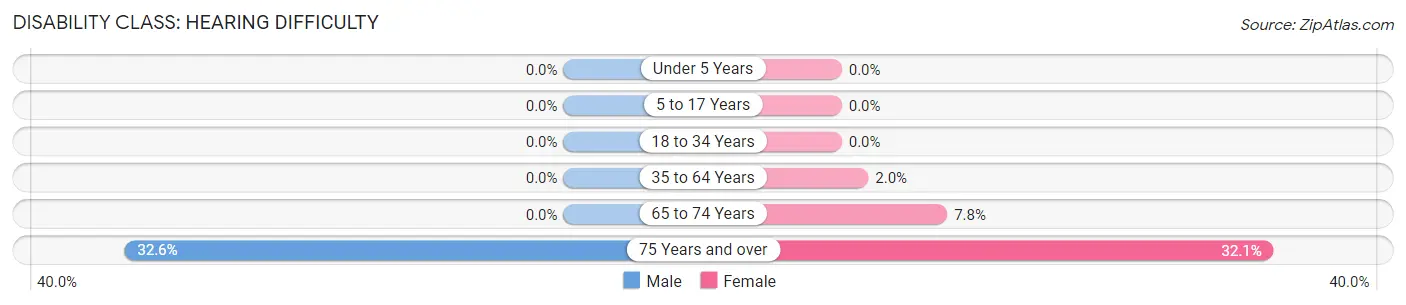
| Age Bracket | Male | Female |
| Under 5 Years | 0 (0.0%) | 0 (0.0%) |
| 5 to 17 Years | 0 (0.0%) | 0 (0.0%) |
| 18 to 34 Years | 0 (0.0%) | 0 (0.0%) |
| 35 to 64 Years | 0 (0.0%) | 8 (2.0%) |
| 65 to 74 Years | 0 (0.0%) | 13 (7.8%) |
| 75 Years and over | 44 (32.6%) | 42 (32.1%) |
Disability Class: Vision Difficulty
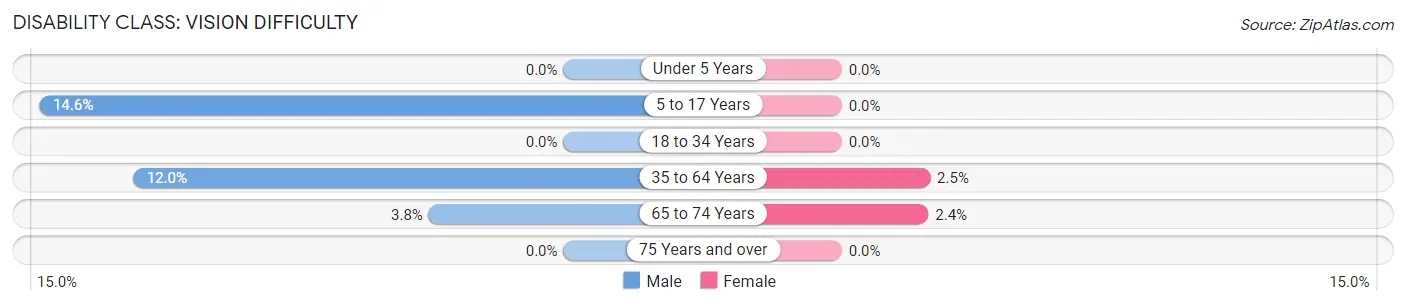
| Age Bracket | Male | Female |
| Under 5 Years | 0 (0.0%) | 0 (0.0%) |
| 5 to 17 Years | 22 (14.6%) | 0 (0.0%) |
| 18 to 34 Years | 0 (0.0%) | 0 (0.0%) |
| 35 to 64 Years | 44 (12.0%) | 10 (2.5%) |
| 65 to 74 Years | 3 (3.7%) | 4 (2.4%) |
| 75 Years and over | 0 (0.0%) | 0 (0.0%) |
Disability Class: Cognitive Difficulty
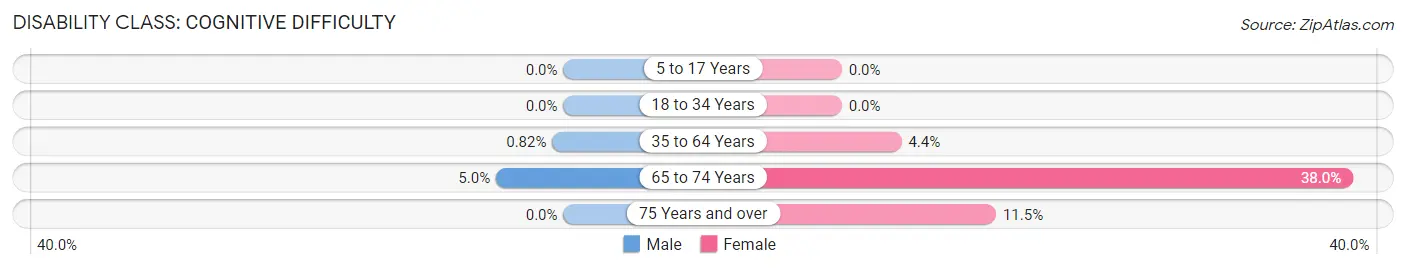
| Age Bracket | Male | Female |
| 5 to 17 Years | 0 (0.0%) | 0 (0.0%) |
| 18 to 34 Years | 0 (0.0%) | 0 (0.0%) |
| 35 to 64 Years | 3 (0.8%) | 18 (4.4%) |
| 65 to 74 Years | 4 (5.0%) | 63 (38.0%) |
| 75 Years and over | 0 (0.0%) | 15 (11.5%) |
Disability Class: Ambulatory Difficulty
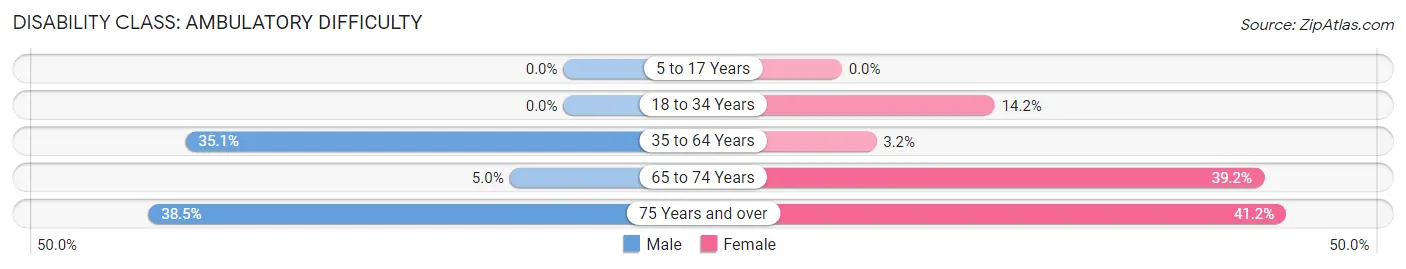
| Age Bracket | Male | Female |
| 5 to 17 Years | 0 (0.0%) | 0 (0.0%) |
| 18 to 34 Years | 0 (0.0%) | 22 (14.2%) |
| 35 to 64 Years | 129 (35.0%) | 13 (3.2%) |
| 65 to 74 Years | 4 (5.0%) | 65 (39.2%) |
| 75 Years and over | 52 (38.5%) | 54 (41.2%) |
Disability Class: Self-Care Difficulty
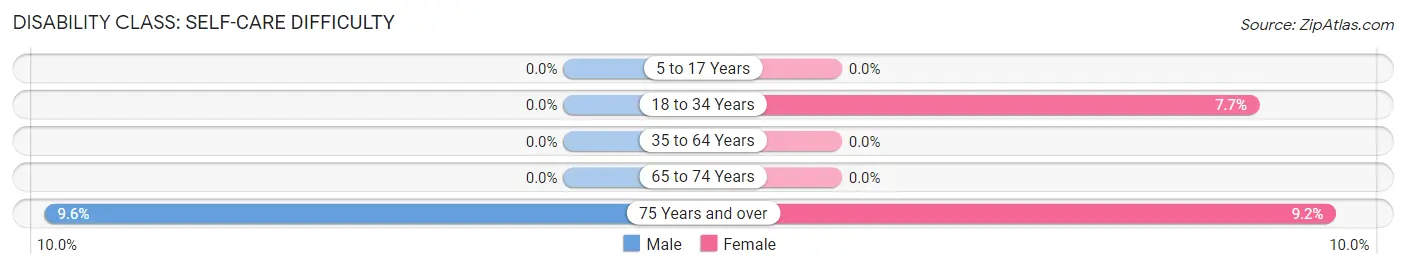
| Age Bracket | Male | Female |
| 5 to 17 Years | 0 (0.0%) | 0 (0.0%) |
| 18 to 34 Years | 0 (0.0%) | 12 (7.7%) |
| 35 to 64 Years | 0 (0.0%) | 0 (0.0%) |
| 65 to 74 Years | 0 (0.0%) | 0 (0.0%) |
| 75 Years and over | 13 (9.6%) | 12 (9.2%) |
Technology Access in Scotland Neck
Computing Device Access in Scotland Neck
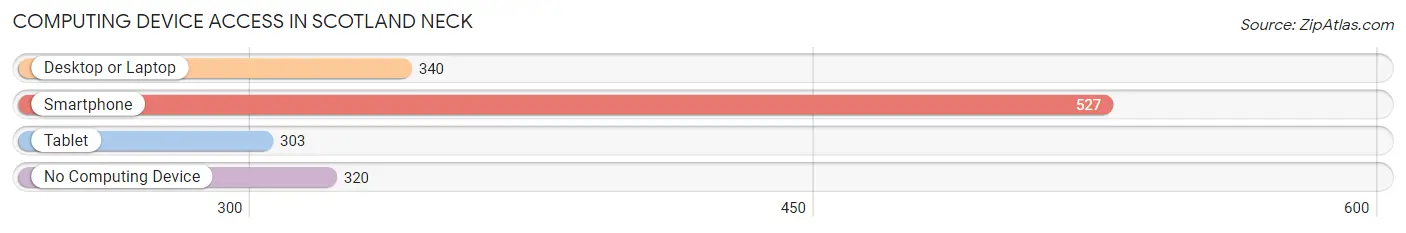
| Device Type | # Households | % Households |
| Desktop or Laptop | 340 | 36.1% |
| Smartphone | 527 | 55.9% |
| Tablet | 303 | 32.1% |
| No Computing Device | 320 | 33.9% |
| Total | 943 | 100.0% |
Internet Access in Scotland Neck
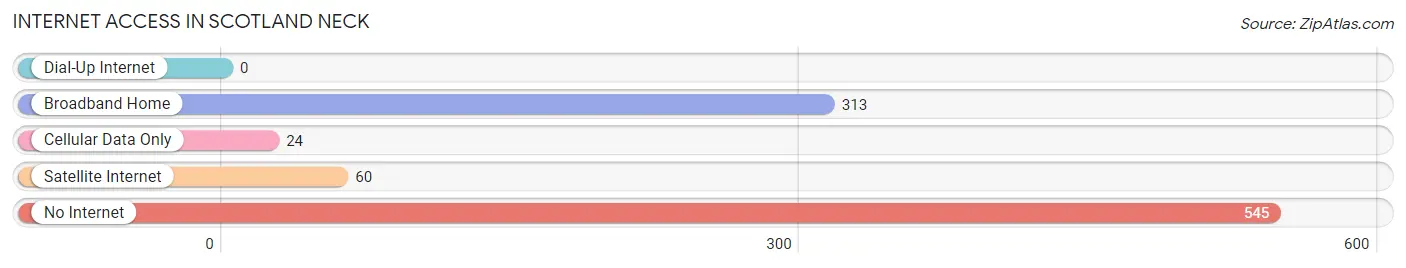
| Internet Type | # Households | % Households |
| Dial-Up Internet | 0 | 0.0% |
| Broadband Home | 313 | 33.2% |
| Cellular Data Only | 24 | 2.5% |
| Satellite Internet | 60 | 6.4% |
| No Internet | 545 | 57.8% |
| Total | 943 | 100.0% |
Scotland Neck Summary
History
The town of Scotland Neck, North Carolina is located in Halifax County in the northeastern part of the state. It was founded in 1774 and named after Scotland Neck, Scotland, the ancestral home of the area’s first settlers. The town was originally a trading post and was the site of a Revolutionary War battle in 1781. The town was incorporated in 1872 and has since grown to a population of approximately 2,000 people.
The town has a rich history of African American culture and is home to the Scotland Neck Historic District, which is listed on the National Register of Historic Places. The district includes a variety of historic buildings, including the Scotland Neck Colored School, which was built in 1891 and is the oldest African American school in Halifax County.
Geography
Scotland Neck is located in the northeastern part of North Carolina, approximately 50 miles from the state capital of Raleigh. The town is situated on the Roanoke River, which is a major tributary of the Albemarle Sound. The town is surrounded by farmland and is located near the Great Dismal Swamp National Wildlife Refuge.
The town has a humid subtropical climate, with hot, humid summers and mild winters. The average annual temperature is around 70 degrees Fahrenheit, with an average high of around 90 degrees in the summer and an average low of around 40 degrees in the winter.
Economy
The economy of Scotland Neck is largely based on agriculture and manufacturing. The town is home to several large farms, including the Scotland Neck Cotton Mill, which produces cotton products for the textile industry. The town is also home to several small businesses, including restaurants, retail stores, and service providers.
The town is also home to a number of government and educational institutions, including the Scotland Neck Public Library, the Scotland Neck Community College, and the Scotland Neck Historical Museum.
Demographics
As of the 2010 census, the population of Scotland Neck was 2,039. The racial makeup of the town was 57.3% White, 37.2% African American, 0.3% Native American, 0.7% Asian, 0.1% Pacific Islander, and 4.4% from other races. The median household income was $30,938, and the median family income was $37,917.
The town is home to a variety of religious denominations, including Baptist, Methodist, and Presbyterian. The town is also home to a variety of cultural and recreational activities, including the Scotland Neck Music Festival, the Scotland Neck Arts Festival, and the Scotland Neck Film Festival.
Common Questions
What is Per Capita Income in Scotland Neck?
Per Capita income in Scotland Neck is $19,716.
What is the Median Family Income in Scotland Neck?
Median Family Income in Scotland Neck is $46,058.
What is the Median Household income in Scotland Neck?
Median Household Income in Scotland Neck is $17,271.
What is Income or Wage Gap in Scotland Neck?
Income or Wage Gap in Scotland Neck is 48.1%.
Women in Scotland Neck earn 51.9 cents for every dollar earned by a man.
What is Inequality or Gini Index in Scotland Neck?
Inequality or Gini Index in Scotland Neck is 0.56.
What is the Total Population of Scotland Neck?
Total Population of Scotland Neck is 1,861.
What is the Total Male Population of Scotland Neck?
Total Male Population of Scotland Neck is 903.
What is the Total Female Population of Scotland Neck?
Total Female Population of Scotland Neck is 958.
What is the Ratio of Males per 100 Females in Scotland Neck?
There are 94.26 Males per 100 Females in Scotland Neck.
What is the Ratio of Females per 100 Males in Scotland Neck?
There are 106.09 Females per 100 Males in Scotland Neck.
What is the Median Population Age in Scotland Neck?
Median Population Age in Scotland Neck is 52.9 Years.
What is the Average Family Size in Scotland Neck
Average Family Size in Scotland Neck is 3.3 People.
What is the Average Household Size in Scotland Neck
Average Household Size in Scotland Neck is 1.9 People.
How Large is the Labor Force in Scotland Neck?
There are 646 People in the Labor Forcein in Scotland Neck.
What is the Percentage of People in the Labor Force in Scotland Neck?
39.1% of People are in the Labor Force in Scotland Neck.
What is the Unemployment Rate in Scotland Neck?
Unemployment Rate in Scotland Neck is 10.7%.