Zip Codes with the Highest Percentage of Households with Income Below $10,000 in Kinston, NC
RELATED REPORTS & OPTIONS
Household Income | $0-10k
Kinston
Compare Zip Codes
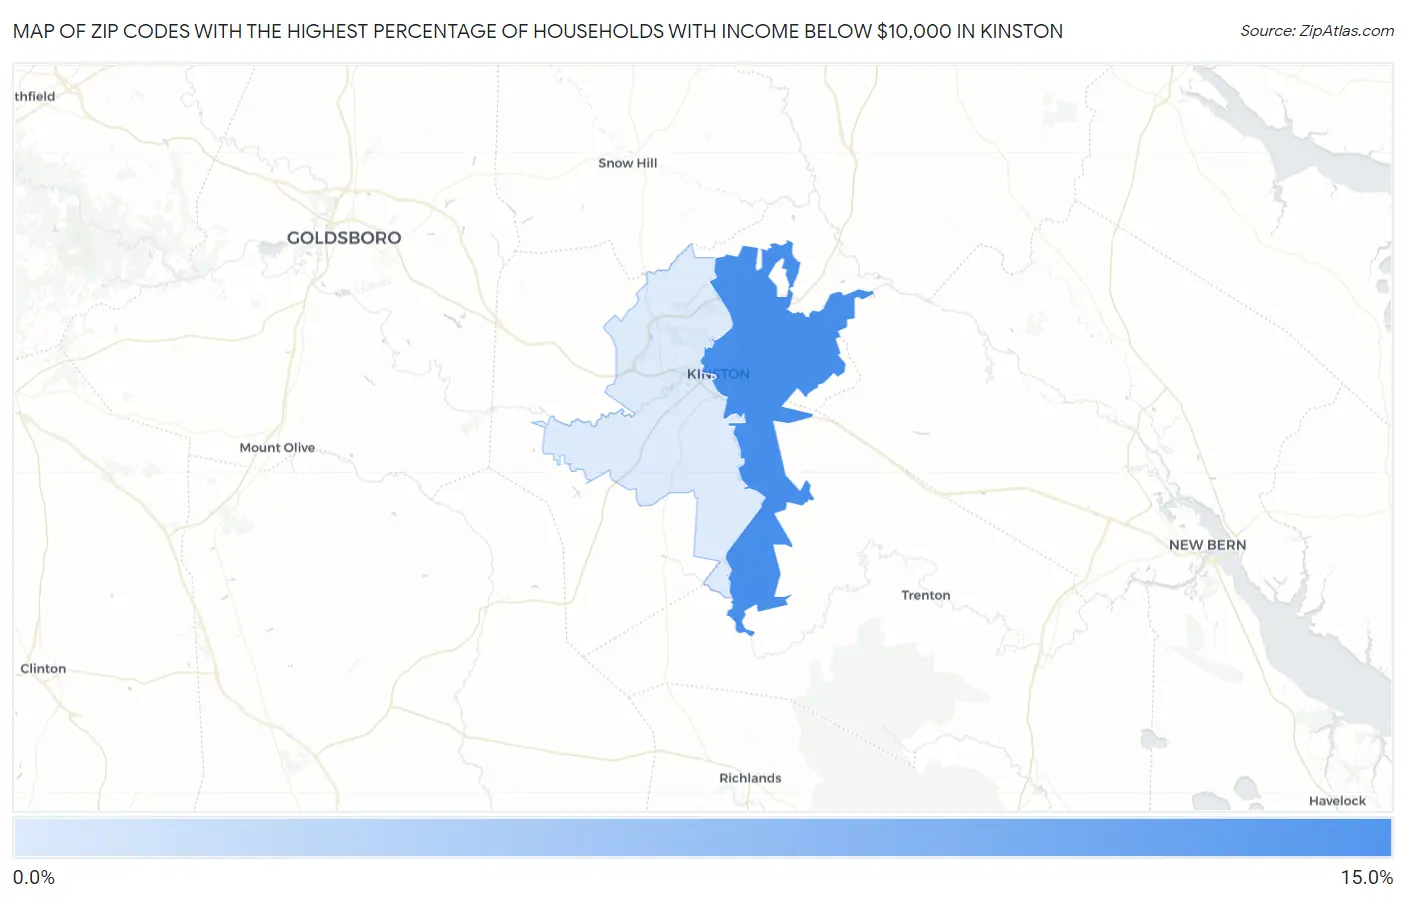
Map of Zip Codes with the Highest Percentage of Households with Income Below $10,000 in Kinston
3.1%
11.7%
Zip Codes with the Highest Percentage of Households with Income Below $10,000 in Kinston, NC
| Zip Code | Households with Income < $10k | vs State | vs National | |
| 1. | 28501 | 11.7% | 5.1%(+6.60)#62 | 4.9%(+6.80)#2,585 |
| 2. | 28504 | 3.1% | 5.1%(-2.00)#558 | 4.9%(-1.80)#18,954 |
1
Common Questions
What are the Top Zip Codes with the Highest Percentage of Households with Income Below $10,000 in Kinston, NC?
Top Zip Codes with the Highest Percentage of Households with Income Below $10,000 in Kinston, NC are:
What zip code has the Highest Percentage of Households with Income Below $10,000 in Kinston, NC?
28501 has the Highest Percentage of Households with Income Below $10,000 in Kinston, NC with 11.7%.
What is the Percentage of Households with Income Below $10,000 in Kinston, NC?
Percentage of Households with Income Below $10,000 in Kinston is 10.4%.
What is the Percentage of Households with Income Below $10,000 in North Carolina?
Percentage of Households with Income Below $10,000 in North Carolina is 5.1%.
What is the Percentage of Households with Income Below $10,000 in the United States?
Percentage of Households with Income Below $10,000 in the United States is 4.9%.