Cities with the Most Immigrants from China in North Carolina
RELATED REPORTS & OPTIONS
China
North Carolina
Compare Cities
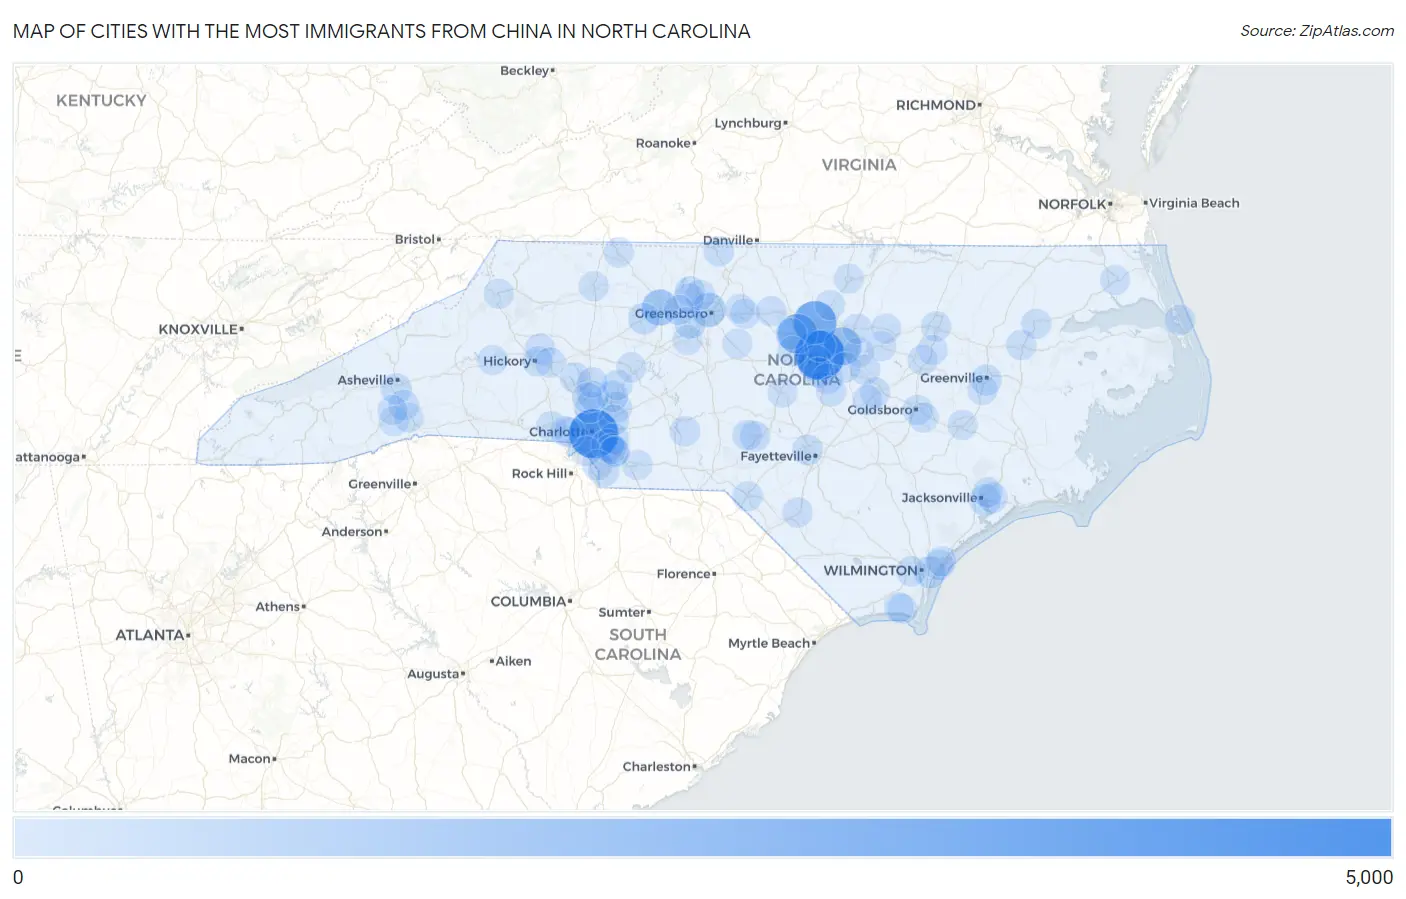
Map of Cities with the Most Immigrants from China in North Carolina
0
5,000
Cities with the Most Immigrants from China in North Carolina
| City | China | vs State | vs National | |
| 1. | Cary | 4,728 | 32,948(14.35%)#1 | 2,829,008(0.17%)#74 |
| 2. | Charlotte | 4,617 | 32,948(14.01%)#2 | 2,829,008(0.16%)#77 |
| 3. | Durham | 3,097 | 32,948(9.40%)#3 | 2,829,008(0.11%)#114 |
| 4. | Chapel Hill | 2,265 | 32,948(6.87%)#4 | 2,829,008(0.08%)#152 |
| 5. | Raleigh | 1,814 | 32,948(5.51%)#5 | 2,829,008(0.06%)#192 |
| 6. | Winston Salem | 1,432 | 32,948(4.35%)#6 | 2,829,008(0.05%)#245 |
| 7. | Apex | 1,193 | 32,948(3.62%)#7 | 2,829,008(0.04%)#288 |
| 8. | Greensboro | 984 | 32,948(2.99%)#8 | 2,829,008(0.03%)#351 |
| 9. | Matthews | 473 | 32,948(1.44%)#9 | 2,829,008(0.02%)#663 |
| 10. | High Point | 375 | 32,948(1.14%)#10 | 2,829,008(0.01%)#782 |
| 11. | Wilmington | 334 | 32,948(1.01%)#11 | 2,829,008(0.01%)#852 |
| 12. | Clemmons | 331 | 32,948(1.00%)#12 | 2,829,008(0.01%)#859 |
| 13. | Morrisville | 323 | 32,948(0.98%)#13 | 2,829,008(0.01%)#872 |
| 14. | Jacksonville | 318 | 32,948(0.97%)#14 | 2,829,008(0.01%)#884 |
| 15. | Carrboro | 295 | 32,948(0.90%)#15 | 2,829,008(0.01%)#933 |
| 16. | Concord | 249 | 32,948(0.76%)#16 | 2,829,008(0.01%)#1,066 |
| 17. | Huntersville | 237 | 32,948(0.72%)#17 | 2,829,008(0.01%)#1,114 |
| 18. | Kannapolis | 226 | 32,948(0.69%)#18 | 2,829,008(0.01%)#1,164 |
| 19. | Greenville | 214 | 32,948(0.65%)#19 | 2,829,008(0.01%)#1,214 |
| 20. | Asheville | 207 | 32,948(0.63%)#20 | 2,829,008(0.01%)#1,240 |
| 21. | Mint Hill | 185 | 32,948(0.56%)#21 | 2,829,008(0.01%)#1,354 |
| 22. | Fayetteville | 175 | 32,948(0.53%)#22 | 2,829,008(0.01%)#1,400 |
| 23. | Waxhaw | 154 | 32,948(0.47%)#23 | 2,829,008(0.01%)#1,544 |
| 24. | Oak Ridge | 134 | 32,948(0.41%)#24 | 2,829,008(0.00%)#1,693 |
| 25. | Fletcher | 126 | 32,948(0.38%)#25 | 2,829,008(0.00%)#1,757 |
| 26. | Harrisburg | 123 | 32,948(0.37%)#26 | 2,829,008(0.00%)#1,783 |
| 27. | Southern Pines | 123 | 32,948(0.37%)#27 | 2,829,008(0.00%)#1,784 |
| 28. | Piney Green | 117 | 32,948(0.36%)#28 | 2,829,008(0.00%)#1,834 |
| 29. | Indian Trail | 100 | 32,948(0.30%)#29 | 2,829,008(0.00%)#2,011 |
| 30. | Pinehurst | 96 | 32,948(0.29%)#30 | 2,829,008(0.00%)#2,077 |
| 31. | Fuquay Varina | 95 | 32,948(0.29%)#31 | 2,829,008(0.00%)#2,086 |
| 32. | Marvin | 94 | 32,948(0.29%)#32 | 2,829,008(0.00%)#2,104 |
| 33. | Stallings | 93 | 32,948(0.28%)#33 | 2,829,008(0.00%)#2,109 |
| 34. | Mount Gilead | 92 | 32,948(0.28%)#34 | 2,829,008(0.00%)#2,126 |
| 35. | Belmont | 91 | 32,948(0.28%)#35 | 2,829,008(0.00%)#2,133 |
| 36. | Lake Norman Of Catawba | 91 | 32,948(0.28%)#36 | 2,829,008(0.00%)#2,134 |
| 37. | Mebane | 88 | 32,948(0.27%)#37 | 2,829,008(0.00%)#2,175 |
| 38. | Bethlehem | 88 | 32,948(0.27%)#38 | 2,829,008(0.00%)#2,188 |
| 39. | Davidson | 87 | 32,948(0.26%)#39 | 2,829,008(0.00%)#2,195 |
| 40. | Summerfield | 86 | 32,948(0.26%)#40 | 2,829,008(0.00%)#2,215 |
| 41. | Eden | 75 | 32,948(0.23%)#41 | 2,829,008(0.00%)#2,385 |
| 42. | Landis | 73 | 32,948(0.22%)#42 | 2,829,008(0.00%)#2,428 |
| 43. | Mooresville | 72 | 32,948(0.22%)#43 | 2,829,008(0.00%)#2,432 |
| 44. | Kill Devil Hills | 72 | 32,948(0.22%)#44 | 2,829,008(0.00%)#2,449 |
| 45. | Ogden | 70 | 32,948(0.21%)#45 | 2,829,008(0.00%)#2,482 |
| 46. | Gastonia | 65 | 32,948(0.20%)#46 | 2,829,008(0.00%)#2,566 |
| 47. | Hickory | 63 | 32,948(0.19%)#47 | 2,829,008(0.00%)#2,608 |
| 48. | Briar Chapel | 59 | 32,948(0.18%)#48 | 2,829,008(0.00%)#2,717 |
| 49. | Garner | 58 | 32,948(0.18%)#49 | 2,829,008(0.00%)#2,728 |
| 50. | Fearrington Village | 57 | 32,948(0.17%)#50 | 2,829,008(0.00%)#2,770 |
| 51. | Williamston | 56 | 32,948(0.17%)#51 | 2,829,008(0.00%)#2,788 |
| 52. | Goldsboro | 53 | 32,948(0.16%)#52 | 2,829,008(0.00%)#2,841 |
| 53. | Holly Springs | 51 | 32,948(0.15%)#53 | 2,829,008(0.00%)#2,891 |
| 54. | Laurinburg | 51 | 32,948(0.15%)#54 | 2,829,008(0.00%)#2,902 |
| 55. | Windsor | 49 | 32,948(0.15%)#55 | 2,829,008(0.00%)#2,989 |
| 56. | Leland | 47 | 32,948(0.14%)#56 | 2,829,008(0.00%)#3,041 |
| 57. | Clayton | 46 | 32,948(0.14%)#57 | 2,829,008(0.00%)#3,070 |
| 58. | Stokesdale | 45 | 32,948(0.14%)#58 | 2,829,008(0.00%)#3,116 |
| 59. | Angier | 45 | 32,948(0.14%)#59 | 2,829,008(0.00%)#3,118 |
| 60. | Rocky Mount | 42 | 32,948(0.13%)#60 | 2,829,008(0.00%)#3,189 |
| 61. | Cornelius | 42 | 32,948(0.13%)#61 | 2,829,008(0.00%)#3,193 |
| 62. | Lumberton | 41 | 32,948(0.12%)#62 | 2,829,008(0.00%)#3,233 |
| 63. | Smithfield | 41 | 32,948(0.12%)#63 | 2,829,008(0.00%)#3,239 |
| 64. | Pineville | 41 | 32,948(0.12%)#64 | 2,829,008(0.00%)#3,242 |
| 65. | Salisbury | 36 | 32,948(0.11%)#65 | 2,829,008(0.00%)#3,416 |
| 66. | Kernersville | 36 | 32,948(0.11%)#66 | 2,829,008(0.00%)#3,420 |
| 67. | Winterville | 34 | 32,948(0.10%)#67 | 2,829,008(0.00%)#3,530 |
| 68. | Elizabeth City | 33 | 32,948(0.10%)#68 | 2,829,008(0.00%)#3,561 |
| 69. | St James | 33 | 32,948(0.10%)#69 | 2,829,008(0.00%)#3,580 |
| 70. | Anderson Creek | 32 | 32,948(0.10%)#70 | 2,829,008(0.00%)#3,616 |
| 71. | Porters Neck | 32 | 32,948(0.10%)#71 | 2,829,008(0.00%)#3,627 |
| 72. | Elkin | 32 | 32,948(0.10%)#72 | 2,829,008(0.00%)#3,641 |
| 73. | Boone | 31 | 32,948(0.09%)#73 | 2,829,008(0.00%)#3,659 |
| 74. | Liberty | 30 | 32,948(0.09%)#74 | 2,829,008(0.00%)#3,734 |
| 75. | Knightdale | 29 | 32,948(0.09%)#75 | 2,829,008(0.00%)#3,756 |
| 76. | Conover | 29 | 32,948(0.09%)#76 | 2,829,008(0.00%)#3,769 |
| 77. | Trinity | 29 | 32,948(0.09%)#77 | 2,829,008(0.00%)#3,776 |
| 78. | Wilson | 28 | 32,948(0.08%)#78 | 2,829,008(0.00%)#3,800 |
| 79. | Morganton | 28 | 32,948(0.08%)#79 | 2,829,008(0.00%)#3,810 |
| 80. | Wake Forest | 27 | 32,948(0.08%)#80 | 2,829,008(0.00%)#3,861 |
| 81. | Etowah | 25 | 32,948(0.08%)#81 | 2,829,008(0.00%)#3,998 |
| 82. | Burlington | 24 | 32,948(0.07%)#82 | 2,829,008(0.00%)#4,027 |
| 83. | Oak Island | 24 | 32,948(0.07%)#83 | 2,829,008(0.00%)#4,054 |
| 84. | Zebulon | 24 | 32,948(0.07%)#84 | 2,829,008(0.00%)#4,058 |
| 85. | Kinston | 23 | 32,948(0.07%)#85 | 2,829,008(0.00%)#4,099 |
| 86. | Bunn | 23 | 32,948(0.07%)#86 | 2,829,008(0.00%)#4,157 |
| 87. | Sanford | 21 | 32,948(0.06%)#87 | 2,829,008(0.00%)#4,210 |
| 88. | Cramerton | 21 | 32,948(0.06%)#88 | 2,829,008(0.00%)#4,239 |
| 89. | Four Oaks | 21 | 32,948(0.06%)#89 | 2,829,008(0.00%)#4,253 |
| 90. | Mount Airy | 20 | 32,948(0.06%)#90 | 2,829,008(0.00%)#4,286 |
| 91. | Elroy | 20 | 32,948(0.06%)#91 | 2,829,008(0.00%)#4,316 |
| 92. | Pumpkin Center | 20 | 32,948(0.06%)#92 | 2,829,008(0.00%)#4,326 |
| 93. | Hendersonville | 19 | 32,948(0.06%)#93 | 2,829,008(0.00%)#4,358 |
| 94. | Mills River | 19 | 32,948(0.06%)#94 | 2,829,008(0.00%)#4,380 |
| 95. | Gibsonville | 17 | 32,948(0.05%)#95 | 2,829,008(0.00%)#4,525 |
| 96. | Wingate | 17 | 32,948(0.05%)#96 | 2,829,008(0.00%)#4,552 |
| 97. | Oxford | 15 | 32,948(0.05%)#97 | 2,829,008(0.00%)#4,703 |
| 98. | Butner | 15 | 32,948(0.05%)#98 | 2,829,008(0.00%)#4,706 |
| 99. | Lake Park | 15 | 32,948(0.05%)#99 | 2,829,008(0.00%)#4,730 |
| 100. | Elm City | 15 | 32,948(0.05%)#100 | 2,829,008(0.00%)#4,752 |
Common Questions
What are the Top 10 Cities with the Most Immigrants from China in North Carolina?
Top 10 Cities with the Most Immigrants from China in North Carolina are:
#1
4,728
#2
4,617
#3
3,097
#4
2,265
#5
1,814
#6
1,432
#7
1,193
#8
984
#9
473
#10
375
What city has the Most Immigrants from China in North Carolina?
Cary has the Most Immigrants from China in North Carolina with 4,728.
What is the Total Immigrants from China in the State of North Carolina?
Total Immigrants from China in North Carolina is 32,948.
What is the Total Immigrants from China in the United States?
Total Immigrants from China in the United States is 2,829,008.