Catawba, NC Map & Demographics
Catawba Map
Catawba Overview
$28,878
PER CAPITA INCOME
$69,722
AVG FAMILY INCOME
$44,167
AVG HOUSEHOLD INCOME
21.0%
WAGE / INCOME GAP [ % ]
79.0¢/ $1
WAGE / INCOME GAP [ $ ]
$12,453
FAMILY INCOME DEFICIT
0.52
INEQUALITY / GINI INDEX
630
TOTAL POPULATION
384
MALE POPULATION
246
FEMALE POPULATION
156.10
MALES / 100 FEMALES
64.06
FEMALES / 100 MALES
49.1
MEDIAN AGE
2.8
AVG FAMILY SIZE
2.0
AVG HOUSEHOLD SIZE
287
LABOR FORCE [ PEOPLE ]
52.7%
PERCENT IN LABOR FORCE
5.2%
UNEMPLOYMENT RATE
Catawba Zip Codes
Catawba Area Codes
Income in Catawba
Income Overview in Catawba
Per Capita Income in Catawba is $28,878, while median incomes of families and households are $69,722 and $44,167 respectively.
| Characteristic | Number | Measure |
| Per Capita Income | 630 | $28,878 |
| Median Family Income | 154 | $69,722 |
| Mean Family Income | 154 | $79,757 |
| Median Household Income | 322 | $44,167 |
| Mean Household Income | 322 | $52,523 |
| Income Deficit | 154 | $12,453 |
| Wage / Income Gap (%) | 630 | 20.96% |
| Wage / Income Gap ($) | 630 | 79.04¢ per $1 |
| Gini / Inequality Index | 630 | 0.52 |
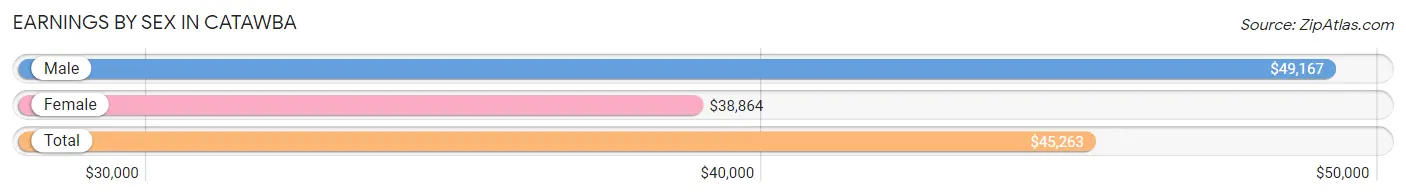
Earnings by Sex in Catawba
Average Earnings in Catawba are $45,263, $49,167 for men and $38,864 for women, a difference of 21.0%.
| Sex | Number | Average Earnings |
| Male | 178 (62.7%) | $49,167 |
| Female | 106 (37.3%) | $38,864 |
| Total | 284 (100.0%) | $45,263 |
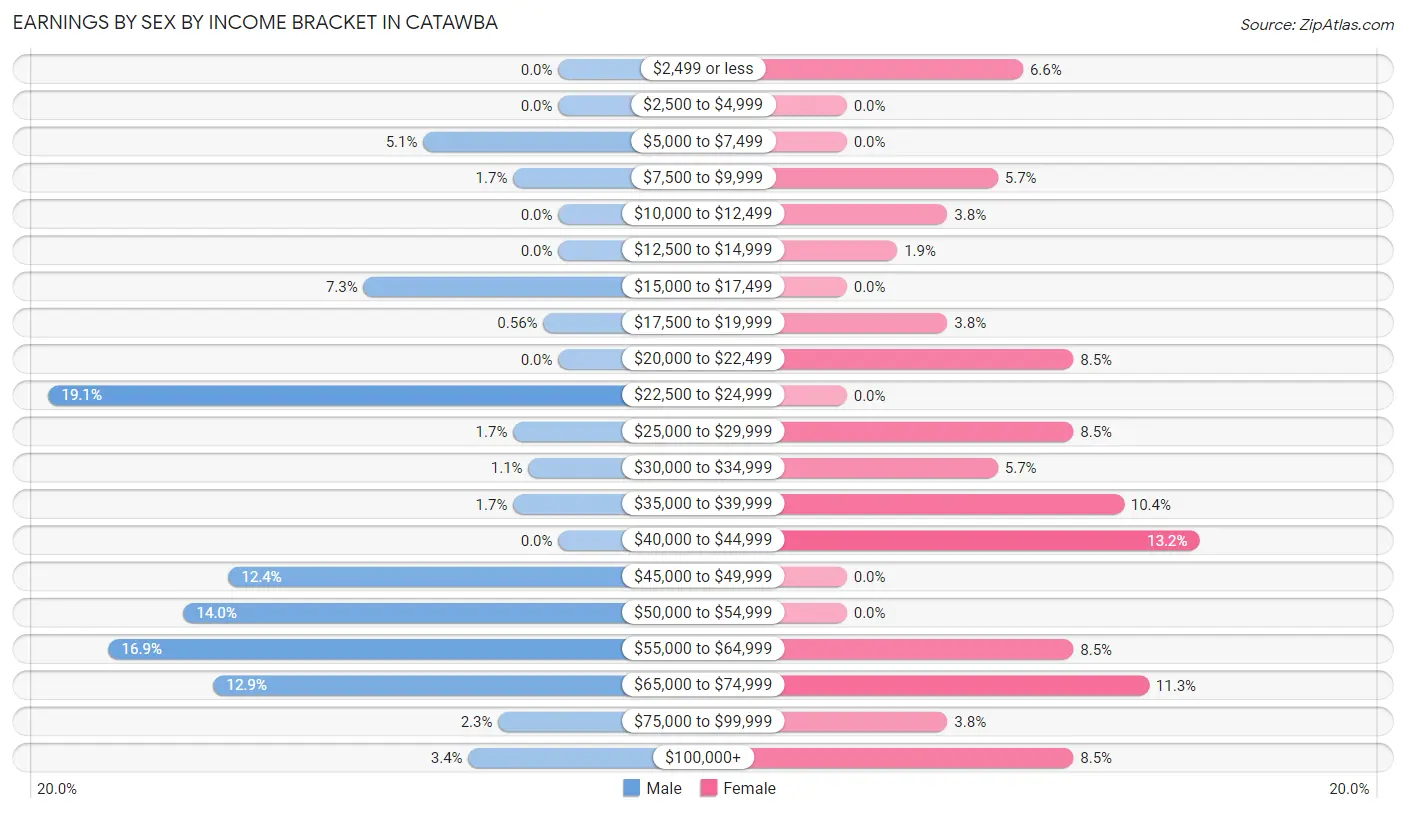
Earnings by Sex by Income Bracket in Catawba
The most common earnings brackets in Catawba are $22,500 to $24,999 for men (34 | 19.1%) and $40,000 to $44,999 for women (14 | 13.2%).
| Income | Male | Female |
| $2,499 or less | 0 (0.0%) | 7 (6.6%) |
| $2,500 to $4,999 | 0 (0.0%) | 0 (0.0%) |
| $5,000 to $7,499 | 9 (5.1%) | 0 (0.0%) |
| $7,500 to $9,999 | 3 (1.7%) | 6 (5.7%) |
| $10,000 to $12,499 | 0 (0.0%) | 4 (3.8%) |
| $12,500 to $14,999 | 0 (0.0%) | 2 (1.9%) |
| $15,000 to $17,499 | 13 (7.3%) | 0 (0.0%) |
| $17,500 to $19,999 | 1 (0.6%) | 4 (3.8%) |
| $20,000 to $22,499 | 0 (0.0%) | 9 (8.5%) |
| $22,500 to $24,999 | 34 (19.1%) | 0 (0.0%) |
| $25,000 to $29,999 | 3 (1.7%) | 9 (8.5%) |
| $30,000 to $34,999 | 2 (1.1%) | 6 (5.7%) |
| $35,000 to $39,999 | 3 (1.7%) | 11 (10.4%) |
| $40,000 to $44,999 | 0 (0.0%) | 14 (13.2%) |
| $45,000 to $49,999 | 22 (12.4%) | 0 (0.0%) |
| $50,000 to $54,999 | 25 (14.0%) | 0 (0.0%) |
| $55,000 to $64,999 | 30 (16.9%) | 9 (8.5%) |
| $65,000 to $74,999 | 23 (12.9%) | 12 (11.3%) |
| $75,000 to $99,999 | 4 (2.2%) | 4 (3.8%) |
| $100,000+ | 6 (3.4%) | 9 (8.5%) |
| Total | 178 (100.0%) | 106 (100.0%) |
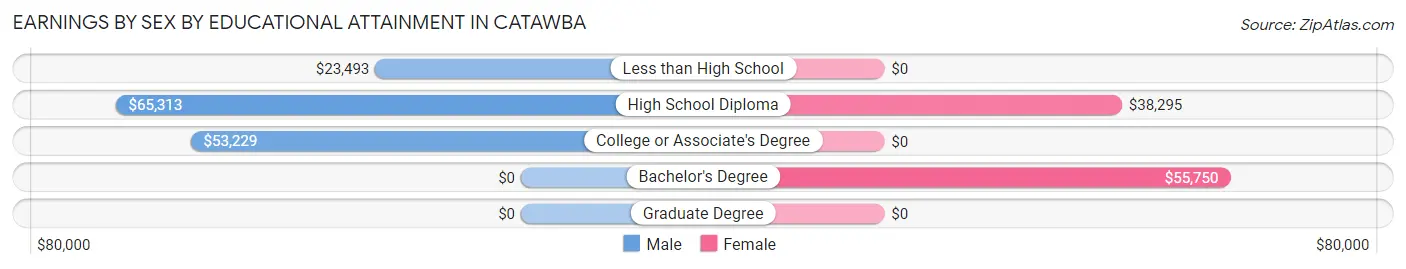
Earnings by Sex by Educational Attainment in Catawba
Average earnings in Catawba are $47,434 for men and $40,417 for women, a difference of 14.8%. Men with an educational attainment of high school diploma enjoy the highest average annual earnings of $65,313, while those with less than high school education earn the least with $23,493. Women with an educational attainment of bachelor's degree earn the most with the average annual earnings of $55,750, while those with high school diploma education have the smallest earnings of $38,295.
| Educational Attainment | Male Income | Female Income |
| Less than High School | $23,493 | $0 |
| High School Diploma | $65,313 | $38,295 |
| College or Associate's Degree | $53,229 | $0 |
| Bachelor's Degree | - | - |
| Graduate Degree | - | - |
| Total | $47,434 | $40,417 |
Family Income in Catawba
Family Income Brackets in Catawba
According to the Catawba family income data, there are 49 families falling into the $50,000 to $74,999 income range, which is the most common income bracket and makes up 31.8% of all families.
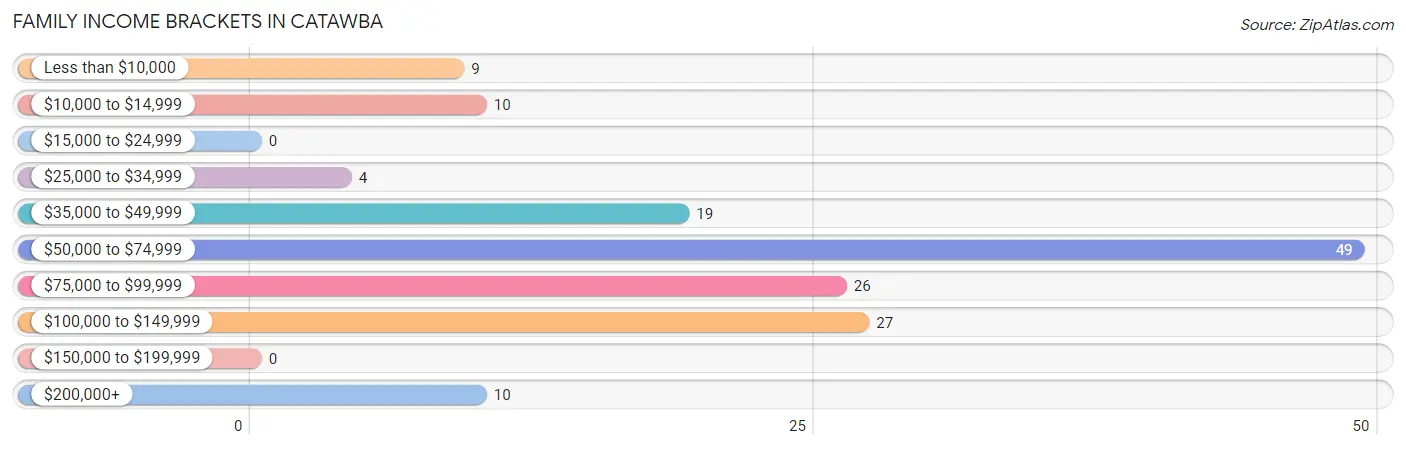
| Income Bracket | # Families | % Families |
| Less than $10,000 | 9 | 5.8% |
| $10,000 to $14,999 | 10 | 6.5% |
| $15,000 to $24,999 | 0 | 0.0% |
| $25,000 to $34,999 | 4 | 2.6% |
| $35,000 to $49,999 | 19 | 12.3% |
| $50,000 to $74,999 | 49 | 31.8% |
| $75,000 to $99,999 | 26 | 16.9% |
| $100,000 to $149,999 | 27 | 17.5% |
| $150,000 to $199,999 | 0 | 0.0% |
| $200,000+ | 10 | 6.5% |
Family Income by Famaliy Size in Catawba
2-person families (107 | 69.5%) account for the highest median family income in Catawba with $69,531 per family, while 2-person families (107 | 69.5%) have the highest median income of $34,766 per family member.
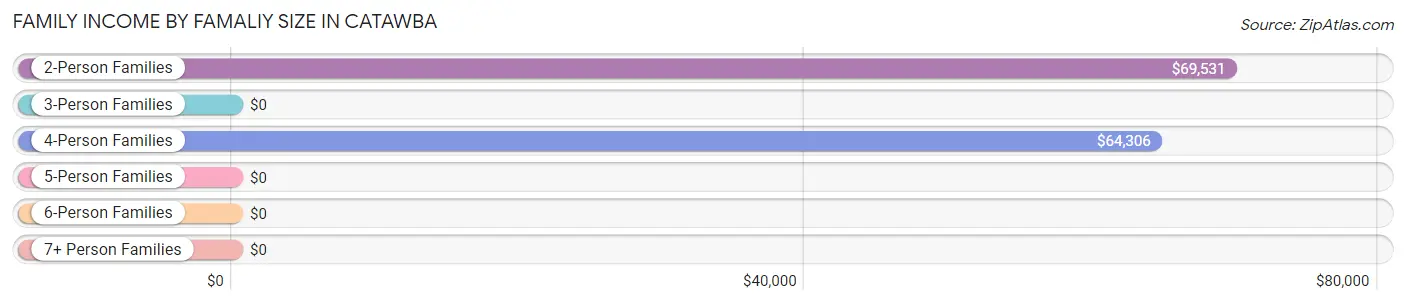
| Income Bracket | # Families | Median Income |
| 2-Person Families | 107 (69.5%) | $69,531 |
| 3-Person Families | 23 (14.9%) | $0 |
| 4-Person Families | 13 (8.4%) | $64,306 |
| 5-Person Families | 2 (1.3%) | $0 |
| 6-Person Families | 0 (0.0%) | $0 |
| 7+ Person Families | 9 (5.8%) | $0 |
| Total | 154 (100.0%) | $69,722 |
Family Income by Number of Earners in Catawba
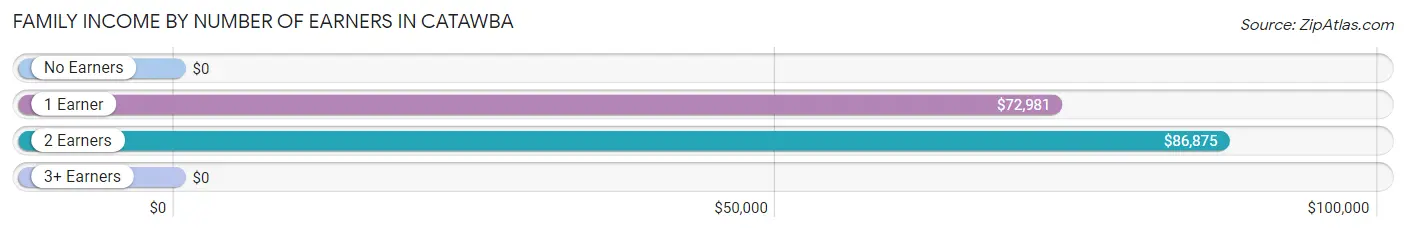
| Number of Earners | # Families | Median Income |
| No Earners | 34 (22.1%) | $0 |
| 1 Earner | 57 (37.0%) | $72,981 |
| 2 Earners | 61 (39.6%) | $86,875 |
| 3+ Earners | 2 (1.3%) | $0 |
| Total | 154 (100.0%) | $69,722 |
Household Income in Catawba
Household Income Brackets in Catawba
With 80 households falling in the category, the $50,000 to $74,999 income range is the most frequent in Catawba, accounting for 24.8% of all households.
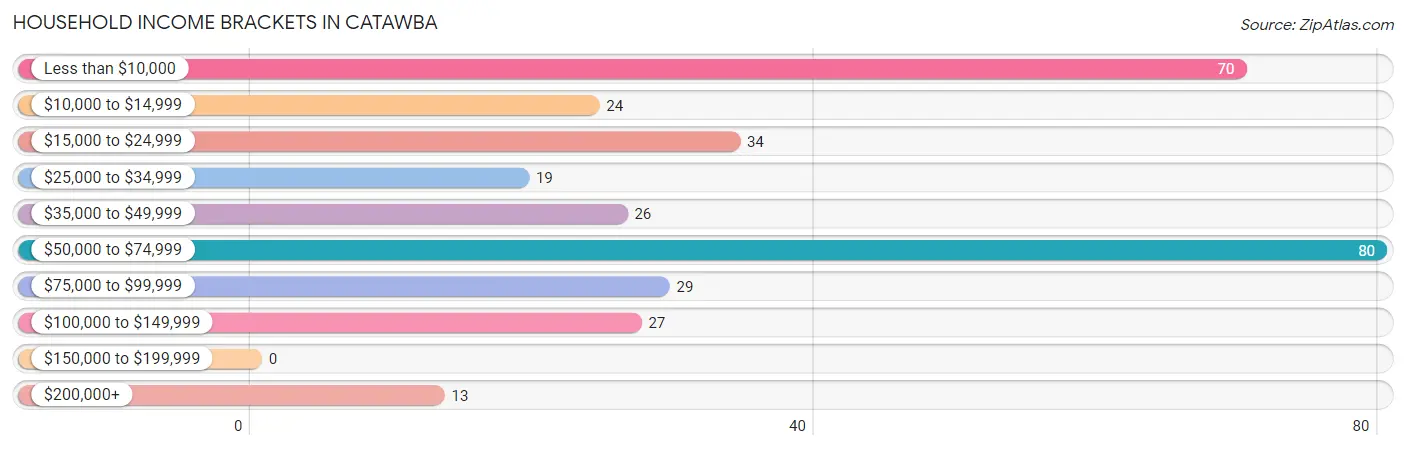
| Income Bracket | # Households | % Households |
| Less than $10,000 | 70 | 21.7% |
| $10,000 to $14,999 | 24 | 7.5% |
| $15,000 to $24,999 | 34 | 10.6% |
| $25,000 to $34,999 | 19 | 5.9% |
| $35,000 to $49,999 | 26 | 8.1% |
| $50,000 to $74,999 | 80 | 24.8% |
| $75,000 to $99,999 | 29 | 9.0% |
| $100,000 to $149,999 | 27 | 8.4% |
| $150,000 to $199,999 | 0 | 0.0% |
| $200,000+ | 13 | 4.0% |
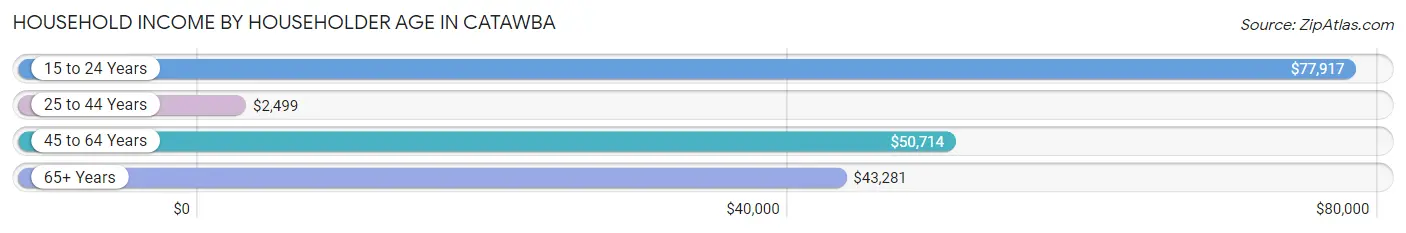
Household Income by Householder Age in Catawba
The median household income in Catawba is $44,167, with the highest median household income of $77,917 found in the 15 to 24 years age bracket for the primary householder. A total of 15 households (4.7%) fall into this category. Meanwhile, the 25 to 44 years age bracket for the primary householder has the lowest median household income of $2,499, with 94 households (29.2%) in this group.
| Income Bracket | # Households | Median Income |
| 15 to 24 Years | 15 (4.7%) | $77,917 |
| 25 to 44 Years | 94 (29.2%) | $2,499 |
| 45 to 64 Years | 132 (41.0%) | $50,714 |
| 65+ Years | 81 (25.2%) | $43,281 |
| Total | 322 (100.0%) | $44,167 |
Poverty in Catawba
Income Below Poverty by Sex and Age in Catawba
With 19.5% poverty level for males and 17.9% for females among the residents of Catawba, 15 year old males and 35 to 44 year old females are the most vulnerable to poverty, with 4 males (100.0%) and 13 females (37.1%) in their respective age groups living below the poverty level.
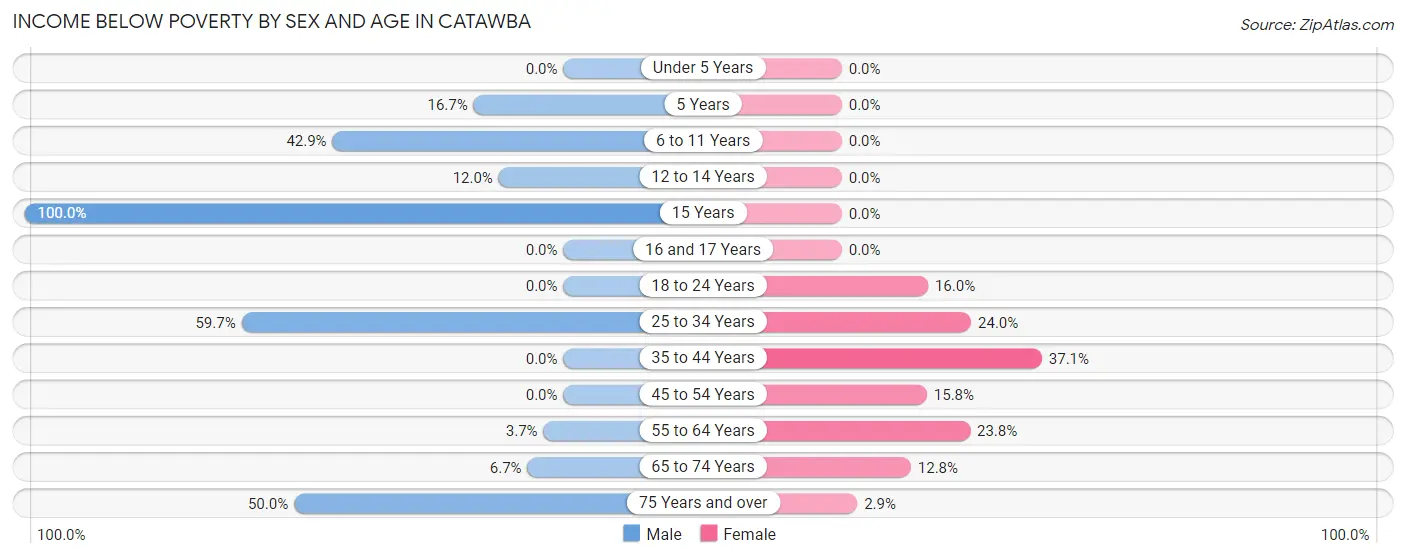
| Age Bracket | Male | Female |
| Under 5 Years | 0 (0.0%) | 0 (0.0%) |
| 5 Years | 1 (16.7%) | 0 (0.0%) |
| 6 to 11 Years | 3 (42.9%) | 0 (0.0%) |
| 12 to 14 Years | 3 (12.0%) | 0 (0.0%) |
| 15 Years | 4 (100.0%) | 0 (0.0%) |
| 16 and 17 Years | 0 (0.0%) | 0 (0.0%) |
| 18 to 24 Years | 0 (0.0%) | 4 (16.0%) |
| 25 to 34 Years | 46 (59.7%) | 6 (24.0%) |
| 35 to 44 Years | 0 (0.0%) | 13 (37.1%) |
| 45 to 54 Years | 0 (0.0%) | 3 (15.8%) |
| 55 to 64 Years | 4 (3.7%) | 10 (23.8%) |
| 65 to 74 Years | 1 (6.7%) | 5 (12.8%) |
| 75 Years and over | 13 (50.0%) | 1 (2.9%) |
| Total | 75 (19.5%) | 42 (17.9%) |
Income Above Poverty by Sex and Age in Catawba
According to the poverty statistics in Catawba, males aged under 5 years and females aged under 5 years are the age groups that are most secure financially, with 100.0% of males and 100.0% of females in these age groups living above the poverty line.
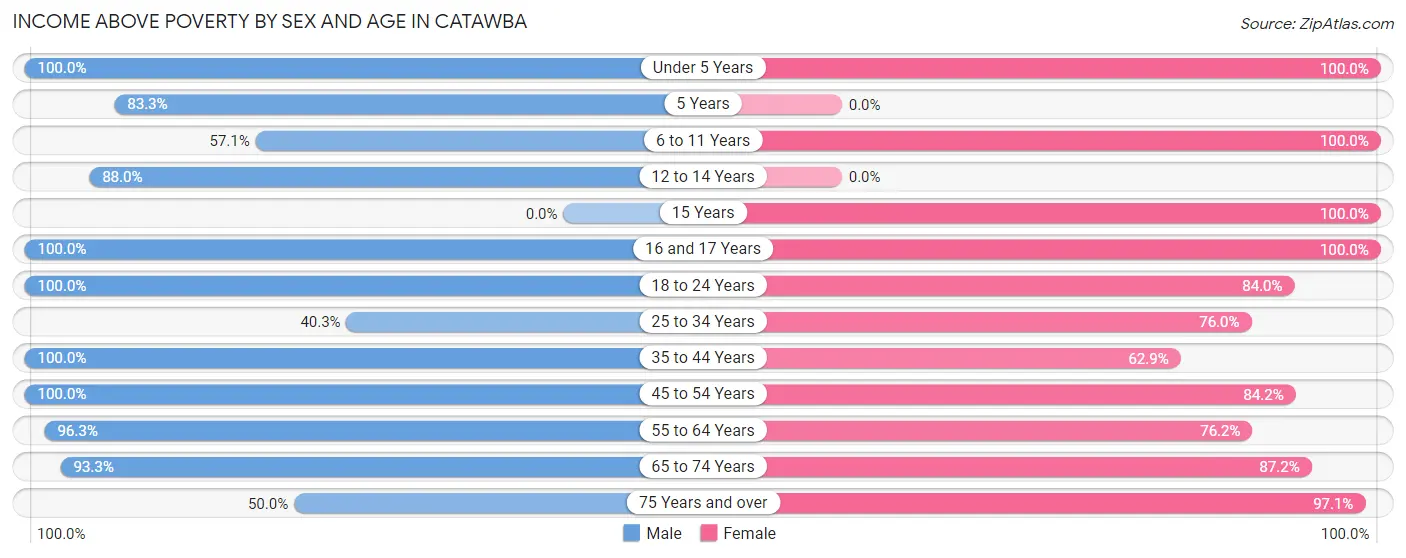
| Age Bracket | Male | Female |
| Under 5 Years | 19 (100.0%) | 1 (100.0%) |
| 5 Years | 5 (83.3%) | 0 (0.0%) |
| 6 to 11 Years | 4 (57.1%) | 11 (100.0%) |
| 12 to 14 Years | 22 (88.0%) | 0 (0.0%) |
| 15 Years | 0 (0.0%) | 1 (100.0%) |
| 16 and 17 Years | 6 (100.0%) | 2 (100.0%) |
| 18 to 24 Years | 24 (100.0%) | 21 (84.0%) |
| 25 to 34 Years | 31 (40.3%) | 19 (76.0%) |
| 35 to 44 Years | 23 (100.0%) | 22 (62.9%) |
| 45 to 54 Years | 44 (100.0%) | 16 (84.2%) |
| 55 to 64 Years | 104 (96.3%) | 32 (76.2%) |
| 65 to 74 Years | 14 (93.3%) | 34 (87.2%) |
| 75 Years and over | 13 (50.0%) | 34 (97.1%) |
| Total | 309 (80.5%) | 193 (82.1%) |
Income Below Poverty Among Married-Couple Families in Catawba
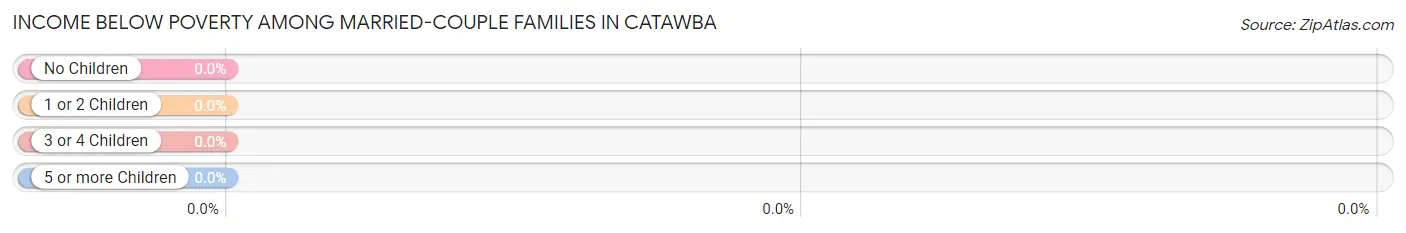
| Children | Above Poverty | Below Poverty |
| No Children | 81 (100.0%) | 0 (0.0%) |
| 1 or 2 Children | 12 (100.0%) | 0 (0.0%) |
| 3 or 4 Children | 0 (0.0%) | 0 (0.0%) |
| 5 or more Children | 9 (100.0%) | 0 (0.0%) |
| Total | 102 (100.0%) | 0 (0.0%) |
Income Below Poverty Among Single-Parent Households in Catawba
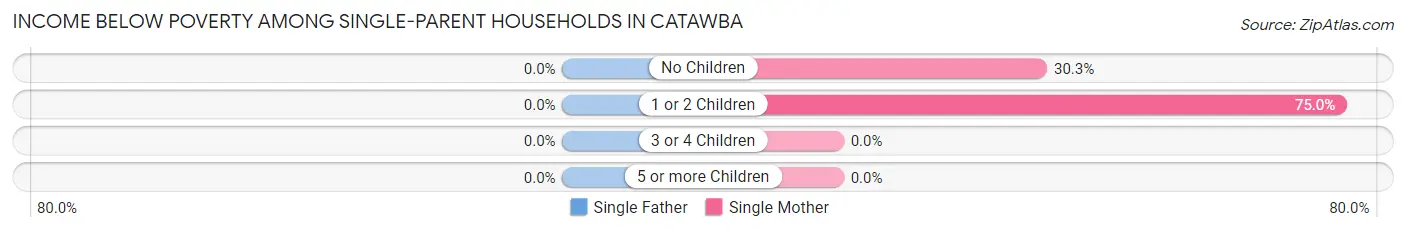
| Children | Single Father | Single Mother |
| No Children | 0 (0.0%) | 10 (30.3%) |
| 1 or 2 Children | 0 (0.0%) | 9 (75.0%) |
| 3 or 4 Children | 0 (0.0%) | 0 (0.0%) |
| 5 or more Children | 0 (0.0%) | 0 (0.0%) |
| Total | 0 (0.0%) | 19 (42.2%) |
Income Below Poverty Among Married-Couple vs Single-Parent Households in Catawba
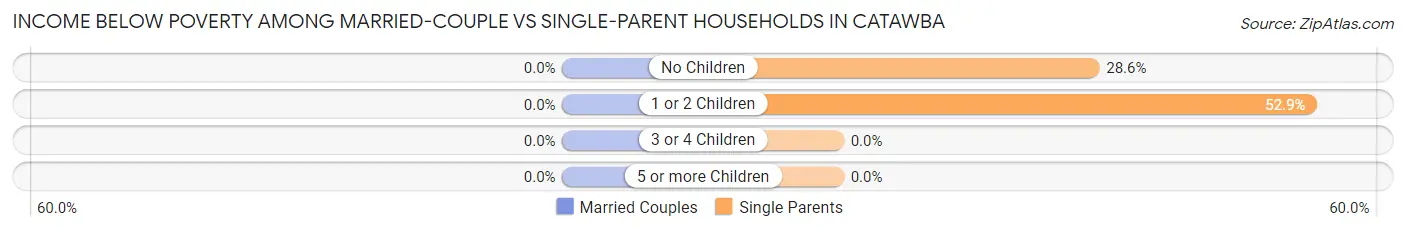
| Children | Married-Couple Families | Single-Parent Households |
| No Children | 0 (0.0%) | 10 (28.6%) |
| 1 or 2 Children | 0 (0.0%) | 9 (52.9%) |
| 3 or 4 Children | 0 (0.0%) | 0 (0.0%) |
| 5 or more Children | 0 (0.0%) | 0 (0.0%) |
| Total | 0 (0.0%) | 19 (36.5%) |
Race in Catawba
The most populous races in Catawba are White / Caucasian (490 | 77.8%), Black / African American (120 | 19.1%), and Hispanic or Latino (30 | 4.8%).
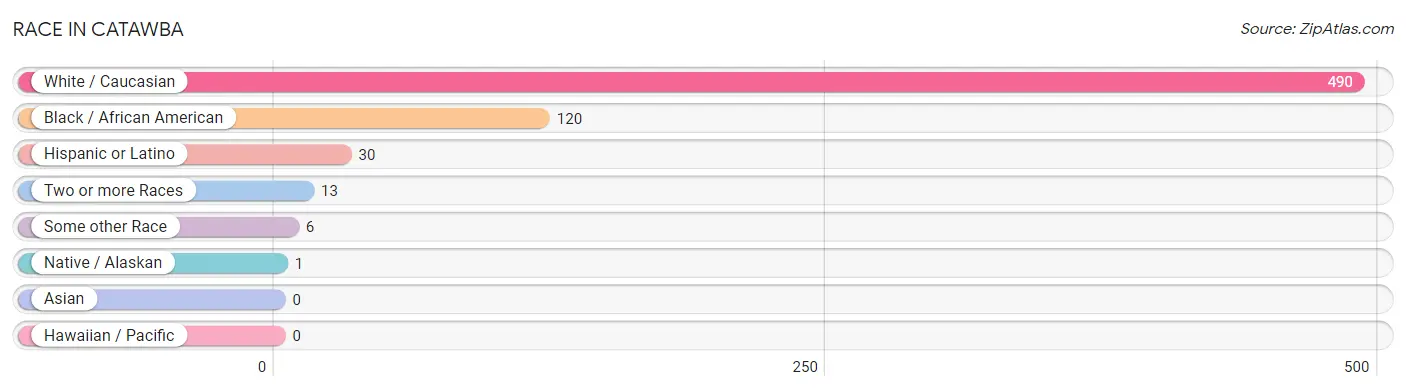
| Race | # Population | % Population |
| Asian | 0 | 0.0% |
| Black / African American | 120 | 19.1% |
| Hawaiian / Pacific | 0 | 0.0% |
| Hispanic or Latino | 30 | 4.8% |
| Native / Alaskan | 1 | 0.2% |
| White / Caucasian | 490 | 77.8% |
| Two or more Races | 13 | 2.1% |
| Some other Race | 6 | 0.9% |
| Total | 630 | 100.0% |
Ancestry in Catawba
The most populous ancestries reported in Catawba are German (144 | 22.9%), American (107 | 17.0%), African (60 | 9.5%), Subsaharan African (60 | 9.5%), and Welsh (51 | 8.1%), together accounting for 67.0% of all Catawba residents.
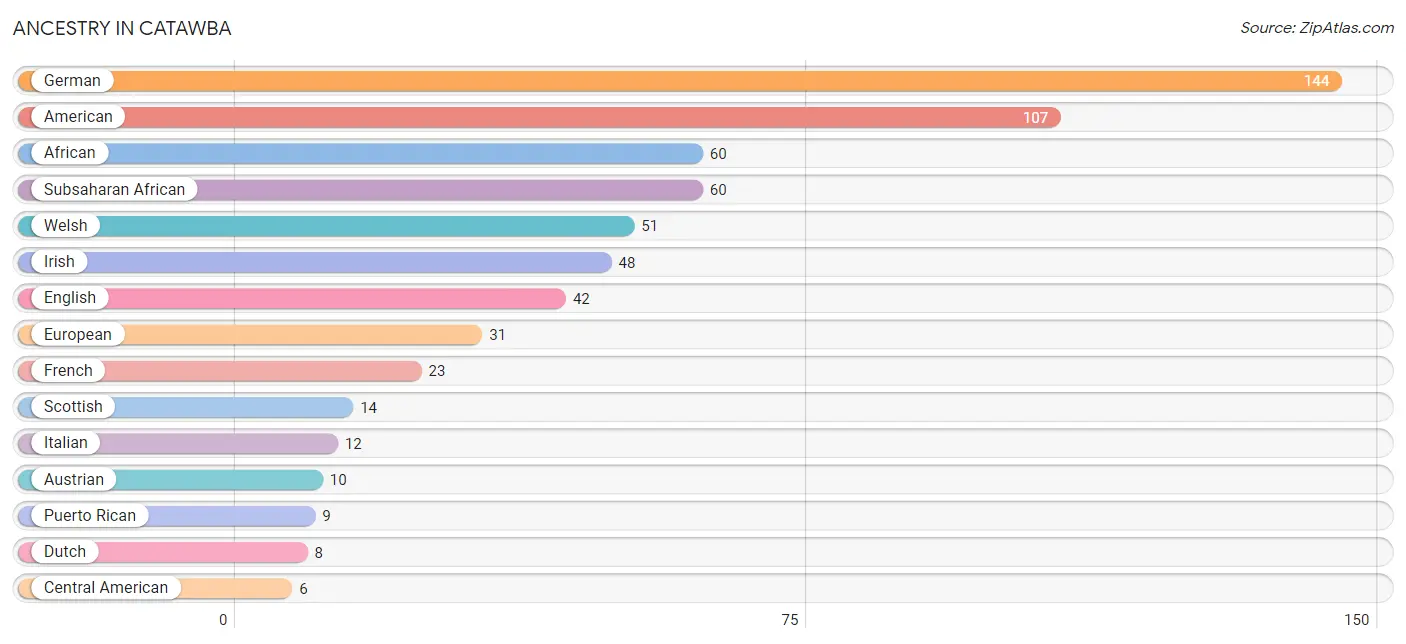
| Ancestry | # Population | % Population |
| African | 60 | 9.5% |
| American | 107 | 17.0% |
| Austrian | 10 | 1.6% |
| Central American | 6 | 0.9% |
| Cherokee | 4 | 0.6% |
| Colombian | 3 | 0.5% |
| Cuban | 1 | 0.2% |
| Dominican | 4 | 0.6% |
| Dutch | 8 | 1.3% |
| English | 42 | 6.7% |
| European | 31 | 4.9% |
| French | 23 | 3.6% |
| German | 144 | 22.9% |
| Irish | 48 | 7.6% |
| Italian | 12 | 1.9% |
| Korean | 6 | 0.9% |
| Mexican | 4 | 0.6% |
| Polish | 6 | 0.9% |
| Puerto Rican | 9 | 1.4% |
| Salvadoran | 6 | 0.9% |
| Scotch-Irish | 3 | 0.5% |
| Scottish | 14 | 2.2% |
| South American | 3 | 0.5% |
| Spanish | 3 | 0.5% |
| Subsaharan African | 60 | 9.5% |
| Welsh | 51 | 8.1% | View All 26 Rows |
Immigrants in Catawba
The most numerous immigrant groups reported in Catawba came from Latin America (8 | 1.3%), Central America (5 | 0.8%), Colombia (3 | 0.5%), El Salvador (3 | 0.5%), and South America (3 | 0.5%), together accounting for 3.5% of all Catawba residents.
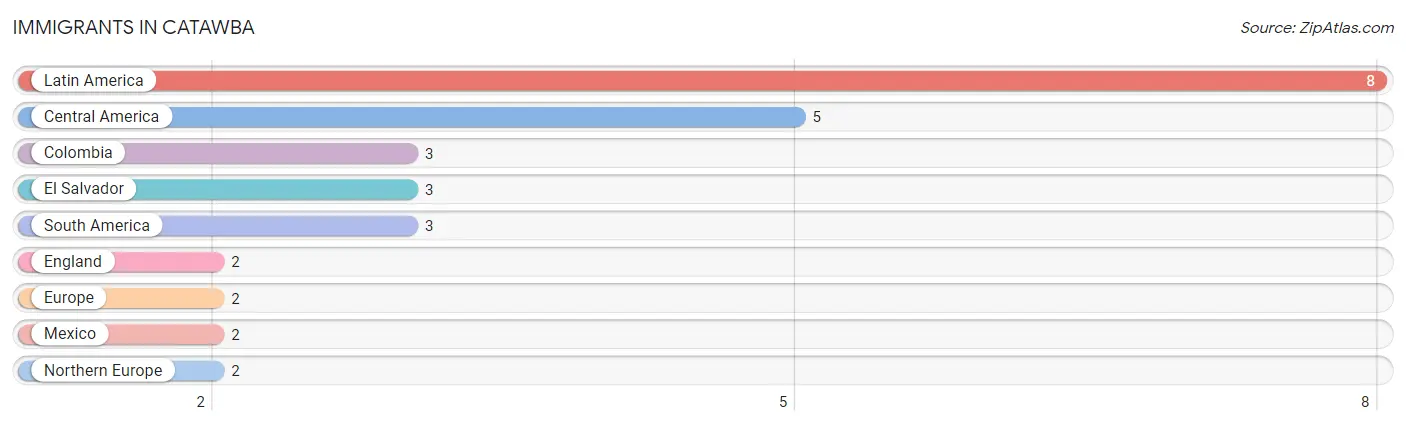
| Immigration Origin | # Population | % Population |
| Central America | 5 | 0.8% |
| Colombia | 3 | 0.5% |
| El Salvador | 3 | 0.5% |
| England | 2 | 0.3% |
| Europe | 2 | 0.3% |
| Latin America | 8 | 1.3% |
| Mexico | 2 | 0.3% |
| Northern Europe | 2 | 0.3% |
| South America | 3 | 0.5% | View All 9 Rows |
Sex and Age in Catawba
Sex and Age in Catawba
The most populous age groups in Catawba are 60 to 64 Years (102 | 26.6%) for men and 35 to 39 Years (27 | 11.0%) for women.
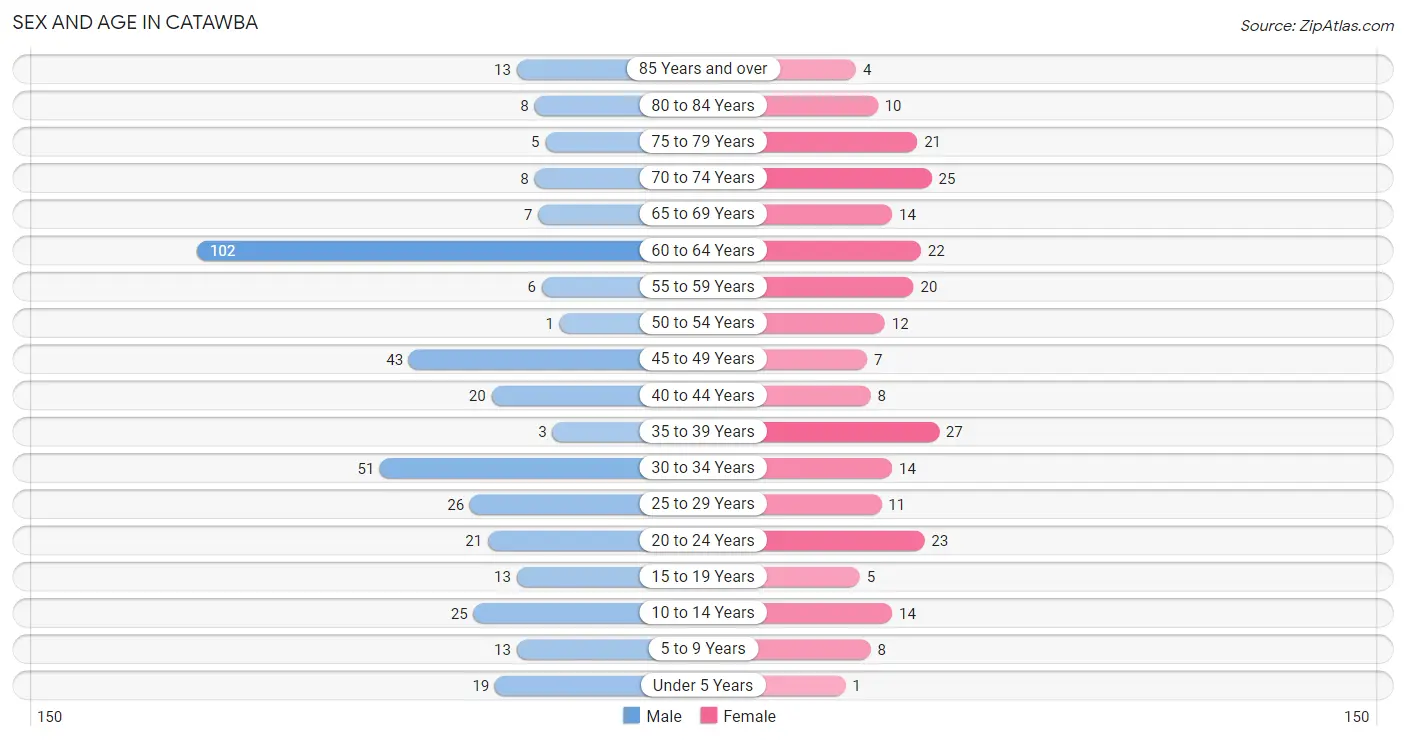
| Age Bracket | Male | Female |
| Under 5 Years | 19 (5.0%) | 1 (0.4%) |
| 5 to 9 Years | 13 (3.4%) | 8 (3.3%) |
| 10 to 14 Years | 25 (6.5%) | 14 (5.7%) |
| 15 to 19 Years | 13 (3.4%) | 5 (2.0%) |
| 20 to 24 Years | 21 (5.5%) | 23 (9.3%) |
| 25 to 29 Years | 26 (6.8%) | 11 (4.5%) |
| 30 to 34 Years | 51 (13.3%) | 14 (5.7%) |
| 35 to 39 Years | 3 (0.8%) | 27 (11.0%) |
| 40 to 44 Years | 20 (5.2%) | 8 (3.3%) |
| 45 to 49 Years | 43 (11.2%) | 7 (2.9%) |
| 50 to 54 Years | 1 (0.3%) | 12 (4.9%) |
| 55 to 59 Years | 6 (1.6%) | 20 (8.1%) |
| 60 to 64 Years | 102 (26.6%) | 22 (8.9%) |
| 65 to 69 Years | 7 (1.8%) | 14 (5.7%) |
| 70 to 74 Years | 8 (2.1%) | 25 (10.2%) |
| 75 to 79 Years | 5 (1.3%) | 21 (8.5%) |
| 80 to 84 Years | 8 (2.1%) | 10 (4.1%) |
| 85 Years and over | 13 (3.4%) | 4 (1.6%) |
| Total | 384 (100.0%) | 246 (100.0%) |
Families and Households in Catawba
Median Family Size in Catawba
The median family size in Catawba is 2.78 persons per family, with married-couple families (102 | 66.2%) accounting for the largest median family size of 3.12 persons per family. On the other hand, single female/mother families (45 | 29.2%) represent the smallest median family size with 2.07 persons per family.
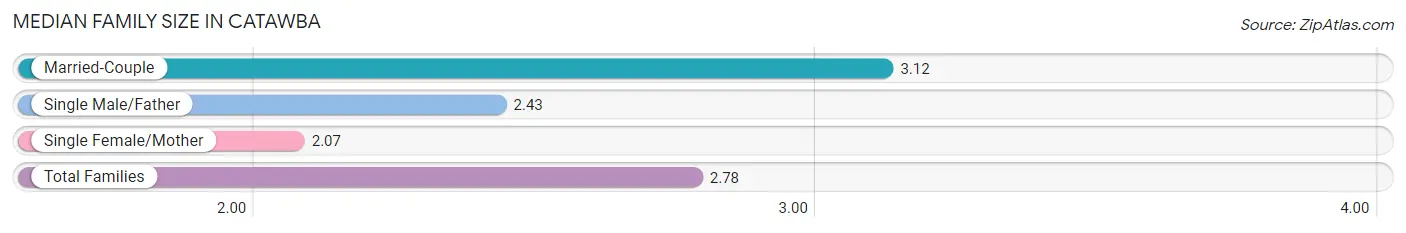
| Family Type | # Families | Family Size |
| Married-Couple | 102 (66.2%) | 3.12 |
| Single Male/Father | 7 (4.5%) | 2.43 |
| Single Female/Mother | 45 (29.2%) | 2.07 |
| Total Families | 154 (100.0%) | 2.78 |
Median Household Size in Catawba
The median household size in Catawba is 1.96 persons per household, with married-couple households (102 | 31.7%) accounting for the largest median household size of 3.12 persons per household. non-family households (168 | 52.2%) represent the smallest median household size with 1.18 persons per household.
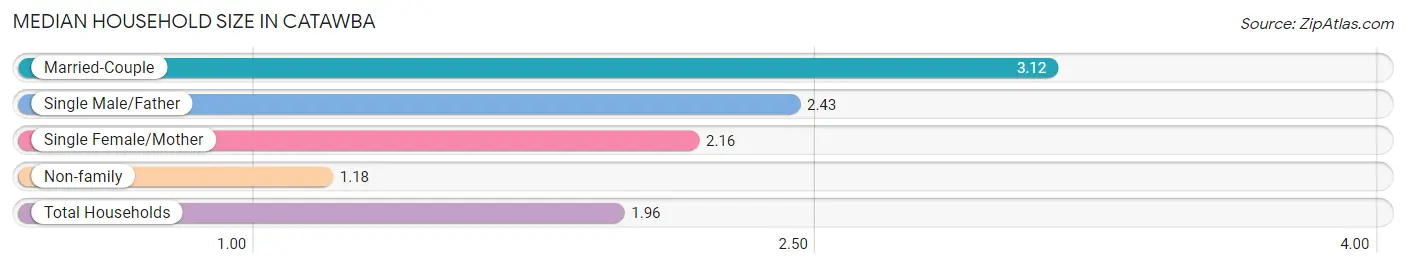
| Household Type | # Households | Household Size |
| Married-Couple | 102 (31.7%) | 3.12 |
| Single Male/Father | 7 (2.2%) | 2.43 |
| Single Female/Mother | 45 (14.0%) | 2.16 |
| Non-family | 168 (52.2%) | 1.18 |
| Total Households | 322 (100.0%) | 1.96 |
Household Size by Marriage Status in Catawba
Out of a total of 322 households in Catawba, 154 (47.8%) are family households, while 168 (52.2%) are nonfamily households. The most numerous type of family households are 2-person households, comprising 104, and the most common type of nonfamily households are 1-person households, comprising 162.
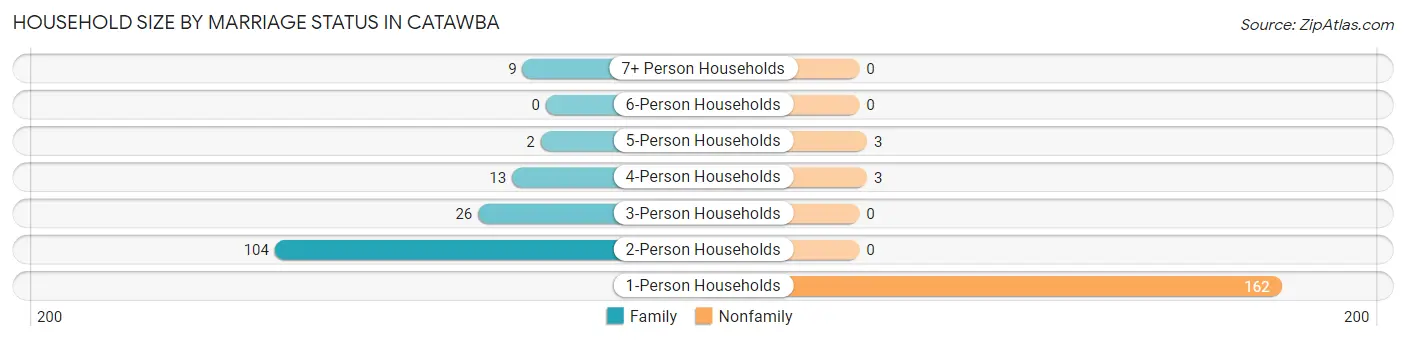
| Household Size | Family Households | Nonfamily Households |
| 1-Person Households | - | 162 (50.3%) |
| 2-Person Households | 104 (32.3%) | 0 (0.0%) |
| 3-Person Households | 26 (8.1%) | 0 (0.0%) |
| 4-Person Households | 13 (4.0%) | 3 (0.9%) |
| 5-Person Households | 2 (0.6%) | 3 (0.9%) |
| 6-Person Households | 0 (0.0%) | 0 (0.0%) |
| 7+ Person Households | 9 (2.8%) | 0 (0.0%) |
| Total | 154 (47.8%) | 168 (52.2%) |
Female Fertility in Catawba
Fertility by Age in Catawba
Average fertility rate in Catawba is 51.0 births per 1,000 women. Women in the age bracket of 20 to 34 years have the highest fertility rate with 83.0 births per 1,000 women. Women in the age bracket of 20 to 34 years acount for 80.0% of all women with births.
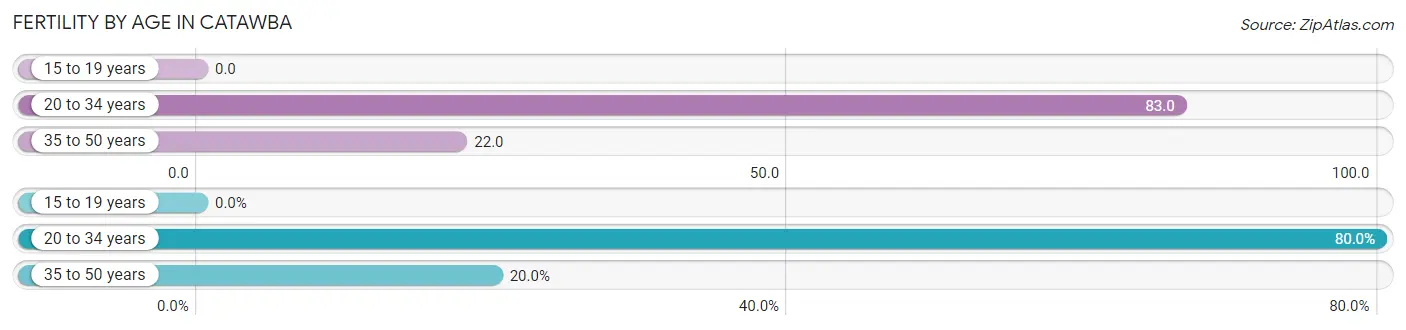
| Age Bracket | Women with Births | Births / 1,000 Women |
| 15 to 19 years | 0 (0.0%) | 0.0 |
| 20 to 34 years | 4 (80.0%) | 83.0 |
| 35 to 50 years | 1 (20.0%) | 22.0 |
| Total | 5 (100.0%) | 51.0 |
Fertility by Age by Marriage Status in Catawba
40.0% of women with births (5) in Catawba are married. The highest percentage of unmarried women with births falls into 20 to 34 years age bracket with 75.0% of them unmarried at the time of birth, while the lowest percentage of unmarried women with births belong to 35 to 50 years age bracket with 0.0% of them unmarried.
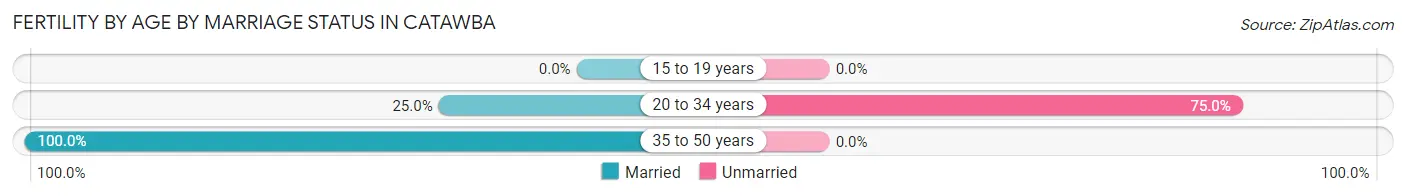
| Age Bracket | Married | Unmarried |
| 15 to 19 years | 0 (0.0%) | 0 (0.0%) |
| 20 to 34 years | 1 (25.0%) | 3 (75.0%) |
| 35 to 50 years | 1 (100.0%) | 0 (0.0%) |
| Total | 2 (40.0%) | 3 (60.0%) |
Fertility by Education in Catawba
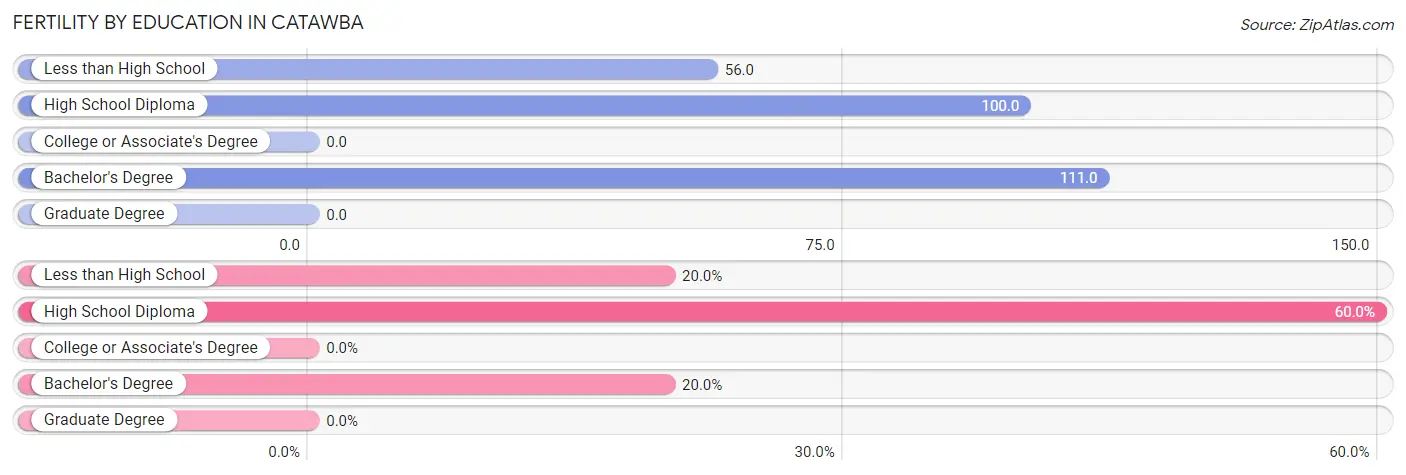
| Educational Attainment | Women with Births | Births / 1,000 Women |
| Less than High School | 1 (20.0%) | 56.0 |
| High School Diploma | 3 (60.0%) | 100.0 |
| College or Associate's Degree | 0 (0.0%) | 0.0 |
| Bachelor's Degree | 1 (20.0%) | 111.0 |
| Graduate Degree | 0 (0.0%) | 0.0 |
| Total | 5 (100.0%) | 51.0 |
Fertility by Education by Marriage Status in Catawba
60.0% of women with births in Catawba are unmarried. Women with the educational attainment of less than high school are most likely to be married with 100.0% of them married at childbirth, while women with the educational attainment of high school diploma are least likely to be married with 100.0% of them unmarried at childbirth.
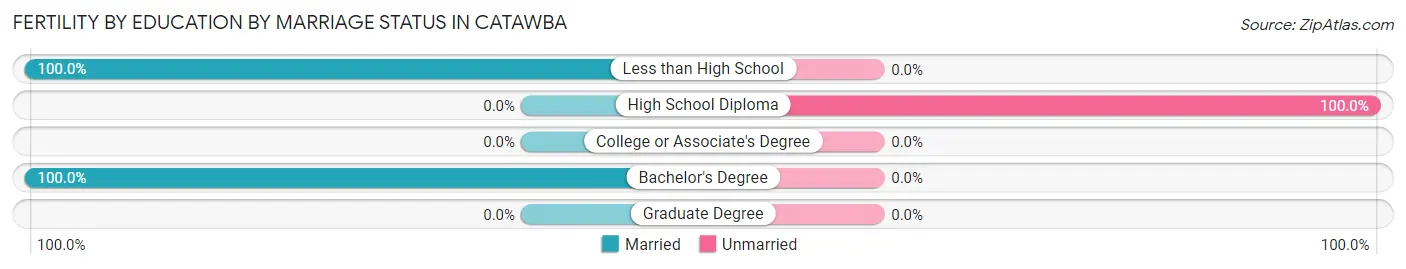
| Educational Attainment | Married | Unmarried |
| Less than High School | 1 (100.0%) | 0 (0.0%) |
| High School Diploma | 0 (0.0%) | 3 (100.0%) |
| College or Associate's Degree | 0 (0.0%) | 0 (0.0%) |
| Bachelor's Degree | 1 (100.0%) | 0 (0.0%) |
| Graduate Degree | 0 (0.0%) | 0 (0.0%) |
| Total | 2 (40.0%) | 3 (60.0%) |
Employment Characteristics in Catawba
Employment by Class of Employer in Catawba
Among the 268 employed individuals in Catawba, private company employees (185 | 69.0%), self-employed (not incorporated) (38 | 14.2%), and local government employees (25 | 9.3%) make up the most common classes of employment.
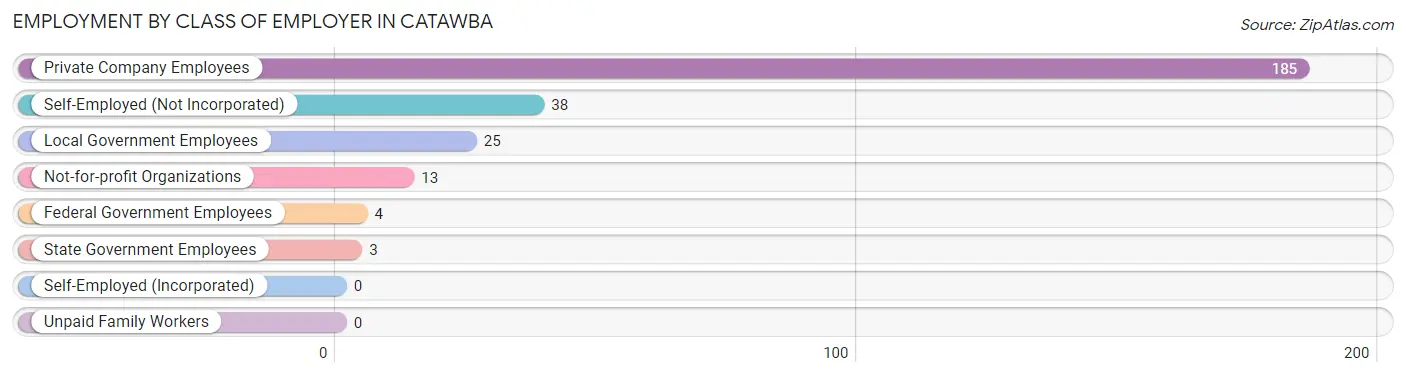
| Employer Class | # Employees | % Employees |
| Private Company Employees | 185 | 69.0% |
| Self-Employed (Incorporated) | 0 | 0.0% |
| Self-Employed (Not Incorporated) | 38 | 14.2% |
| Not-for-profit Organizations | 13 | 4.9% |
| Local Government Employees | 25 | 9.3% |
| State Government Employees | 3 | 1.1% |
| Federal Government Employees | 4 | 1.5% |
| Unpaid Family Workers | 0 | 0.0% |
| Total | 268 | 100.0% |
Employment Status by Age in Catawba
According to the labor force statistics for Catawba, out of the total population over 16 years of age (545), 52.7% or 287 individuals are in the labor force, with 5.2% or 15 of them unemployed. The age group with the highest labor force participation rate is 25 to 29 years, with 100.0% or 37 individuals in the labor force. Within the labor force, the 30 to 34 years age range has the highest percentage of unemployed individuals, with 31.6% or 6 of them being unemployed.
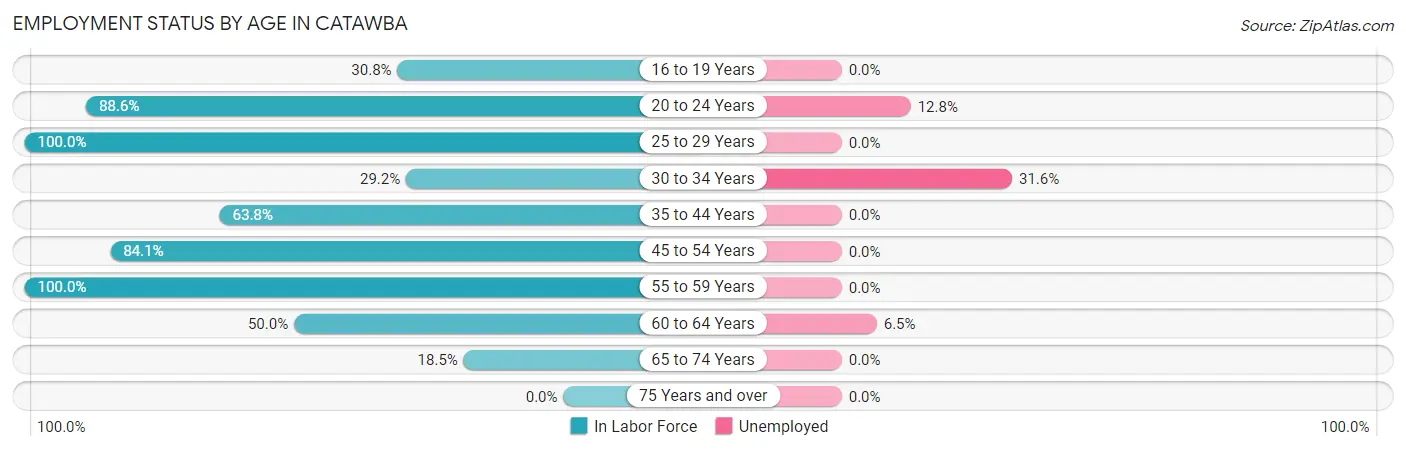
| Age Bracket | In Labor Force | Unemployed |
| 16 to 19 Years | 4 (30.8%) | 0 (0.0%) |
| 20 to 24 Years | 39 (88.6%) | 5 (12.8%) |
| 25 to 29 Years | 37 (100.0%) | 0 (0.0%) |
| 30 to 34 Years | 19 (29.2%) | 6 (31.6%) |
| 35 to 44 Years | 37 (63.8%) | 0 (0.0%) |
| 45 to 54 Years | 53 (84.1%) | 0 (0.0%) |
| 55 to 59 Years | 26 (100.0%) | 0 (0.0%) |
| 60 to 64 Years | 62 (50.0%) | 4 (6.5%) |
| 65 to 74 Years | 10 (18.5%) | 0 (0.0%) |
| 75 Years and over | 0 (0.0%) | 0 (0.0%) |
| Total | 287 (52.7%) | 15 (5.2%) |
Employment Status by Educational Attainment in Catawba
According to labor force statistics for Catawba, 62.7% of individuals (234) out of the total population between 25 and 64 years of age (373) are in the labor force, with 4.3% or 10 of them being unemployed. The group with the highest labor force participation rate are those with the educational attainment of bachelor's degree or higher, with 100.0% or 17 individuals in the labor force. Within the labor force, individuals with high school diploma education have the highest percentage of unemployment, with 9.4% or 6 of them being unemployed.
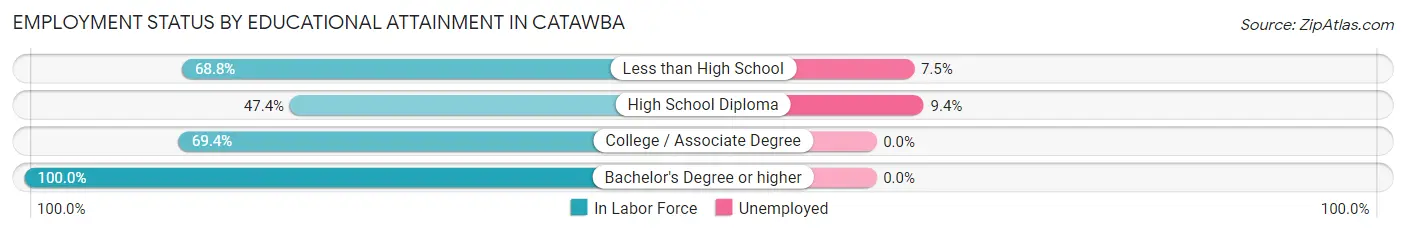
| Educational Attainment | In Labor Force | Unemployed |
| Less than High School | 53 (68.8%) | 6 (7.5%) |
| High School Diploma | 64 (47.4%) | 13 (9.4%) |
| College / Associate Degree | 100 (69.4%) | 0 (0.0%) |
| Bachelor's Degree or higher | 17 (100.0%) | 0 (0.0%) |
| Total | 234 (62.7%) | 16 (4.3%) |
Employment Occupations by Sex in Catawba
Management, Business, Science and Arts Occupations
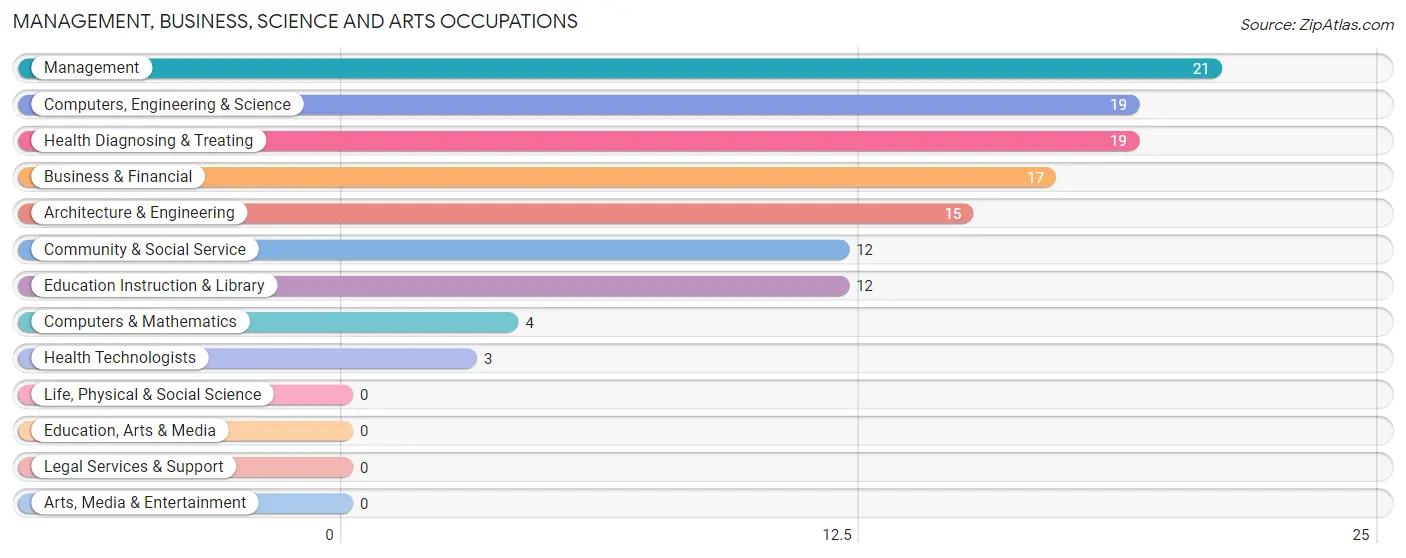
The most common Management, Business, Science and Arts occupations in Catawba are Management (21 | 7.7%), Computers, Engineering & Science (19 | 7.0%), Health Diagnosing & Treating (19 | 7.0%), Business & Financial (17 | 6.2%), and Architecture & Engineering (15 | 5.5%).
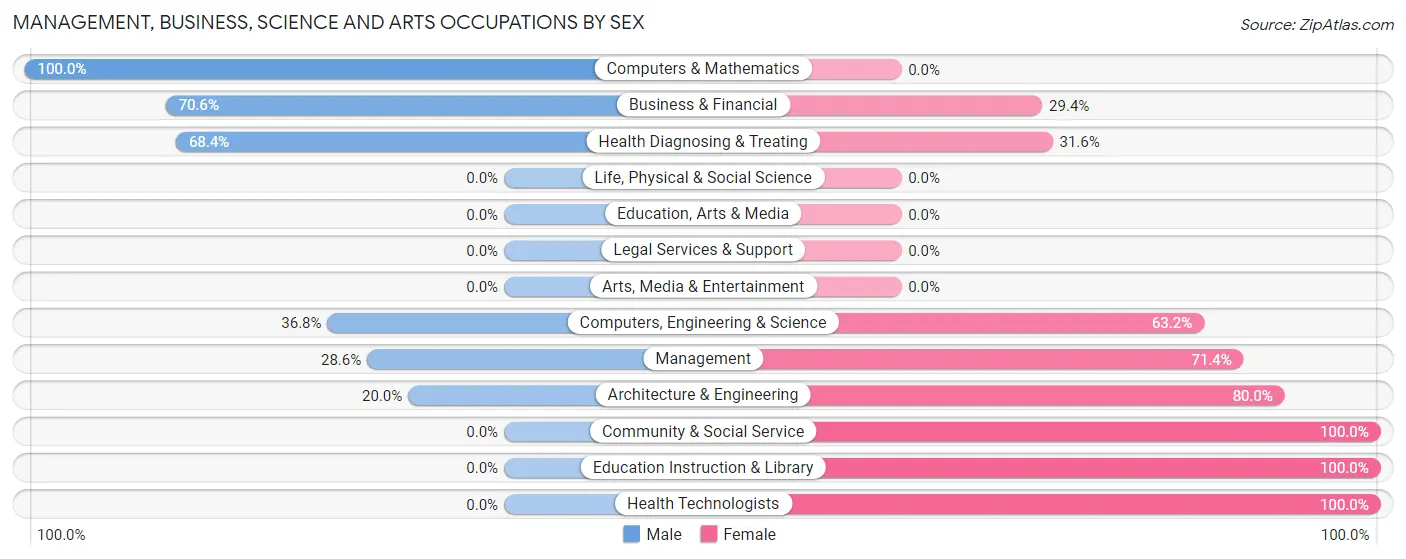
Management, Business, Science and Arts Occupations by Sex
Within the Management, Business, Science and Arts occupations in Catawba, the most male-oriented occupations are Computers & Mathematics (100.0%), Business & Financial (70.6%), and Health Diagnosing & Treating (68.4%), while the most female-oriented occupations are Community & Social Service (100.0%), Education Instruction & Library (100.0%), and Health Technologists (100.0%).
| Occupation | Male | Female |
| Management | 6 (28.6%) | 15 (71.4%) |
| Business & Financial | 12 (70.6%) | 5 (29.4%) |
| Computers, Engineering & Science | 7 (36.8%) | 12 (63.2%) |
| Computers & Mathematics | 4 (100.0%) | 0 (0.0%) |
| Architecture & Engineering | 3 (20.0%) | 12 (80.0%) |
| Life, Physical & Social Science | 0 (0.0%) | 0 (0.0%) |
| Community & Social Service | 0 (0.0%) | 12 (100.0%) |
| Education, Arts & Media | 0 (0.0%) | 0 (0.0%) |
| Legal Services & Support | 0 (0.0%) | 0 (0.0%) |
| Education Instruction & Library | 0 (0.0%) | 12 (100.0%) |
| Arts, Media & Entertainment | 0 (0.0%) | 0 (0.0%) |
| Health Diagnosing & Treating | 13 (68.4%) | 6 (31.6%) |
| Health Technologists | 0 (0.0%) | 3 (100.0%) |
| Total (Category) | 38 (43.2%) | 50 (56.8%) |
| Total (Overall) | 168 (61.8%) | 104 (38.2%) |
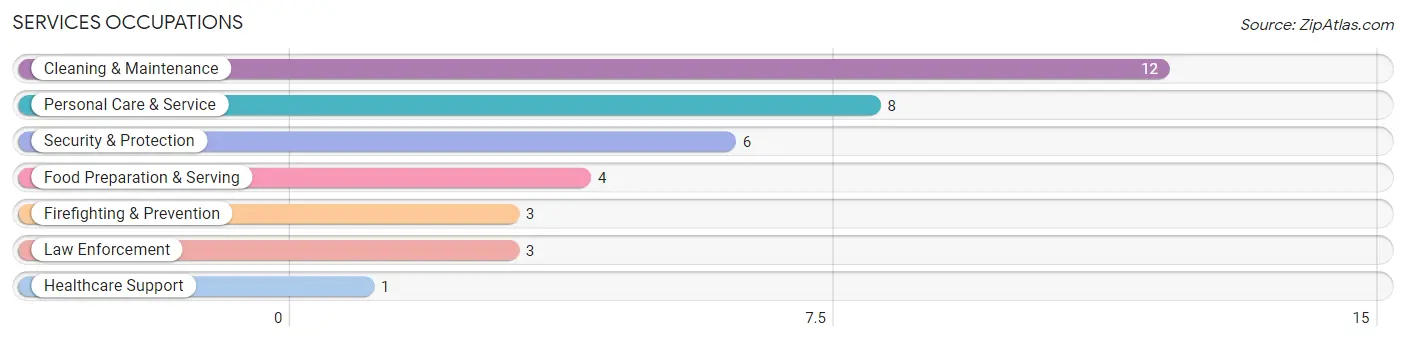
Services Occupations
The most common Services occupations in Catawba are Cleaning & Maintenance (12 | 4.4%), Personal Care & Service (8 | 2.9%), Security & Protection (6 | 2.2%), Food Preparation & Serving (4 | 1.5%), and Firefighting & Prevention (3 | 1.1%).
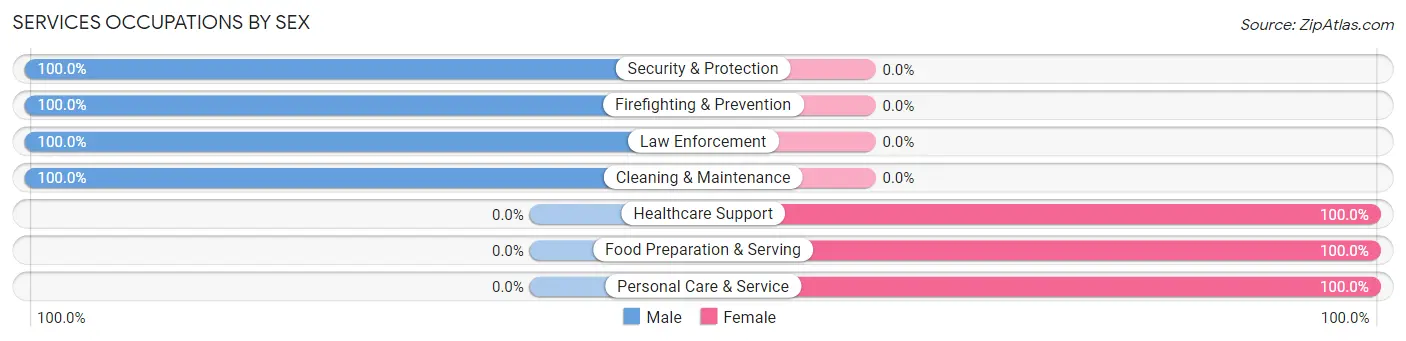
Services Occupations by Sex
Within the Services occupations in Catawba, the most male-oriented occupations are Security & Protection (100.0%), Firefighting & Prevention (100.0%), and Law Enforcement (100.0%), while the most female-oriented occupations are Healthcare Support (100.0%), Food Preparation & Serving (100.0%), and Personal Care & Service (100.0%).
| Occupation | Male | Female |
| Healthcare Support | 0 (0.0%) | 1 (100.0%) |
| Security & Protection | 6 (100.0%) | 0 (0.0%) |
| Firefighting & Prevention | 3 (100.0%) | 0 (0.0%) |
| Law Enforcement | 3 (100.0%) | 0 (0.0%) |
| Food Preparation & Serving | 0 (0.0%) | 4 (100.0%) |
| Cleaning & Maintenance | 12 (100.0%) | 0 (0.0%) |
| Personal Care & Service | 0 (0.0%) | 8 (100.0%) |
| Total (Category) | 18 (58.1%) | 13 (41.9%) |
| Total (Overall) | 168 (61.8%) | 104 (38.2%) |
Sales and Office Occupations
The most common Sales and Office occupations in Catawba are Office & Administration (15 | 5.5%), and Sales & Related (7 | 2.6%).
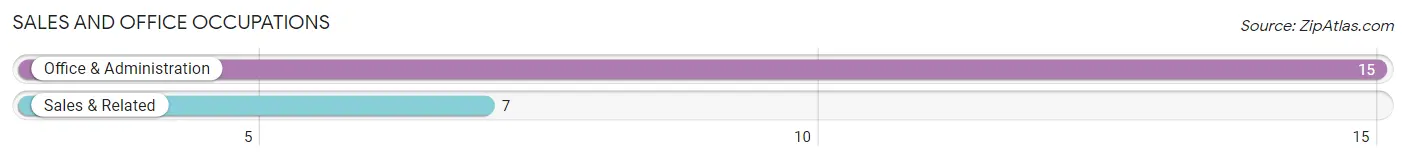
Sales and Office Occupations by Sex
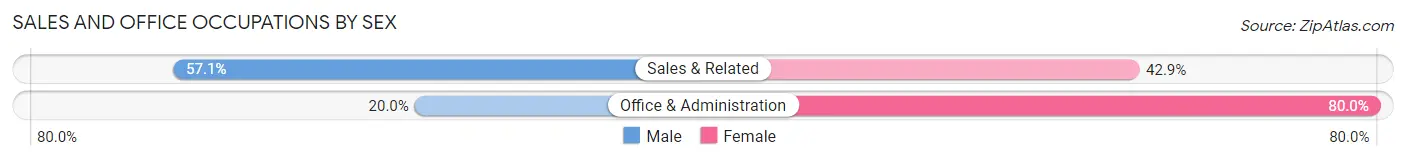
| Occupation | Male | Female |
| Sales & Related | 4 (57.1%) | 3 (42.9%) |
| Office & Administration | 3 (20.0%) | 12 (80.0%) |
| Total (Category) | 7 (31.8%) | 15 (68.2%) |
| Total (Overall) | 168 (61.8%) | 104 (38.2%) |
Natural Resources, Construction and Maintenance Occupations
The most common Natural Resources, Construction and Maintenance occupations in Catawba are Farming, Fishing & Forestry (4 | 1.5%), Construction & Extraction (4 | 1.5%), and Installation, Maintenance & Repair (1 | 0.4%).
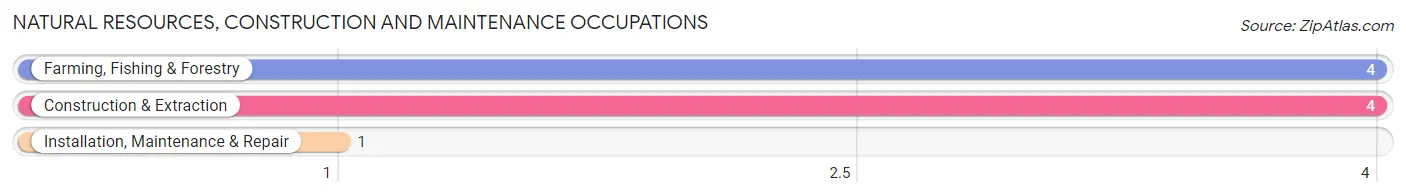
Natural Resources, Construction and Maintenance Occupations by Sex
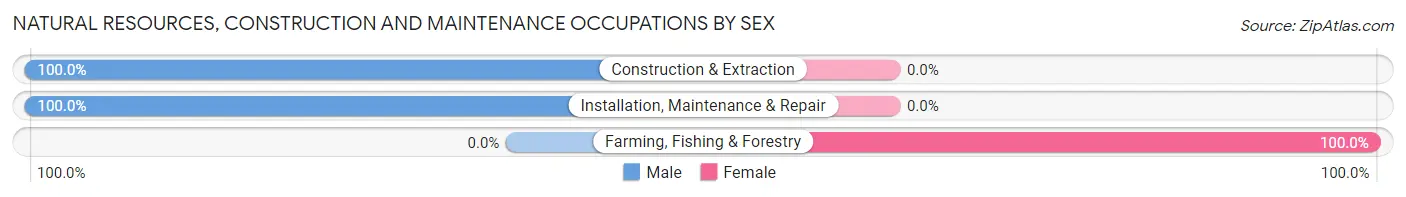
| Occupation | Male | Female |
| Farming, Fishing & Forestry | 0 (0.0%) | 4 (100.0%) |
| Construction & Extraction | 4 (100.0%) | 0 (0.0%) |
| Installation, Maintenance & Repair | 1 (100.0%) | 0 (0.0%) |
| Total (Category) | 5 (55.6%) | 4 (44.4%) |
| Total (Overall) | 168 (61.8%) | 104 (38.2%) |
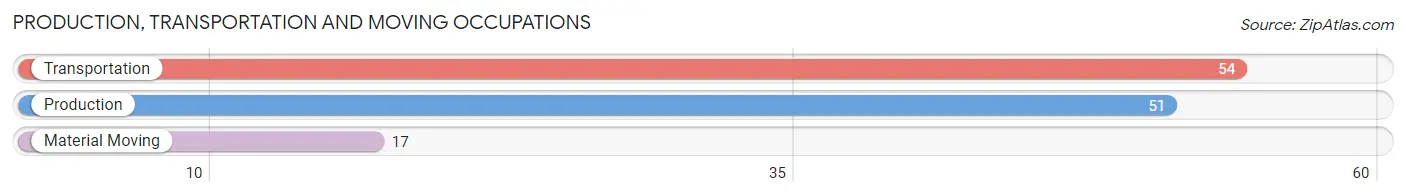
Production, Transportation and Moving Occupations
The most common Production, Transportation and Moving occupations in Catawba are Transportation (54 | 19.9%), Production (51 | 18.8%), and Material Moving (17 | 6.2%).
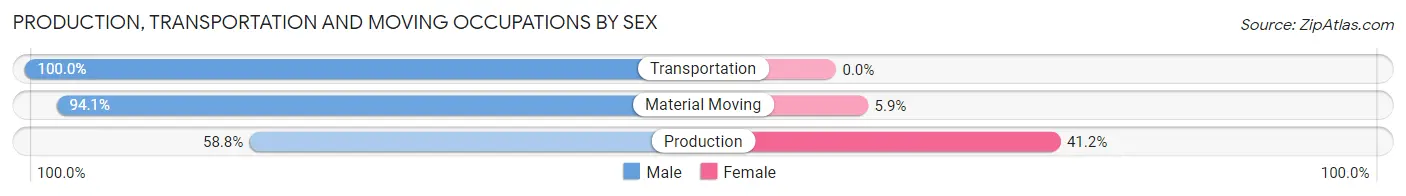
Production, Transportation and Moving Occupations by Sex
| Occupation | Male | Female |
| Production | 30 (58.8%) | 21 (41.2%) |
| Transportation | 54 (100.0%) | 0 (0.0%) |
| Material Moving | 16 (94.1%) | 1 (5.9%) |
| Total (Category) | 100 (82.0%) | 22 (18.0%) |
| Total (Overall) | 168 (61.8%) | 104 (38.2%) |
Employment Industries by Sex in Catawba
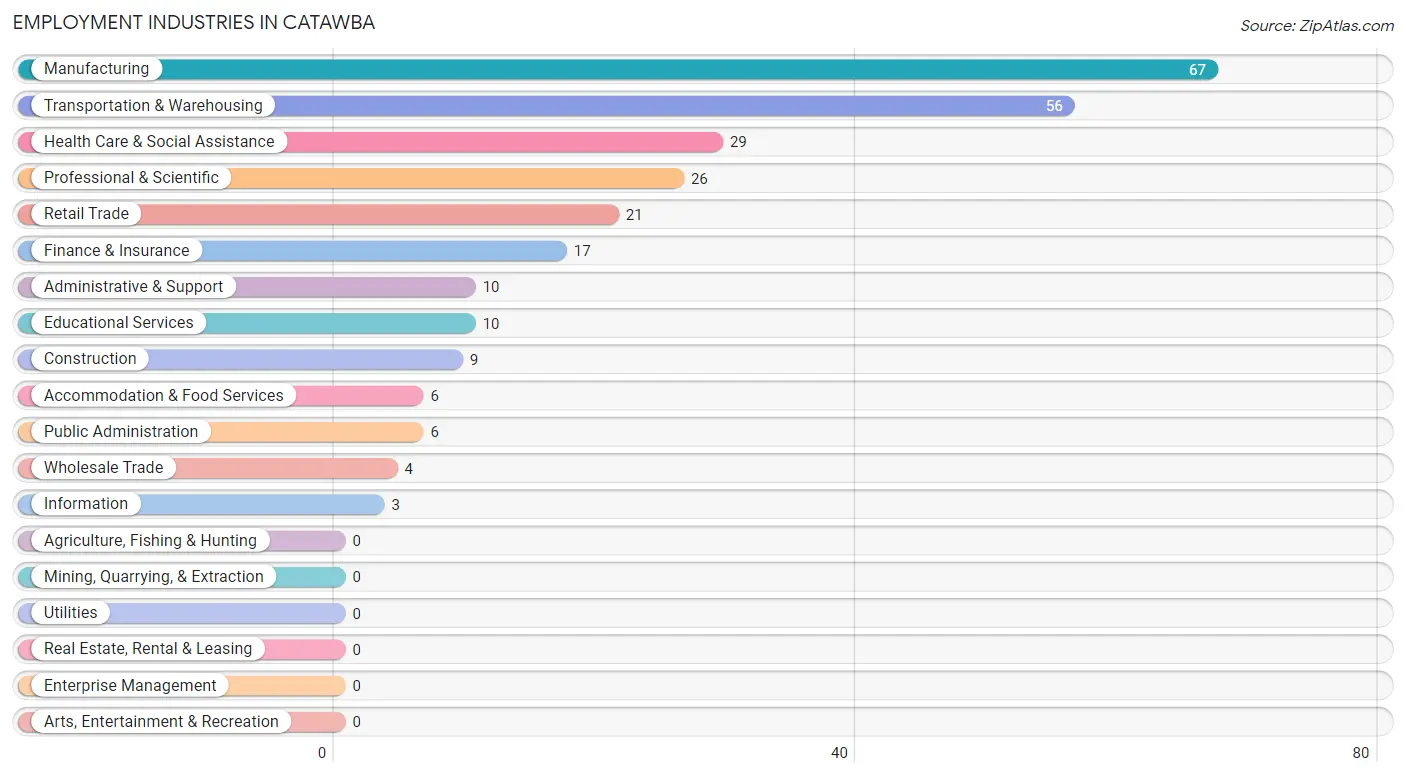
Employment Industries in Catawba
The major employment industries in Catawba include Manufacturing (67 | 24.6%), Transportation & Warehousing (56 | 20.6%), Health Care & Social Assistance (29 | 10.7%), Professional & Scientific (26 | 9.6%), and Retail Trade (21 | 7.7%).
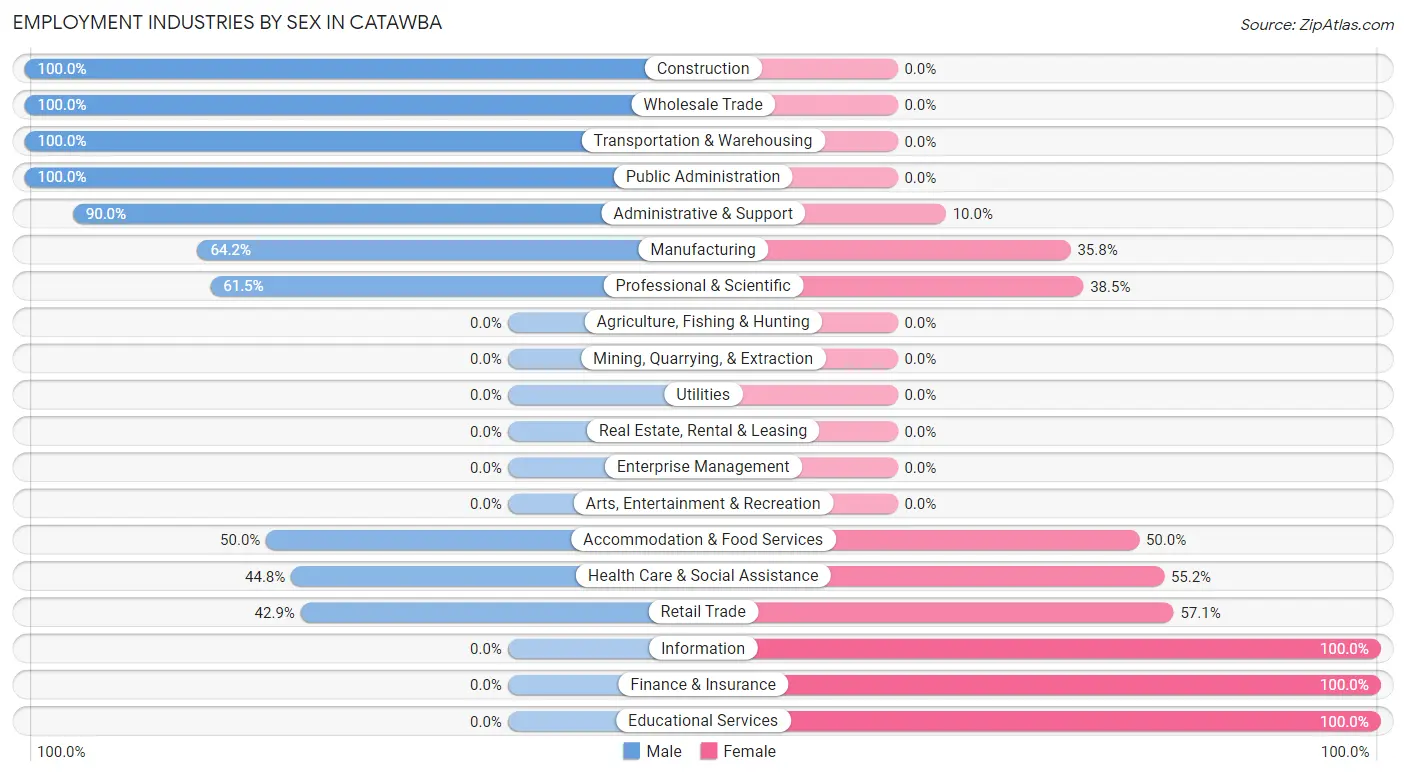
Employment Industries by Sex in Catawba
The Catawba industries that see more men than women are Construction (100.0%), Wholesale Trade (100.0%), and Transportation & Warehousing (100.0%), whereas the industries that tend to have a higher number of women are Information (100.0%), Finance & Insurance (100.0%), and Educational Services (100.0%).
| Industry | Male | Female |
| Agriculture, Fishing & Hunting | 0 (0.0%) | 0 (0.0%) |
| Mining, Quarrying, & Extraction | 0 (0.0%) | 0 (0.0%) |
| Construction | 9 (100.0%) | 0 (0.0%) |
| Manufacturing | 43 (64.2%) | 24 (35.8%) |
| Wholesale Trade | 4 (100.0%) | 0 (0.0%) |
| Retail Trade | 9 (42.9%) | 12 (57.1%) |
| Transportation & Warehousing | 56 (100.0%) | 0 (0.0%) |
| Utilities | 0 (0.0%) | 0 (0.0%) |
| Information | 0 (0.0%) | 3 (100.0%) |
| Finance & Insurance | 0 (0.0%) | 17 (100.0%) |
| Real Estate, Rental & Leasing | 0 (0.0%) | 0 (0.0%) |
| Professional & Scientific | 16 (61.5%) | 10 (38.5%) |
| Enterprise Management | 0 (0.0%) | 0 (0.0%) |
| Administrative & Support | 9 (90.0%) | 1 (10.0%) |
| Educational Services | 0 (0.0%) | 10 (100.0%) |
| Health Care & Social Assistance | 13 (44.8%) | 16 (55.2%) |
| Arts, Entertainment & Recreation | 0 (0.0%) | 0 (0.0%) |
| Accommodation & Food Services | 3 (50.0%) | 3 (50.0%) |
| Public Administration | 6 (100.0%) | 0 (0.0%) |
| Total | 168 (61.8%) | 104 (38.2%) |
Education in Catawba
School Enrollment in Catawba
The most common levels of schooling among the 104 students in Catawba are middle school (30 | 28.8%), college / undergraduate (28 | 26.9%), and elementary school (18 | 17.3%).
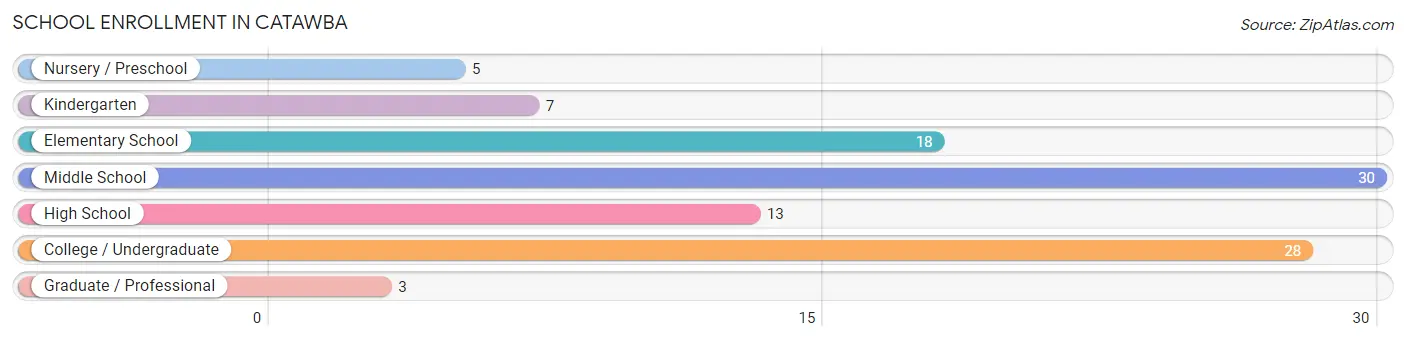
| School Level | # Students | % Students |
| Nursery / Preschool | 5 | 4.8% |
| Kindergarten | 7 | 6.7% |
| Elementary School | 18 | 17.3% |
| Middle School | 30 | 28.8% |
| High School | 13 | 12.5% |
| College / Undergraduate | 28 | 26.9% |
| Graduate / Professional | 3 | 2.9% |
| Total | 104 | 100.0% |
School Enrollment by Age by Funding Source in Catawba
Out of a total of 104 students who are enrolled in schools in Catawba, 26 (25.0%) attend a private institution, while the remaining 78 (75.0%) are enrolled in public schools. The age group of 35 years and over has the highest likelihood of being enrolled in private schools, with 15 (100.0% in the age bracket) enrolled. Conversely, the age group of 10 to 14 year olds has the lowest likelihood of being enrolled in a private school, with 39 (100.0% in the age bracket) attending a public institution.
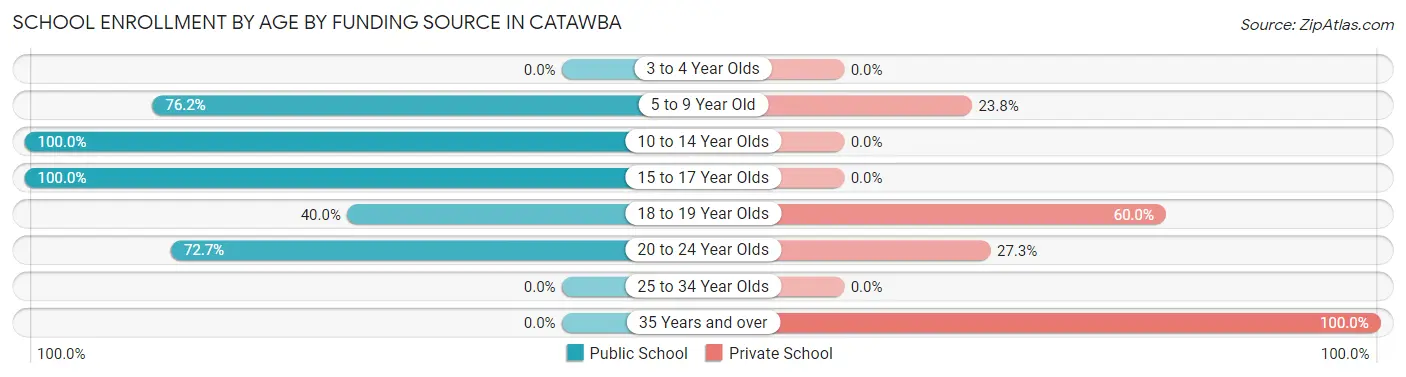
| Age Bracket | Public School | Private School |
| 3 to 4 Year Olds | 0 (0.0%) | 0 (0.0%) |
| 5 to 9 Year Old | 16 (76.2%) | 5 (23.8%) |
| 10 to 14 Year Olds | 39 (100.0%) | 0 (0.0%) |
| 15 to 17 Year Olds | 13 (100.0%) | 0 (0.0%) |
| 18 to 19 Year Olds | 2 (40.0%) | 3 (60.0%) |
| 20 to 24 Year Olds | 8 (72.7%) | 3 (27.3%) |
| 25 to 34 Year Olds | 0 (0.0%) | 0 (0.0%) |
| 35 Years and over | 0 (0.0%) | 15 (100.0%) |
| Total | 78 (75.0%) | 26 (25.0%) |
Educational Attainment by Field of Study in Catawba
Business (9 | 50.0%), social sciences (3 | 16.7%), literature & languages (3 | 16.7%), education (2 | 11.1%), and arts & humanities (1 | 5.6%) are the most common fields of study among 18 individuals in Catawba who have obtained a bachelor's degree or higher.
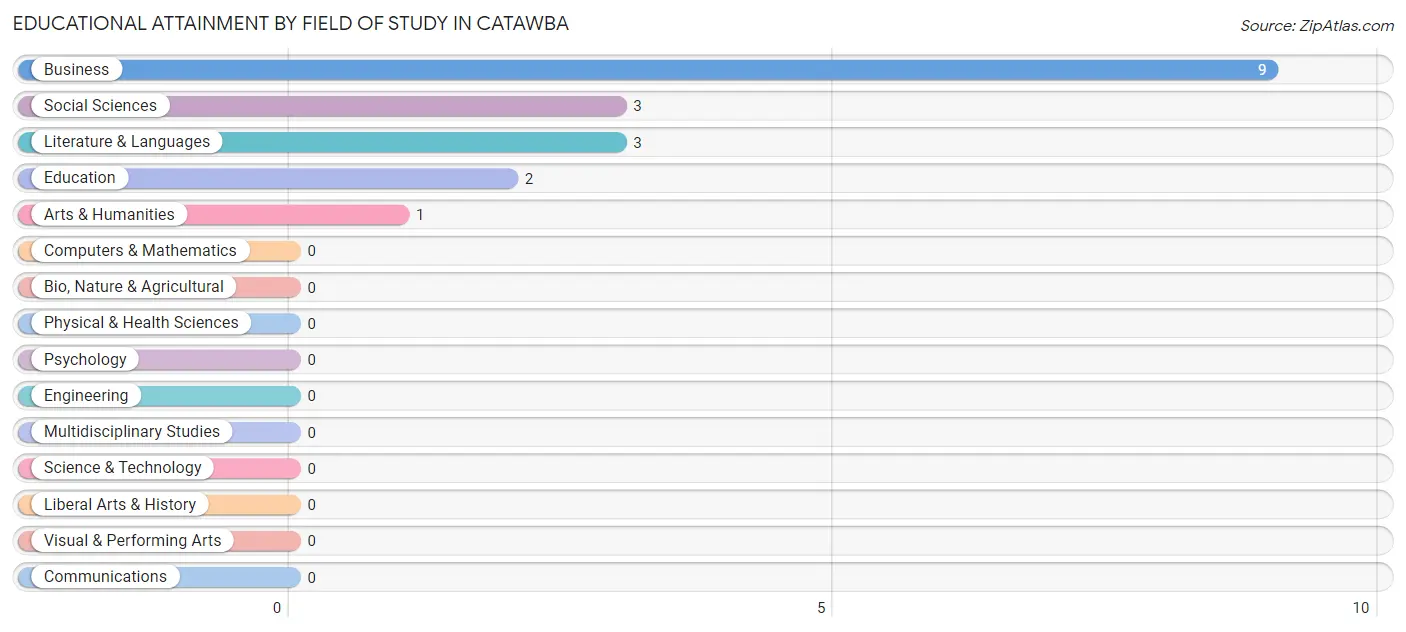
| Field of Study | # Graduates | % Graduates |
| Computers & Mathematics | 0 | 0.0% |
| Bio, Nature & Agricultural | 0 | 0.0% |
| Physical & Health Sciences | 0 | 0.0% |
| Psychology | 0 | 0.0% |
| Social Sciences | 3 | 16.7% |
| Engineering | 0 | 0.0% |
| Multidisciplinary Studies | 0 | 0.0% |
| Science & Technology | 0 | 0.0% |
| Business | 9 | 50.0% |
| Education | 2 | 11.1% |
| Literature & Languages | 3 | 16.7% |
| Liberal Arts & History | 0 | 0.0% |
| Visual & Performing Arts | 0 | 0.0% |
| Communications | 0 | 0.0% |
| Arts & Humanities | 1 | 5.6% |
| Total | 18 | 100.0% |
Transportation & Commute in Catawba
Vehicle Availability by Sex in Catawba
The most prevalent vehicle ownership categories in Catawba are males with 2 vehicles (61, accounting for 36.3%) and females with 2 vehicles (31, making up 61.0%).
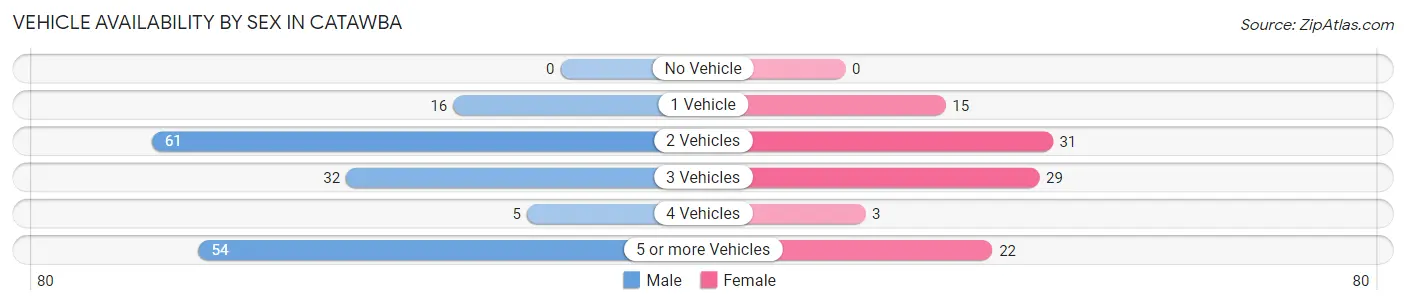
| Vehicles Available | Male | Female |
| No Vehicle | 0 (0.0%) | 0 (0.0%) |
| 1 Vehicle | 16 (9.5%) | 15 (15.0%) |
| 2 Vehicles | 61 (36.3%) | 31 (31.0%) |
| 3 Vehicles | 32 (19.1%) | 29 (29.0%) |
| 4 Vehicles | 5 (3.0%) | 3 (3.0%) |
| 5 or more Vehicles | 54 (32.1%) | 22 (22.0%) |
| Total | 168 (100.0%) | 100 (100.0%) |
Commute Time in Catawba
The most frequently occuring commute durations in Catawba are 20 to 24 minutes (62 commuters, 24.2%), 35 to 39 minutes (51 commuters, 19.9%), and 15 to 19 minutes (31 commuters, 12.1%).
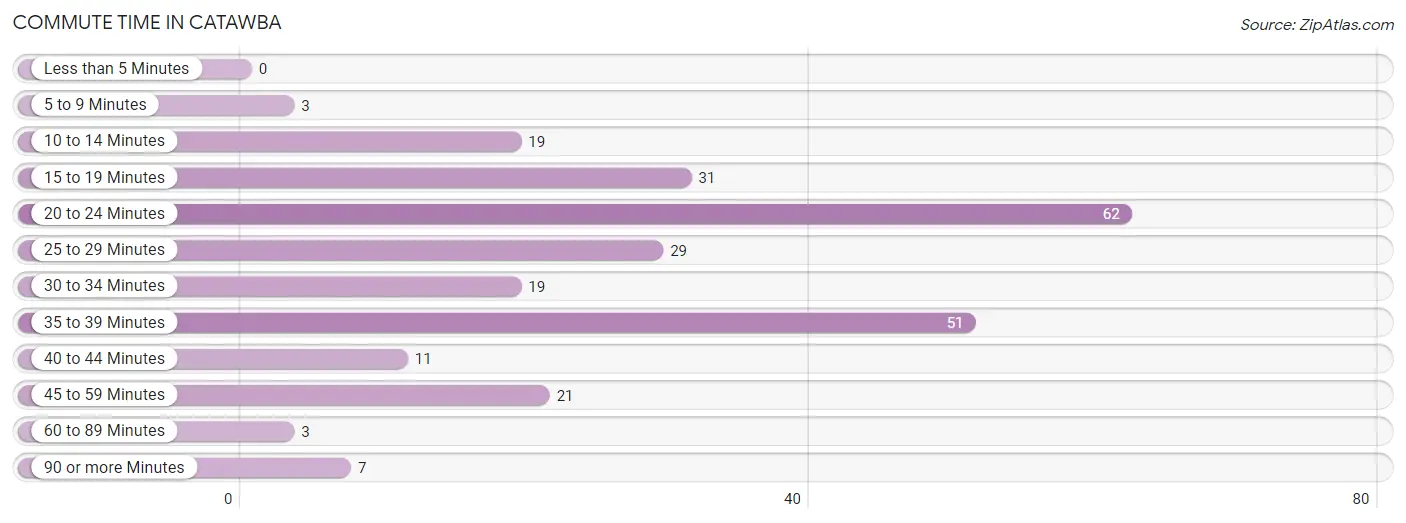
| Commute Time | # Commuters | % Commuters |
| Less than 5 Minutes | 0 | 0.0% |
| 5 to 9 Minutes | 3 | 1.2% |
| 10 to 14 Minutes | 19 | 7.4% |
| 15 to 19 Minutes | 31 | 12.1% |
| 20 to 24 Minutes | 62 | 24.2% |
| 25 to 29 Minutes | 29 | 11.3% |
| 30 to 34 Minutes | 19 | 7.4% |
| 35 to 39 Minutes | 51 | 19.9% |
| 40 to 44 Minutes | 11 | 4.3% |
| 45 to 59 Minutes | 21 | 8.2% |
| 60 to 89 Minutes | 3 | 1.2% |
| 90 or more Minutes | 7 | 2.7% |
Commute Time by Sex in Catawba
The most common commute times in Catawba are 35 to 39 minutes (48 commuters, 28.6%) for males and 20 to 24 minutes (39 commuters, 44.3%) for females.
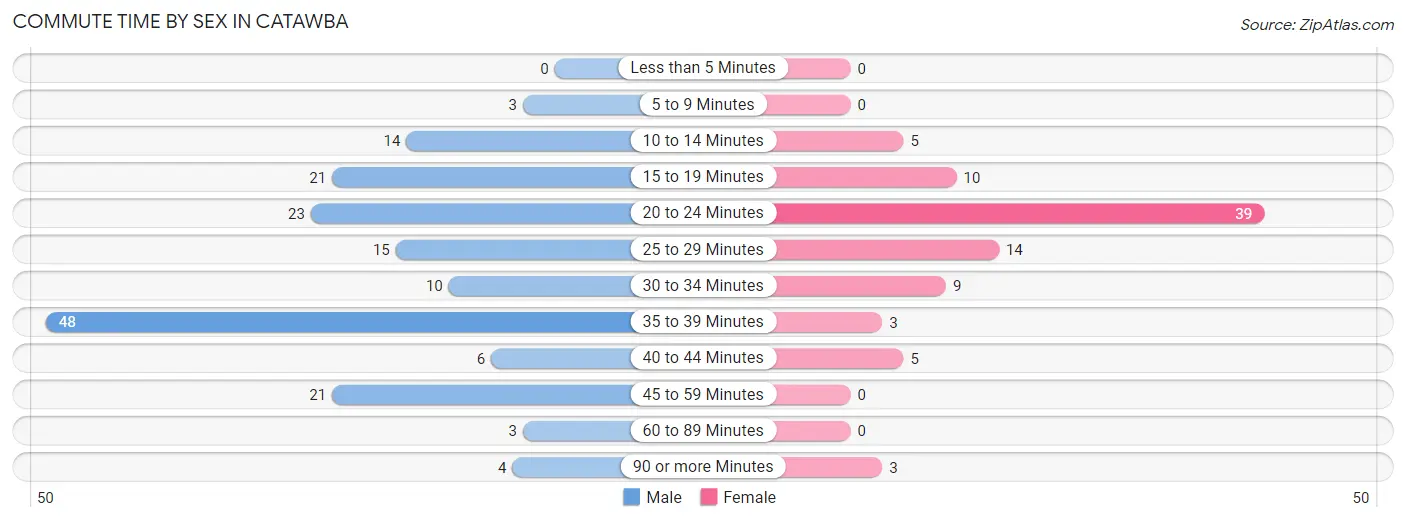
| Commute Time | Male | Female |
| Less than 5 Minutes | 0 (0.0%) | 0 (0.0%) |
| 5 to 9 Minutes | 3 (1.8%) | 0 (0.0%) |
| 10 to 14 Minutes | 14 (8.3%) | 5 (5.7%) |
| 15 to 19 Minutes | 21 (12.5%) | 10 (11.4%) |
| 20 to 24 Minutes | 23 (13.7%) | 39 (44.3%) |
| 25 to 29 Minutes | 15 (8.9%) | 14 (15.9%) |
| 30 to 34 Minutes | 10 (5.9%) | 9 (10.2%) |
| 35 to 39 Minutes | 48 (28.6%) | 3 (3.4%) |
| 40 to 44 Minutes | 6 (3.6%) | 5 (5.7%) |
| 45 to 59 Minutes | 21 (12.5%) | 0 (0.0%) |
| 60 to 89 Minutes | 3 (1.8%) | 0 (0.0%) |
| 90 or more Minutes | 4 (2.4%) | 3 (3.4%) |
Time of Departure to Work by Sex in Catawba
The most frequent times of departure to work in Catawba are 7:00 AM to 7:29 AM (45, 26.8%) for males and 7:00 AM to 7:29 AM (24, 27.3%) for females.
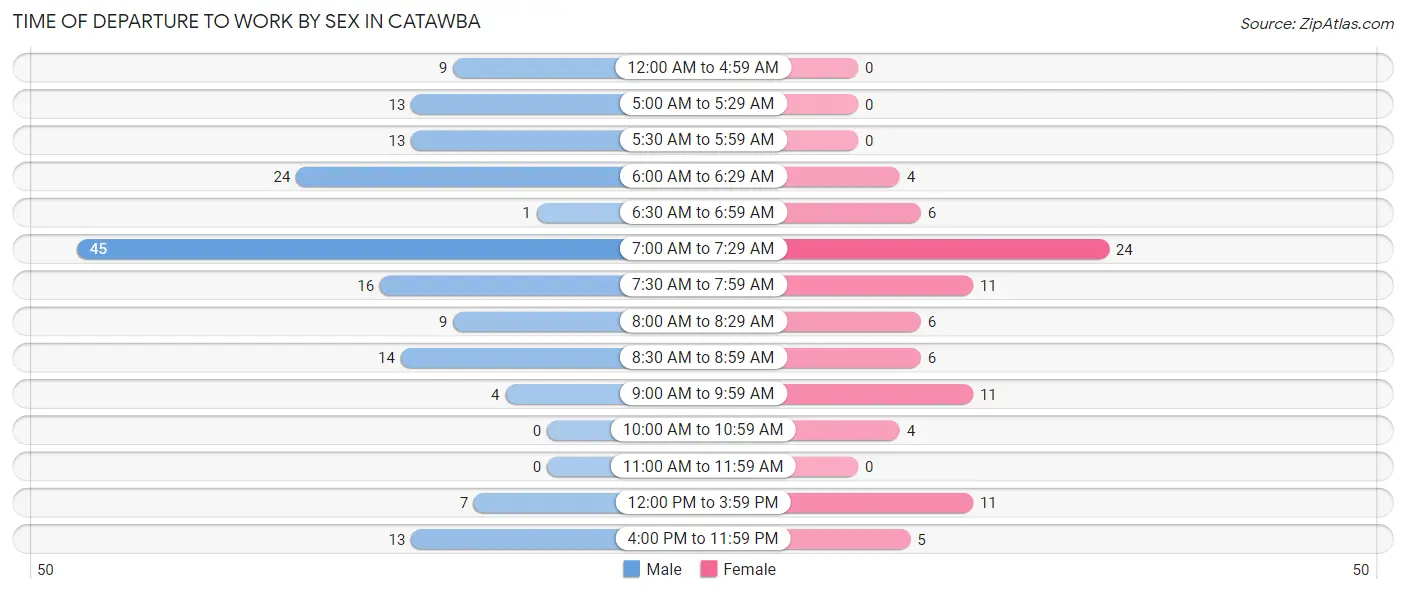
| Time of Departure | Male | Female |
| 12:00 AM to 4:59 AM | 9 (5.4%) | 0 (0.0%) |
| 5:00 AM to 5:29 AM | 13 (7.7%) | 0 (0.0%) |
| 5:30 AM to 5:59 AM | 13 (7.7%) | 0 (0.0%) |
| 6:00 AM to 6:29 AM | 24 (14.3%) | 4 (4.5%) |
| 6:30 AM to 6:59 AM | 1 (0.6%) | 6 (6.8%) |
| 7:00 AM to 7:29 AM | 45 (26.8%) | 24 (27.3%) |
| 7:30 AM to 7:59 AM | 16 (9.5%) | 11 (12.5%) |
| 8:00 AM to 8:29 AM | 9 (5.4%) | 6 (6.8%) |
| 8:30 AM to 8:59 AM | 14 (8.3%) | 6 (6.8%) |
| 9:00 AM to 9:59 AM | 4 (2.4%) | 11 (12.5%) |
| 10:00 AM to 10:59 AM | 0 (0.0%) | 4 (4.5%) |
| 11:00 AM to 11:59 AM | 0 (0.0%) | 0 (0.0%) |
| 12:00 PM to 3:59 PM | 7 (4.2%) | 11 (12.5%) |
| 4:00 PM to 11:59 PM | 13 (7.7%) | 5 (5.7%) |
| Total | 168 (100.0%) | 88 (100.0%) |
Housing Occupancy in Catawba
Occupancy by Ownership in Catawba
Of the total 322 dwellings in Catawba, owner-occupied units account for 226 (70.2%), while renter-occupied units make up 96 (29.8%).
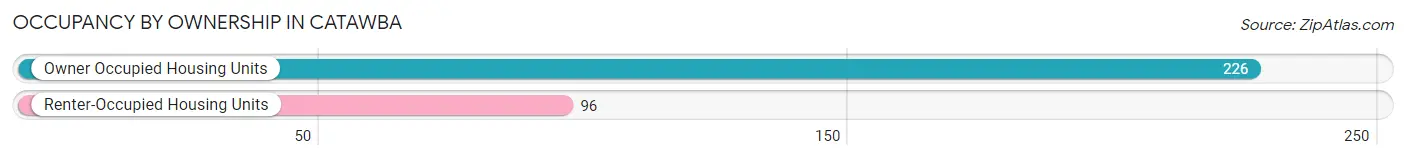
| Occupancy | # Housing Units | % Housing Units |
| Owner Occupied Housing Units | 226 | 70.2% |
| Renter-Occupied Housing Units | 96 | 29.8% |
| Total Occupied Housing Units | 322 | 100.0% |
Occupancy by Household Size in Catawba
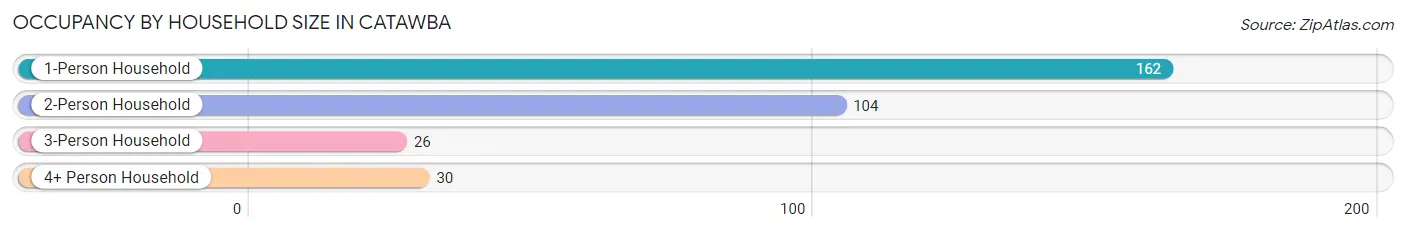
| Household Size | # Housing Units | % Housing Units |
| 1-Person Household | 162 | 50.3% |
| 2-Person Household | 104 | 32.3% |
| 3-Person Household | 26 | 8.1% |
| 4+ Person Household | 30 | 9.3% |
| Total Housing Units | 322 | 100.0% |
Occupancy by Ownership by Household Size in Catawba
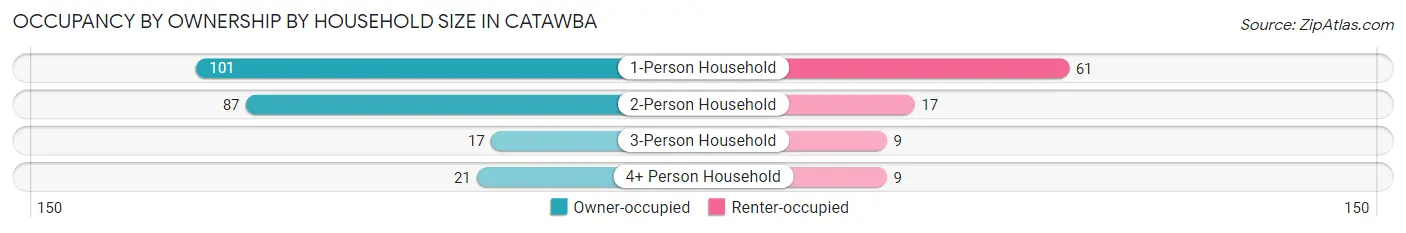
| Household Size | Owner-occupied | Renter-occupied |
| 1-Person Household | 101 (62.4%) | 61 (37.7%) |
| 2-Person Household | 87 (83.7%) | 17 (16.4%) |
| 3-Person Household | 17 (65.4%) | 9 (34.6%) |
| 4+ Person Household | 21 (70.0%) | 9 (30.0%) |
| Total Housing Units | 226 (70.2%) | 96 (29.8%) |
Occupancy by Educational Attainment in Catawba
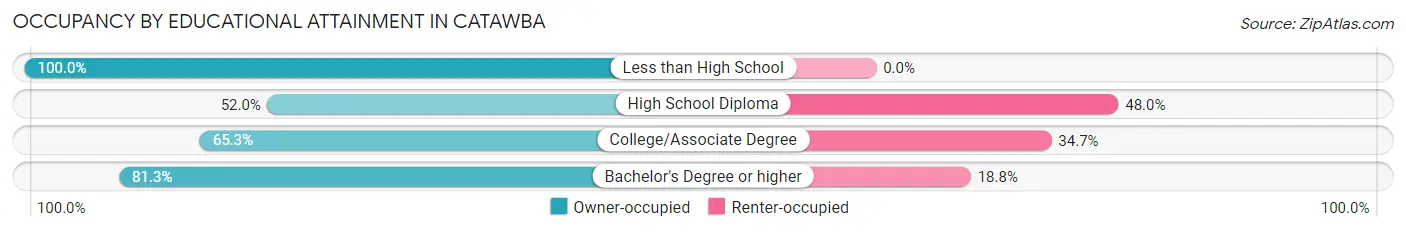
| Household Size | Owner-occupied | Renter-occupied |
| Less than High School | 86 (100.0%) | 0 (0.0%) |
| High School Diploma | 65 (52.0%) | 60 (48.0%) |
| College/Associate Degree | 62 (65.3%) | 33 (34.7%) |
| Bachelor's Degree or higher | 13 (81.2%) | 3 (18.8%) |
Occupancy by Age of Householder in Catawba
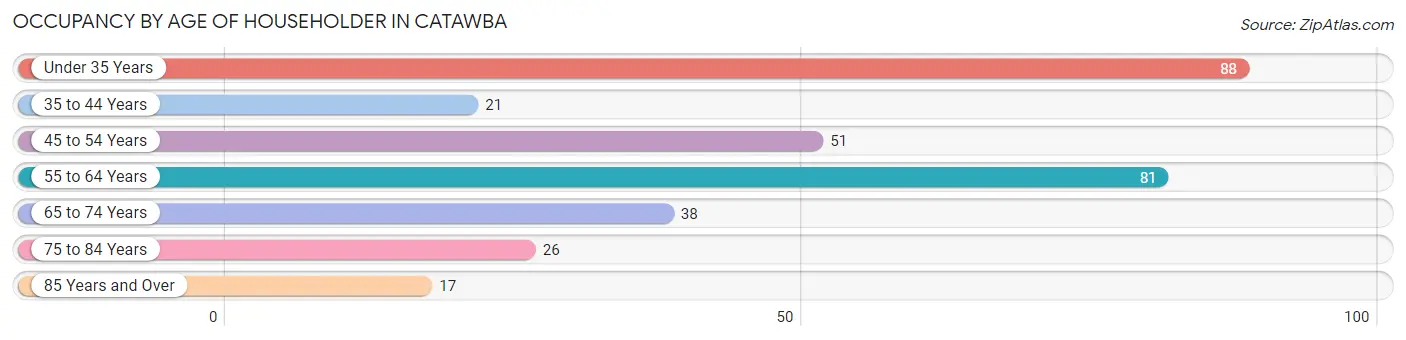
| Age Bracket | # Households | % Households |
| Under 35 Years | 88 | 27.3% |
| 35 to 44 Years | 21 | 6.5% |
| 45 to 54 Years | 51 | 15.8% |
| 55 to 64 Years | 81 | 25.2% |
| 65 to 74 Years | 38 | 11.8% |
| 75 to 84 Years | 26 | 8.1% |
| 85 Years and Over | 17 | 5.3% |
| Total | 322 | 100.0% |
Housing Finances in Catawba
Median Income by Occupancy in Catawba
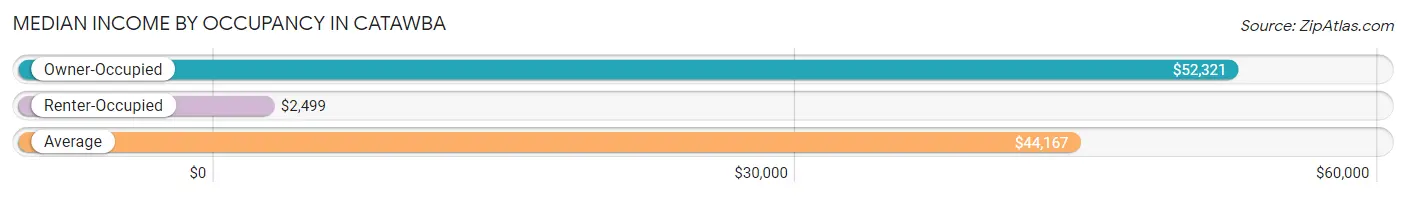
| Occupancy Type | # Households | Median Income |
| Owner-Occupied | 226 (70.2%) | $52,321 |
| Renter-Occupied | 96 (29.8%) | $2,499 |
| Average | 322 (100.0%) | $44,167 |
Occupancy by Householder Income Bracket in Catawba
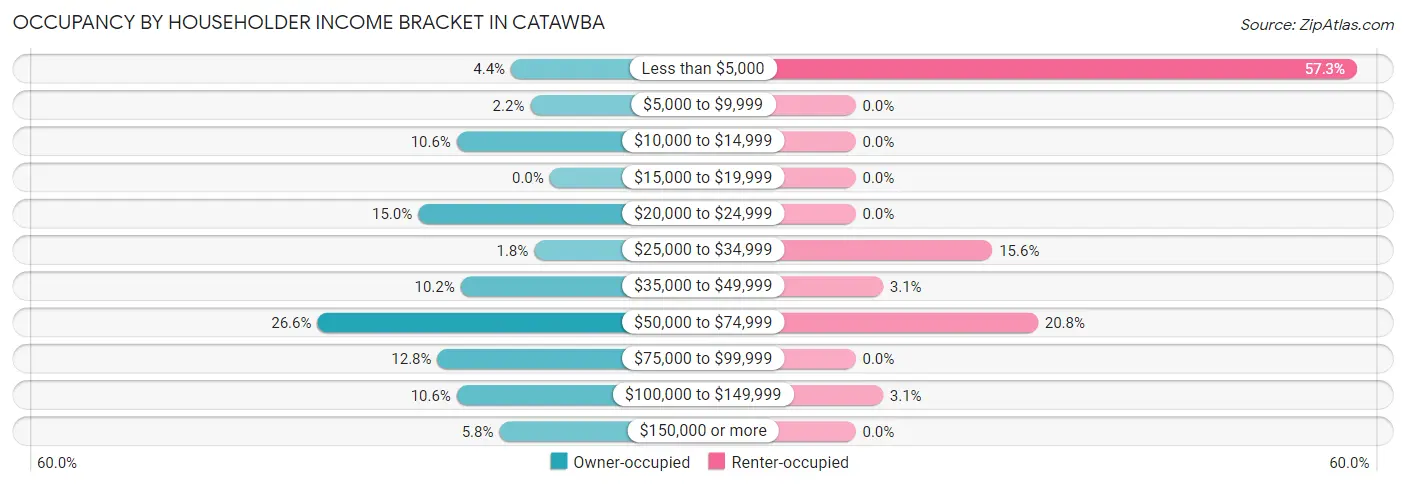
| Income Bracket | Owner-occupied | Renter-occupied |
| Less than $5,000 | 10 (4.4%) | 55 (57.3%) |
| $5,000 to $9,999 | 5 (2.2%) | 0 (0.0%) |
| $10,000 to $14,999 | 24 (10.6%) | 0 (0.0%) |
| $15,000 to $19,999 | 0 (0.0%) | 0 (0.0%) |
| $20,000 to $24,999 | 34 (15.0%) | 0 (0.0%) |
| $25,000 to $34,999 | 4 (1.8%) | 15 (15.6%) |
| $35,000 to $49,999 | 23 (10.2%) | 3 (3.1%) |
| $50,000 to $74,999 | 60 (26.6%) | 20 (20.8%) |
| $75,000 to $99,999 | 29 (12.8%) | 0 (0.0%) |
| $100,000 to $149,999 | 24 (10.6%) | 3 (3.1%) |
| $150,000 or more | 13 (5.8%) | 0 (0.0%) |
| Total | 226 (100.0%) | 96 (100.0%) |
Monthly Housing Cost Tiers in Catawba
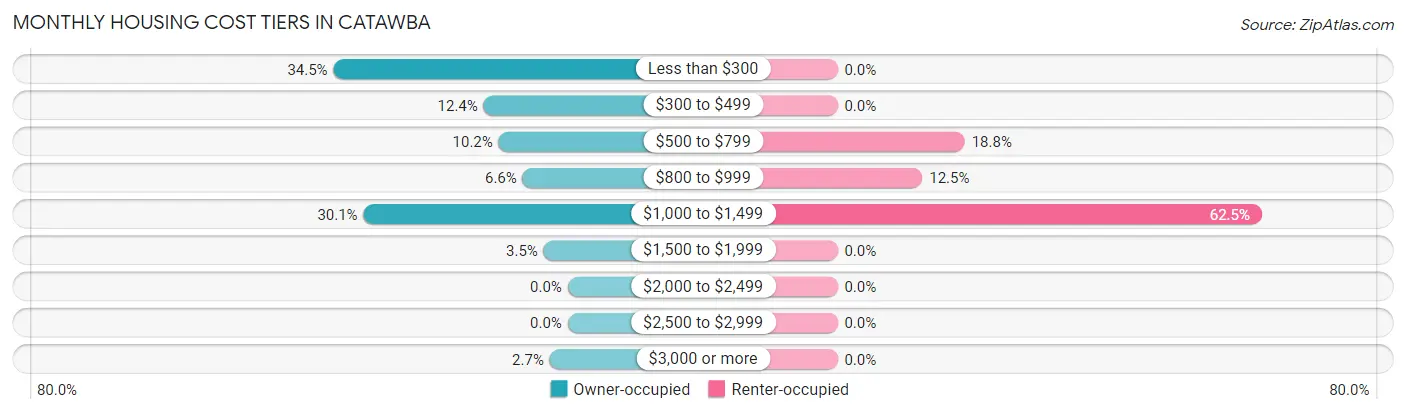
| Monthly Cost | Owner-occupied | Renter-occupied |
| Less than $300 | 78 (34.5%) | 0 (0.0%) |
| $300 to $499 | 28 (12.4%) | 0 (0.0%) |
| $500 to $799 | 23 (10.2%) | 18 (18.8%) |
| $800 to $999 | 15 (6.6%) | 12 (12.5%) |
| $1,000 to $1,499 | 68 (30.1%) | 60 (62.5%) |
| $1,500 to $1,999 | 8 (3.5%) | 0 (0.0%) |
| $2,000 to $2,499 | 0 (0.0%) | 0 (0.0%) |
| $2,500 to $2,999 | 0 (0.0%) | 0 (0.0%) |
| $3,000 or more | 6 (2.6%) | 0 (0.0%) |
| Total | 226 (100.0%) | 96 (100.0%) |
Physical Housing Characteristics in Catawba
Housing Structures in Catawba
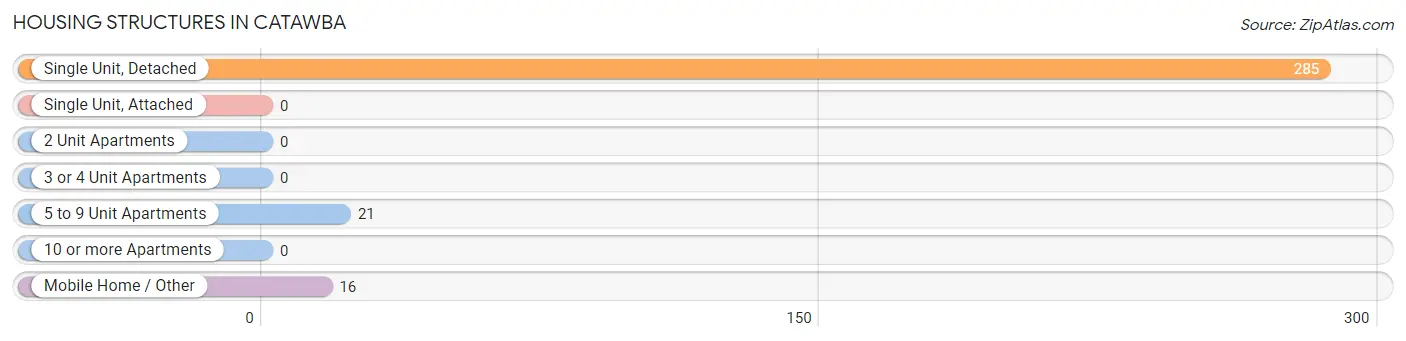
| Structure Type | # Housing Units | % Housing Units |
| Single Unit, Detached | 285 | 88.5% |
| Single Unit, Attached | 0 | 0.0% |
| 2 Unit Apartments | 0 | 0.0% |
| 3 or 4 Unit Apartments | 0 | 0.0% |
| 5 to 9 Unit Apartments | 21 | 6.5% |
| 10 or more Apartments | 0 | 0.0% |
| Mobile Home / Other | 16 | 5.0% |
| Total | 322 | 100.0% |
Housing Structures by Occupancy in Catawba
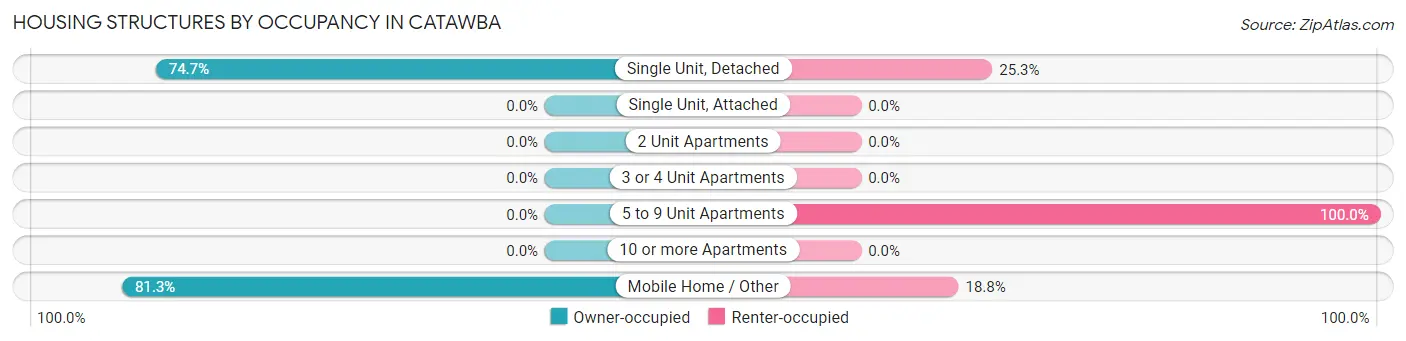
| Structure Type | Owner-occupied | Renter-occupied |
| Single Unit, Detached | 213 (74.7%) | 72 (25.3%) |
| Single Unit, Attached | 0 (0.0%) | 0 (0.0%) |
| 2 Unit Apartments | 0 (0.0%) | 0 (0.0%) |
| 3 or 4 Unit Apartments | 0 (0.0%) | 0 (0.0%) |
| 5 to 9 Unit Apartments | 0 (0.0%) | 21 (100.0%) |
| 10 or more Apartments | 0 (0.0%) | 0 (0.0%) |
| Mobile Home / Other | 13 (81.2%) | 3 (18.8%) |
| Total | 226 (70.2%) | 96 (29.8%) |
Housing Structures by Number of Rooms in Catawba
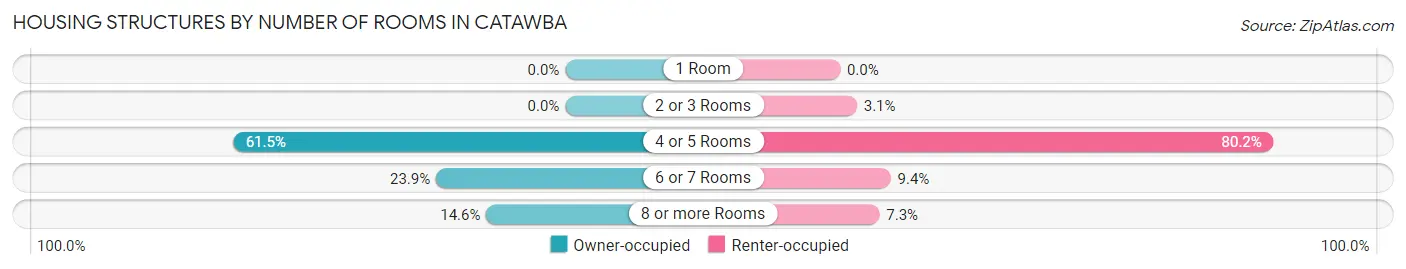
| Number of Rooms | Owner-occupied | Renter-occupied |
| 1 Room | 0 (0.0%) | 0 (0.0%) |
| 2 or 3 Rooms | 0 (0.0%) | 3 (3.1%) |
| 4 or 5 Rooms | 139 (61.5%) | 77 (80.2%) |
| 6 or 7 Rooms | 54 (23.9%) | 9 (9.4%) |
| 8 or more Rooms | 33 (14.6%) | 7 (7.3%) |
| Total | 226 (100.0%) | 96 (100.0%) |
Housing Structure by Heating Type in Catawba
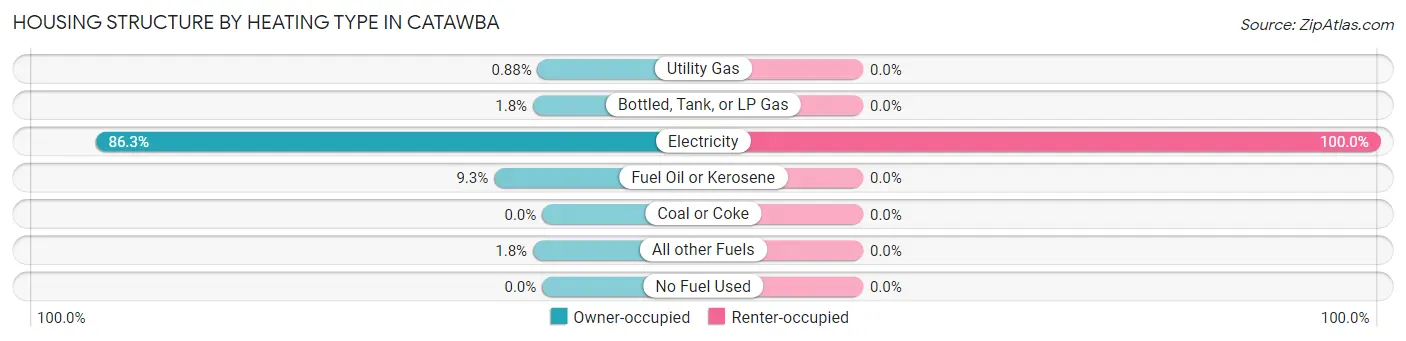
| Heating Type | Owner-occupied | Renter-occupied |
| Utility Gas | 2 (0.9%) | 0 (0.0%) |
| Bottled, Tank, or LP Gas | 4 (1.8%) | 0 (0.0%) |
| Electricity | 195 (86.3%) | 96 (100.0%) |
| Fuel Oil or Kerosene | 21 (9.3%) | 0 (0.0%) |
| Coal or Coke | 0 (0.0%) | 0 (0.0%) |
| All other Fuels | 4 (1.8%) | 0 (0.0%) |
| No Fuel Used | 0 (0.0%) | 0 (0.0%) |
| Total | 226 (100.0%) | 96 (100.0%) |
Household Vehicle Usage in Catawba
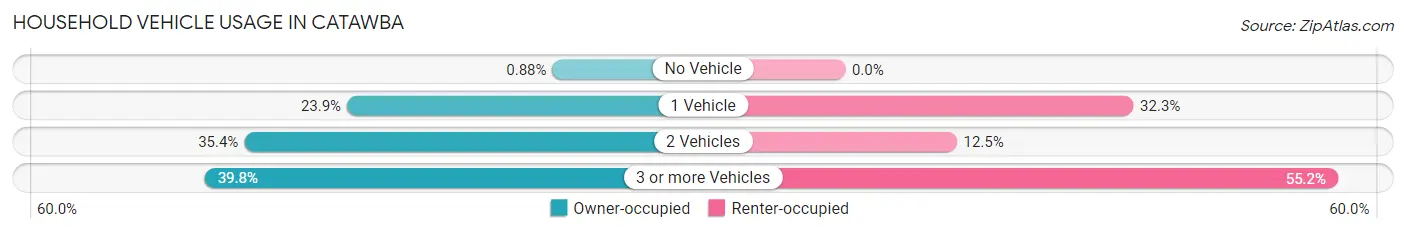
| Vehicles per Household | Owner-occupied | Renter-occupied |
| No Vehicle | 2 (0.9%) | 0 (0.0%) |
| 1 Vehicle | 54 (23.9%) | 31 (32.3%) |
| 2 Vehicles | 80 (35.4%) | 12 (12.5%) |
| 3 or more Vehicles | 90 (39.8%) | 53 (55.2%) |
| Total | 226 (100.0%) | 96 (100.0%) |
Real Estate & Mortgages in Catawba
Real Estate and Mortgage Overview in Catawba
| Characteristic | Without Mortgage | With Mortgage |
| Housing Units | 109 | 117 |
| Median Property Value | $93,700 | $146,200 |
| Median Household Income | - | - |
| Monthly Housing Costs | $278 | $6 |
| Real Estate Taxes | $772 | $1 |
Property Value by Mortgage Status in Catawba
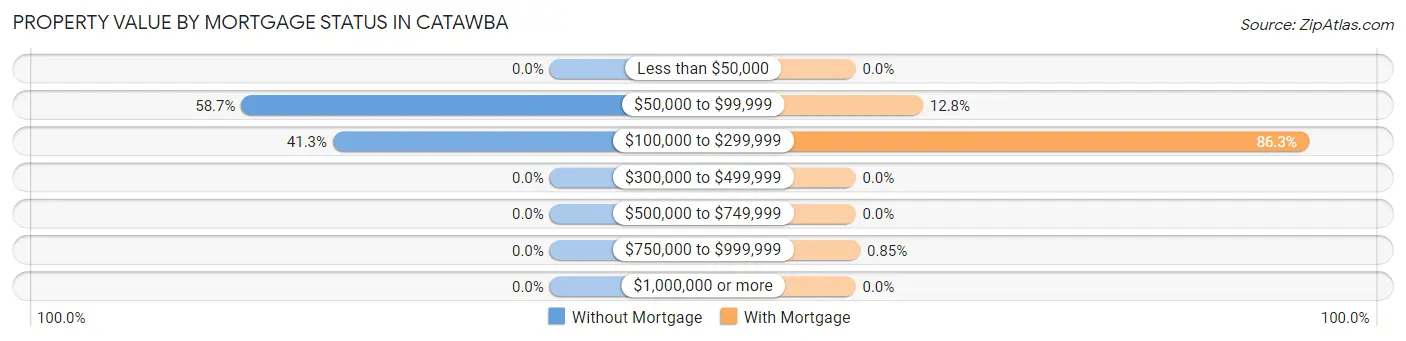
| Property Value | Without Mortgage | With Mortgage |
| Less than $50,000 | 0 (0.0%) | 0 (0.0%) |
| $50,000 to $99,999 | 64 (58.7%) | 15 (12.8%) |
| $100,000 to $299,999 | 45 (41.3%) | 101 (86.3%) |
| $300,000 to $499,999 | 0 (0.0%) | 0 (0.0%) |
| $500,000 to $749,999 | 0 (0.0%) | 0 (0.0%) |
| $750,000 to $999,999 | 0 (0.0%) | 1 (0.9%) |
| $1,000,000 or more | 0 (0.0%) | 0 (0.0%) |
| Total | 109 (100.0%) | 117 (100.0%) |
Household Income by Mortgage Status in Catawba
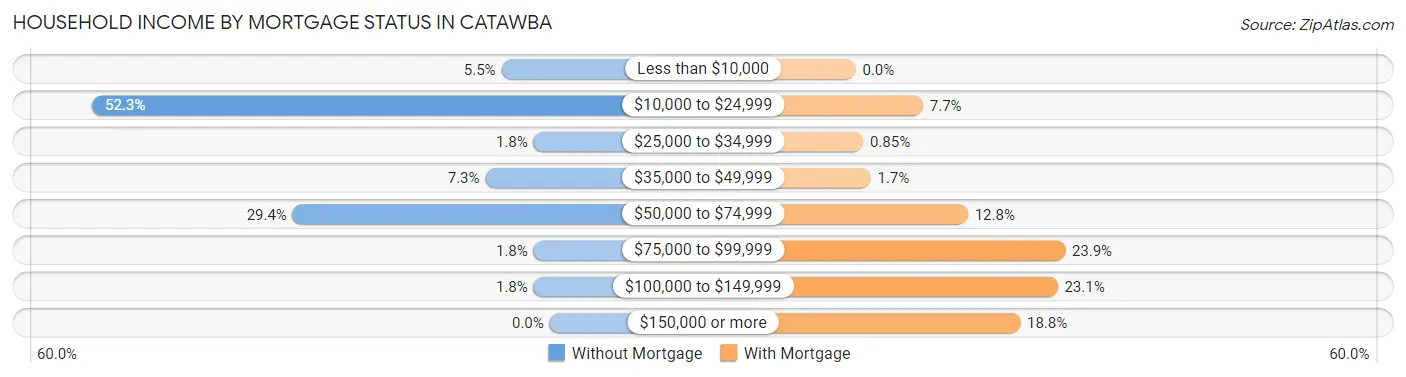
| Household Income | Without Mortgage | With Mortgage |
| Less than $10,000 | 6 (5.5%) | 0 (0.0%) |
| $10,000 to $24,999 | 57 (52.3%) | 9 (7.7%) |
| $25,000 to $34,999 | 2 (1.8%) | 1 (0.9%) |
| $35,000 to $49,999 | 8 (7.3%) | 2 (1.7%) |
| $50,000 to $74,999 | 32 (29.4%) | 15 (12.8%) |
| $75,000 to $99,999 | 2 (1.8%) | 28 (23.9%) |
| $100,000 to $149,999 | 2 (1.8%) | 27 (23.1%) |
| $150,000 or more | 0 (0.0%) | 22 (18.8%) |
| Total | 109 (100.0%) | 117 (100.0%) |
Property Value to Household Income Ratio in Catawba
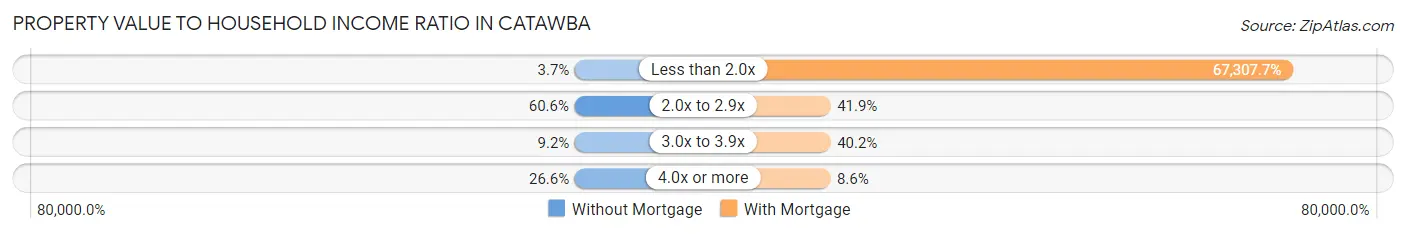
| Value-to-Income Ratio | Without Mortgage | With Mortgage |
| Less than 2.0x | 4 (3.7%) | 78,750 (67,307.7%) |
| 2.0x to 2.9x | 66 (60.6%) | 49 (41.9%) |
| 3.0x to 3.9x | 10 (9.2%) | 47 (40.2%) |
| 4.0x or more | 29 (26.6%) | 10 (8.6%) |
| Total | 109 (100.0%) | 117 (100.0%) |
Real Estate Taxes by Mortgage Status in Catawba
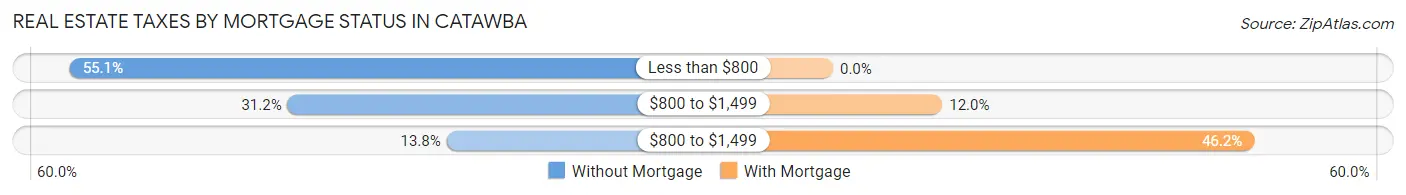
| Property Taxes | Without Mortgage | With Mortgage |
| Less than $800 | 60 (55.0%) | 0 (0.0%) |
| $800 to $1,499 | 34 (31.2%) | 14 (12.0%) |
| $800 to $1,499 | 15 (13.8%) | 54 (46.2%) |
| Total | 109 (100.0%) | 117 (100.0%) |
Health & Disability in Catawba
Health Insurance Coverage by Age in Catawba
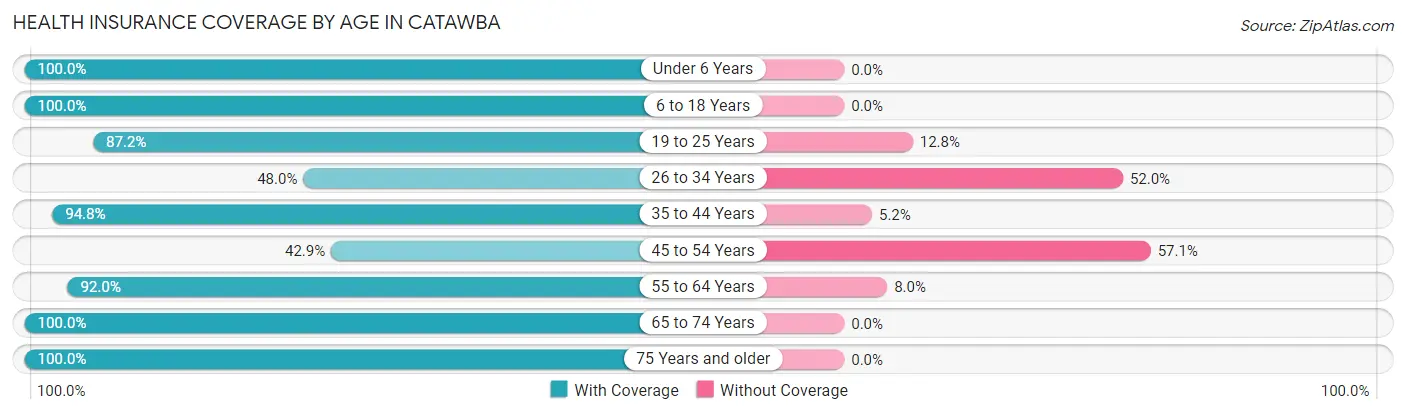
| Age Bracket | With Coverage | Without Coverage |
| Under 6 Years | 26 (100.0%) | 0 (0.0%) |
| 6 to 18 Years | 69 (100.0%) | 0 (0.0%) |
| 19 to 25 Years | 41 (87.2%) | 6 (12.8%) |
| 26 to 34 Years | 49 (48.0%) | 53 (52.0%) |
| 35 to 44 Years | 55 (94.8%) | 3 (5.2%) |
| 45 to 54 Years | 27 (42.9%) | 36 (57.1%) |
| 55 to 64 Years | 138 (92.0%) | 12 (8.0%) |
| 65 to 74 Years | 54 (100.0%) | 0 (0.0%) |
| 75 Years and older | 61 (100.0%) | 0 (0.0%) |
| Total | 520 (82.5%) | 110 (17.5%) |
Health Insurance Coverage by Citizenship Status in Catawba
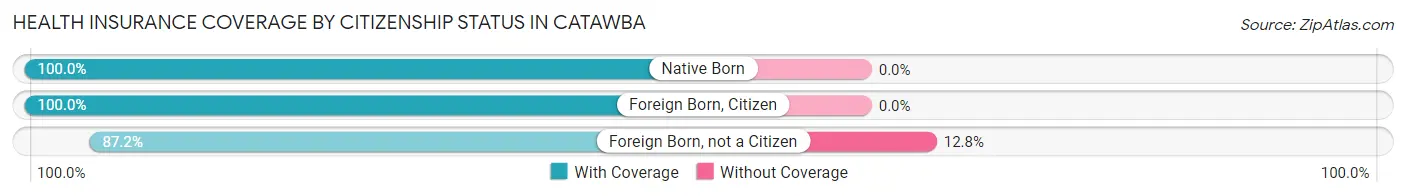
| Citizenship Status | With Coverage | Without Coverage |
| Native Born | 26 (100.0%) | 0 (0.0%) |
| Foreign Born, Citizen | 69 (100.0%) | 0 (0.0%) |
| Foreign Born, not a Citizen | 41 (87.2%) | 6 (12.8%) |
Health Insurance Coverage by Household Income in Catawba
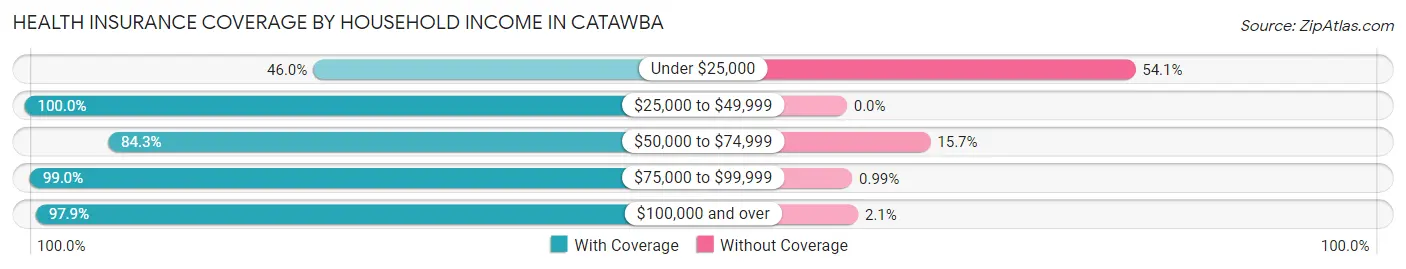
| Household Income | With Coverage | Without Coverage |
| Under $25,000 | 68 (46.0%) | 80 (54.0%) |
| $25,000 to $49,999 | 73 (100.0%) | 0 (0.0%) |
| $50,000 to $74,999 | 140 (84.3%) | 26 (15.7%) |
| $75,000 to $99,999 | 100 (99.0%) | 1 (1.0%) |
| $100,000 and over | 139 (97.9%) | 3 (2.1%) |
Public vs Private Health Insurance Coverage by Age in Catawba
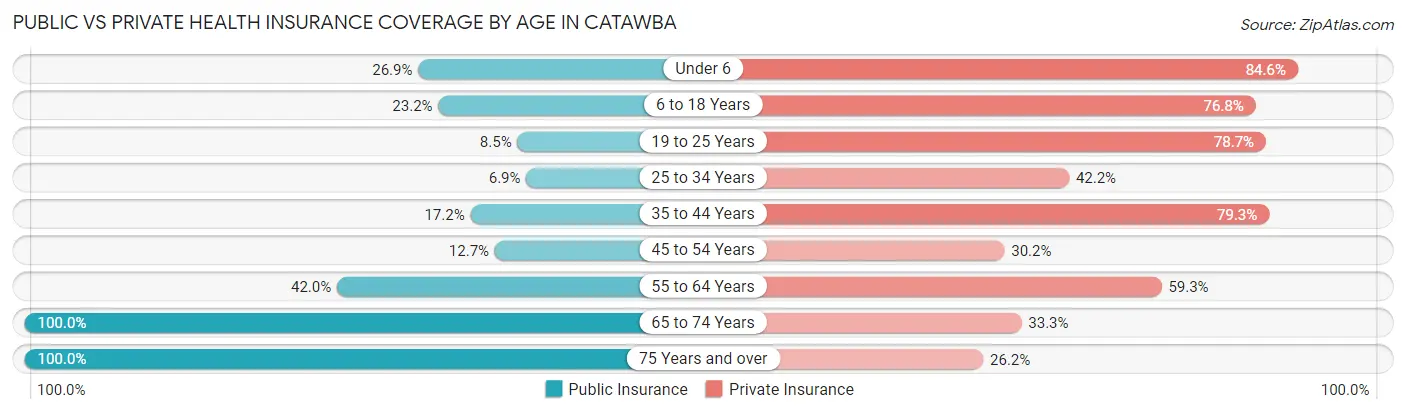
| Age Bracket | Public Insurance | Private Insurance |
| Under 6 | 7 (26.9%) | 22 (84.6%) |
| 6 to 18 Years | 16 (23.2%) | 53 (76.8%) |
| 19 to 25 Years | 4 (8.5%) | 37 (78.7%) |
| 25 to 34 Years | 7 (6.9%) | 43 (42.2%) |
| 35 to 44 Years | 10 (17.2%) | 46 (79.3%) |
| 45 to 54 Years | 8 (12.7%) | 19 (30.2%) |
| 55 to 64 Years | 63 (42.0%) | 89 (59.3%) |
| 65 to 74 Years | 54 (100.0%) | 18 (33.3%) |
| 75 Years and over | 61 (100.0%) | 16 (26.2%) |
| Total | 230 (36.5%) | 343 (54.4%) |
Disability Status by Sex by Age in Catawba
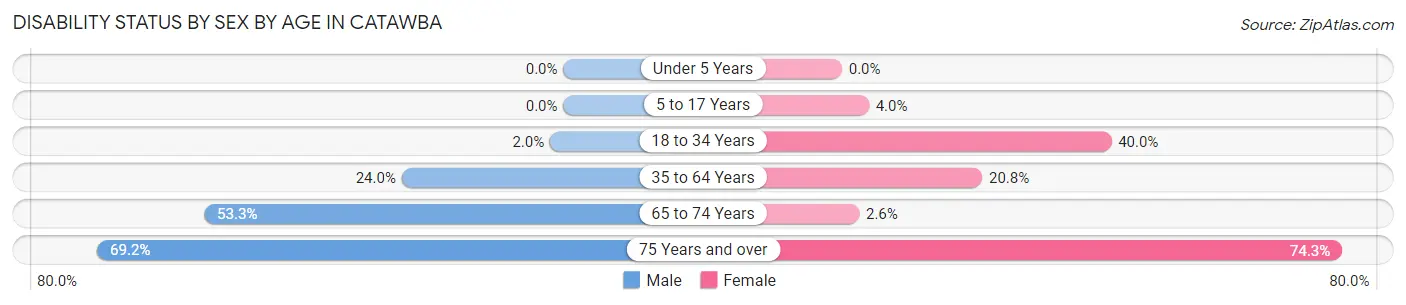
| Age Bracket | Male | Female |
| Under 5 Years | 0 (0.0%) | 0 (0.0%) |
| 5 to 17 Years | 0 (0.0%) | 1 (4.0%) |
| 18 to 34 Years | 2 (2.0%) | 20 (40.0%) |
| 35 to 64 Years | 42 (24.0%) | 20 (20.8%) |
| 65 to 74 Years | 8 (53.3%) | 1 (2.6%) |
| 75 Years and over | 18 (69.2%) | 26 (74.3%) |
Disability Class by Sex by Age in Catawba
Disability Class: Hearing Difficulty
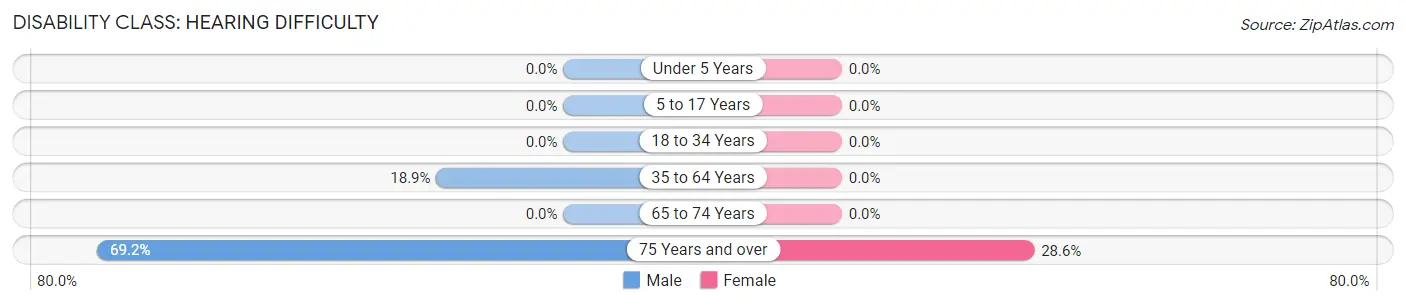
| Age Bracket | Male | Female |
| Under 5 Years | 0 (0.0%) | 0 (0.0%) |
| 5 to 17 Years | 0 (0.0%) | 0 (0.0%) |
| 18 to 34 Years | 0 (0.0%) | 0 (0.0%) |
| 35 to 64 Years | 33 (18.9%) | 0 (0.0%) |
| 65 to 74 Years | 0 (0.0%) | 0 (0.0%) |
| 75 Years and over | 18 (69.2%) | 10 (28.6%) |
Disability Class: Vision Difficulty
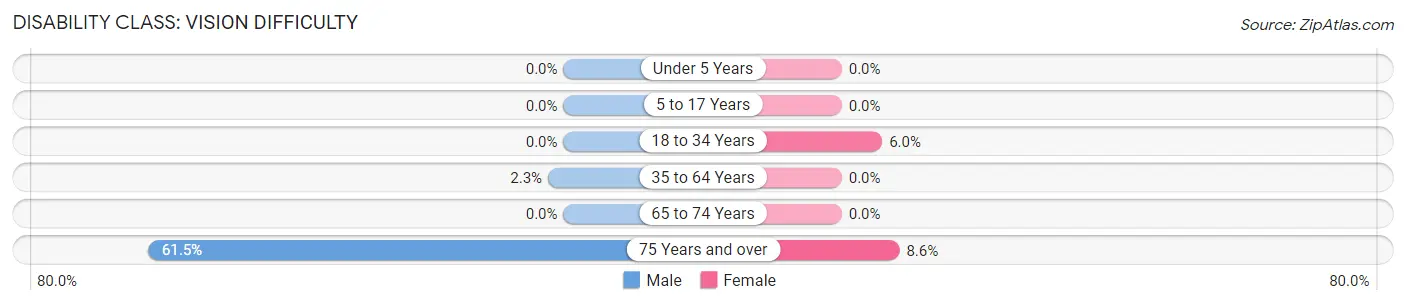
| Age Bracket | Male | Female |
| Under 5 Years | 0 (0.0%) | 0 (0.0%) |
| 5 to 17 Years | 0 (0.0%) | 0 (0.0%) |
| 18 to 34 Years | 0 (0.0%) | 3 (6.0%) |
| 35 to 64 Years | 4 (2.3%) | 0 (0.0%) |
| 65 to 74 Years | 0 (0.0%) | 0 (0.0%) |
| 75 Years and over | 16 (61.5%) | 3 (8.6%) |
Disability Class: Cognitive Difficulty
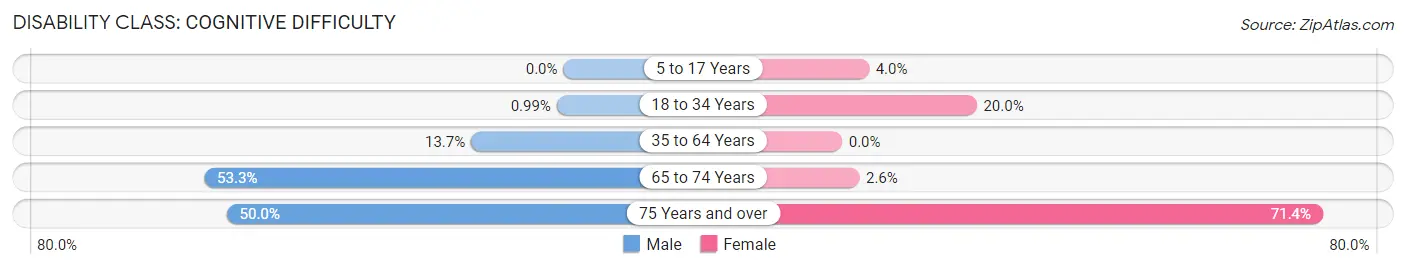
| Age Bracket | Male | Female |
| 5 to 17 Years | 0 (0.0%) | 1 (4.0%) |
| 18 to 34 Years | 1 (1.0%) | 10 (20.0%) |
| 35 to 64 Years | 24 (13.7%) | 0 (0.0%) |
| 65 to 74 Years | 8 (53.3%) | 1 (2.6%) |
| 75 Years and over | 13 (50.0%) | 25 (71.4%) |
Disability Class: Ambulatory Difficulty
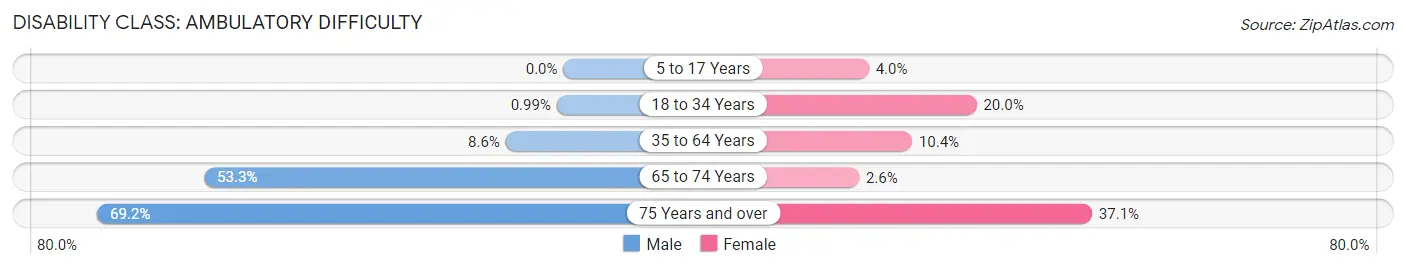
| Age Bracket | Male | Female |
| 5 to 17 Years | 0 (0.0%) | 1 (4.0%) |
| 18 to 34 Years | 1 (1.0%) | 10 (20.0%) |
| 35 to 64 Years | 15 (8.6%) | 10 (10.4%) |
| 65 to 74 Years | 8 (53.3%) | 1 (2.6%) |
| 75 Years and over | 18 (69.2%) | 13 (37.1%) |
Disability Class: Self-Care Difficulty
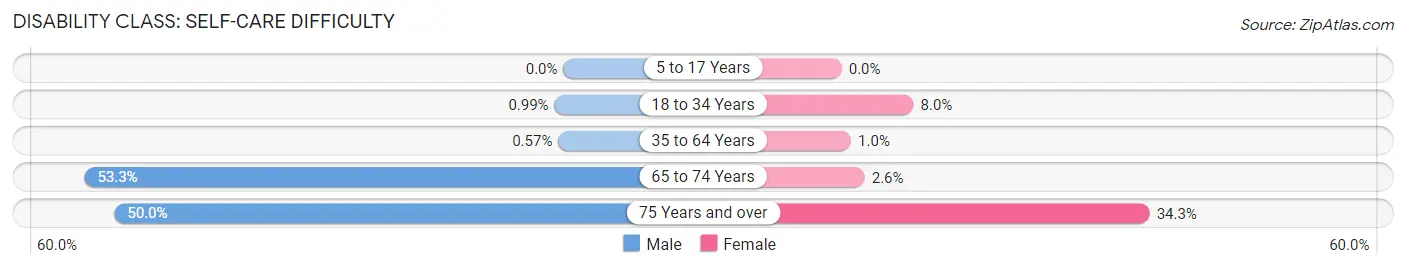
| Age Bracket | Male | Female |
| 5 to 17 Years | 0 (0.0%) | 0 (0.0%) |
| 18 to 34 Years | 1 (1.0%) | 4 (8.0%) |
| 35 to 64 Years | 1 (0.6%) | 1 (1.0%) |
| 65 to 74 Years | 8 (53.3%) | 1 (2.6%) |
| 75 Years and over | 13 (50.0%) | 12 (34.3%) |
Technology Access in Catawba
Computing Device Access in Catawba
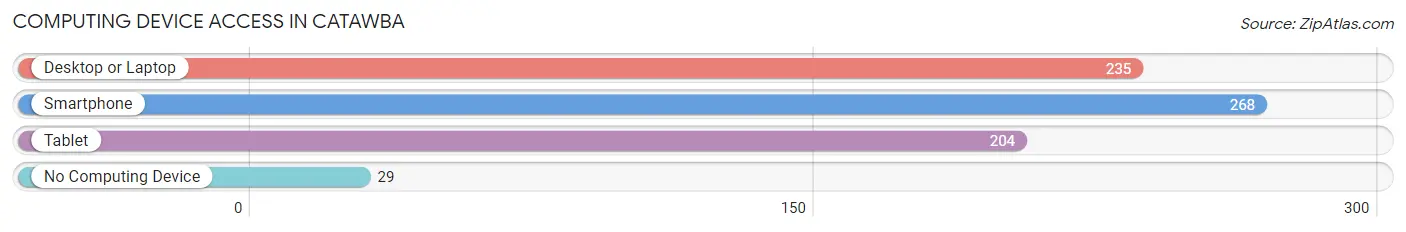
| Device Type | # Households | % Households |
| Desktop or Laptop | 235 | 73.0% |
| Smartphone | 268 | 83.2% |
| Tablet | 204 | 63.3% |
| No Computing Device | 29 | 9.0% |
| Total | 322 | 100.0% |
Internet Access in Catawba
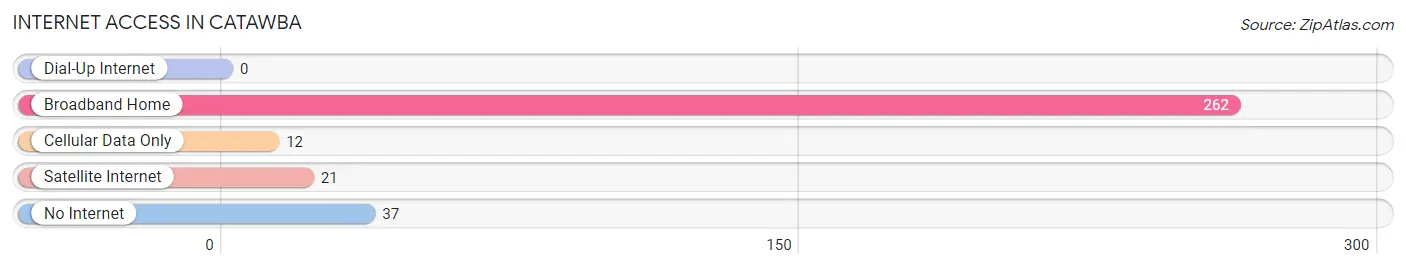
| Internet Type | # Households | % Households |
| Dial-Up Internet | 0 | 0.0% |
| Broadband Home | 262 | 81.4% |
| Cellular Data Only | 12 | 3.7% |
| Satellite Internet | 21 | 6.5% |
| No Internet | 37 | 11.5% |
| Total | 322 | 100.0% |
Catawba Summary
Catawba is a small town located in Catawba County, North Carolina. It is situated in the foothills of the Blue Ridge Mountains, about 25 miles northwest of Charlotte. The town has a population of approximately 1,500 people and is part of the Hickory-Lenoir-Morganton Metropolitan Statistical Area.
History
Catawba was first settled in the late 1700s by German and Scots-Irish immigrants. The town was originally known as Catawba Station, named after the nearby Catawba River. The town was officially incorporated in 1891.
In the early 1900s, Catawba was a thriving agricultural community. The town was home to several cotton mills, which provided employment for many of the town’s residents. The town also had a thriving furniture industry, which was centered around the Catawba Furniture Company.
In the 1950s, Catawba began to experience a decline in its economy. The cotton mills and furniture factories began to close, leaving many of the town’s residents without jobs. In the late 1970s, the town began to experience a resurgence in its economy, as new businesses began to move into the area.
Geography
Catawba is located in the foothills of the Blue Ridge Mountains, about 25 miles northwest of Charlotte. The town is situated along the Catawba River, which provides a scenic backdrop for the town. The town is also located near several lakes, including Lake Norman and Lake Hickory.
The town has a total area of 2.2 square miles, all of which is land. The town has a humid subtropical climate, with hot, humid summers and mild winters.
Economy
Catawba’s economy is largely based on tourism and manufacturing. The town is home to several tourist attractions, including the Catawba River Canoe Trail, the Catawba Valley Brewing Company, and the Catawba Valley Winery.
The town is also home to several manufacturing companies, including the Catawba Valley Furniture Company, the Catawba Valley Textile Company, and the Catawba Valley Tool and Die Company.
Demographics
As of the 2010 census, Catawba had a population of 1,521 people. The racial makeup of the town was 94.2% White, 2.2% African American, 0.7% Native American, 0.4% Asian, 0.1% Pacific Islander, and 2.4% from other races. Hispanic or Latino of any race were 2.7% of the population.
The median household income in Catawba was $37,917, and the median family income was $45,938. The per capita income for the town was $20,945. About 11.2% of families and 14.2% of the population were below the poverty line, including 19.2% of those under age 18 and 8.2% of those age 65 or over.
Common Questions
What is Per Capita Income in Catawba?
Per Capita income in Catawba is $28,878.
What is the Median Family Income in Catawba?
Median Family Income in Catawba is $69,722.
What is the Median Household income in Catawba?
Median Household Income in Catawba is $44,167.
What is Income or Wage Gap in Catawba?
Income or Wage Gap in Catawba is 21.0%.
Women in Catawba earn 79.0 cents for every dollar earned by a man.
What is Family Income Deficit in Catawba?
Family Income Deficit in Catawba is $12,453.
Families that are below poverty line in Catawba earn $12,453 less on average than the poverty threshold level.
What is Inequality or Gini Index in Catawba?
Inequality or Gini Index in Catawba is 0.52.
What is the Total Population of Catawba?
Total Population of Catawba is 630.
What is the Total Male Population of Catawba?
Total Male Population of Catawba is 384.
What is the Total Female Population of Catawba?
Total Female Population of Catawba is 246.
What is the Ratio of Males per 100 Females in Catawba?
There are 156.10 Males per 100 Females in Catawba.
What is the Ratio of Females per 100 Males in Catawba?
There are 64.06 Females per 100 Males in Catawba.
What is the Median Population Age in Catawba?
Median Population Age in Catawba is 49.1 Years.
What is the Average Family Size in Catawba
Average Family Size in Catawba is 2.8 People.
What is the Average Household Size in Catawba
Average Household Size in Catawba is 2.0 People.
How Large is the Labor Force in Catawba?
There are 287 People in the Labor Forcein in Catawba.
What is the Percentage of People in the Labor Force in Catawba?
52.7% of People are in the Labor Force in Catawba.
What is the Unemployment Rate in Catawba?
Unemployment Rate in Catawba is 5.2%.