Pembroke, NC Map & Demographics
Pembroke Map
Pembroke Overview
$14,357
PER CAPITA INCOME
$39,241
AVG FAMILY INCOME
$23,107
AVG HOUSEHOLD INCOME
25.3%
WAGE / INCOME GAP [ % ]
74.7¢/ $1
WAGE / INCOME GAP [ $ ]
0.60
INEQUALITY / GINI INDEX
2,832
TOTAL POPULATION
1,380
MALE POPULATION
1,452
FEMALE POPULATION
95.04
MALES / 100 FEMALES
105.22
FEMALES / 100 MALES
24.0
MEDIAN AGE
3.2
AVG FAMILY SIZE
2.3
AVG HOUSEHOLD SIZE
875
LABOR FORCE [ PEOPLE ]
38.6%
PERCENT IN LABOR FORCE
4.8%
UNEMPLOYMENT RATE
Pembroke Zip Codes
Pembroke Area Codes
Income in Pembroke
Income Overview in Pembroke
Per Capita Income in Pembroke is $14,357, while median incomes of families and households are $39,241 and $23,107 respectively.
| Characteristic | Number | Measure |
| Per Capita Income | 2,832 | $14,357 |
| Median Family Income | 517 | $39,241 |
| Mean Family Income | 517 | $52,684 |
| Median Household Income | 1,037 | $23,107 |
| Mean Household Income | 1,037 | $35,693 |
| Income Deficit | 517 | $0 |
| Wage / Income Gap (%) | 2,832 | 25.29% |
| Wage / Income Gap ($) | 2,832 | 74.71¢ per $1 |
| Gini / Inequality Index | 2,832 | 0.60 |
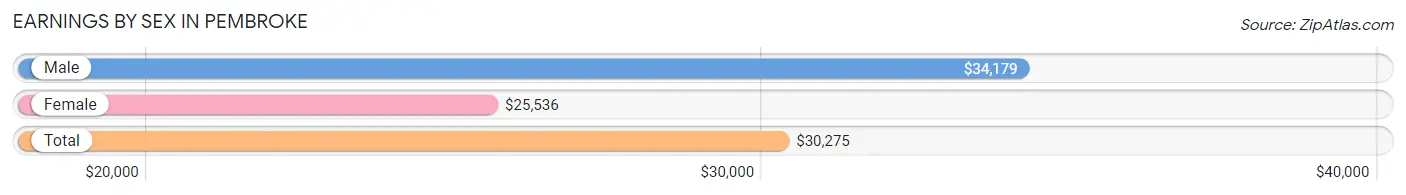
Earnings by Sex in Pembroke
Average Earnings in Pembroke are $30,275, $34,179 for men and $25,536 for women, a difference of 25.3%.
| Sex | Number | Average Earnings |
| Male | 389 (42.7%) | $34,179 |
| Female | 522 (57.3%) | $25,536 |
| Total | 911 (100.0%) | $30,275 |
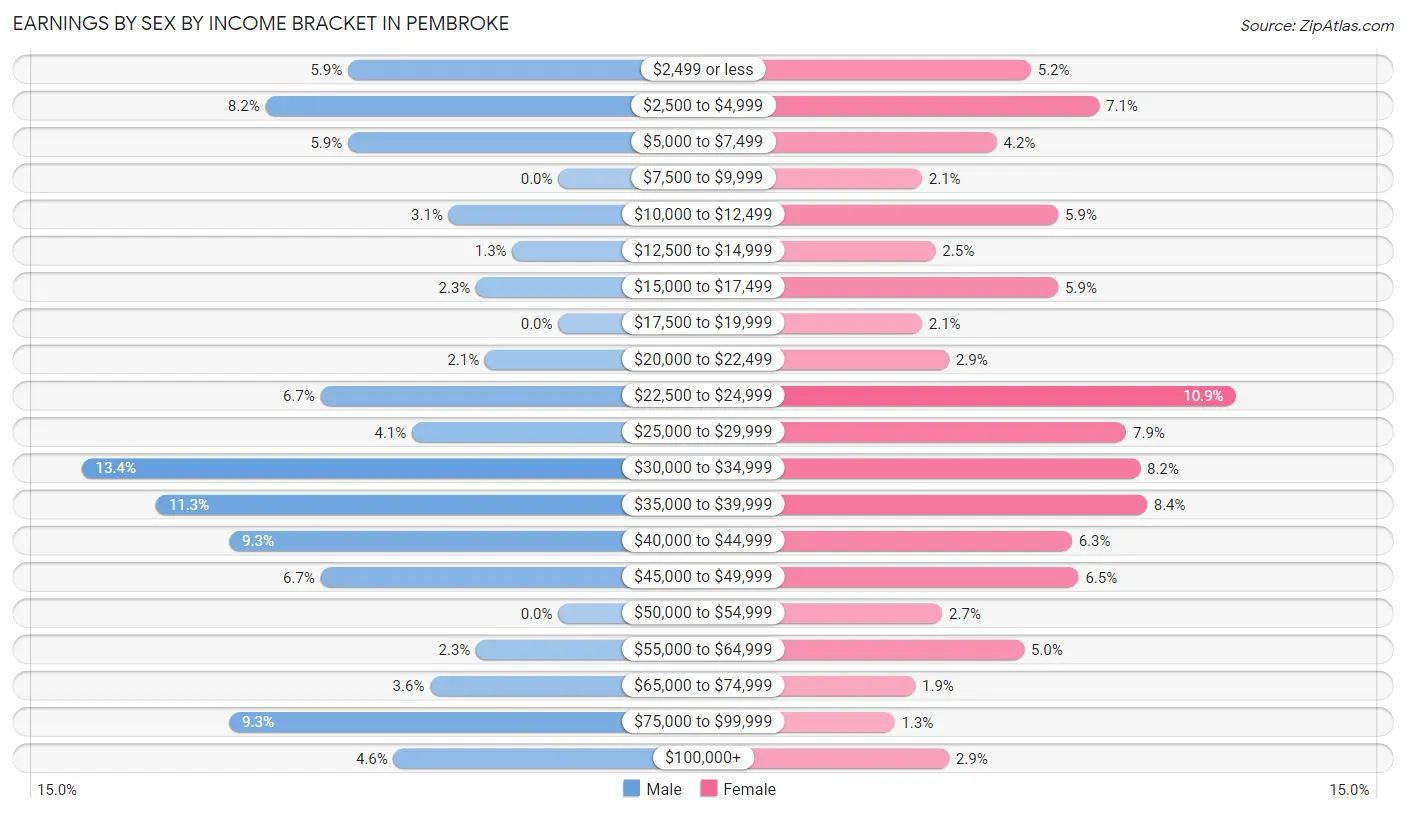
Earnings by Sex by Income Bracket in Pembroke
The most common earnings brackets in Pembroke are $30,000 to $34,999 for men (52 | 13.4%) and $22,500 to $24,999 for women (57 | 10.9%).
| Income | Male | Female |
| $2,499 or less | 23 (5.9%) | 27 (5.2%) |
| $2,500 to $4,999 | 32 (8.2%) | 37 (7.1%) |
| $5,000 to $7,499 | 23 (5.9%) | 22 (4.2%) |
| $7,500 to $9,999 | 0 (0.0%) | 11 (2.1%) |
| $10,000 to $12,499 | 12 (3.1%) | 31 (5.9%) |
| $12,500 to $14,999 | 5 (1.3%) | 13 (2.5%) |
| $15,000 to $17,499 | 9 (2.3%) | 31 (5.9%) |
| $17,500 to $19,999 | 0 (0.0%) | 11 (2.1%) |
| $20,000 to $22,499 | 8 (2.1%) | 15 (2.9%) |
| $22,500 to $24,999 | 26 (6.7%) | 57 (10.9%) |
| $25,000 to $29,999 | 16 (4.1%) | 41 (7.9%) |
| $30,000 to $34,999 | 52 (13.4%) | 43 (8.2%) |
| $35,000 to $39,999 | 44 (11.3%) | 44 (8.4%) |
| $40,000 to $44,999 | 36 (9.2%) | 33 (6.3%) |
| $45,000 to $49,999 | 26 (6.7%) | 34 (6.5%) |
| $50,000 to $54,999 | 0 (0.0%) | 14 (2.7%) |
| $55,000 to $64,999 | 9 (2.3%) | 26 (5.0%) |
| $65,000 to $74,999 | 14 (3.6%) | 10 (1.9%) |
| $75,000 to $99,999 | 36 (9.2%) | 7 (1.3%) |
| $100,000+ | 18 (4.6%) | 15 (2.9%) |
| Total | 389 (100.0%) | 522 (100.0%) |
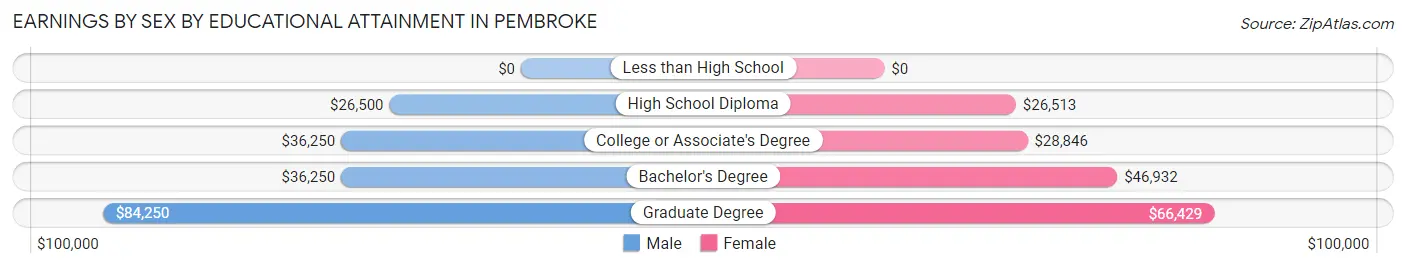
Earnings by Sex by Educational Attainment in Pembroke
Average earnings in Pembroke are $36,696 for men and $30,985 for women, a difference of 15.6%. Men with an educational attainment of graduate degree enjoy the highest average annual earnings of $84,250, while those with high school diploma education earn the least with $26,500. Women with an educational attainment of graduate degree earn the most with the average annual earnings of $66,429, while those with high school diploma education have the smallest earnings of $26,513.
| Educational Attainment | Male Income | Female Income |
| Less than High School | - | - |
| High School Diploma | $26,500 | $26,513 |
| College or Associate's Degree | $36,250 | $28,846 |
| Bachelor's Degree | $36,250 | $46,932 |
| Graduate Degree | $84,250 | $66,429 |
| Total | $36,696 | $30,985 |
Family Income in Pembroke
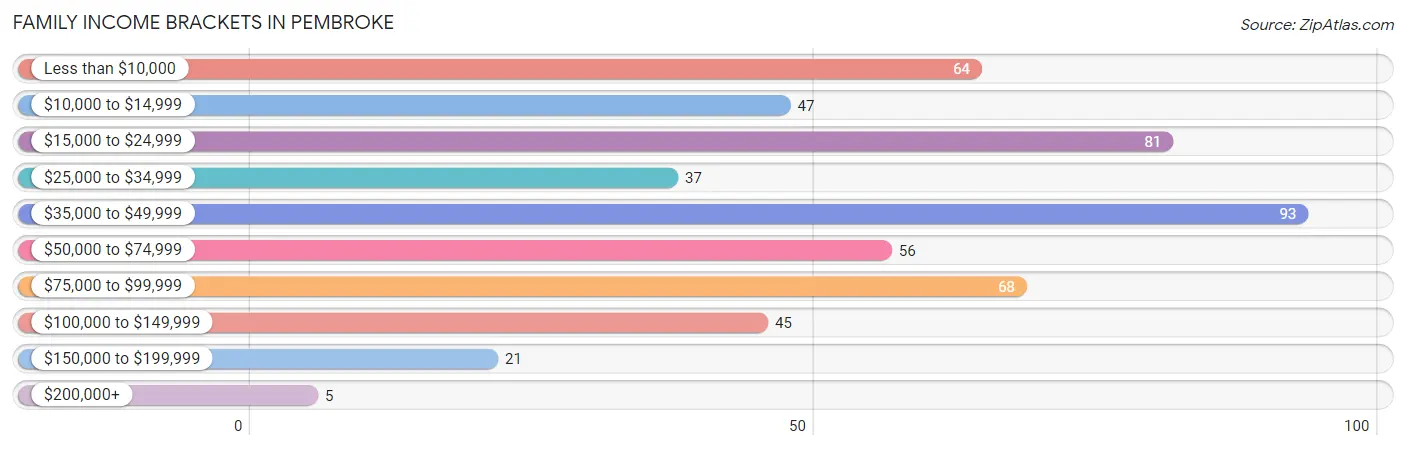
Family Income Brackets in Pembroke
According to the Pembroke family income data, there are 93 families falling into the $35,000 to $49,999 income range, which is the most common income bracket and makes up 18.0% of all families. Conversely, the $200,000+ income bracket is the least frequent group with only 5 families (1.0%) belonging to this category.
| Income Bracket | # Families | % Families |
| Less than $10,000 | 64 | 12.4% |
| $10,000 to $14,999 | 47 | 9.1% |
| $15,000 to $24,999 | 81 | 15.7% |
| $25,000 to $34,999 | 37 | 7.2% |
| $35,000 to $49,999 | 93 | 18.0% |
| $50,000 to $74,999 | 56 | 10.8% |
| $75,000 to $99,999 | 68 | 13.2% |
| $100,000 to $149,999 | 45 | 8.7% |
| $150,000 to $199,999 | 21 | 4.1% |
| $200,000+ | 5 | 1.0% |
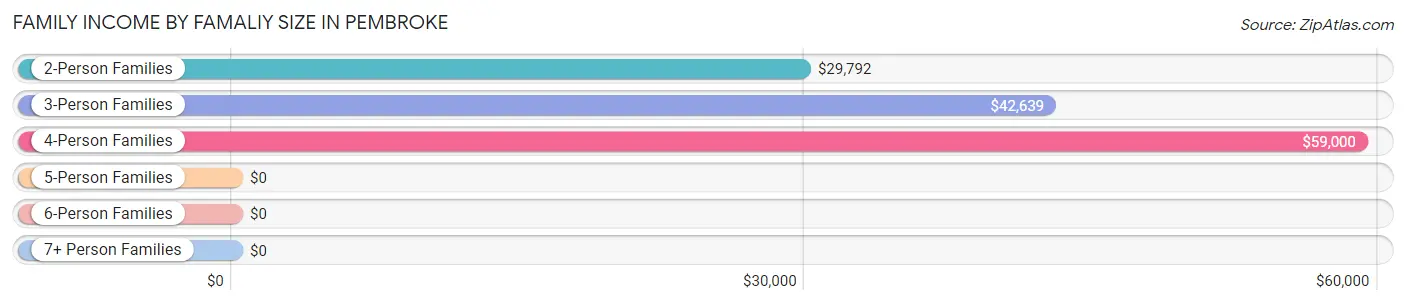
Family Income by Famaliy Size in Pembroke
4-person families (102 | 19.7%) account for the highest median family income in Pembroke with $59,000 per family, while 2-person families (199 | 38.5%) have the highest median income of $14,896 per family member.
| Income Bracket | # Families | Median Income |
| 2-Person Families | 199 (38.5%) | $29,792 |
| 3-Person Families | 186 (36.0%) | $42,639 |
| 4-Person Families | 102 (19.7%) | $59,000 |
| 5-Person Families | 25 (4.8%) | $0 |
| 6-Person Families | 5 (1.0%) | $0 |
| 7+ Person Families | 0 (0.0%) | $0 |
| Total | 517 (100.0%) | $39,241 |
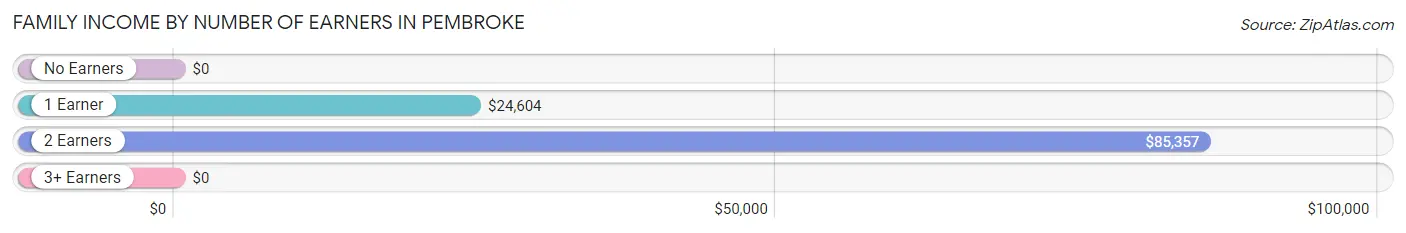
Family Income by Number of Earners in Pembroke
| Number of Earners | # Families | Median Income |
| No Earners | 118 (22.8%) | $0 |
| 1 Earner | 219 (42.4%) | $24,604 |
| 2 Earners | 176 (34.0%) | $85,357 |
| 3+ Earners | 4 (0.8%) | $0 |
| Total | 517 (100.0%) | $39,241 |
Household Income in Pembroke
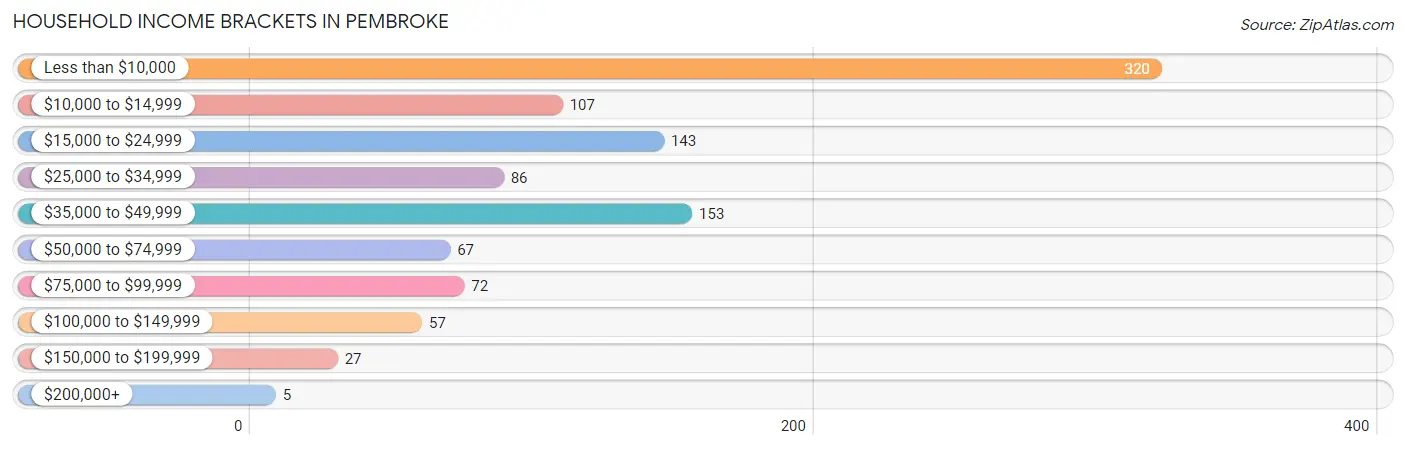
Household Income Brackets in Pembroke
With 320 households falling in the category, the less than $10,000 income range is the most frequent in Pembroke, accounting for 30.9% of all households. In contrast, only 5 households (0.5%) fall into the $200,000+ income bracket, making it the least populous group.
| Income Bracket | # Households | % Households |
| Less than $10,000 | 320 | 30.9% |
| $10,000 to $14,999 | 107 | 10.3% |
| $15,000 to $24,999 | 143 | 13.8% |
| $25,000 to $34,999 | 86 | 8.3% |
| $35,000 to $49,999 | 153 | 14.8% |
| $50,000 to $74,999 | 67 | 6.5% |
| $75,000 to $99,999 | 72 | 6.9% |
| $100,000 to $149,999 | 57 | 5.5% |
| $150,000 to $199,999 | 27 | 2.6% |
| $200,000+ | 5 | 0.5% |
Household Income by Householder Age in Pembroke
The median household income in Pembroke is $23,107, with the highest median household income of $37,727 found in the 25 to 44 years age bracket for the primary householder. A total of 290 households (28.0%) fall into this category. Meanwhile, the 15 to 24 years age bracket for the primary householder has the lowest median household income of $2,499, with 267 households (25.8%) in this group.
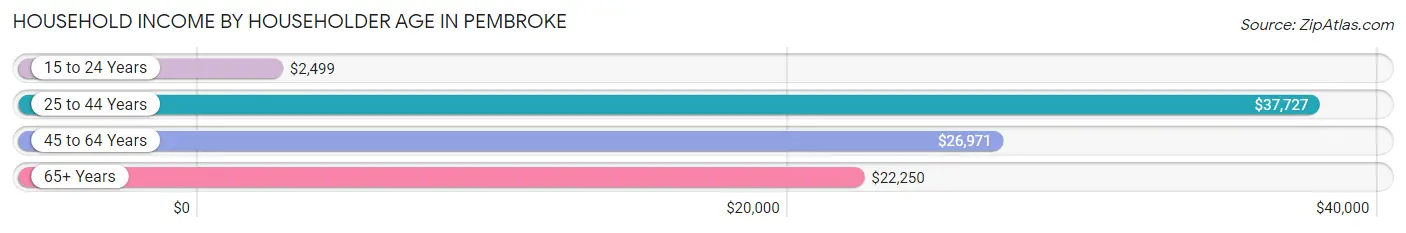
| Income Bracket | # Households | Median Income |
| 15 to 24 Years | 267 (25.8%) | $2,499 |
| 25 to 44 Years | 290 (28.0%) | $37,727 |
| 45 to 64 Years | 247 (23.8%) | $26,971 |
| 65+ Years | 233 (22.5%) | $22,250 |
| Total | 1,037 (100.0%) | $23,107 |
Poverty in Pembroke
Income Below Poverty by Sex and Age in Pembroke
With 37.3% poverty level for males and 43.8% for females among the residents of Pembroke, 15 year old males and 5 year old females are the most vulnerable to poverty, with 8 males (100.0%) and 20 females (100.0%) in their respective age groups living below the poverty level.
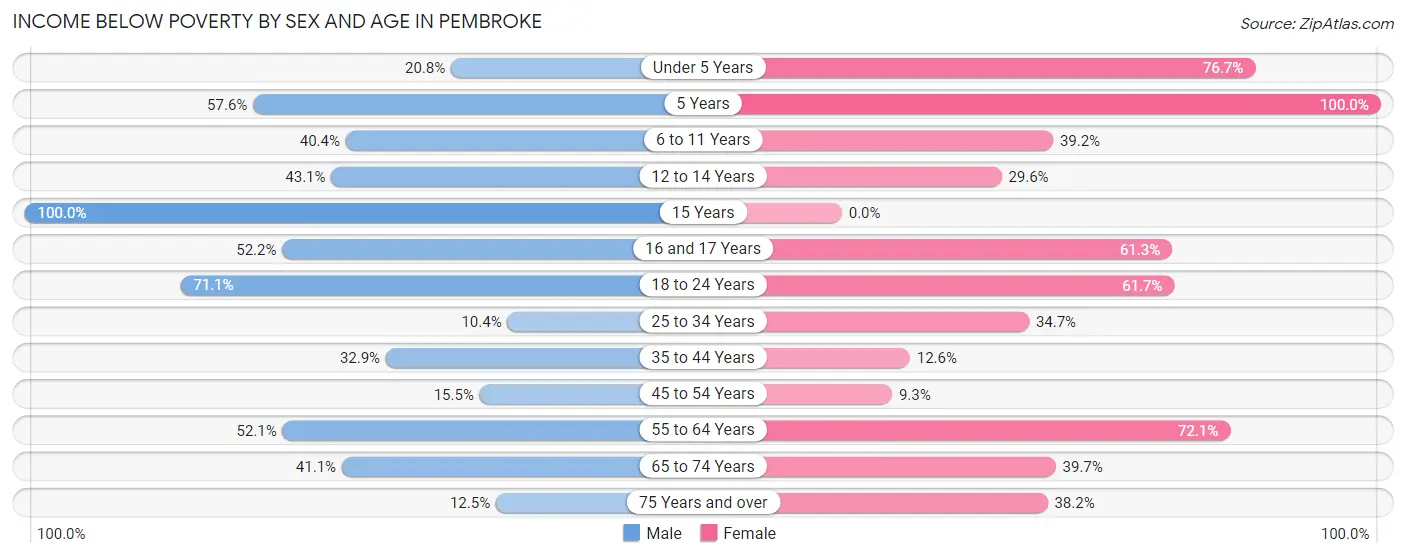
| Age Bracket | Male | Female |
| Under 5 Years | 40 (20.8%) | 56 (76.7%) |
| 5 Years | 19 (57.6%) | 20 (100.0%) |
| 6 to 11 Years | 21 (40.4%) | 29 (39.2%) |
| 12 to 14 Years | 31 (43.1%) | 8 (29.6%) |
| 15 Years | 8 (100.0%) | 0 (0.0%) |
| 16 and 17 Years | 24 (52.2%) | 19 (61.3%) |
| 18 to 24 Years | 145 (71.1%) | 158 (61.7%) |
| 25 to 34 Years | 14 (10.4%) | 66 (34.7%) |
| 35 to 44 Years | 27 (32.9%) | 12 (12.6%) |
| 45 to 54 Years | 18 (15.5%) | 15 (9.3%) |
| 55 to 64 Years | 37 (52.1%) | 80 (72.1%) |
| 65 to 74 Years | 30 (41.1%) | 52 (39.7%) |
| 75 Years and over | 5 (12.5%) | 21 (38.2%) |
| Total | 419 (37.3%) | 536 (43.8%) |
Income Above Poverty by Sex and Age in Pembroke
According to the poverty statistics in Pembroke, males aged 25 to 34 years and females aged 45 to 54 years are the age groups that are most secure financially, with 89.6% of males and 90.7% of females in these age groups living above the poverty line.
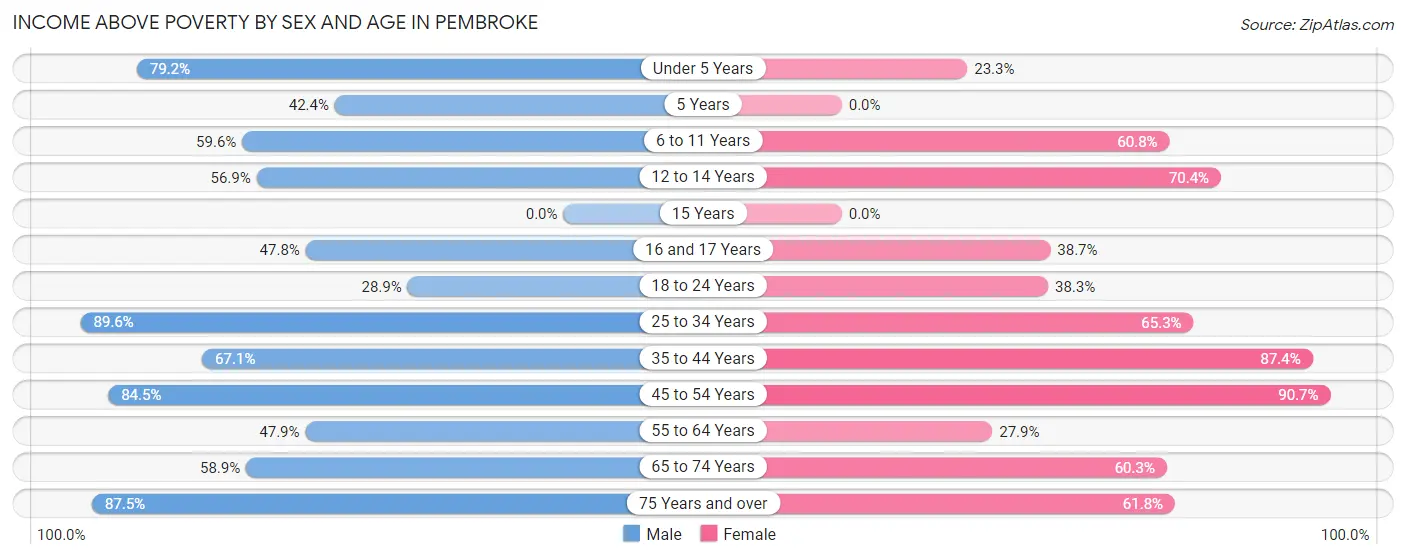
| Age Bracket | Male | Female |
| Under 5 Years | 152 (79.2%) | 17 (23.3%) |
| 5 Years | 14 (42.4%) | 0 (0.0%) |
| 6 to 11 Years | 31 (59.6%) | 45 (60.8%) |
| 12 to 14 Years | 41 (56.9%) | 19 (70.4%) |
| 15 Years | 0 (0.0%) | 0 (0.0%) |
| 16 and 17 Years | 22 (47.8%) | 12 (38.7%) |
| 18 to 24 Years | 59 (28.9%) | 98 (38.3%) |
| 25 to 34 Years | 121 (89.6%) | 124 (65.3%) |
| 35 to 44 Years | 55 (67.1%) | 83 (87.4%) |
| 45 to 54 Years | 98 (84.5%) | 146 (90.7%) |
| 55 to 64 Years | 34 (47.9%) | 31 (27.9%) |
| 65 to 74 Years | 43 (58.9%) | 79 (60.3%) |
| 75 Years and over | 35 (87.5%) | 34 (61.8%) |
| Total | 705 (62.7%) | 688 (56.2%) |
Income Below Poverty Among Married-Couple Families in Pembroke
The poverty statistics for married-couple families in Pembroke show that 2.9% or 5 of the total 171 families live below the poverty line. Families with 1 or 2 children have the highest poverty rate of 6.9%, comprising of 5 families. On the other hand, families with no children have the lowest poverty rate of 0.0%, which includes 0 families.
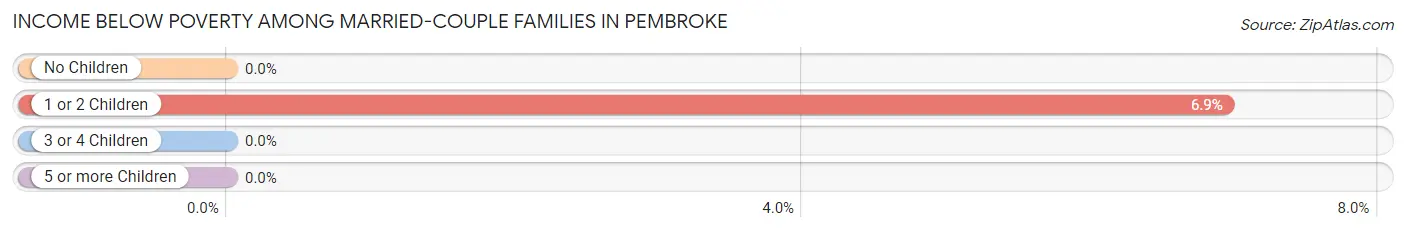
| Children | Above Poverty | Below Poverty |
| No Children | 94 (100.0%) | 0 (0.0%) |
| 1 or 2 Children | 67 (93.1%) | 5 (6.9%) |
| 3 or 4 Children | 5 (100.0%) | 0 (0.0%) |
| 5 or more Children | 0 (0.0%) | 0 (0.0%) |
| Total | 166 (97.1%) | 5 (2.9%) |
Income Below Poverty Among Single-Parent Households in Pembroke
According to the poverty data in Pembroke, 32.7% or 17 single-father households and 42.9% or 126 single-mother households are living below the poverty line. Among single-father households, those with no children have the highest poverty rate, with 12 households (46.2%) experiencing poverty. Likewise, among single-mother households, those with 3 or 4 children have the highest poverty rate, with 46 households (88.5%) falling below the poverty line.
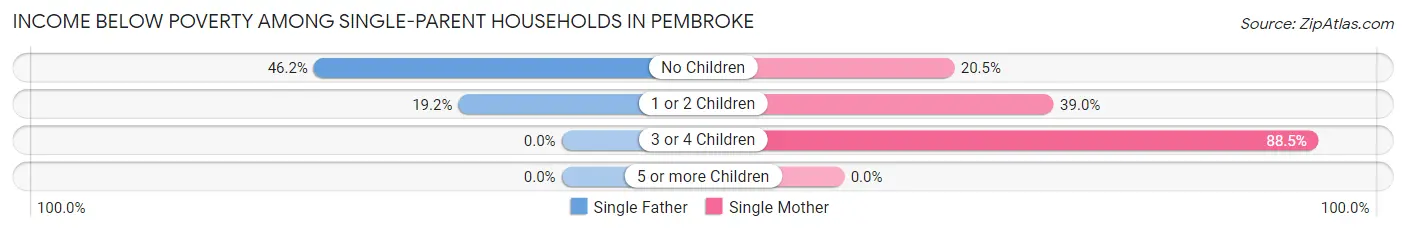
| Children | Single Father | Single Mother |
| No Children | 12 (46.2%) | 16 (20.5%) |
| 1 or 2 Children | 5 (19.2%) | 64 (39.0%) |
| 3 or 4 Children | 0 (0.0%) | 46 (88.5%) |
| 5 or more Children | 0 (0.0%) | 0 (0.0%) |
| Total | 17 (32.7%) | 126 (42.9%) |
Income Below Poverty Among Married-Couple vs Single-Parent Households in Pembroke
The poverty data for Pembroke shows that 5 of the married-couple family households (2.9%) and 143 of the single-parent households (41.3%) are living below the poverty level. Within the married-couple family households, those with 1 or 2 children have the highest poverty rate, with 5 households (6.9%) falling below the poverty line. Among the single-parent households, those with 3 or 4 children have the highest poverty rate, with 46 household (88.5%) living below poverty.
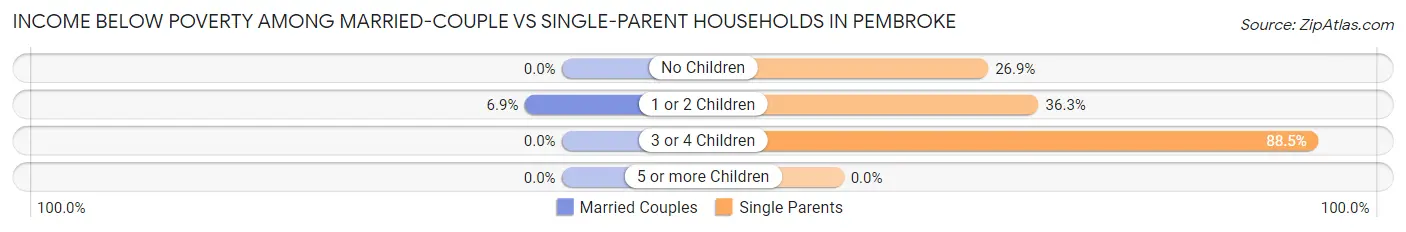
| Children | Married-Couple Families | Single-Parent Households |
| No Children | 0 (0.0%) | 28 (26.9%) |
| 1 or 2 Children | 5 (6.9%) | 69 (36.3%) |
| 3 or 4 Children | 0 (0.0%) | 46 (88.5%) |
| 5 or more Children | 0 (0.0%) | 0 (0.0%) |
| Total | 5 (2.9%) | 143 (41.3%) |
Race in Pembroke
The most populous races in Pembroke are Native / Alaskan (1,818 | 64.2%), Black / African American (564 | 19.9%), and White / Caucasian (301 | 10.6%).
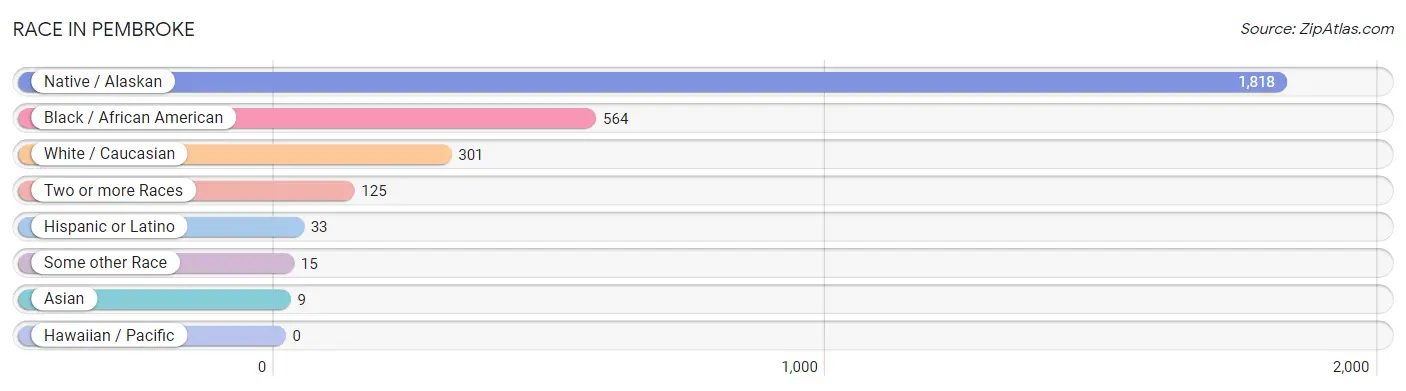
| Race | # Population | % Population |
| Asian | 9 | 0.3% |
| Black / African American | 564 | 19.9% |
| Hawaiian / Pacific | 0 | 0.0% |
| Hispanic or Latino | 33 | 1.2% |
| Native / Alaskan | 1,818 | 64.2% |
| White / Caucasian | 301 | 10.6% |
| Two or more Races | 125 | 4.4% |
| Some other Race | 15 | 0.5% |
| Total | 2,832 | 100.0% |
Ancestry in Pembroke
The most populous ancestries reported in Pembroke are Lumbee (1,572 | 55.5%), American (417 | 14.7%), Cherokee (66 | 2.3%), English (58 | 2.1%), and Sioux (50 | 1.8%), together accounting for 76.4% of all Pembroke residents.
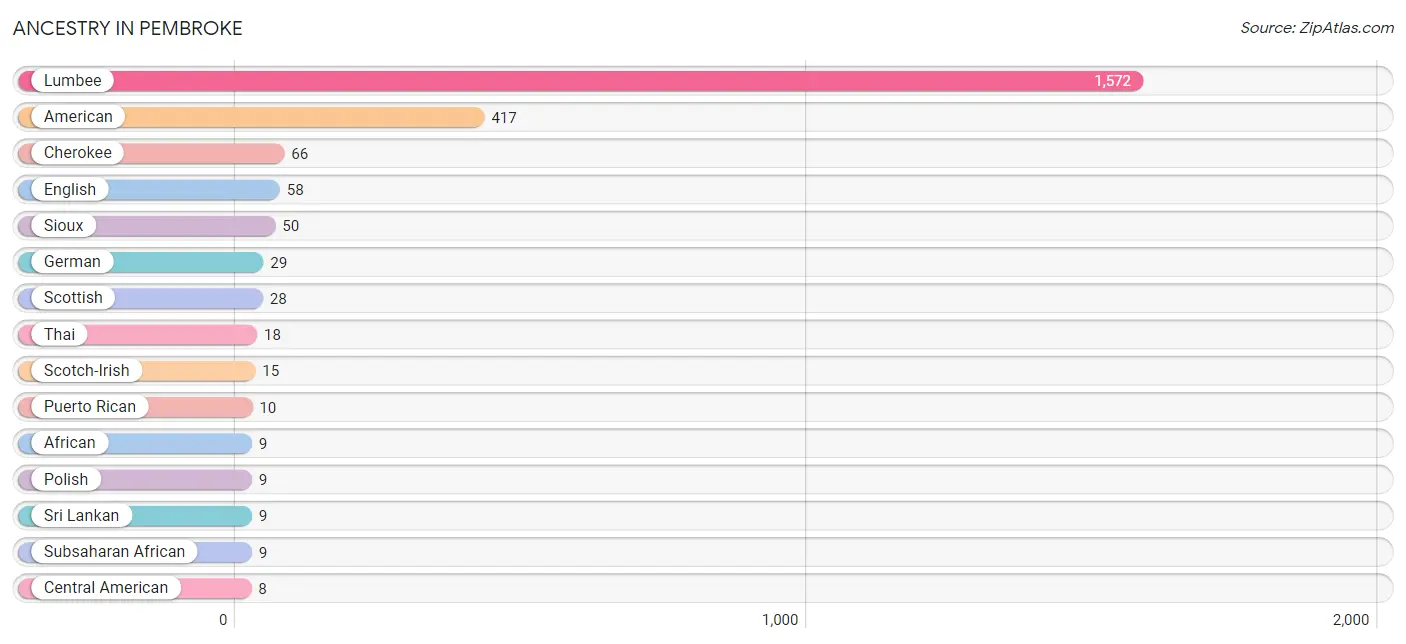
| Ancestry | # Population | % Population |
| African | 9 | 0.3% |
| American | 417 | 14.7% |
| Central American | 8 | 0.3% |
| Cherokee | 66 | 2.3% |
| Ecuadorian | 4 | 0.1% |
| English | 58 | 2.1% |
| German | 29 | 1.0% |
| Lumbee | 1,572 | 55.5% |
| Mexican | 6 | 0.2% |
| Norwegian | 3 | 0.1% |
| Panamanian | 8 | 0.3% |
| Polish | 9 | 0.3% |
| Puerto Rican | 10 | 0.4% |
| Scotch-Irish | 15 | 0.5% |
| Scottish | 28 | 1.0% |
| Sioux | 50 | 1.8% |
| South American | 4 | 0.1% |
| Spanish | 5 | 0.2% |
| Sri Lankan | 9 | 0.3% |
| Subsaharan African | 9 | 0.3% |
| Thai | 18 | 0.6% | View All 21 Rows |
Immigrants in Pembroke
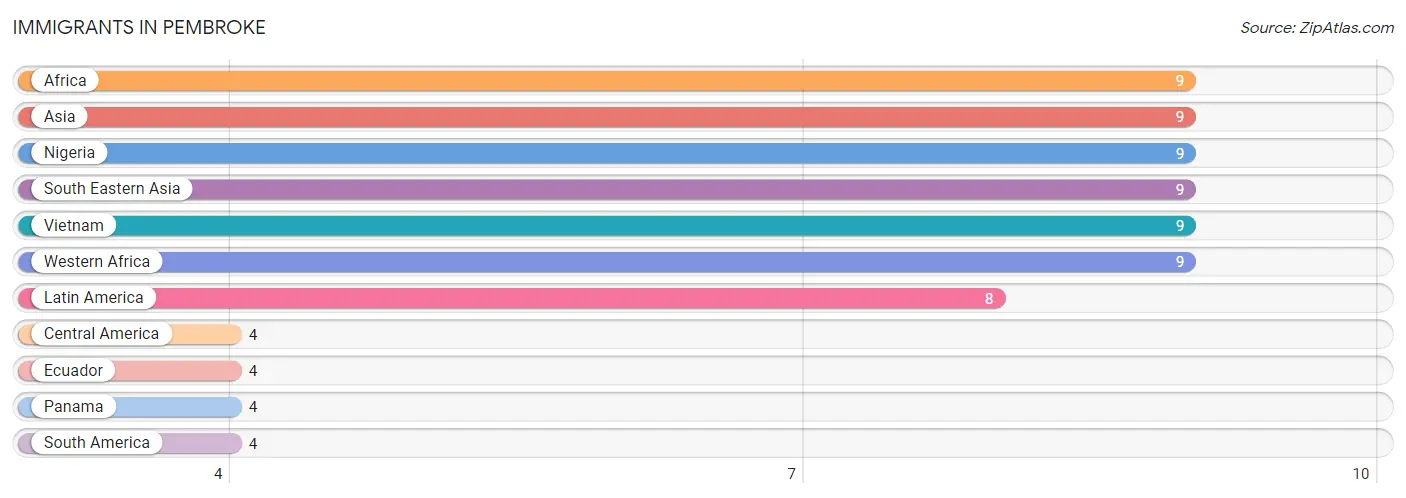
The most numerous immigrant groups reported in Pembroke came from Africa (9 | 0.3%), Asia (9 | 0.3%), Nigeria (9 | 0.3%), South Eastern Asia (9 | 0.3%), and Vietnam (9 | 0.3%), together accounting for 1.6% of all Pembroke residents.
| Immigration Origin | # Population | % Population |
| Africa | 9 | 0.3% |
| Asia | 9 | 0.3% |
| Central America | 4 | 0.1% |
| Ecuador | 4 | 0.1% |
| Latin America | 8 | 0.3% |
| Nigeria | 9 | 0.3% |
| Panama | 4 | 0.1% |
| South America | 4 | 0.1% |
| South Eastern Asia | 9 | 0.3% |
| Vietnam | 9 | 0.3% |
| Western Africa | 9 | 0.3% | View All 11 Rows |
Sex and Age in Pembroke
Sex and Age in Pembroke
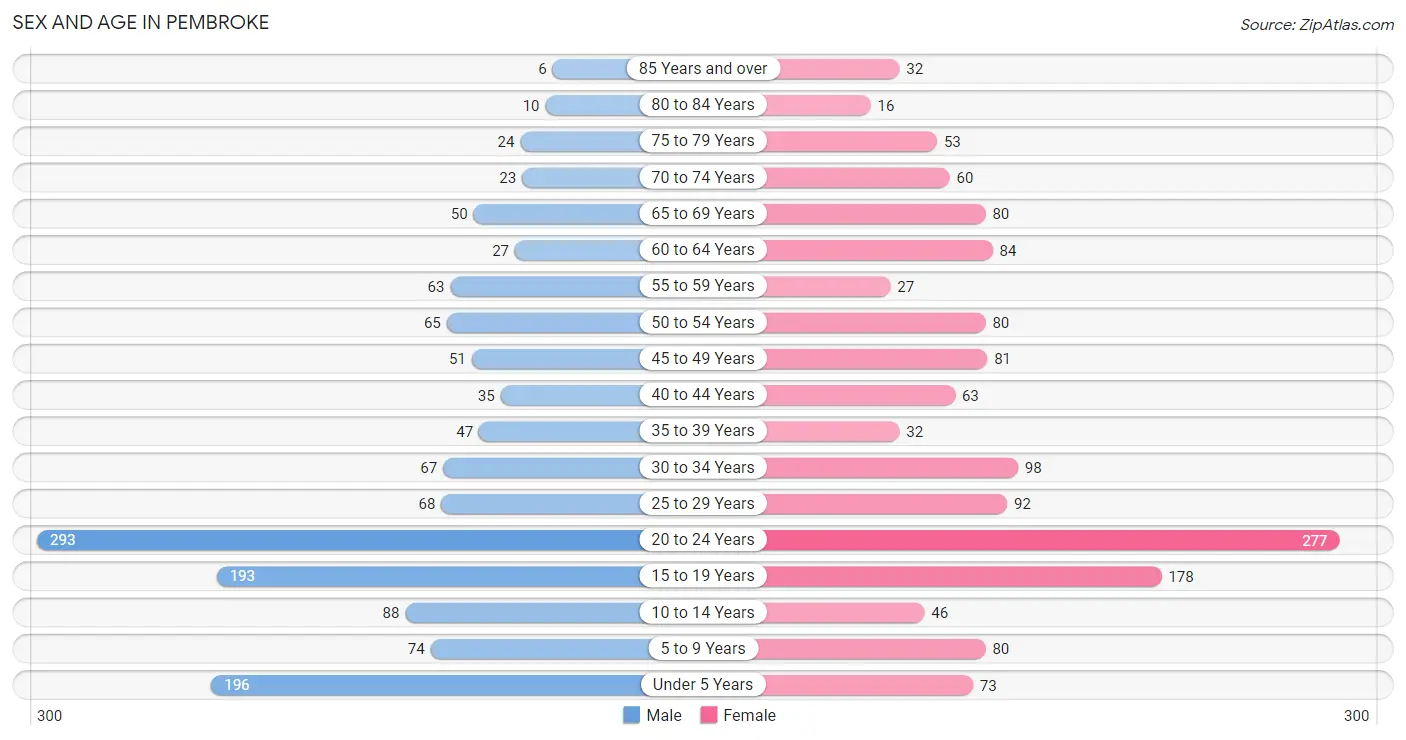
The most populous age groups in Pembroke are 20 to 24 Years (293 | 21.2%) for men and 20 to 24 Years (277 | 19.1%) for women.
| Age Bracket | Male | Female |
| Under 5 Years | 196 (14.2%) | 73 (5.0%) |
| 5 to 9 Years | 74 (5.4%) | 80 (5.5%) |
| 10 to 14 Years | 88 (6.4%) | 46 (3.2%) |
| 15 to 19 Years | 193 (14.0%) | 178 (12.3%) |
| 20 to 24 Years | 293 (21.2%) | 277 (19.1%) |
| 25 to 29 Years | 68 (4.9%) | 92 (6.3%) |
| 30 to 34 Years | 67 (4.9%) | 98 (6.8%) |
| 35 to 39 Years | 47 (3.4%) | 32 (2.2%) |
| 40 to 44 Years | 35 (2.5%) | 63 (4.3%) |
| 45 to 49 Years | 51 (3.7%) | 81 (5.6%) |
| 50 to 54 Years | 65 (4.7%) | 80 (5.5%) |
| 55 to 59 Years | 63 (4.6%) | 27 (1.9%) |
| 60 to 64 Years | 27 (2.0%) | 84 (5.8%) |
| 65 to 69 Years | 50 (3.6%) | 80 (5.5%) |
| 70 to 74 Years | 23 (1.7%) | 60 (4.1%) |
| 75 to 79 Years | 24 (1.7%) | 53 (3.6%) |
| 80 to 84 Years | 10 (0.7%) | 16 (1.1%) |
| 85 Years and over | 6 (0.4%) | 32 (2.2%) |
| Total | 1,380 (100.0%) | 1,452 (100.0%) |
Families and Households in Pembroke
Median Family Size in Pembroke
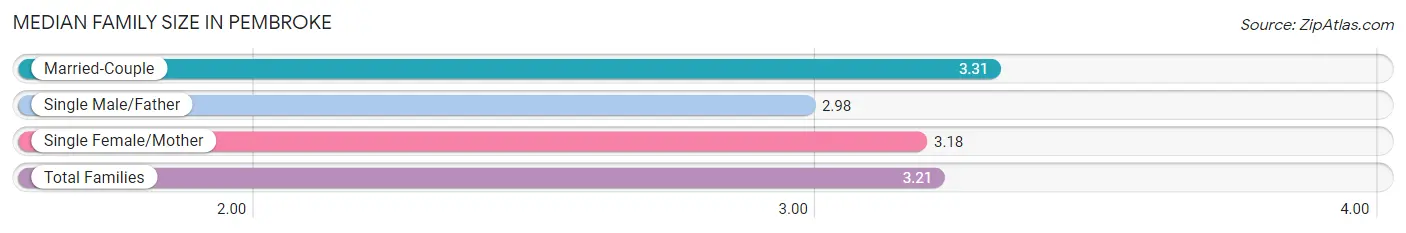
The median family size in Pembroke is 3.21 persons per family, with married-couple families (171 | 33.1%) accounting for the largest median family size of 3.31 persons per family. On the other hand, single male/father families (52 | 10.1%) represent the smallest median family size with 2.98 persons per family.
| Family Type | # Families | Family Size |
| Married-Couple | 171 (33.1%) | 3.31 |
| Single Male/Father | 52 (10.1%) | 2.98 |
| Single Female/Mother | 294 (56.9%) | 3.18 |
| Total Families | 517 (100.0%) | 3.21 |
Median Household Size in Pembroke
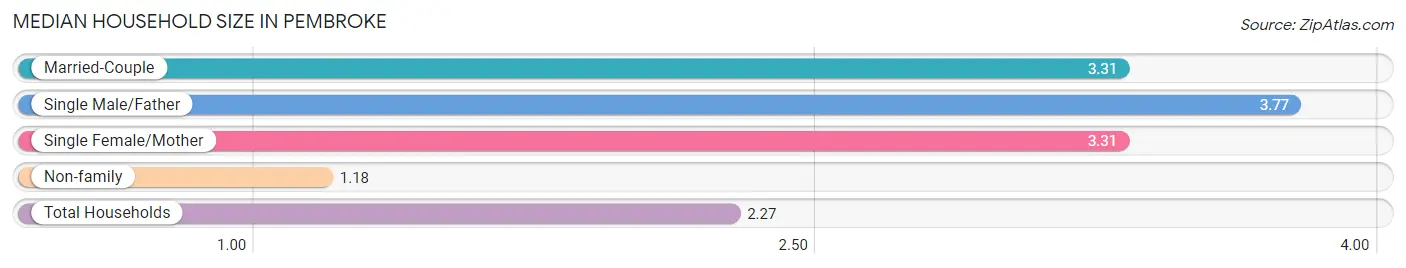
The median household size in Pembroke is 2.27 persons per household, with single male/father households (52 | 5.0%) accounting for the largest median household size of 3.77 persons per household. non-family households (520 | 50.1%) represent the smallest median household size with 1.18 persons per household.
| Household Type | # Households | Household Size |
| Married-Couple | 171 (16.5%) | 3.31 |
| Single Male/Father | 52 (5.0%) | 3.77 |
| Single Female/Mother | 294 (28.3%) | 3.31 |
| Non-family | 520 (50.1%) | 1.18 |
| Total Households | 1,037 (100.0%) | 2.27 |
Household Size by Marriage Status in Pembroke
Out of a total of 1,037 households in Pembroke, 517 (49.9%) are family households, while 520 (50.1%) are nonfamily households. The most numerous type of family households are 2-person households, comprising 177, and the most common type of nonfamily households are 1-person households, comprising 462.
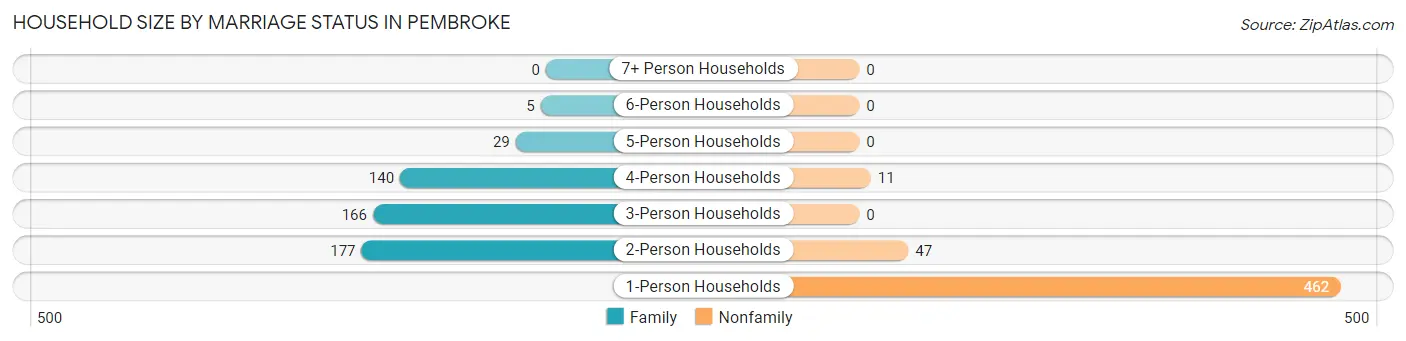
| Household Size | Family Households | Nonfamily Households |
| 1-Person Households | - | 462 (44.6%) |
| 2-Person Households | 177 (17.1%) | 47 (4.5%) |
| 3-Person Households | 166 (16.0%) | 0 (0.0%) |
| 4-Person Households | 140 (13.5%) | 11 (1.1%) |
| 5-Person Households | 29 (2.8%) | 0 (0.0%) |
| 6-Person Households | 5 (0.5%) | 0 (0.0%) |
| 7+ Person Households | 0 (0.0%) | 0 (0.0%) |
| Total | 517 (49.9%) | 520 (50.1%) |
Female Fertility in Pembroke
Fertility by Age in Pembroke
Average fertility rate in Pembroke is 26.0 births per 1,000 women. Women in the age bracket of 20 to 34 years have the highest fertility rate with 47.0 births per 1,000 women. Women in the age bracket of 20 to 34 years acount for 100.0% of all women with births.
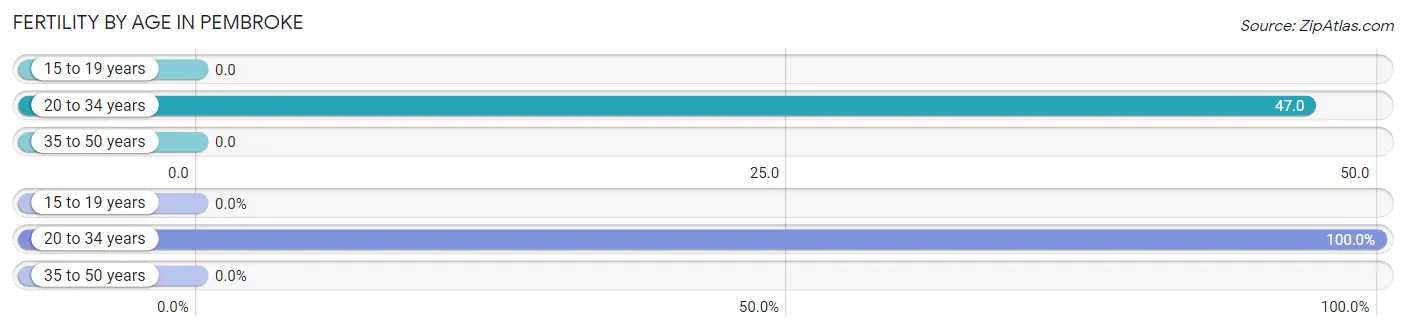
| Age Bracket | Women with Births | Births / 1,000 Women |
| 15 to 19 years | 0 (0.0%) | 0.0 |
| 20 to 34 years | 22 (100.0%) | 47.0 |
| 35 to 50 years | 0 (0.0%) | 0.0 |
| Total | 22 (100.0%) | 26.0 |
Fertility by Age by Marriage Status in Pembroke
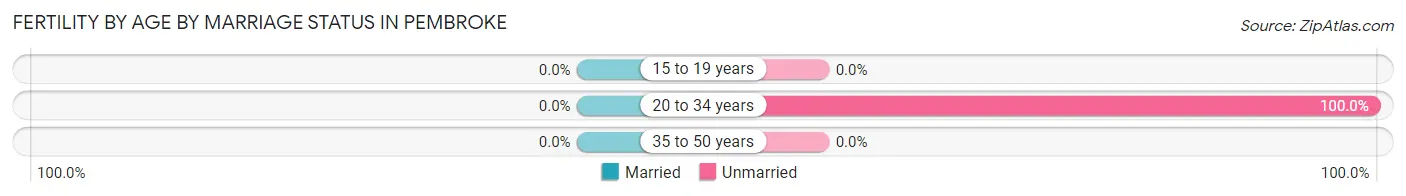
| Age Bracket | Married | Unmarried |
| 15 to 19 years | 0 (0.0%) | 0 (0.0%) |
| 20 to 34 years | 0 (0.0%) | 22 (100.0%) |
| 35 to 50 years | 0 (0.0%) | 0 (0.0%) |
| Total | 0 (0.0%) | 22 (100.0%) |
Fertility by Education in Pembroke
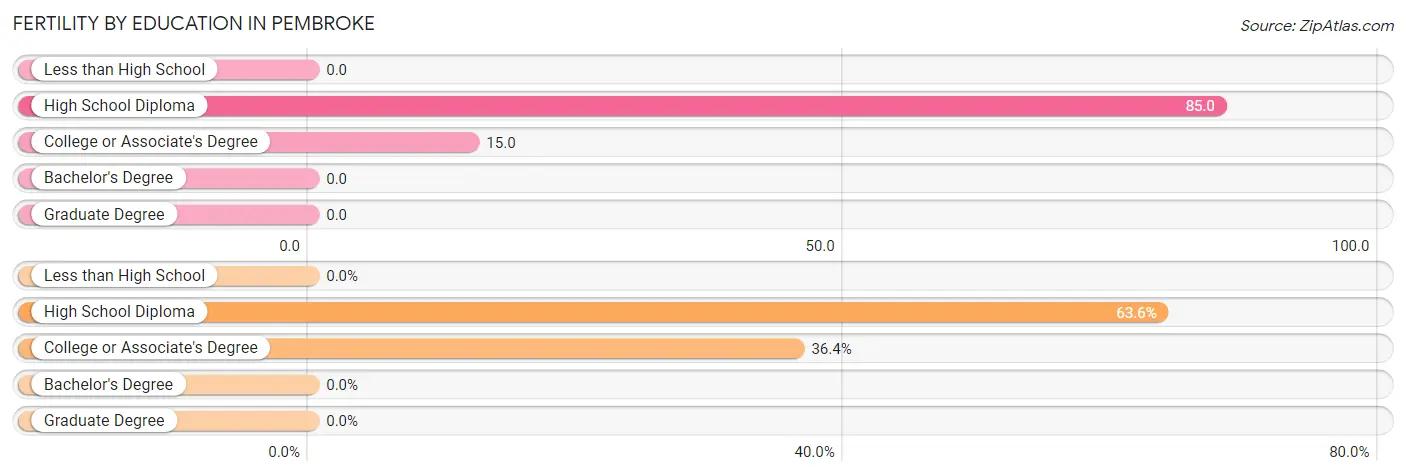
| Educational Attainment | Women with Births | Births / 1,000 Women |
| Less than High School | 0 (0.0%) | 0.0 |
| High School Diploma | 14 (63.6%) | 85.0 |
| College or Associate's Degree | 8 (36.4%) | 15.0 |
| Bachelor's Degree | 0 (0.0%) | 0.0 |
| Graduate Degree | 0 (0.0%) | 0.0 |
| Total | 22 (100.0%) | 26.0 |
Fertility by Education by Marriage Status in Pembroke
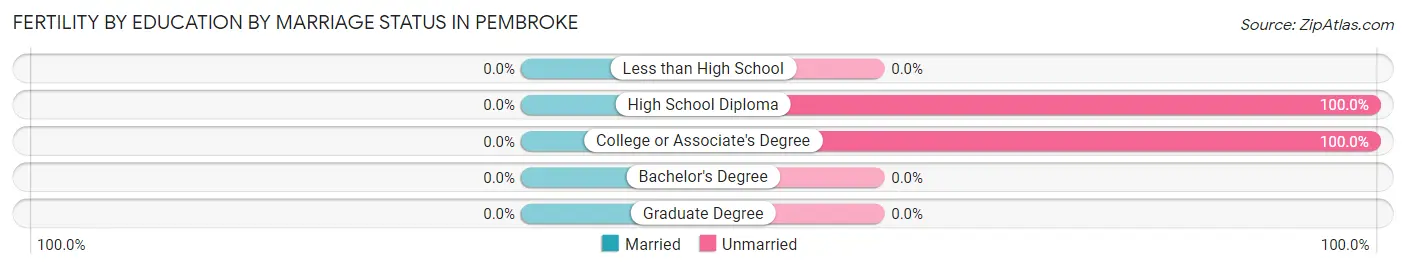
| Educational Attainment | Married | Unmarried |
| Less than High School | 0 (0.0%) | 0 (0.0%) |
| High School Diploma | 0 (0.0%) | 14 (100.0%) |
| College or Associate's Degree | 0 (0.0%) | 8 (100.0%) |
| Bachelor's Degree | 0 (0.0%) | 0 (0.0%) |
| Graduate Degree | 0 (0.0%) | 0 (0.0%) |
| Total | 0 (0.0%) | 22 (100.0%) |
Employment Characteristics in Pembroke
Employment by Class of Employer in Pembroke
Among the 819 employed individuals in Pembroke, private company employees (538 | 65.7%), state government employees (97 | 11.8%), and local government employees (57 | 7.0%) make up the most common classes of employment.
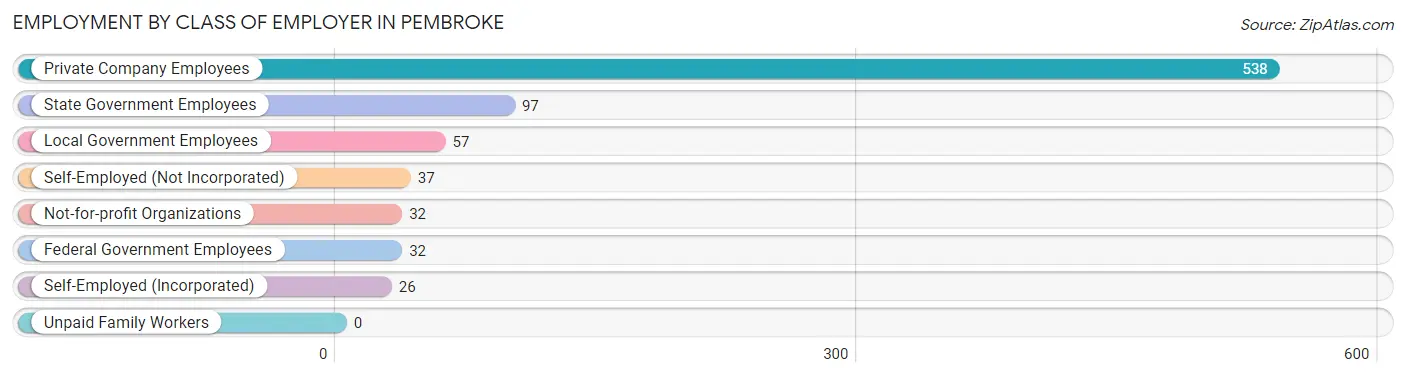
| Employer Class | # Employees | % Employees |
| Private Company Employees | 538 | 65.7% |
| Self-Employed (Incorporated) | 26 | 3.2% |
| Self-Employed (Not Incorporated) | 37 | 4.5% |
| Not-for-profit Organizations | 32 | 3.9% |
| Local Government Employees | 57 | 7.0% |
| State Government Employees | 97 | 11.8% |
| Federal Government Employees | 32 | 3.9% |
| Unpaid Family Workers | 0 | 0.0% |
| Total | 819 | 100.0% |
Employment Status by Age in Pembroke
According to the labor force statistics for Pembroke, out of the total population over 16 years of age (2,267), 38.6% or 875 individuals are in the labor force, with 4.8% or 42 of them unemployed. The age group with the highest labor force participation rate is 30 to 34 years, with 83.6% or 138 individuals in the labor force. Within the labor force, the 30 to 34 years age range has the highest percentage of unemployed individuals, with 11.6% or 16 of them being unemployed.
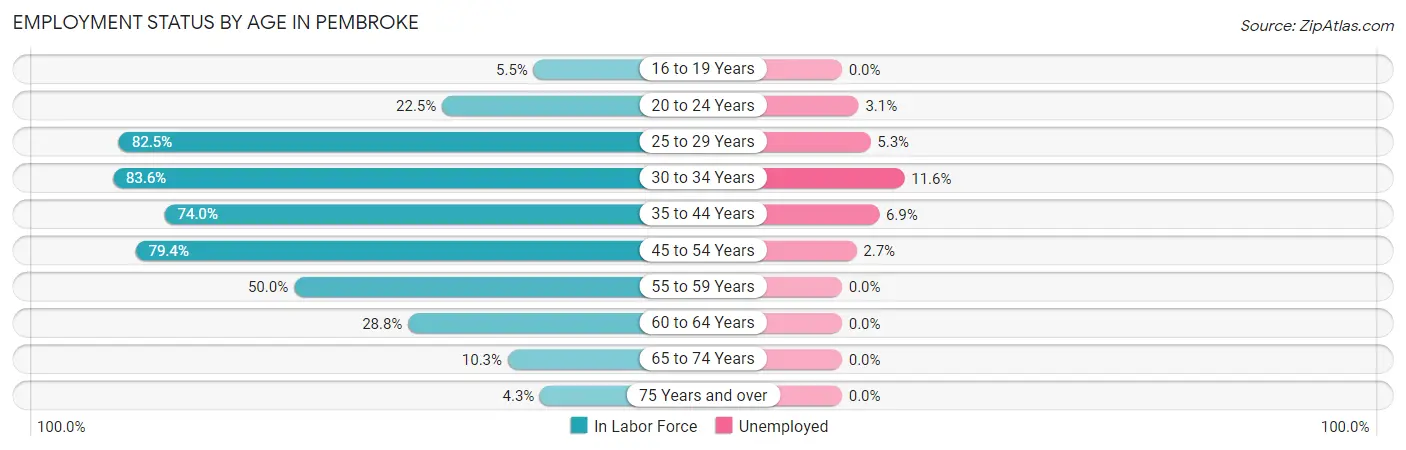
| Age Bracket | In Labor Force | Unemployed |
| 16 to 19 Years | 20 (5.5%) | 0 (0.0%) |
| 20 to 24 Years | 128 (22.5%) | 4 (3.1%) |
| 25 to 29 Years | 132 (82.5%) | 7 (5.3%) |
| 30 to 34 Years | 138 (83.6%) | 16 (11.6%) |
| 35 to 44 Years | 131 (74.0%) | 9 (6.9%) |
| 45 to 54 Years | 220 (79.4%) | 6 (2.7%) |
| 55 to 59 Years | 45 (50.0%) | 0 (0.0%) |
| 60 to 64 Years | 32 (28.8%) | 0 (0.0%) |
| 65 to 74 Years | 22 (10.3%) | 0 (0.0%) |
| 75 Years and over | 6 (4.3%) | 0 (0.0%) |
| Total | 875 (38.6%) | 42 (4.8%) |
Employment Status by Educational Attainment in Pembroke
According to labor force statistics for Pembroke, 71.2% of individuals (698) out of the total population between 25 and 64 years of age (980) are in the labor force, with 5.4% or 38 of them being unemployed. The group with the highest labor force participation rate are those with the educational attainment of bachelor's degree or higher, with 89.5% or 162 individuals in the labor force. Within the labor force, individuals with high school diploma education have the highest percentage of unemployment, with 15.8% or 28 of them being unemployed.
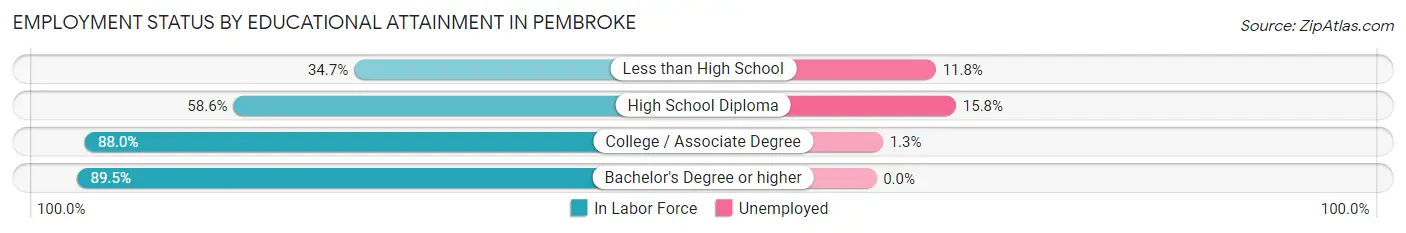
| Educational Attainment | In Labor Force | Unemployed |
| Less than High School | 51 (34.7%) | 17 (11.8%) |
| High School Diploma | 177 (58.6%) | 48 (15.8%) |
| College / Associate Degree | 308 (88.0%) | 5 (1.3%) |
| Bachelor's Degree or higher | 162 (89.5%) | 0 (0.0%) |
| Total | 698 (71.2%) | 53 (5.4%) |
Employment Occupations by Sex in Pembroke
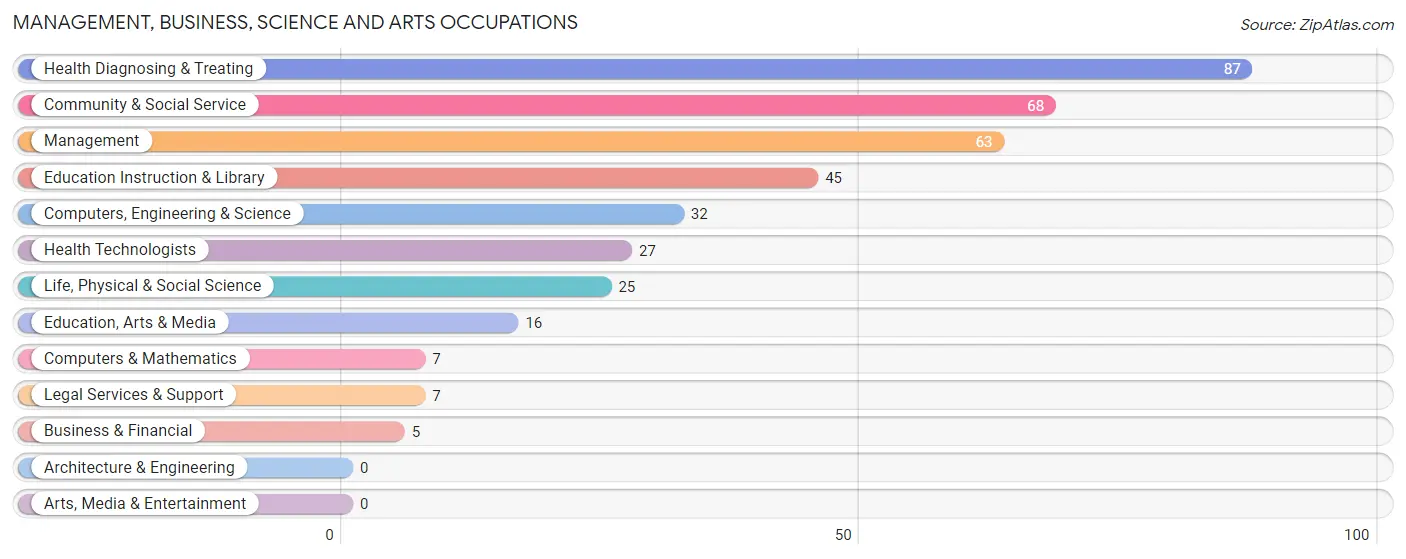
Management, Business, Science and Arts Occupations
The most common Management, Business, Science and Arts occupations in Pembroke are Health Diagnosing & Treating (87 | 10.5%), Community & Social Service (68 | 8.2%), Management (63 | 7.6%), Education Instruction & Library (45 | 5.4%), and Computers, Engineering & Science (32 | 3.8%).
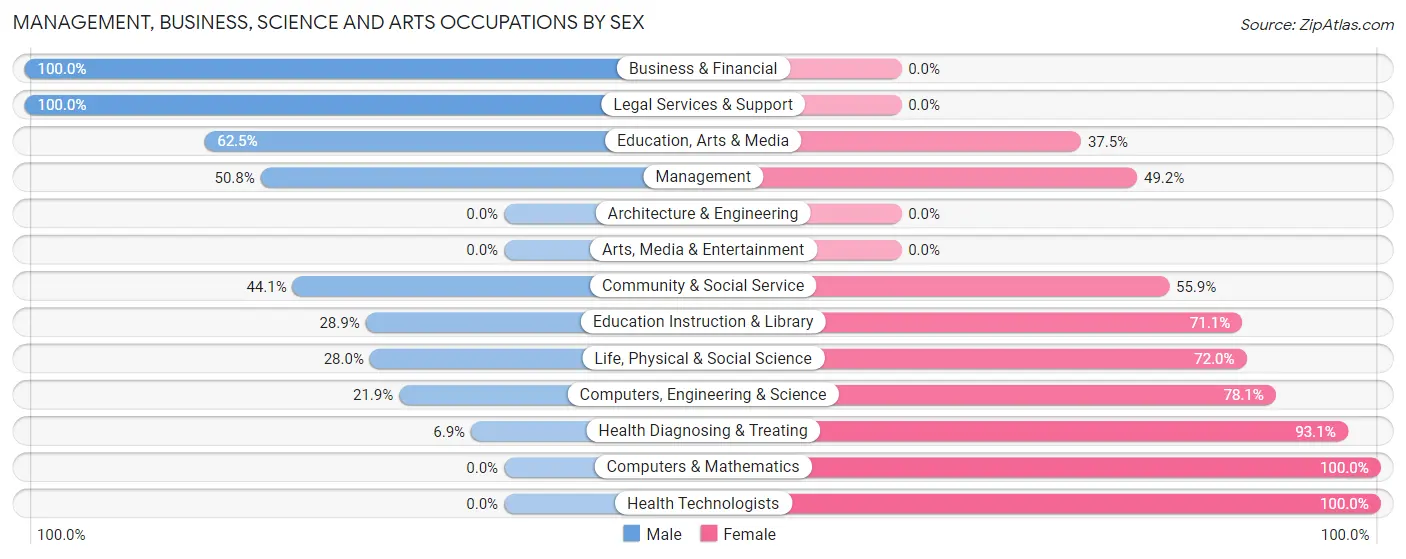
Management, Business, Science and Arts Occupations by Sex
Within the Management, Business, Science and Arts occupations in Pembroke, the most male-oriented occupations are Business & Financial (100.0%), Legal Services & Support (100.0%), and Education, Arts & Media (62.5%), while the most female-oriented occupations are Computers & Mathematics (100.0%), Health Technologists (100.0%), and Health Diagnosing & Treating (93.1%).
| Occupation | Male | Female |
| Management | 32 (50.8%) | 31 (49.2%) |
| Business & Financial | 5 (100.0%) | 0 (0.0%) |
| Computers, Engineering & Science | 7 (21.9%) | 25 (78.1%) |
| Computers & Mathematics | 0 (0.0%) | 7 (100.0%) |
| Architecture & Engineering | 0 (0.0%) | 0 (0.0%) |
| Life, Physical & Social Science | 7 (28.0%) | 18 (72.0%) |
| Community & Social Service | 30 (44.1%) | 38 (55.9%) |
| Education, Arts & Media | 10 (62.5%) | 6 (37.5%) |
| Legal Services & Support | 7 (100.0%) | 0 (0.0%) |
| Education Instruction & Library | 13 (28.9%) | 32 (71.1%) |
| Arts, Media & Entertainment | 0 (0.0%) | 0 (0.0%) |
| Health Diagnosing & Treating | 6 (6.9%) | 81 (93.1%) |
| Health Technologists | 0 (0.0%) | 27 (100.0%) |
| Total (Category) | 80 (31.4%) | 175 (68.6%) |
| Total (Overall) | 340 (40.9%) | 492 (59.1%) |
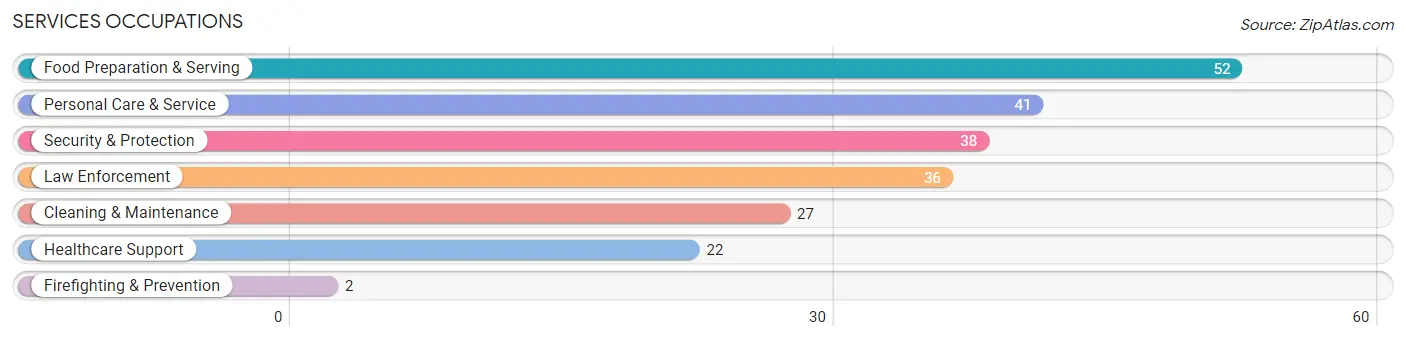
Services Occupations
The most common Services occupations in Pembroke are Food Preparation & Serving (52 | 6.2%), Personal Care & Service (41 | 4.9%), Security & Protection (38 | 4.6%), Law Enforcement (36 | 4.3%), and Cleaning & Maintenance (27 | 3.3%).
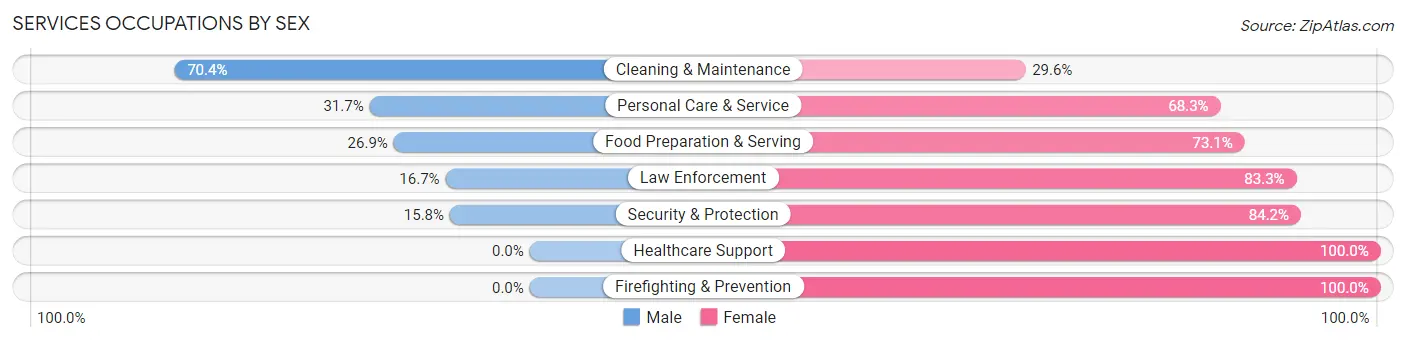
Services Occupations by Sex
Within the Services occupations in Pembroke, the most male-oriented occupations are Cleaning & Maintenance (70.4%), Personal Care & Service (31.7%), and Food Preparation & Serving (26.9%), while the most female-oriented occupations are Healthcare Support (100.0%), Firefighting & Prevention (100.0%), and Security & Protection (84.2%).
| Occupation | Male | Female |
| Healthcare Support | 0 (0.0%) | 22 (100.0%) |
| Security & Protection | 6 (15.8%) | 32 (84.2%) |
| Firefighting & Prevention | 0 (0.0%) | 2 (100.0%) |
| Law Enforcement | 6 (16.7%) | 30 (83.3%) |
| Food Preparation & Serving | 14 (26.9%) | 38 (73.1%) |
| Cleaning & Maintenance | 19 (70.4%) | 8 (29.6%) |
| Personal Care & Service | 13 (31.7%) | 28 (68.3%) |
| Total (Category) | 52 (28.9%) | 128 (71.1%) |
| Total (Overall) | 340 (40.9%) | 492 (59.1%) |
Sales and Office Occupations
The most common Sales and Office occupations in Pembroke are Sales & Related (98 | 11.8%), and Office & Administration (95 | 11.4%).
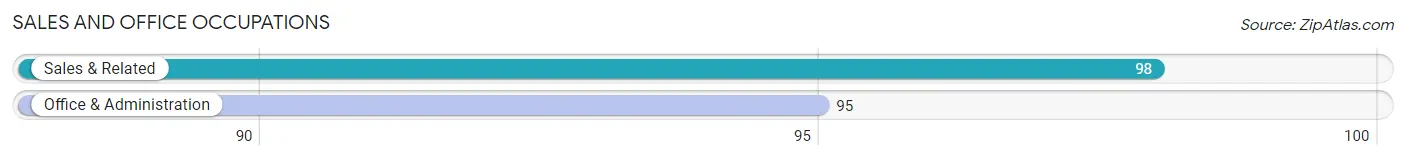
Sales and Office Occupations by Sex
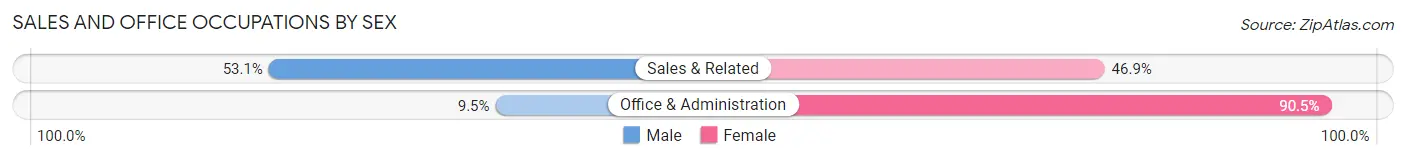
| Occupation | Male | Female |
| Sales & Related | 52 (53.1%) | 46 (46.9%) |
| Office & Administration | 9 (9.5%) | 86 (90.5%) |
| Total (Category) | 61 (31.6%) | 132 (68.4%) |
| Total (Overall) | 340 (40.9%) | 492 (59.1%) |
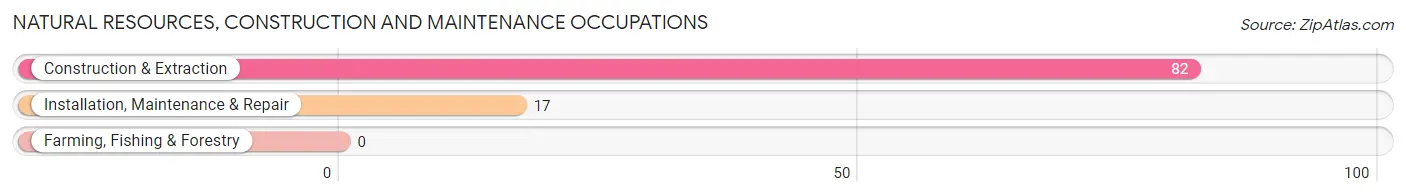
Natural Resources, Construction and Maintenance Occupations
The most common Natural Resources, Construction and Maintenance occupations in Pembroke are Construction & Extraction (82 | 9.9%), and Installation, Maintenance & Repair (17 | 2.0%).
Natural Resources, Construction and Maintenance Occupations by Sex
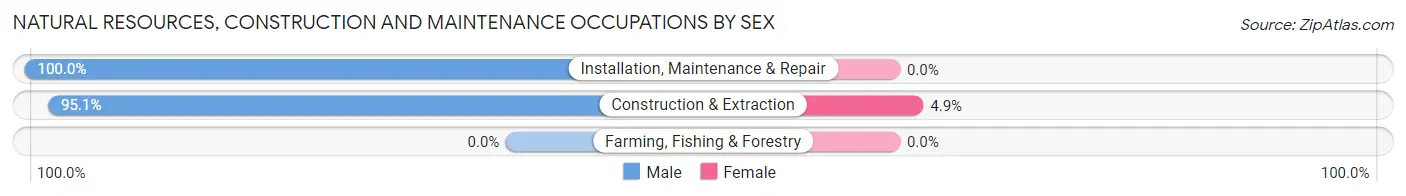
| Occupation | Male | Female |
| Farming, Fishing & Forestry | 0 (0.0%) | 0 (0.0%) |
| Construction & Extraction | 78 (95.1%) | 4 (4.9%) |
| Installation, Maintenance & Repair | 17 (100.0%) | 0 (0.0%) |
| Total (Category) | 95 (96.0%) | 4 (4.0%) |
| Total (Overall) | 340 (40.9%) | 492 (59.1%) |
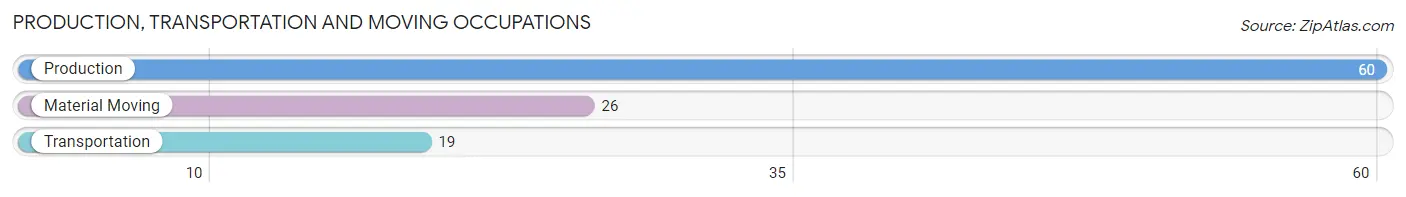
Production, Transportation and Moving Occupations
The most common Production, Transportation and Moving occupations in Pembroke are Production (60 | 7.2%), Material Moving (26 | 3.1%), and Transportation (19 | 2.3%).
Production, Transportation and Moving Occupations by Sex
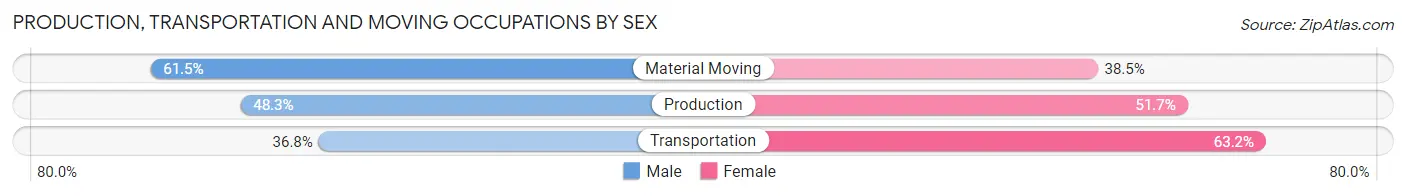
| Occupation | Male | Female |
| Production | 29 (48.3%) | 31 (51.7%) |
| Transportation | 7 (36.8%) | 12 (63.2%) |
| Material Moving | 16 (61.5%) | 10 (38.5%) |
| Total (Category) | 52 (49.5%) | 53 (50.5%) |
| Total (Overall) | 340 (40.9%) | 492 (59.1%) |
Employment Industries by Sex in Pembroke
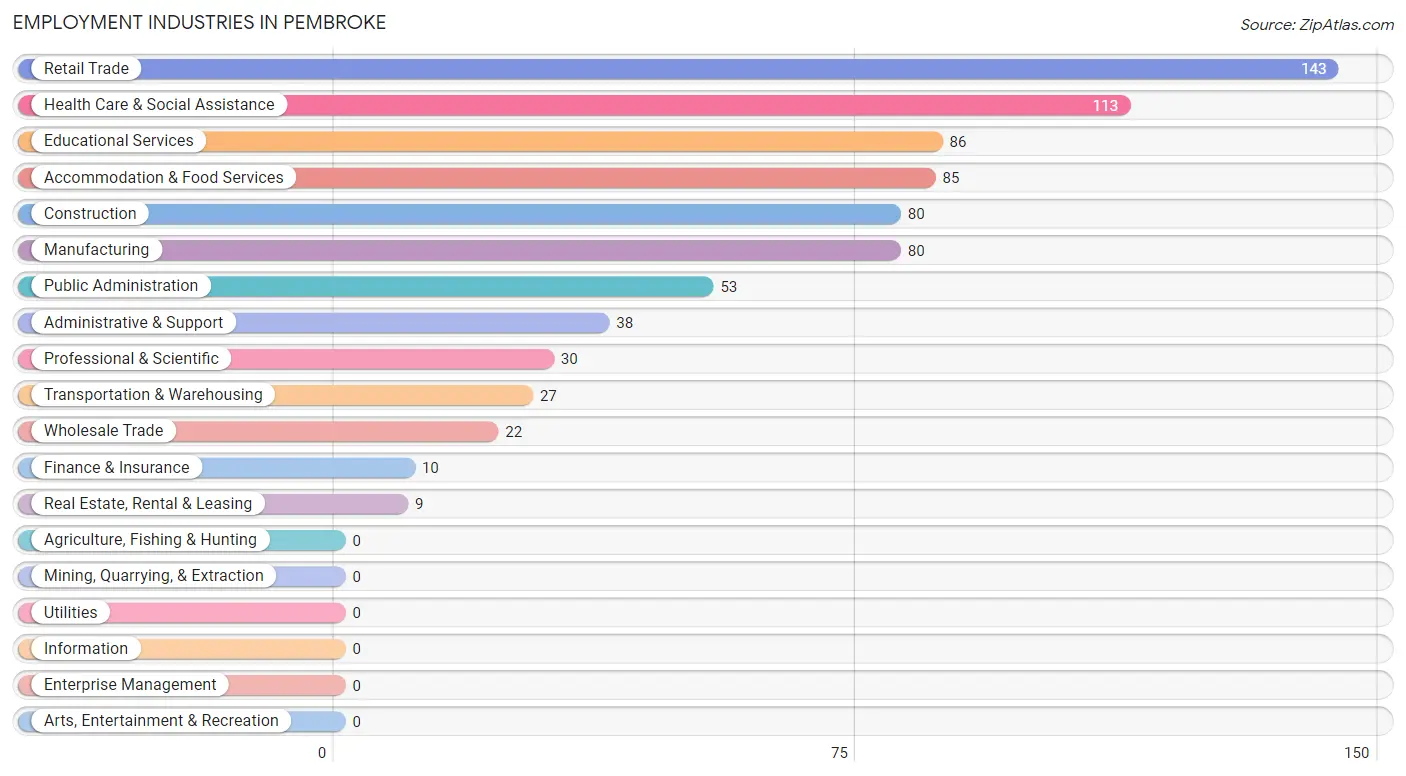
Employment Industries in Pembroke
The major employment industries in Pembroke include Retail Trade (143 | 17.2%), Health Care & Social Assistance (113 | 13.6%), Educational Services (86 | 10.3%), Accommodation & Food Services (85 | 10.2%), and Construction (80 | 9.6%).
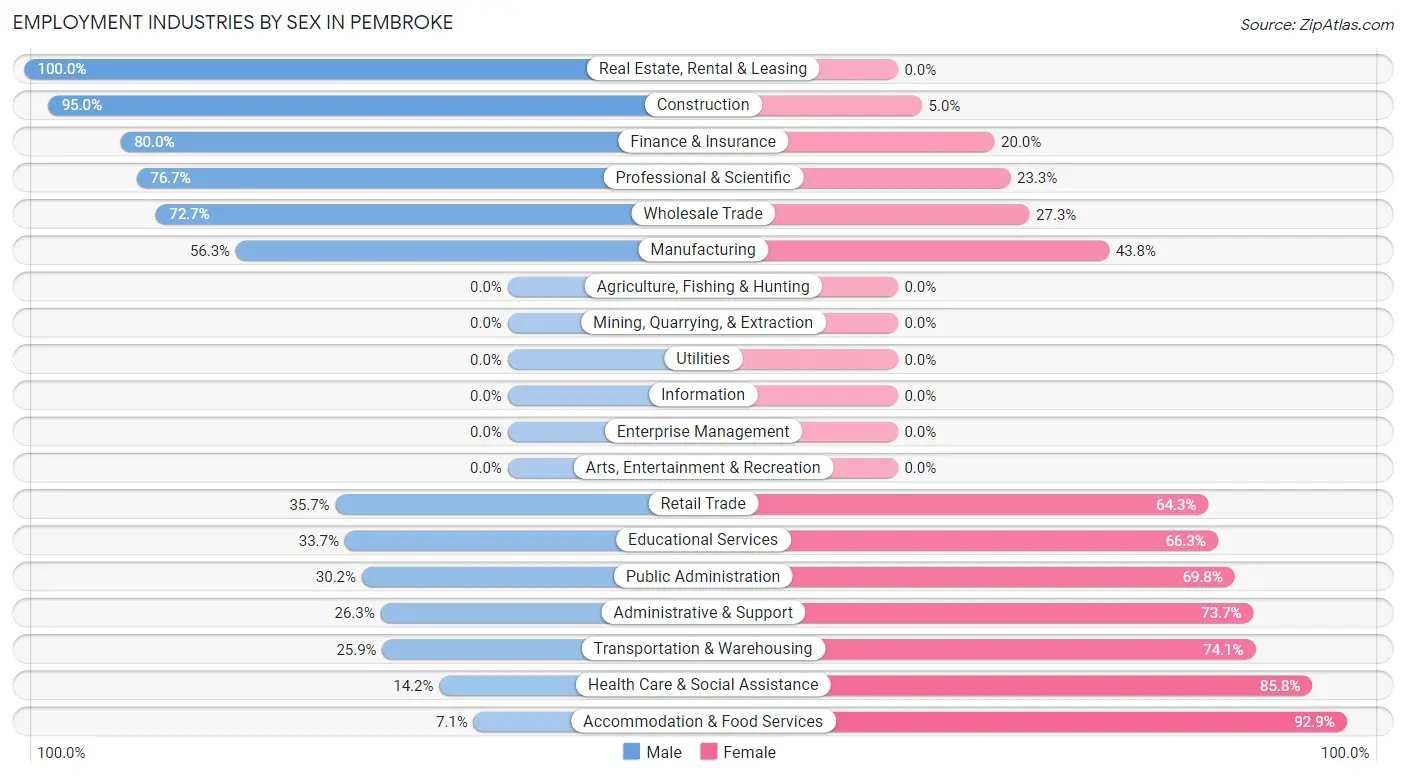
Employment Industries by Sex in Pembroke
The Pembroke industries that see more men than women are Real Estate, Rental & Leasing (100.0%), Construction (95.0%), and Finance & Insurance (80.0%), whereas the industries that tend to have a higher number of women are Accommodation & Food Services (92.9%), Health Care & Social Assistance (85.8%), and Transportation & Warehousing (74.1%).
| Industry | Male | Female |
| Agriculture, Fishing & Hunting | 0 (0.0%) | 0 (0.0%) |
| Mining, Quarrying, & Extraction | 0 (0.0%) | 0 (0.0%) |
| Construction | 76 (95.0%) | 4 (5.0%) |
| Manufacturing | 45 (56.2%) | 35 (43.8%) |
| Wholesale Trade | 16 (72.7%) | 6 (27.3%) |
| Retail Trade | 51 (35.7%) | 92 (64.3%) |
| Transportation & Warehousing | 7 (25.9%) | 20 (74.1%) |
| Utilities | 0 (0.0%) | 0 (0.0%) |
| Information | 0 (0.0%) | 0 (0.0%) |
| Finance & Insurance | 8 (80.0%) | 2 (20.0%) |
| Real Estate, Rental & Leasing | 9 (100.0%) | 0 (0.0%) |
| Professional & Scientific | 23 (76.7%) | 7 (23.3%) |
| Enterprise Management | 0 (0.0%) | 0 (0.0%) |
| Administrative & Support | 10 (26.3%) | 28 (73.7%) |
| Educational Services | 29 (33.7%) | 57 (66.3%) |
| Health Care & Social Assistance | 16 (14.2%) | 97 (85.8%) |
| Arts, Entertainment & Recreation | 0 (0.0%) | 0 (0.0%) |
| Accommodation & Food Services | 6 (7.1%) | 79 (92.9%) |
| Public Administration | 16 (30.2%) | 37 (69.8%) |
| Total | 340 (40.9%) | 492 (59.1%) |
Education in Pembroke
School Enrollment in Pembroke
The most common levels of schooling among the 1,211 students in Pembroke are college / undergraduate (747 | 61.7%), high school (138 | 11.4%), and middle school (117 | 9.7%).
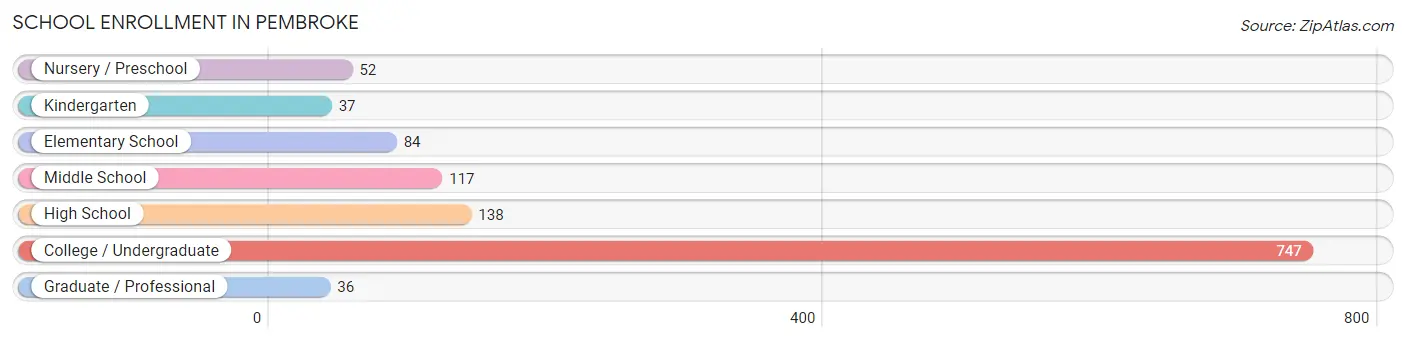
| School Level | # Students | % Students |
| Nursery / Preschool | 52 | 4.3% |
| Kindergarten | 37 | 3.1% |
| Elementary School | 84 | 6.9% |
| Middle School | 117 | 9.7% |
| High School | 138 | 11.4% |
| College / Undergraduate | 747 | 61.7% |
| Graduate / Professional | 36 | 3.0% |
| Total | 1,211 | 100.0% |
School Enrollment by Age by Funding Source in Pembroke
Out of a total of 1,211 students who are enrolled in schools in Pembroke, 128 (10.6%) attend a private institution, while the remaining 1,083 (89.4%) are enrolled in public schools. The age group of 25 to 34 year olds has the highest likelihood of being enrolled in private schools, with 16 (25.0% in the age bracket) enrolled. Conversely, the age group of 3 to 4 year olds has the lowest likelihood of being enrolled in a private school, with 27 (100.0% in the age bracket) attending a public institution.
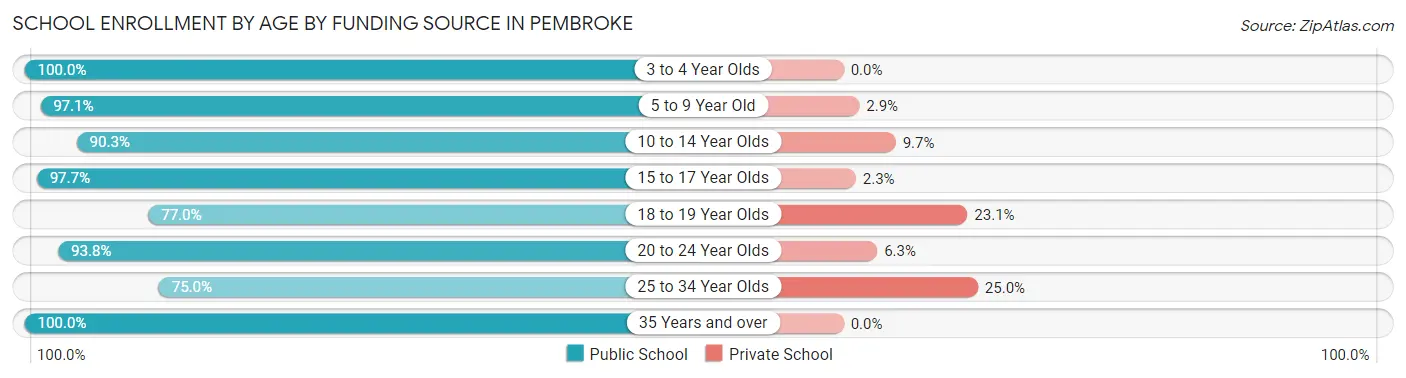
| Age Bracket | Public School | Private School |
| 3 to 4 Year Olds | 27 (100.0%) | 0 (0.0%) |
| 5 to 9 Year Old | 133 (97.1%) | 4 (2.9%) |
| 10 to 14 Year Olds | 121 (90.3%) | 13 (9.7%) |
| 15 to 17 Year Olds | 86 (97.7%) | 2 (2.3%) |
| 18 to 19 Year Olds | 217 (76.9%) | 65 (23.1%) |
| 20 to 24 Year Olds | 420 (93.8%) | 28 (6.2%) |
| 25 to 34 Year Olds | 48 (75.0%) | 16 (25.0%) |
| 35 Years and over | 31 (100.0%) | 0 (0.0%) |
| Total | 1,083 (89.4%) | 128 (10.6%) |
Educational Attainment by Field of Study in Pembroke
Education (52 | 20.4%), science & technology (42 | 16.5%), arts & humanities (38 | 14.9%), social sciences (29 | 11.4%), and business (27 | 10.6%) are the most common fields of study among 255 individuals in Pembroke who have obtained a bachelor's degree or higher.
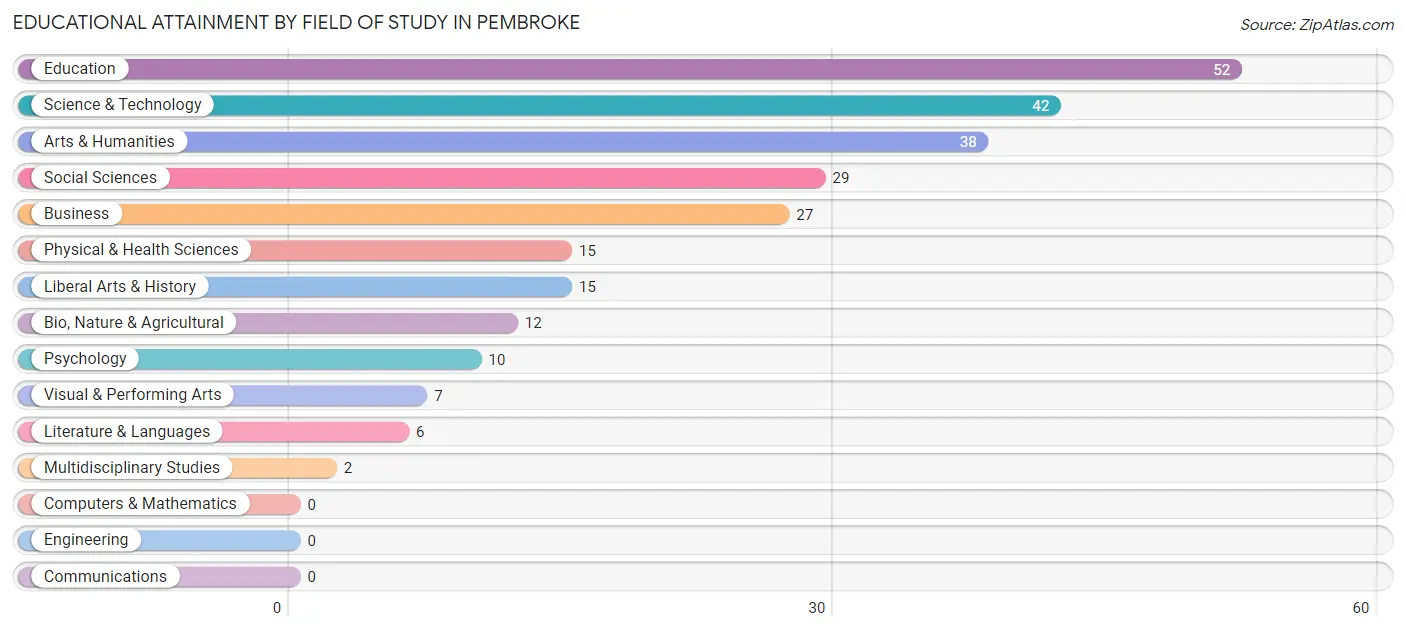
| Field of Study | # Graduates | % Graduates |
| Computers & Mathematics | 0 | 0.0% |
| Bio, Nature & Agricultural | 12 | 4.7% |
| Physical & Health Sciences | 15 | 5.9% |
| Psychology | 10 | 3.9% |
| Social Sciences | 29 | 11.4% |
| Engineering | 0 | 0.0% |
| Multidisciplinary Studies | 2 | 0.8% |
| Science & Technology | 42 | 16.5% |
| Business | 27 | 10.6% |
| Education | 52 | 20.4% |
| Literature & Languages | 6 | 2.4% |
| Liberal Arts & History | 15 | 5.9% |
| Visual & Performing Arts | 7 | 2.8% |
| Communications | 0 | 0.0% |
| Arts & Humanities | 38 | 14.9% |
| Total | 255 | 100.0% |
Transportation & Commute in Pembroke
Vehicle Availability by Sex in Pembroke
The most prevalent vehicle ownership categories in Pembroke are males with 2 vehicles (96, accounting for 31.6%) and females with 2 vehicles (146, making up 19.8%).
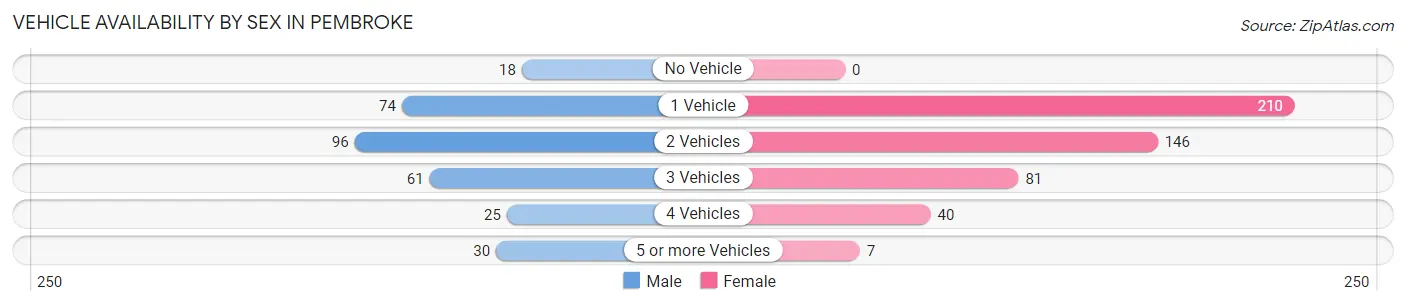
| Vehicles Available | Male | Female |
| No Vehicle | 18 (5.9%) | 0 (0.0%) |
| 1 Vehicle | 74 (24.3%) | 210 (43.4%) |
| 2 Vehicles | 96 (31.6%) | 146 (30.2%) |
| 3 Vehicles | 61 (20.1%) | 81 (16.7%) |
| 4 Vehicles | 25 (8.2%) | 40 (8.3%) |
| 5 or more Vehicles | 30 (9.9%) | 7 (1.5%) |
| Total | 304 (100.0%) | 484 (100.0%) |
Commute Time in Pembroke
The most frequently occuring commute durations in Pembroke are 5 to 9 minutes (190 commuters, 23.9%), 10 to 14 minutes (136 commuters, 17.1%), and 20 to 24 minutes (111 commuters, 14.0%).
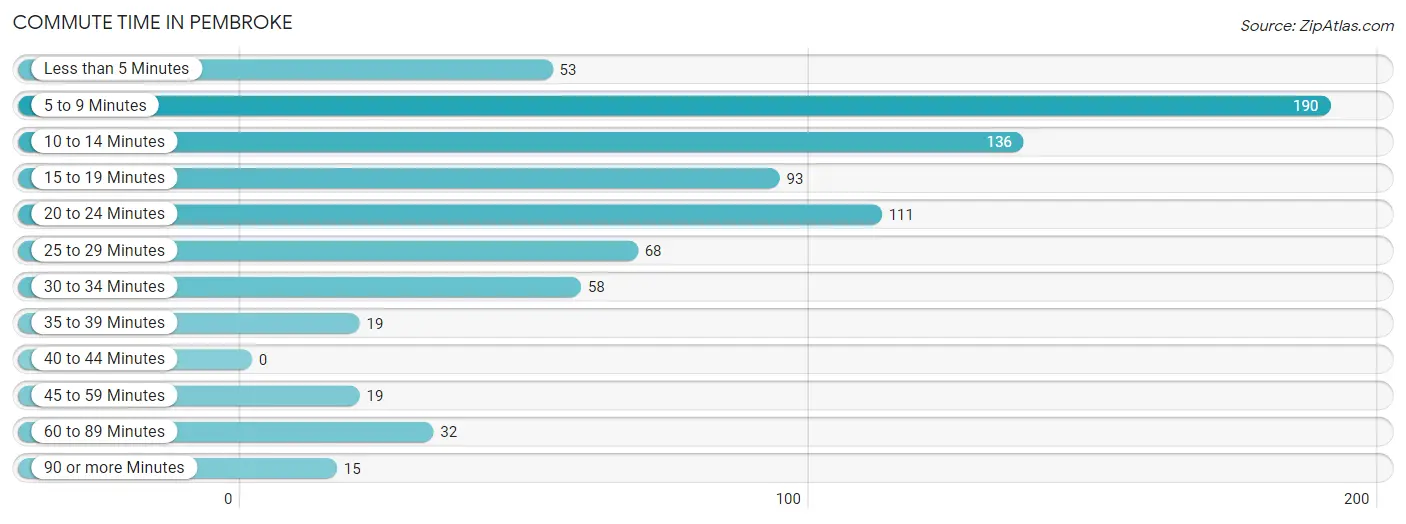
| Commute Time | # Commuters | % Commuters |
| Less than 5 Minutes | 53 | 6.7% |
| 5 to 9 Minutes | 190 | 23.9% |
| 10 to 14 Minutes | 136 | 17.1% |
| 15 to 19 Minutes | 93 | 11.7% |
| 20 to 24 Minutes | 111 | 14.0% |
| 25 to 29 Minutes | 68 | 8.6% |
| 30 to 34 Minutes | 58 | 7.3% |
| 35 to 39 Minutes | 19 | 2.4% |
| 40 to 44 Minutes | 0 | 0.0% |
| 45 to 59 Minutes | 19 | 2.4% |
| 60 to 89 Minutes | 32 | 4.0% |
| 90 or more Minutes | 15 | 1.9% |
Commute Time by Sex in Pembroke
The most common commute times in Pembroke are 10 to 14 minutes (68 commuters, 20.7%) for males and 5 to 9 minutes (133 commuters, 28.5%) for females.
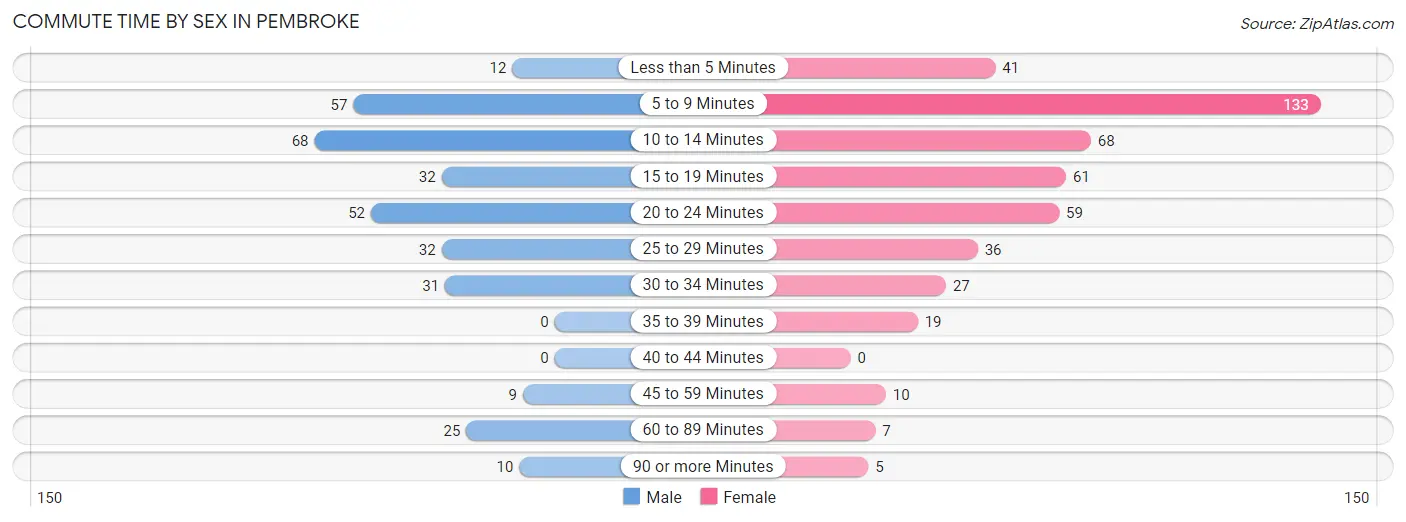
| Commute Time | Male | Female |
| Less than 5 Minutes | 12 (3.7%) | 41 (8.8%) |
| 5 to 9 Minutes | 57 (17.4%) | 133 (28.5%) |
| 10 to 14 Minutes | 68 (20.7%) | 68 (14.6%) |
| 15 to 19 Minutes | 32 (9.8%) | 61 (13.1%) |
| 20 to 24 Minutes | 52 (15.9%) | 59 (12.7%) |
| 25 to 29 Minutes | 32 (9.8%) | 36 (7.7%) |
| 30 to 34 Minutes | 31 (9.5%) | 27 (5.8%) |
| 35 to 39 Minutes | 0 (0.0%) | 19 (4.1%) |
| 40 to 44 Minutes | 0 (0.0%) | 0 (0.0%) |
| 45 to 59 Minutes | 9 (2.7%) | 10 (2.1%) |
| 60 to 89 Minutes | 25 (7.6%) | 7 (1.5%) |
| 90 or more Minutes | 10 (3.0%) | 5 (1.1%) |
Time of Departure to Work by Sex in Pembroke
The most frequent times of departure to work in Pembroke are 4:00 PM to 11:59 PM (49, 14.9%) for males and 7:30 AM to 7:59 AM (95, 20.4%) for females.
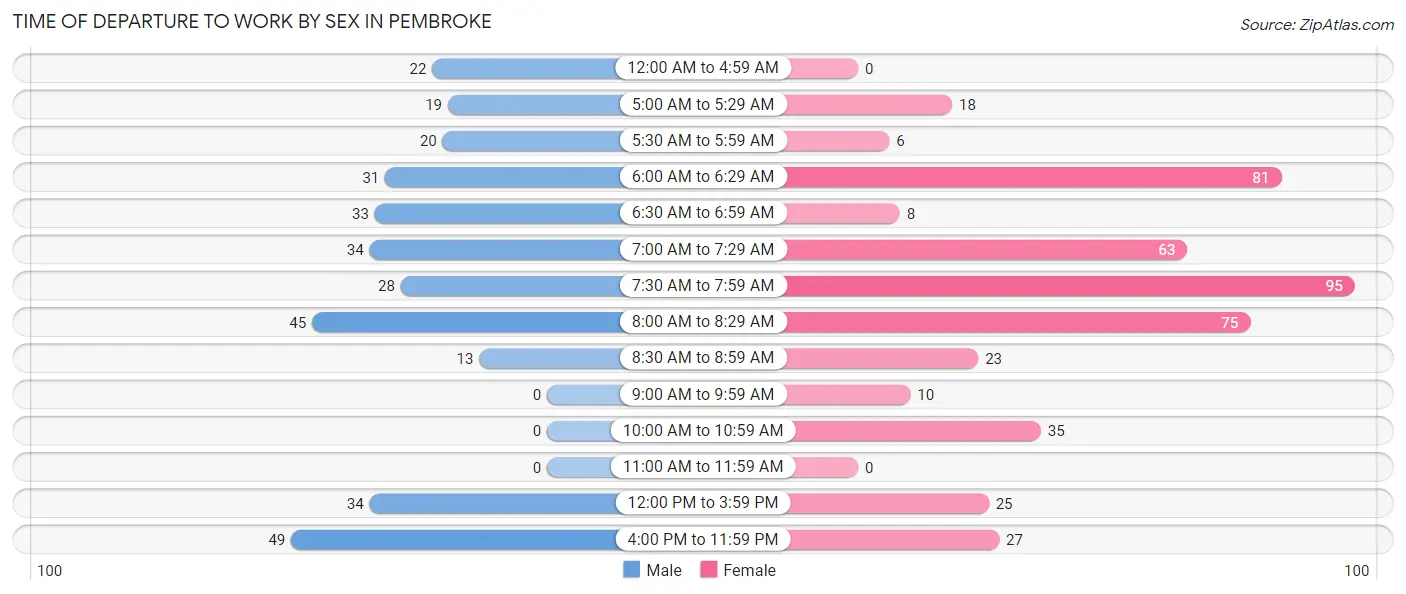
| Time of Departure | Male | Female |
| 12:00 AM to 4:59 AM | 22 (6.7%) | 0 (0.0%) |
| 5:00 AM to 5:29 AM | 19 (5.8%) | 18 (3.9%) |
| 5:30 AM to 5:59 AM | 20 (6.1%) | 6 (1.3%) |
| 6:00 AM to 6:29 AM | 31 (9.5%) | 81 (17.4%) |
| 6:30 AM to 6:59 AM | 33 (10.1%) | 8 (1.7%) |
| 7:00 AM to 7:29 AM | 34 (10.4%) | 63 (13.5%) |
| 7:30 AM to 7:59 AM | 28 (8.5%) | 95 (20.4%) |
| 8:00 AM to 8:29 AM | 45 (13.7%) | 75 (16.1%) |
| 8:30 AM to 8:59 AM | 13 (4.0%) | 23 (4.9%) |
| 9:00 AM to 9:59 AM | 0 (0.0%) | 10 (2.1%) |
| 10:00 AM to 10:59 AM | 0 (0.0%) | 35 (7.5%) |
| 11:00 AM to 11:59 AM | 0 (0.0%) | 0 (0.0%) |
| 12:00 PM to 3:59 PM | 34 (10.4%) | 25 (5.4%) |
| 4:00 PM to 11:59 PM | 49 (14.9%) | 27 (5.8%) |
| Total | 328 (100.0%) | 466 (100.0%) |
Housing Occupancy in Pembroke
Occupancy by Ownership in Pembroke
Of the total 1,037 dwellings in Pembroke, owner-occupied units account for 295 (28.4%), while renter-occupied units make up 742 (71.6%).
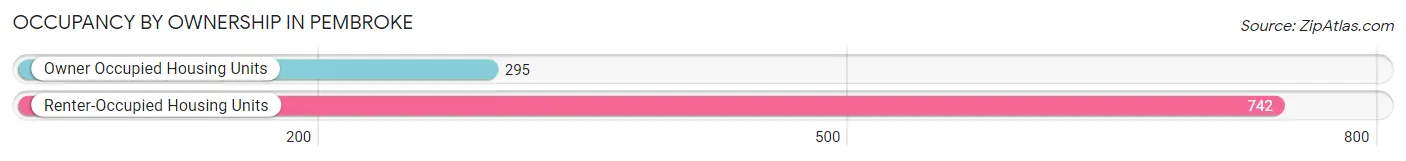
| Occupancy | # Housing Units | % Housing Units |
| Owner Occupied Housing Units | 295 | 28.4% |
| Renter-Occupied Housing Units | 742 | 71.6% |
| Total Occupied Housing Units | 1,037 | 100.0% |
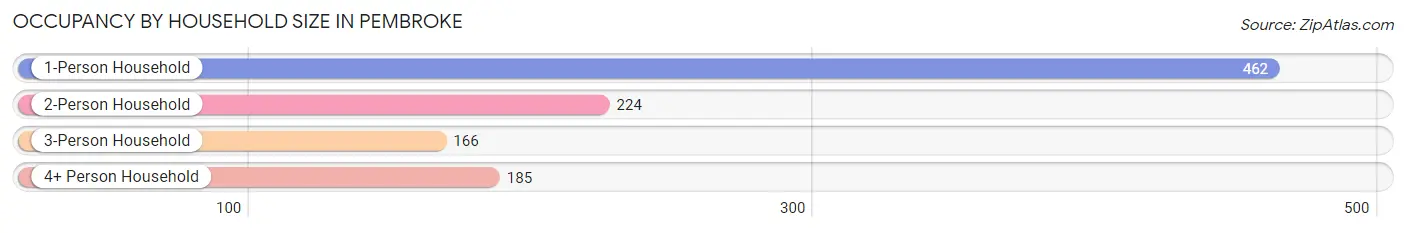
Occupancy by Household Size in Pembroke
| Household Size | # Housing Units | % Housing Units |
| 1-Person Household | 462 | 44.6% |
| 2-Person Household | 224 | 21.6% |
| 3-Person Household | 166 | 16.0% |
| 4+ Person Household | 185 | 17.8% |
| Total Housing Units | 1,037 | 100.0% |
Occupancy by Ownership by Household Size in Pembroke
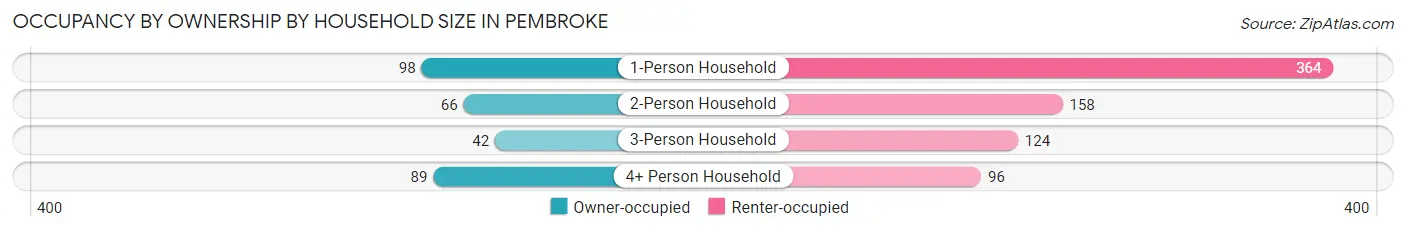
| Household Size | Owner-occupied | Renter-occupied |
| 1-Person Household | 98 (21.2%) | 364 (78.8%) |
| 2-Person Household | 66 (29.5%) | 158 (70.5%) |
| 3-Person Household | 42 (25.3%) | 124 (74.7%) |
| 4+ Person Household | 89 (48.1%) | 96 (51.9%) |
| Total Housing Units | 295 (28.4%) | 742 (71.6%) |
Occupancy by Educational Attainment in Pembroke
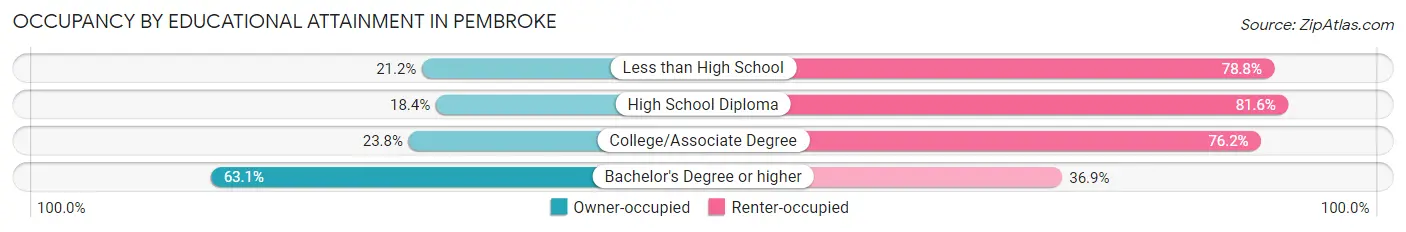
| Household Size | Owner-occupied | Renter-occupied |
| Less than High School | 29 (21.2%) | 108 (78.8%) |
| High School Diploma | 49 (18.4%) | 217 (81.6%) |
| College/Associate Degree | 111 (23.8%) | 355 (76.2%) |
| Bachelor's Degree or higher | 106 (63.1%) | 62 (36.9%) |
Occupancy by Age of Householder in Pembroke
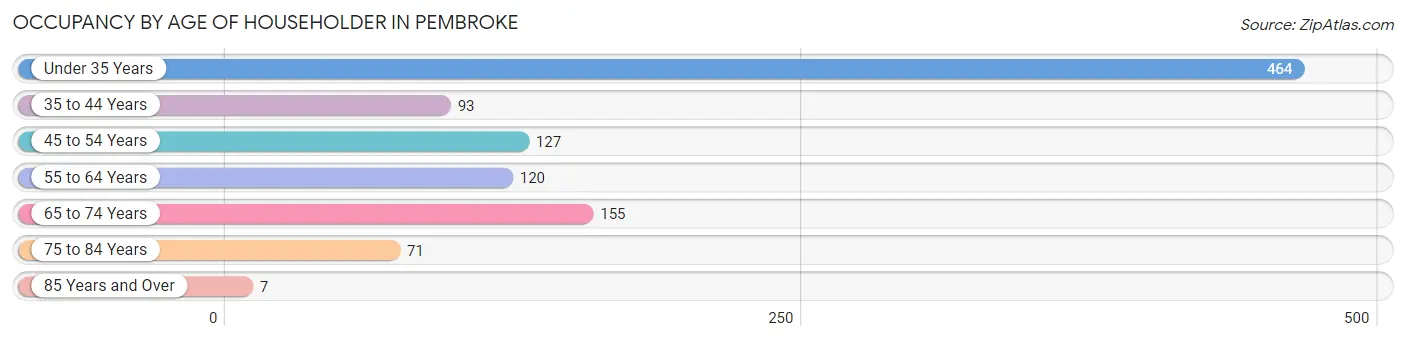
| Age Bracket | # Households | % Households |
| Under 35 Years | 464 | 44.7% |
| 35 to 44 Years | 93 | 9.0% |
| 45 to 54 Years | 127 | 12.2% |
| 55 to 64 Years | 120 | 11.6% |
| 65 to 74 Years | 155 | 14.9% |
| 75 to 84 Years | 71 | 6.9% |
| 85 Years and Over | 7 | 0.7% |
| Total | 1,037 | 100.0% |
Housing Finances in Pembroke
Median Income by Occupancy in Pembroke
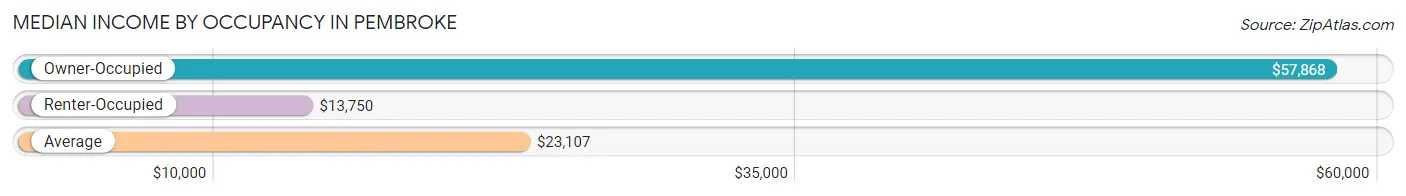
| Occupancy Type | # Households | Median Income |
| Owner-Occupied | 295 (28.4%) | $57,868 |
| Renter-Occupied | 742 (71.6%) | $13,750 |
| Average | 1,037 (100.0%) | $23,107 |
Occupancy by Householder Income Bracket in Pembroke
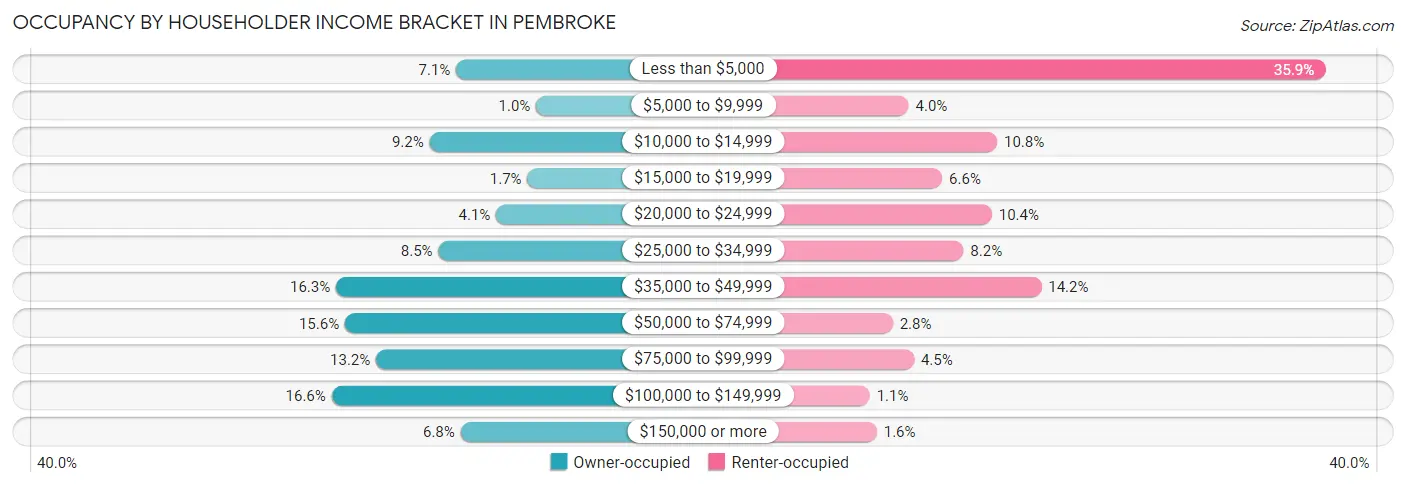
| Income Bracket | Owner-occupied | Renter-occupied |
| Less than $5,000 | 21 (7.1%) | 266 (35.8%) |
| $5,000 to $9,999 | 3 (1.0%) | 30 (4.0%) |
| $10,000 to $14,999 | 27 (9.1%) | 80 (10.8%) |
| $15,000 to $19,999 | 5 (1.7%) | 49 (6.6%) |
| $20,000 to $24,999 | 12 (4.1%) | 77 (10.4%) |
| $25,000 to $34,999 | 25 (8.5%) | 61 (8.2%) |
| $35,000 to $49,999 | 48 (16.3%) | 105 (14.1%) |
| $50,000 to $74,999 | 46 (15.6%) | 21 (2.8%) |
| $75,000 to $99,999 | 39 (13.2%) | 33 (4.4%) |
| $100,000 to $149,999 | 49 (16.6%) | 8 (1.1%) |
| $150,000 or more | 20 (6.8%) | 12 (1.6%) |
| Total | 295 (100.0%) | 742 (100.0%) |
Monthly Housing Cost Tiers in Pembroke
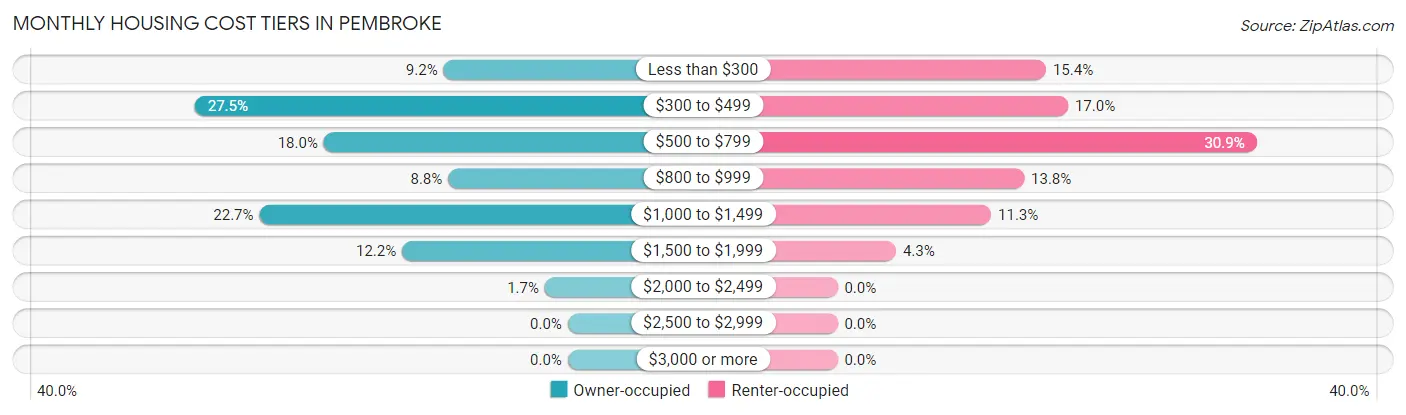
| Monthly Cost | Owner-occupied | Renter-occupied |
| Less than $300 | 27 (9.1%) | 114 (15.4%) |
| $300 to $499 | 81 (27.5%) | 126 (17.0%) |
| $500 to $799 | 53 (18.0%) | 229 (30.9%) |
| $800 to $999 | 26 (8.8%) | 102 (13.8%) |
| $1,000 to $1,499 | 67 (22.7%) | 84 (11.3%) |
| $1,500 to $1,999 | 36 (12.2%) | 32 (4.3%) |
| $2,000 to $2,499 | 5 (1.7%) | 0 (0.0%) |
| $2,500 to $2,999 | 0 (0.0%) | 0 (0.0%) |
| $3,000 or more | 0 (0.0%) | 0 (0.0%) |
| Total | 295 (100.0%) | 742 (100.0%) |
Physical Housing Characteristics in Pembroke
Housing Structures in Pembroke
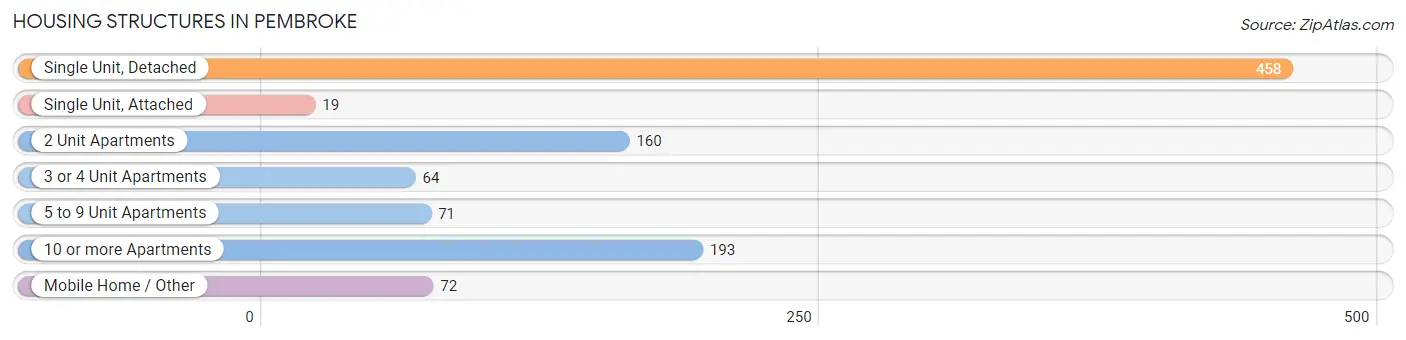
| Structure Type | # Housing Units | % Housing Units |
| Single Unit, Detached | 458 | 44.2% |
| Single Unit, Attached | 19 | 1.8% |
| 2 Unit Apartments | 160 | 15.4% |
| 3 or 4 Unit Apartments | 64 | 6.2% |
| 5 to 9 Unit Apartments | 71 | 6.9% |
| 10 or more Apartments | 193 | 18.6% |
| Mobile Home / Other | 72 | 6.9% |
| Total | 1,037 | 100.0% |
Housing Structures by Occupancy in Pembroke
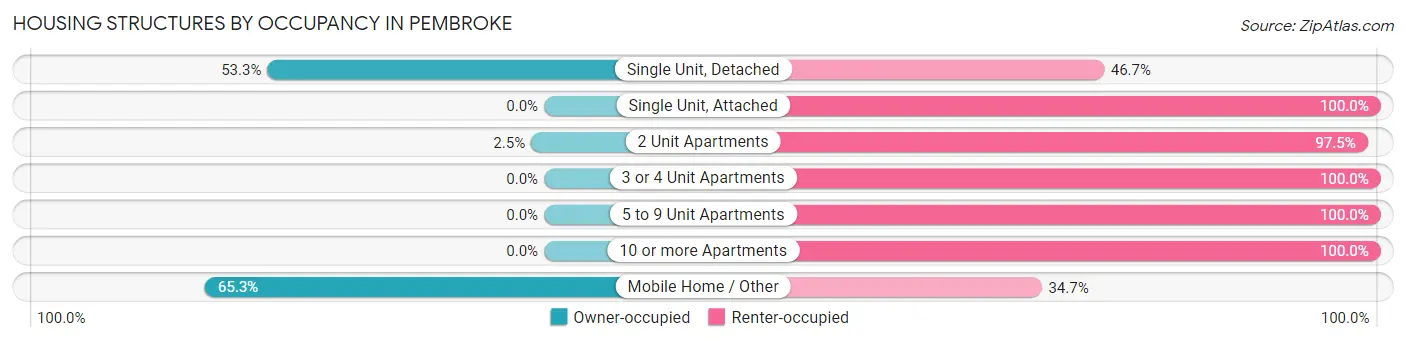
| Structure Type | Owner-occupied | Renter-occupied |
| Single Unit, Detached | 244 (53.3%) | 214 (46.7%) |
| Single Unit, Attached | 0 (0.0%) | 19 (100.0%) |
| 2 Unit Apartments | 4 (2.5%) | 156 (97.5%) |
| 3 or 4 Unit Apartments | 0 (0.0%) | 64 (100.0%) |
| 5 to 9 Unit Apartments | 0 (0.0%) | 71 (100.0%) |
| 10 or more Apartments | 0 (0.0%) | 193 (100.0%) |
| Mobile Home / Other | 47 (65.3%) | 25 (34.7%) |
| Total | 295 (28.4%) | 742 (71.6%) |
Housing Structures by Number of Rooms in Pembroke
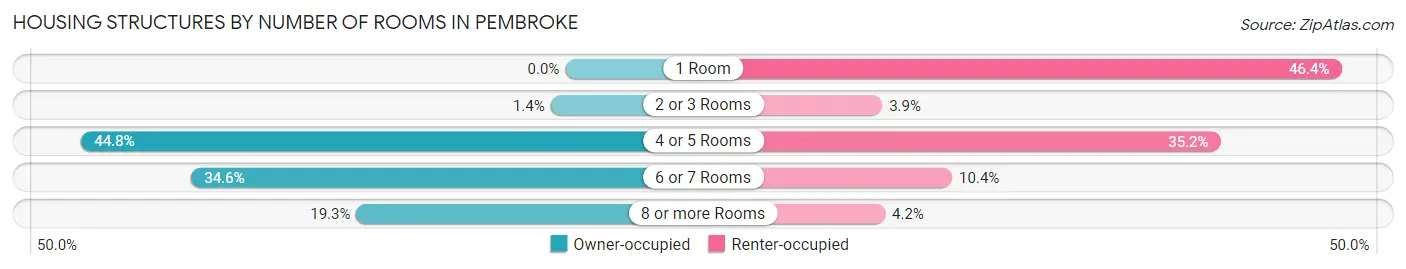
| Number of Rooms | Owner-occupied | Renter-occupied |
| 1 Room | 0 (0.0%) | 344 (46.4%) |
| 2 or 3 Rooms | 4 (1.4%) | 29 (3.9%) |
| 4 or 5 Rooms | 132 (44.8%) | 261 (35.2%) |
| 6 or 7 Rooms | 102 (34.6%) | 77 (10.4%) |
| 8 or more Rooms | 57 (19.3%) | 31 (4.2%) |
| Total | 295 (100.0%) | 742 (100.0%) |
Housing Structure by Heating Type in Pembroke
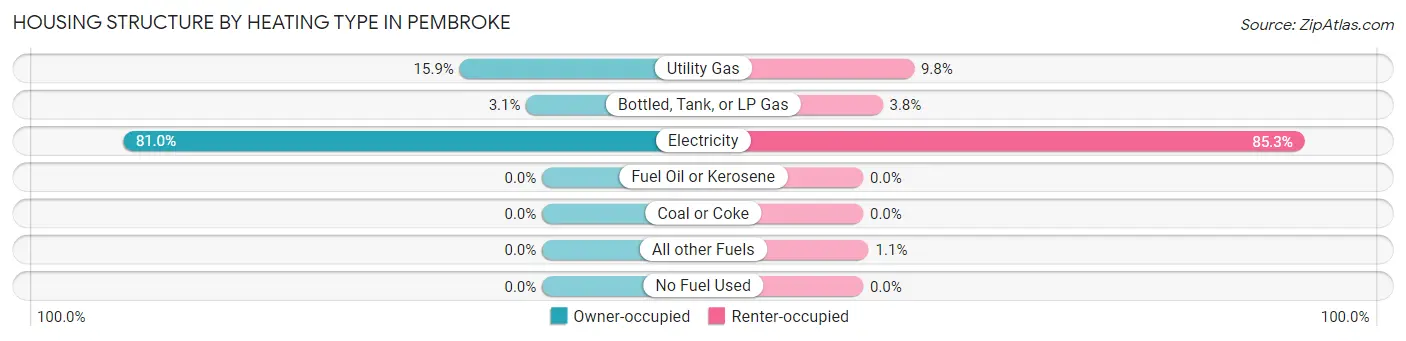
| Heating Type | Owner-occupied | Renter-occupied |
| Utility Gas | 47 (15.9%) | 73 (9.8%) |
| Bottled, Tank, or LP Gas | 9 (3.0%) | 28 (3.8%) |
| Electricity | 239 (81.0%) | 633 (85.3%) |
| Fuel Oil or Kerosene | 0 (0.0%) | 0 (0.0%) |
| Coal or Coke | 0 (0.0%) | 0 (0.0%) |
| All other Fuels | 0 (0.0%) | 8 (1.1%) |
| No Fuel Used | 0 (0.0%) | 0 (0.0%) |
| Total | 295 (100.0%) | 742 (100.0%) |
Household Vehicle Usage in Pembroke
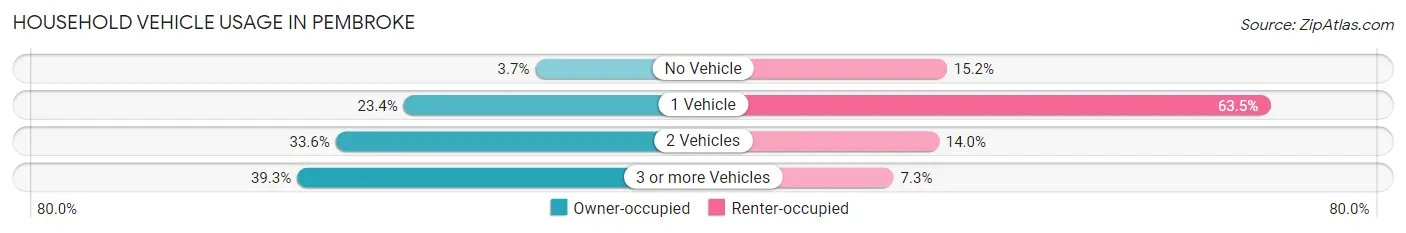
| Vehicles per Household | Owner-occupied | Renter-occupied |
| No Vehicle | 11 (3.7%) | 113 (15.2%) |
| 1 Vehicle | 69 (23.4%) | 471 (63.5%) |
| 2 Vehicles | 99 (33.6%) | 104 (14.0%) |
| 3 or more Vehicles | 116 (39.3%) | 54 (7.3%) |
| Total | 295 (100.0%) | 742 (100.0%) |
Real Estate & Mortgages in Pembroke
Real Estate and Mortgage Overview in Pembroke
| Characteristic | Without Mortgage | With Mortgage |
| Housing Units | 143 | 152 |
| Median Property Value | $75,000 | $121,500 |
| Median Household Income | $57,574 | $20 |
| Monthly Housing Costs | $419 | $0 |
| Real Estate Taxes | $929 | $8 |
Property Value by Mortgage Status in Pembroke
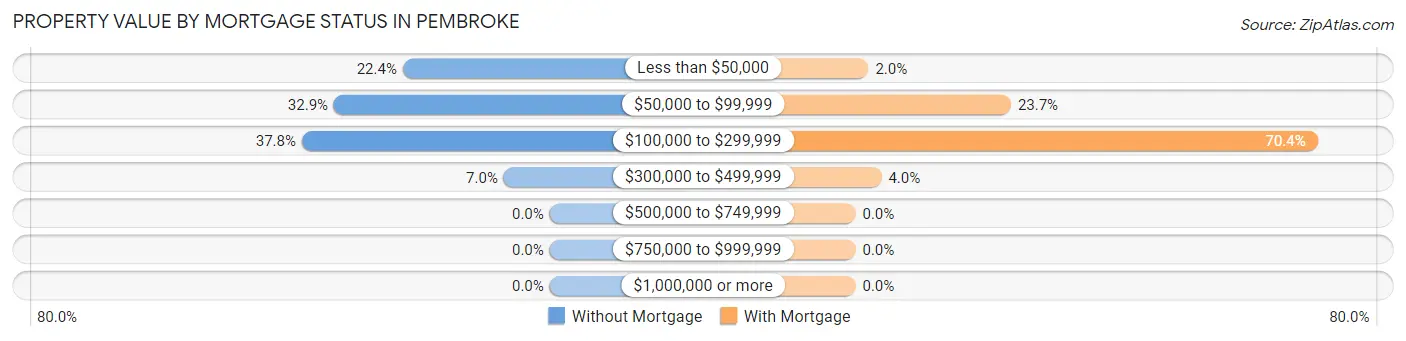
| Property Value | Without Mortgage | With Mortgage |
| Less than $50,000 | 32 (22.4%) | 3 (2.0%) |
| $50,000 to $99,999 | 47 (32.9%) | 36 (23.7%) |
| $100,000 to $299,999 | 54 (37.8%) | 107 (70.4%) |
| $300,000 to $499,999 | 10 (7.0%) | 6 (4.0%) |
| $500,000 to $749,999 | 0 (0.0%) | 0 (0.0%) |
| $750,000 to $999,999 | 0 (0.0%) | 0 (0.0%) |
| $1,000,000 or more | 0 (0.0%) | 0 (0.0%) |
| Total | 143 (100.0%) | 152 (100.0%) |
Household Income by Mortgage Status in Pembroke
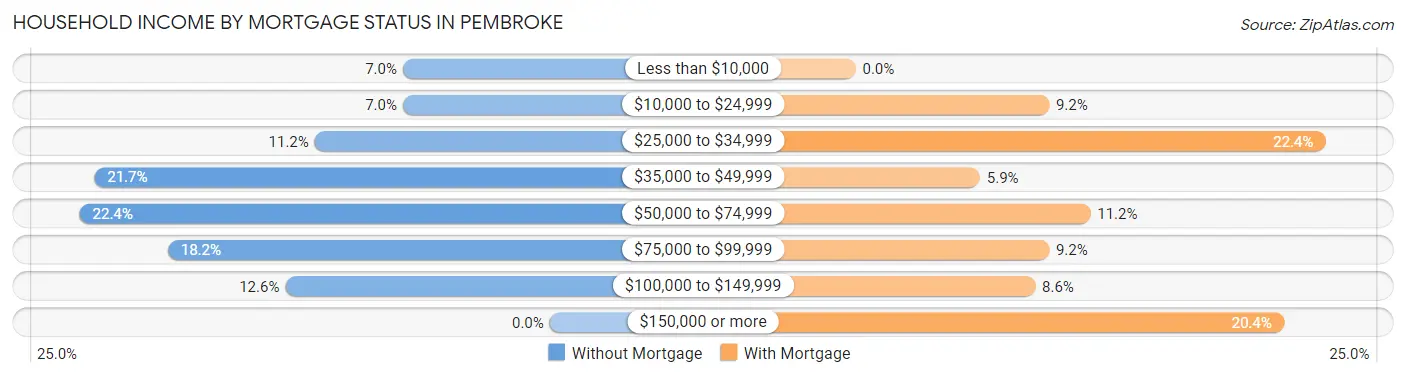
| Household Income | Without Mortgage | With Mortgage |
| Less than $10,000 | 10 (7.0%) | 0 (0.0%) |
| $10,000 to $24,999 | 10 (7.0%) | 14 (9.2%) |
| $25,000 to $34,999 | 16 (11.2%) | 34 (22.4%) |
| $35,000 to $49,999 | 31 (21.7%) | 9 (5.9%) |
| $50,000 to $74,999 | 32 (22.4%) | 17 (11.2%) |
| $75,000 to $99,999 | 26 (18.2%) | 14 (9.2%) |
| $100,000 to $149,999 | 18 (12.6%) | 13 (8.6%) |
| $150,000 or more | 0 (0.0%) | 31 (20.4%) |
| Total | 143 (100.0%) | 152 (100.0%) |
Property Value to Household Income Ratio in Pembroke
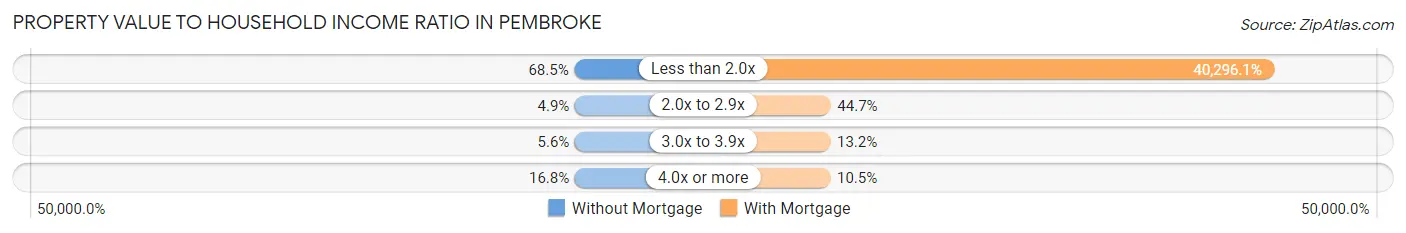
| Value-to-Income Ratio | Without Mortgage | With Mortgage |
| Less than 2.0x | 98 (68.5%) | 61,250 (40,296.1%) |
| 2.0x to 2.9x | 7 (4.9%) | 68 (44.7%) |
| 3.0x to 3.9x | 8 (5.6%) | 20 (13.2%) |
| 4.0x or more | 24 (16.8%) | 16 (10.5%) |
| Total | 143 (100.0%) | 152 (100.0%) |
Real Estate Taxes by Mortgage Status in Pembroke
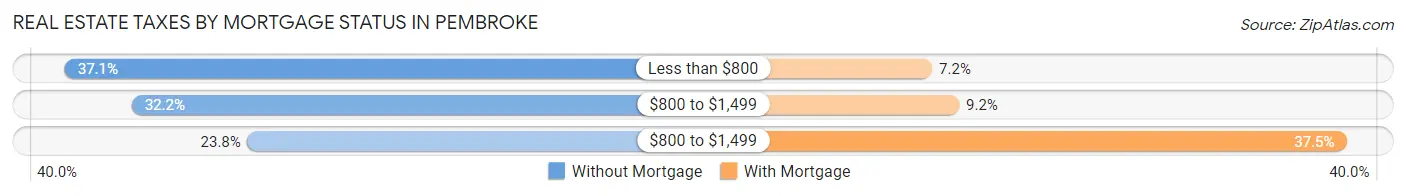
| Property Taxes | Without Mortgage | With Mortgage |
| Less than $800 | 53 (37.1%) | 11 (7.2%) |
| $800 to $1,499 | 46 (32.2%) | 14 (9.2%) |
| $800 to $1,499 | 34 (23.8%) | 57 (37.5%) |
| Total | 143 (100.0%) | 152 (100.0%) |
Health & Disability in Pembroke
Health Insurance Coverage by Age in Pembroke
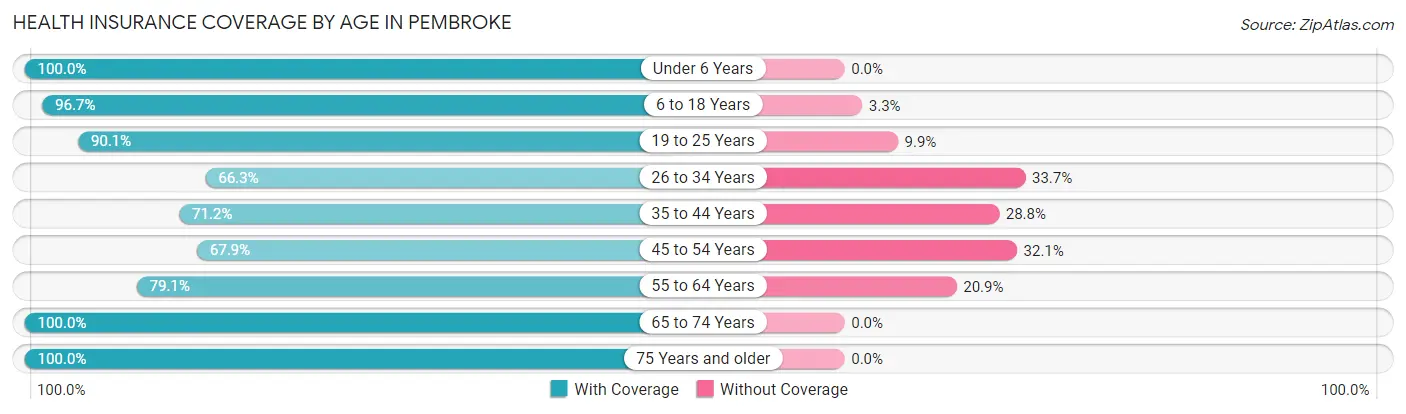
| Age Bracket | With Coverage | Without Coverage |
| Under 6 Years | 322 (100.0%) | 0 (0.0%) |
| 6 to 18 Years | 473 (96.7%) | 16 (3.3%) |
| 19 to 25 Years | 652 (90.1%) | 72 (9.9%) |
| 26 to 34 Years | 183 (66.3%) | 93 (33.7%) |
| 35 to 44 Years | 126 (71.2%) | 51 (28.8%) |
| 45 to 54 Years | 188 (67.9%) | 89 (32.1%) |
| 55 to 64 Years | 144 (79.1%) | 38 (20.9%) |
| 65 to 74 Years | 204 (100.0%) | 0 (0.0%) |
| 75 Years and older | 95 (100.0%) | 0 (0.0%) |
| Total | 2,387 (86.9%) | 359 (13.1%) |
Health Insurance Coverage by Citizenship Status in Pembroke
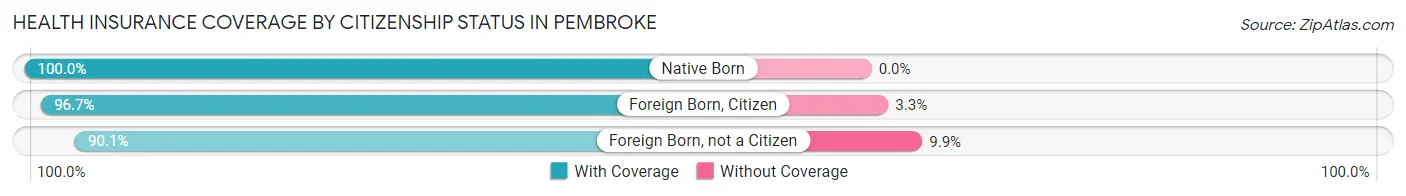
| Citizenship Status | With Coverage | Without Coverage |
| Native Born | 322 (100.0%) | 0 (0.0%) |
| Foreign Born, Citizen | 473 (96.7%) | 16 (3.3%) |
| Foreign Born, not a Citizen | 652 (90.1%) | 72 (9.9%) |
Health Insurance Coverage by Household Income in Pembroke
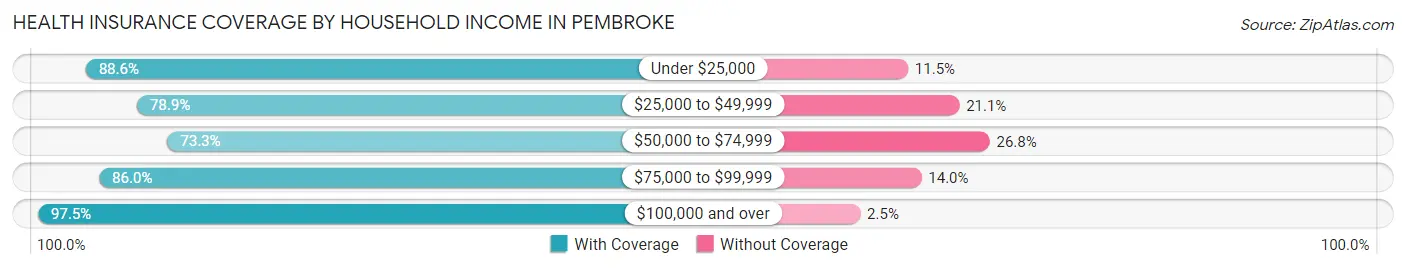
| Household Income | With Coverage | Without Coverage |
| Under $25,000 | 928 (88.5%) | 120 (11.5%) |
| $25,000 to $49,999 | 446 (78.9%) | 119 (21.1%) |
| $50,000 to $74,999 | 167 (73.3%) | 61 (26.8%) |
| $75,000 to $99,999 | 197 (86.0%) | 32 (14.0%) |
| $100,000 and over | 273 (97.5%) | 7 (2.5%) |
Public vs Private Health Insurance Coverage by Age in Pembroke
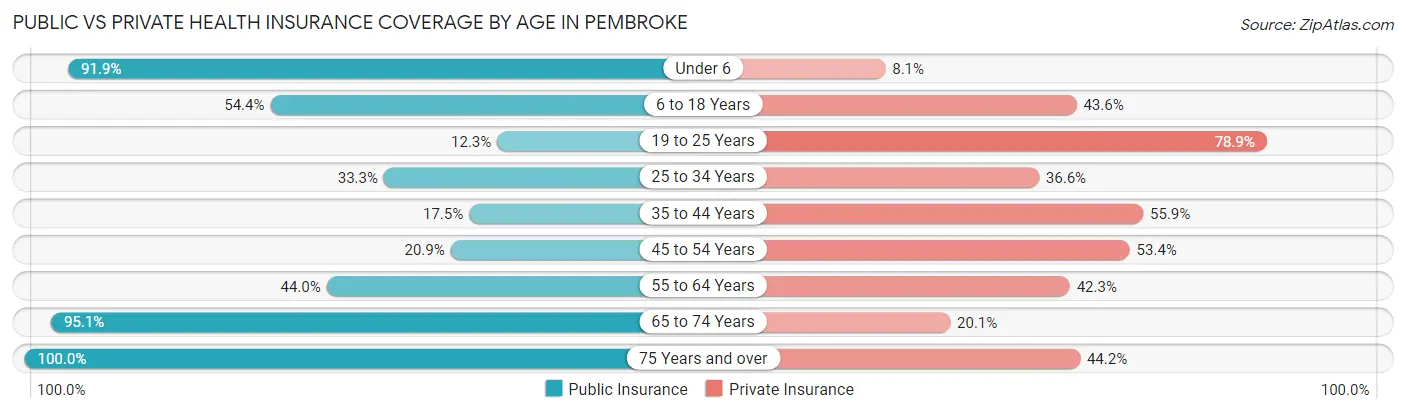
| Age Bracket | Public Insurance | Private Insurance |
| Under 6 | 296 (91.9%) | 26 (8.1%) |
| 6 to 18 Years | 266 (54.4%) | 213 (43.6%) |
| 19 to 25 Years | 89 (12.3%) | 571 (78.9%) |
| 25 to 34 Years | 92 (33.3%) | 101 (36.6%) |
| 35 to 44 Years | 31 (17.5%) | 99 (55.9%) |
| 45 to 54 Years | 58 (20.9%) | 148 (53.4%) |
| 55 to 64 Years | 80 (44.0%) | 77 (42.3%) |
| 65 to 74 Years | 194 (95.1%) | 41 (20.1%) |
| 75 Years and over | 95 (100.0%) | 42 (44.2%) |
| Total | 1,201 (43.7%) | 1,318 (48.0%) |
Disability Status by Sex by Age in Pembroke
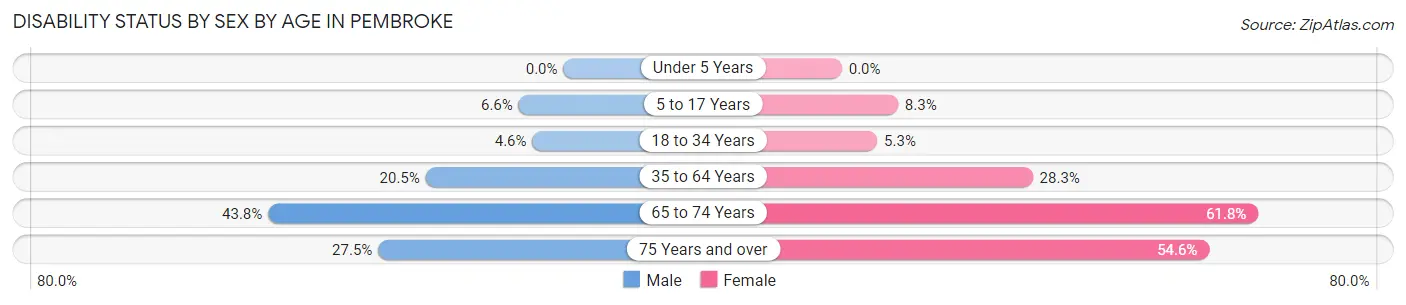
| Age Bracket | Male | Female |
| Under 5 Years | 0 (0.0%) | 0 (0.0%) |
| 5 to 17 Years | 14 (6.6%) | 13 (8.3%) |
| 18 to 34 Years | 26 (4.6%) | 32 (5.2%) |
| 35 to 64 Years | 55 (20.4%) | 104 (28.3%) |
| 65 to 74 Years | 32 (43.8%) | 81 (61.8%) |
| 75 Years and over | 11 (27.5%) | 30 (54.5%) |
Disability Class by Sex by Age in Pembroke
Disability Class: Hearing Difficulty
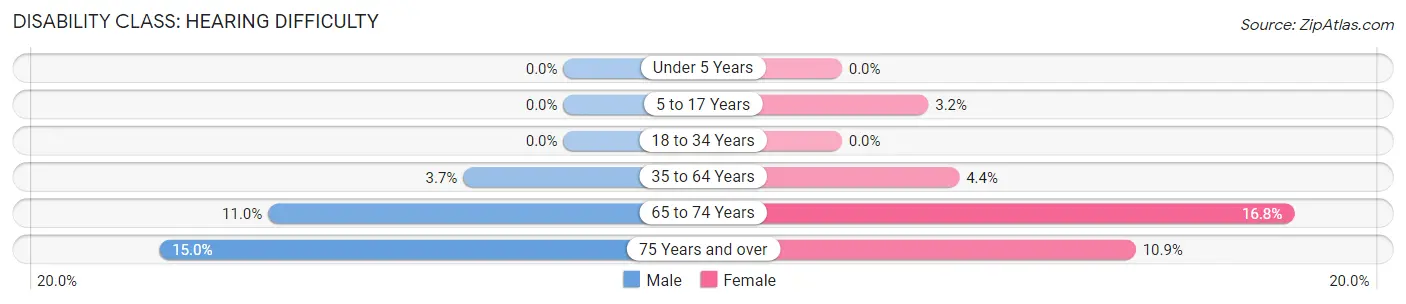
| Age Bracket | Male | Female |
| Under 5 Years | 0 (0.0%) | 0 (0.0%) |
| 5 to 17 Years | 0 (0.0%) | 5 (3.2%) |
| 18 to 34 Years | 0 (0.0%) | 0 (0.0%) |
| 35 to 64 Years | 10 (3.7%) | 16 (4.4%) |
| 65 to 74 Years | 8 (11.0%) | 22 (16.8%) |
| 75 Years and over | 6 (15.0%) | 6 (10.9%) |
Disability Class: Vision Difficulty
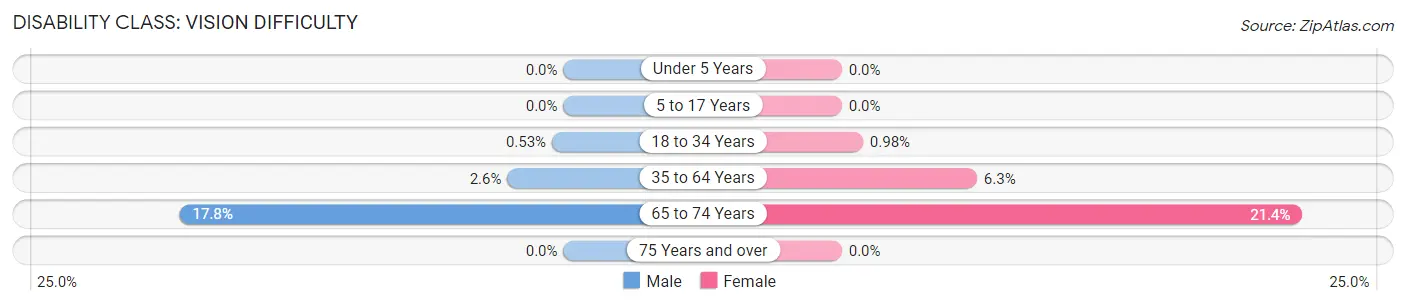
| Age Bracket | Male | Female |
| Under 5 Years | 0 (0.0%) | 0 (0.0%) |
| 5 to 17 Years | 0 (0.0%) | 0 (0.0%) |
| 18 to 34 Years | 3 (0.5%) | 6 (1.0%) |
| 35 to 64 Years | 7 (2.6%) | 23 (6.3%) |
| 65 to 74 Years | 13 (17.8%) | 28 (21.4%) |
| 75 Years and over | 0 (0.0%) | 0 (0.0%) |
Disability Class: Cognitive Difficulty
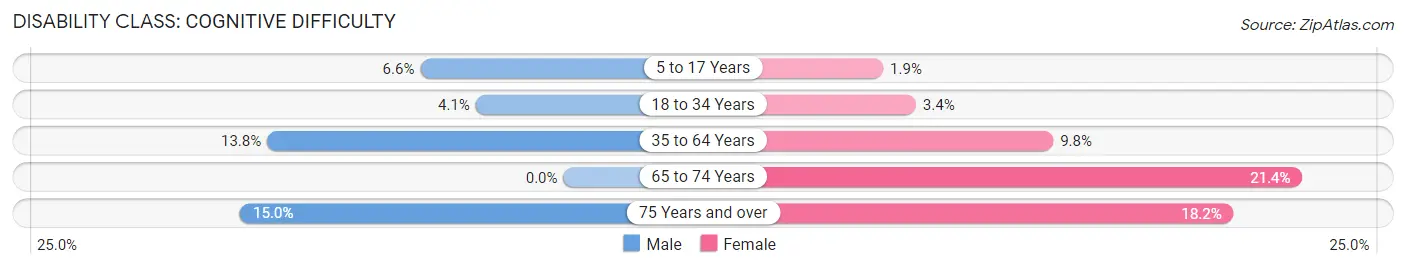
| Age Bracket | Male | Female |
| 5 to 17 Years | 14 (6.6%) | 3 (1.9%) |
| 18 to 34 Years | 23 (4.1%) | 21 (3.4%) |
| 35 to 64 Years | 37 (13.8%) | 36 (9.8%) |
| 65 to 74 Years | 0 (0.0%) | 28 (21.4%) |
| 75 Years and over | 6 (15.0%) | 10 (18.2%) |
Disability Class: Ambulatory Difficulty
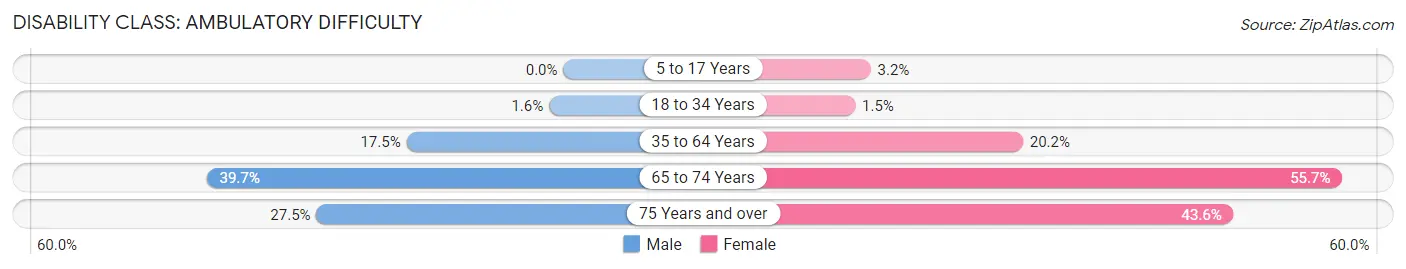
| Age Bracket | Male | Female |
| 5 to 17 Years | 0 (0.0%) | 5 (3.2%) |
| 18 to 34 Years | 9 (1.6%) | 9 (1.5%) |
| 35 to 64 Years | 47 (17.5%) | 74 (20.2%) |
| 65 to 74 Years | 29 (39.7%) | 73 (55.7%) |
| 75 Years and over | 11 (27.5%) | 24 (43.6%) |
Disability Class: Self-Care Difficulty
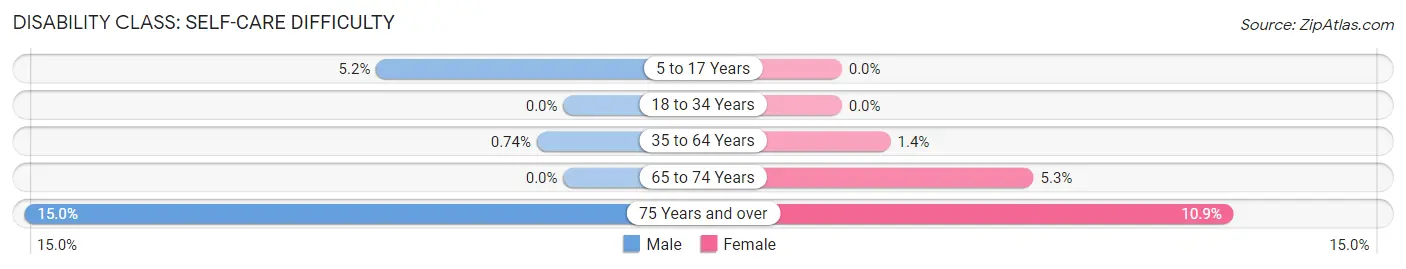
| Age Bracket | Male | Female |
| 5 to 17 Years | 11 (5.2%) | 0 (0.0%) |
| 18 to 34 Years | 0 (0.0%) | 0 (0.0%) |
| 35 to 64 Years | 2 (0.7%) | 5 (1.4%) |
| 65 to 74 Years | 0 (0.0%) | 7 (5.3%) |
| 75 Years and over | 6 (15.0%) | 6 (10.9%) |
Technology Access in Pembroke
Computing Device Access in Pembroke
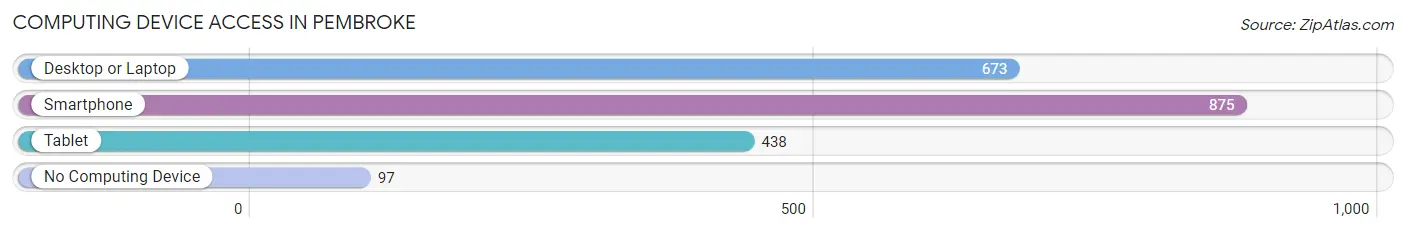
| Device Type | # Households | % Households |
| Desktop or Laptop | 673 | 64.9% |
| Smartphone | 875 | 84.4% |
| Tablet | 438 | 42.2% |
| No Computing Device | 97 | 9.3% |
| Total | 1,037 | 100.0% |
Internet Access in Pembroke
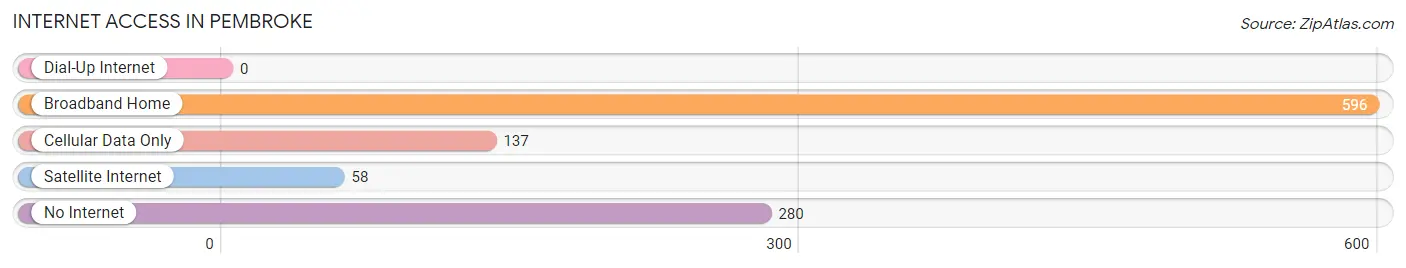
| Internet Type | # Households | % Households |
| Dial-Up Internet | 0 | 0.0% |
| Broadband Home | 596 | 57.5% |
| Cellular Data Only | 137 | 13.2% |
| Satellite Internet | 58 | 5.6% |
| No Internet | 280 | 27.0% |
| Total | 1,037 | 100.0% |
Pembroke Summary
Pembroke, North Carolina is a small town located in Robeson County, in the southeastern part of the state. It is situated on the Lumber River, which is a tributary of the Cape Fear River. The town was founded in 1885 and is home to the Lumbee Tribe of North Carolina, the largest Native American tribe east of the Mississippi River.
History
The area that is now Pembroke was originally inhabited by the Lumbee Indians, who were part of the larger Siouan-speaking tribes of the region. The Lumbee were known for their agricultural skills and their ability to survive in the harsh environment of the coastal plain. The first European settlers arrived in the area in the late 1700s, and the town of Pembroke was officially established in 1885.
The town was named after the Pembroke family, who were prominent landowners in the area. The town quickly grew and became a center of commerce for the surrounding area. In the early 1900s, the town was home to several businesses, including a sawmill, a gristmill, and a cotton gin.
In the 1950s, Pembroke began to experience a period of growth and development. The town was home to several new businesses, including a furniture factory, a textile mill, and a lumber mill. The town also became home to the University of North Carolina at Pembroke, which was established in 1972.
Geography
Pembroke is located in Robeson County, in the southeastern part of North Carolina. The town is situated on the Lumber River, which is a tributary of the Cape Fear River. The town is located about 30 miles from the city of Fayetteville and about 60 miles from the city of Wilmington.
The town is located in a region of North Carolina known as the Sandhills. The area is characterized by rolling hills and sandy soils. The climate in the area is mild, with temperatures ranging from the mid-50s in the winter to the mid-80s in the summer.
Economy
The economy of Pembroke is largely based on agriculture and manufacturing. The town is home to several large agricultural operations, including poultry farms, hog farms, and vegetable farms. The town is also home to several manufacturing companies, including a furniture factory, a textile mill, and a lumber mill.
The town is also home to the University of North Carolina at Pembroke, which is a major employer in the area. The university provides jobs for faculty, staff, and students, as well as providing educational opportunities for the local community.
Demographics
As of the 2010 census, the population of Pembroke was 2,973. The town has a diverse population, with the majority of residents being of Native American, African American, and White descent. The median household income in the town is $30,945, and the median age is 33.
The town is home to the Lumbee Tribe of North Carolina, the largest Native American tribe east of the Mississippi River. The tribe is recognized by the state of North Carolina and is actively involved in the local community. The tribe is also home to the University of North Carolina at Pembroke, which is a major employer in the area.
Conclusion
Pembroke, North Carolina is a small town located in Robeson County, in the southeastern part of the state. The town was founded in 1885 and is home to the Lumbee Tribe of North Carolina, the largest Native American tribe east of the Mississippi River. The town is situated on the Lumber River, and is characterized by rolling hills and sandy soils. The economy of Pembroke is largely based on agriculture and manufacturing, and the town is home to the University of North Carolina at Pembroke. The population of Pembroke is diverse, with the majority of residents being of Native American, African American, and White descent.
Common Questions
What is Per Capita Income in Pembroke?
Per Capita income in Pembroke is $14,357.
What is the Median Family Income in Pembroke?
Median Family Income in Pembroke is $39,241.
What is the Median Household income in Pembroke?
Median Household Income in Pembroke is $23,107.
What is Income or Wage Gap in Pembroke?
Income or Wage Gap in Pembroke is 25.3%.
Women in Pembroke earn 74.7 cents for every dollar earned by a man.
What is Inequality or Gini Index in Pembroke?
Inequality or Gini Index in Pembroke is 0.60.
What is the Total Population of Pembroke?
Total Population of Pembroke is 2,832.
What is the Total Male Population of Pembroke?
Total Male Population of Pembroke is 1,380.
What is the Total Female Population of Pembroke?
Total Female Population of Pembroke is 1,452.
What is the Ratio of Males per 100 Females in Pembroke?
There are 95.04 Males per 100 Females in Pembroke.
What is the Ratio of Females per 100 Males in Pembroke?
There are 105.22 Females per 100 Males in Pembroke.
What is the Median Population Age in Pembroke?
Median Population Age in Pembroke is 24.0 Years.
What is the Average Family Size in Pembroke
Average Family Size in Pembroke is 3.2 People.
What is the Average Household Size in Pembroke
Average Household Size in Pembroke is 2.3 People.
How Large is the Labor Force in Pembroke?
There are 875 People in the Labor Forcein in Pembroke.
What is the Percentage of People in the Labor Force in Pembroke?
38.6% of People are in the Labor Force in Pembroke.
What is the Unemployment Rate in Pembroke?
Unemployment Rate in Pembroke is 4.8%.