Cities with the Highest Percentage of Immigrants from Guatemala in North Carolina
RELATED REPORTS & OPTIONS
Guatemala
North Carolina
Compare Cities
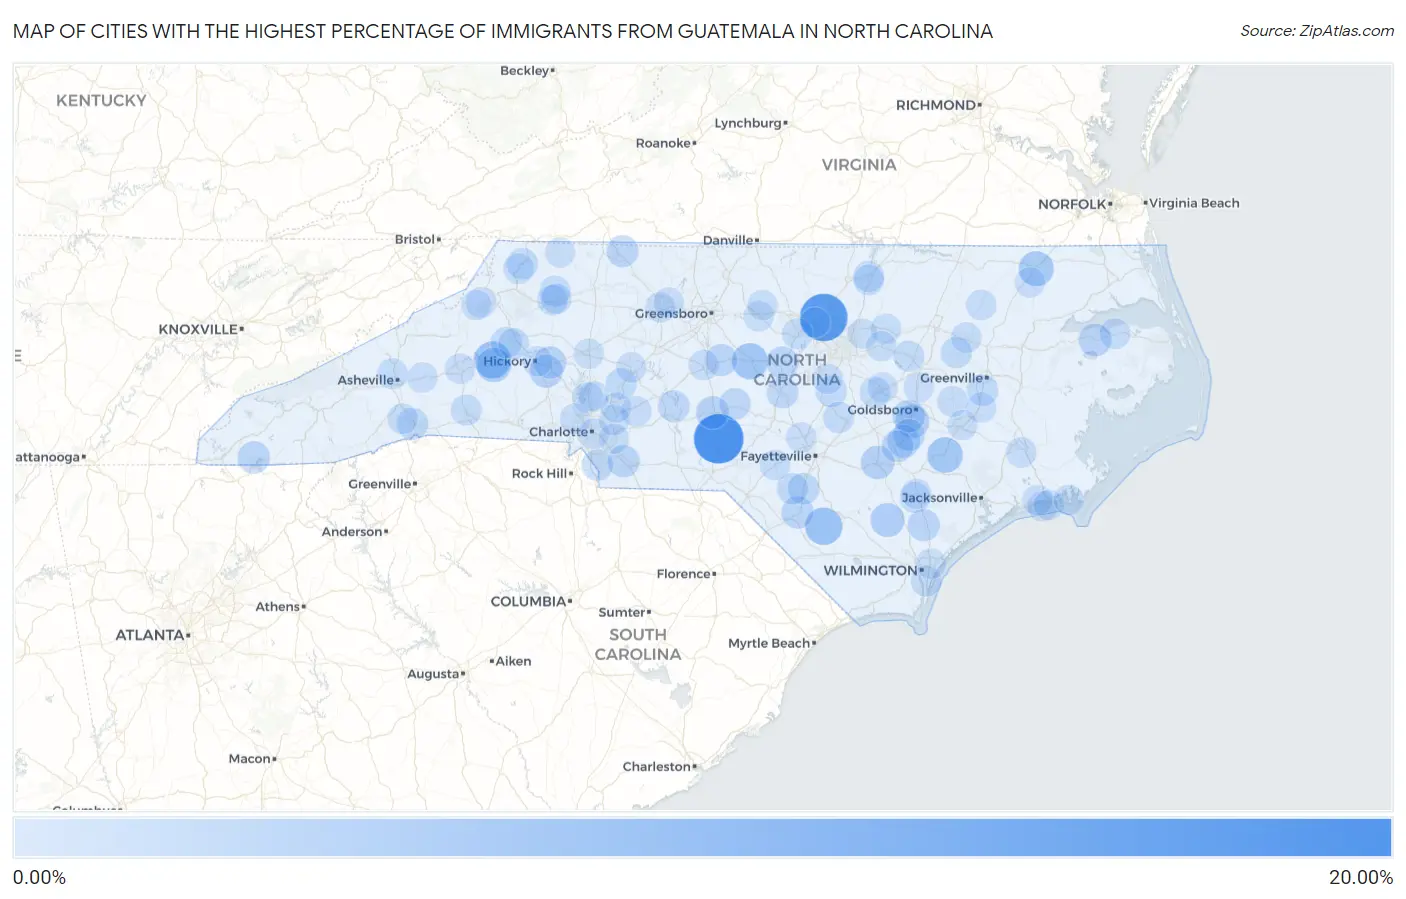
Map of Cities with the Highest Percentage of Immigrants from Guatemala in North Carolina
0.00%
20.00%
Cities with the Highest Percentage of Immigrants from Guatemala in North Carolina
| City | Guatemala | vs State | vs National | |
| 1. | Norman | 19.08% | 0.22%(+18.9)#-1 | 0.32%(+18.8)#0 |
| 2. | Gorman | 16.97% | 0.22%(+16.8)#0 | 0.32%(+16.7)#1 |
| 3. | Dudley | 16.83% | 0.22%(+16.6)#1 | 0.32%(+16.5)#2 |
| 4. | Bladenboro | 6.84% | 0.22%(+6.62)#2 | 0.32%(+6.52)#3 |
| 5. | Morganton | 6.71% | 0.22%(+6.49)#3 | 0.32%(+6.40)#4 |
| 6. | Siler City | 5.82% | 0.22%(+5.60)#4 | 0.32%(+5.51)#5 |
| 7. | Pink Hill | 5.30% | 0.22%(+5.08)#5 | 0.32%(+4.99)#6 |
| 8. | Winton | 4.75% | 0.22%(+4.53)#28 | 0.32%(+4.43)#1,293 |
| 9. | Salem | 4.28% | 0.22%(+4.06)#29 | 0.32%(+3.97)#1,294 |
| 10. | Ivanhoe | 3.69% | 0.22%(+3.47)#30 | 0.32%(+3.37)#1,295 |
| 11. | Brogden | 3.24% | 0.22%(+3.02)#31 | 0.32%(+2.93)#1,296 |
| 12. | Clinton | 3.20% | 0.22%(+2.99)#32 | 0.32%(+2.89)#1,297 |
| 13. | Newton | 2.78% | 0.22%(+2.56)#33 | 0.32%(+2.46)#1,298 |
| 14. | Creswell | 2.63% | 0.22%(+2.41)#34 | 0.32%(+2.31)#1,299 |
| 15. | Biscoe | 2.58% | 0.22%(+2.36)#35 | 0.32%(+2.26)#1,300 |
| 16. | Calypso | 2.56% | 0.22%(+2.34)#36 | 0.32%(+2.25)#1,301 |
| 17. | Mar Mac | 2.45% | 0.22%(+2.24)#37 | 0.32%(+2.14)#1,302 |
| 18. | Hayesville | 2.23% | 0.22%(+2.01)#38 | 0.32%(+1.91)#1,303 |
| 19. | Conover | 2.21% | 0.22%(+1.99)#39 | 0.32%(+1.89)#1,304 |
| 20. | Lumberton | 2.10% | 0.22%(+1.88)#40 | 0.32%(+1.78)#1,305 |
| 21. | Burgaw | 2.09% | 0.22%(+1.87)#41 | 0.32%(+1.77)#1,306 |
| 22. | Monroe | 2.07% | 0.22%(+1.85)#73 | 0.32%(+1.75)#2,321 |
| 23. | Pittsboro | 2.00% | 0.22%(+1.78)#74 | 0.32%(+1.68)#2,322 |
| 24. | Mount Olive | 1.96% | 0.22%(+1.74)#75 | 0.32%(+1.64)#2,323 |
| 25. | Franklinville | 1.93% | 0.22%(+1.71)#76 | 0.32%(+1.61)#2,324 |
| 26. | Faison | 1.79% | 0.22%(+1.57)#77 | 0.32%(+1.47)#2,325 |
| 27. | Flat Rock | 1.78% | 0.22%(+1.56)#78 | 0.32%(+1.46)#2,326 |
| 28. | Badin | 1.69% | 0.22%(+1.47)#79 | 0.32%(+1.37)#2,327 |
| 29. | Sanford | 1.68% | 0.22%(+1.46)#80 | 0.32%(+1.36)#2,328 |
| 30. | Robbins | 1.59% | 0.22%(+1.37)#81 | 0.32%(+1.27)#2,329 |
| 31. | East Flat Rock | 1.53% | 0.22%(+1.31)#82 | 0.32%(+1.22)#2,330 |
| 32. | St Pauls | 1.50% | 0.22%(+1.28)#83 | 0.32%(+1.19)#2,331 |
| 33. | Marvin | 1.43% | 0.22%(+1.21)#84 | 0.32%(+1.12)#2,877 |
| 34. | Angier | 1.40% | 0.22%(+1.18)#85 | 0.32%(+1.08)#2,878 |
| 35. | Winterville | 1.37% | 0.22%(+1.15)#86 | 0.32%(+1.05)#2,879 |
| 36. | Rennert | 1.33% | 0.22%(+1.11)#87 | 0.32%(+1.02)#2,880 |
| 37. | Gamewell | 1.24% | 0.22%(+1.02)#88 | 0.32%(+0.922)#2,881 |
| 38. | Pinetops | 1.24% | 0.22%(+1.02)#89 | 0.32%(+0.920)#2,882 |
| 39. | China Grove | 1.19% | 0.22%(+0.972)#90 | 0.32%(+0.874)#2,883 |
| 40. | Jefferson | 1.18% | 0.22%(+0.956)#91 | 0.32%(+0.857)#2,884 |
| 41. | Erwin | 1.11% | 0.22%(+0.888)#92 | 0.32%(+0.790)#2,885 |
| 42. | Mulberry | 1.01% | 0.22%(+0.791)#93 | 0.32%(+0.692)#2,886 |
| 43. | Chapel Hill | 0.99% | 0.22%(+0.772)#94 | 0.32%(+0.673)#2,887 |
| 44. | Sims | 0.99% | 0.22%(+0.766)#95 | 0.32%(+0.667)#2,888 |
| 45. | Cajah S Mountain | 0.88% | 0.22%(+0.665)#96 | 0.32%(+0.566)#2,889 |
| 46. | Smithfield | 0.86% | 0.22%(+0.640)#97 | 0.32%(+0.541)#2,890 |
| 47. | Henderson | 0.81% | 0.22%(+0.594)#98 | 0.32%(+0.496)#2,891 |
| 48. | Ruth | 0.81% | 0.22%(+0.586)#99 | 0.32%(+0.487)#2,892 |
| 49. | Woodfin | 0.80% | 0.22%(+0.578)#100 | 0.32%(+0.480)#2,893 |
| 50. | Silver Lake | 0.77% | 0.22%(+0.549)#101 | 0.32%(+0.450)#2,894 |
| 51. | West Jefferson | 0.73% | 0.22%(+0.510)#102 | 0.32%(+0.412)#2,895 |
| 52. | Wallace | 0.70% | 0.22%(+0.478)#103 | 0.32%(+0.379)#2,896 |
| 53. | Mount Pleasant | 0.68% | 0.22%(+0.456)#104 | 0.32%(+0.358)#2,897 |
| 54. | South Henderson | 0.67% | 0.22%(+0.455)#105 | 0.32%(+0.356)#2,898 |
| 55. | Snow Hill | 0.67% | 0.22%(+0.450)#106 | 0.32%(+0.351)#2,899 |
| 56. | Laurel Park | 0.61% | 0.22%(+0.393)#107 | 0.32%(+0.294)#2,900 |
| 57. | Cricket | 0.60% | 0.22%(+0.383)#108 | 0.32%(+0.284)#2,901 |
| 58. | North Wilkesboro | 0.60% | 0.22%(+0.379)#109 | 0.32%(+0.280)#2,902 |
| 59. | Raeford | 0.59% | 0.22%(+0.371)#110 | 0.32%(+0.273)#2,903 |
| 60. | Tarboro | 0.59% | 0.22%(+0.370)#111 | 0.32%(+0.271)#2,904 |
| 61. | Scotland Neck | 0.54% | 0.22%(+0.318)#112 | 0.32%(+0.220)#2,905 |
| 62. | Columbia | 0.54% | 0.22%(+0.316)#113 | 0.32%(+0.218)#2,906 |
| 63. | Asheboro | 0.53% | 0.22%(+0.312)#114 | 0.32%(+0.213)#2,907 |
| 64. | Mount Holly | 0.50% | 0.22%(+0.285)#115 | 0.32%(+0.187)#2,908 |
| 65. | New Bern | 0.49% | 0.22%(+0.272)#116 | 0.32%(+0.173)#2,909 |
| 66. | Cornelius | 0.48% | 0.22%(+0.262)#117 | 0.32%(+0.163)#2,910 |
| 67. | Charlotte | 0.47% | 0.22%(+0.249)#118 | 0.32%(+0.150)#2,911 |
| 68. | Fuquay Varina | 0.46% | 0.22%(+0.241)#119 | 0.32%(+0.142)#2,912 |
| 69. | Sparta | 0.45% | 0.22%(+0.226)#120 | 0.32%(+0.128)#2,913 |
| 70. | Indian Beach | 0.44% | 0.22%(+0.225)#121 | 0.32%(+0.127)#2,914 |
| 71. | Ahoskie | 0.43% | 0.22%(+0.214)#122 | 0.32%(+0.116)#2,915 |
| 72. | Graham | 0.43% | 0.22%(+0.213)#123 | 0.32%(+0.114)#2,916 |
| 73. | Bunn | 0.42% | 0.22%(+0.199)#124 | 0.32%(+0.101)#2,917 |
| 74. | Broad Creek | 0.40% | 0.22%(+0.178)#125 | 0.32%(+0.080)#2,918 |
| 75. | Black Mountain | 0.39% | 0.22%(+0.172)#126 | 0.32%(+0.074)#2,919 |
| 76. | Harrisburg | 0.39% | 0.22%(+0.172)#127 | 0.32%(+0.073)#2,920 |
| 77. | Mint Hill | 0.37% | 0.22%(+0.146)#128 | 0.32%(+0.048)#2,921 |
| 78. | Spring Lake | 0.36% | 0.22%(+0.139)#129 | 0.32%(+0.041)#2,922 |
| 79. | Teachey | 0.35% | 0.22%(+0.129)#130 | 0.32%(+0.031)#2,923 |
| 80. | Marion | 0.34% | 0.22%(+0.120)#131 | 0.32%(+0.022)#2,924 |
| 81. | Statesville | 0.33% | 0.22%(+0.113)#132 | 0.32%(+0.015)#2,925 |
| 82. | Rolesville | 0.33% | 0.22%(+0.111)#133 | 0.32%(+0.012)#2,926 |
| 83. | Concord | 0.32% | 0.22%(+0.102)#134 | 0.32%(+0.003)#2,927 |
| 84. | Fremont | 0.32% | 0.22%(+0.102)#135 | 0.32%(+0.003)#2,928 |
| 85. | Grifton | 0.30% | 0.22%(+0.080)#136 | 0.32%(-0.019)#2,929 |
| 86. | Pine Knoll Shores | 0.29% | 0.22%(+0.074)#137 | 0.32%(-0.024)#2,930 |
| 87. | Winston Salem | 0.29% | 0.22%(+0.071)#138 | 0.32%(-0.028)#2,931 |
| 88. | Green Level | 0.29% | 0.22%(+0.070)#139 | 0.32%(-0.028)#2,932 |
| 89. | Kings Grant | 0.28% | 0.22%(+0.061)#140 | 0.32%(-0.037)#2,933 |
| 90. | Salisbury | 0.25% | 0.22%(+0.032)#141 | 0.32%(-0.067)#2,934 |
| 91. | Durham | 0.25% | 0.22%(+0.027)#142 | 0.32%(-0.072)#2,935 |
| 92. | Walkertown | 0.25% | 0.22%(+0.026)#143 | 0.32%(-0.072)#2,936 |
| 93. | Davidson | 0.24% | 0.22%(+0.024)#144 | 0.32%(-0.074)#2,937 |
| 94. | Beaufort | 0.24% | 0.22%(+0.023)#145 | 0.32%(-0.075)#2,938 |
| 95. | Seven Devils | 0.24% | 0.22%(+0.018)#146 | 0.32%(-0.081)#2,939 |
| 96. | Hickory | 0.23% | 0.22%(+0.011)#147 | 0.32%(-0.087)#2,940 |
| 97. | Zebulon | 0.22% | 0.22%(-0.004)#148 | 0.32%(-0.102)#2,941 |
| 98. | Sugar Mountain | 0.20% | 0.22%(-0.015)#149 | 0.32%(-0.113)#2,942 |
| 99. | Selma | 0.20% | 0.22%(-0.018)#150 | 0.32%(-0.116)#2,943 |
| 100. | Kinston | 0.20% | 0.22%(-0.021)#151 | 0.32%(-0.120)#2,944 |
Common Questions
What are the Top 10 Cities with the Highest Percentage of Immigrants from Guatemala in North Carolina?
Top 10 Cities with the Highest Percentage of Immigrants from Guatemala in North Carolina are:
#1
19.08%
#2
16.97%
#3
6.84%
#4
6.71%
#5
5.82%
#6
5.30%
#7
4.75%
#8
4.28%
#9
3.69%
#10
3.24%
What city has the Highest Percentage of Immigrants from Guatemala in North Carolina?
Norman has the Highest Percentage of Immigrants from Guatemala in North Carolina with 19.08%.
What is the Percentage of Immigrants from Guatemala in the State of North Carolina?
Percentage of Immigrants from Guatemala in North Carolina is 0.22%.
What is the Percentage of Immigrants from Guatemala in the United States?
Percentage of Immigrants from Guatemala in the United States is 0.32%.