Bladenboro, NC Map & Demographics
Bladenboro Map
Bladenboro Overview
$20,422
PER CAPITA INCOME
$77,813
AVG FAMILY INCOME
$54,797
AVG HOUSEHOLD INCOME
41.0%
WAGE / INCOME GAP [ % ]
59.0¢/ $1
WAGE / INCOME GAP [ $ ]
0.46
INEQUALITY / GINI INDEX
2,485
TOTAL POPULATION
1,135
MALE POPULATION
1,350
FEMALE POPULATION
84.07
MALES / 100 FEMALES
118.94
FEMALES / 100 MALES
36.4
MEDIAN AGE
4.3
AVG FAMILY SIZE
3.3
AVG HOUSEHOLD SIZE
845
LABOR FORCE [ PEOPLE ]
48.0%
PERCENT IN LABOR FORCE
6.2%
UNEMPLOYMENT RATE
Bladenboro Zip Codes
Bladenboro Area Codes
Income in Bladenboro
Income Overview in Bladenboro
Per Capita Income in Bladenboro is $20,422, while median incomes of families and households are $77,813 and $54,797 respectively.
| Characteristic | Number | Measure |
| Per Capita Income | 2,485 | $20,422 |
| Median Family Income | 513 | $77,813 |
| Mean Family Income | 513 | $76,360 |
| Median Household Income | 756 | $54,797 |
| Mean Household Income | 756 | $58,620 |
| Income Deficit | 513 | $0 |
| Wage / Income Gap (%) | 2,485 | 40.99% |
| Wage / Income Gap ($) | 2,485 | 59.01¢ per $1 |
| Gini / Inequality Index | 2,485 | 0.46 |
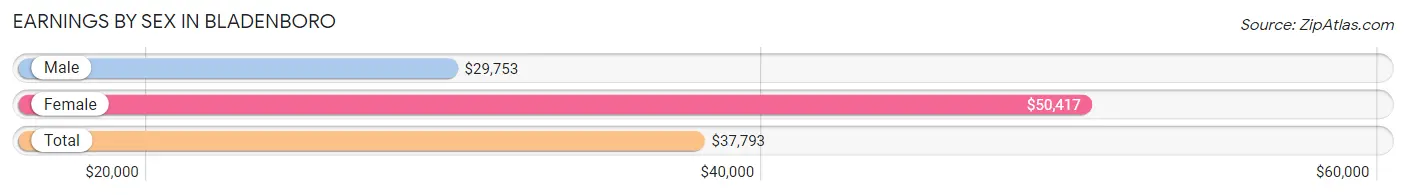
Earnings by Sex in Bladenboro
Average Earnings in Bladenboro are $37,793, $29,753 for men and $50,417 for women, a difference of 41.0%.
| Sex | Number | Average Earnings |
| Male | 509 (57.1%) | $29,753 |
| Female | 382 (42.9%) | $50,417 |
| Total | 891 (100.0%) | $37,793 |
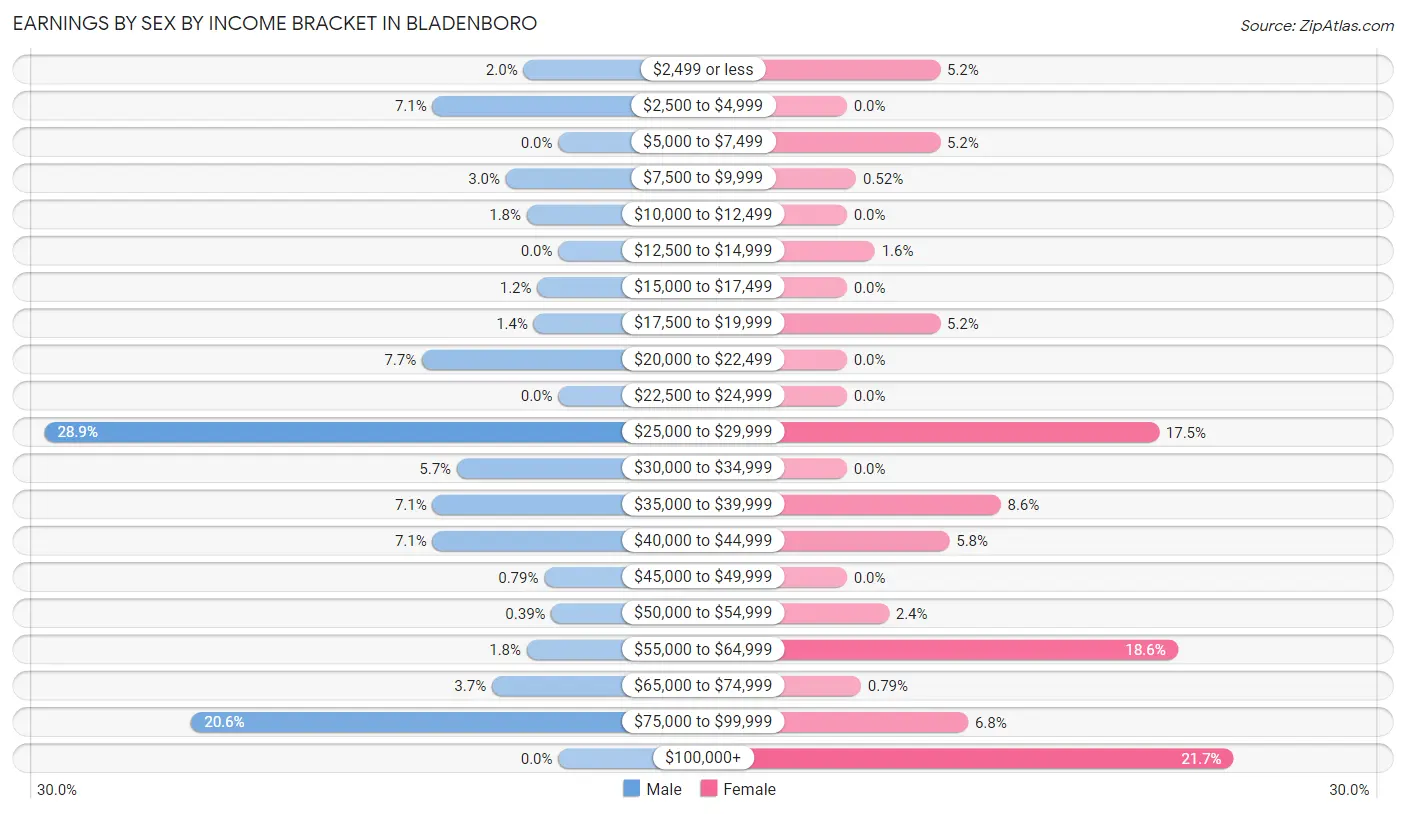
Earnings by Sex by Income Bracket in Bladenboro
The most common earnings brackets in Bladenboro are $25,000 to $29,999 for men (147 | 28.9%) and $100,000+ for women (83 | 21.7%).
| Income | Male | Female |
| $2,499 or less | 10 (2.0%) | 20 (5.2%) |
| $2,500 to $4,999 | 36 (7.1%) | 0 (0.0%) |
| $5,000 to $7,499 | 0 (0.0%) | 20 (5.2%) |
| $7,500 to $9,999 | 15 (2.9%) | 2 (0.5%) |
| $10,000 to $12,499 | 9 (1.8%) | 0 (0.0%) |
| $12,500 to $14,999 | 0 (0.0%) | 6 (1.6%) |
| $15,000 to $17,499 | 6 (1.2%) | 0 (0.0%) |
| $17,500 to $19,999 | 7 (1.4%) | 20 (5.2%) |
| $20,000 to $22,499 | 39 (7.7%) | 0 (0.0%) |
| $22,500 to $24,999 | 0 (0.0%) | 0 (0.0%) |
| $25,000 to $29,999 | 147 (28.9%) | 67 (17.5%) |
| $30,000 to $34,999 | 29 (5.7%) | 0 (0.0%) |
| $35,000 to $39,999 | 36 (7.1%) | 33 (8.6%) |
| $40,000 to $44,999 | 36 (7.1%) | 22 (5.8%) |
| $45,000 to $49,999 | 4 (0.8%) | 0 (0.0%) |
| $50,000 to $54,999 | 2 (0.4%) | 9 (2.4%) |
| $55,000 to $64,999 | 9 (1.8%) | 71 (18.6%) |
| $65,000 to $74,999 | 19 (3.7%) | 3 (0.8%) |
| $75,000 to $99,999 | 105 (20.6%) | 26 (6.8%) |
| $100,000+ | 0 (0.0%) | 83 (21.7%) |
| Total | 509 (100.0%) | 382 (100.0%) |
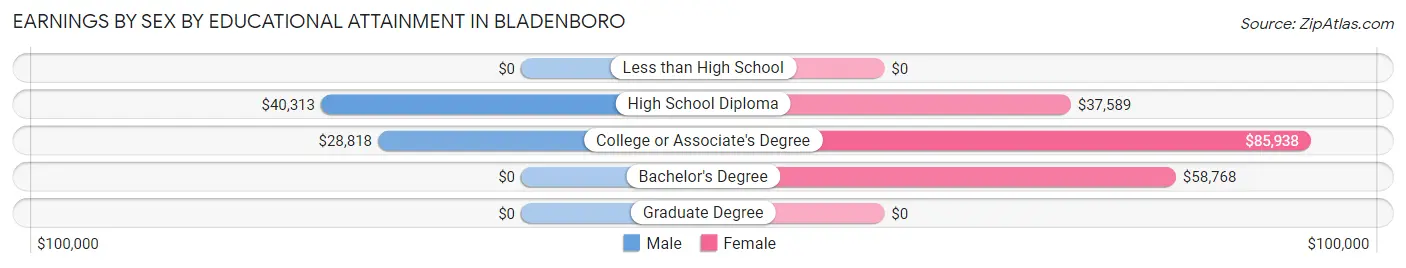
Earnings by Sex by Educational Attainment in Bladenboro
Average earnings in Bladenboro are $29,575 for men and $57,904 for women, a difference of 48.9%. Men with an educational attainment of high school diploma enjoy the highest average annual earnings of $40,313, while those with college or associate's degree education earn the least with $28,818. Women with an educational attainment of college or associate's degree earn the most with the average annual earnings of $85,938, while those with high school diploma education have the smallest earnings of $37,589.
| Educational Attainment | Male Income | Female Income |
| Less than High School | - | - |
| High School Diploma | $40,313 | $37,589 |
| College or Associate's Degree | $28,818 | $85,938 |
| Bachelor's Degree | - | - |
| Graduate Degree | - | - |
| Total | $29,575 | $57,904 |
Family Income in Bladenboro
Family Income Brackets in Bladenboro
According to the Bladenboro family income data, there are 129 families falling into the $50,000 to $74,999 income range, which is the most common income bracket and makes up 25.2% of all families.
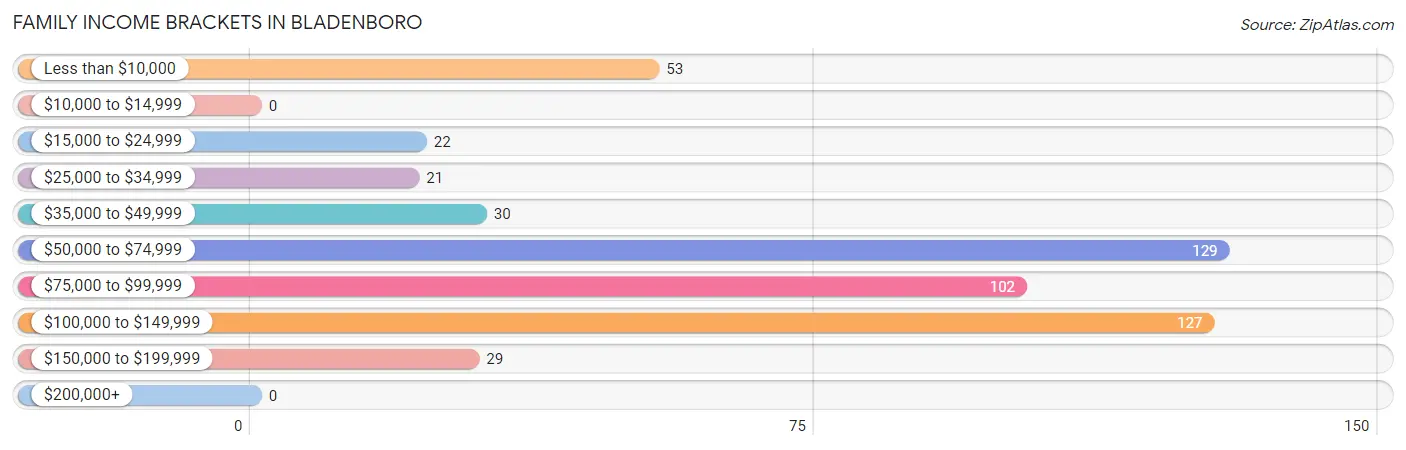
| Income Bracket | # Families | % Families |
| Less than $10,000 | 53 | 10.3% |
| $10,000 to $14,999 | 0 | 0.0% |
| $15,000 to $24,999 | 22 | 4.3% |
| $25,000 to $34,999 | 21 | 4.1% |
| $35,000 to $49,999 | 30 | 5.8% |
| $50,000 to $74,999 | 129 | 25.1% |
| $75,000 to $99,999 | 102 | 19.9% |
| $100,000 to $149,999 | 127 | 24.8% |
| $150,000 to $199,999 | 29 | 5.7% |
| $200,000+ | 0 | 0.0% |
Family Income by Famaliy Size in Bladenboro
4-person families (132 | 25.7%) account for the highest median family income in Bladenboro with $122,708 per family, while 4-person families (132 | 25.7%) have the highest median income of $30,677 per family member.
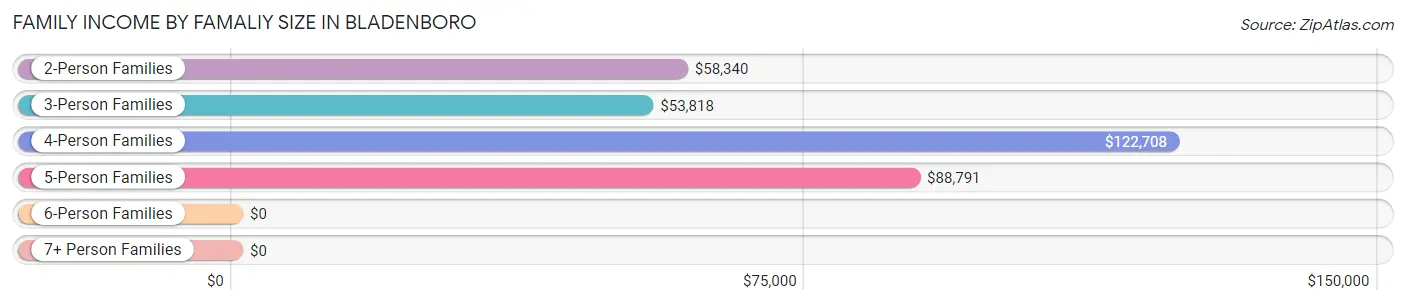
| Income Bracket | # Families | Median Income |
| 2-Person Families | 197 (38.4%) | $58,340 |
| 3-Person Families | 91 (17.7%) | $53,818 |
| 4-Person Families | 132 (25.7%) | $122,708 |
| 5-Person Families | 87 (17.0%) | $88,791 |
| 6-Person Families | 2 (0.4%) | $0 |
| 7+ Person Families | 4 (0.8%) | $0 |
| Total | 513 (100.0%) | $77,813 |
Family Income by Number of Earners in Bladenboro
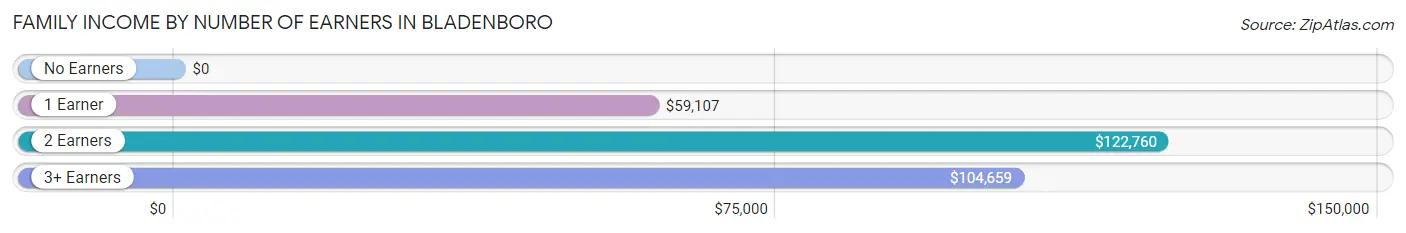
| Number of Earners | # Families | Median Income |
| No Earners | 88 (17.2%) | $0 |
| 1 Earner | 198 (38.6%) | $59,107 |
| 2 Earners | 189 (36.8%) | $122,760 |
| 3+ Earners | 38 (7.4%) | $104,659 |
| Total | 513 (100.0%) | $77,813 |
Household Income in Bladenboro
Household Income Brackets in Bladenboro
With 152 households falling in the category, the $50,000 to $74,999 income range is the most frequent in Bladenboro, accounting for 20.1% of all households. In contrast, only 6 households (0.8%) fall into the $200,000+ income bracket, making it the least populous group.
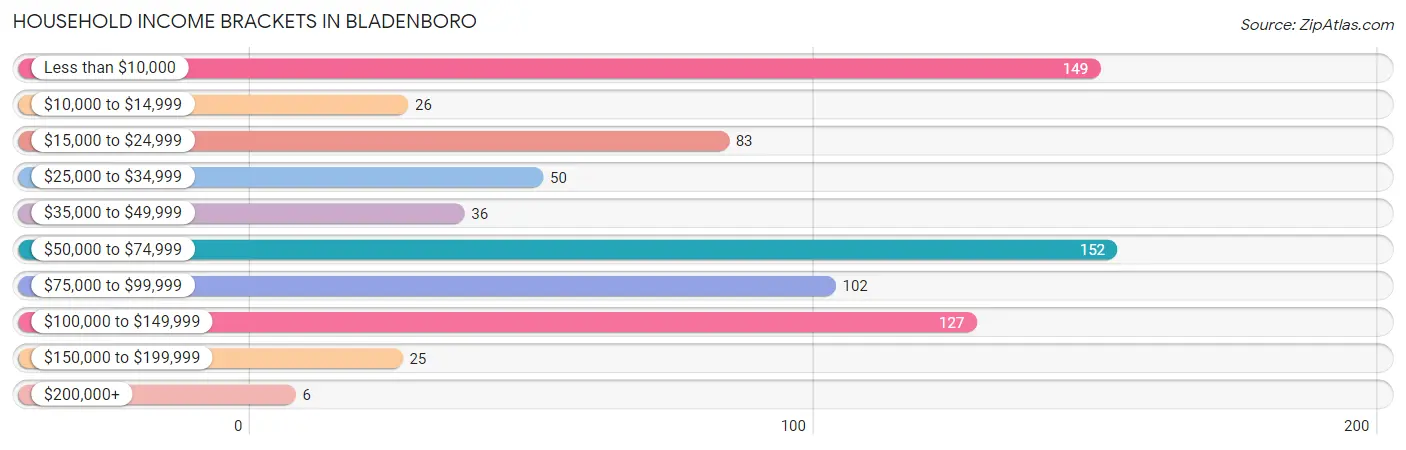
| Income Bracket | # Households | % Households |
| Less than $10,000 | 149 | 19.7% |
| $10,000 to $14,999 | 26 | 3.4% |
| $15,000 to $24,999 | 83 | 11.0% |
| $25,000 to $34,999 | 50 | 6.6% |
| $35,000 to $49,999 | 36 | 4.8% |
| $50,000 to $74,999 | 152 | 20.1% |
| $75,000 to $99,999 | 102 | 13.5% |
| $100,000 to $149,999 | 127 | 16.8% |
| $150,000 to $199,999 | 25 | 3.3% |
| $200,000+ | 6 | 0.8% |
Household Income by Householder Age in Bladenboro
The median household income in Bladenboro is $54,797, with the highest median household income of $87,787 found in the 25 to 44 years age bracket for the primary householder. A total of 320 households (42.3%) fall into this category. Meanwhile, the 15 to 24 years age bracket for the primary householder has the lowest median household income of $0, with 22 households (2.9%) in this group.
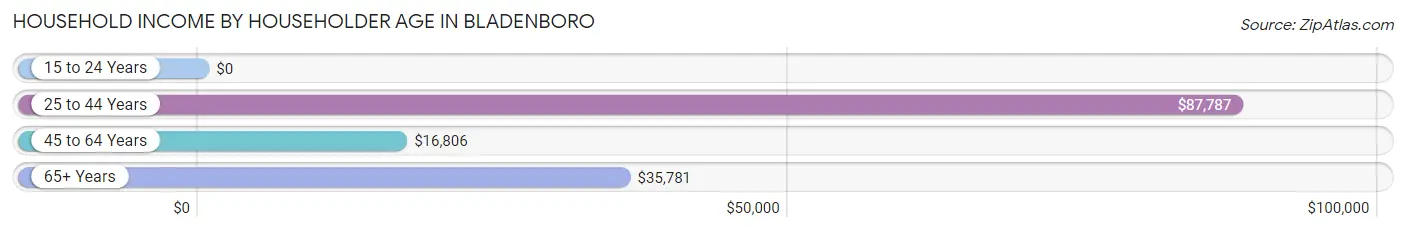
| Income Bracket | # Households | Median Income |
| 15 to 24 Years | 22 (2.9%) | $0 |
| 25 to 44 Years | 320 (42.3%) | $87,787 |
| 45 to 64 Years | 204 (27.0%) | $16,806 |
| 65+ Years | 210 (27.8%) | $35,781 |
| Total | 756 (100.0%) | $54,797 |
Poverty in Bladenboro
Income Below Poverty by Sex and Age in Bladenboro
With 20.3% poverty level for males and 16.4% for females among the residents of Bladenboro, 6 to 11 year old males and under 5 year old females are the most vulnerable to poverty, with 94 males (96.9%) and 18 females (33.3%) in their respective age groups living below the poverty level.
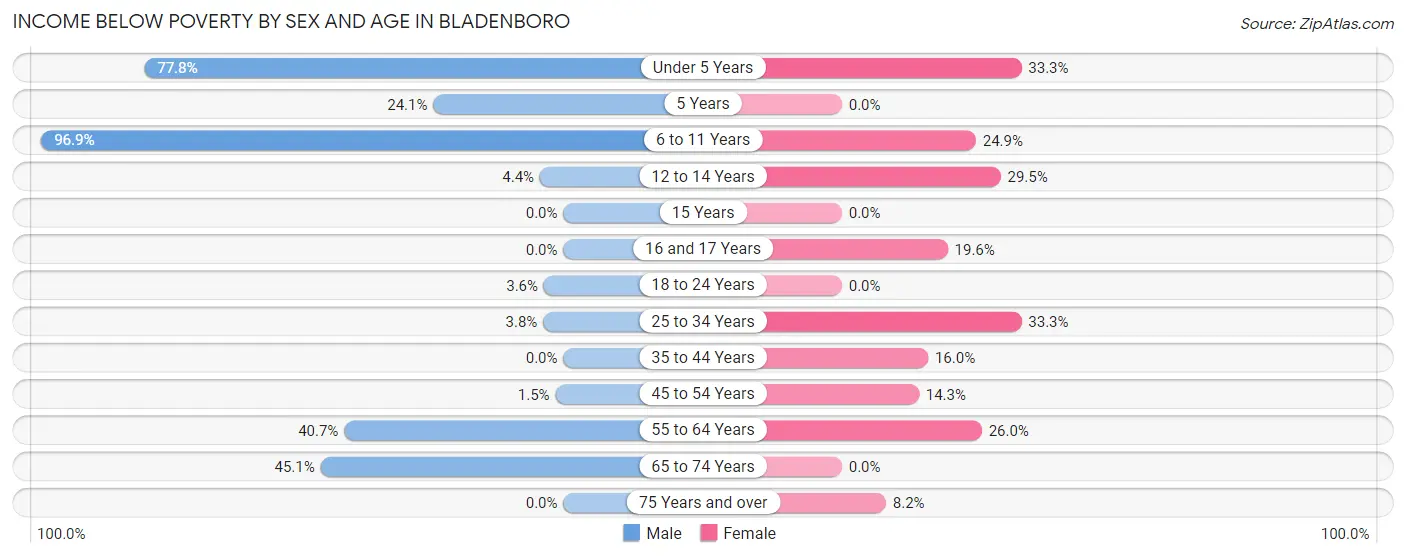
| Age Bracket | Male | Female |
| Under 5 Years | 28 (77.8%) | 18 (33.3%) |
| 5 Years | 14 (24.1%) | 0 (0.0%) |
| 6 to 11 Years | 94 (96.9%) | 49 (24.9%) |
| 12 to 14 Years | 1 (4.3%) | 28 (29.5%) |
| 15 Years | 0 (0.0%) | 0 (0.0%) |
| 16 and 17 Years | 0 (0.0%) | 11 (19.6%) |
| 18 to 24 Years | 8 (3.6%) | 0 (0.0%) |
| 25 to 34 Years | 3 (3.7%) | 28 (33.3%) |
| 35 to 44 Years | 0 (0.0%) | 32 (16.0%) |
| 45 to 54 Years | 1 (1.5%) | 27 (14.3%) |
| 55 to 64 Years | 48 (40.7%) | 20 (26.0%) |
| 65 to 74 Years | 32 (45.1%) | 0 (0.0%) |
| 75 Years and over | 0 (0.0%) | 9 (8.2%) |
| Total | 229 (20.3%) | 222 (16.4%) |
Income Above Poverty by Sex and Age in Bladenboro
According to the poverty statistics in Bladenboro, males aged 16 and 17 years and females aged 5 years are the age groups that are most secure financially, with 100.0% of males and 100.0% of females in these age groups living above the poverty line.
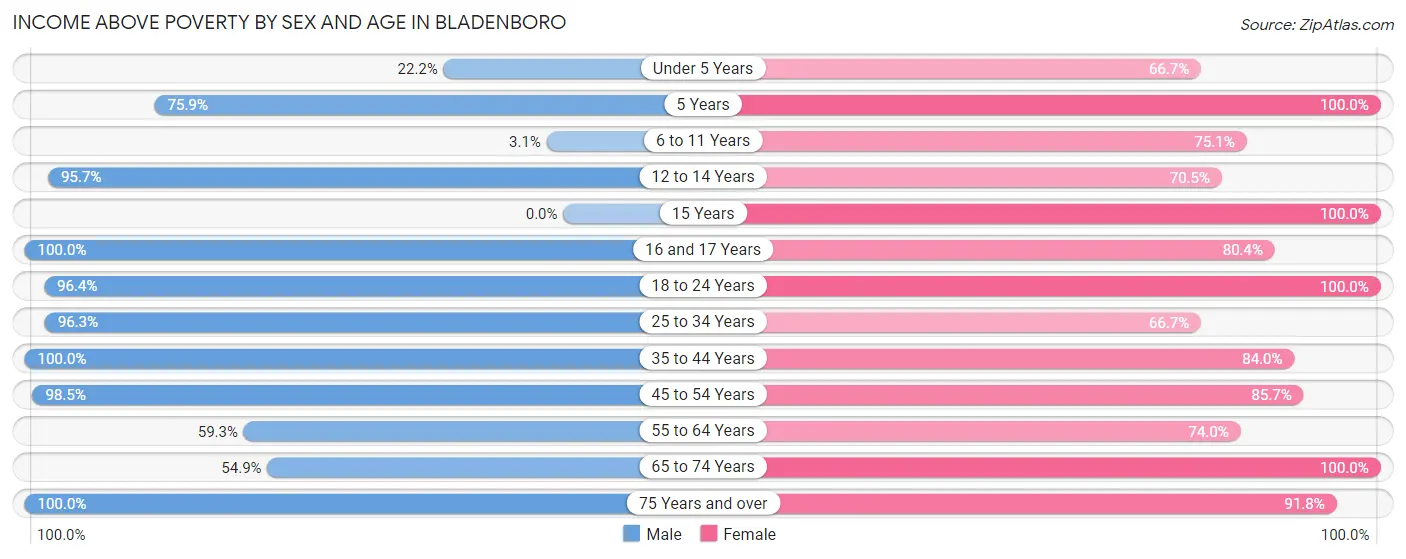
| Age Bracket | Male | Female |
| Under 5 Years | 8 (22.2%) | 36 (66.7%) |
| 5 Years | 44 (75.9%) | 89 (100.0%) |
| 6 to 11 Years | 3 (3.1%) | 148 (75.1%) |
| 12 to 14 Years | 22 (95.7%) | 67 (70.5%) |
| 15 Years | 0 (0.0%) | 69 (100.0%) |
| 16 and 17 Years | 2 (100.0%) | 45 (80.4%) |
| 18 to 24 Years | 213 (96.4%) | 42 (100.0%) |
| 25 to 34 Years | 77 (96.3%) | 56 (66.7%) |
| 35 to 44 Years | 309 (100.0%) | 168 (84.0%) |
| 45 to 54 Years | 67 (98.5%) | 162 (85.7%) |
| 55 to 64 Years | 70 (59.3%) | 57 (74.0%) |
| 65 to 74 Years | 39 (54.9%) | 88 (100.0%) |
| 75 Years and over | 45 (100.0%) | 101 (91.8%) |
| Total | 899 (79.7%) | 1,128 (83.6%) |
Income Below Poverty Among Married-Couple Families in Bladenboro
The poverty statistics for married-couple families in Bladenboro show that 0.7% or 2 of the total 301 families live below the poverty line. Families with 1 or 2 children have the highest poverty rate of 1.1%, comprising of 2 families. On the other hand, families with no children have the lowest poverty rate of 0.0%, which includes 0 families.
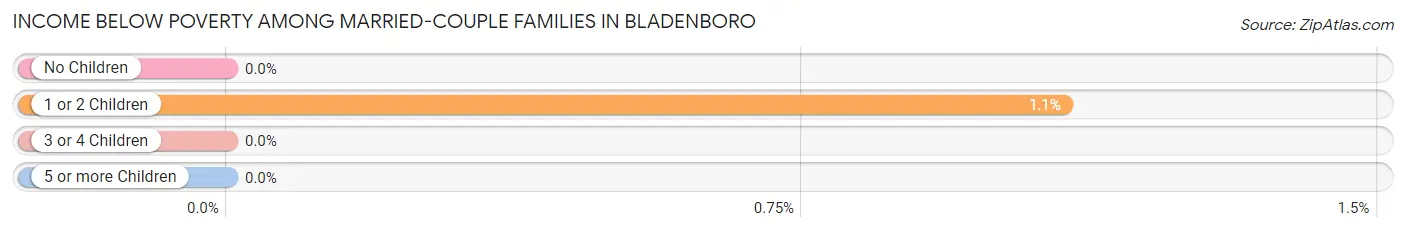
| Children | Above Poverty | Below Poverty |
| No Children | 104 (100.0%) | 0 (0.0%) |
| 1 or 2 Children | 181 (98.9%) | 2 (1.1%) |
| 3 or 4 Children | 14 (100.0%) | 0 (0.0%) |
| 5 or more Children | 0 (0.0%) | 0 (0.0%) |
| Total | 299 (99.3%) | 2 (0.7%) |
Income Below Poverty Among Single-Parent Households in Bladenboro
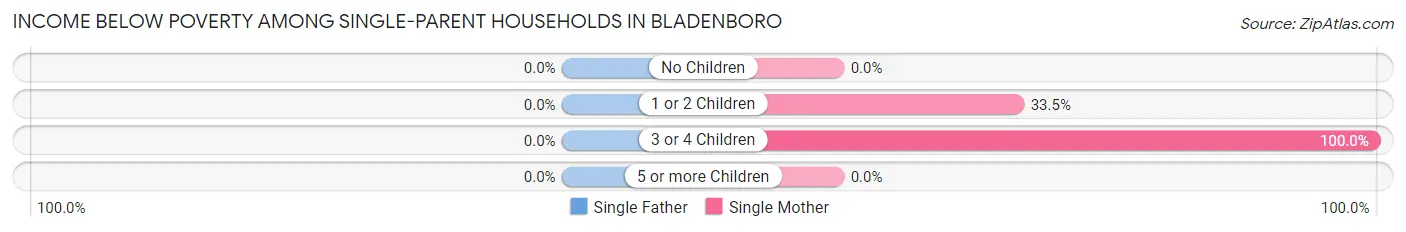
| Children | Single Father | Single Mother |
| No Children | 0 (0.0%) | 0 (0.0%) |
| 1 or 2 Children | 0 (0.0%) | 53 (33.5%) |
| 3 or 4 Children | 0 (0.0%) | 12 (100.0%) |
| 5 or more Children | 0 (0.0%) | 0 (0.0%) |
| Total | 0 (0.0%) | 65 (33.5%) |
Income Below Poverty Among Married-Couple vs Single-Parent Households in Bladenboro
The poverty data for Bladenboro shows that 2 of the married-couple family households (0.7%) and 65 of the single-parent households (30.7%) are living below the poverty level. Within the married-couple family households, those with 1 or 2 children have the highest poverty rate, with 2 households (1.1%) falling below the poverty line. Among the single-parent households, those with 3 or 4 children have the highest poverty rate, with 12 household (100.0%) living below poverty.
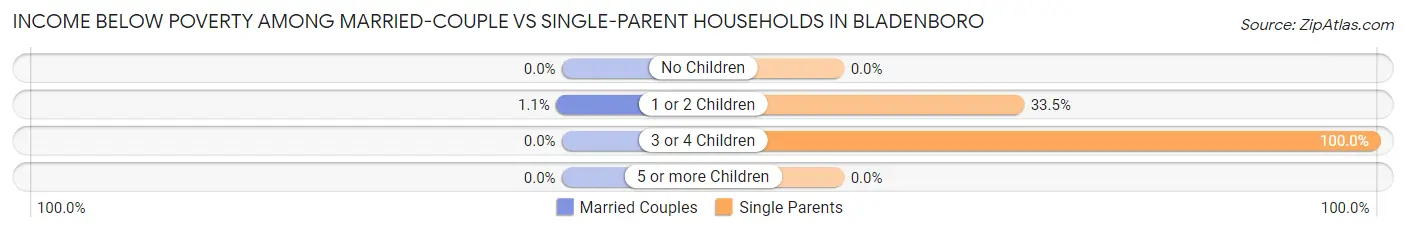
| Children | Married-Couple Families | Single-Parent Households |
| No Children | 0 (0.0%) | 0 (0.0%) |
| 1 or 2 Children | 2 (1.1%) | 53 (33.5%) |
| 3 or 4 Children | 0 (0.0%) | 12 (100.0%) |
| 5 or more Children | 0 (0.0%) | 0 (0.0%) |
| Total | 2 (0.7%) | 65 (30.7%) |
Race in Bladenboro
The most populous races in Bladenboro are White / Caucasian (1,348 | 54.2%), Hispanic or Latino (655 | 26.4%), and Some other Race (501 | 20.2%).
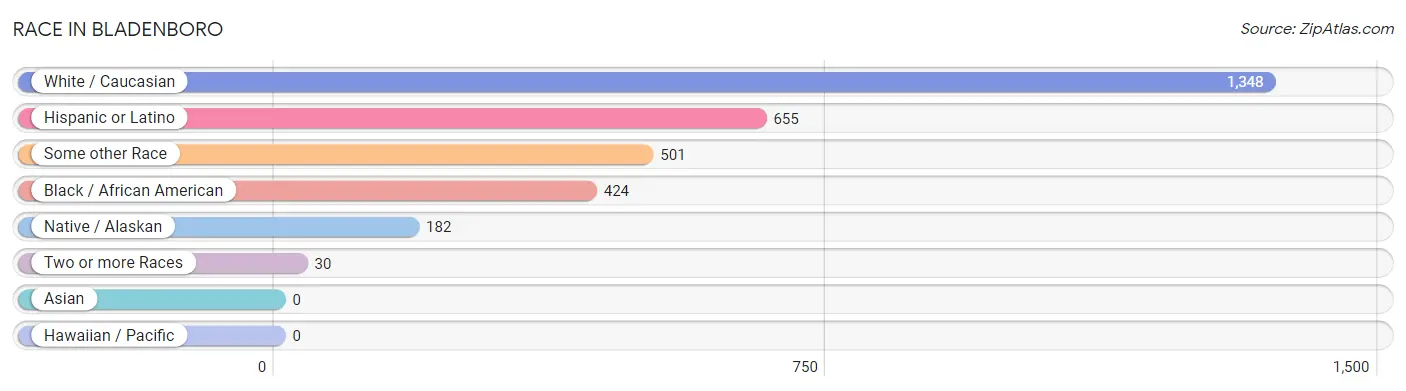
| Race | # Population | % Population |
| Asian | 0 | 0.0% |
| Black / African American | 424 | 17.1% |
| Hawaiian / Pacific | 0 | 0.0% |
| Hispanic or Latino | 655 | 26.4% |
| Native / Alaskan | 182 | 7.3% |
| White / Caucasian | 1,348 | 54.2% |
| Two or more Races | 30 | 1.2% |
| Some other Race | 501 | 20.2% |
| Total | 2,485 | 100.0% |
Ancestry in Bladenboro
The most populous ancestries reported in Bladenboro are American (683 | 27.5%), Central American (501 | 20.2%), Guatemalan (501 | 20.2%), Lumbee (174 | 7.0%), and Mexican (146 | 5.9%), together accounting for 80.7% of all Bladenboro residents.
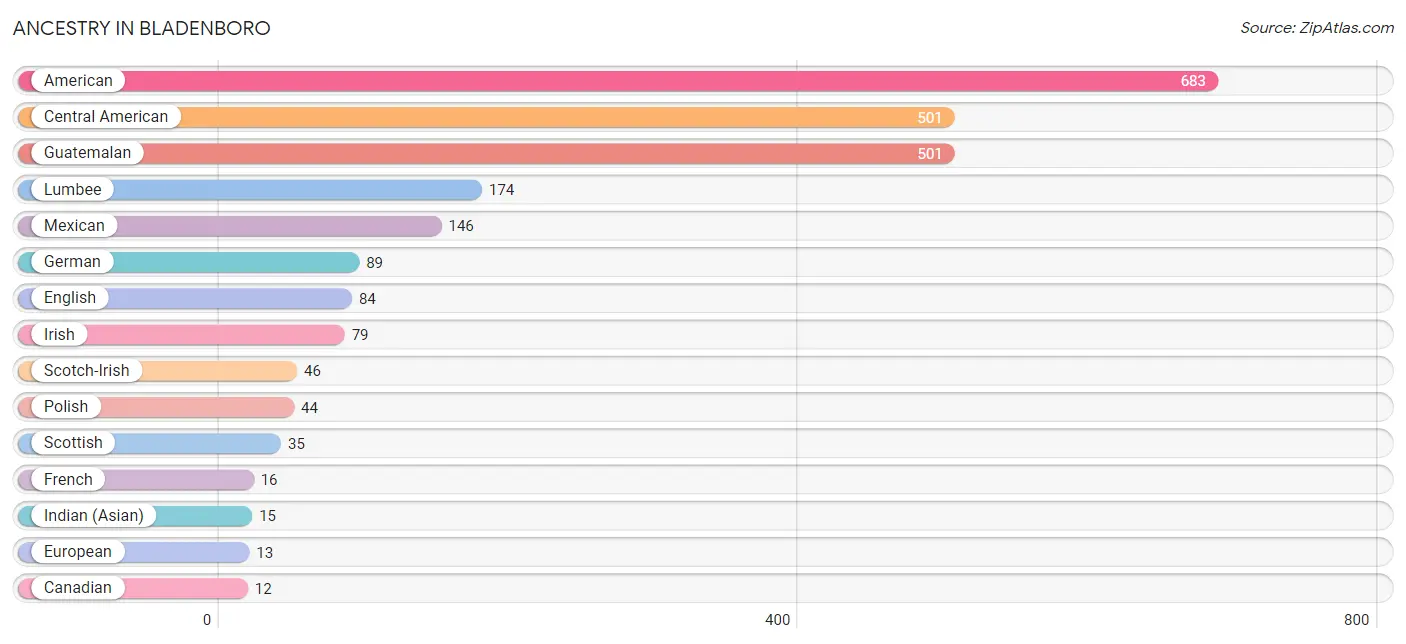
| Ancestry | # Population | % Population |
| American | 683 | 27.5% |
| Canadian | 12 | 0.5% |
| Central American | 501 | 20.2% |
| Central American Indian | 8 | 0.3% |
| English | 84 | 3.4% |
| European | 13 | 0.5% |
| French | 16 | 0.6% |
| German | 89 | 3.6% |
| Guatemalan | 501 | 20.2% |
| Indian (Asian) | 15 | 0.6% |
| Irish | 79 | 3.2% |
| Italian | 11 | 0.4% |
| Lumbee | 174 | 7.0% |
| Mexican | 146 | 5.9% |
| Polish | 44 | 1.8% |
| Puerto Rican | 8 | 0.3% |
| Scotch-Irish | 46 | 1.8% |
| Scottish | 35 | 1.4% |
| Welsh | 3 | 0.1% | View All 19 Rows |
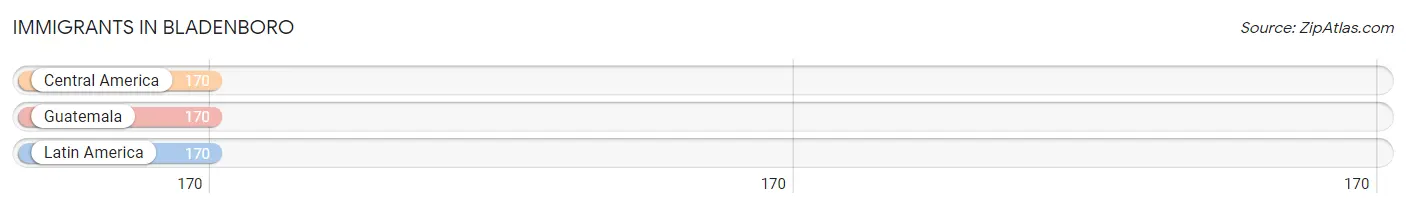
Immigrants in Bladenboro
The most numerous immigrant groups reported in Bladenboro came from Central America (170 | 6.8%), Guatemala (170 | 6.8%), and Latin America (170 | 6.8%), together accounting for 20.5% of all Bladenboro residents.
| Immigration Origin | # Population | % Population |
| Central America | 170 | 6.8% |
| Guatemala | 170 | 6.8% |
| Latin America | 170 | 6.8% | View All 3 Rows |
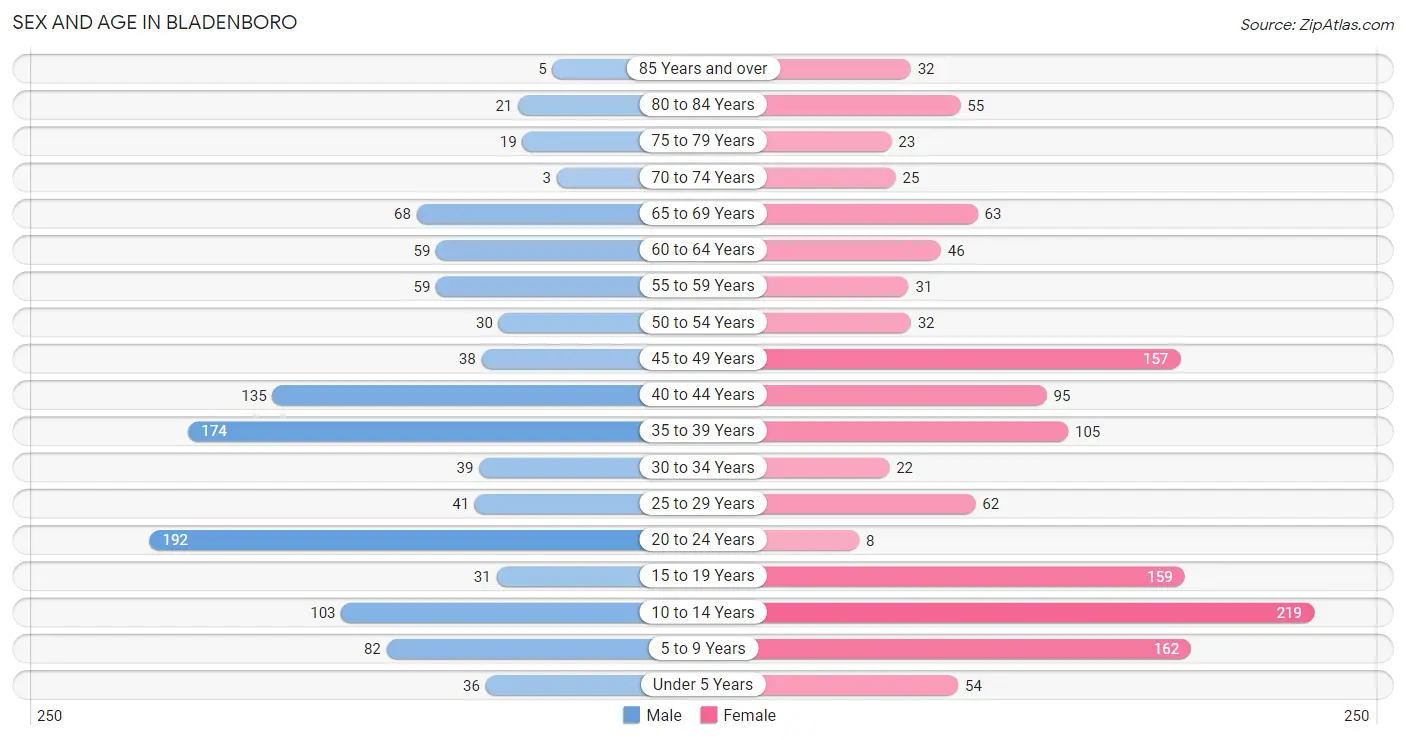
Sex and Age in Bladenboro
Sex and Age in Bladenboro
The most populous age groups in Bladenboro are 20 to 24 Years (192 | 16.9%) for men and 10 to 14 Years (219 | 16.2%) for women.
| Age Bracket | Male | Female |
| Under 5 Years | 36 (3.2%) | 54 (4.0%) |
| 5 to 9 Years | 82 (7.2%) | 162 (12.0%) |
| 10 to 14 Years | 103 (9.1%) | 219 (16.2%) |
| 15 to 19 Years | 31 (2.7%) | 159 (11.8%) |
| 20 to 24 Years | 192 (16.9%) | 8 (0.6%) |
| 25 to 29 Years | 41 (3.6%) | 62 (4.6%) |
| 30 to 34 Years | 39 (3.4%) | 22 (1.6%) |
| 35 to 39 Years | 174 (15.3%) | 105 (7.8%) |
| 40 to 44 Years | 135 (11.9%) | 95 (7.0%) |
| 45 to 49 Years | 38 (3.4%) | 157 (11.6%) |
| 50 to 54 Years | 30 (2.6%) | 32 (2.4%) |
| 55 to 59 Years | 59 (5.2%) | 31 (2.3%) |
| 60 to 64 Years | 59 (5.2%) | 46 (3.4%) |
| 65 to 69 Years | 68 (6.0%) | 63 (4.7%) |
| 70 to 74 Years | 3 (0.3%) | 25 (1.8%) |
| 75 to 79 Years | 19 (1.7%) | 23 (1.7%) |
| 80 to 84 Years | 21 (1.8%) | 55 (4.1%) |
| 85 Years and over | 5 (0.4%) | 32 (2.4%) |
| Total | 1,135 (100.0%) | 1,350 (100.0%) |
Families and Households in Bladenboro
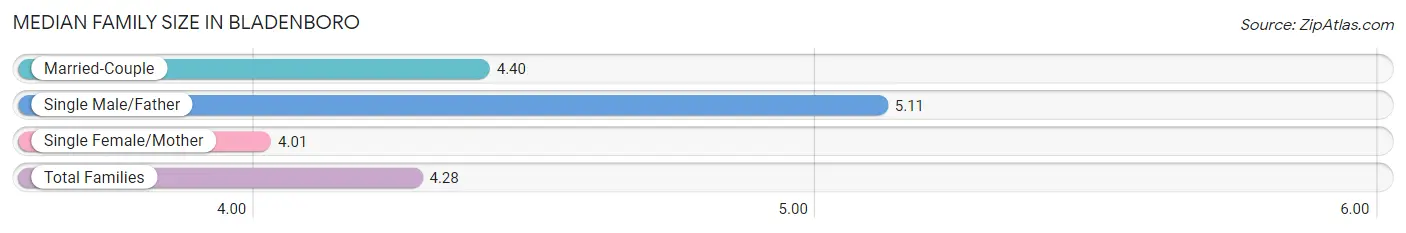
Median Family Size in Bladenboro
The median family size in Bladenboro is 4.28 persons per family, with single male/father families (18 | 3.5%) accounting for the largest median family size of 5.11 persons per family. On the other hand, single female/mother families (194 | 37.8%) represent the smallest median family size with 4.01 persons per family.
| Family Type | # Families | Family Size |
| Married-Couple | 301 (58.7%) | 4.40 |
| Single Male/Father | 18 (3.5%) | 5.11 |
| Single Female/Mother | 194 (37.8%) | 4.01 |
| Total Families | 513 (100.0%) | 4.28 |
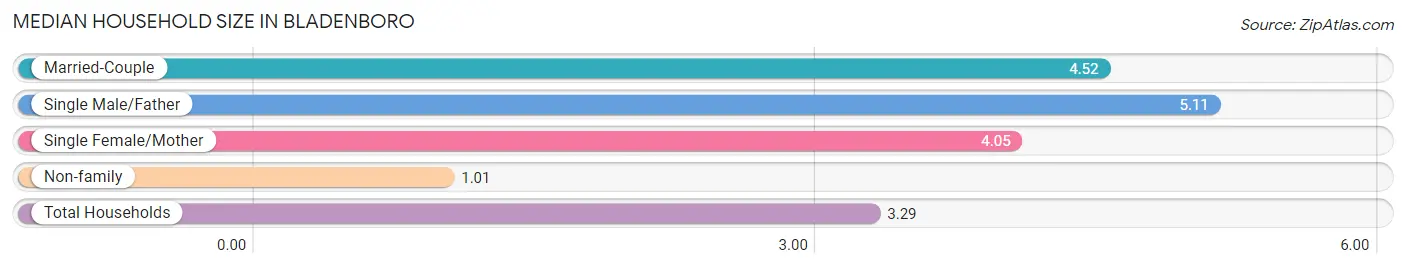
Median Household Size in Bladenboro
The median household size in Bladenboro is 3.29 persons per household, with single male/father households (18 | 2.4%) accounting for the largest median household size of 5.11 persons per household. non-family households (243 | 32.1%) represent the smallest median household size with 1.01 persons per household.
| Household Type | # Households | Household Size |
| Married-Couple | 301 (39.8%) | 4.52 |
| Single Male/Father | 18 (2.4%) | 5.11 |
| Single Female/Mother | 194 (25.7%) | 4.05 |
| Non-family | 243 (32.1%) | 1.01 |
| Total Households | 756 (100.0%) | 3.29 |
Household Size by Marriage Status in Bladenboro
Out of a total of 756 households in Bladenboro, 513 (67.9%) are family households, while 243 (32.1%) are nonfamily households. The most numerous type of family households are 2-person households, comprising 197, and the most common type of nonfamily households are 1-person households, comprising 238.
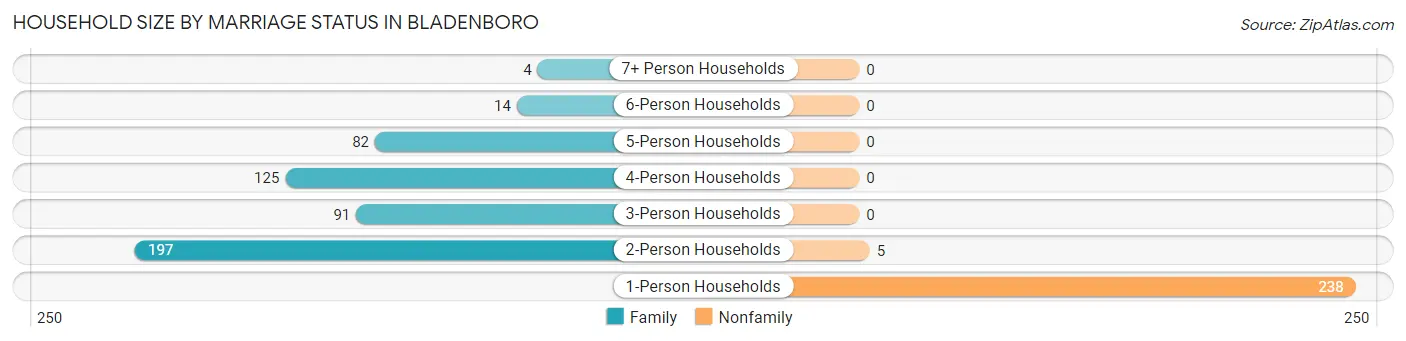
| Household Size | Family Households | Nonfamily Households |
| 1-Person Households | - | 238 (31.5%) |
| 2-Person Households | 197 (26.1%) | 5 (0.7%) |
| 3-Person Households | 91 (12.0%) | 0 (0.0%) |
| 4-Person Households | 125 (16.5%) | 0 (0.0%) |
| 5-Person Households | 82 (10.8%) | 0 (0.0%) |
| 6-Person Households | 14 (1.8%) | 0 (0.0%) |
| 7+ Person Households | 4 (0.5%) | 0 (0.0%) |
| Total | 513 (67.9%) | 243 (32.1%) |
Female Fertility in Bladenboro
Fertility by Age in Bladenboro
Average fertility rate in Bladenboro is 28.0 births per 1,000 women. Women in the age bracket of 20 to 34 years have the highest fertility rate with 185.0 births per 1,000 women. Women in the age bracket of 20 to 34 years acount for 100.0% of all women with births.
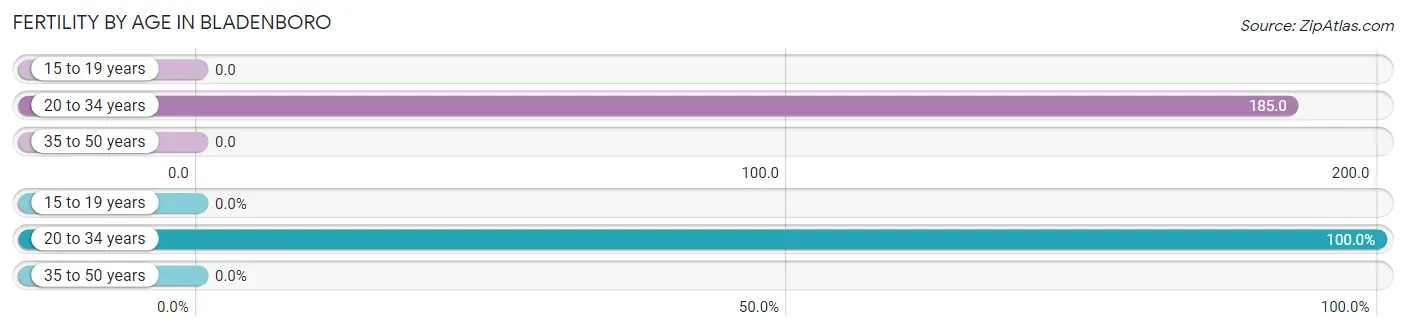
| Age Bracket | Women with Births | Births / 1,000 Women |
| 15 to 19 years | 0 (0.0%) | 0.0 |
| 20 to 34 years | 17 (100.0%) | 185.0 |
| 35 to 50 years | 0 (0.0%) | 0.0 |
| Total | 17 (100.0%) | 28.0 |
Fertility by Age by Marriage Status in Bladenboro
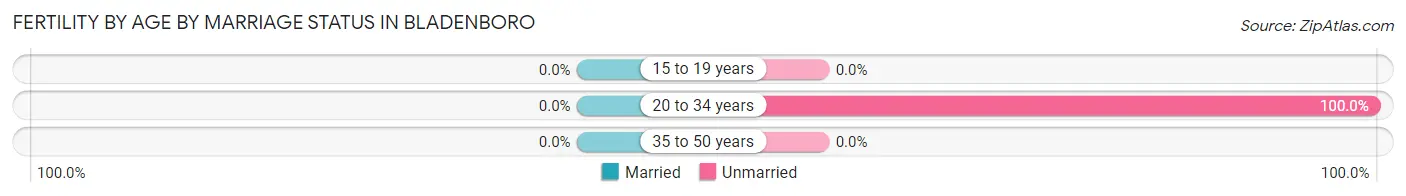
| Age Bracket | Married | Unmarried |
| 15 to 19 years | 0 (0.0%) | 0 (0.0%) |
| 20 to 34 years | 0 (0.0%) | 17 (100.0%) |
| 35 to 50 years | 0 (0.0%) | 0 (0.0%) |
| Total | 0 (0.0%) | 17 (100.0%) |
Fertility by Education in Bladenboro
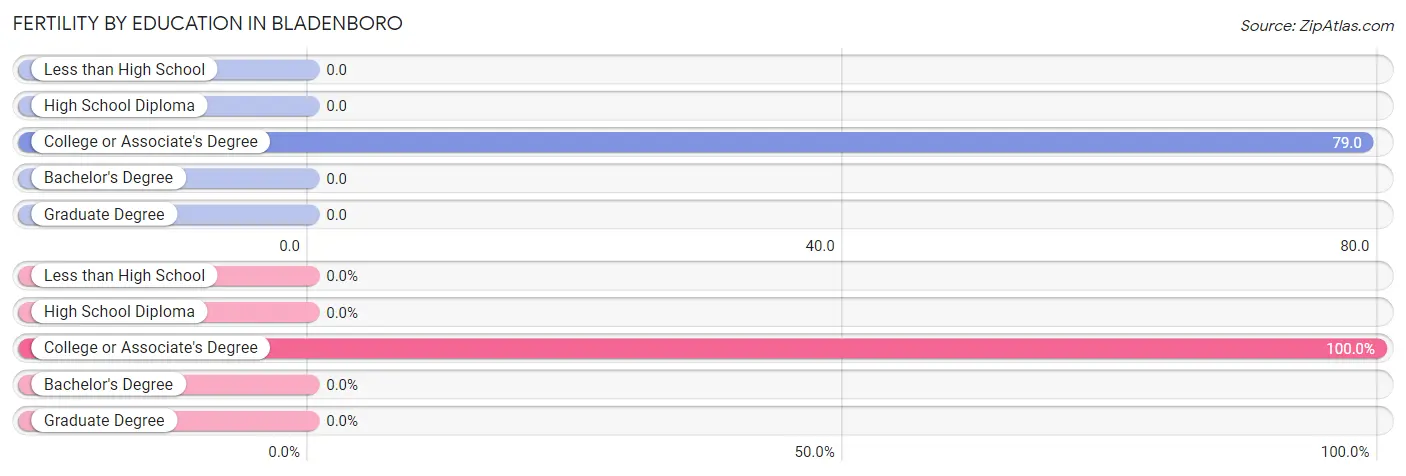
| Educational Attainment | Women with Births | Births / 1,000 Women |
| Less than High School | 0 (0.0%) | 0.0 |
| High School Diploma | 0 (0.0%) | 0.0 |
| College or Associate's Degree | 17 (100.0%) | 79.0 |
| Bachelor's Degree | 0 (0.0%) | 0.0 |
| Graduate Degree | 0 (0.0%) | 0.0 |
| Total | 17 (100.0%) | 28.0 |
Fertility by Education by Marriage Status in Bladenboro
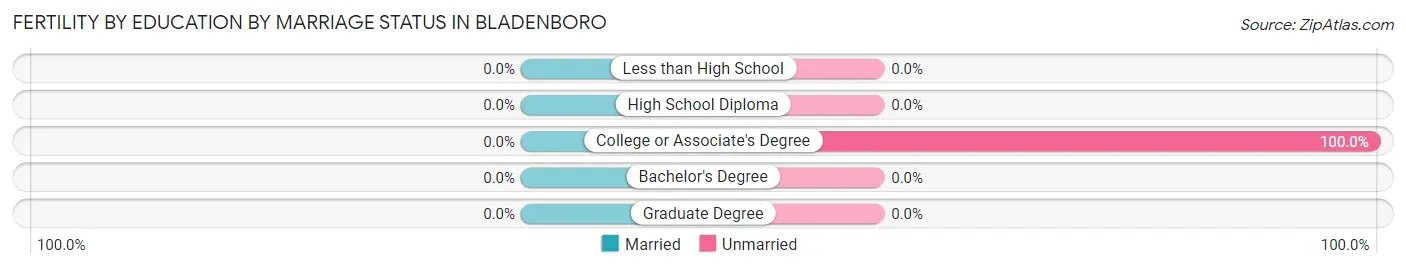
| Educational Attainment | Married | Unmarried |
| Less than High School | 0 (0.0%) | 0 (0.0%) |
| High School Diploma | 0 (0.0%) | 0 (0.0%) |
| College or Associate's Degree | 0 (0.0%) | 17 (100.0%) |
| Bachelor's Degree | 0 (0.0%) | 0 (0.0%) |
| Graduate Degree | 0 (0.0%) | 0 (0.0%) |
| Total | 0 (0.0%) | 17 (100.0%) |
Employment Characteristics in Bladenboro
Employment by Class of Employer in Bladenboro
Among the 787 employed individuals in Bladenboro, private company employees (673 | 85.5%), not-for-profit organizations (39 | 5.0%), and state government employees (38 | 4.8%) make up the most common classes of employment.
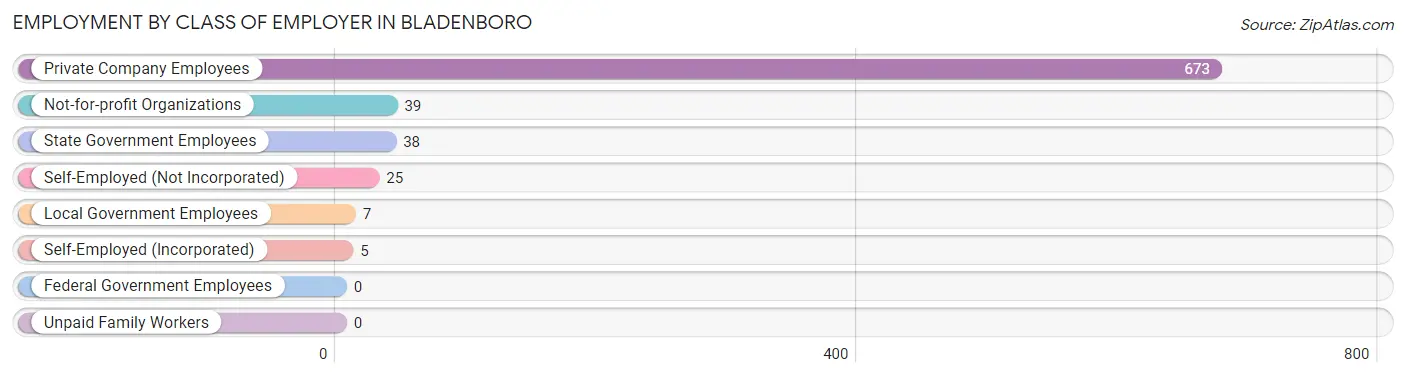
| Employer Class | # Employees | % Employees |
| Private Company Employees | 673 | 85.5% |
| Self-Employed (Incorporated) | 5 | 0.6% |
| Self-Employed (Not Incorporated) | 25 | 3.2% |
| Not-for-profit Organizations | 39 | 5.0% |
| Local Government Employees | 7 | 0.9% |
| State Government Employees | 38 | 4.8% |
| Federal Government Employees | 0 | 0.0% |
| Unpaid Family Workers | 0 | 0.0% |
| Total | 787 | 100.0% |
Employment Status by Age in Bladenboro
According to the labor force statistics for Bladenboro, out of the total population over 16 years of age (1,760), 48.0% or 845 individuals are in the labor force, with 6.2% or 52 of them unemployed. The age group with the highest labor force participation rate is 35 to 44 years, with 90.2% or 459 individuals in the labor force. Within the labor force, the 55 to 59 years age range has the highest percentage of unemployed individuals, with 39.6% or 19 of them being unemployed.
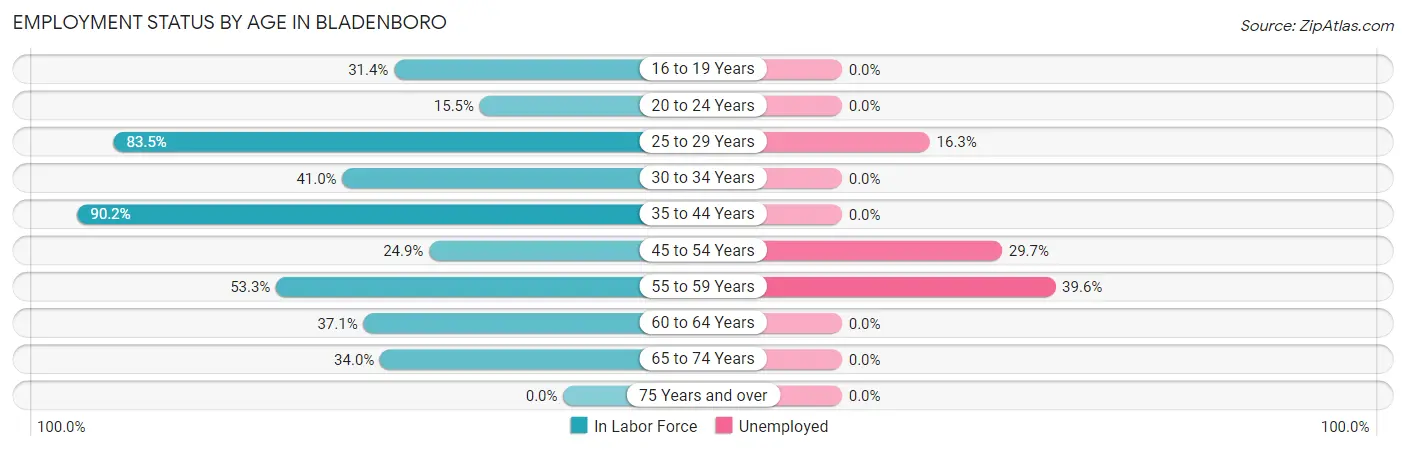
| Age Bracket | In Labor Force | Unemployed |
| 16 to 19 Years | 38 (31.4%) | 0 (0.0%) |
| 20 to 24 Years | 31 (15.5%) | 0 (0.0%) |
| 25 to 29 Years | 86 (83.5%) | 14 (16.3%) |
| 30 to 34 Years | 25 (41.0%) | 0 (0.0%) |
| 35 to 44 Years | 459 (90.2%) | 0 (0.0%) |
| 45 to 54 Years | 64 (24.9%) | 19 (29.7%) |
| 55 to 59 Years | 48 (53.3%) | 19 (39.6%) |
| 60 to 64 Years | 39 (37.1%) | 0 (0.0%) |
| 65 to 74 Years | 54 (34.0%) | 0 (0.0%) |
| 75 Years and over | 0 (0.0%) | 0 (0.0%) |
| Total | 845 (48.0%) | 52 (6.2%) |
Employment Status by Educational Attainment in Bladenboro
According to labor force statistics for Bladenboro, 64.1% of individuals (721) out of the total population between 25 and 64 years of age (1,125) are in the labor force, with 7.2% or 52 of them being unemployed. The group with the highest labor force participation rate are those with the educational attainment of bachelor's degree or higher, with 77.6% or 111 individuals in the labor force. Within the labor force, individuals with high school diploma education have the highest percentage of unemployment, with 15.3% or 43 of them being unemployed.
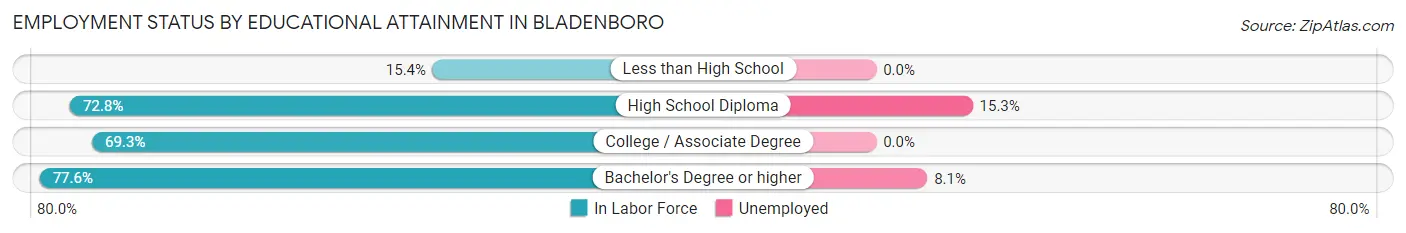
| Educational Attainment | In Labor Force | Unemployed |
| Less than High School | 24 (15.4%) | 0 (0.0%) |
| High School Diploma | 281 (72.8%) | 59 (15.3%) |
| College / Associate Degree | 305 (69.3%) | 0 (0.0%) |
| Bachelor's Degree or higher | 111 (77.6%) | 12 (8.1%) |
| Total | 721 (64.1%) | 81 (7.2%) |
Employment Occupations by Sex in Bladenboro
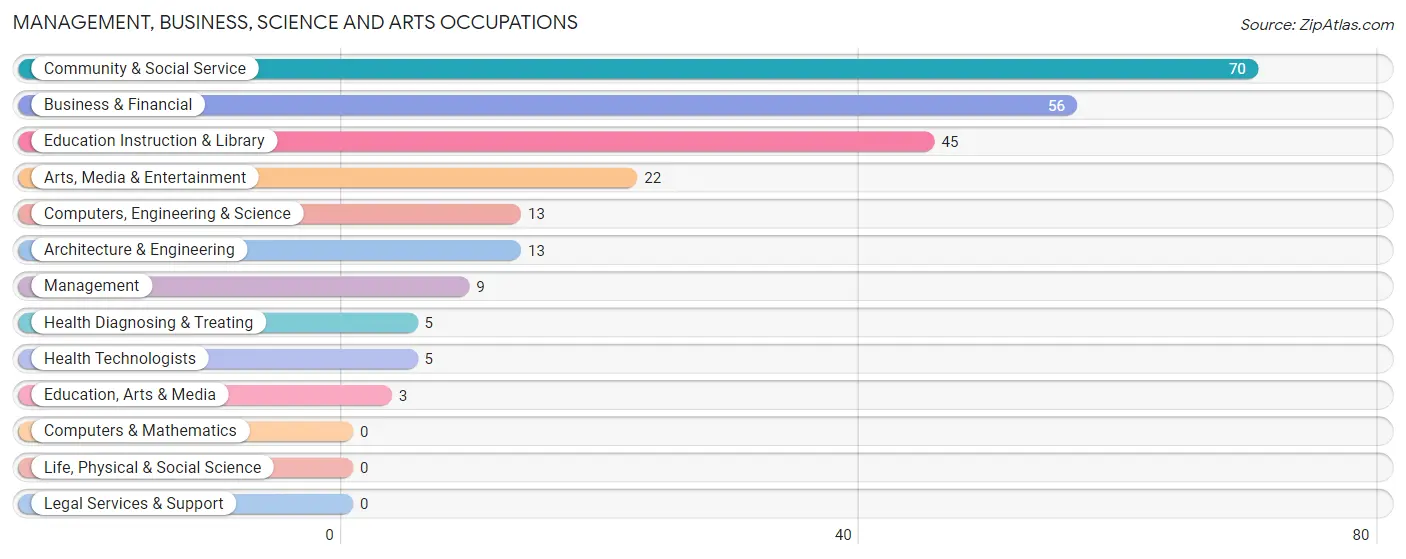
Management, Business, Science and Arts Occupations
The most common Management, Business, Science and Arts occupations in Bladenboro are Community & Social Service (70 | 8.8%), Business & Financial (56 | 7.1%), Education Instruction & Library (45 | 5.7%), Arts, Media & Entertainment (22 | 2.8%), and Computers, Engineering & Science (13 | 1.6%).
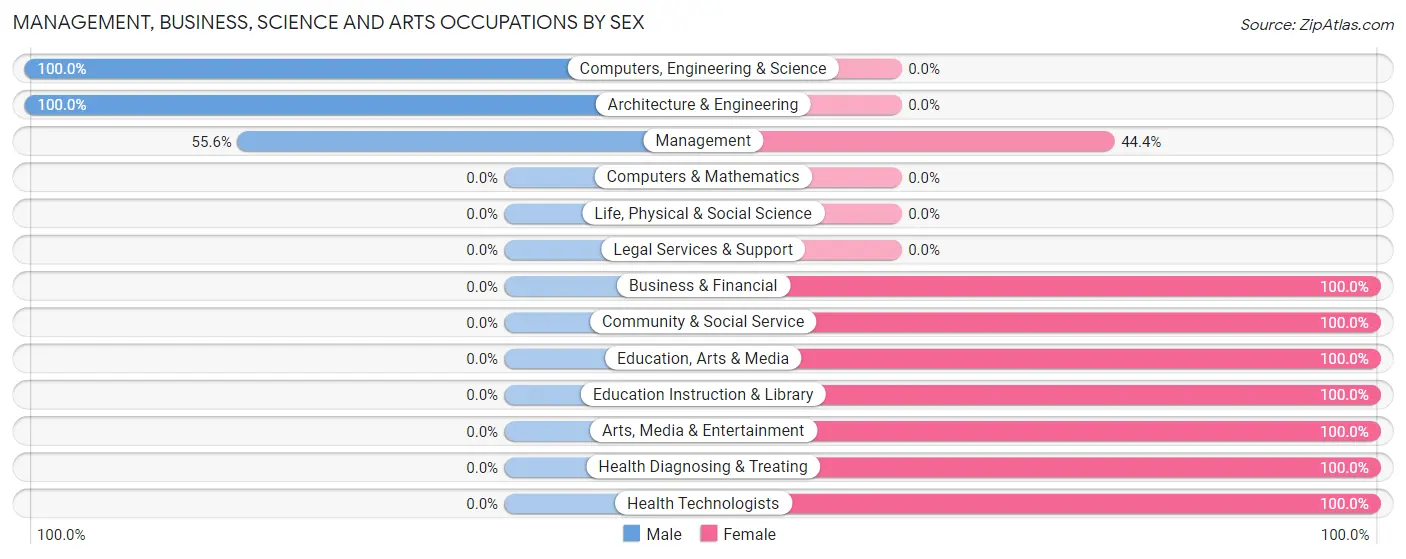
Management, Business, Science and Arts Occupations by Sex
Within the Management, Business, Science and Arts occupations in Bladenboro, the most male-oriented occupations are Computers, Engineering & Science (100.0%), Architecture & Engineering (100.0%), and Management (55.6%), while the most female-oriented occupations are Business & Financial (100.0%), Community & Social Service (100.0%), and Education, Arts & Media (100.0%).
| Occupation | Male | Female |
| Management | 5 (55.6%) | 4 (44.4%) |
| Business & Financial | 0 (0.0%) | 56 (100.0%) |
| Computers, Engineering & Science | 13 (100.0%) | 0 (0.0%) |
| Computers & Mathematics | 0 (0.0%) | 0 (0.0%) |
| Architecture & Engineering | 13 (100.0%) | 0 (0.0%) |
| Life, Physical & Social Science | 0 (0.0%) | 0 (0.0%) |
| Community & Social Service | 0 (0.0%) | 70 (100.0%) |
| Education, Arts & Media | 0 (0.0%) | 3 (100.0%) |
| Legal Services & Support | 0 (0.0%) | 0 (0.0%) |
| Education Instruction & Library | 0 (0.0%) | 45 (100.0%) |
| Arts, Media & Entertainment | 0 (0.0%) | 22 (100.0%) |
| Health Diagnosing & Treating | 0 (0.0%) | 5 (100.0%) |
| Health Technologists | 0 (0.0%) | 5 (100.0%) |
| Total (Category) | 18 (11.8%) | 135 (88.2%) |
| Total (Overall) | 437 (55.2%) | 355 (44.8%) |
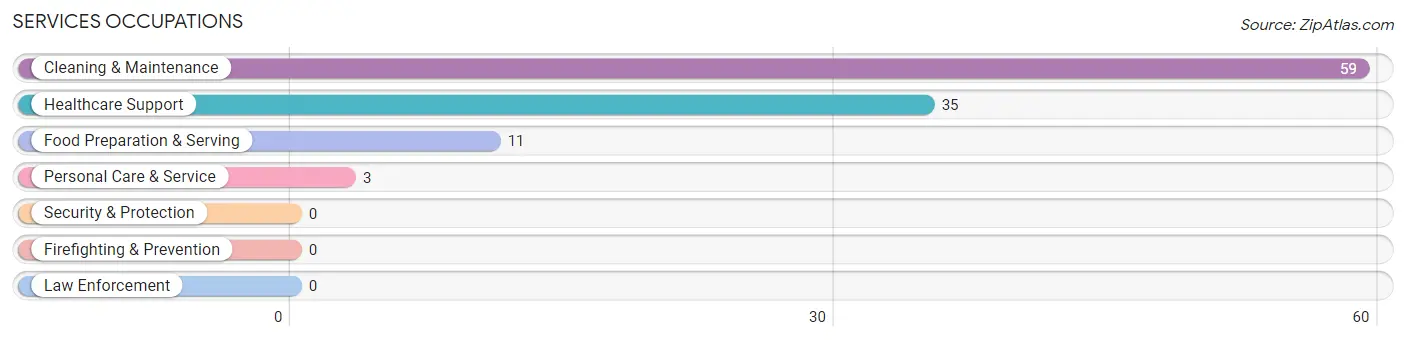
Services Occupations
The most common Services occupations in Bladenboro are Cleaning & Maintenance (59 | 7.4%), Healthcare Support (35 | 4.4%), Food Preparation & Serving (11 | 1.4%), and Personal Care & Service (3 | 0.4%).
Services Occupations by Sex
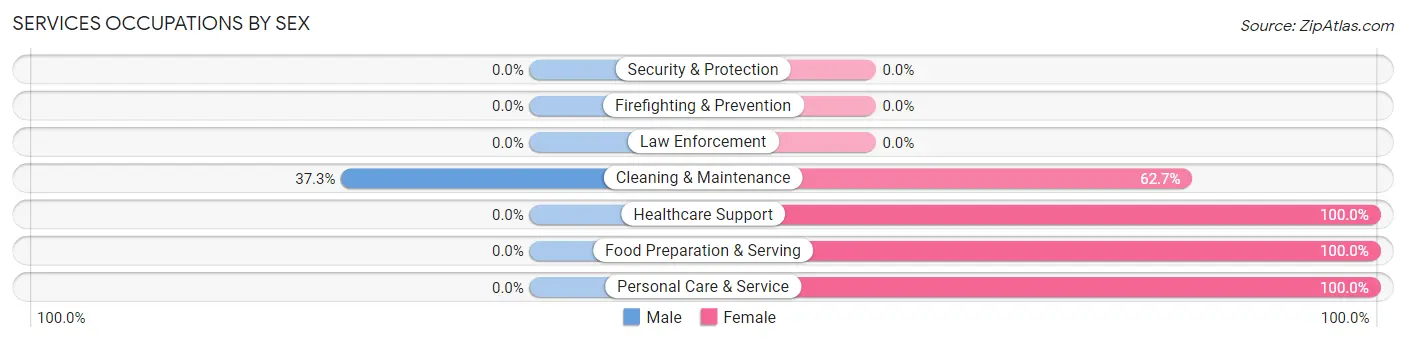
| Occupation | Male | Female |
| Healthcare Support | 0 (0.0%) | 35 (100.0%) |
| Security & Protection | 0 (0.0%) | 0 (0.0%) |
| Firefighting & Prevention | 0 (0.0%) | 0 (0.0%) |
| Law Enforcement | 0 (0.0%) | 0 (0.0%) |
| Food Preparation & Serving | 0 (0.0%) | 11 (100.0%) |
| Cleaning & Maintenance | 22 (37.3%) | 37 (62.7%) |
| Personal Care & Service | 0 (0.0%) | 3 (100.0%) |
| Total (Category) | 22 (20.4%) | 86 (79.6%) |
| Total (Overall) | 437 (55.2%) | 355 (44.8%) |
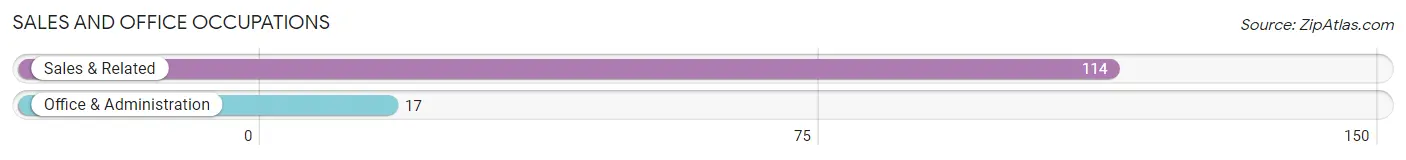
Sales and Office Occupations
The most common Sales and Office occupations in Bladenboro are Sales & Related (114 | 14.4%), and Office & Administration (17 | 2.1%).
Sales and Office Occupations by Sex
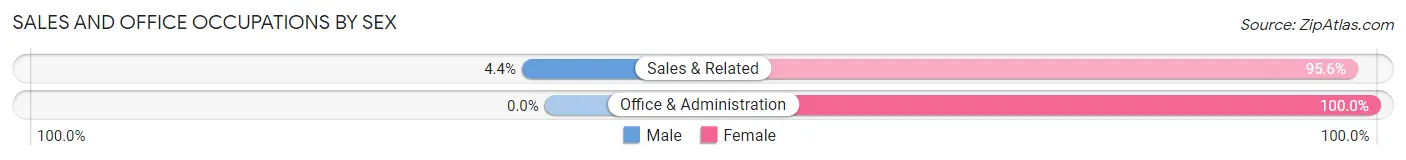
| Occupation | Male | Female |
| Sales & Related | 5 (4.4%) | 109 (95.6%) |
| Office & Administration | 0 (0.0%) | 17 (100.0%) |
| Total (Category) | 5 (3.8%) | 126 (96.2%) |
| Total (Overall) | 437 (55.2%) | 355 (44.8%) |
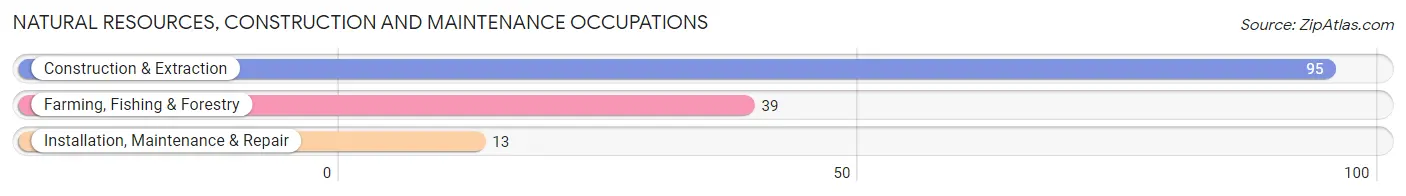
Natural Resources, Construction and Maintenance Occupations
The most common Natural Resources, Construction and Maintenance occupations in Bladenboro are Construction & Extraction (95 | 12.0%), Farming, Fishing & Forestry (39 | 4.9%), and Installation, Maintenance & Repair (13 | 1.6%).
Natural Resources, Construction and Maintenance Occupations by Sex
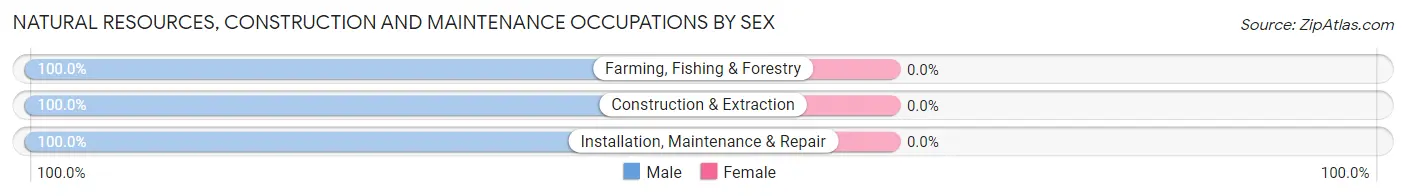
| Occupation | Male | Female |
| Farming, Fishing & Forestry | 39 (100.0%) | 0 (0.0%) |
| Construction & Extraction | 95 (100.0%) | 0 (0.0%) |
| Installation, Maintenance & Repair | 13 (100.0%) | 0 (0.0%) |
| Total (Category) | 147 (100.0%) | 0 (0.0%) |
| Total (Overall) | 437 (55.2%) | 355 (44.8%) |
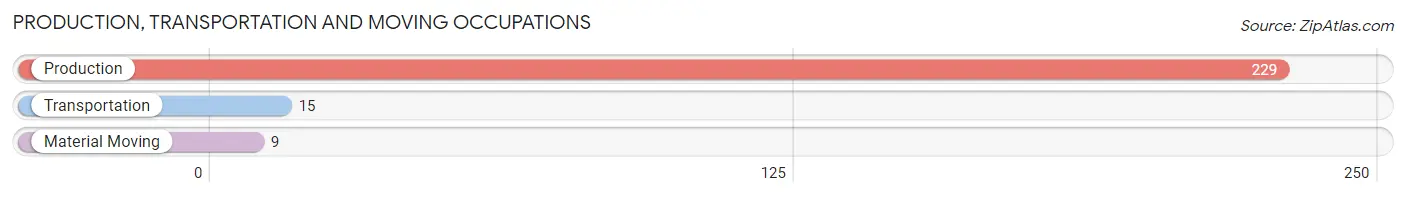
Production, Transportation and Moving Occupations
The most common Production, Transportation and Moving occupations in Bladenboro are Production (229 | 28.9%), Transportation (15 | 1.9%), and Material Moving (9 | 1.1%).
Production, Transportation and Moving Occupations by Sex
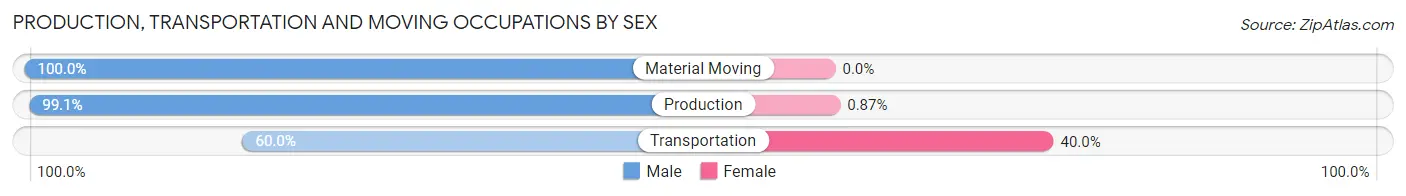
| Occupation | Male | Female |
| Production | 227 (99.1%) | 2 (0.9%) |
| Transportation | 9 (60.0%) | 6 (40.0%) |
| Material Moving | 9 (100.0%) | 0 (0.0%) |
| Total (Category) | 245 (96.8%) | 8 (3.2%) |
| Total (Overall) | 437 (55.2%) | 355 (44.8%) |
Employment Industries by Sex in Bladenboro
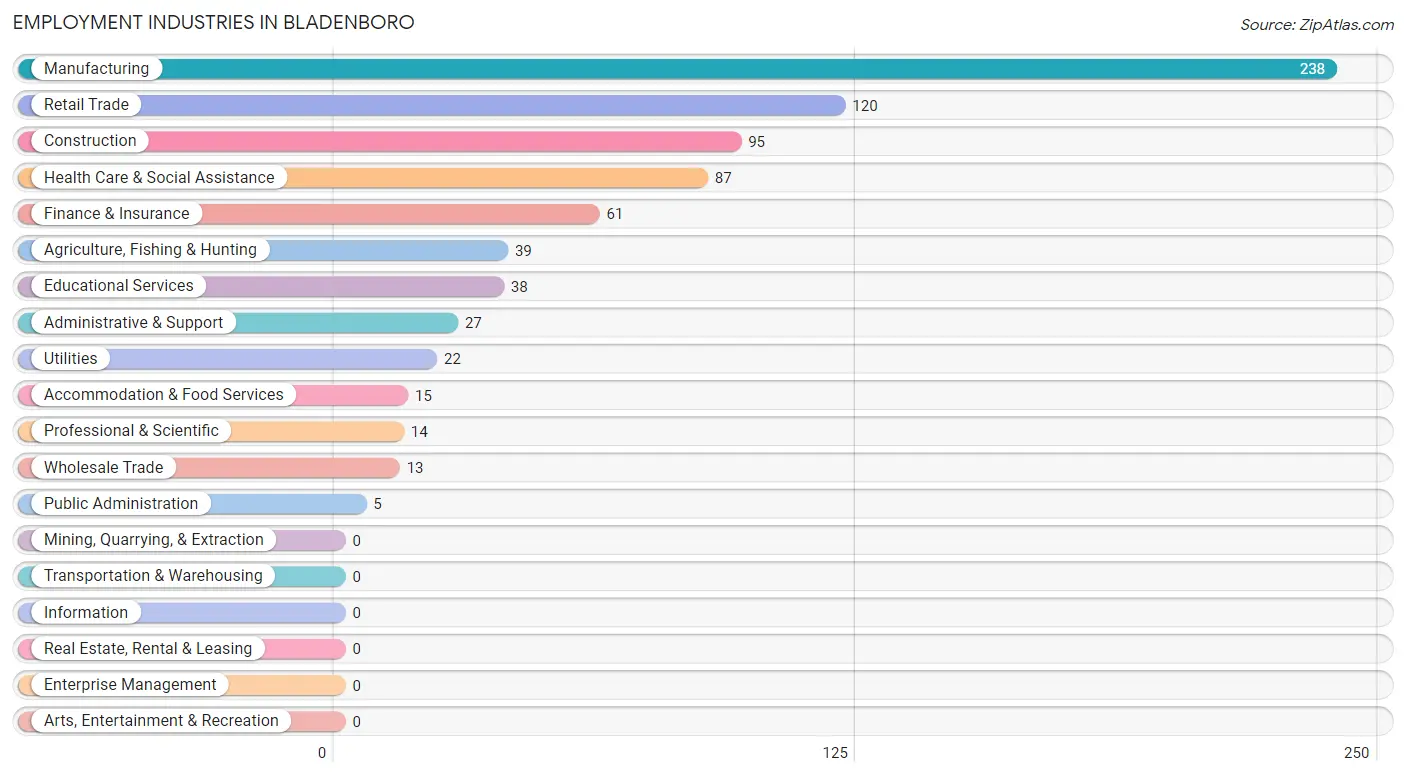
Employment Industries in Bladenboro
The major employment industries in Bladenboro include Manufacturing (238 | 30.0%), Retail Trade (120 | 15.1%), Construction (95 | 12.0%), Health Care & Social Assistance (87 | 11.0%), and Finance & Insurance (61 | 7.7%).
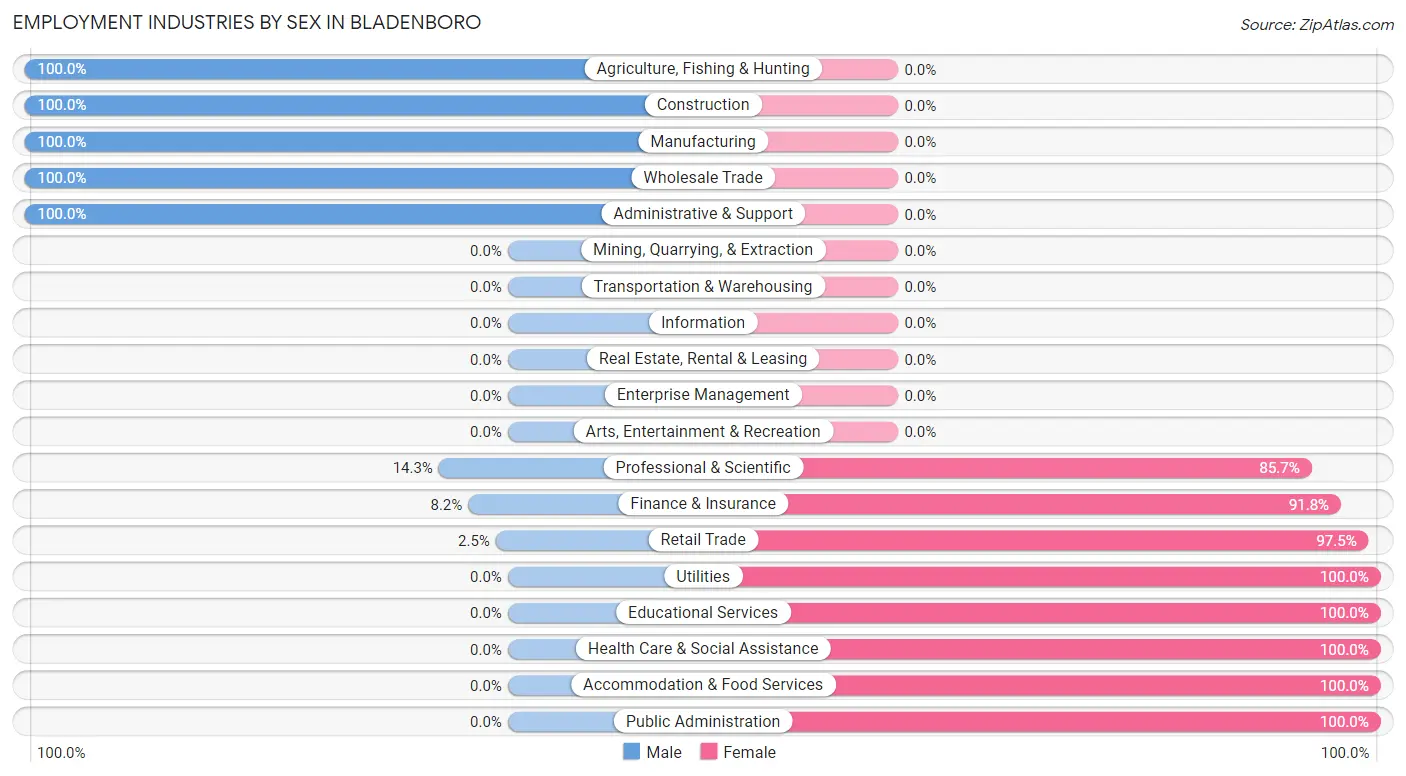
Employment Industries by Sex in Bladenboro
The Bladenboro industries that see more men than women are Agriculture, Fishing & Hunting (100.0%), Construction (100.0%), and Manufacturing (100.0%), whereas the industries that tend to have a higher number of women are Utilities (100.0%), Educational Services (100.0%), and Health Care & Social Assistance (100.0%).
| Industry | Male | Female |
| Agriculture, Fishing & Hunting | 39 (100.0%) | 0 (0.0%) |
| Mining, Quarrying, & Extraction | 0 (0.0%) | 0 (0.0%) |
| Construction | 95 (100.0%) | 0 (0.0%) |
| Manufacturing | 238 (100.0%) | 0 (0.0%) |
| Wholesale Trade | 13 (100.0%) | 0 (0.0%) |
| Retail Trade | 3 (2.5%) | 117 (97.5%) |
| Transportation & Warehousing | 0 (0.0%) | 0 (0.0%) |
| Utilities | 0 (0.0%) | 22 (100.0%) |
| Information | 0 (0.0%) | 0 (0.0%) |
| Finance & Insurance | 5 (8.2%) | 56 (91.8%) |
| Real Estate, Rental & Leasing | 0 (0.0%) | 0 (0.0%) |
| Professional & Scientific | 2 (14.3%) | 12 (85.7%) |
| Enterprise Management | 0 (0.0%) | 0 (0.0%) |
| Administrative & Support | 27 (100.0%) | 0 (0.0%) |
| Educational Services | 0 (0.0%) | 38 (100.0%) |
| Health Care & Social Assistance | 0 (0.0%) | 87 (100.0%) |
| Arts, Entertainment & Recreation | 0 (0.0%) | 0 (0.0%) |
| Accommodation & Food Services | 0 (0.0%) | 15 (100.0%) |
| Public Administration | 0 (0.0%) | 5 (100.0%) |
| Total | 437 (55.2%) | 355 (44.8%) |
Education in Bladenboro
School Enrollment in Bladenboro
The most common levels of schooling among the 834 students in Bladenboro are middle school (234 | 28.1%), elementary school (173 | 20.7%), and college / undergraduate (160 | 19.2%).
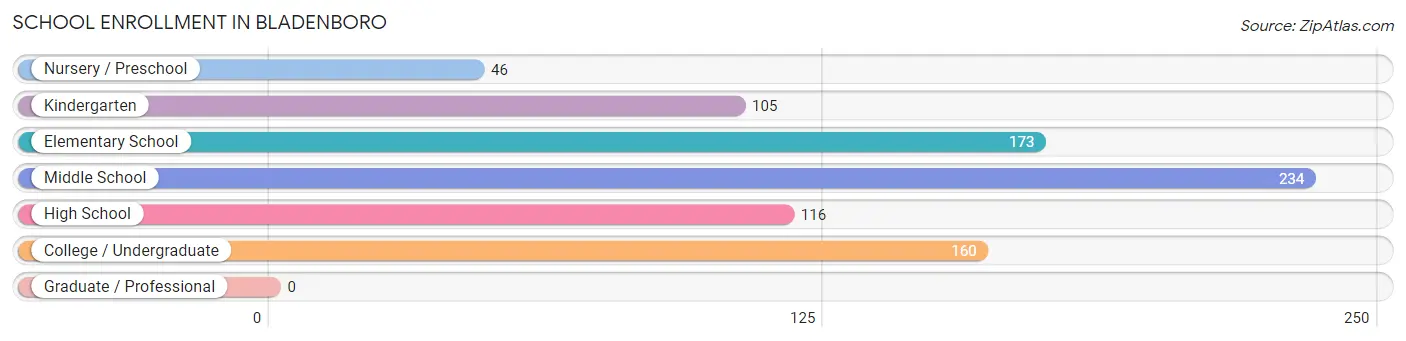
| School Level | # Students | % Students |
| Nursery / Preschool | 46 | 5.5% |
| Kindergarten | 105 | 12.6% |
| Elementary School | 173 | 20.7% |
| Middle School | 234 | 28.1% |
| High School | 116 | 13.9% |
| College / Undergraduate | 160 | 19.2% |
| Graduate / Professional | 0 | 0.0% |
| Total | 834 | 100.0% |
School Enrollment by Age by Funding Source in Bladenboro
Out of a total of 834 students who are enrolled in schools in Bladenboro, 64 (7.7%) attend a private institution, while the remaining 770 (92.3%) are enrolled in public schools. The age group of 5 to 9 year old has the highest likelihood of being enrolled in private schools, with 60 (24.9% in the age bracket) enrolled. Conversely, the age group of 15 to 17 year olds has the lowest likelihood of being enrolled in a private school, with 82 (100.0% in the age bracket) attending a public institution.
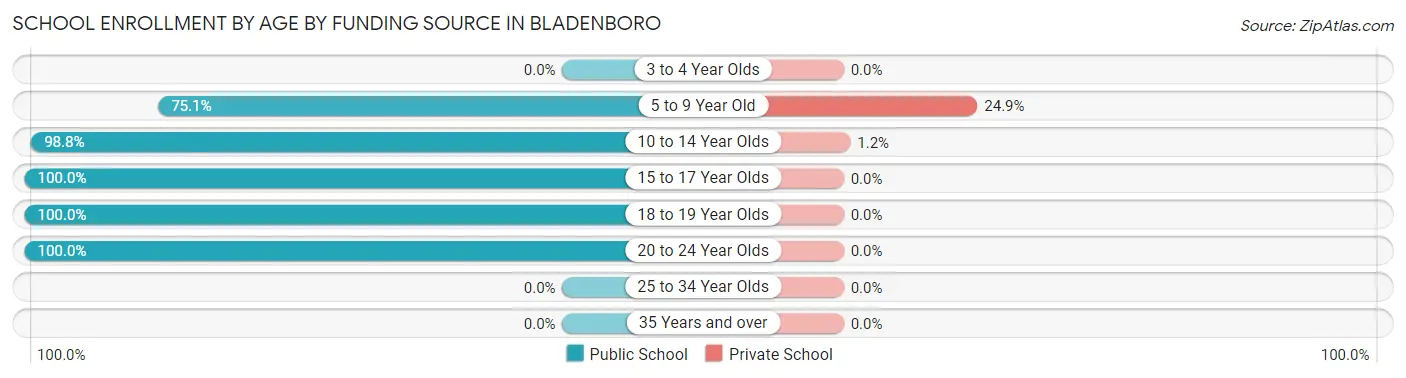
| Age Bracket | Public School | Private School |
| 3 to 4 Year Olds | 0 (0.0%) | 0 (0.0%) |
| 5 to 9 Year Old | 181 (75.1%) | 60 (24.9%) |
| 10 to 14 Year Olds | 318 (98.8%) | 4 (1.2%) |
| 15 to 17 Year Olds | 82 (100.0%) | 0 (0.0%) |
| 18 to 19 Year Olds | 36 (100.0%) | 0 (0.0%) |
| 20 to 24 Year Olds | 153 (100.0%) | 0 (0.0%) |
| 25 to 34 Year Olds | 0 (0.0%) | 0 (0.0%) |
| 35 Years and over | 0 (0.0%) | 0 (0.0%) |
| Total | 770 (92.3%) | 64 (7.7%) |
Educational Attainment by Field of Study in Bladenboro
Business (86 | 45.5%), education (31 | 16.4%), science & technology (20 | 10.6%), engineering (18 | 9.5%), and physical & health sciences (17 | 9.0%) are the most common fields of study among 189 individuals in Bladenboro who have obtained a bachelor's degree or higher.
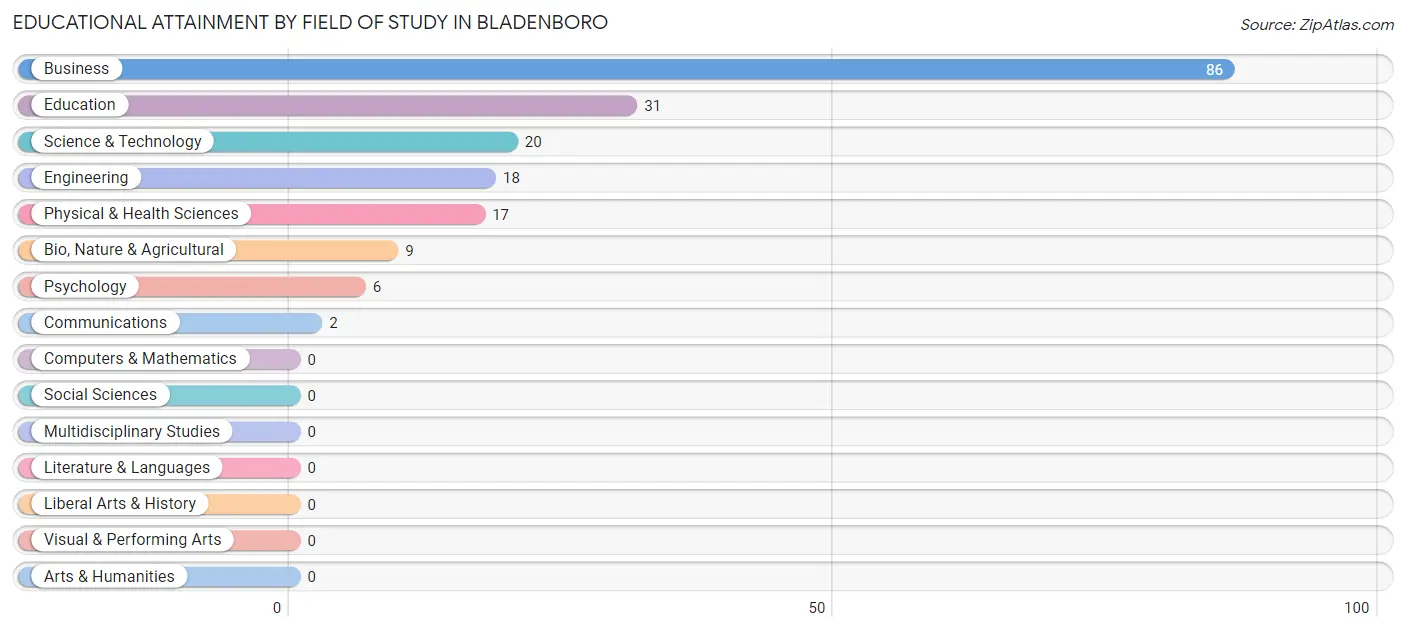
| Field of Study | # Graduates | % Graduates |
| Computers & Mathematics | 0 | 0.0% |
| Bio, Nature & Agricultural | 9 | 4.8% |
| Physical & Health Sciences | 17 | 9.0% |
| Psychology | 6 | 3.2% |
| Social Sciences | 0 | 0.0% |
| Engineering | 18 | 9.5% |
| Multidisciplinary Studies | 0 | 0.0% |
| Science & Technology | 20 | 10.6% |
| Business | 86 | 45.5% |
| Education | 31 | 16.4% |
| Literature & Languages | 0 | 0.0% |
| Liberal Arts & History | 0 | 0.0% |
| Visual & Performing Arts | 0 | 0.0% |
| Communications | 2 | 1.1% |
| Arts & Humanities | 0 | 0.0% |
| Total | 189 | 100.0% |
Transportation & Commute in Bladenboro
Vehicle Availability by Sex in Bladenboro
The most prevalent vehicle ownership categories in Bladenboro are males with 2 vehicles (279, accounting for 64.6%) and females with 2 vehicles (122, making up 78.6%).
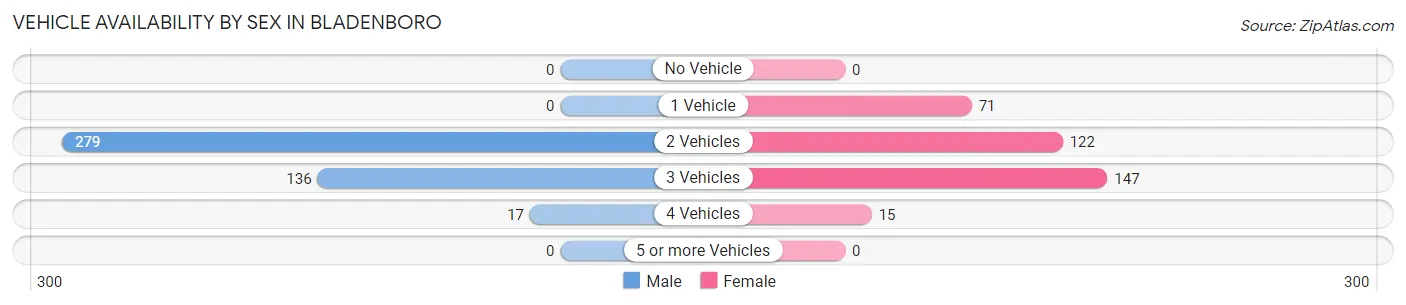
| Vehicles Available | Male | Female |
| No Vehicle | 0 (0.0%) | 0 (0.0%) |
| 1 Vehicle | 0 (0.0%) | 71 (20.0%) |
| 2 Vehicles | 279 (64.6%) | 122 (34.4%) |
| 3 Vehicles | 136 (31.5%) | 147 (41.4%) |
| 4 Vehicles | 17 (3.9%) | 15 (4.2%) |
| 5 or more Vehicles | 0 (0.0%) | 0 (0.0%) |
| Total | 432 (100.0%) | 355 (100.0%) |
Commute Time in Bladenboro
The most frequently occuring commute durations in Bladenboro are 20 to 24 minutes (203 commuters, 28.7%), 5 to 9 minutes (135 commuters, 19.1%), and 30 to 34 minutes (114 commuters, 16.2%).
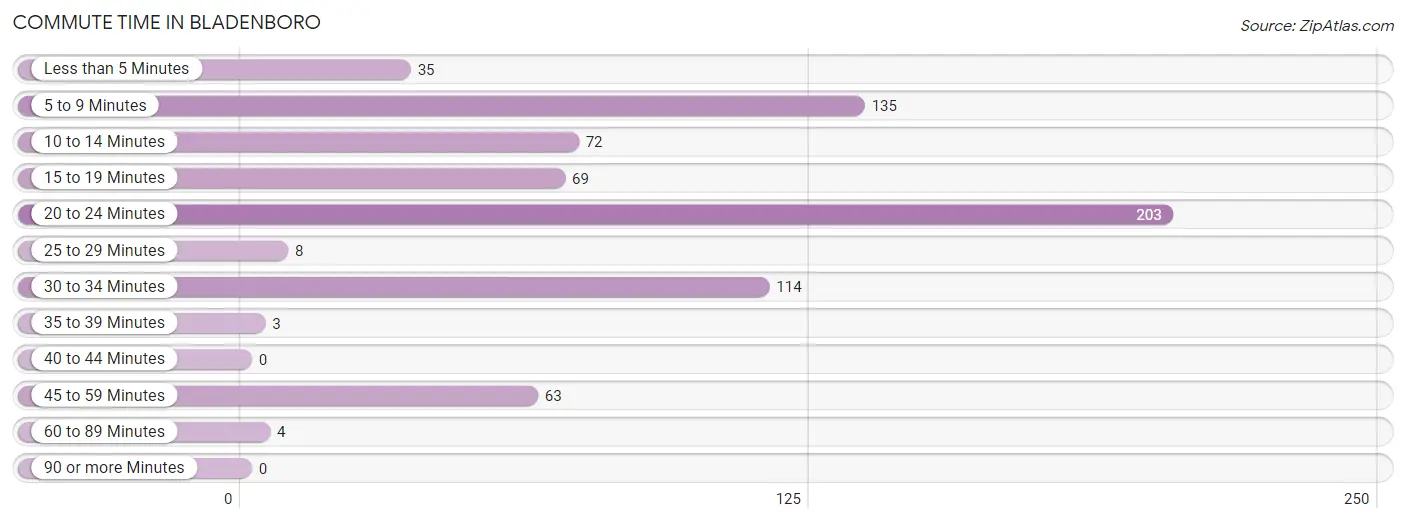
| Commute Time | # Commuters | % Commuters |
| Less than 5 Minutes | 35 | 5.0% |
| 5 to 9 Minutes | 135 | 19.1% |
| 10 to 14 Minutes | 72 | 10.2% |
| 15 to 19 Minutes | 69 | 9.8% |
| 20 to 24 Minutes | 203 | 28.7% |
| 25 to 29 Minutes | 8 | 1.1% |
| 30 to 34 Minutes | 114 | 16.2% |
| 35 to 39 Minutes | 3 | 0.4% |
| 40 to 44 Minutes | 0 | 0.0% |
| 45 to 59 Minutes | 63 | 8.9% |
| 60 to 89 Minutes | 4 | 0.6% |
| 90 or more Minutes | 0 | 0.0% |
Commute Time by Sex in Bladenboro
The most common commute times in Bladenboro are 20 to 24 minutes (164 commuters, 39.1%) for males and 5 to 9 minutes (81 commuters, 28.2%) for females.
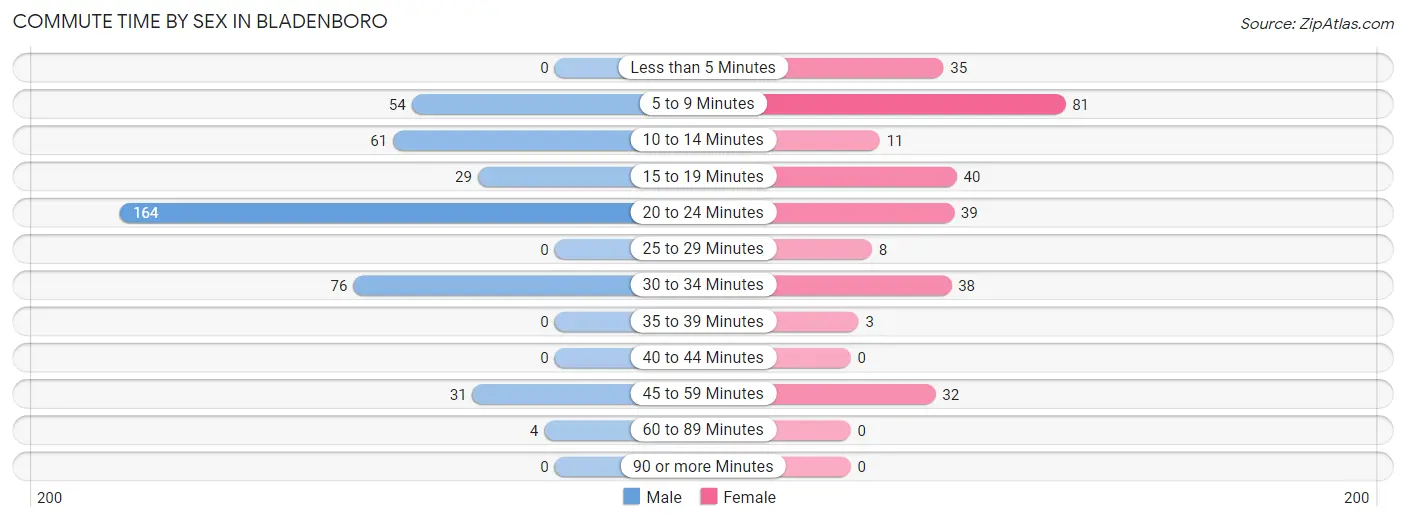
| Commute Time | Male | Female |
| Less than 5 Minutes | 0 (0.0%) | 35 (12.2%) |
| 5 to 9 Minutes | 54 (12.9%) | 81 (28.2%) |
| 10 to 14 Minutes | 61 (14.6%) | 11 (3.8%) |
| 15 to 19 Minutes | 29 (6.9%) | 40 (13.9%) |
| 20 to 24 Minutes | 164 (39.1%) | 39 (13.6%) |
| 25 to 29 Minutes | 0 (0.0%) | 8 (2.8%) |
| 30 to 34 Minutes | 76 (18.1%) | 38 (13.2%) |
| 35 to 39 Minutes | 0 (0.0%) | 3 (1.1%) |
| 40 to 44 Minutes | 0 (0.0%) | 0 (0.0%) |
| 45 to 59 Minutes | 31 (7.4%) | 32 (11.2%) |
| 60 to 89 Minutes | 4 (0.9%) | 0 (0.0%) |
| 90 or more Minutes | 0 (0.0%) | 0 (0.0%) |
Time of Departure to Work by Sex in Bladenboro
The most frequent times of departure to work in Bladenboro are 4:00 PM to 11:59 PM (147, 35.1%) for males and 8:00 AM to 8:29 AM (125, 43.5%) for females.
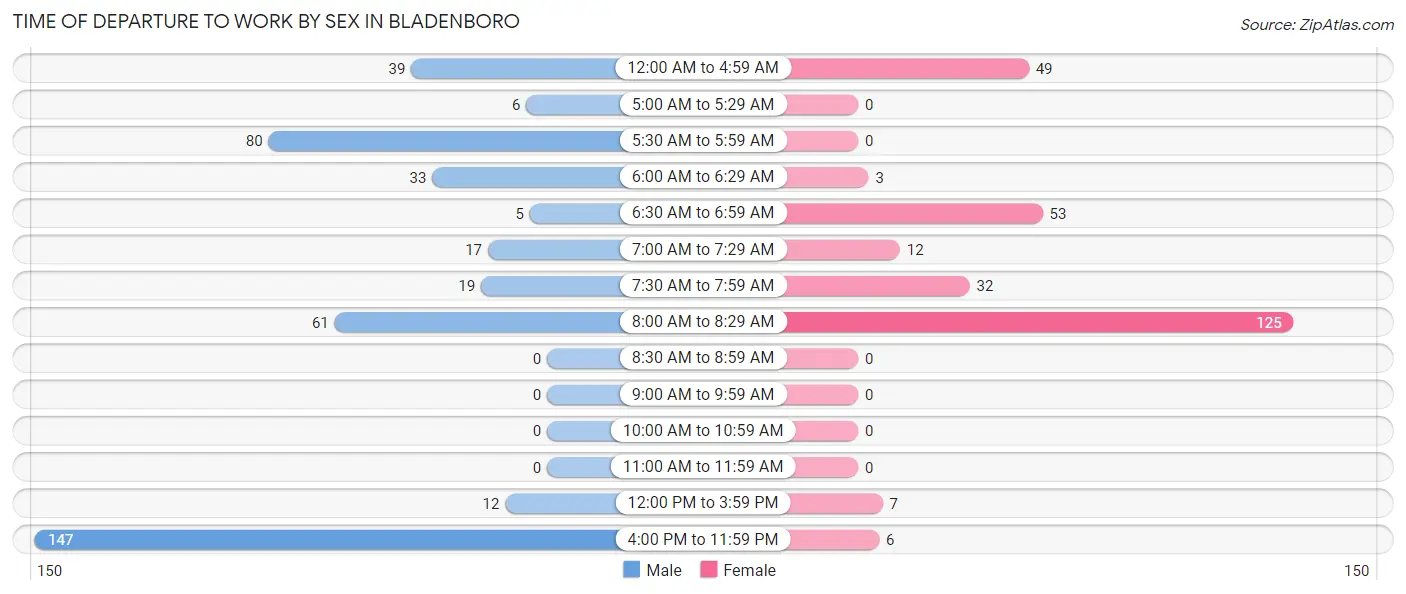
| Time of Departure | Male | Female |
| 12:00 AM to 4:59 AM | 39 (9.3%) | 49 (17.1%) |
| 5:00 AM to 5:29 AM | 6 (1.4%) | 0 (0.0%) |
| 5:30 AM to 5:59 AM | 80 (19.1%) | 0 (0.0%) |
| 6:00 AM to 6:29 AM | 33 (7.9%) | 3 (1.1%) |
| 6:30 AM to 6:59 AM | 5 (1.2%) | 53 (18.5%) |
| 7:00 AM to 7:29 AM | 17 (4.1%) | 12 (4.2%) |
| 7:30 AM to 7:59 AM | 19 (4.5%) | 32 (11.2%) |
| 8:00 AM to 8:29 AM | 61 (14.6%) | 125 (43.5%) |
| 8:30 AM to 8:59 AM | 0 (0.0%) | 0 (0.0%) |
| 9:00 AM to 9:59 AM | 0 (0.0%) | 0 (0.0%) |
| 10:00 AM to 10:59 AM | 0 (0.0%) | 0 (0.0%) |
| 11:00 AM to 11:59 AM | 0 (0.0%) | 0 (0.0%) |
| 12:00 PM to 3:59 PM | 12 (2.9%) | 7 (2.4%) |
| 4:00 PM to 11:59 PM | 147 (35.1%) | 6 (2.1%) |
| Total | 419 (100.0%) | 287 (100.0%) |
Housing Occupancy in Bladenboro
Occupancy by Ownership in Bladenboro
Of the total 756 dwellings in Bladenboro, owner-occupied units account for 318 (42.1%), while renter-occupied units make up 438 (57.9%).
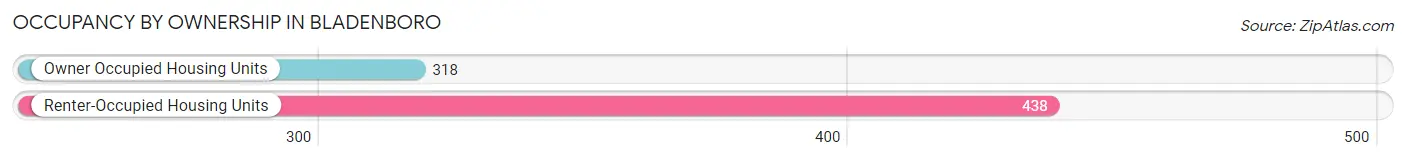
| Occupancy | # Housing Units | % Housing Units |
| Owner Occupied Housing Units | 318 | 42.1% |
| Renter-Occupied Housing Units | 438 | 57.9% |
| Total Occupied Housing Units | 756 | 100.0% |
Occupancy by Household Size in Bladenboro
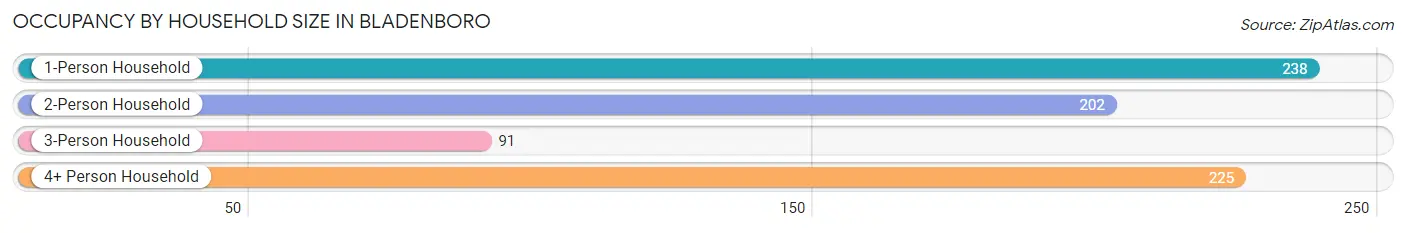
| Household Size | # Housing Units | % Housing Units |
| 1-Person Household | 238 | 31.5% |
| 2-Person Household | 202 | 26.7% |
| 3-Person Household | 91 | 12.0% |
| 4+ Person Household | 225 | 29.8% |
| Total Housing Units | 756 | 100.0% |
Occupancy by Ownership by Household Size in Bladenboro
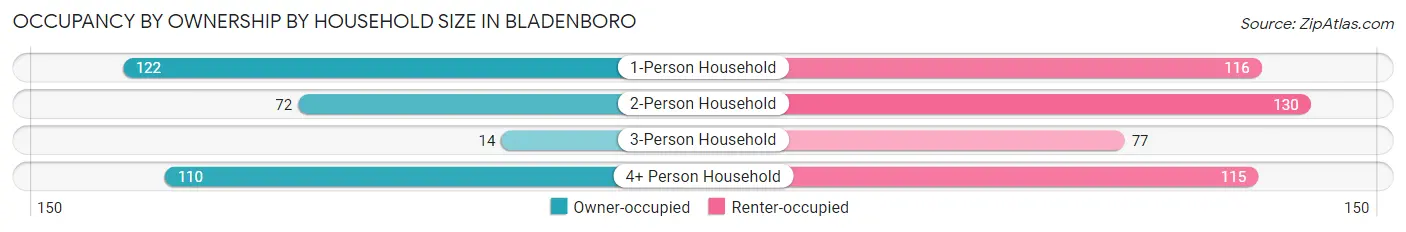
| Household Size | Owner-occupied | Renter-occupied |
| 1-Person Household | 122 (51.3%) | 116 (48.7%) |
| 2-Person Household | 72 (35.6%) | 130 (64.4%) |
| 3-Person Household | 14 (15.4%) | 77 (84.6%) |
| 4+ Person Household | 110 (48.9%) | 115 (51.1%) |
| Total Housing Units | 318 (42.1%) | 438 (57.9%) |
Occupancy by Educational Attainment in Bladenboro
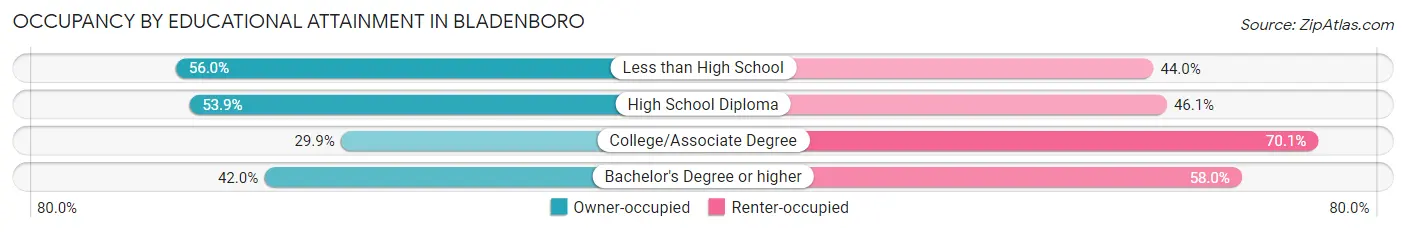
| Household Size | Owner-occupied | Renter-occupied |
| Less than High School | 42 (56.0%) | 33 (44.0%) |
| High School Diploma | 125 (53.9%) | 107 (46.1%) |
| College/Associate Degree | 93 (29.9%) | 218 (70.1%) |
| Bachelor's Degree or higher | 58 (42.0%) | 80 (58.0%) |
Occupancy by Age of Householder in Bladenboro
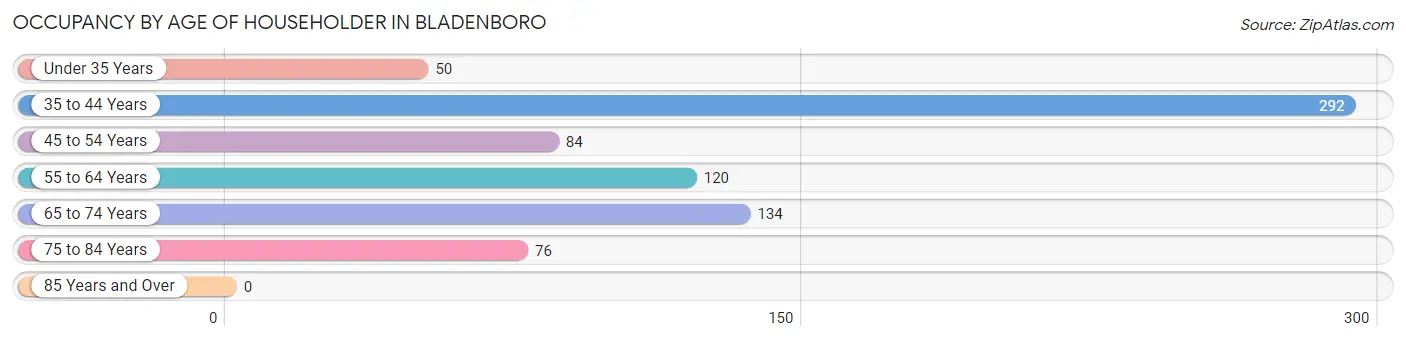
| Age Bracket | # Households | % Households |
| Under 35 Years | 50 | 6.6% |
| 35 to 44 Years | 292 | 38.6% |
| 45 to 54 Years | 84 | 11.1% |
| 55 to 64 Years | 120 | 15.9% |
| 65 to 74 Years | 134 | 17.7% |
| 75 to 84 Years | 76 | 10.1% |
| 85 Years and Over | 0 | 0.0% |
| Total | 756 | 100.0% |
Housing Finances in Bladenboro
Median Income by Occupancy in Bladenboro
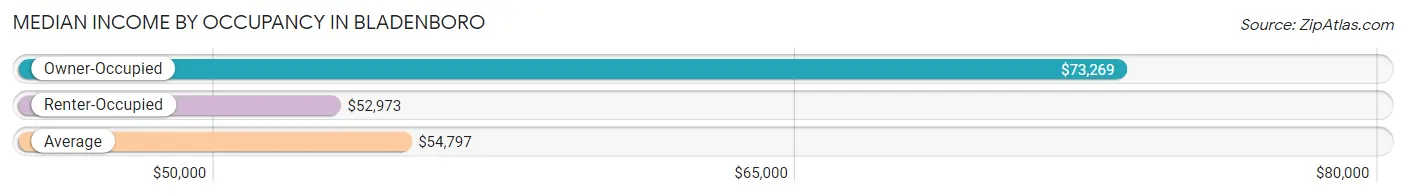
| Occupancy Type | # Households | Median Income |
| Owner-Occupied | 318 (42.1%) | $73,269 |
| Renter-Occupied | 438 (57.9%) | $52,973 |
| Average | 756 (100.0%) | $54,797 |
Occupancy by Householder Income Bracket in Bladenboro
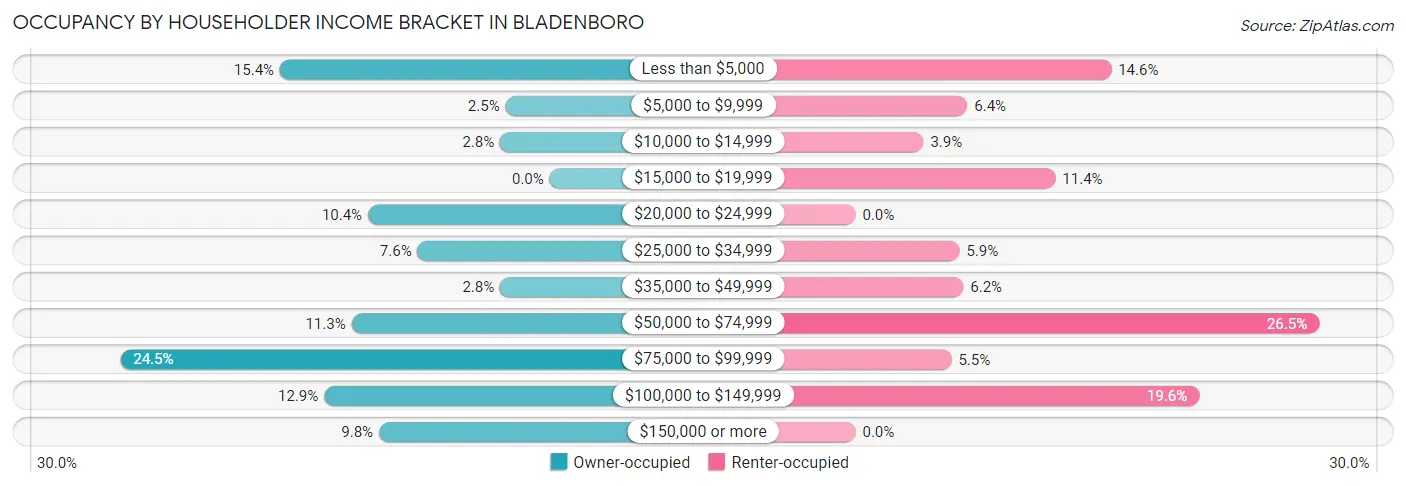
| Income Bracket | Owner-occupied | Renter-occupied |
| Less than $5,000 | 49 (15.4%) | 64 (14.6%) |
| $5,000 to $9,999 | 8 (2.5%) | 28 (6.4%) |
| $10,000 to $14,999 | 9 (2.8%) | 17 (3.9%) |
| $15,000 to $19,999 | 0 (0.0%) | 50 (11.4%) |
| $20,000 to $24,999 | 33 (10.4%) | 0 (0.0%) |
| $25,000 to $34,999 | 24 (7.5%) | 26 (5.9%) |
| $35,000 to $49,999 | 9 (2.8%) | 27 (6.2%) |
| $50,000 to $74,999 | 36 (11.3%) | 116 (26.5%) |
| $75,000 to $99,999 | 78 (24.5%) | 24 (5.5%) |
| $100,000 to $149,999 | 41 (12.9%) | 86 (19.6%) |
| $150,000 or more | 31 (9.8%) | 0 (0.0%) |
| Total | 318 (100.0%) | 438 (100.0%) |
Monthly Housing Cost Tiers in Bladenboro

| Monthly Cost | Owner-occupied | Renter-occupied |
| Less than $300 | 35 (11.0%) | 27 (6.2%) |
| $300 to $499 | 117 (36.8%) | 33 (7.5%) |
| $500 to $799 | 64 (20.1%) | 179 (40.9%) |
| $800 to $999 | 37 (11.6%) | 90 (20.5%) |
| $1,000 to $1,499 | 65 (20.4%) | 14 (3.2%) |
| $1,500 to $1,999 | 0 (0.0%) | 0 (0.0%) |
| $2,000 to $2,499 | 0 (0.0%) | 0 (0.0%) |
| $2,500 to $2,999 | 0 (0.0%) | 0 (0.0%) |
| $3,000 or more | 0 (0.0%) | 0 (0.0%) |
| Total | 318 (100.0%) | 438 (100.0%) |
Physical Housing Characteristics in Bladenboro
Housing Structures in Bladenboro
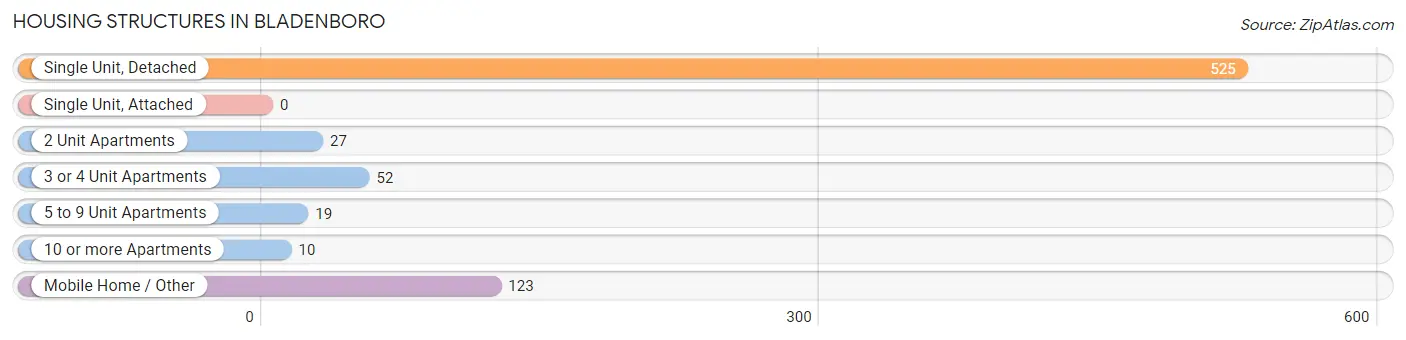
| Structure Type | # Housing Units | % Housing Units |
| Single Unit, Detached | 525 | 69.4% |
| Single Unit, Attached | 0 | 0.0% |
| 2 Unit Apartments | 27 | 3.6% |
| 3 or 4 Unit Apartments | 52 | 6.9% |
| 5 to 9 Unit Apartments | 19 | 2.5% |
| 10 or more Apartments | 10 | 1.3% |
| Mobile Home / Other | 123 | 16.3% |
| Total | 756 | 100.0% |
Housing Structures by Occupancy in Bladenboro
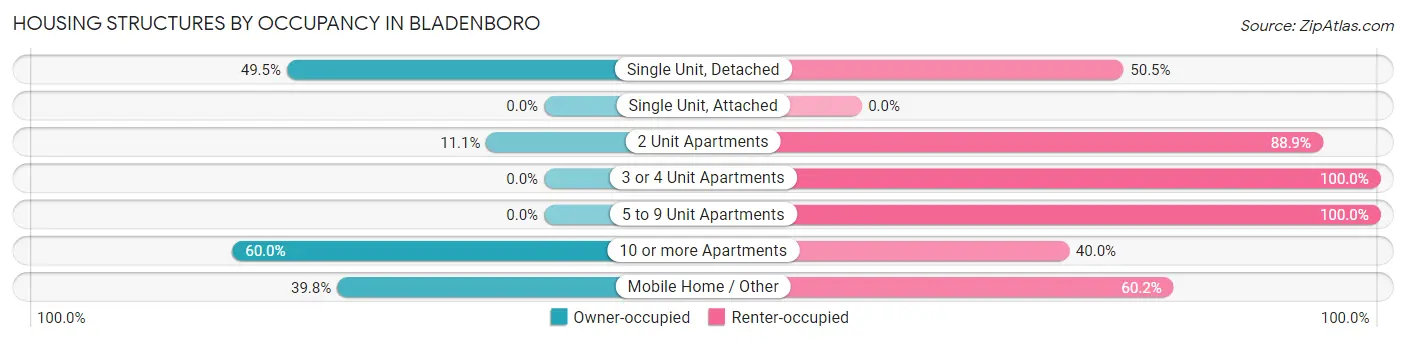
| Structure Type | Owner-occupied | Renter-occupied |
| Single Unit, Detached | 260 (49.5%) | 265 (50.5%) |
| Single Unit, Attached | 0 (0.0%) | 0 (0.0%) |
| 2 Unit Apartments | 3 (11.1%) | 24 (88.9%) |
| 3 or 4 Unit Apartments | 0 (0.0%) | 52 (100.0%) |
| 5 to 9 Unit Apartments | 0 (0.0%) | 19 (100.0%) |
| 10 or more Apartments | 6 (60.0%) | 4 (40.0%) |
| Mobile Home / Other | 49 (39.8%) | 74 (60.2%) |
| Total | 318 (42.1%) | 438 (57.9%) |
Housing Structures by Number of Rooms in Bladenboro
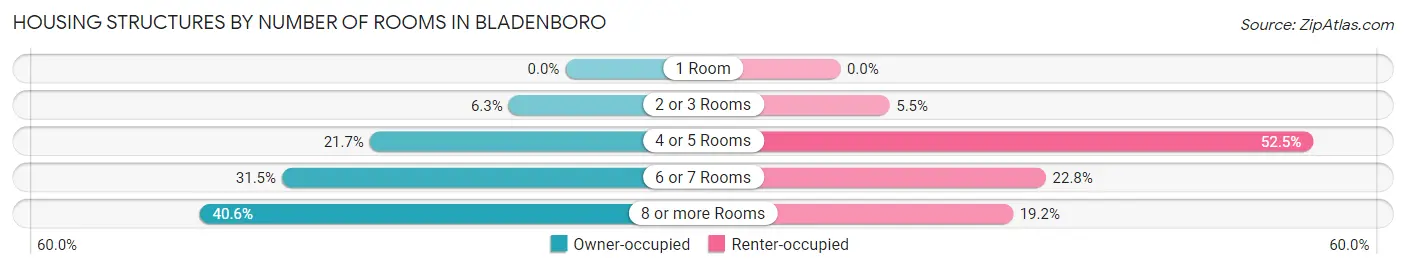
| Number of Rooms | Owner-occupied | Renter-occupied |
| 1 Room | 0 (0.0%) | 0 (0.0%) |
| 2 or 3 Rooms | 20 (6.3%) | 24 (5.5%) |
| 4 or 5 Rooms | 69 (21.7%) | 230 (52.5%) |
| 6 or 7 Rooms | 100 (31.5%) | 100 (22.8%) |
| 8 or more Rooms | 129 (40.6%) | 84 (19.2%) |
| Total | 318 (100.0%) | 438 (100.0%) |
Housing Structure by Heating Type in Bladenboro
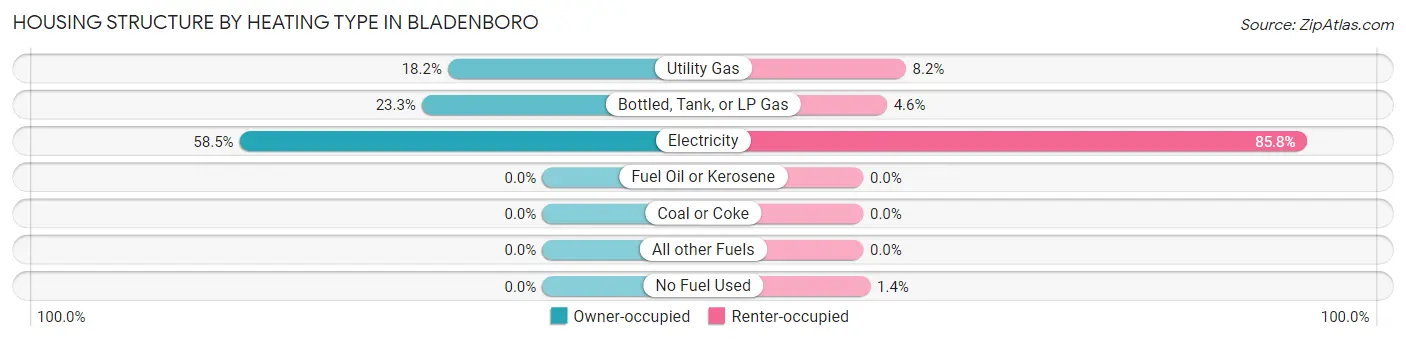
| Heating Type | Owner-occupied | Renter-occupied |
| Utility Gas | 58 (18.2%) | 36 (8.2%) |
| Bottled, Tank, or LP Gas | 74 (23.3%) | 20 (4.6%) |
| Electricity | 186 (58.5%) | 376 (85.8%) |
| Fuel Oil or Kerosene | 0 (0.0%) | 0 (0.0%) |
| Coal or Coke | 0 (0.0%) | 0 (0.0%) |
| All other Fuels | 0 (0.0%) | 0 (0.0%) |
| No Fuel Used | 0 (0.0%) | 6 (1.4%) |
| Total | 318 (100.0%) | 438 (100.0%) |
Household Vehicle Usage in Bladenboro
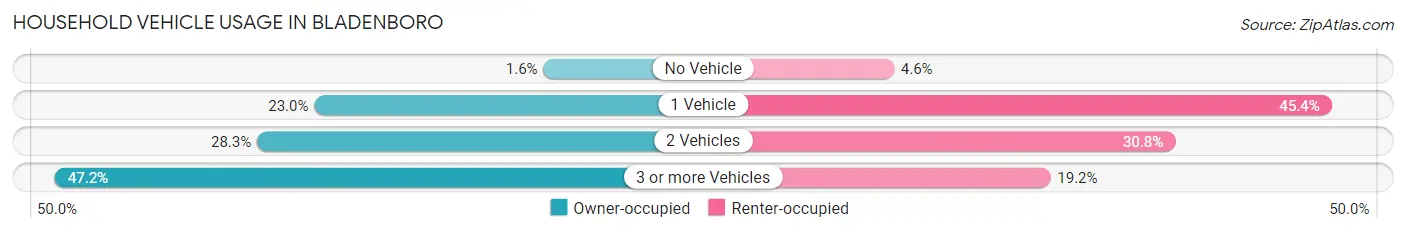
| Vehicles per Household | Owner-occupied | Renter-occupied |
| No Vehicle | 5 (1.6%) | 20 (4.6%) |
| 1 Vehicle | 73 (23.0%) | 199 (45.4%) |
| 2 Vehicles | 90 (28.3%) | 135 (30.8%) |
| 3 or more Vehicles | 150 (47.2%) | 84 (19.2%) |
| Total | 318 (100.0%) | 438 (100.0%) |
Real Estate & Mortgages in Bladenboro
Real Estate and Mortgage Overview in Bladenboro
| Characteristic | Without Mortgage | With Mortgage |
| Housing Units | 227 | 91 |
| Median Property Value | $82,200 | $94,500 |
| Median Household Income | - | - |
| Monthly Housing Costs | $459 | $0 |
| Real Estate Taxes | $812 | $0 |
Property Value by Mortgage Status in Bladenboro
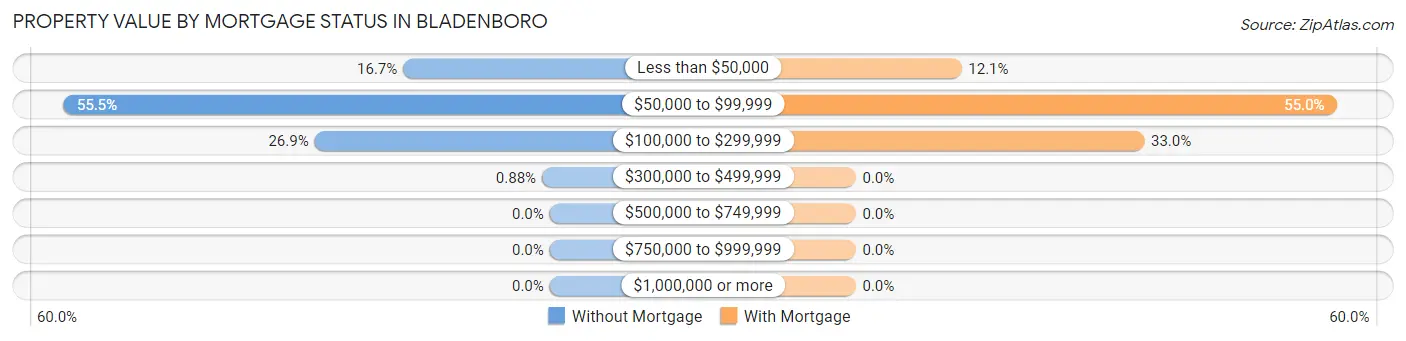
| Property Value | Without Mortgage | With Mortgage |
| Less than $50,000 | 38 (16.7%) | 11 (12.1%) |
| $50,000 to $99,999 | 126 (55.5%) | 50 (54.9%) |
| $100,000 to $299,999 | 61 (26.9%) | 30 (33.0%) |
| $300,000 to $499,999 | 2 (0.9%) | 0 (0.0%) |
| $500,000 to $749,999 | 0 (0.0%) | 0 (0.0%) |
| $750,000 to $999,999 | 0 (0.0%) | 0 (0.0%) |
| $1,000,000 or more | 0 (0.0%) | 0 (0.0%) |
| Total | 227 (100.0%) | 91 (100.0%) |
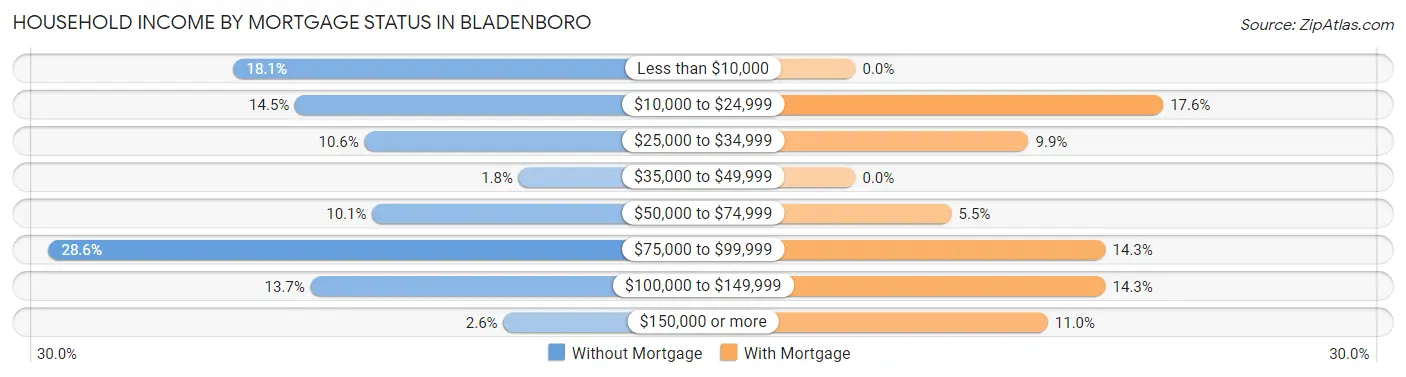
Household Income by Mortgage Status in Bladenboro
| Household Income | Without Mortgage | With Mortgage |
| Less than $10,000 | 41 (18.1%) | 0 (0.0%) |
| $10,000 to $24,999 | 33 (14.5%) | 16 (17.6%) |
| $25,000 to $34,999 | 24 (10.6%) | 9 (9.9%) |
| $35,000 to $49,999 | 4 (1.8%) | 0 (0.0%) |
| $50,000 to $74,999 | 23 (10.1%) | 5 (5.5%) |
| $75,000 to $99,999 | 65 (28.6%) | 13 (14.3%) |
| $100,000 to $149,999 | 31 (13.7%) | 13 (14.3%) |
| $150,000 or more | 6 (2.6%) | 10 (11.0%) |
| Total | 227 (100.0%) | 91 (100.0%) |
Property Value to Household Income Ratio in Bladenboro
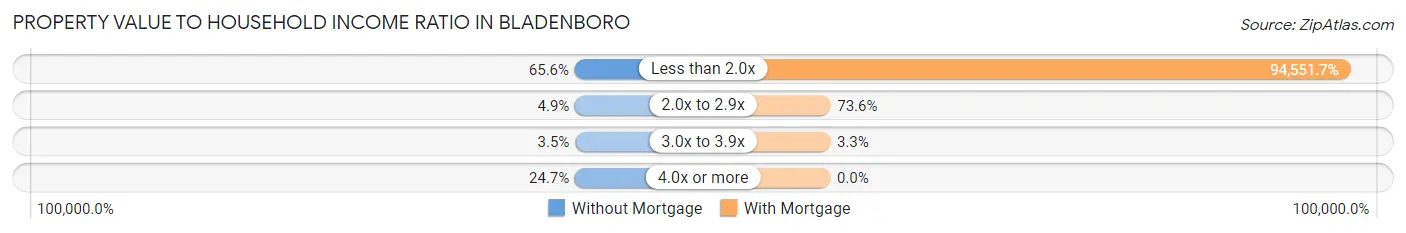
| Value-to-Income Ratio | Without Mortgage | With Mortgage |
| Less than 2.0x | 149 (65.6%) | 86,042 (94,551.6%) |
| 2.0x to 2.9x | 11 (4.9%) | 67 (73.6%) |
| 3.0x to 3.9x | 8 (3.5%) | 3 (3.3%) |
| 4.0x or more | 56 (24.7%) | 0 (0.0%) |
| Total | 227 (100.0%) | 91 (100.0%) |
Real Estate Taxes by Mortgage Status in Bladenboro
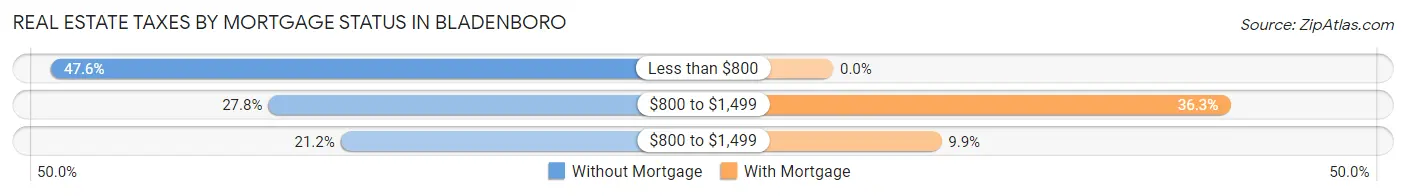
| Property Taxes | Without Mortgage | With Mortgage |
| Less than $800 | 108 (47.6%) | 0 (0.0%) |
| $800 to $1,499 | 63 (27.8%) | 33 (36.3%) |
| $800 to $1,499 | 48 (21.1%) | 9 (9.9%) |
| Total | 227 (100.0%) | 91 (100.0%) |
Health & Disability in Bladenboro
Health Insurance Coverage by Age in Bladenboro
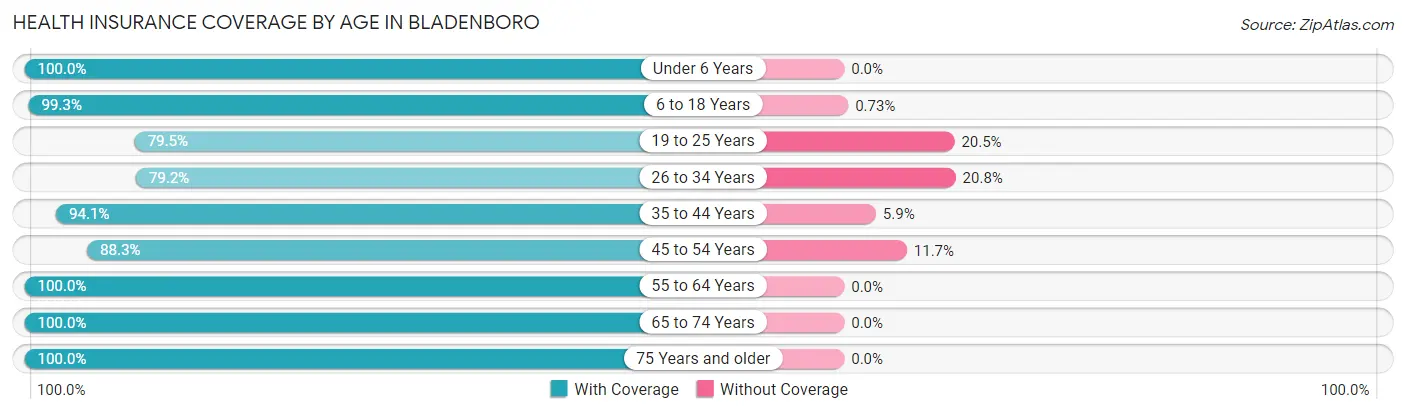
| Age Bracket | With Coverage | Without Coverage |
| Under 6 Years | 237 (100.0%) | 0 (0.0%) |
| 6 to 18 Years | 542 (99.3%) | 4 (0.7%) |
| 19 to 25 Years | 236 (79.5%) | 61 (20.5%) |
| 26 to 34 Years | 103 (79.2%) | 27 (20.8%) |
| 35 to 44 Years | 479 (94.1%) | 30 (5.9%) |
| 45 to 54 Years | 227 (88.3%) | 30 (11.7%) |
| 55 to 64 Years | 195 (100.0%) | 0 (0.0%) |
| 65 to 74 Years | 159 (100.0%) | 0 (0.0%) |
| 75 Years and older | 155 (100.0%) | 0 (0.0%) |
| Total | 2,333 (93.9%) | 152 (6.1%) |
Health Insurance Coverage by Citizenship Status in Bladenboro
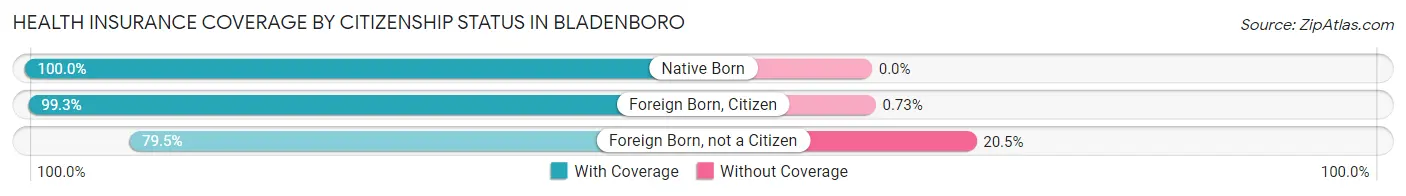
| Citizenship Status | With Coverage | Without Coverage |
| Native Born | 237 (100.0%) | 0 (0.0%) |
| Foreign Born, Citizen | 542 (99.3%) | 4 (0.7%) |
| Foreign Born, not a Citizen | 236 (79.5%) | 61 (20.5%) |
Health Insurance Coverage by Household Income in Bladenboro
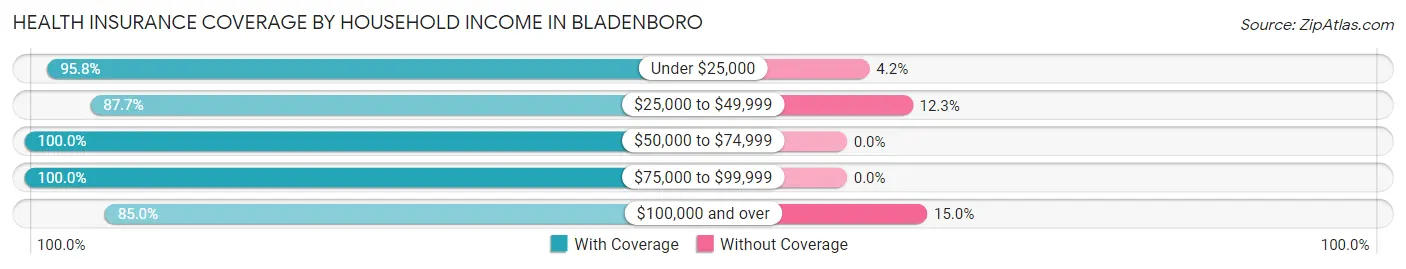
| Household Income | With Coverage | Without Coverage |
| Under $25,000 | 497 (95.8%) | 22 (4.2%) |
| $25,000 to $49,999 | 178 (87.7%) | 25 (12.3%) |
| $50,000 to $74,999 | 416 (100.0%) | 0 (0.0%) |
| $75,000 to $99,999 | 649 (100.0%) | 0 (0.0%) |
| $100,000 and over | 593 (85.0%) | 105 (15.0%) |
Public vs Private Health Insurance Coverage by Age in Bladenboro
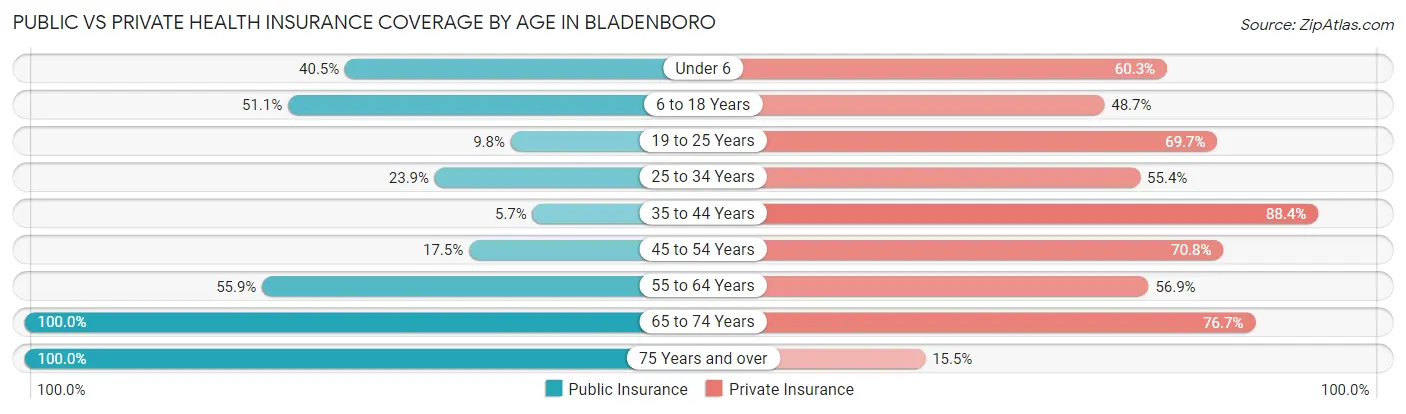
| Age Bracket | Public Insurance | Private Insurance |
| Under 6 | 96 (40.5%) | 143 (60.3%) |
| 6 to 18 Years | 279 (51.1%) | 266 (48.7%) |
| 19 to 25 Years | 29 (9.8%) | 207 (69.7%) |
| 25 to 34 Years | 31 (23.8%) | 72 (55.4%) |
| 35 to 44 Years | 29 (5.7%) | 450 (88.4%) |
| 45 to 54 Years | 45 (17.5%) | 182 (70.8%) |
| 55 to 64 Years | 109 (55.9%) | 111 (56.9%) |
| 65 to 74 Years | 159 (100.0%) | 122 (76.7%) |
| 75 Years and over | 155 (100.0%) | 24 (15.5%) |
| Total | 932 (37.5%) | 1,577 (63.5%) |
Disability Status by Sex by Age in Bladenboro
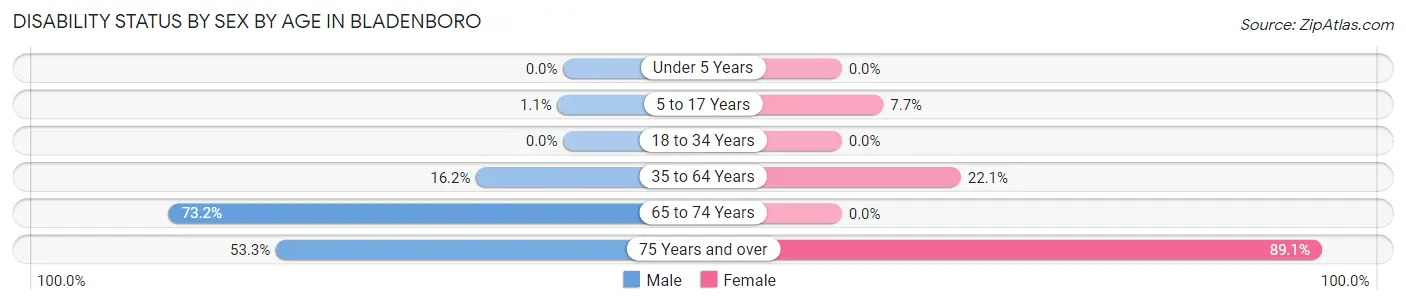
| Age Bracket | Male | Female |
| Under 5 Years | 0 (0.0%) | 0 (0.0%) |
| 5 to 17 Years | 2 (1.1%) | 39 (7.7%) |
| 18 to 34 Years | 0 (0.0%) | 0 (0.0%) |
| 35 to 64 Years | 80 (16.2%) | 103 (22.1%) |
| 65 to 74 Years | 52 (73.2%) | 0 (0.0%) |
| 75 Years and over | 24 (53.3%) | 98 (89.1%) |
Disability Class by Sex by Age in Bladenboro
Disability Class: Hearing Difficulty
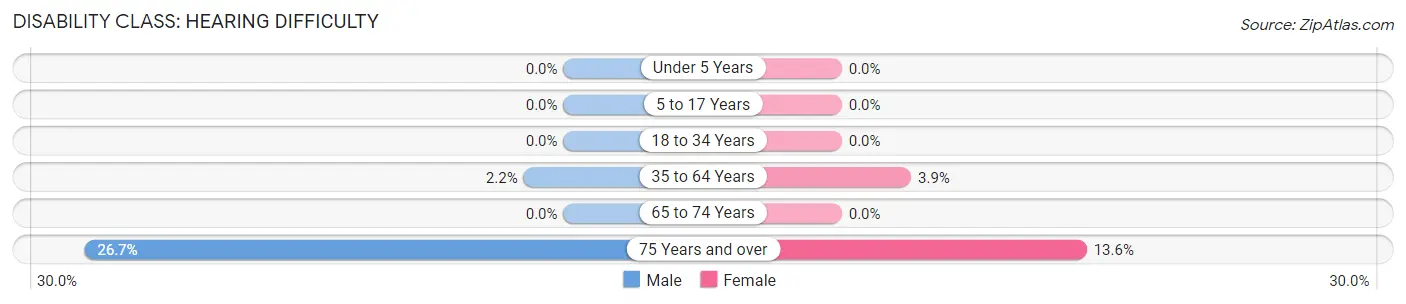
| Age Bracket | Male | Female |
| Under 5 Years | 0 (0.0%) | 0 (0.0%) |
| 5 to 17 Years | 0 (0.0%) | 0 (0.0%) |
| 18 to 34 Years | 0 (0.0%) | 0 (0.0%) |
| 35 to 64 Years | 11 (2.2%) | 18 (3.9%) |
| 65 to 74 Years | 0 (0.0%) | 0 (0.0%) |
| 75 Years and over | 12 (26.7%) | 15 (13.6%) |
Disability Class: Vision Difficulty
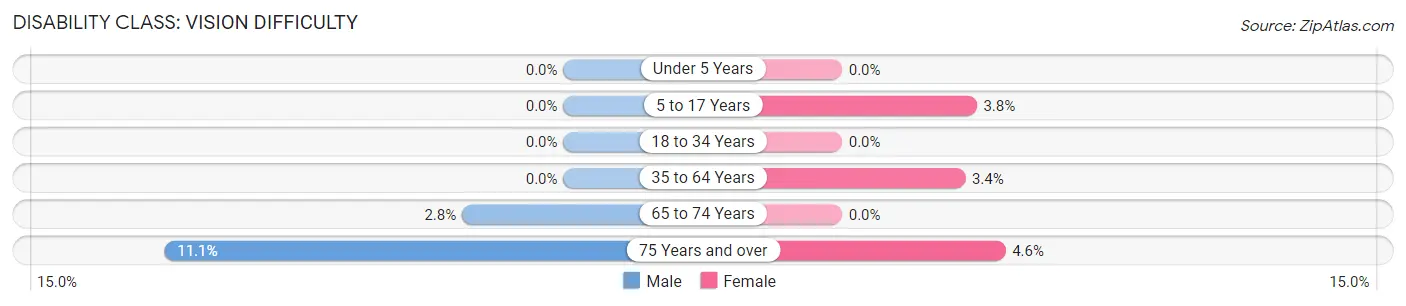
| Age Bracket | Male | Female |
| Under 5 Years | 0 (0.0%) | 0 (0.0%) |
| 5 to 17 Years | 0 (0.0%) | 19 (3.7%) |
| 18 to 34 Years | 0 (0.0%) | 0 (0.0%) |
| 35 to 64 Years | 0 (0.0%) | 16 (3.4%) |
| 65 to 74 Years | 2 (2.8%) | 0 (0.0%) |
| 75 Years and over | 5 (11.1%) | 5 (4.5%) |
Disability Class: Cognitive Difficulty
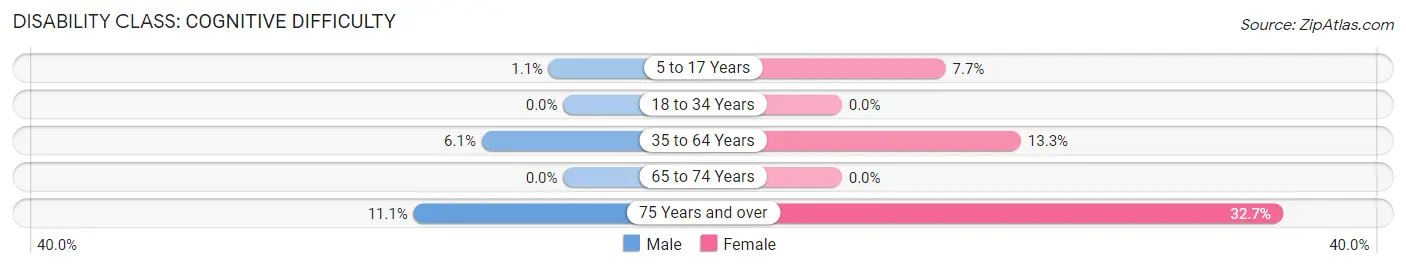
| Age Bracket | Male | Female |
| 5 to 17 Years | 2 (1.1%) | 39 (7.7%) |
| 18 to 34 Years | 0 (0.0%) | 0 (0.0%) |
| 35 to 64 Years | 30 (6.1%) | 62 (13.3%) |
| 65 to 74 Years | 0 (0.0%) | 0 (0.0%) |
| 75 Years and over | 5 (11.1%) | 36 (32.7%) |
Disability Class: Ambulatory Difficulty
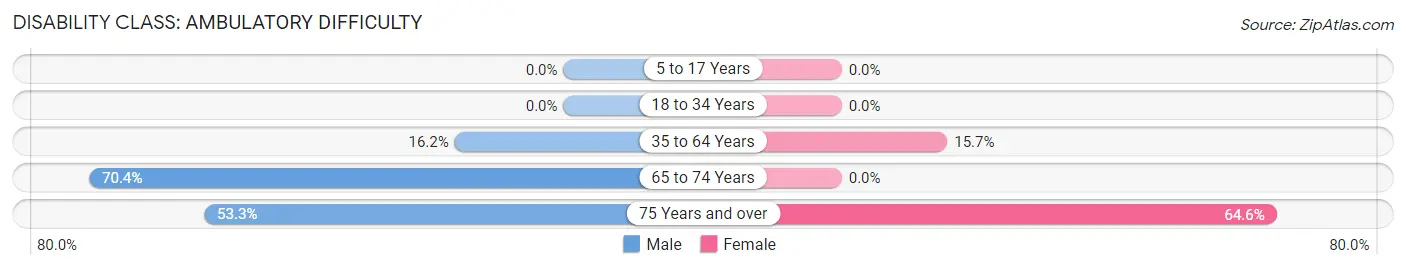
| Age Bracket | Male | Female |
| 5 to 17 Years | 0 (0.0%) | 0 (0.0%) |
| 18 to 34 Years | 0 (0.0%) | 0 (0.0%) |
| 35 to 64 Years | 80 (16.2%) | 73 (15.7%) |
| 65 to 74 Years | 50 (70.4%) | 0 (0.0%) |
| 75 Years and over | 24 (53.3%) | 71 (64.5%) |
Disability Class: Self-Care Difficulty
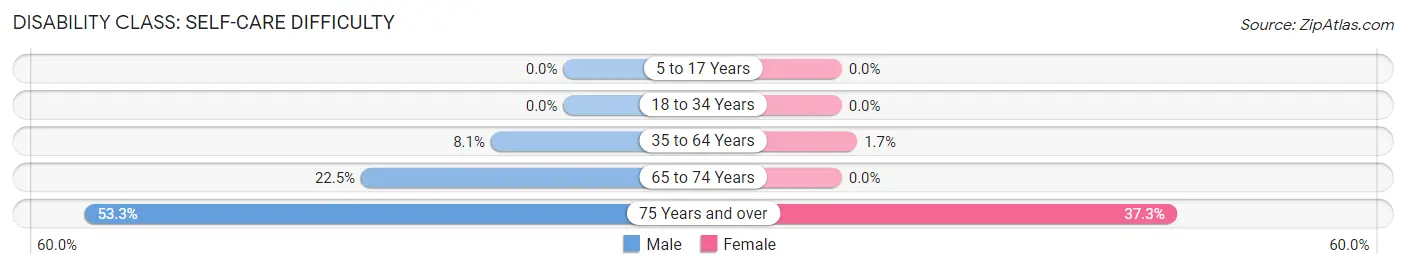
| Age Bracket | Male | Female |
| 5 to 17 Years | 0 (0.0%) | 0 (0.0%) |
| 18 to 34 Years | 0 (0.0%) | 0 (0.0%) |
| 35 to 64 Years | 40 (8.1%) | 8 (1.7%) |
| 65 to 74 Years | 16 (22.5%) | 0 (0.0%) |
| 75 Years and over | 24 (53.3%) | 41 (37.3%) |
Technology Access in Bladenboro
Computing Device Access in Bladenboro
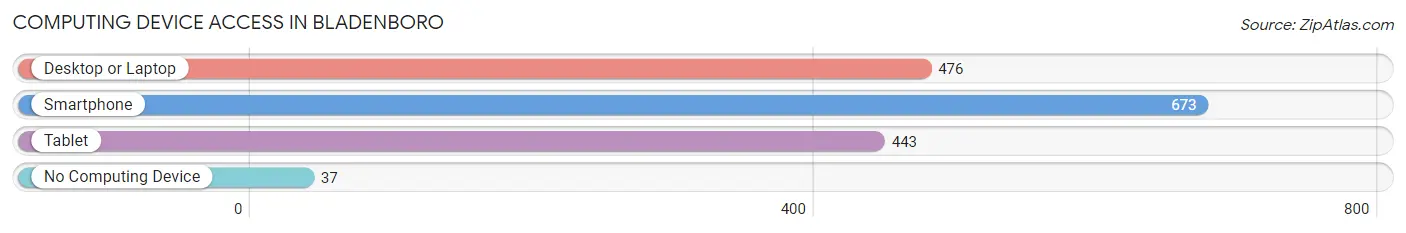
| Device Type | # Households | % Households |
| Desktop or Laptop | 476 | 63.0% |
| Smartphone | 673 | 89.0% |
| Tablet | 443 | 58.6% |
| No Computing Device | 37 | 4.9% |
| Total | 756 | 100.0% |
Internet Access in Bladenboro
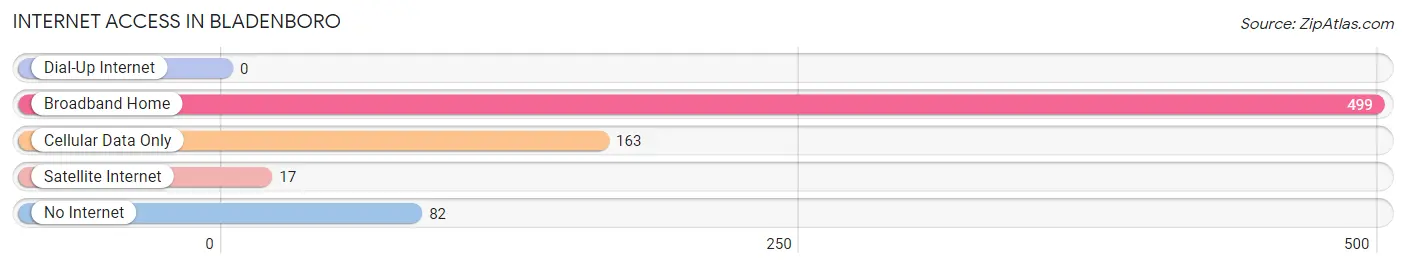
| Internet Type | # Households | % Households |
| Dial-Up Internet | 0 | 0.0% |
| Broadband Home | 499 | 66.0% |
| Cellular Data Only | 163 | 21.6% |
| Satellite Internet | 17 | 2.2% |
| No Internet | 82 | 10.8% |
| Total | 756 | 100.0% |
Bladenboro Summary
Bladenboro is a small town located in Bladen County, North Carolina. It is situated on the banks of the Cape Fear River, about 30 miles south of Fayetteville. The town was founded in 1793 and incorporated in 1891. As of the 2010 census, the population of Bladenboro was 1,750.
Geography
Bladenboro is located at 34°41'25"N 78°51'45"W (34.690278, -78.862500). It is situated on the banks of the Cape Fear River, about 30 miles south of Fayetteville. The town is located in the southeastern part of Bladen County, near the border with Columbus County. The town is surrounded by rural farmland and forests.
Climate
Bladenboro has a humid subtropical climate, with hot, humid summers and mild winters. The average annual temperature is around 70°F (21°C). The average annual precipitation is around 48 inches (122 cm).
Demographics
As of the 2010 census, the population of Bladenboro was 1,750. The racial makeup of the town was 79.2% White, 17.2% African American, 0.7% Native American, 0.4% Asian, 0.1% Pacific Islander, 1.2% from other races, and 1.2% from two or more races. Hispanic or Latino of any race were 2.3% of the population.
Economy
The economy of Bladenboro is largely based on agriculture. The town is home to several farms, which produce a variety of crops, including corn, soybeans, cotton, and tobacco. The town is also home to several small businesses, including restaurants, convenience stores, and auto repair shops.
History
Bladenboro was founded in 1793 by a group of settlers from Scotland. The town was named after Bladen County, which was named after Martin Bladen, a British politician. The town was incorporated in 1891.
In the early 20th century, Bladenboro was a thriving agricultural center. The town was home to several cotton mills, which provided employment for many of the town's residents. The town also had a thriving lumber industry, which provided lumber for the construction of homes and businesses.
In the late 20th century, the economy of Bladenboro began to decline. Many of the town's businesses closed, and the population began to decline. In recent years, the town has seen a resurgence in population and economic activity. The town is now home to several small businesses, and the population has grown to 1,750.
Common Questions
What is Per Capita Income in Bladenboro?
Per Capita income in Bladenboro is $20,422.
What is the Median Family Income in Bladenboro?
Median Family Income in Bladenboro is $77,813.
What is the Median Household income in Bladenboro?
Median Household Income in Bladenboro is $54,797.
What is Income or Wage Gap in Bladenboro?
Income or Wage Gap in Bladenboro is 41.0%.
Women in Bladenboro earn 59.0 cents for every dollar earned by a man.
What is Inequality or Gini Index in Bladenboro?
Inequality or Gini Index in Bladenboro is 0.46.
What is the Total Population of Bladenboro?
Total Population of Bladenboro is 2,485.
What is the Total Male Population of Bladenboro?
Total Male Population of Bladenboro is 1,135.
What is the Total Female Population of Bladenboro?
Total Female Population of Bladenboro is 1,350.
What is the Ratio of Males per 100 Females in Bladenboro?
There are 84.07 Males per 100 Females in Bladenboro.
What is the Ratio of Females per 100 Males in Bladenboro?
There are 118.94 Females per 100 Males in Bladenboro.
What is the Median Population Age in Bladenboro?
Median Population Age in Bladenboro is 36.4 Years.
What is the Average Family Size in Bladenboro
Average Family Size in Bladenboro is 4.3 People.
What is the Average Household Size in Bladenboro
Average Household Size in Bladenboro is 3.3 People.
How Large is the Labor Force in Bladenboro?
There are 845 People in the Labor Forcein in Bladenboro.
What is the Percentage of People in the Labor Force in Bladenboro?
48.0% of People are in the Labor Force in Bladenboro.
What is the Unemployment Rate in Bladenboro?
Unemployment Rate in Bladenboro is 6.2%.