Cities with the Highest Percentage of Population Walking to Work in Maryland
RELATED REPORTS & OPTIONS
Walk to Work
Maryland
Compare Cities
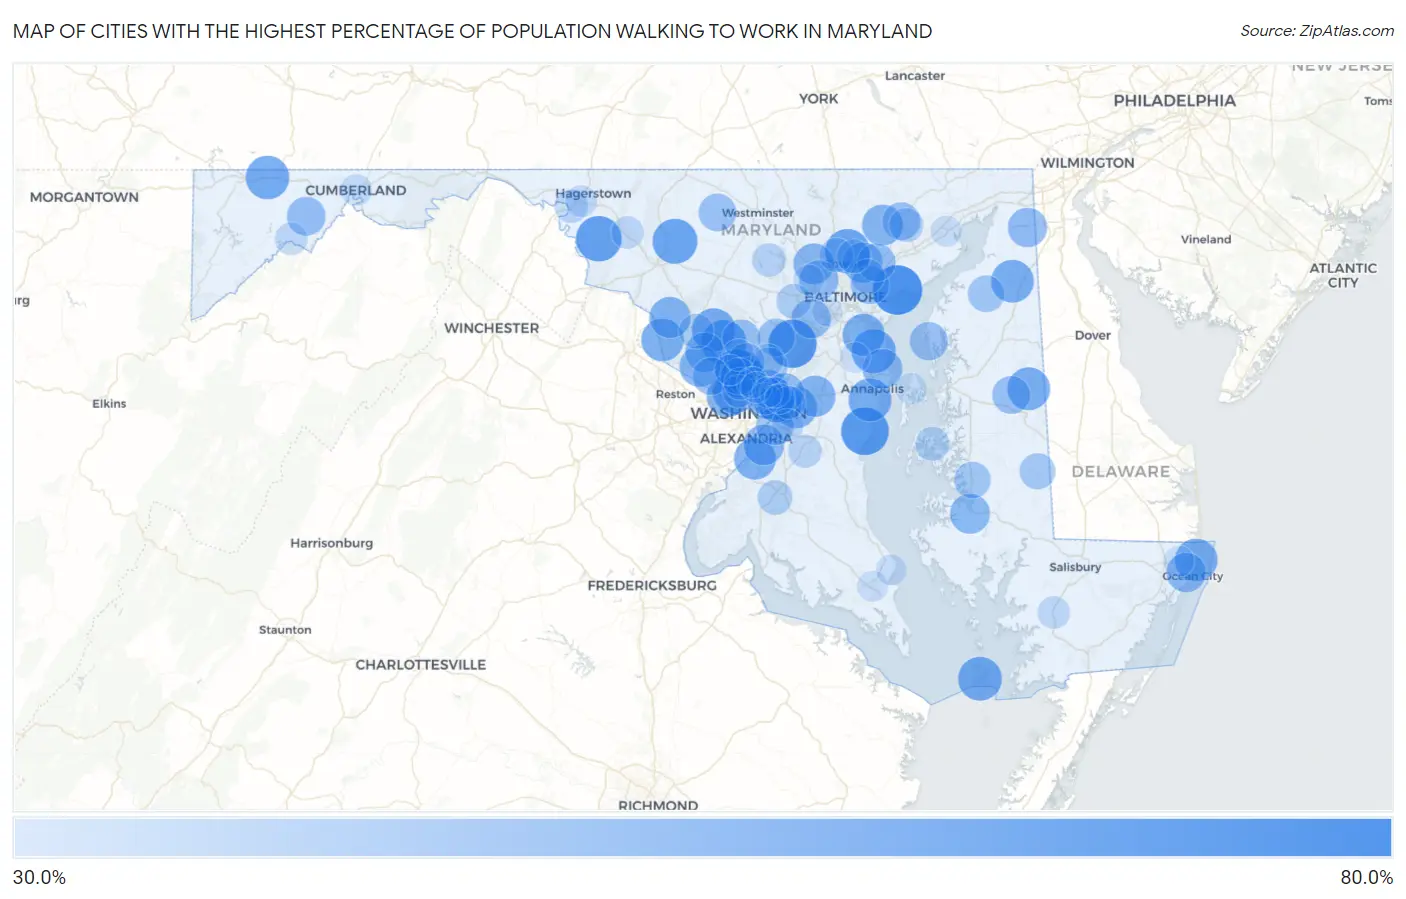
Map of Cities with the Highest Percentage of Population Walking to Work in Maryland
0.0%
80.0%
Cities with the Highest Percentage of Population Walking to Work in Maryland
| City | % Walk to Work | vs State | vs National | |
| 1. | Bowleys Quarters | 70.4% | 32.8%(+37.6)#1 | 33.4%(+37.0)#109 |
| 2. | North Laurel | 68.3% | 32.8%(+35.5)#2 | 33.4%(+34.9)#170 |
| 3. | Shady Side | 67.2% | 32.8%(+34.4)#3 | 33.4%(+33.8)#226 |
| 4. | Kensington | 65.6% | 32.8%(+32.8)#4 | 33.4%(+32.2)#305 |
| 5. | Brown Station | 63.5% | 32.8%(+30.7)#5 | 33.4%(+30.1)#447 |
| 6. | Keedysville | 63.5% | 32.8%(+30.7)#6 | 33.4%(+30.1)#450 |
| 7. | Redland | 62.1% | 32.8%(+29.3)#7 | 33.4%(+28.7)#598 |
| 8. | Walkersville | 62.1% | 32.8%(+29.3)#8 | 33.4%(+28.7)#602 |
| 9. | Timonium | 61.7% | 32.8%(+28.9)#9 | 33.4%(+28.3)#628 |
| 10. | Somerset | 61.0% | 32.8%(+28.2)#10 | 33.4%(+27.6)#728 |
| 11. | Garrett Park | 60.8% | 32.8%(+28.0)#11 | 33.4%(+27.4)#744 |
| 12. | Lake Shore | 60.5% | 32.8%(+27.7)#12 | 33.4%(+27.1)#769 |
| 13. | Smith Island | 60.3% | 32.8%(+27.5)#13 | 33.4%(+26.9)#837 |
| 14. | Grantsville | 59.8% | 32.8%(+27.0)#14 | 33.4%(+26.4)#890 |
| 15. | Montgomery Village | 59.5% | 32.8%(+26.7)#15 | 33.4%(+26.1)#906 |
| 16. | Annapolis Neck | 58.8% | 32.8%(+26.0)#16 | 33.4%(+25.4)#1,027 |
| 17. | Galena | 58.5% | 32.8%(+25.7)#17 | 33.4%(+25.1)#1,082 |
| 18. | Greensboro | 58.3% | 32.8%(+25.5)#18 | 33.4%(+24.9)#1,121 |
| 19. | Ocean City | 58.1% | 32.8%(+25.3)#19 | 33.4%(+24.7)#1,148 |
| 20. | Poolesville | 57.8% | 32.8%(+25.0)#20 | 33.4%(+24.4)#1,177 |
| 21. | Brentwood | 57.6% | 32.8%(+24.8)#21 | 33.4%(+24.2)#1,205 |
| 22. | Riviera Beach | 57.4% | 32.8%(+24.6)#22 | 33.4%(+24.0)#1,242 |
| 23. | Bladensburg | 57.0% | 32.8%(+24.2)#23 | 33.4%(+23.6)#1,321 |
| 24. | Fort Washington | 56.6% | 32.8%(+23.8)#24 | 33.4%(+23.2)#1,361 |
| 25. | Brookmont | 56.5% | 32.8%(+23.7)#25 | 33.4%(+23.1)#1,390 |
| 26. | Lake Arbor | 56.0% | 32.8%(+23.2)#26 | 33.4%(+22.6)#1,492 |
| 27. | Bowie | 55.5% | 32.8%(+22.7)#27 | 33.4%(+22.1)#1,549 |
| 28. | Barnesville | 55.5% | 32.8%(+22.7)#28 | 33.4%(+22.1)#1,584 |
| 29. | Travilah | 55.3% | 32.8%(+22.5)#29 | 33.4%(+21.9)#1,613 |
| 30. | Fallston | 54.9% | 32.8%(+22.1)#30 | 33.4%(+21.5)#1,693 |
| 31. | Garrison | 54.7% | 32.8%(+21.9)#31 | 33.4%(+21.3)#1,715 |
| 32. | Oxon Hill | 54.5% | 32.8%(+21.7)#32 | 33.4%(+21.1)#1,739 |
| 33. | Carney | 53.8% | 32.8%(+21.0)#33 | 33.4%(+20.4)#1,860 |
| 34. | University Park | 53.8% | 32.8%(+21.0)#34 | 33.4%(+20.4)#1,867 |
| 35. | Cambridge | 53.5% | 32.8%(+20.7)#35 | 33.4%(+20.1)#1,913 |
| 36. | North Potomac | 53.2% | 32.8%(+20.4)#36 | 33.4%(+19.8)#1,988 |
| 37. | Cape St Claire | 53.1% | 32.8%(+20.3)#37 | 33.4%(+19.7)#2,011 |
| 38. | West Ocean City | 52.8% | 32.8%(+20.0)#38 | 33.4%(+19.4)#2,058 |
| 39. | Lochearn | 52.3% | 32.8%(+19.5)#39 | 33.4%(+18.9)#2,160 |
| 40. | Chesapeake City | 52.3% | 32.8%(+19.5)#40 | 33.4%(+18.9)#2,180 |
| 41. | Ilchester | 52.1% | 32.8%(+19.3)#41 | 33.4%(+18.7)#2,212 |
| 42. | Landover | 51.8% | 32.8%(+19.0)#42 | 33.4%(+18.4)#2,254 |
| 43. | New Carrollton | 51.3% | 32.8%(+18.5)#43 | 33.4%(+17.9)#2,343 |
| 44. | Lonaconing | 51.1% | 32.8%(+18.3)#44 | 33.4%(+17.7)#2,391 |
| 45. | Rosedale | 50.7% | 32.8%(+17.9)#45 | 33.4%(+17.3)#2,441 |
| 46. | Olney | 50.6% | 32.8%(+17.8)#46 | 33.4%(+17.2)#2,462 |
| 47. | Forest Glen | 50.5% | 32.8%(+17.7)#47 | 33.4%(+17.1)#2,488 |
| 48. | Perry Hall | 50.4% | 32.8%(+17.6)#48 | 33.4%(+17.0)#2,513 |
| 49. | Rock Hall | 50.1% | 32.8%(+17.3)#49 | 33.4%(+16.7)#2,593 |
| 50. | Bel Air North | 49.9% | 32.8%(+17.1)#50 | 33.4%(+16.5)#2,621 |
| 51. | Ridgely | 49.9% | 32.8%(+17.1)#51 | 33.4%(+16.5)#2,628 |
| 52. | Suitland | 49.8% | 32.8%(+17.0)#52 | 33.4%(+16.4)#2,633 |
| 53. | Fulton | 49.3% | 32.8%(+16.5)#53 | 33.4%(+15.9)#2,745 |
| 54. | Union Bridge | 49.3% | 32.8%(+16.5)#54 | 33.4%(+15.9)#2,757 |
| 55. | Cheverly | 49.2% | 32.8%(+16.4)#55 | 33.4%(+15.8)#2,768 |
| 56. | Potomac | 49.0% | 32.8%(+16.2)#56 | 33.4%(+15.6)#2,799 |
| 57. | Calverton | 48.9% | 32.8%(+16.1)#57 | 33.4%(+15.5)#2,814 |
| 58. | Glenmont | 47.7% | 32.8%(+14.9)#58 | 33.4%(+14.3)#3,041 |
| 59. | Kennedyville | 47.7% | 32.8%(+14.9)#59 | 33.4%(+14.3)#3,049 |
| 60. | Trappe | 47.4% | 32.8%(+14.6)#60 | 33.4%(+14.0)#3,117 |
| 61. | South Kensington | 47.3% | 32.8%(+14.5)#61 | 33.4%(+13.9)#3,126 |
| 62. | Federalsburg | 46.4% | 32.8%(+13.6)#62 | 33.4%(+13.0)#3,290 |
| 63. | Germantown | 44.6% | 32.8%(+11.8)#63 | 33.4%(+11.2)#3,647 |
| 64. | Waldorf | 44.3% | 32.8%(+11.5)#64 | 33.4%(+10.9)#3,716 |
| 65. | Ellicott City | 44.2% | 32.8%(+11.4)#65 | 33.4%(+10.8)#3,742 |
| 66. | Overlea | 44.1% | 32.8%(+11.3)#66 | 33.4%(+10.7)#3,768 |
| 67. | Bel Air | 43.2% | 32.8%(+10.4)#67 | 33.4%(+9.80)#3,953 |
| 68. | Mays Chapel | 43.1% | 32.8%(+10.3)#68 | 33.4%(+9.70)#3,967 |
| 69. | St Michaels | 42.9% | 32.8%(+10.1)#69 | 33.4%(+9.50)#4,012 |
| 70. | Hampton | 42.8% | 32.8%(+10.0)#70 | 33.4%(+9.40)#4,019 |
| 71. | Eldersburg | 42.3% | 32.8%(+9.50)#71 | 33.4%(+8.90)#4,143 |
| 72. | Marlton | 41.8% | 32.8%(+9.00)#72 | 33.4%(+8.40)#4,242 |
| 73. | Williamsport | 41.8% | 32.8%(+9.00)#73 | 33.4%(+8.40)#4,250 |
| 74. | Woodlawn Cdp Prince George S County | 41.5% | 32.8%(+8.70)#74 | 33.4%(+8.10)#4,329 |
| 75. | Glenarden | 41.2% | 32.8%(+8.40)#75 | 33.4%(+7.80)#4,429 |
| 76. | Chevy Chase Village | 40.9% | 32.8%(+8.10)#76 | 33.4%(+7.50)#4,475 |
| 77. | Westernport | 40.6% | 32.8%(+7.80)#77 | 33.4%(+7.20)#4,550 |
| 78. | Fairland | 40.4% | 32.8%(+7.60)#78 | 33.4%(+7.00)#4,605 |
| 79. | Myersville | 40.4% | 32.8%(+7.60)#79 | 33.4%(+7.00)#4,618 |
| 80. | Princess Anne | 40.2% | 32.8%(+7.40)#80 | 33.4%(+6.80)#4,666 |
| 81. | Forestville | 39.9% | 32.8%(+7.10)#81 | 33.4%(+6.50)#4,717 |
| 82. | Chevy Chase | 39.7% | 32.8%(+6.90)#82 | 33.4%(+6.30)#4,755 |
| 83. | Aspen Hill | 39.4% | 32.8%(+6.60)#83 | 33.4%(+6.00)#4,816 |
| 84. | Halfway | 39.1% | 32.8%(+6.30)#84 | 33.4%(+5.70)#4,900 |
| 85. | Mount Rainier | 38.9% | 32.8%(+6.10)#85 | 33.4%(+5.50)#4,935 |
| 86. | Cumberland | 38.7% | 32.8%(+5.90)#86 | 33.4%(+5.30)#4,990 |
| 87. | Silver Spring | 38.2% | 32.8%(+5.40)#87 | 33.4%(+4.80)#5,115 |
| 88. | Stevensville | 38.2% | 32.8%(+5.40)#88 | 33.4%(+4.80)#5,123 |
| 89. | Takoma Park | 38.1% | 32.8%(+5.30)#89 | 33.4%(+4.70)#5,142 |
| 90. | Aberdeen | 37.9% | 32.8%(+5.10)#90 | 33.4%(+4.50)#5,171 |
| 91. | Ocean Pines | 37.8% | 32.8%(+5.00)#91 | 33.4%(+4.40)#5,193 |
| 92. | Milford Mill | 37.7% | 32.8%(+4.90)#92 | 33.4%(+4.30)#5,229 |
| 93. | California | 37.7% | 32.8%(+4.90)#93 | 33.4%(+4.30)#5,233 |
| 94. | Chesapeake Ranch Estates | 37.4% | 32.8%(+4.60)#94 | 33.4%(+4.00)#5,316 |
| 95. | North Bethesda | 37.3% | 32.8%(+4.50)#95 | 33.4%(+3.90)#5,333 |
| 96. | Arbutus | 37.2% | 32.8%(+4.40)#96 | 33.4%(+3.80)#5,361 |
| 97. | Severna Park | 36.9% | 32.8%(+4.10)#97 | 33.4%(+3.50)#5,416 |
| 98. | Riverdale Park | 36.9% | 32.8%(+4.10)#98 | 33.4%(+3.50)#5,424 |
| 99. | Hyattsville | 36.8% | 32.8%(+4.00)#99 | 33.4%(+3.40)#5,445 |
| 100. | Landover Hills | 36.5% | 32.8%(+3.70)#100 | 33.4%(+3.10)#5,536 |
Common Questions
What are the Top 10 Cities with the Highest Percentage of Population Walking to Work in Maryland?
Top 10 Cities with the Highest Percentage of Population Walking to Work in Maryland are:
#1
70.4%
#2
68.3%
#3
67.2%
#4
65.6%
#5
63.5%
#6
62.1%
#7
62.1%
#8
61.7%
#9
61.0%
#10
60.8%
What city has the Highest Percentage of Population Walking to Work in Maryland?
Bowleys Quarters has the Highest Percentage of Population Walking to Work in Maryland with 70.4%.
What is the Percentage of Population Walking to Work in the State of Maryland?
Percentage of Population Walking to Work in Maryland is 32.8%.
What is the Percentage of Population Walking to Work in the United States?
Percentage of Population Walking to Work in the United States is 33.4%.