Chesapeake City, MD Map & Demographics
Chesapeake City Map
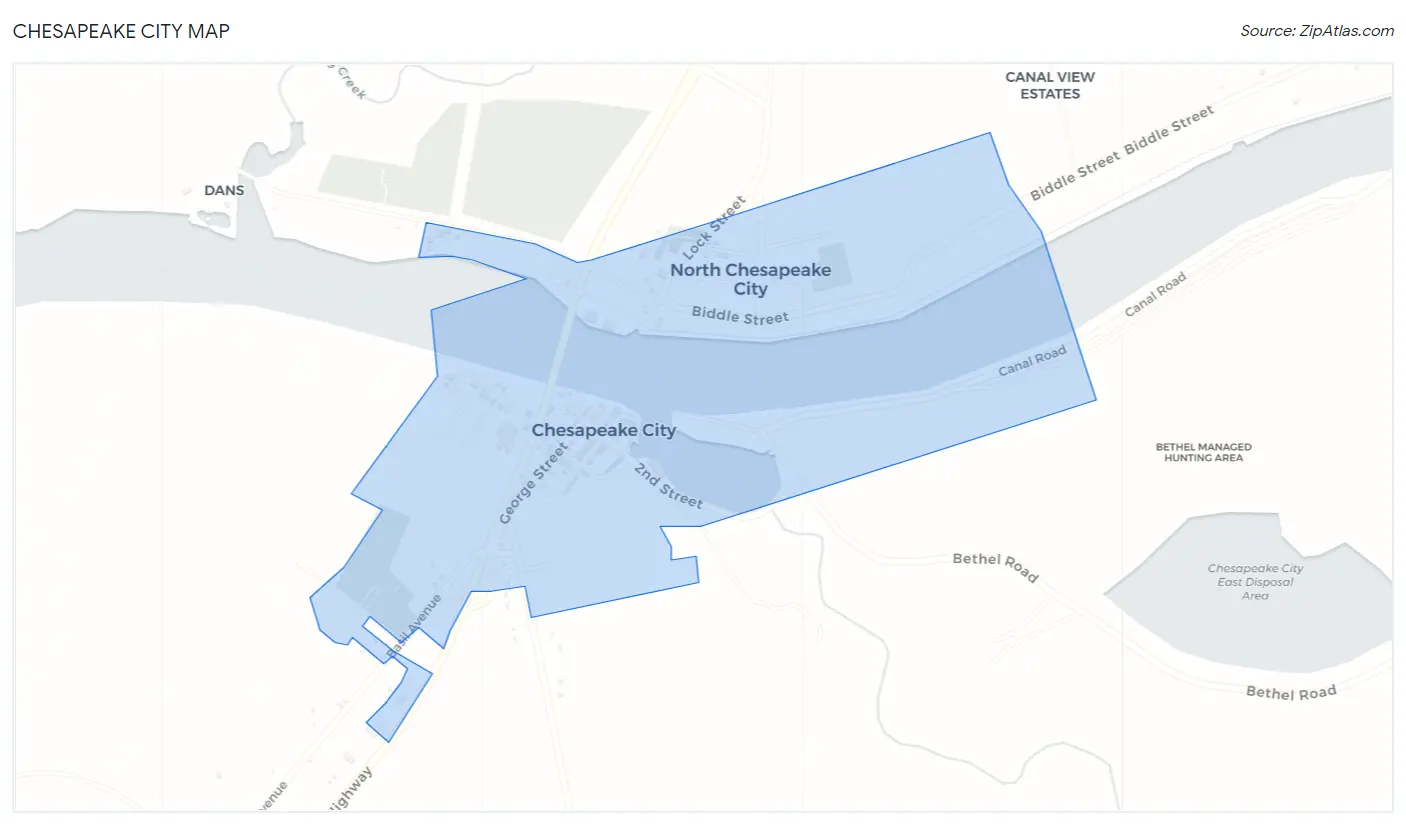
Chesapeake City Overview
$46,132
PER CAPITA INCOME
$81,786
AVG FAMILY INCOME
$68,750
AVG HOUSEHOLD INCOME
43.1%
WAGE / INCOME GAP [ % ]
56.9¢/ $1
WAGE / INCOME GAP [ $ ]
0.50
INEQUALITY / GINI INDEX
801
TOTAL POPULATION
358
MALE POPULATION
443
FEMALE POPULATION
80.81
MALES / 100 FEMALES
123.74
FEMALES / 100 MALES
56.9
MEDIAN AGE
2.6
AVG FAMILY SIZE
1.9
AVG HOUSEHOLD SIZE
406
LABOR FORCE [ PEOPLE ]
58.9%
PERCENT IN LABOR FORCE
4.4%
UNEMPLOYMENT RATE
Chesapeake City Zip Codes
Income in Chesapeake City
Income Overview in Chesapeake City
Per Capita Income in Chesapeake City is $46,132, while median incomes of families and households are $81,786 and $68,750 respectively.
| Characteristic | Number | Measure |
| Per Capita Income | 801 | $46,132 |
| Median Family Income | 214 | $81,786 |
| Mean Family Income | 214 | $115,229 |
| Median Household Income | 414 | $68,750 |
| Mean Household Income | 414 | $89,125 |
| Income Deficit | 214 | $0 |
| Wage / Income Gap (%) | 801 | 43.12% |
| Wage / Income Gap ($) | 801 | 56.88¢ per $1 |
| Gini / Inequality Index | 801 | 0.50 |
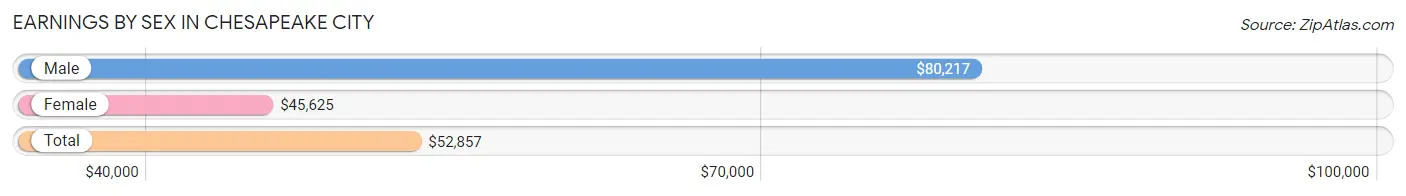
Earnings by Sex in Chesapeake City
Average Earnings in Chesapeake City are $52,857, $80,217 for men and $45,625 for women, a difference of 43.1%.
| Sex | Number | Average Earnings |
| Male | 202 (47.6%) | $80,217 |
| Female | 222 (52.4%) | $45,625 |
| Total | 424 (100.0%) | $52,857 |
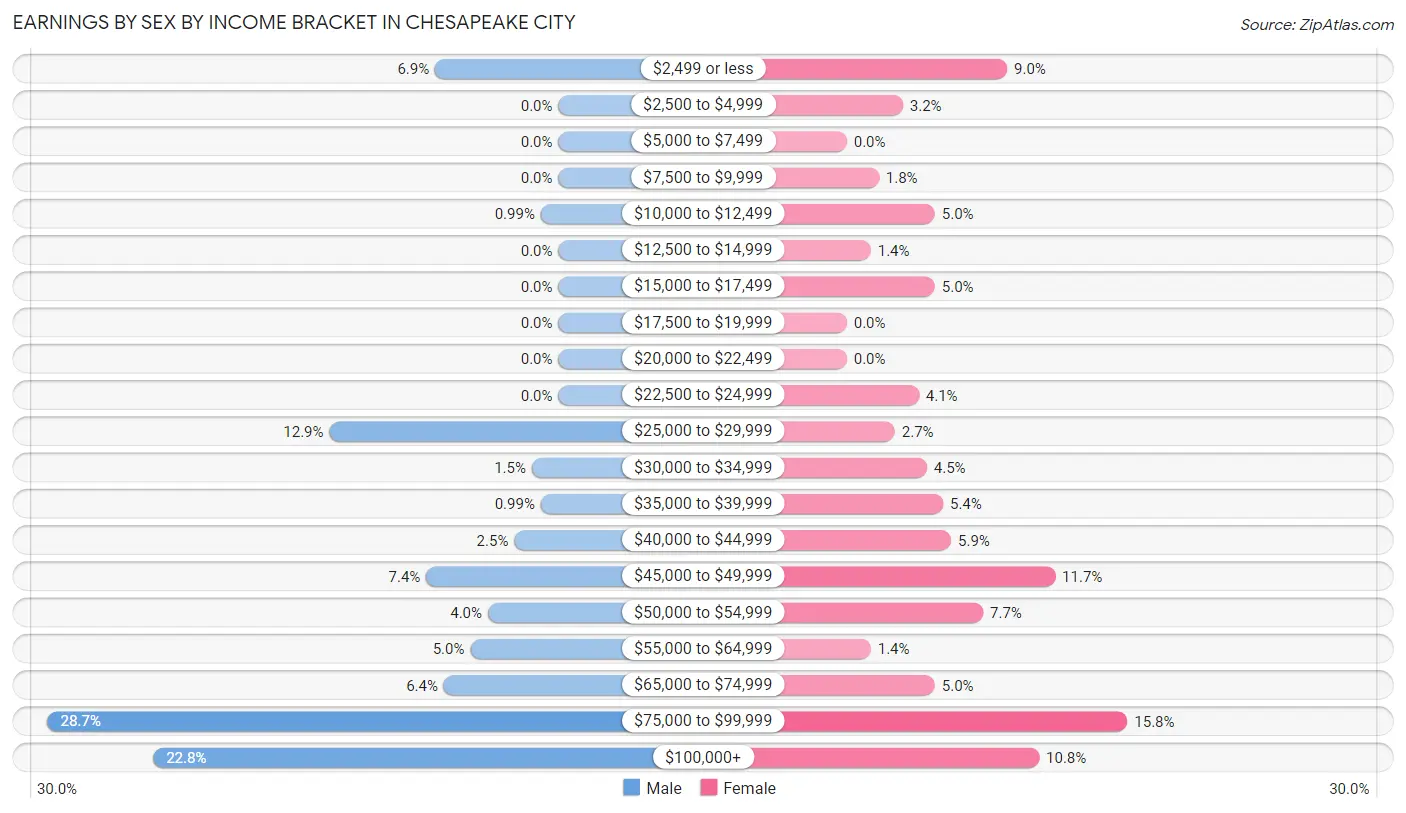
Earnings by Sex by Income Bracket in Chesapeake City
The most common earnings brackets in Chesapeake City are $75,000 to $99,999 for men (58 | 28.7%) and $75,000 to $99,999 for women (35 | 15.8%).
| Income | Male | Female |
| $2,499 or less | 14 (6.9%) | 20 (9.0%) |
| $2,500 to $4,999 | 0 (0.0%) | 7 (3.2%) |
| $5,000 to $7,499 | 0 (0.0%) | 0 (0.0%) |
| $7,500 to $9,999 | 0 (0.0%) | 4 (1.8%) |
| $10,000 to $12,499 | 2 (1.0%) | 11 (5.0%) |
| $12,500 to $14,999 | 0 (0.0%) | 3 (1.3%) |
| $15,000 to $17,499 | 0 (0.0%) | 11 (5.0%) |
| $17,500 to $19,999 | 0 (0.0%) | 0 (0.0%) |
| $20,000 to $22,499 | 0 (0.0%) | 0 (0.0%) |
| $22,500 to $24,999 | 0 (0.0%) | 9 (4.1%) |
| $25,000 to $29,999 | 26 (12.9%) | 6 (2.7%) |
| $30,000 to $34,999 | 3 (1.5%) | 10 (4.5%) |
| $35,000 to $39,999 | 2 (1.0%) | 12 (5.4%) |
| $40,000 to $44,999 | 5 (2.5%) | 13 (5.9%) |
| $45,000 to $49,999 | 15 (7.4%) | 26 (11.7%) |
| $50,000 to $54,999 | 8 (4.0%) | 17 (7.7%) |
| $55,000 to $64,999 | 10 (5.0%) | 3 (1.3%) |
| $65,000 to $74,999 | 13 (6.4%) | 11 (5.0%) |
| $75,000 to $99,999 | 58 (28.7%) | 35 (15.8%) |
| $100,000+ | 46 (22.8%) | 24 (10.8%) |
| Total | 202 (100.0%) | 222 (100.0%) |
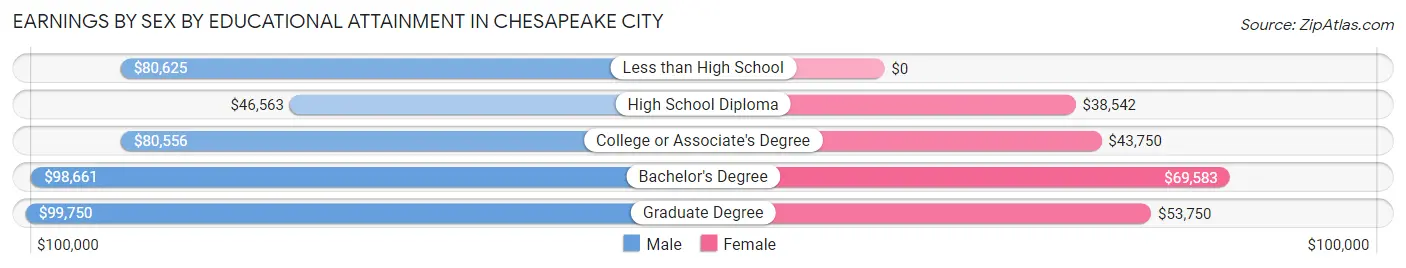
Earnings by Sex by Educational Attainment in Chesapeake City
Average earnings in Chesapeake City are $81,087 for men and $45,688 for women, a difference of 43.7%. Men with an educational attainment of graduate degree enjoy the highest average annual earnings of $99,750, while those with high school diploma education earn the least with $46,563. Women with an educational attainment of bachelor's degree earn the most with the average annual earnings of $69,583, while those with high school diploma education have the smallest earnings of $38,542.
| Educational Attainment | Male Income | Female Income |
| Less than High School | $80,625 | $0 |
| High School Diploma | $46,563 | $38,542 |
| College or Associate's Degree | $80,556 | $43,750 |
| Bachelor's Degree | $98,661 | $69,583 |
| Graduate Degree | $99,750 | $53,750 |
| Total | $81,087 | $45,688 |
Family Income in Chesapeake City
Family Income Brackets in Chesapeake City
According to the Chesapeake City family income data, there are 53 families falling into the $100,000 to $149,999 income range, which is the most common income bracket and makes up 24.8% of all families. Conversely, the $25,000 to $34,999 income bracket is the least frequent group with only 3 families (1.4%) belonging to this category.
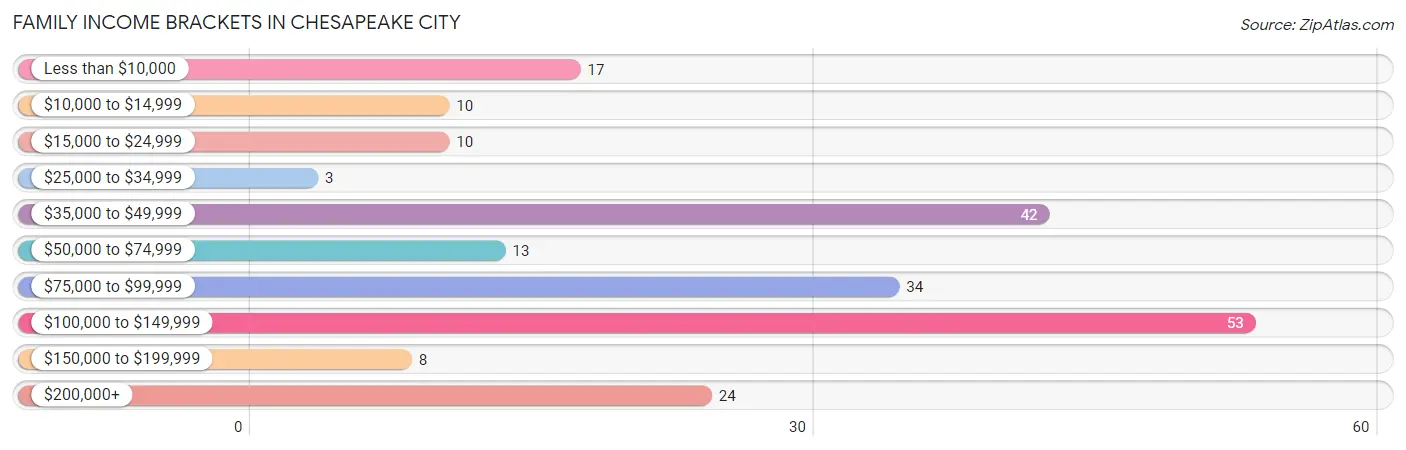
| Income Bracket | # Families | % Families |
| Less than $10,000 | 17 | 7.9% |
| $10,000 to $14,999 | 10 | 4.7% |
| $15,000 to $24,999 | 10 | 4.7% |
| $25,000 to $34,999 | 3 | 1.4% |
| $35,000 to $49,999 | 42 | 19.6% |
| $50,000 to $74,999 | 13 | 6.1% |
| $75,000 to $99,999 | 34 | 15.9% |
| $100,000 to $149,999 | 53 | 24.8% |
| $150,000 to $199,999 | 8 | 3.7% |
| $200,000+ | 24 | 11.2% |
Family Income by Famaliy Size in Chesapeake City
2-person families (153 | 71.5%) account for the highest median family income in Chesapeake City with $85,208 per family, while 2-person families (153 | 71.5%) have the highest median income of $42,604 per family member.
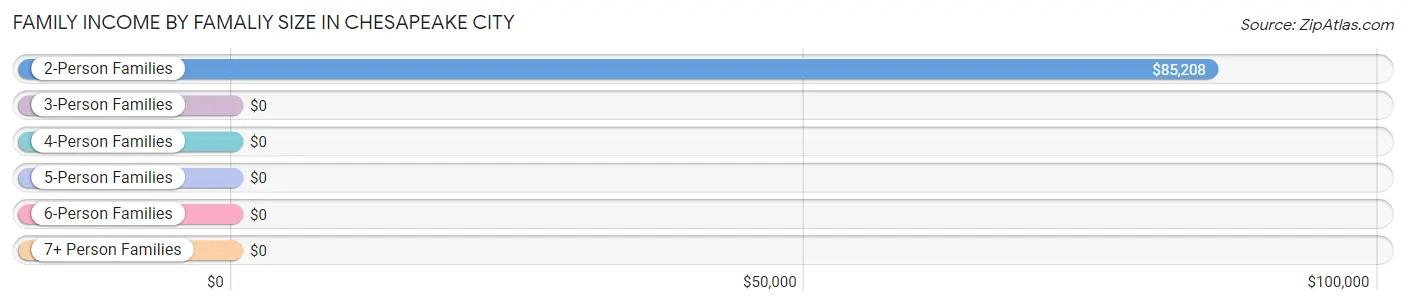
| Income Bracket | # Families | Median Income |
| 2-Person Families | 153 (71.5%) | $85,208 |
| 3-Person Families | 31 (14.5%) | $0 |
| 4-Person Families | 25 (11.7%) | $0 |
| 5-Person Families | 2 (0.9%) | $0 |
| 6-Person Families | 0 (0.0%) | $0 |
| 7+ Person Families | 3 (1.4%) | $0 |
| Total | 214 (100.0%) | $81,786 |
Family Income by Number of Earners in Chesapeake City
The median family income in Chesapeake City is $81,786, with families comprising 3+ earners (13) having the highest median family income of $250,001, while families with no earners (51) have the lowest median family income of $38,472, accounting for 6.1% and 23.8% of families, respectively.
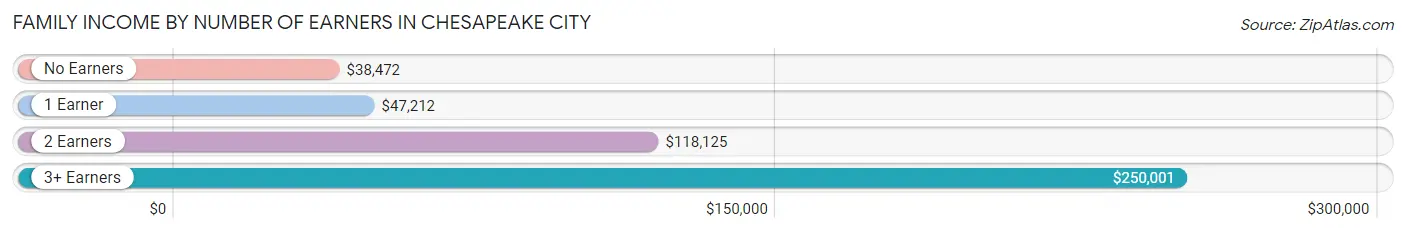
| Number of Earners | # Families | Median Income |
| No Earners | 51 (23.8%) | $38,472 |
| 1 Earner | 59 (27.6%) | $47,212 |
| 2 Earners | 91 (42.5%) | $118,125 |
| 3+ Earners | 13 (6.1%) | $250,001 |
| Total | 214 (100.0%) | $81,786 |
Household Income in Chesapeake City
Household Income Brackets in Chesapeake City
With 82 households falling in the category, the $75,000 to $99,999 income range is the most frequent in Chesapeake City, accounting for 19.8% of all households. In contrast, only 11 households (2.7%) fall into the $150,000 to $199,999 income bracket, making it the least populous group.
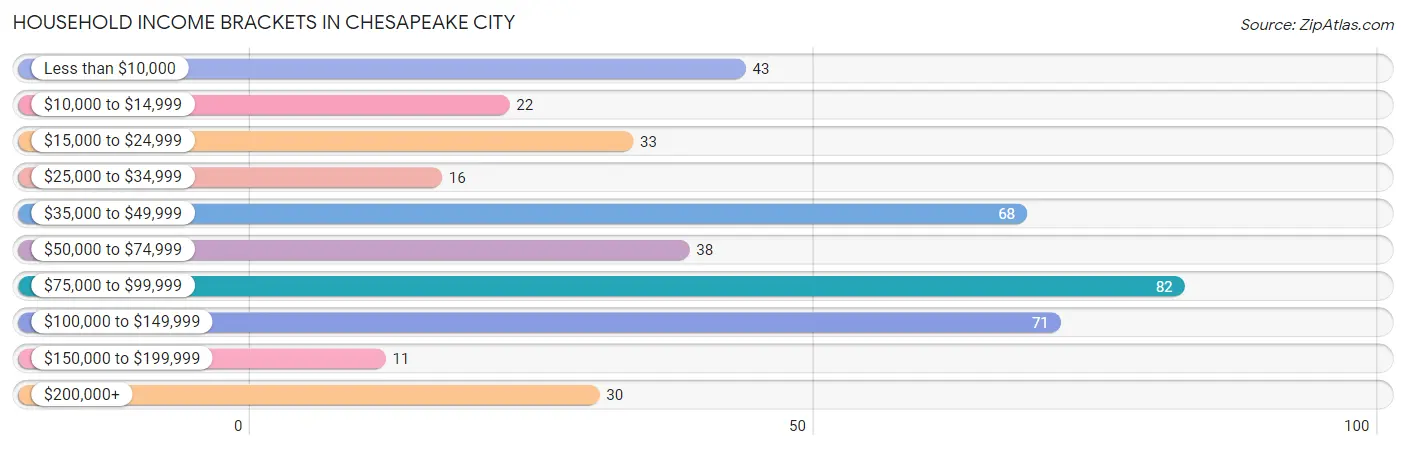
| Income Bracket | # Households | % Households |
| Less than $10,000 | 43 | 10.4% |
| $10,000 to $14,999 | 22 | 5.3% |
| $15,000 to $24,999 | 33 | 8.0% |
| $25,000 to $34,999 | 16 | 3.9% |
| $35,000 to $49,999 | 68 | 16.4% |
| $50,000 to $74,999 | 38 | 9.2% |
| $75,000 to $99,999 | 82 | 19.8% |
| $100,000 to $149,999 | 71 | 17.1% |
| $150,000 to $199,999 | 11 | 2.7% |
| $200,000+ | 30 | 7.2% |
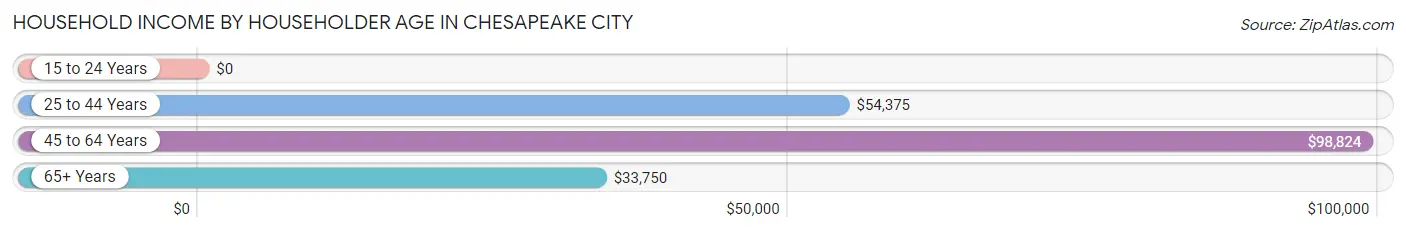
Household Income by Householder Age in Chesapeake City
The median household income in Chesapeake City is $68,750, with the highest median household income of $98,824 found in the 45 to 64 years age bracket for the primary householder. A total of 176 households (42.5%) fall into this category. Meanwhile, the 15 to 24 years age bracket for the primary householder has the lowest median household income of $0, with 3 households (0.7%) in this group.
| Income Bracket | # Households | Median Income |
| 15 to 24 Years | 3 (0.7%) | $0 |
| 25 to 44 Years | 71 (17.2%) | $54,375 |
| 45 to 64 Years | 176 (42.5%) | $98,824 |
| 65+ Years | 164 (39.6%) | $33,750 |
| Total | 414 (100.0%) | $68,750 |
Poverty in Chesapeake City
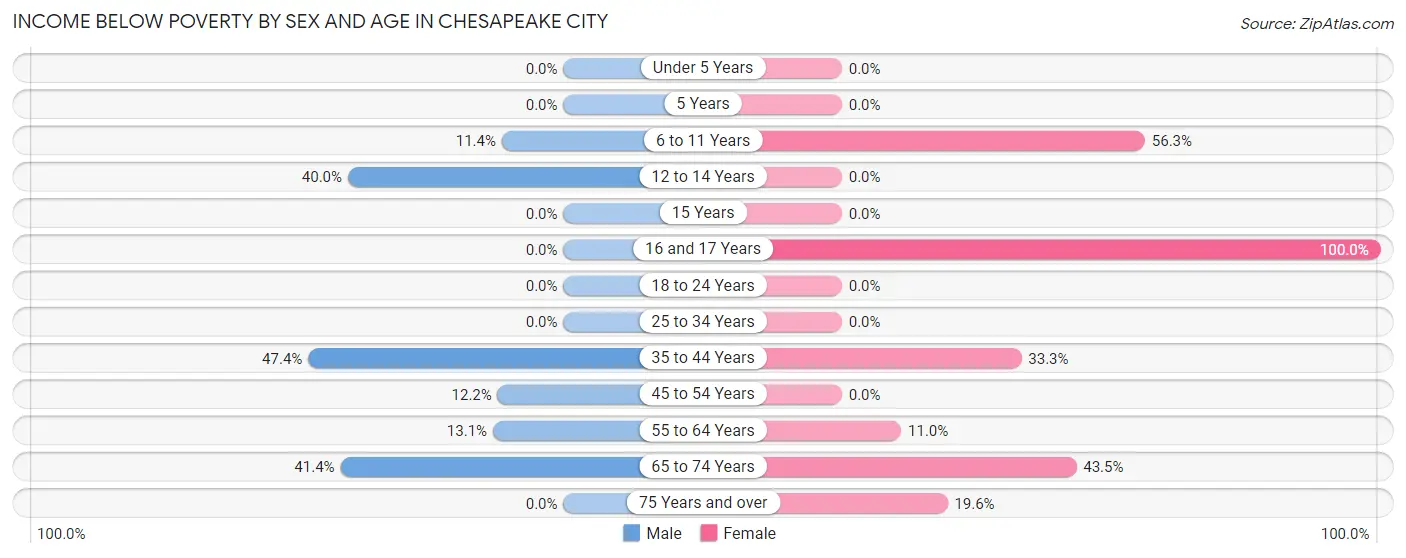
Income Below Poverty by Sex and Age in Chesapeake City
With 16.3% poverty level for males and 18.3% for females among the residents of Chesapeake City, 35 to 44 year old males and 16 and 17 year old females are the most vulnerable to poverty, with 9 males (47.4%) and 5 females (100.0%) in their respective age groups living below the poverty level.
| Age Bracket | Male | Female |
| Under 5 Years | 0 (0.0%) | 0 (0.0%) |
| 5 Years | 0 (0.0%) | 0 (0.0%) |
| 6 to 11 Years | 4 (11.4%) | 9 (56.2%) |
| 12 to 14 Years | 2 (40.0%) | 0 (0.0%) |
| 15 Years | 0 (0.0%) | 0 (0.0%) |
| 16 and 17 Years | 0 (0.0%) | 5 (100.0%) |
| 18 to 24 Years | 0 (0.0%) | 0 (0.0%) |
| 25 to 34 Years | 0 (0.0%) | 0 (0.0%) |
| 35 to 44 Years | 9 (47.4%) | 8 (33.3%) |
| 45 to 54 Years | 5 (12.2%) | 0 (0.0%) |
| 55 to 64 Years | 14 (13.1%) | 12 (11.0%) |
| 65 to 74 Years | 24 (41.4%) | 37 (43.5%) |
| 75 Years and over | 0 (0.0%) | 10 (19.6%) |
| Total | 58 (16.3%) | 81 (18.3%) |
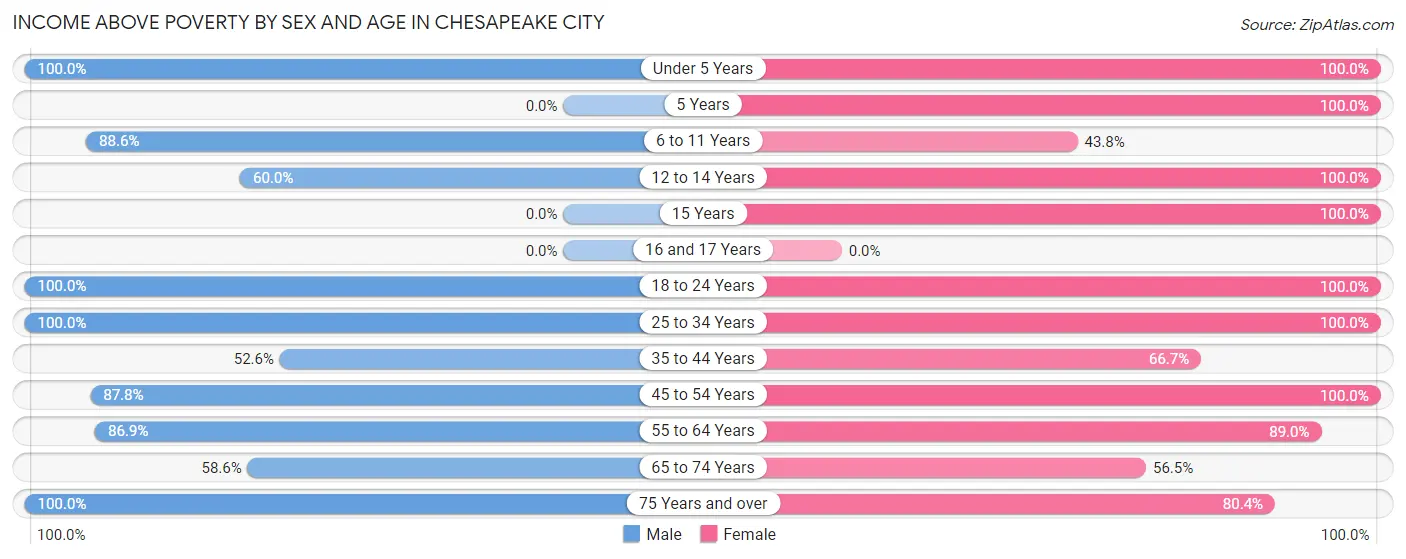
Income Above Poverty by Sex and Age in Chesapeake City
According to the poverty statistics in Chesapeake City, males aged under 5 years and females aged under 5 years are the age groups that are most secure financially, with 100.0% of males and 100.0% of females in these age groups living above the poverty line.
| Age Bracket | Male | Female |
| Under 5 Years | 2 (100.0%) | 27 (100.0%) |
| 5 Years | 0 (0.0%) | 16 (100.0%) |
| 6 to 11 Years | 31 (88.6%) | 7 (43.8%) |
| 12 to 14 Years | 3 (60.0%) | 5 (100.0%) |
| 15 Years | 0 (0.0%) | 4 (100.0%) |
| 16 and 17 Years | 0 (0.0%) | 0 (0.0%) |
| 18 to 24 Years | 16 (100.0%) | 7 (100.0%) |
| 25 to 34 Years | 35 (100.0%) | 52 (100.0%) |
| 35 to 44 Years | 10 (52.6%) | 16 (66.7%) |
| 45 to 54 Years | 36 (87.8%) | 42 (100.0%) |
| 55 to 64 Years | 93 (86.9%) | 97 (89.0%) |
| 65 to 74 Years | 34 (58.6%) | 48 (56.5%) |
| 75 Years and over | 38 (100.0%) | 41 (80.4%) |
| Total | 298 (83.7%) | 362 (81.7%) |
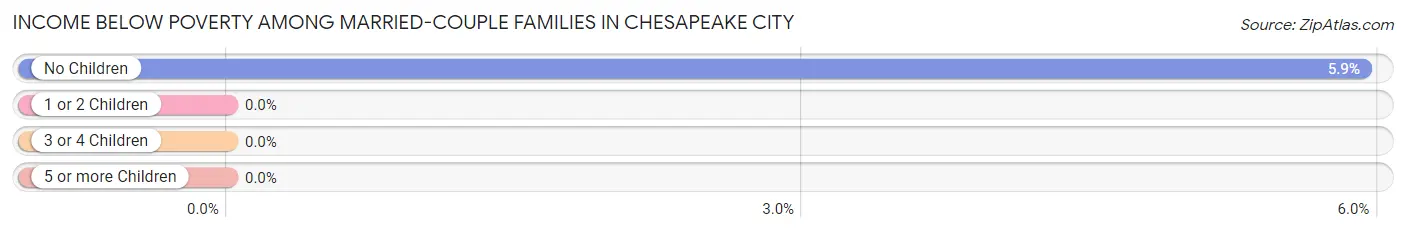
Income Below Poverty Among Married-Couple Families in Chesapeake City
The poverty statistics for married-couple families in Chesapeake City show that 5.4% or 9 of the total 167 families live below the poverty line. Families with no children have the highest poverty rate of 5.9%, comprising of 9 families. On the other hand, families with 1 or 2 children have the lowest poverty rate of 0.0%, which includes 0 families.
| Children | Above Poverty | Below Poverty |
| No Children | 143 (94.1%) | 9 (5.9%) |
| 1 or 2 Children | 15 (100.0%) | 0 (0.0%) |
| 3 or 4 Children | 0 (0.0%) | 0 (0.0%) |
| 5 or more Children | 0 (0.0%) | 0 (0.0%) |
| Total | 158 (94.6%) | 9 (5.4%) |
Income Below Poverty Among Single-Parent Households in Chesapeake City
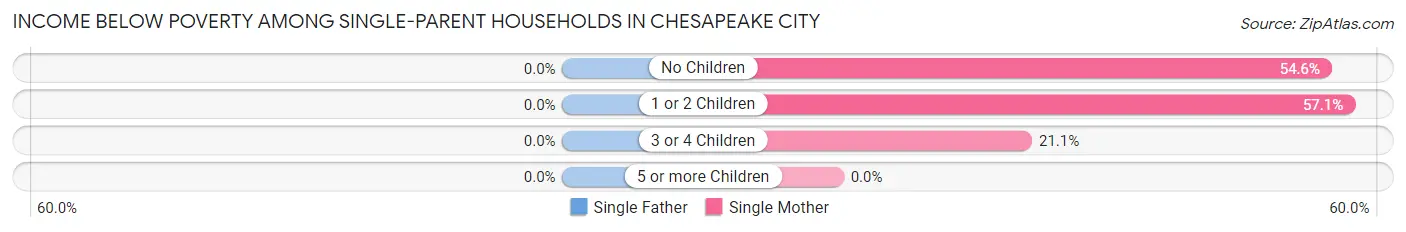
| Children | Single Father | Single Mother |
| No Children | 0 (0.0%) | 6 (54.5%) |
| 1 or 2 Children | 0 (0.0%) | 8 (57.1%) |
| 3 or 4 Children | 0 (0.0%) | 4 (21.0%) |
| 5 or more Children | 0 (0.0%) | 0 (0.0%) |
| Total | 0 (0.0%) | 18 (40.9%) |
Income Below Poverty Among Married-Couple vs Single-Parent Households in Chesapeake City
The poverty data for Chesapeake City shows that 9 of the married-couple family households (5.4%) and 18 of the single-parent households (38.3%) are living below the poverty level. Within the married-couple family households, those with no children have the highest poverty rate, with 9 households (5.9%) falling below the poverty line. Among the single-parent households, those with 1 or 2 children have the highest poverty rate, with 8 household (57.1%) living below poverty.
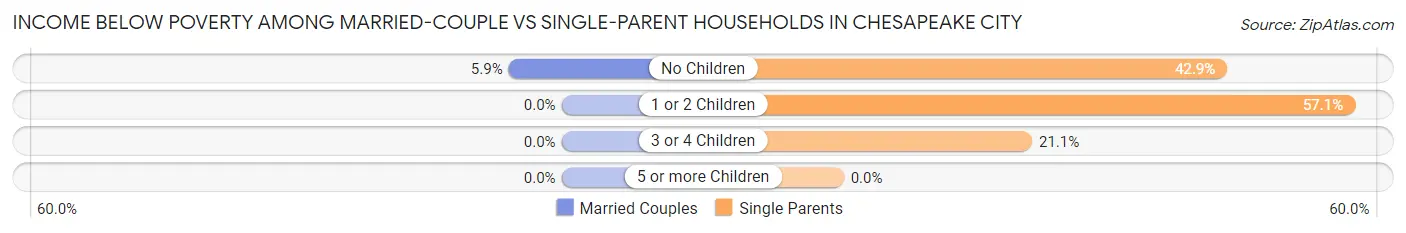
| Children | Married-Couple Families | Single-Parent Households |
| No Children | 9 (5.9%) | 6 (42.9%) |
| 1 or 2 Children | 0 (0.0%) | 8 (57.1%) |
| 3 or 4 Children | 0 (0.0%) | 4 (21.0%) |
| 5 or more Children | 0 (0.0%) | 0 (0.0%) |
| Total | 9 (5.4%) | 18 (38.3%) |
Race in Chesapeake City
The most populous races in Chesapeake City are White / Caucasian (652 | 81.4%), Two or more Races (111 | 13.9%), and Hispanic or Latino (106 | 13.2%).
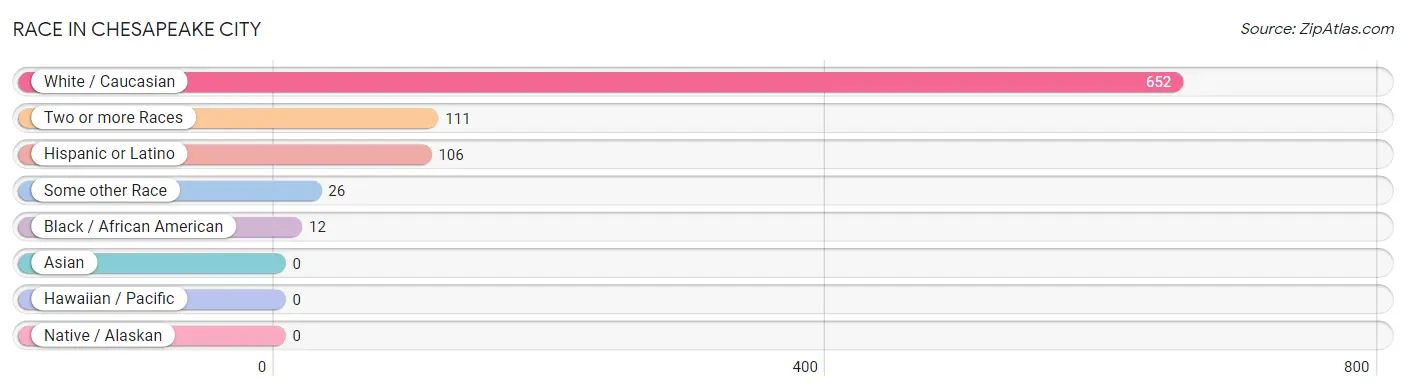
| Race | # Population | % Population |
| Asian | 0 | 0.0% |
| Black / African American | 12 | 1.5% |
| Hawaiian / Pacific | 0 | 0.0% |
| Hispanic or Latino | 106 | 13.2% |
| Native / Alaskan | 0 | 0.0% |
| White / Caucasian | 652 | 81.4% |
| Two or more Races | 111 | 13.9% |
| Some other Race | 26 | 3.3% |
| Total | 801 | 100.0% |
Ancestry in Chesapeake City
The most populous ancestries reported in Chesapeake City are Irish (143 | 17.8%), English (121 | 15.1%), German (117 | 14.6%), Mexican (85 | 10.6%), and Italian (56 | 7.0%), together accounting for 65.2% of all Chesapeake City residents.
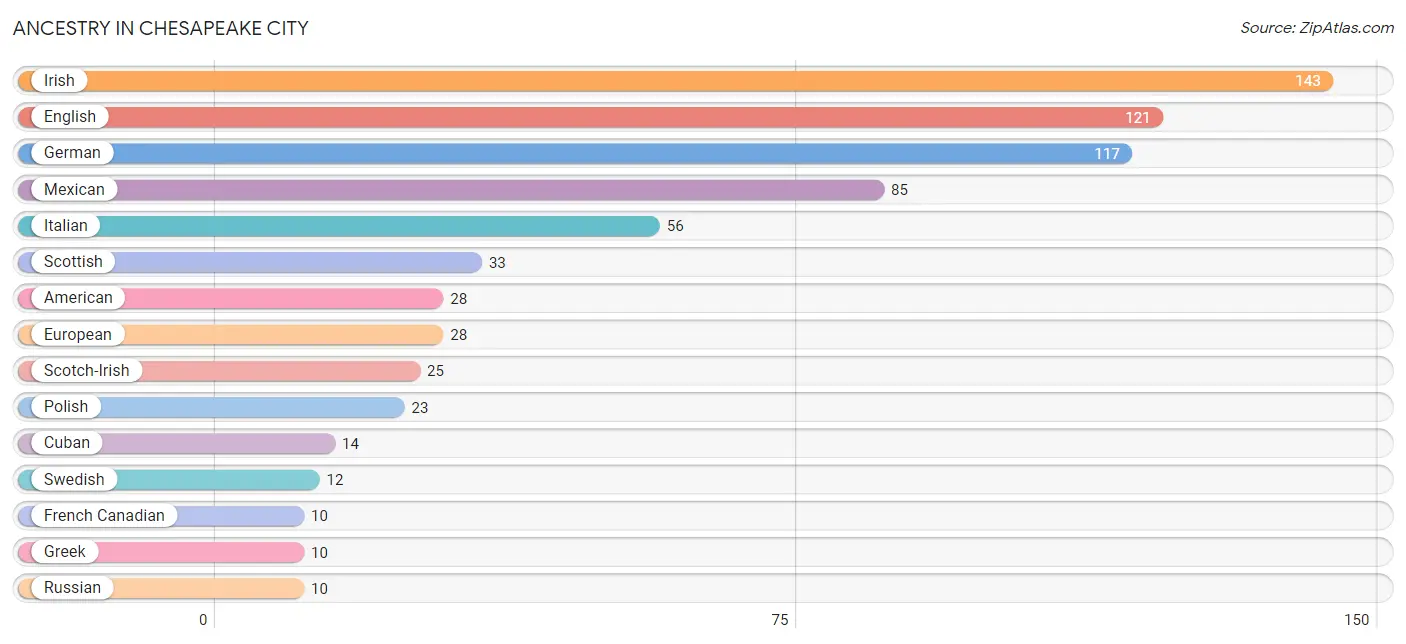
| Ancestry | # Population | % Population |
| African | 3 | 0.4% |
| American | 28 | 3.5% |
| Bhutanese | 2 | 0.3% |
| British | 4 | 0.5% |
| Burmese | 3 | 0.4% |
| Cherokee | 3 | 0.4% |
| Cuban | 14 | 1.8% |
| Dutch | 4 | 0.5% |
| Eastern European | 5 | 0.6% |
| English | 121 | 15.1% |
| European | 28 | 3.5% |
| French | 7 | 0.9% |
| French Canadian | 10 | 1.3% |
| German | 117 | 14.6% |
| Greek | 10 | 1.3% |
| Hungarian | 2 | 0.3% |
| Irish | 143 | 17.8% |
| Italian | 56 | 7.0% |
| Lithuanian | 3 | 0.4% |
| Mexican | 85 | 10.6% |
| Nigerian | 7 | 0.9% |
| Pennsylvania German | 3 | 0.4% |
| Polish | 23 | 2.9% |
| Portuguese | 4 | 0.5% |
| Russian | 10 | 1.3% |
| Scotch-Irish | 25 | 3.1% |
| Scottish | 33 | 4.1% |
| Spanish | 5 | 0.6% |
| Subsaharan African | 10 | 1.3% |
| Swedish | 12 | 1.5% |
| Ukrainian | 5 | 0.6% | View All 31 Rows |
Immigrants in Chesapeake City
The most numerous immigrant groups reported in Chesapeake City came from Latin America (40 | 5.0%), Central America (26 | 3.3%), Mexico (26 | 3.3%), Caribbean (14 | 1.8%), and Cuba (14 | 1.8%), together accounting for 15.0% of all Chesapeake City residents.
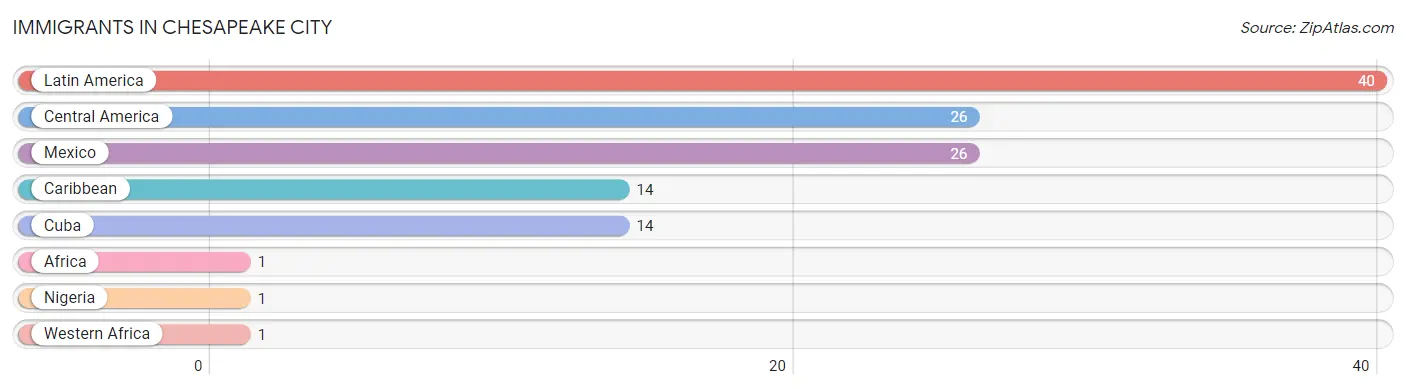
| Immigration Origin | # Population | % Population |
| Africa | 1 | 0.1% |
| Caribbean | 14 | 1.8% |
| Central America | 26 | 3.3% |
| Cuba | 14 | 1.8% |
| Latin America | 40 | 5.0% |
| Mexico | 26 | 3.3% |
| Nigeria | 1 | 0.1% |
| Western Africa | 1 | 0.1% | View All 8 Rows |
Sex and Age in Chesapeake City
Sex and Age in Chesapeake City
The most populous age groups in Chesapeake City are 60 to 64 Years (63 | 17.6%) for men and 55 to 59 Years (79 | 17.8%) for women.
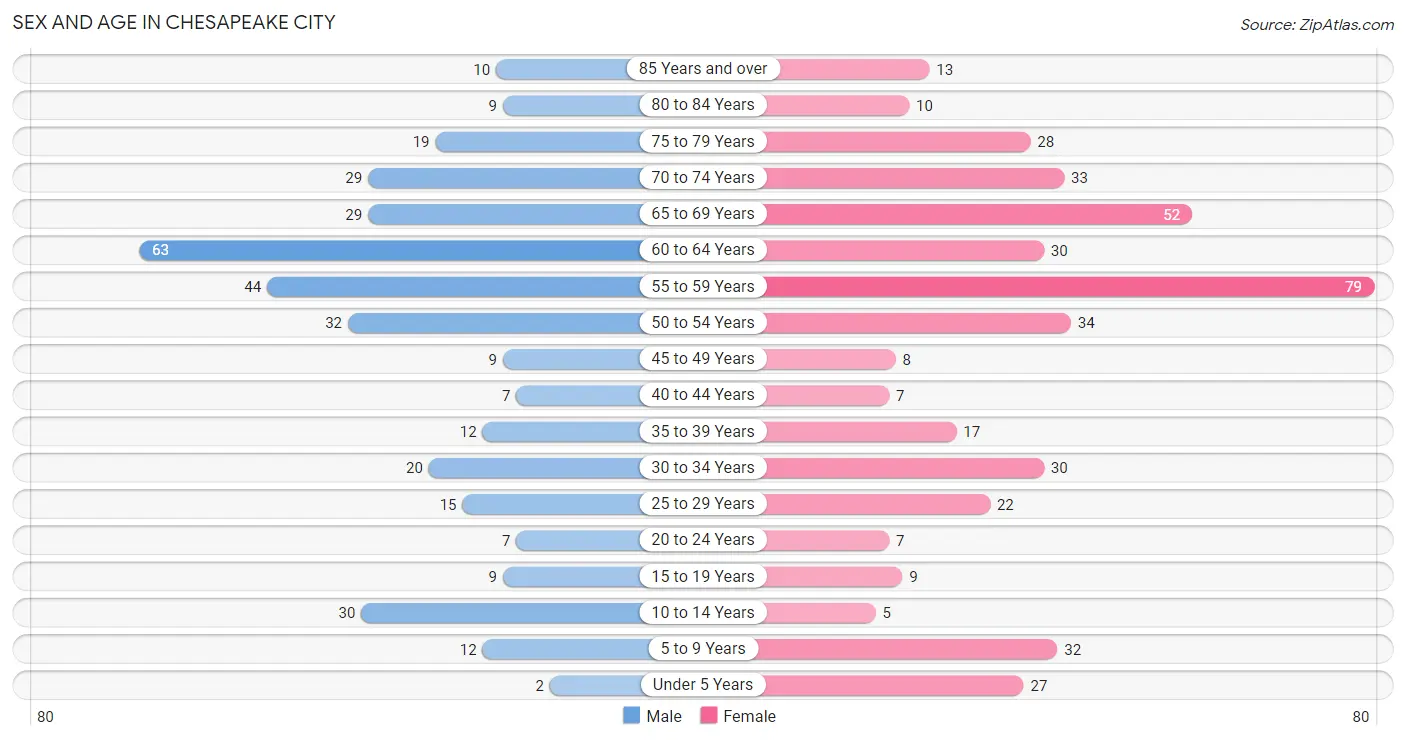
| Age Bracket | Male | Female |
| Under 5 Years | 2 (0.6%) | 27 (6.1%) |
| 5 to 9 Years | 12 (3.4%) | 32 (7.2%) |
| 10 to 14 Years | 30 (8.4%) | 5 (1.1%) |
| 15 to 19 Years | 9 (2.5%) | 9 (2.0%) |
| 20 to 24 Years | 7 (2.0%) | 7 (1.6%) |
| 25 to 29 Years | 15 (4.2%) | 22 (5.0%) |
| 30 to 34 Years | 20 (5.6%) | 30 (6.8%) |
| 35 to 39 Years | 12 (3.4%) | 17 (3.8%) |
| 40 to 44 Years | 7 (2.0%) | 7 (1.6%) |
| 45 to 49 Years | 9 (2.5%) | 8 (1.8%) |
| 50 to 54 Years | 32 (8.9%) | 34 (7.7%) |
| 55 to 59 Years | 44 (12.3%) | 79 (17.8%) |
| 60 to 64 Years | 63 (17.6%) | 30 (6.8%) |
| 65 to 69 Years | 29 (8.1%) | 52 (11.7%) |
| 70 to 74 Years | 29 (8.1%) | 33 (7.4%) |
| 75 to 79 Years | 19 (5.3%) | 28 (6.3%) |
| 80 to 84 Years | 9 (2.5%) | 10 (2.3%) |
| 85 Years and over | 10 (2.8%) | 13 (2.9%) |
| Total | 358 (100.0%) | 443 (100.0%) |
Families and Households in Chesapeake City
Median Family Size in Chesapeake City
The median family size in Chesapeake City is 2.59 persons per family, with single female/mother families (44 | 20.6%) accounting for the largest median family size of 3.93 persons per family. On the other hand, married-couple families (167 | 78.0%) represent the smallest median family size with 2.25 persons per family.
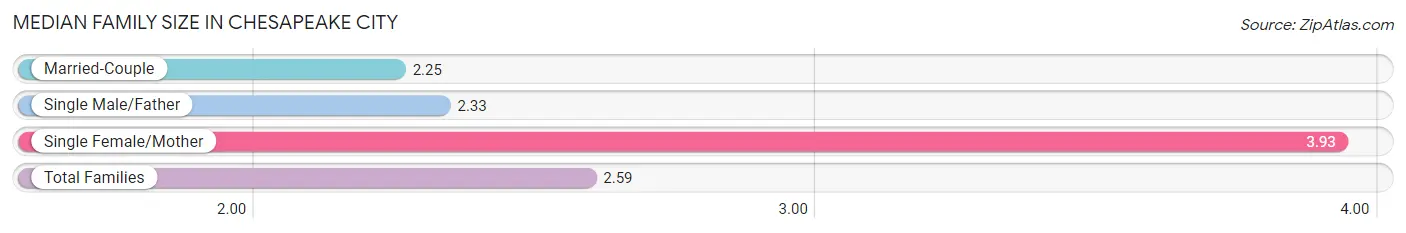
| Family Type | # Families | Family Size |
| Married-Couple | 167 (78.0%) | 2.25 |
| Single Male/Father | 3 (1.4%) | 2.33 |
| Single Female/Mother | 44 (20.6%) | 3.93 |
| Total Families | 214 (100.0%) | 2.59 |
Median Household Size in Chesapeake City
The median household size in Chesapeake City is 1.90 persons per household, with single female/mother households (44 | 10.6%) accounting for the largest median household size of 4.18 persons per household. non-family households (200 | 48.3%) represent the smallest median household size with 1.09 persons per household.
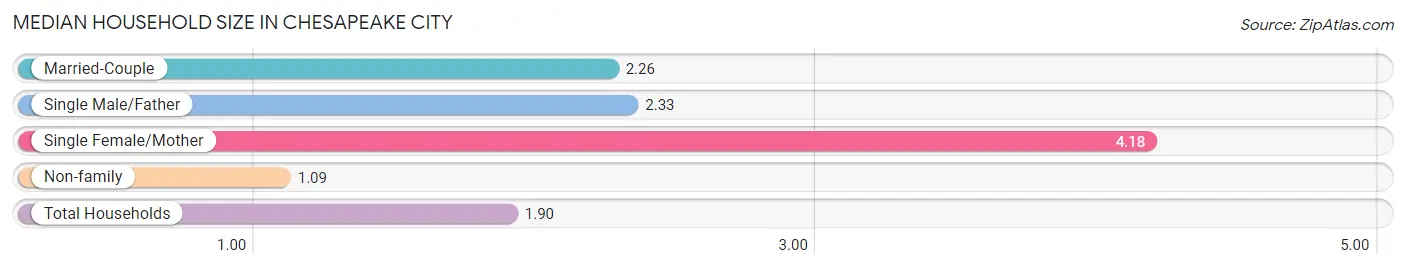
| Household Type | # Households | Household Size |
| Married-Couple | 167 (40.3%) | 2.26 |
| Single Male/Father | 3 (0.7%) | 2.33 |
| Single Female/Mother | 44 (10.6%) | 4.18 |
| Non-family | 200 (48.3%) | 1.09 |
| Total Households | 414 (100.0%) | 1.90 |
Household Size by Marriage Status in Chesapeake City
Out of a total of 414 households in Chesapeake City, 214 (51.7%) are family households, while 200 (48.3%) are nonfamily households. The most numerous type of family households are 2-person households, comprising 148, and the most common type of nonfamily households are 1-person households, comprising 185.
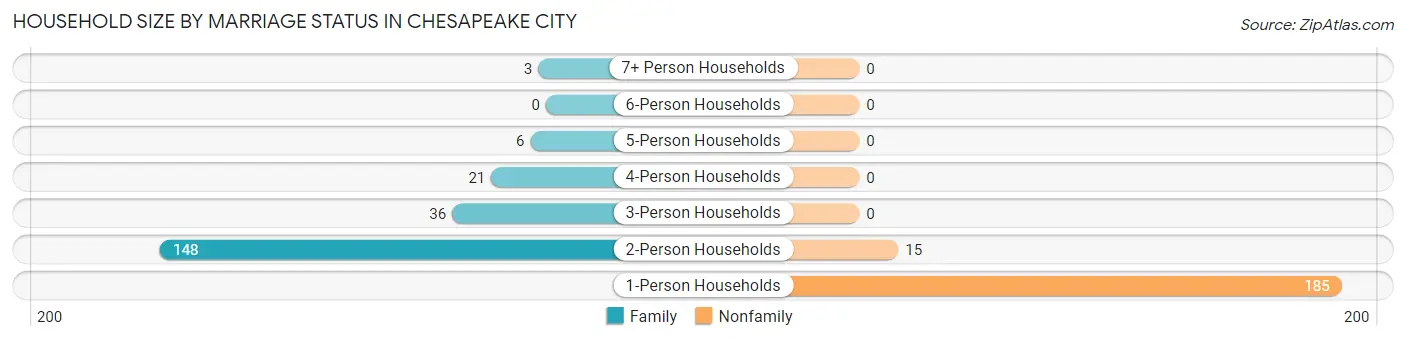
| Household Size | Family Households | Nonfamily Households |
| 1-Person Households | - | 185 (44.7%) |
| 2-Person Households | 148 (35.7%) | 15 (3.6%) |
| 3-Person Households | 36 (8.7%) | 0 (0.0%) |
| 4-Person Households | 21 (5.1%) | 0 (0.0%) |
| 5-Person Households | 6 (1.5%) | 0 (0.0%) |
| 6-Person Households | 0 (0.0%) | 0 (0.0%) |
| 7+ Person Households | 3 (0.7%) | 0 (0.0%) |
| Total | 214 (51.7%) | 200 (48.3%) |
Female Fertility in Chesapeake City
Fertility by Age in Chesapeake City
| Age Bracket | Women with Births | Births / 1,000 Women |
| 15 to 19 years | 0 (0.0%) | 0.0 |
| 20 to 34 years | 0 (0.0%) | 0.0 |
| 35 to 50 years | 0 (0.0%) | 0.0 |
| Total | 0 (0.0%) | 0.0 |
Fertility by Age by Marriage Status in Chesapeake City
| Age Bracket | Married | Unmarried |
| 15 to 19 years | 0 (0.0%) | 0 (0.0%) |
| 20 to 34 years | 0 (0.0%) | 0 (0.0%) |
| 35 to 50 years | 0 (0.0%) | 0 (0.0%) |
| Total | 0 (0.0%) | 0 (0.0%) |
Fertility by Education in Chesapeake City
| Educational Attainment | Women with Births | Births / 1,000 Women |
| Less than High School | 0 (0.0%) | 0.0 |
| High School Diploma | 0 (0.0%) | 0.0 |
| College or Associate's Degree | 0 (0.0%) | 0.0 |
| Bachelor's Degree | 0 (0.0%) | 0.0 |
| Graduate Degree | 0 (0.0%) | 0.0 |
| Total | 0 (0.0%) | 0.0 |
Fertility by Education by Marriage Status in Chesapeake City
| Educational Attainment | Married | Unmarried |
| Less than High School | 0 (0.0%) | 0 (0.0%) |
| High School Diploma | 0 (0.0%) | 0 (0.0%) |
| College or Associate's Degree | 0 (0.0%) | 0 (0.0%) |
| Bachelor's Degree | 0 (0.0%) | 0 (0.0%) |
| Graduate Degree | 0 (0.0%) | 0 (0.0%) |
| Total | 0 (0.0%) | 0 (0.0%) |
Employment Characteristics in Chesapeake City
Employment by Class of Employer in Chesapeake City
Among the 376 employed individuals in Chesapeake City, private company employees (251 | 66.8%), local government employees (49 | 13.0%), and federal government employees (21 | 5.6%) make up the most common classes of employment.
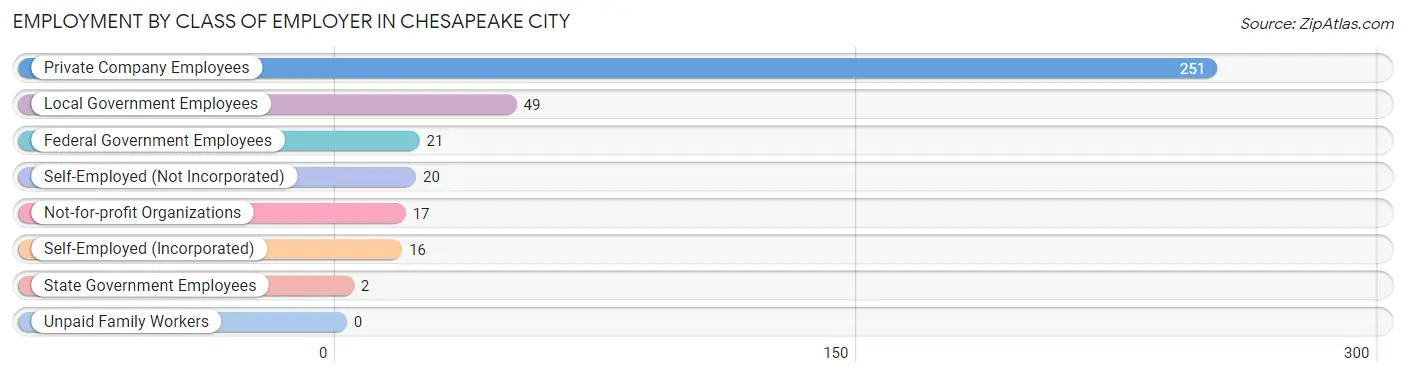
| Employer Class | # Employees | % Employees |
| Private Company Employees | 251 | 66.8% |
| Self-Employed (Incorporated) | 16 | 4.3% |
| Self-Employed (Not Incorporated) | 20 | 5.3% |
| Not-for-profit Organizations | 17 | 4.5% |
| Local Government Employees | 49 | 13.0% |
| State Government Employees | 2 | 0.5% |
| Federal Government Employees | 21 | 5.6% |
| Unpaid Family Workers | 0 | 0.0% |
| Total | 376 | 100.0% |
Employment Status by Age in Chesapeake City
According to the labor force statistics for Chesapeake City, out of the total population over 16 years of age (689), 58.9% or 406 individuals are in the labor force, with 4.4% or 18 of them unemployed. The age group with the highest labor force participation rate is 20 to 24 years, with 100.0% or 14 individuals in the labor force. Within the labor force, the 20 to 24 years age range has the highest percentage of unemployed individuals, with 28.6% or 4 of them being unemployed.
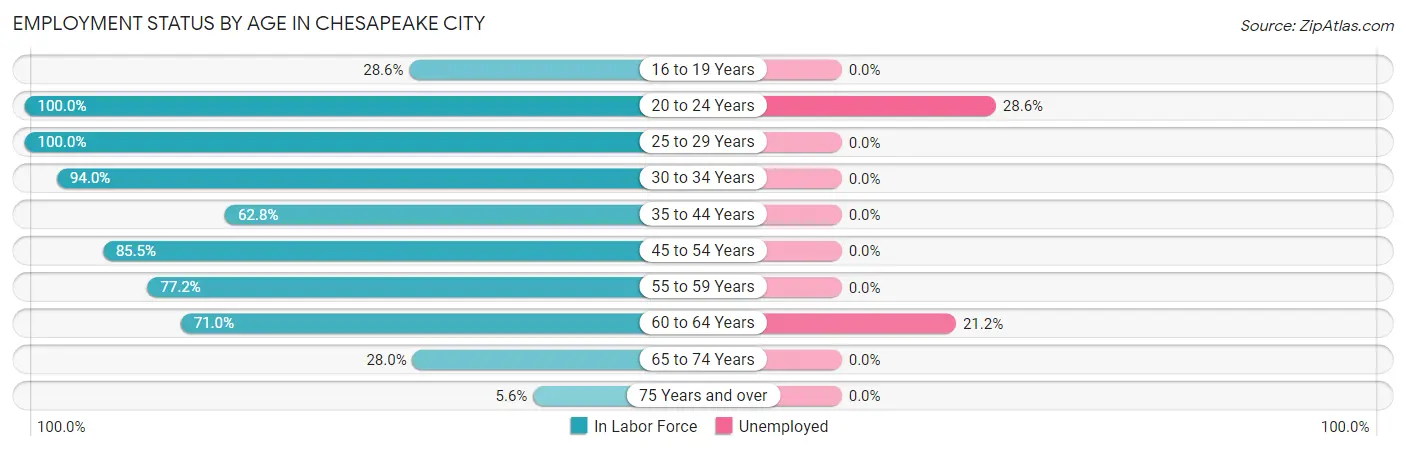
| Age Bracket | In Labor Force | Unemployed |
| 16 to 19 Years | 4 (28.6%) | 0 (0.0%) |
| 20 to 24 Years | 14 (100.0%) | 4 (28.6%) |
| 25 to 29 Years | 37 (100.0%) | 0 (0.0%) |
| 30 to 34 Years | 47 (94.0%) | 0 (0.0%) |
| 35 to 44 Years | 27 (62.8%) | 0 (0.0%) |
| 45 to 54 Years | 71 (85.5%) | 0 (0.0%) |
| 55 to 59 Years | 95 (77.2%) | 0 (0.0%) |
| 60 to 64 Years | 66 (71.0%) | 14 (21.2%) |
| 65 to 74 Years | 40 (28.0%) | 0 (0.0%) |
| 75 Years and over | 5 (5.6%) | 0 (0.0%) |
| Total | 406 (58.9%) | 18 (4.4%) |
Employment Status by Educational Attainment in Chesapeake City
According to labor force statistics for Chesapeake City, 80.0% of individuals (343) out of the total population between 25 and 64 years of age (429) are in the labor force, with 4.1% or 14 of them being unemployed. The group with the highest labor force participation rate are those with the educational attainment of bachelor's degree or higher, with 92.9% or 145 individuals in the labor force. Within the labor force, individuals with bachelor's degree or higher education have the highest percentage of unemployment, with 9.7% or 14 of them being unemployed.
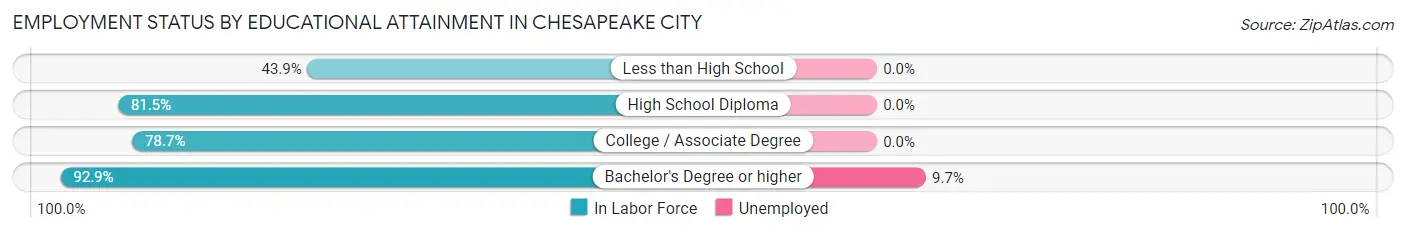
| Educational Attainment | In Labor Force | Unemployed |
| Less than High School | 25 (43.9%) | 0 (0.0%) |
| High School Diploma | 88 (81.5%) | 0 (0.0%) |
| College / Associate Degree | 85 (78.7%) | 0 (0.0%) |
| Bachelor's Degree or higher | 145 (92.9%) | 15 (9.7%) |
| Total | 343 (80.0%) | 18 (4.1%) |
Employment Occupations by Sex in Chesapeake City
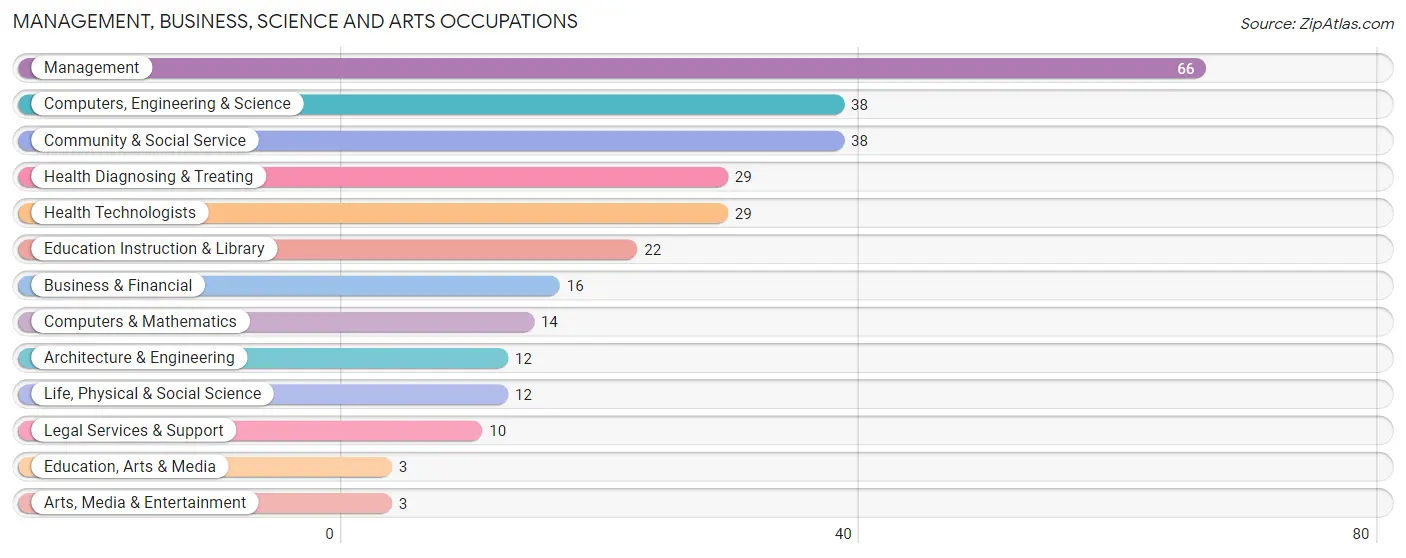
Management, Business, Science and Arts Occupations
The most common Management, Business, Science and Arts occupations in Chesapeake City are Management (66 | 17.0%), Computers, Engineering & Science (38 | 9.8%), Community & Social Service (38 | 9.8%), Health Diagnosing & Treating (29 | 7.5%), and Health Technologists (29 | 7.5%).
Management, Business, Science and Arts Occupations by Sex
Within the Management, Business, Science and Arts occupations in Chesapeake City, the most male-oriented occupations are Architecture & Engineering (100.0%), Arts, Media & Entertainment (100.0%), and Computers & Mathematics (92.9%), while the most female-oriented occupations are Education, Arts & Media (100.0%), Health Diagnosing & Treating (93.1%), and Health Technologists (93.1%).
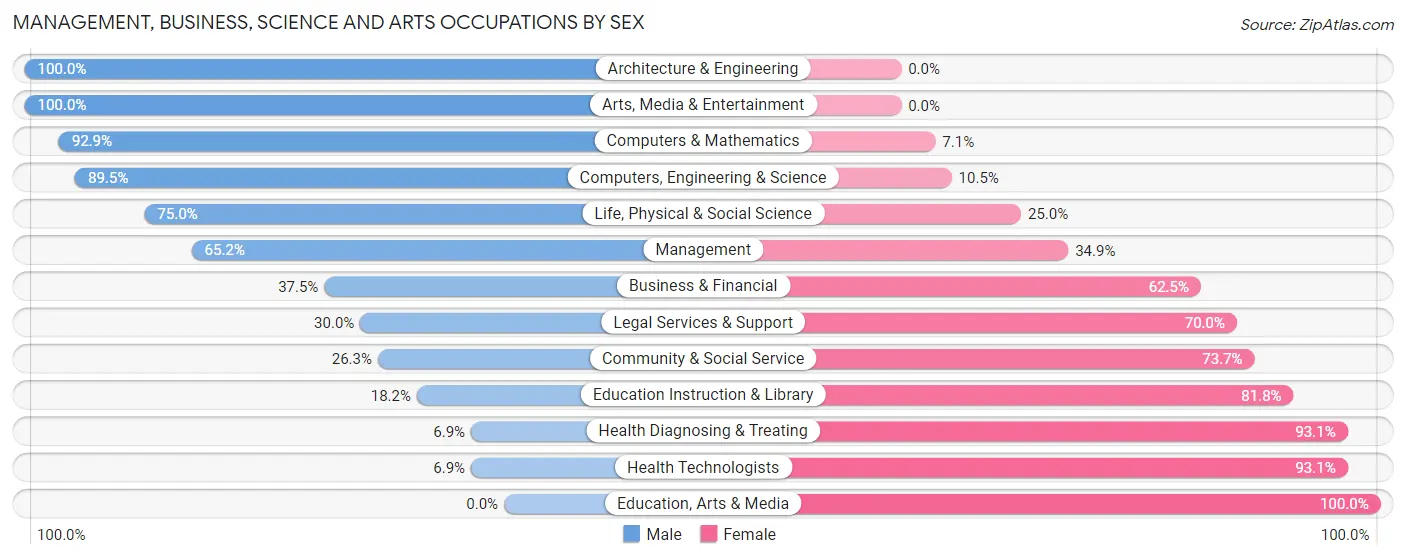
| Occupation | Male | Female |
| Management | 43 (65.1%) | 23 (34.8%) |
| Business & Financial | 6 (37.5%) | 10 (62.5%) |
| Computers, Engineering & Science | 34 (89.5%) | 4 (10.5%) |
| Computers & Mathematics | 13 (92.9%) | 1 (7.1%) |
| Architecture & Engineering | 12 (100.0%) | 0 (0.0%) |
| Life, Physical & Social Science | 9 (75.0%) | 3 (25.0%) |
| Community & Social Service | 10 (26.3%) | 28 (73.7%) |
| Education, Arts & Media | 0 (0.0%) | 3 (100.0%) |
| Legal Services & Support | 3 (30.0%) | 7 (70.0%) |
| Education Instruction & Library | 4 (18.2%) | 18 (81.8%) |
| Arts, Media & Entertainment | 3 (100.0%) | 0 (0.0%) |
| Health Diagnosing & Treating | 2 (6.9%) | 27 (93.1%) |
| Health Technologists | 2 (6.9%) | 27 (93.1%) |
| Total (Category) | 95 (50.8%) | 92 (49.2%) |
| Total (Overall) | 177 (45.6%) | 211 (54.4%) |
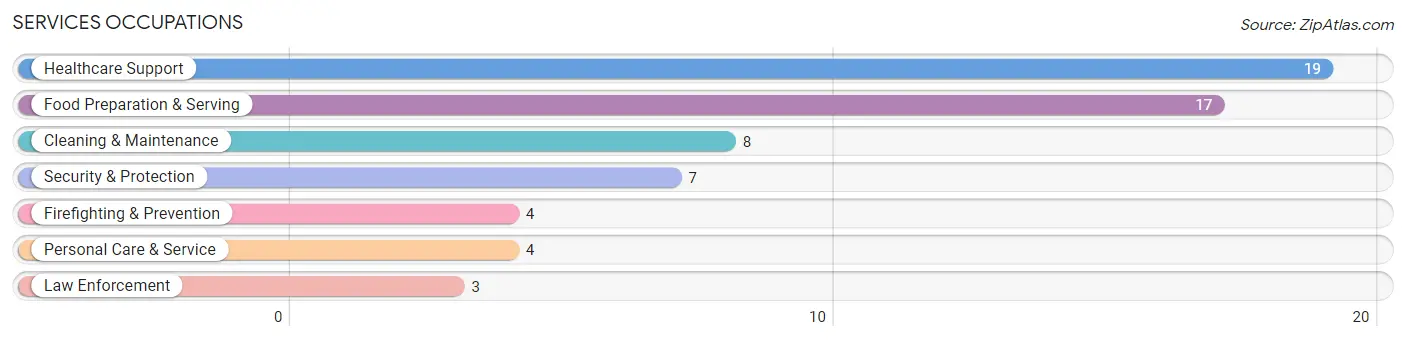
Services Occupations
The most common Services occupations in Chesapeake City are Healthcare Support (19 | 4.9%), Food Preparation & Serving (17 | 4.4%), Cleaning & Maintenance (8 | 2.1%), Security & Protection (7 | 1.8%), and Firefighting & Prevention (4 | 1.0%).
Services Occupations by Sex
Within the Services occupations in Chesapeake City, the most male-oriented occupations are Security & Protection (100.0%), Firefighting & Prevention (100.0%), and Law Enforcement (100.0%), while the most female-oriented occupations are Healthcare Support (100.0%), Food Preparation & Serving (100.0%), and Personal Care & Service (100.0%).
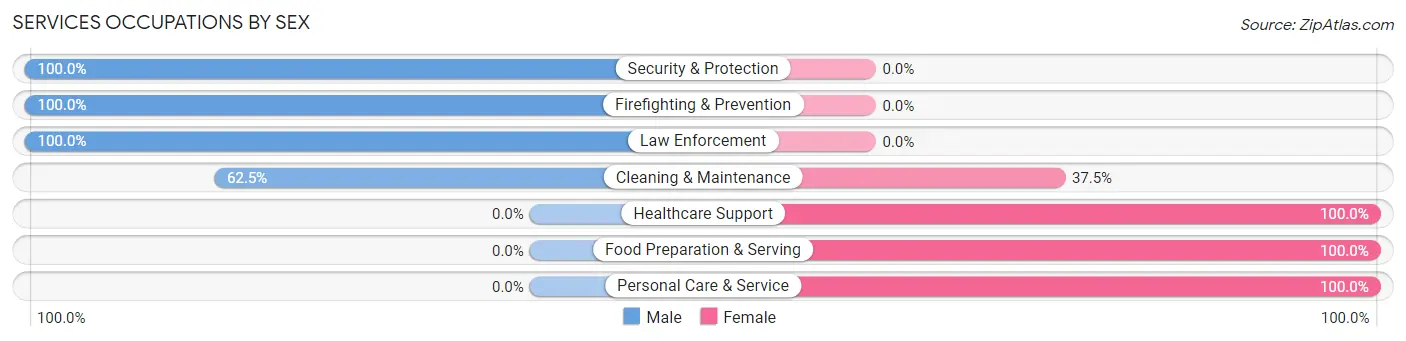
| Occupation | Male | Female |
| Healthcare Support | 0 (0.0%) | 19 (100.0%) |
| Security & Protection | 7 (100.0%) | 0 (0.0%) |
| Firefighting & Prevention | 4 (100.0%) | 0 (0.0%) |
| Law Enforcement | 3 (100.0%) | 0 (0.0%) |
| Food Preparation & Serving | 0 (0.0%) | 17 (100.0%) |
| Cleaning & Maintenance | 5 (62.5%) | 3 (37.5%) |
| Personal Care & Service | 0 (0.0%) | 4 (100.0%) |
| Total (Category) | 12 (21.8%) | 43 (78.2%) |
| Total (Overall) | 177 (45.6%) | 211 (54.4%) |
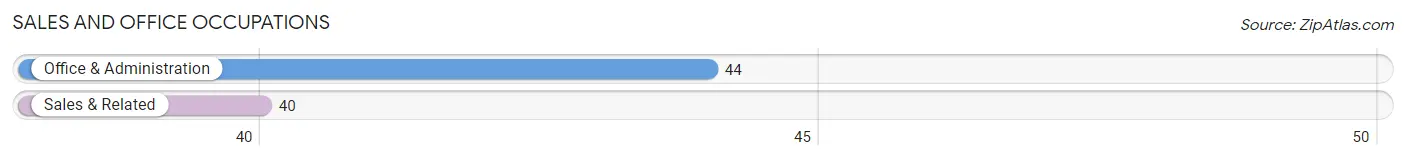
Sales and Office Occupations
The most common Sales and Office occupations in Chesapeake City are Office & Administration (44 | 11.3%), and Sales & Related (40 | 10.3%).
Sales and Office Occupations by Sex
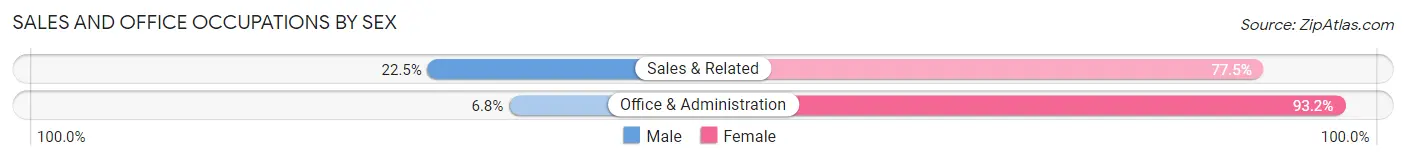
| Occupation | Male | Female |
| Sales & Related | 9 (22.5%) | 31 (77.5%) |
| Office & Administration | 3 (6.8%) | 41 (93.2%) |
| Total (Category) | 12 (14.3%) | 72 (85.7%) |
| Total (Overall) | 177 (45.6%) | 211 (54.4%) |
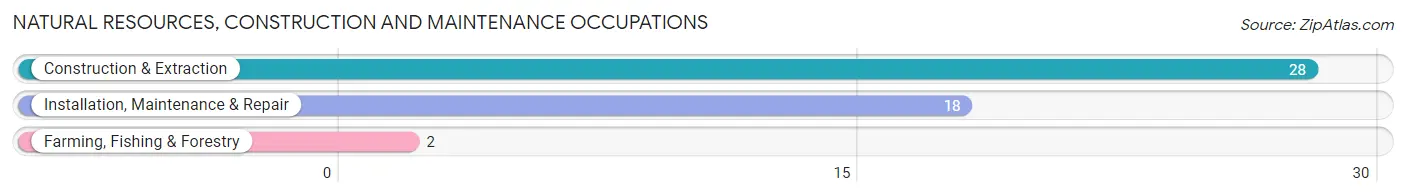
Natural Resources, Construction and Maintenance Occupations
The most common Natural Resources, Construction and Maintenance occupations in Chesapeake City are Construction & Extraction (28 | 7.2%), Installation, Maintenance & Repair (18 | 4.6%), and Farming, Fishing & Forestry (2 | 0.5%).
Natural Resources, Construction and Maintenance Occupations by Sex
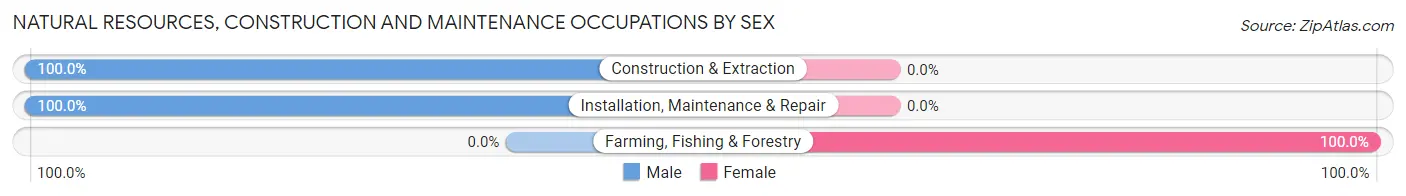
| Occupation | Male | Female |
| Farming, Fishing & Forestry | 0 (0.0%) | 2 (100.0%) |
| Construction & Extraction | 28 (100.0%) | 0 (0.0%) |
| Installation, Maintenance & Repair | 18 (100.0%) | 0 (0.0%) |
| Total (Category) | 46 (95.8%) | 2 (4.2%) |
| Total (Overall) | 177 (45.6%) | 211 (54.4%) |
Production, Transportation and Moving Occupations
The most common Production, Transportation and Moving occupations in Chesapeake City are , and Production (14 | 3.6%).
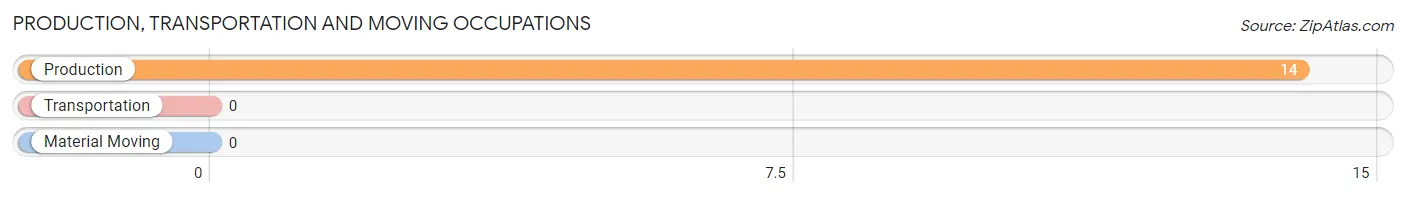
Production, Transportation and Moving Occupations by Sex
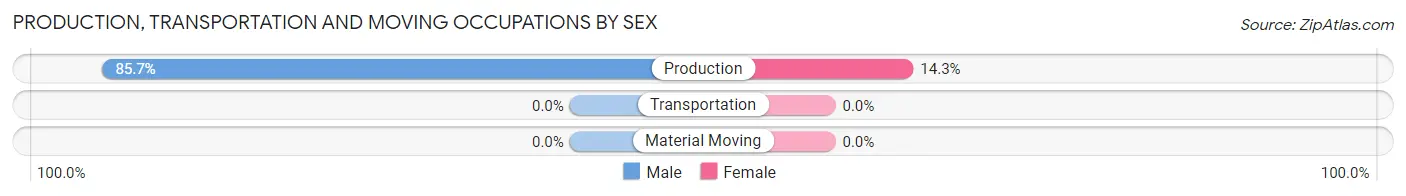
| Occupation | Male | Female |
| Production | 12 (85.7%) | 2 (14.3%) |
| Transportation | 0 (0.0%) | 0 (0.0%) |
| Material Moving | 0 (0.0%) | 0 (0.0%) |
| Total (Category) | 12 (85.7%) | 2 (14.3%) |
| Total (Overall) | 177 (45.6%) | 211 (54.4%) |
Employment Industries by Sex in Chesapeake City
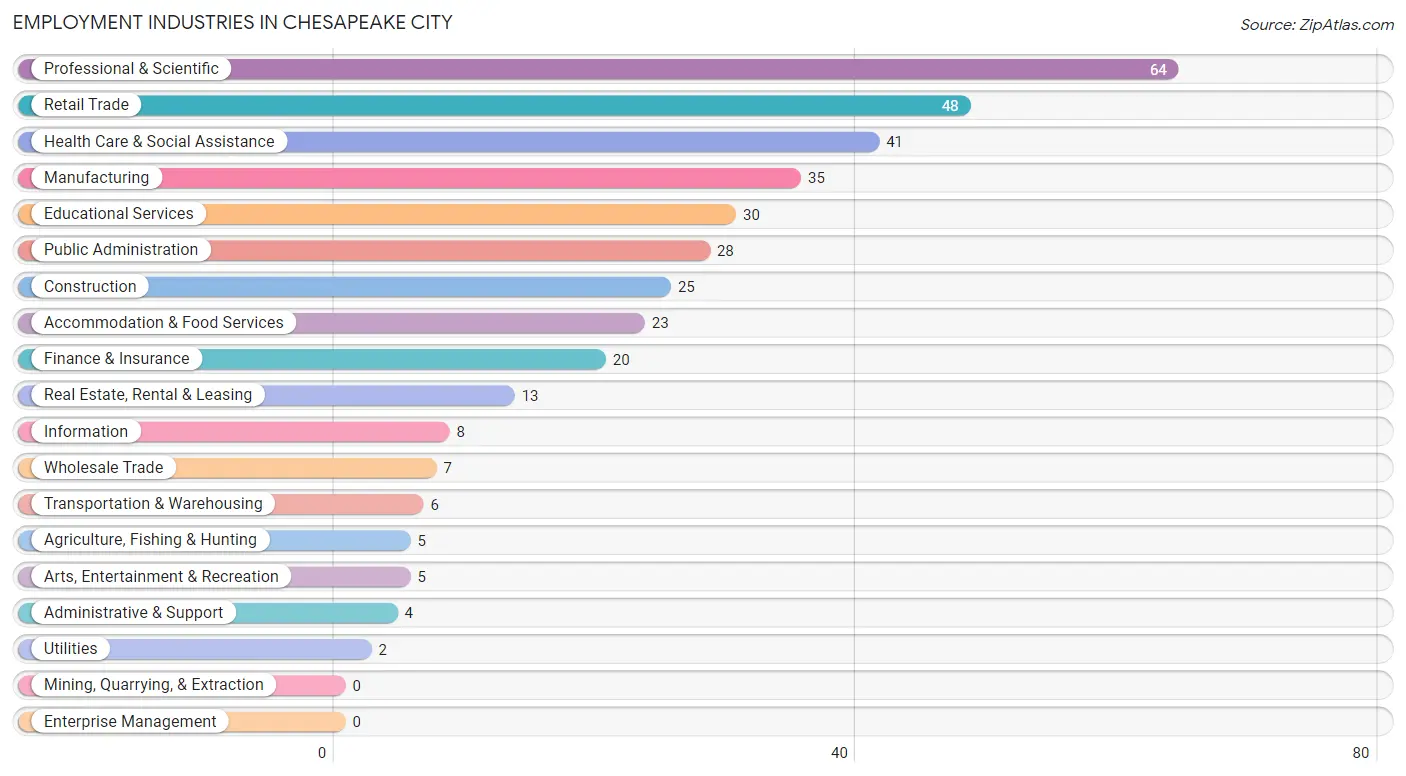
Employment Industries in Chesapeake City
The major employment industries in Chesapeake City include Professional & Scientific (64 | 16.5%), Retail Trade (48 | 12.4%), Health Care & Social Assistance (41 | 10.6%), Manufacturing (35 | 9.0%), and Educational Services (30 | 7.7%).
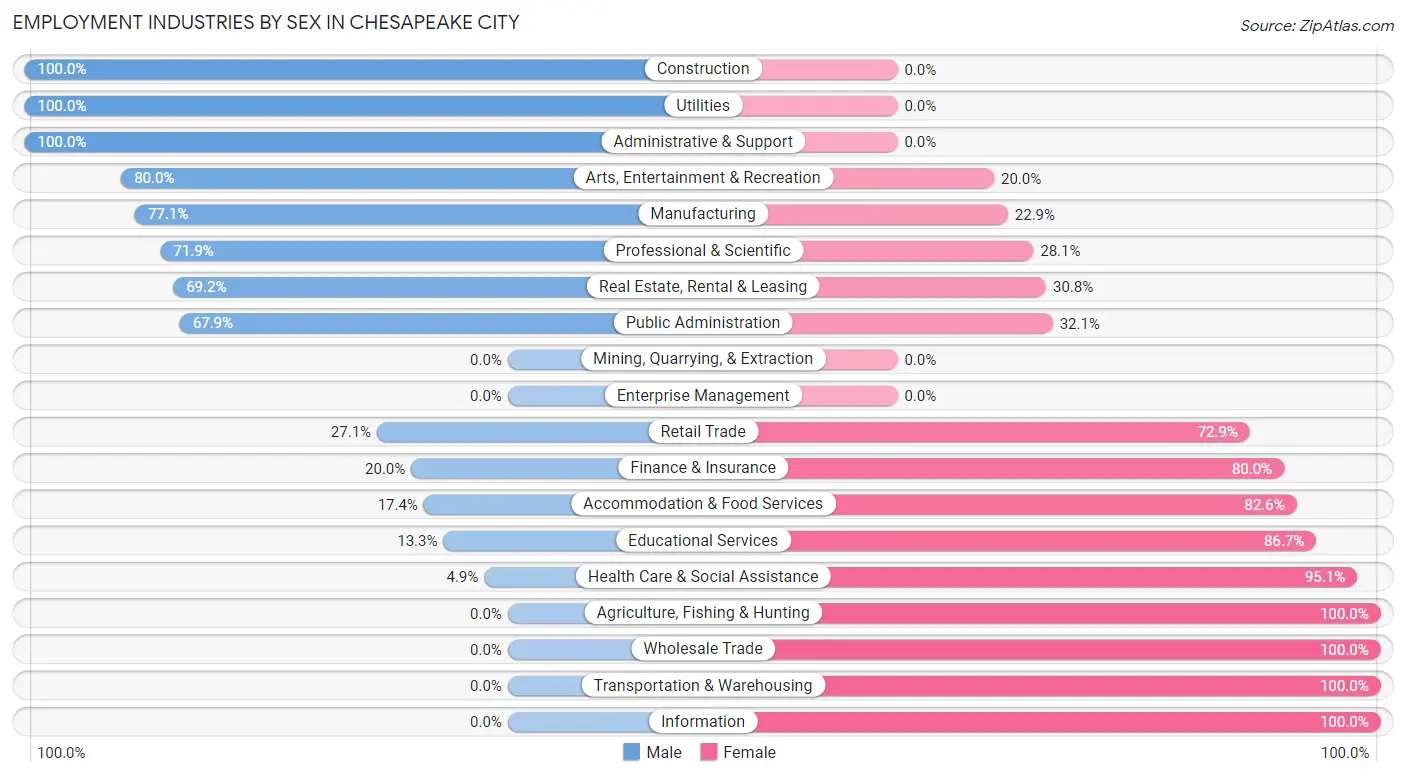
Employment Industries by Sex in Chesapeake City
The Chesapeake City industries that see more men than women are Construction (100.0%), Utilities (100.0%), and Administrative & Support (100.0%), whereas the industries that tend to have a higher number of women are Agriculture, Fishing & Hunting (100.0%), Wholesale Trade (100.0%), and Transportation & Warehousing (100.0%).
| Industry | Male | Female |
| Agriculture, Fishing & Hunting | 0 (0.0%) | 5 (100.0%) |
| Mining, Quarrying, & Extraction | 0 (0.0%) | 0 (0.0%) |
| Construction | 25 (100.0%) | 0 (0.0%) |
| Manufacturing | 27 (77.1%) | 8 (22.9%) |
| Wholesale Trade | 0 (0.0%) | 7 (100.0%) |
| Retail Trade | 13 (27.1%) | 35 (72.9%) |
| Transportation & Warehousing | 0 (0.0%) | 6 (100.0%) |
| Utilities | 2 (100.0%) | 0 (0.0%) |
| Information | 0 (0.0%) | 8 (100.0%) |
| Finance & Insurance | 4 (20.0%) | 16 (80.0%) |
| Real Estate, Rental & Leasing | 9 (69.2%) | 4 (30.8%) |
| Professional & Scientific | 46 (71.9%) | 18 (28.1%) |
| Enterprise Management | 0 (0.0%) | 0 (0.0%) |
| Administrative & Support | 4 (100.0%) | 0 (0.0%) |
| Educational Services | 4 (13.3%) | 26 (86.7%) |
| Health Care & Social Assistance | 2 (4.9%) | 39 (95.1%) |
| Arts, Entertainment & Recreation | 4 (80.0%) | 1 (20.0%) |
| Accommodation & Food Services | 4 (17.4%) | 19 (82.6%) |
| Public Administration | 19 (67.9%) | 9 (32.1%) |
| Total | 177 (45.6%) | 211 (54.4%) |
Education in Chesapeake City
School Enrollment in Chesapeake City
The most common levels of schooling among the 110 students in Chesapeake City are middle school (33 | 30.0%), elementary school (28 | 25.5%), and kindergarten (16 | 14.5%).
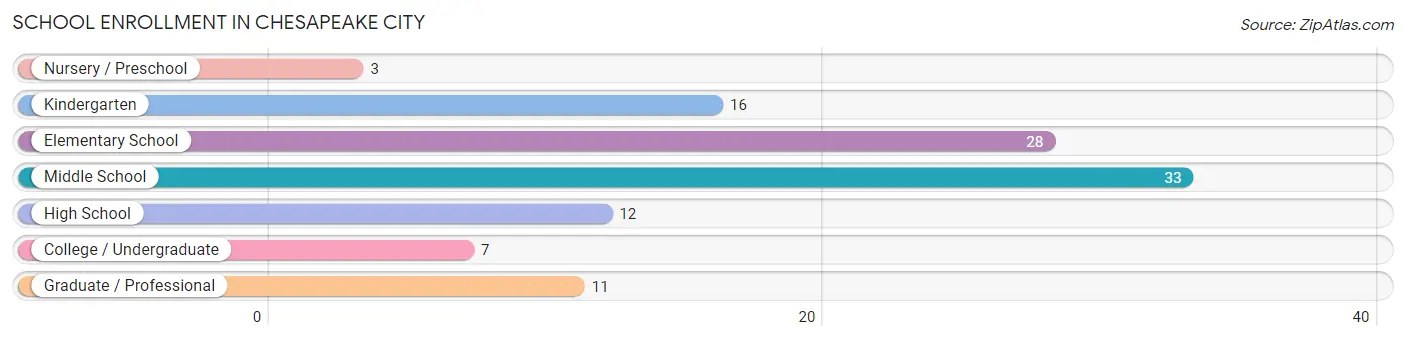
| School Level | # Students | % Students |
| Nursery / Preschool | 3 | 2.7% |
| Kindergarten | 16 | 14.5% |
| Elementary School | 28 | 25.5% |
| Middle School | 33 | 30.0% |
| High School | 12 | 10.9% |
| College / Undergraduate | 7 | 6.4% |
| Graduate / Professional | 11 | 10.0% |
| Total | 110 | 100.0% |
School Enrollment by Age by Funding Source in Chesapeake City
Out of a total of 110 students who are enrolled in schools in Chesapeake City, 9 (8.2%) attend a private institution, while the remaining 101 (91.8%) are enrolled in public schools. The age group of 3 to 4 year olds has the highest likelihood of being enrolled in private schools, with 3 (100.0% in the age bracket) enrolled. Conversely, the age group of 5 to 9 year old has the lowest likelihood of being enrolled in a private school, with 44 (100.0% in the age bracket) attending a public institution.
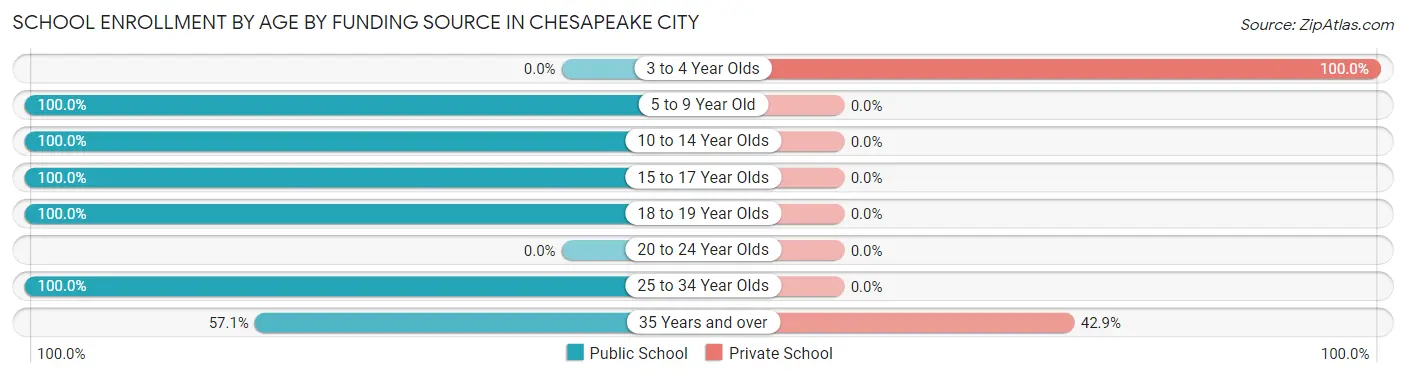
| Age Bracket | Public School | Private School |
| 3 to 4 Year Olds | 0 (0.0%) | 3 (100.0%) |
| 5 to 9 Year Old | 44 (100.0%) | 0 (0.0%) |
| 10 to 14 Year Olds | 33 (100.0%) | 0 (0.0%) |
| 15 to 17 Year Olds | 9 (100.0%) | 0 (0.0%) |
| 18 to 19 Year Olds | 3 (100.0%) | 0 (0.0%) |
| 20 to 24 Year Olds | 0 (0.0%) | 0 (0.0%) |
| 25 to 34 Year Olds | 4 (100.0%) | 0 (0.0%) |
| 35 Years and over | 8 (57.1%) | 6 (42.9%) |
| Total | 101 (91.8%) | 9 (8.2%) |
Educational Attainment by Field of Study in Chesapeake City
Business (58 | 27.1%), social sciences (42 | 19.6%), science & technology (29 | 13.6%), education (24 | 11.2%), and visual & performing arts (18 | 8.4%) are the most common fields of study among 214 individuals in Chesapeake City who have obtained a bachelor's degree or higher.
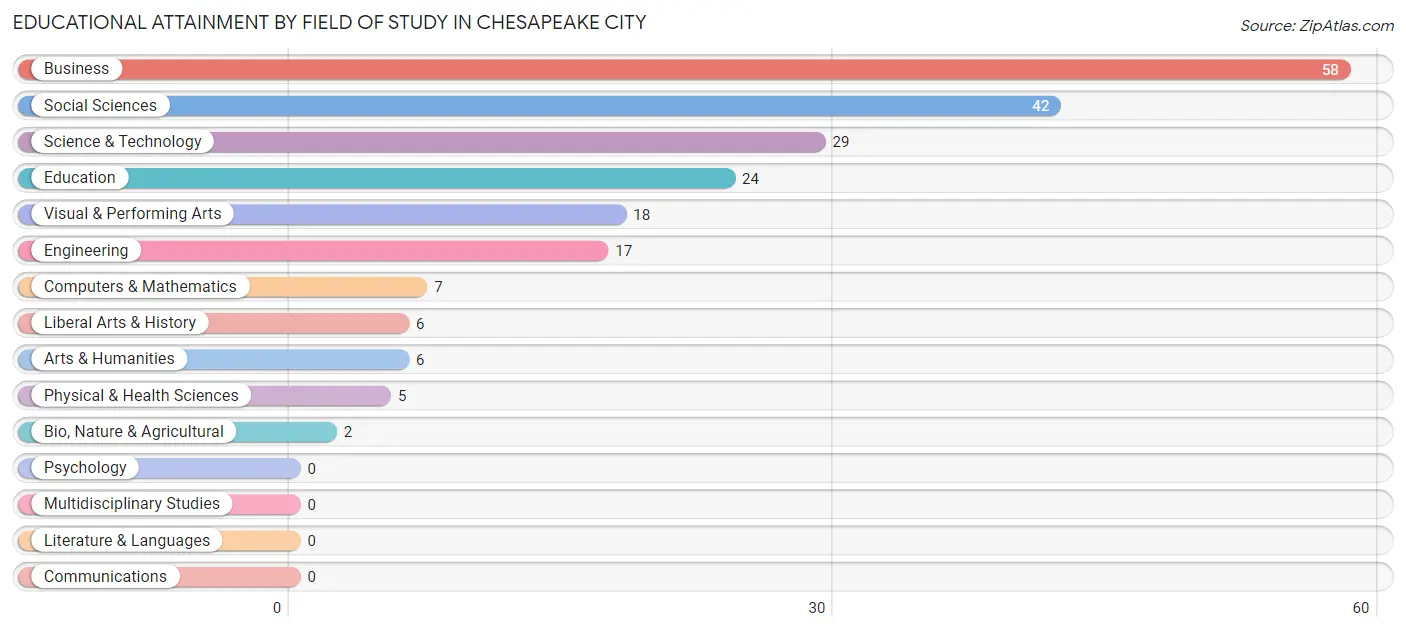
| Field of Study | # Graduates | % Graduates |
| Computers & Mathematics | 7 | 3.3% |
| Bio, Nature & Agricultural | 2 | 0.9% |
| Physical & Health Sciences | 5 | 2.3% |
| Psychology | 0 | 0.0% |
| Social Sciences | 42 | 19.6% |
| Engineering | 17 | 7.9% |
| Multidisciplinary Studies | 0 | 0.0% |
| Science & Technology | 29 | 13.6% |
| Business | 58 | 27.1% |
| Education | 24 | 11.2% |
| Literature & Languages | 0 | 0.0% |
| Liberal Arts & History | 6 | 2.8% |
| Visual & Performing Arts | 18 | 8.4% |
| Communications | 0 | 0.0% |
| Arts & Humanities | 6 | 2.8% |
| Total | 214 | 100.0% |
Transportation & Commute in Chesapeake City
Vehicle Availability by Sex in Chesapeake City
The most prevalent vehicle ownership categories in Chesapeake City are males with 2 vehicles (92, accounting for 53.8%) and females with 2 vehicles (74, making up 45.5%).
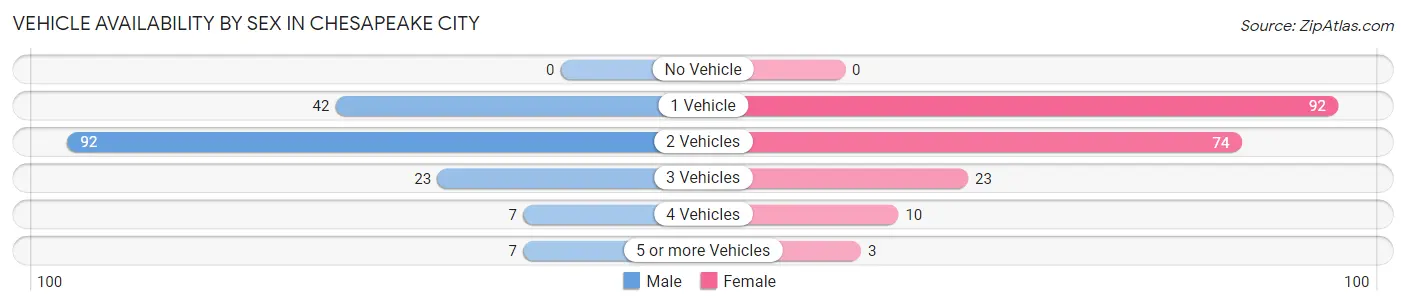
| Vehicles Available | Male | Female |
| No Vehicle | 0 (0.0%) | 0 (0.0%) |
| 1 Vehicle | 42 (24.6%) | 92 (45.5%) |
| 2 Vehicles | 92 (53.8%) | 74 (36.6%) |
| 3 Vehicles | 23 (13.5%) | 23 (11.4%) |
| 4 Vehicles | 7 (4.1%) | 10 (5.0%) |
| 5 or more Vehicles | 7 (4.1%) | 3 (1.5%) |
| Total | 171 (100.0%) | 202 (100.0%) |
Commute Time in Chesapeake City
The most frequently occuring commute durations in Chesapeake City are 5 to 9 minutes (45 commuters, 14.3%), 30 to 34 minutes (45 commuters, 14.3%), and 25 to 29 minutes (33 commuters, 10.5%).
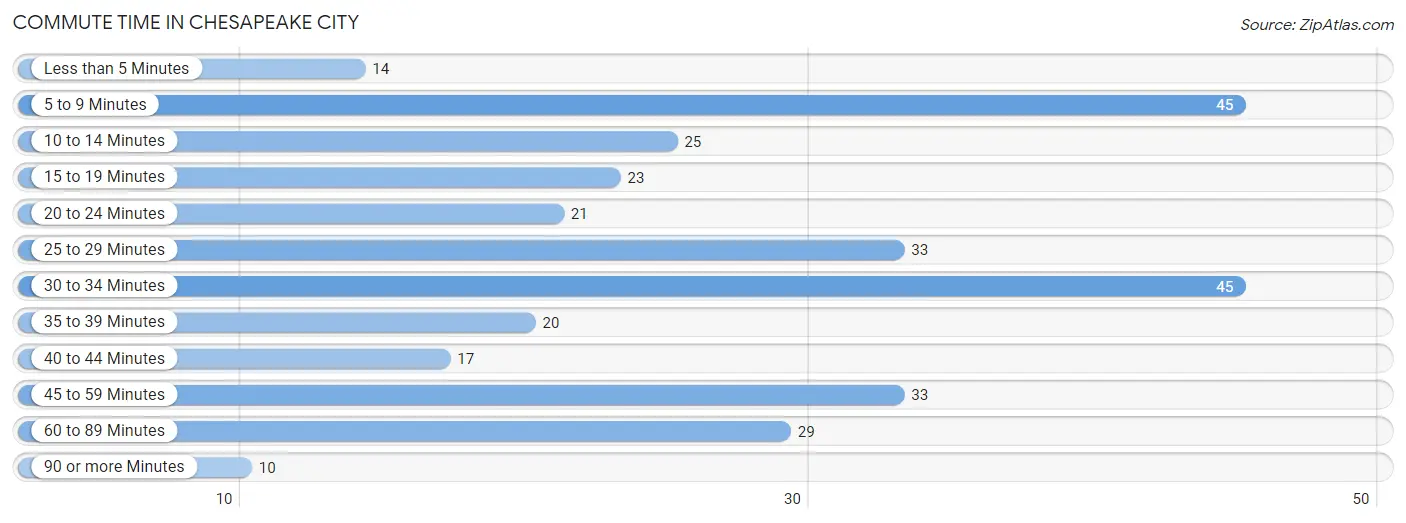
| Commute Time | # Commuters | % Commuters |
| Less than 5 Minutes | 14 | 4.4% |
| 5 to 9 Minutes | 45 | 14.3% |
| 10 to 14 Minutes | 25 | 7.9% |
| 15 to 19 Minutes | 23 | 7.3% |
| 20 to 24 Minutes | 21 | 6.7% |
| 25 to 29 Minutes | 33 | 10.5% |
| 30 to 34 Minutes | 45 | 14.3% |
| 35 to 39 Minutes | 20 | 6.4% |
| 40 to 44 Minutes | 17 | 5.4% |
| 45 to 59 Minutes | 33 | 10.5% |
| 60 to 89 Minutes | 29 | 9.2% |
| 90 or more Minutes | 10 | 3.2% |
Commute Time by Sex in Chesapeake City
The most common commute times in Chesapeake City are 60 to 89 minutes (28 commuters, 19.4%) for males and 30 to 34 minutes (41 commuters, 24.0%) for females.
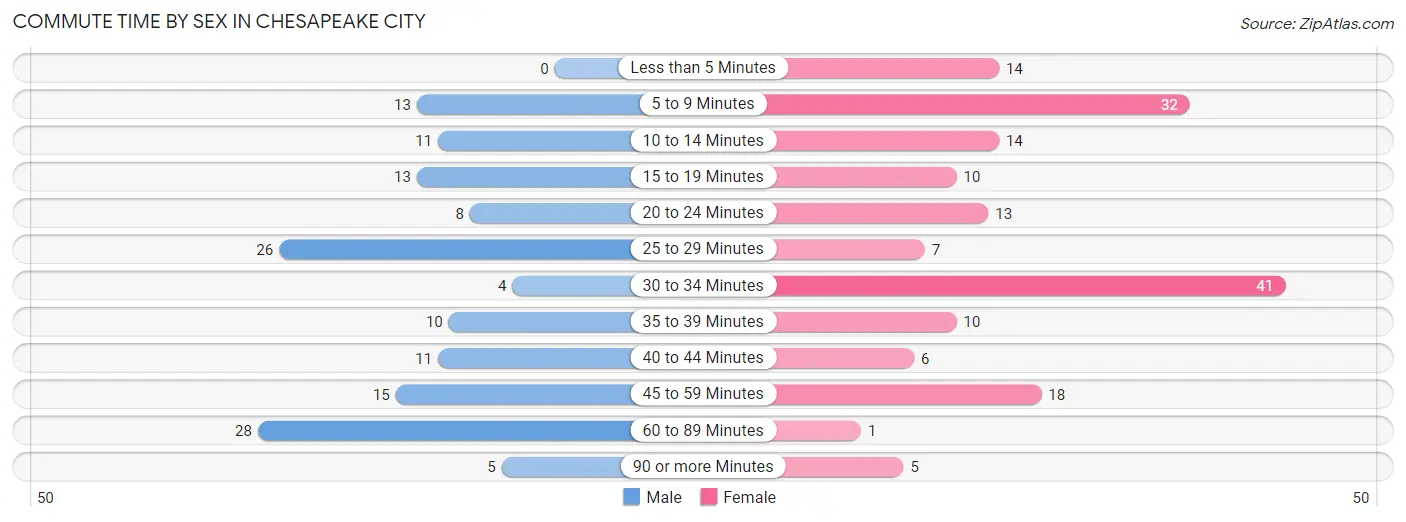
| Commute Time | Male | Female |
| Less than 5 Minutes | 0 (0.0%) | 14 (8.2%) |
| 5 to 9 Minutes | 13 (9.0%) | 32 (18.7%) |
| 10 to 14 Minutes | 11 (7.6%) | 14 (8.2%) |
| 15 to 19 Minutes | 13 (9.0%) | 10 (5.9%) |
| 20 to 24 Minutes | 8 (5.6%) | 13 (7.6%) |
| 25 to 29 Minutes | 26 (18.1%) | 7 (4.1%) |
| 30 to 34 Minutes | 4 (2.8%) | 41 (24.0%) |
| 35 to 39 Minutes | 10 (6.9%) | 10 (5.9%) |
| 40 to 44 Minutes | 11 (7.6%) | 6 (3.5%) |
| 45 to 59 Minutes | 15 (10.4%) | 18 (10.5%) |
| 60 to 89 Minutes | 28 (19.4%) | 1 (0.6%) |
| 90 or more Minutes | 5 (3.5%) | 5 (2.9%) |
Time of Departure to Work by Sex in Chesapeake City
The most frequent times of departure to work in Chesapeake City are 6:30 AM to 6:59 AM (31, 21.5%) for males and 6:30 AM to 6:59 AM (44, 25.7%) for females.
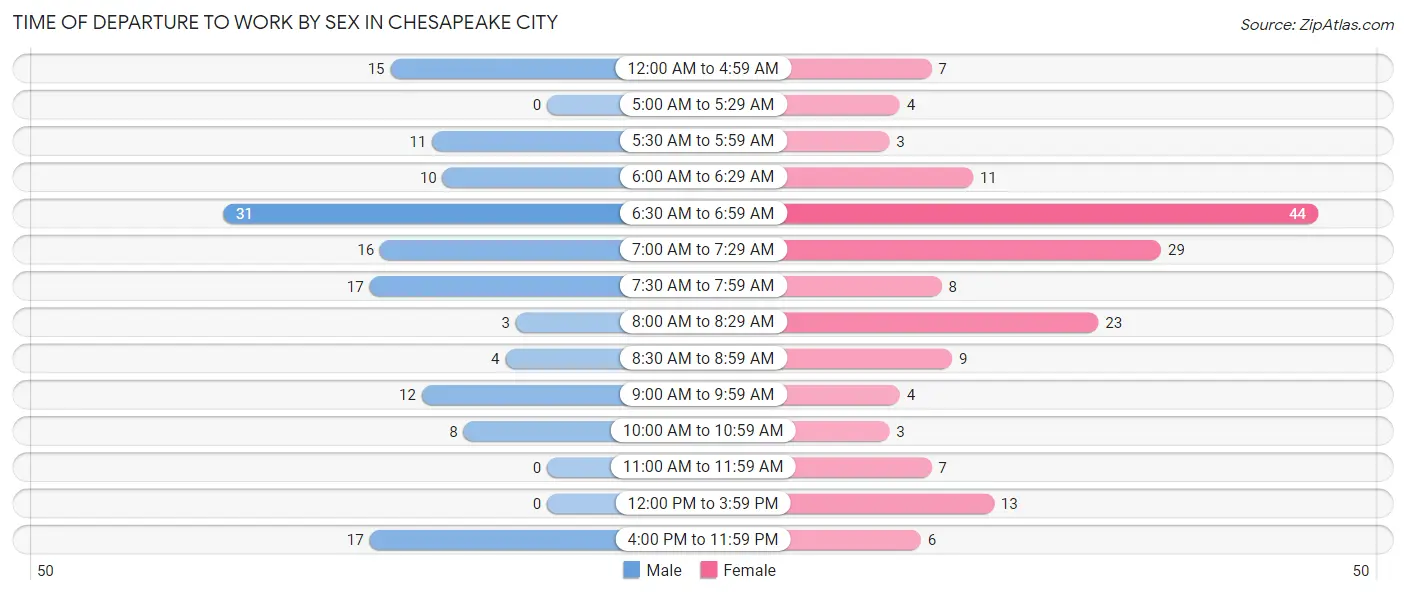
| Time of Departure | Male | Female |
| 12:00 AM to 4:59 AM | 15 (10.4%) | 7 (4.1%) |
| 5:00 AM to 5:29 AM | 0 (0.0%) | 4 (2.3%) |
| 5:30 AM to 5:59 AM | 11 (7.6%) | 3 (1.8%) |
| 6:00 AM to 6:29 AM | 10 (6.9%) | 11 (6.4%) |
| 6:30 AM to 6:59 AM | 31 (21.5%) | 44 (25.7%) |
| 7:00 AM to 7:29 AM | 16 (11.1%) | 29 (17.0%) |
| 7:30 AM to 7:59 AM | 17 (11.8%) | 8 (4.7%) |
| 8:00 AM to 8:29 AM | 3 (2.1%) | 23 (13.5%) |
| 8:30 AM to 8:59 AM | 4 (2.8%) | 9 (5.3%) |
| 9:00 AM to 9:59 AM | 12 (8.3%) | 4 (2.3%) |
| 10:00 AM to 10:59 AM | 8 (5.6%) | 3 (1.8%) |
| 11:00 AM to 11:59 AM | 0 (0.0%) | 7 (4.1%) |
| 12:00 PM to 3:59 PM | 0 (0.0%) | 13 (7.6%) |
| 4:00 PM to 11:59 PM | 17 (11.8%) | 6 (3.5%) |
| Total | 144 (100.0%) | 171 (100.0%) |
Housing Occupancy in Chesapeake City
Occupancy by Ownership in Chesapeake City
Of the total 414 dwellings in Chesapeake City, owner-occupied units account for 325 (78.5%), while renter-occupied units make up 89 (21.5%).
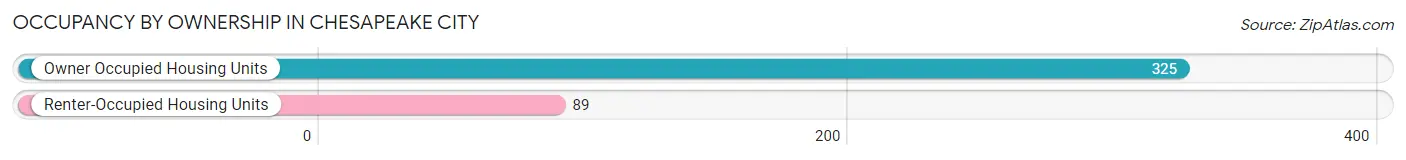
| Occupancy | # Housing Units | % Housing Units |
| Owner Occupied Housing Units | 325 | 78.5% |
| Renter-Occupied Housing Units | 89 | 21.5% |
| Total Occupied Housing Units | 414 | 100.0% |
Occupancy by Household Size in Chesapeake City
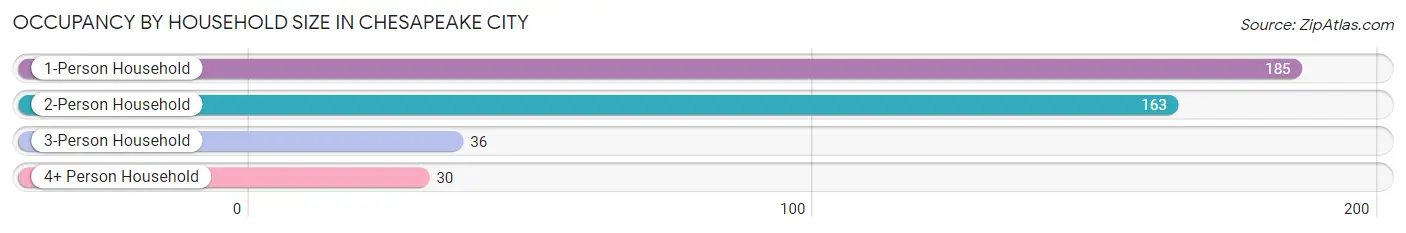
| Household Size | # Housing Units | % Housing Units |
| 1-Person Household | 185 | 44.7% |
| 2-Person Household | 163 | 39.4% |
| 3-Person Household | 36 | 8.7% |
| 4+ Person Household | 30 | 7.2% |
| Total Housing Units | 414 | 100.0% |
Occupancy by Ownership by Household Size in Chesapeake City
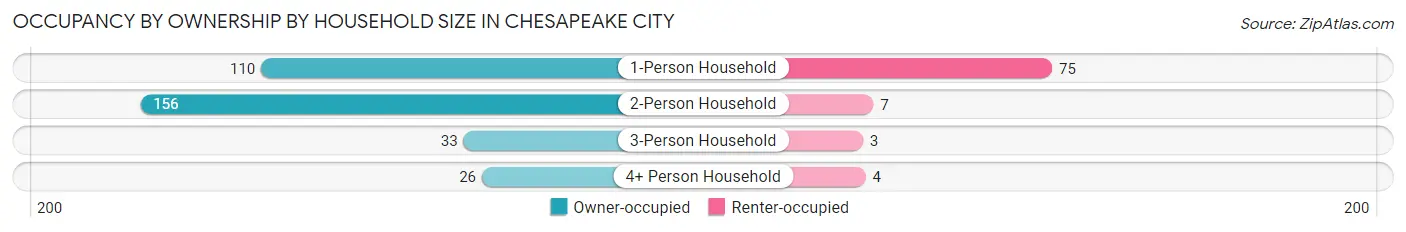
| Household Size | Owner-occupied | Renter-occupied |
| 1-Person Household | 110 (59.5%) | 75 (40.5%) |
| 2-Person Household | 156 (95.7%) | 7 (4.3%) |
| 3-Person Household | 33 (91.7%) | 3 (8.3%) |
| 4+ Person Household | 26 (86.7%) | 4 (13.3%) |
| Total Housing Units | 325 (78.5%) | 89 (21.5%) |
Occupancy by Educational Attainment in Chesapeake City
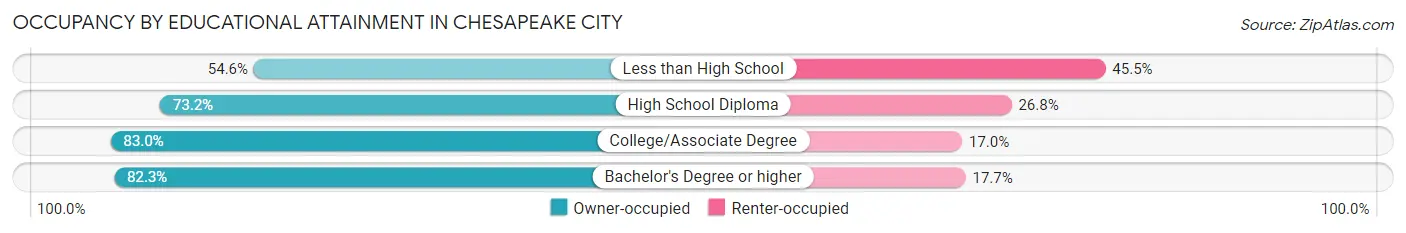
| Household Size | Owner-occupied | Renter-occupied |
| Less than High School | 18 (54.5%) | 15 (45.5%) |
| High School Diploma | 60 (73.2%) | 22 (26.8%) |
| College/Associate Degree | 117 (83.0%) | 24 (17.0%) |
| Bachelor's Degree or higher | 130 (82.3%) | 28 (17.7%) |
Occupancy by Age of Householder in Chesapeake City
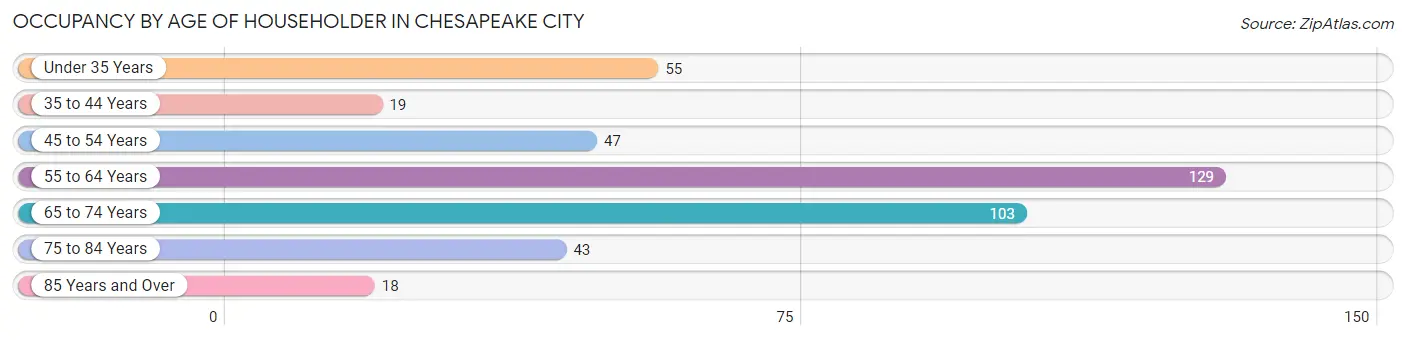
| Age Bracket | # Households | % Households |
| Under 35 Years | 55 | 13.3% |
| 35 to 44 Years | 19 | 4.6% |
| 45 to 54 Years | 47 | 11.4% |
| 55 to 64 Years | 129 | 31.2% |
| 65 to 74 Years | 103 | 24.9% |
| 75 to 84 Years | 43 | 10.4% |
| 85 Years and Over | 18 | 4.3% |
| Total | 414 | 100.0% |
Housing Finances in Chesapeake City
Median Income by Occupancy in Chesapeake City
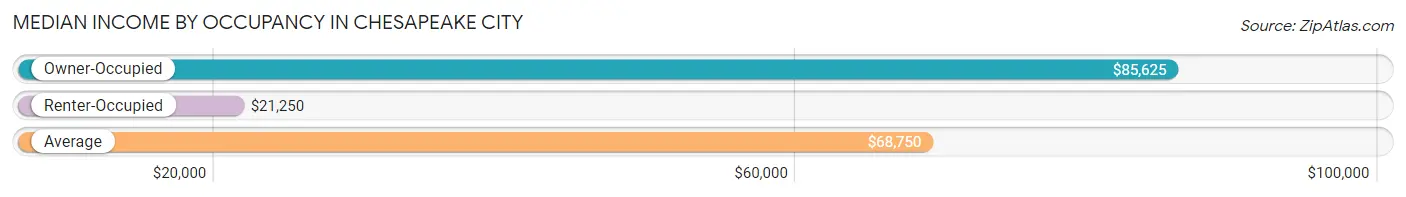
| Occupancy Type | # Households | Median Income |
| Owner-Occupied | 325 (78.5%) | $85,625 |
| Renter-Occupied | 89 (21.5%) | $21,250 |
| Average | 414 (100.0%) | $68,750 |
Occupancy by Householder Income Bracket in Chesapeake City
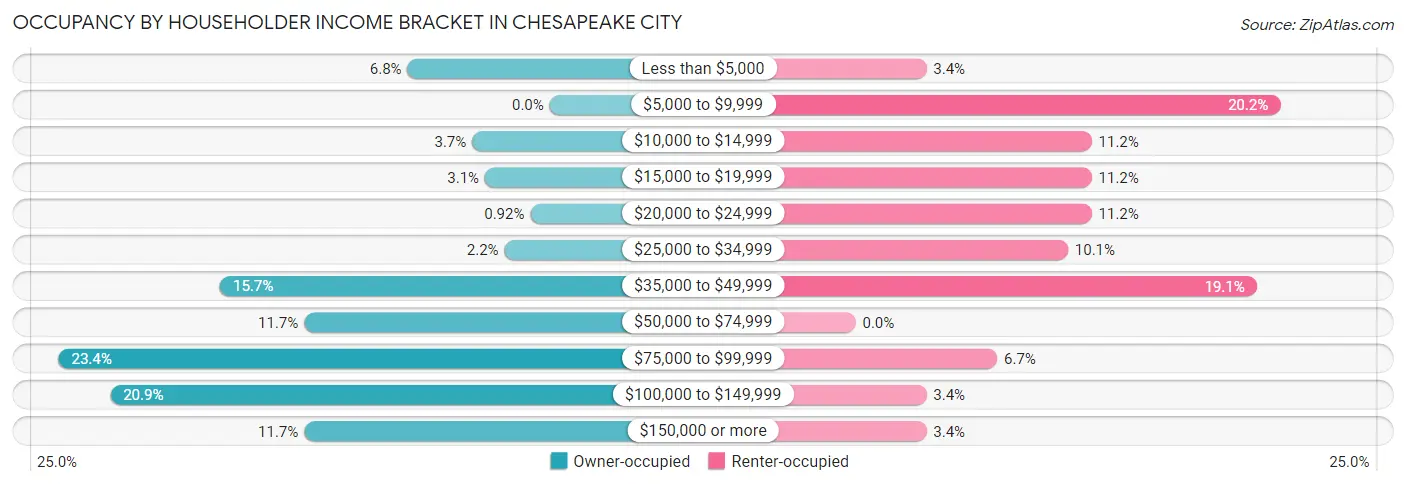
| Income Bracket | Owner-occupied | Renter-occupied |
| Less than $5,000 | 22 (6.8%) | 3 (3.4%) |
| $5,000 to $9,999 | 0 (0.0%) | 18 (20.2%) |
| $10,000 to $14,999 | 12 (3.7%) | 10 (11.2%) |
| $15,000 to $19,999 | 10 (3.1%) | 10 (11.2%) |
| $20,000 to $24,999 | 3 (0.9%) | 10 (11.2%) |
| $25,000 to $34,999 | 7 (2.1%) | 9 (10.1%) |
| $35,000 to $49,999 | 51 (15.7%) | 17 (19.1%) |
| $50,000 to $74,999 | 38 (11.7%) | 0 (0.0%) |
| $75,000 to $99,999 | 76 (23.4%) | 6 (6.7%) |
| $100,000 to $149,999 | 68 (20.9%) | 3 (3.4%) |
| $150,000 or more | 38 (11.7%) | 3 (3.4%) |
| Total | 325 (100.0%) | 89 (100.0%) |
Monthly Housing Cost Tiers in Chesapeake City
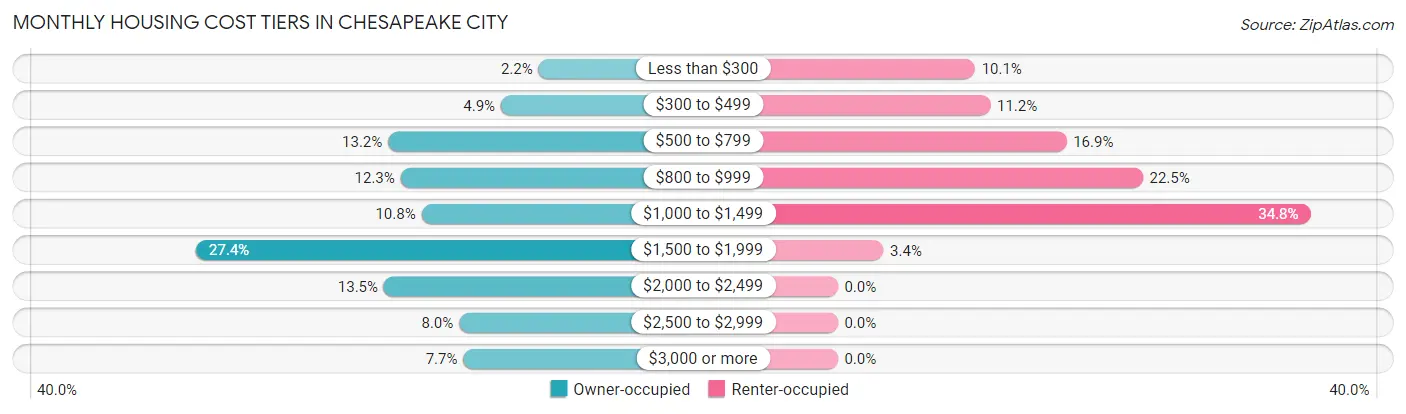
| Monthly Cost | Owner-occupied | Renter-occupied |
| Less than $300 | 7 (2.1%) | 9 (10.1%) |
| $300 to $499 | 16 (4.9%) | 10 (11.2%) |
| $500 to $799 | 43 (13.2%) | 15 (16.9%) |
| $800 to $999 | 40 (12.3%) | 20 (22.5%) |
| $1,000 to $1,499 | 35 (10.8%) | 31 (34.8%) |
| $1,500 to $1,999 | 89 (27.4%) | 3 (3.4%) |
| $2,000 to $2,499 | 44 (13.5%) | 0 (0.0%) |
| $2,500 to $2,999 | 26 (8.0%) | 0 (0.0%) |
| $3,000 or more | 25 (7.7%) | 0 (0.0%) |
| Total | 325 (100.0%) | 89 (100.0%) |
Physical Housing Characteristics in Chesapeake City
Housing Structures in Chesapeake City
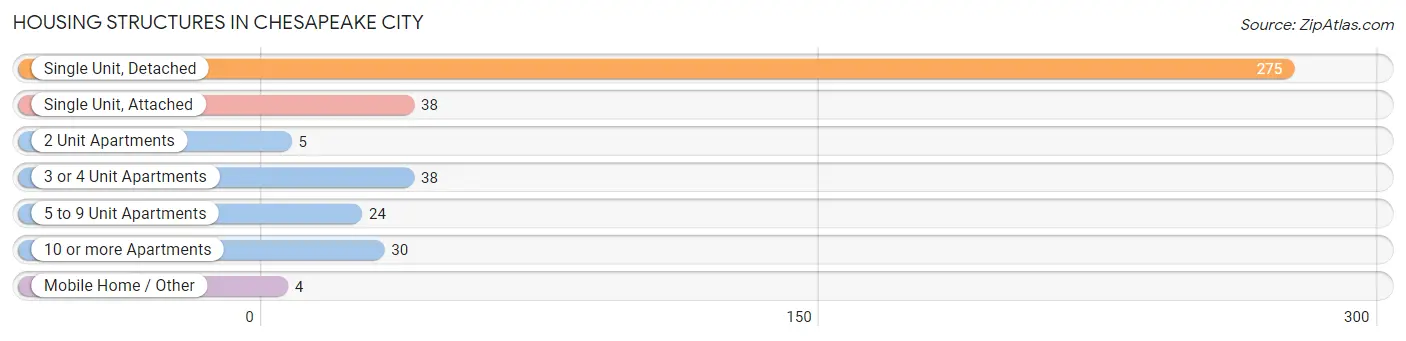
| Structure Type | # Housing Units | % Housing Units |
| Single Unit, Detached | 275 | 66.4% |
| Single Unit, Attached | 38 | 9.2% |
| 2 Unit Apartments | 5 | 1.2% |
| 3 or 4 Unit Apartments | 38 | 9.2% |
| 5 to 9 Unit Apartments | 24 | 5.8% |
| 10 or more Apartments | 30 | 7.2% |
| Mobile Home / Other | 4 | 1.0% |
| Total | 414 | 100.0% |
Housing Structures by Occupancy in Chesapeake City
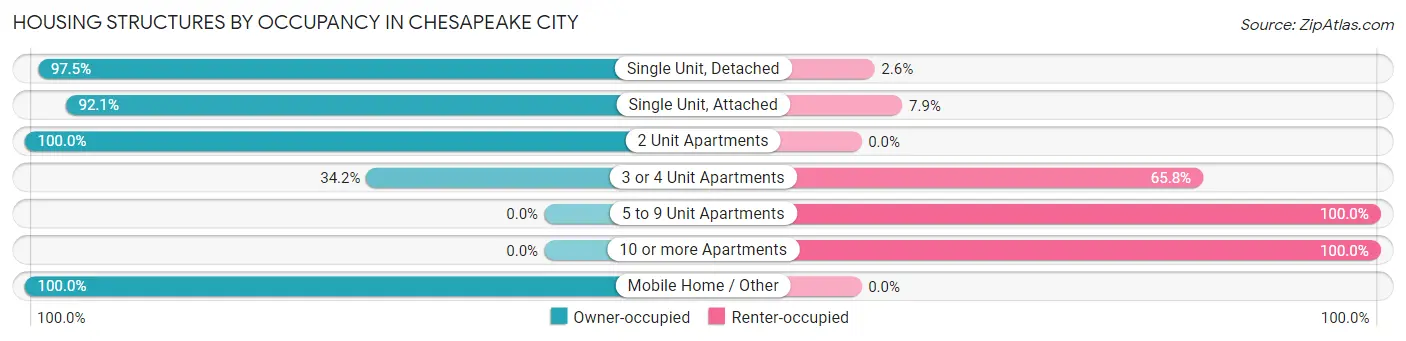
| Structure Type | Owner-occupied | Renter-occupied |
| Single Unit, Detached | 268 (97.5%) | 7 (2.5%) |
| Single Unit, Attached | 35 (92.1%) | 3 (7.9%) |
| 2 Unit Apartments | 5 (100.0%) | 0 (0.0%) |
| 3 or 4 Unit Apartments | 13 (34.2%) | 25 (65.8%) |
| 5 to 9 Unit Apartments | 0 (0.0%) | 24 (100.0%) |
| 10 or more Apartments | 0 (0.0%) | 30 (100.0%) |
| Mobile Home / Other | 4 (100.0%) | 0 (0.0%) |
| Total | 325 (78.5%) | 89 (21.5%) |
Housing Structures by Number of Rooms in Chesapeake City
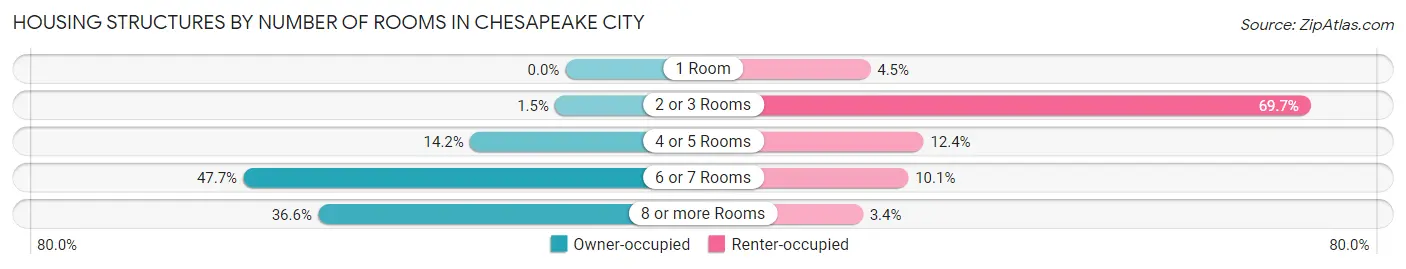
| Number of Rooms | Owner-occupied | Renter-occupied |
| 1 Room | 0 (0.0%) | 4 (4.5%) |
| 2 or 3 Rooms | 5 (1.5%) | 62 (69.7%) |
| 4 or 5 Rooms | 46 (14.1%) | 11 (12.4%) |
| 6 or 7 Rooms | 155 (47.7%) | 9 (10.1%) |
| 8 or more Rooms | 119 (36.6%) | 3 (3.4%) |
| Total | 325 (100.0%) | 89 (100.0%) |
Housing Structure by Heating Type in Chesapeake City
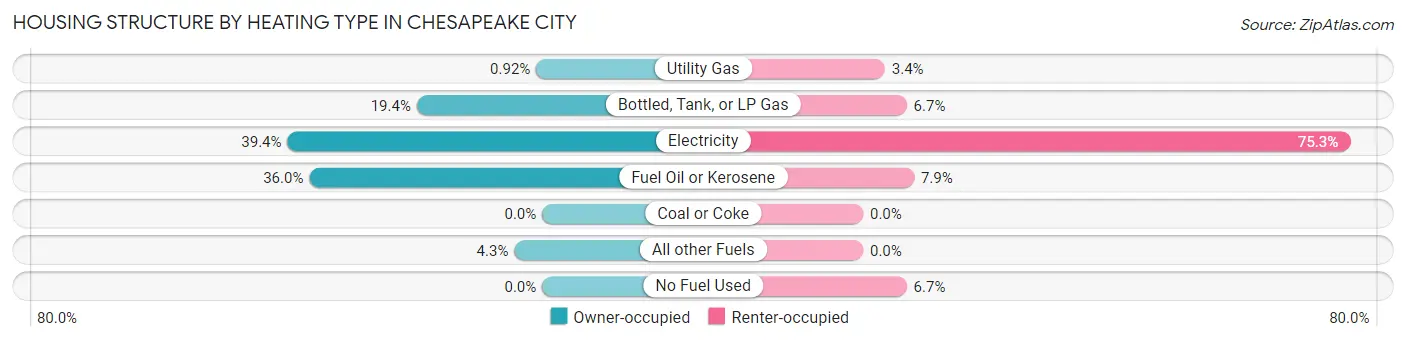
| Heating Type | Owner-occupied | Renter-occupied |
| Utility Gas | 3 (0.9%) | 3 (3.4%) |
| Bottled, Tank, or LP Gas | 63 (19.4%) | 6 (6.7%) |
| Electricity | 128 (39.4%) | 67 (75.3%) |
| Fuel Oil or Kerosene | 117 (36.0%) | 7 (7.9%) |
| Coal or Coke | 0 (0.0%) | 0 (0.0%) |
| All other Fuels | 14 (4.3%) | 0 (0.0%) |
| No Fuel Used | 0 (0.0%) | 6 (6.7%) |
| Total | 325 (100.0%) | 89 (100.0%) |
Household Vehicle Usage in Chesapeake City
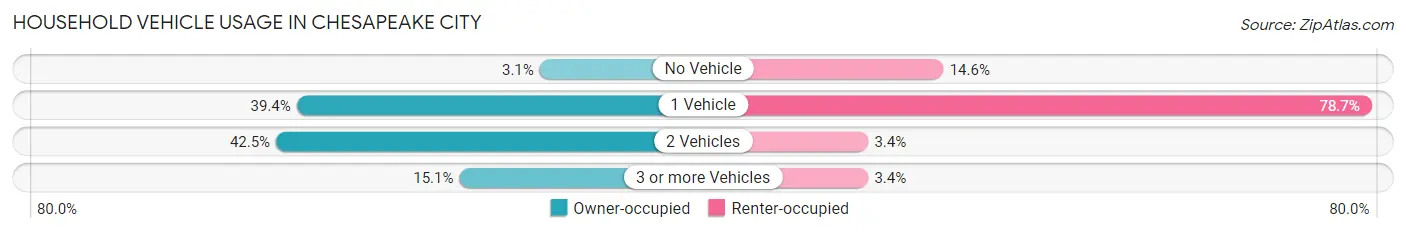
| Vehicles per Household | Owner-occupied | Renter-occupied |
| No Vehicle | 10 (3.1%) | 13 (14.6%) |
| 1 Vehicle | 128 (39.4%) | 70 (78.6%) |
| 2 Vehicles | 138 (42.5%) | 3 (3.4%) |
| 3 or more Vehicles | 49 (15.1%) | 3 (3.4%) |
| Total | 325 (100.0%) | 89 (100.0%) |
Real Estate & Mortgages in Chesapeake City
Real Estate and Mortgage Overview in Chesapeake City
| Characteristic | Without Mortgage | With Mortgage |
| Housing Units | 91 | 234 |
| Median Property Value | $296,400 | $318,000 |
| Median Household Income | $62,639 | $36 |
| Monthly Housing Costs | $725 | $25 |
| Real Estate Taxes | $3,375 | $7 |
Property Value by Mortgage Status in Chesapeake City
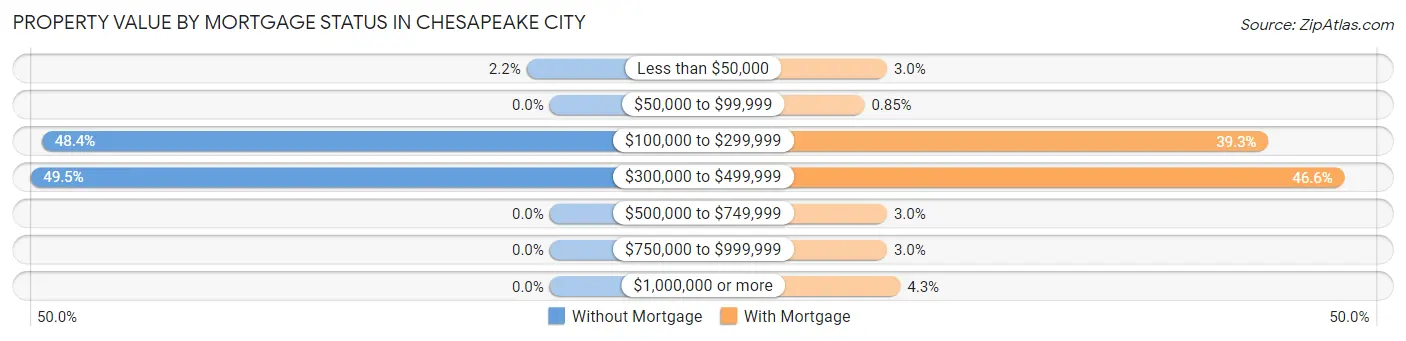
| Property Value | Without Mortgage | With Mortgage |
| Less than $50,000 | 2 (2.2%) | 7 (3.0%) |
| $50,000 to $99,999 | 0 (0.0%) | 2 (0.9%) |
| $100,000 to $299,999 | 44 (48.3%) | 92 (39.3%) |
| $300,000 to $499,999 | 45 (49.4%) | 109 (46.6%) |
| $500,000 to $749,999 | 0 (0.0%) | 7 (3.0%) |
| $750,000 to $999,999 | 0 (0.0%) | 7 (3.0%) |
| $1,000,000 or more | 0 (0.0%) | 10 (4.3%) |
| Total | 91 (100.0%) | 234 (100.0%) |
Household Income by Mortgage Status in Chesapeake City
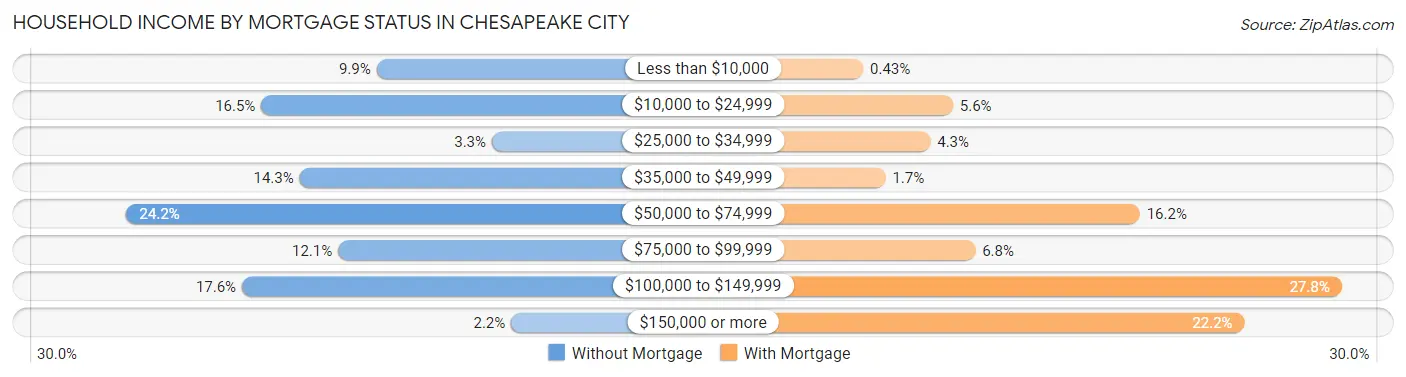
| Household Income | Without Mortgage | With Mortgage |
| Less than $10,000 | 9 (9.9%) | 1 (0.4%) |
| $10,000 to $24,999 | 15 (16.5%) | 13 (5.6%) |
| $25,000 to $34,999 | 3 (3.3%) | 10 (4.3%) |
| $35,000 to $49,999 | 13 (14.3%) | 4 (1.7%) |
| $50,000 to $74,999 | 22 (24.2%) | 38 (16.2%) |
| $75,000 to $99,999 | 11 (12.1%) | 16 (6.8%) |
| $100,000 to $149,999 | 16 (17.6%) | 65 (27.8%) |
| $150,000 or more | 2 (2.2%) | 52 (22.2%) |
| Total | 91 (100.0%) | 234 (100.0%) |
Property Value to Household Income Ratio in Chesapeake City
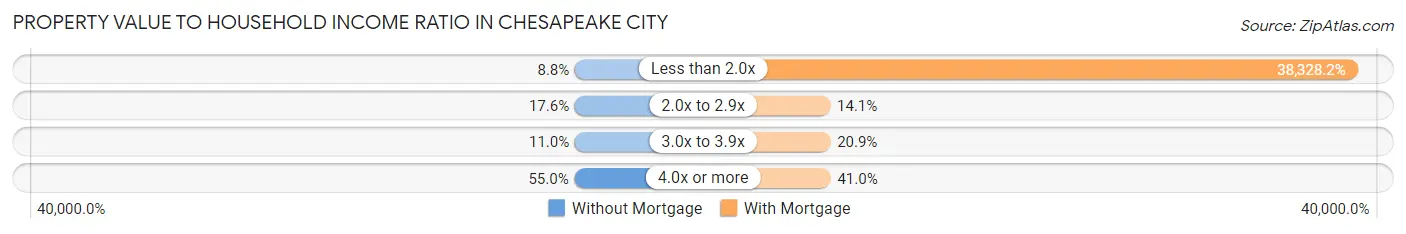
| Value-to-Income Ratio | Without Mortgage | With Mortgage |
| Less than 2.0x | 8 (8.8%) | 89,688 (38,328.2%) |
| 2.0x to 2.9x | 16 (17.6%) | 33 (14.1%) |
| 3.0x to 3.9x | 10 (11.0%) | 49 (20.9%) |
| 4.0x or more | 50 (54.9%) | 96 (41.0%) |
| Total | 91 (100.0%) | 234 (100.0%) |
Real Estate Taxes by Mortgage Status in Chesapeake City
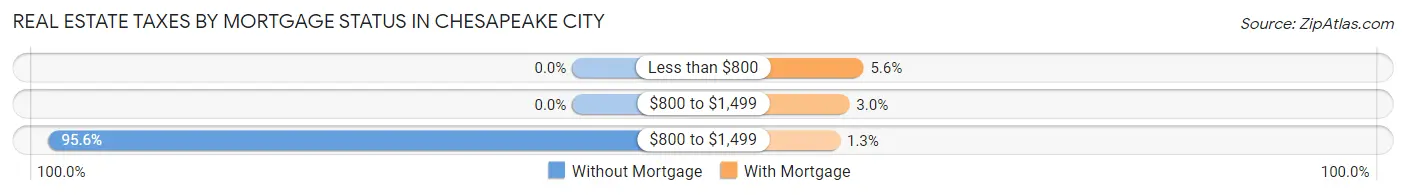
| Property Taxes | Without Mortgage | With Mortgage |
| Less than $800 | 0 (0.0%) | 13 (5.6%) |
| $800 to $1,499 | 0 (0.0%) | 7 (3.0%) |
| $800 to $1,499 | 87 (95.6%) | 3 (1.3%) |
| Total | 91 (100.0%) | 234 (100.0%) |
Health & Disability in Chesapeake City
Health Insurance Coverage by Age in Chesapeake City
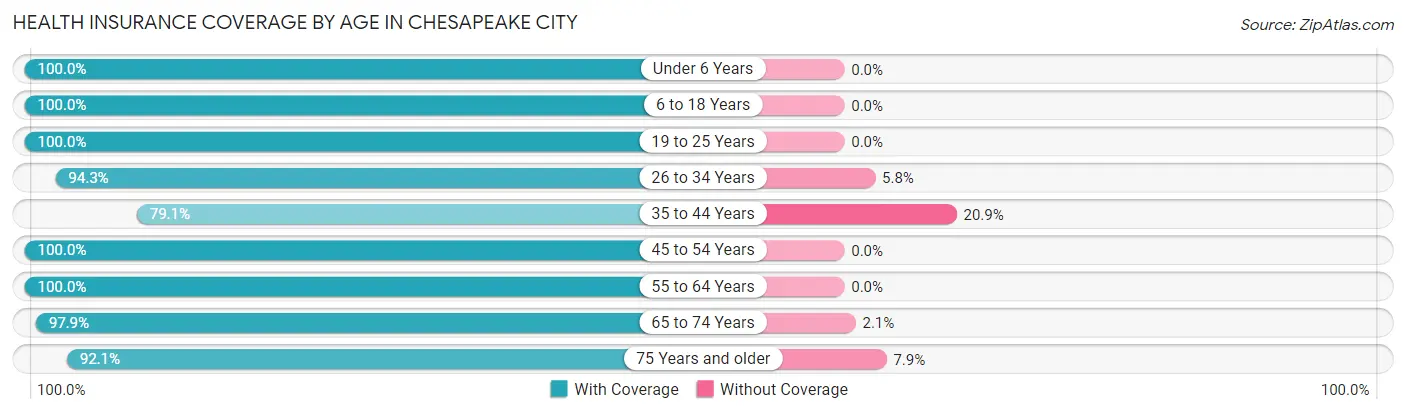
| Age Bracket | With Coverage | Without Coverage |
| Under 6 Years | 45 (100.0%) | 0 (0.0%) |
| 6 to 18 Years | 77 (100.0%) | 0 (0.0%) |
| 19 to 25 Years | 18 (100.0%) | 0 (0.0%) |
| 26 to 34 Years | 82 (94.3%) | 5 (5.8%) |
| 35 to 44 Years | 34 (79.1%) | 9 (20.9%) |
| 45 to 54 Years | 83 (100.0%) | 0 (0.0%) |
| 55 to 64 Years | 216 (100.0%) | 0 (0.0%) |
| 65 to 74 Years | 140 (97.9%) | 3 (2.1%) |
| 75 Years and older | 82 (92.1%) | 7 (7.9%) |
| Total | 777 (97.0%) | 24 (3.0%) |
Health Insurance Coverage by Citizenship Status in Chesapeake City
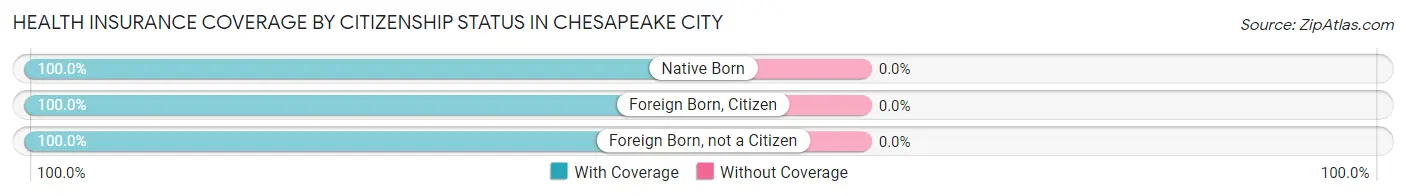
| Citizenship Status | With Coverage | Without Coverage |
| Native Born | 45 (100.0%) | 0 (0.0%) |
| Foreign Born, Citizen | 77 (100.0%) | 0 (0.0%) |
| Foreign Born, not a Citizen | 18 (100.0%) | 0 (0.0%) |
Health Insurance Coverage by Household Income in Chesapeake City
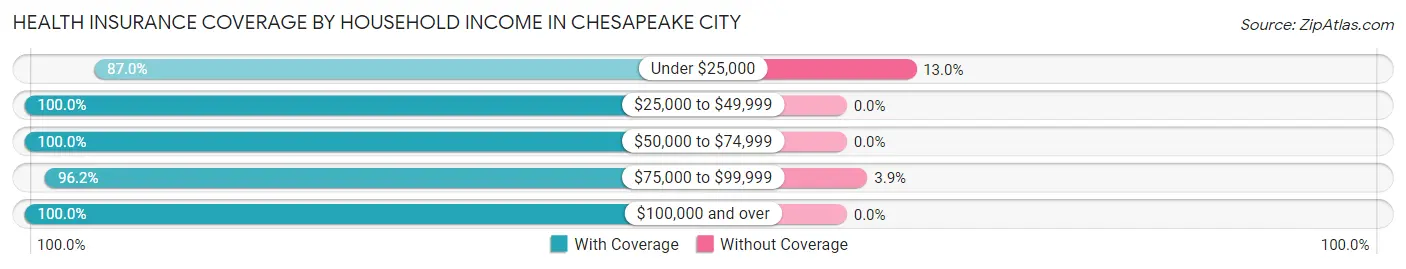
| Household Income | With Coverage | Without Coverage |
| Under $25,000 | 127 (87.0%) | 19 (13.0%) |
| $25,000 to $49,999 | 198 (100.0%) | 0 (0.0%) |
| $50,000 to $74,999 | 54 (100.0%) | 0 (0.0%) |
| $75,000 to $99,999 | 125 (96.2%) | 5 (3.8%) |
| $100,000 and over | 257 (100.0%) | 0 (0.0%) |
Public vs Private Health Insurance Coverage by Age in Chesapeake City
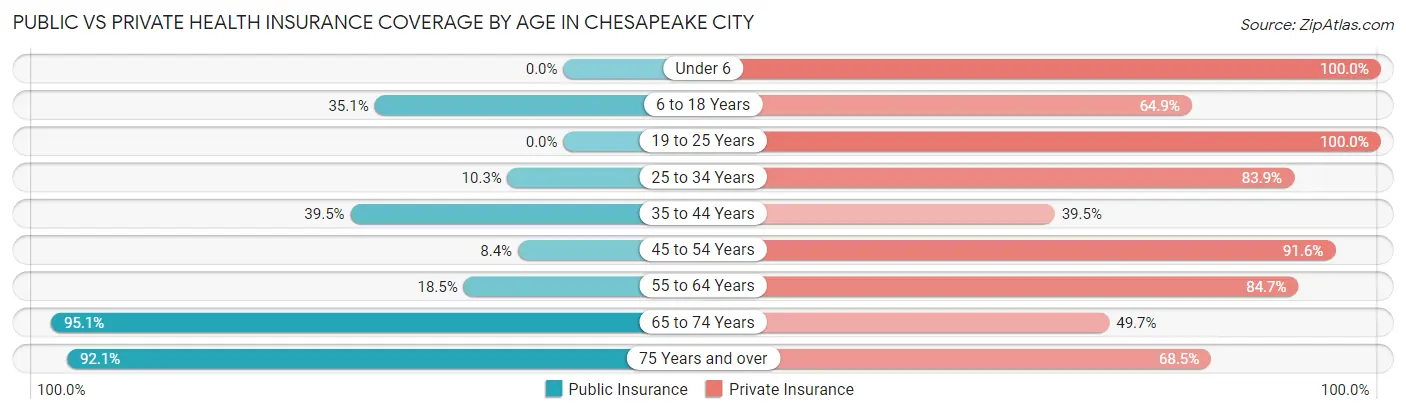
| Age Bracket | Public Insurance | Private Insurance |
| Under 6 | 0 (0.0%) | 45 (100.0%) |
| 6 to 18 Years | 27 (35.1%) | 50 (64.9%) |
| 19 to 25 Years | 0 (0.0%) | 18 (100.0%) |
| 25 to 34 Years | 9 (10.3%) | 73 (83.9%) |
| 35 to 44 Years | 17 (39.5%) | 17 (39.5%) |
| 45 to 54 Years | 7 (8.4%) | 76 (91.6%) |
| 55 to 64 Years | 40 (18.5%) | 183 (84.7%) |
| 65 to 74 Years | 136 (95.1%) | 71 (49.6%) |
| 75 Years and over | 82 (92.1%) | 61 (68.5%) |
| Total | 318 (39.7%) | 594 (74.2%) |
Disability Status by Sex by Age in Chesapeake City
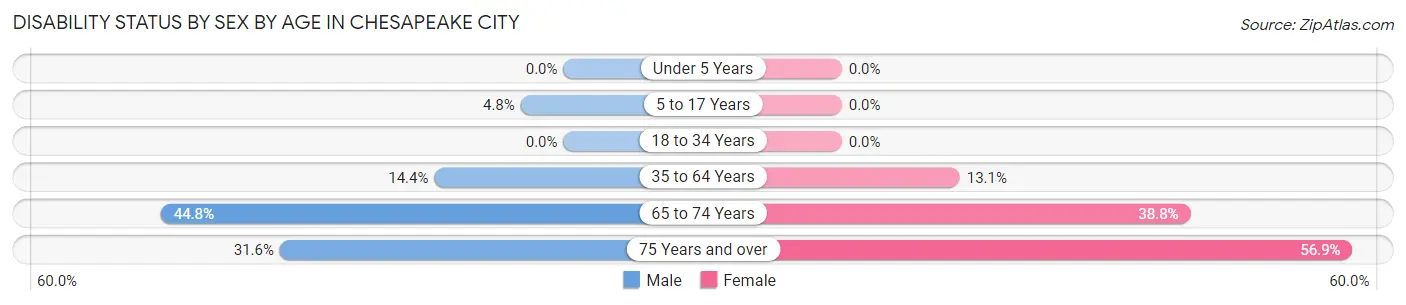
| Age Bracket | Male | Female |
| Under 5 Years | 0 (0.0%) | 0 (0.0%) |
| 5 to 17 Years | 2 (4.8%) | 0 (0.0%) |
| 18 to 34 Years | 0 (0.0%) | 0 (0.0%) |
| 35 to 64 Years | 24 (14.4%) | 23 (13.1%) |
| 65 to 74 Years | 26 (44.8%) | 33 (38.8%) |
| 75 Years and over | 12 (31.6%) | 29 (56.9%) |
Disability Class by Sex by Age in Chesapeake City
Disability Class: Hearing Difficulty
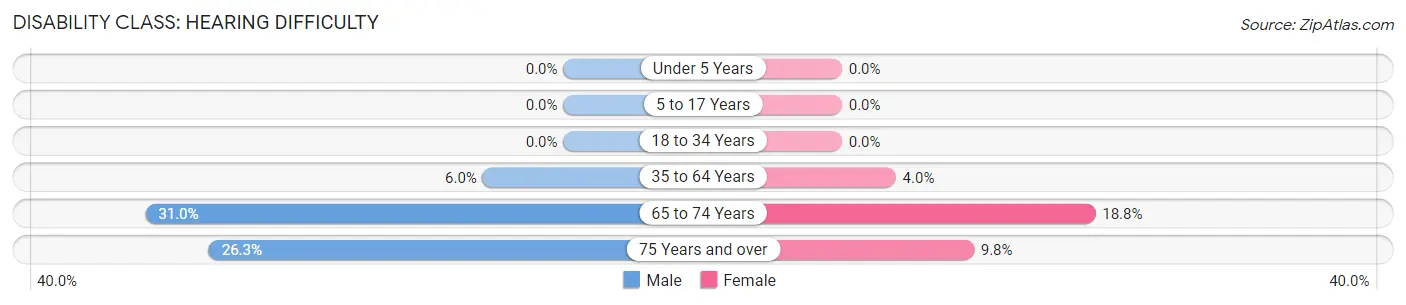
| Age Bracket | Male | Female |
| Under 5 Years | 0 (0.0%) | 0 (0.0%) |
| 5 to 17 Years | 0 (0.0%) | 0 (0.0%) |
| 18 to 34 Years | 0 (0.0%) | 0 (0.0%) |
| 35 to 64 Years | 10 (6.0%) | 7 (4.0%) |
| 65 to 74 Years | 18 (31.0%) | 16 (18.8%) |
| 75 Years and over | 10 (26.3%) | 5 (9.8%) |
Disability Class: Vision Difficulty
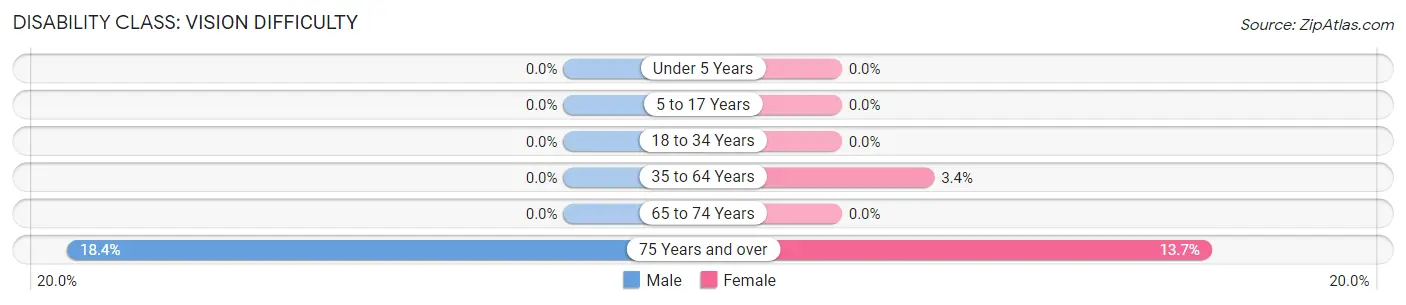
| Age Bracket | Male | Female |
| Under 5 Years | 0 (0.0%) | 0 (0.0%) |
| 5 to 17 Years | 0 (0.0%) | 0 (0.0%) |
| 18 to 34 Years | 0 (0.0%) | 0 (0.0%) |
| 35 to 64 Years | 0 (0.0%) | 6 (3.4%) |
| 65 to 74 Years | 0 (0.0%) | 0 (0.0%) |
| 75 Years and over | 7 (18.4%) | 7 (13.7%) |
Disability Class: Cognitive Difficulty
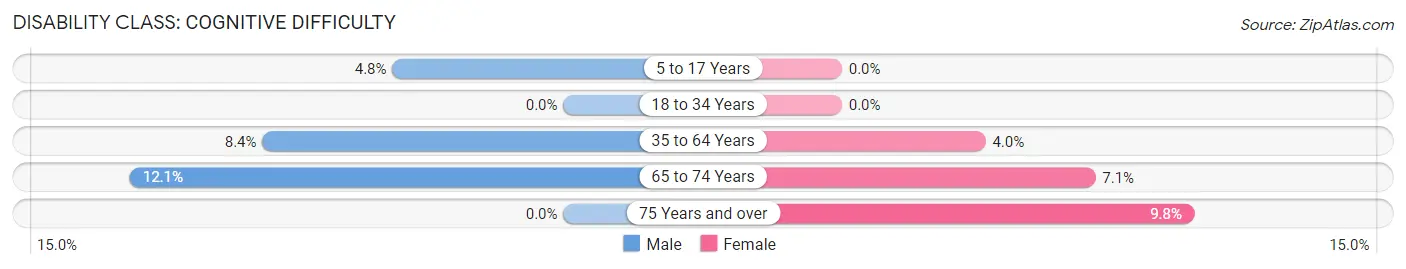
| Age Bracket | Male | Female |
| 5 to 17 Years | 2 (4.8%) | 0 (0.0%) |
| 18 to 34 Years | 0 (0.0%) | 0 (0.0%) |
| 35 to 64 Years | 14 (8.4%) | 7 (4.0%) |
| 65 to 74 Years | 7 (12.1%) | 6 (7.1%) |
| 75 Years and over | 0 (0.0%) | 5 (9.8%) |
Disability Class: Ambulatory Difficulty
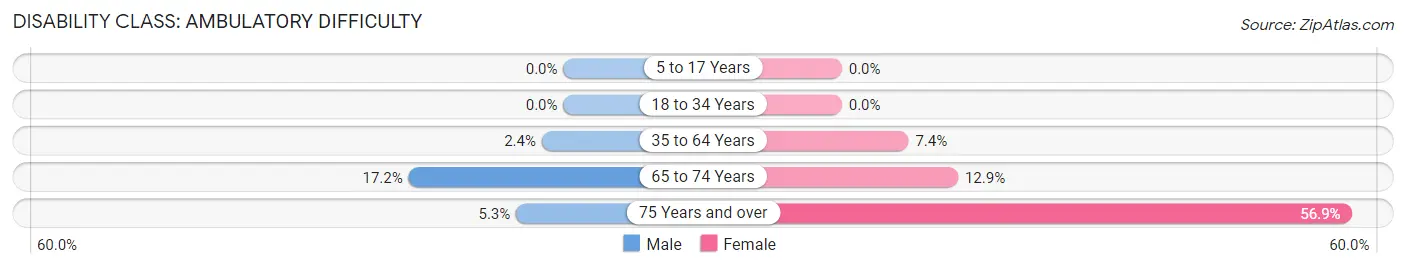
| Age Bracket | Male | Female |
| 5 to 17 Years | 0 (0.0%) | 0 (0.0%) |
| 18 to 34 Years | 0 (0.0%) | 0 (0.0%) |
| 35 to 64 Years | 4 (2.4%) | 13 (7.4%) |
| 65 to 74 Years | 10 (17.2%) | 11 (12.9%) |
| 75 Years and over | 2 (5.3%) | 29 (56.9%) |
Disability Class: Self-Care Difficulty
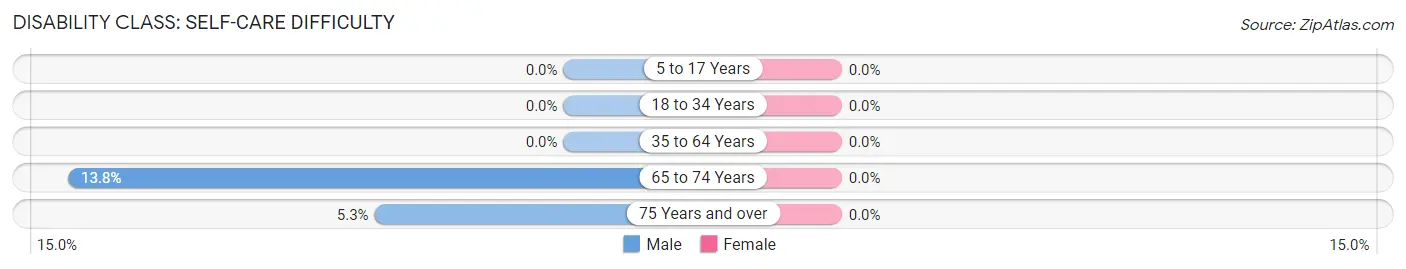
| Age Bracket | Male | Female |
| 5 to 17 Years | 0 (0.0%) | 0 (0.0%) |
| 18 to 34 Years | 0 (0.0%) | 0 (0.0%) |
| 35 to 64 Years | 0 (0.0%) | 0 (0.0%) |
| 65 to 74 Years | 8 (13.8%) | 0 (0.0%) |
| 75 Years and over | 2 (5.3%) | 0 (0.0%) |
Technology Access in Chesapeake City
Computing Device Access in Chesapeake City
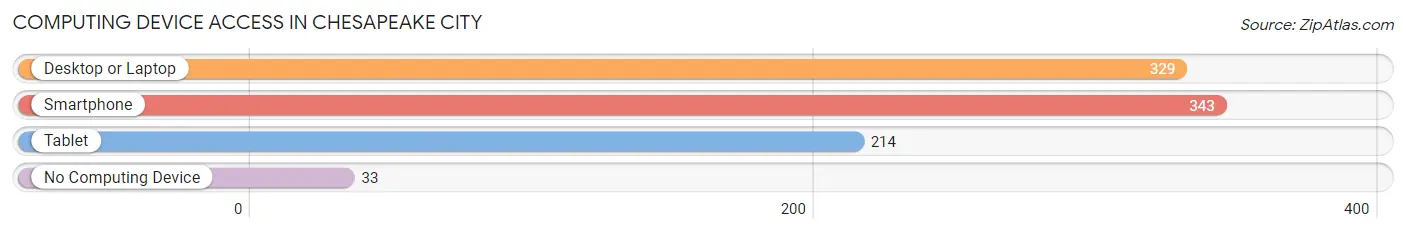
| Device Type | # Households | % Households |
| Desktop or Laptop | 329 | 79.5% |
| Smartphone | 343 | 82.9% |
| Tablet | 214 | 51.7% |
| No Computing Device | 33 | 8.0% |
| Total | 414 | 100.0% |
Internet Access in Chesapeake City
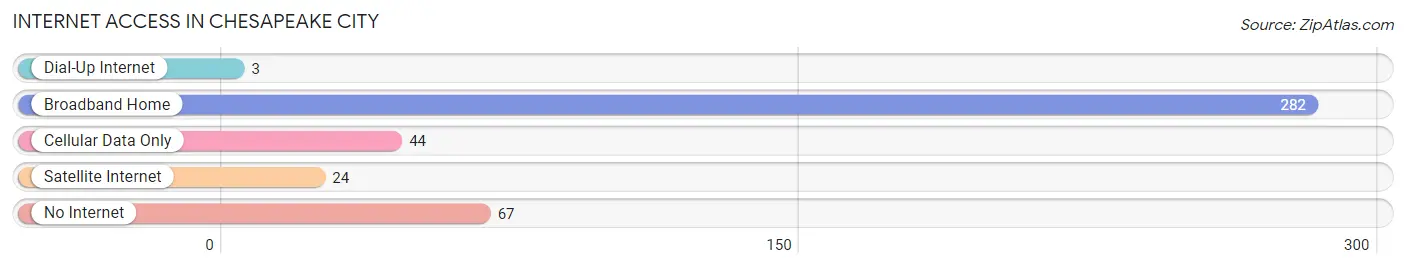
| Internet Type | # Households | % Households |
| Dial-Up Internet | 3 | 0.7% |
| Broadband Home | 282 | 68.1% |
| Cellular Data Only | 44 | 10.6% |
| Satellite Internet | 24 | 5.8% |
| No Internet | 67 | 16.2% |
| Total | 414 | 100.0% |
Chesapeake City Summary
Chesapeake City, Maryland is a small town located in Cecil County, Maryland. It is situated on the north bank of the Chesapeake and Delaware Canal, which connects the Chesapeake Bay to the Delaware River. The town has a population of 1,744 as of the 2010 census, and is part of the greater Elkton-Cecil County Metropolitan Statistical Area.
History
Chesapeake City was founded in 1839 by a group of entrepreneurs from Philadelphia, Pennsylvania. The town was originally known as “Chesapeake City” due to its location on the Chesapeake and Delaware Canal. The canal was built in 1829 to connect the Chesapeake Bay to the Delaware River, and was a major factor in the development of the town.
The town was incorporated in 1867, and the first mayor was elected in 1868. The town quickly grew in population and industry, and by the early 1900s, it was home to several factories, including a cannery, a paper mill, and a brickyard.
In the early 20th century, the town was a popular tourist destination, and many of the town’s buildings were built in the Victorian style. The town was also home to a number of popular restaurants and hotels.
In the 1950s, the town began to decline in population and industry, and many of the factories and businesses closed. In the 1970s, the town was revitalized with the construction of the Chesapeake and Delaware Canal Museum, which is now a popular tourist attraction.
Geography
Chesapeake City is located in Cecil County, Maryland, on the north bank of the Chesapeake and Delaware Canal. The town is situated on the east side of the canal, and is bordered by the towns of North East and Elkton. The town is located approximately 25 miles south of Wilmington, Delaware, and 40 miles north of Baltimore, Maryland.
The town has a total area of 0.7 square miles, all of which is land. The town is located in a humid subtropical climate zone, and experiences hot, humid summers and mild winters.
Economy
Chesapeake City’s economy is largely based on tourism and retail. The town is home to several popular restaurants and hotels, as well as a number of antique shops and art galleries. The town is also home to the Chesapeake and Delaware Canal Museum, which is a popular tourist attraction.
The town is also home to a number of small businesses, including a marina, a boat repair shop, and a boat storage facility. The town is also home to a number of small manufacturing businesses, including a cannery, a paper mill, and a brickyard.
Demographics
As of the 2010 census, the town had a population of 1,744. The racial makeup of the town was 94.3% White, 2.2% African American, 0.3% Native American, 0.7% Asian, 0.1% Pacific Islander, 0.7% from other races, and 1.7% from two or more races. Hispanic or Latino of any race were 2.2% of the population.
The median income for a household in the town was $45,938, and the median income for a family was $51,250. The per capita income for the town was $20,945. About 8.3% of families and 10.2% of the population were below the poverty line, including 14.3% of those under age 18 and 8.2% of those age 65 or over.
Common Questions
What is Per Capita Income in Chesapeake City?
Per Capita income in Chesapeake City is $46,132.
What is the Median Family Income in Chesapeake City?
Median Family Income in Chesapeake City is $81,786.
What is the Median Household income in Chesapeake City?
Median Household Income in Chesapeake City is $68,750.
What is Income or Wage Gap in Chesapeake City?
Income or Wage Gap in Chesapeake City is 43.1%.
Women in Chesapeake City earn 56.9 cents for every dollar earned by a man.
What is Inequality or Gini Index in Chesapeake City?
Inequality or Gini Index in Chesapeake City is 0.50.
What is the Total Population of Chesapeake City?
Total Population of Chesapeake City is 801.
What is the Total Male Population of Chesapeake City?
Total Male Population of Chesapeake City is 358.
What is the Total Female Population of Chesapeake City?
Total Female Population of Chesapeake City is 443.
What is the Ratio of Males per 100 Females in Chesapeake City?
There are 80.81 Males per 100 Females in Chesapeake City.
What is the Ratio of Females per 100 Males in Chesapeake City?
There are 123.74 Females per 100 Males in Chesapeake City.
What is the Median Population Age in Chesapeake City?
Median Population Age in Chesapeake City is 56.9 Years.
What is the Average Family Size in Chesapeake City
Average Family Size in Chesapeake City is 2.6 People.
What is the Average Household Size in Chesapeake City
Average Household Size in Chesapeake City is 1.9 People.
How Large is the Labor Force in Chesapeake City?
There are 406 People in the Labor Forcein in Chesapeake City.
What is the Percentage of People in the Labor Force in Chesapeake City?
58.9% of People are in the Labor Force in Chesapeake City.
What is the Unemployment Rate in Chesapeake City?
Unemployment Rate in Chesapeake City is 4.4%.