Williamsport, MD Map & Demographics
Williamsport Map
Williamsport Overview
$33,899
PER CAPITA INCOME
$68,777
AVG FAMILY INCOME
$58,819
AVG HOUSEHOLD INCOME
2.4%
WAGE / INCOME GAP [ % ]
97.6¢/ $1
WAGE / INCOME GAP [ $ ]
0.46
INEQUALITY / GINI INDEX
1,915
TOTAL POPULATION
925
MALE POPULATION
990
FEMALE POPULATION
93.43
MALES / 100 FEMALES
107.03
FEMALES / 100 MALES
40.0
MEDIAN AGE
2.6
AVG FAMILY SIZE
2.1
AVG HOUSEHOLD SIZE
922
LABOR FORCE [ PEOPLE ]
58.6%
PERCENT IN LABOR FORCE
4.1%
UNEMPLOYMENT RATE
Williamsport Zip Codes
Income in Williamsport
Income Overview in Williamsport
Per Capita Income in Williamsport is $33,899, while median incomes of families and households are $68,777 and $58,819 respectively.
| Characteristic | Number | Measure |
| Per Capita Income | 1,915 | $33,899 |
| Median Family Income | 458 | $68,777 |
| Mean Family Income | 458 | $85,071 |
| Median Household Income | 865 | $58,819 |
| Mean Household Income | 865 | $70,818 |
| Income Deficit | 458 | $0 |
| Wage / Income Gap (%) | 1,915 | 2.45% |
| Wage / Income Gap ($) | 1,915 | 97.55¢ per $1 |
| Gini / Inequality Index | 1,915 | 0.46 |
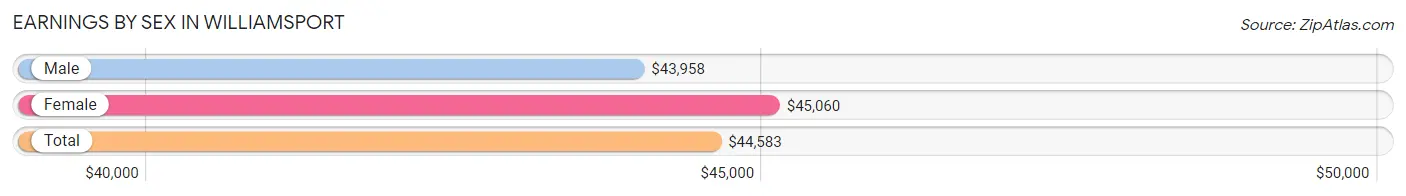
Earnings by Sex in Williamsport
Average Earnings in Williamsport are $44,583, $43,958 for men and $45,060 for women, a difference of 2.5%.
| Sex | Number | Average Earnings |
| Male | 537 (55.1%) | $43,958 |
| Female | 437 (44.9%) | $45,060 |
| Total | 974 (100.0%) | $44,583 |
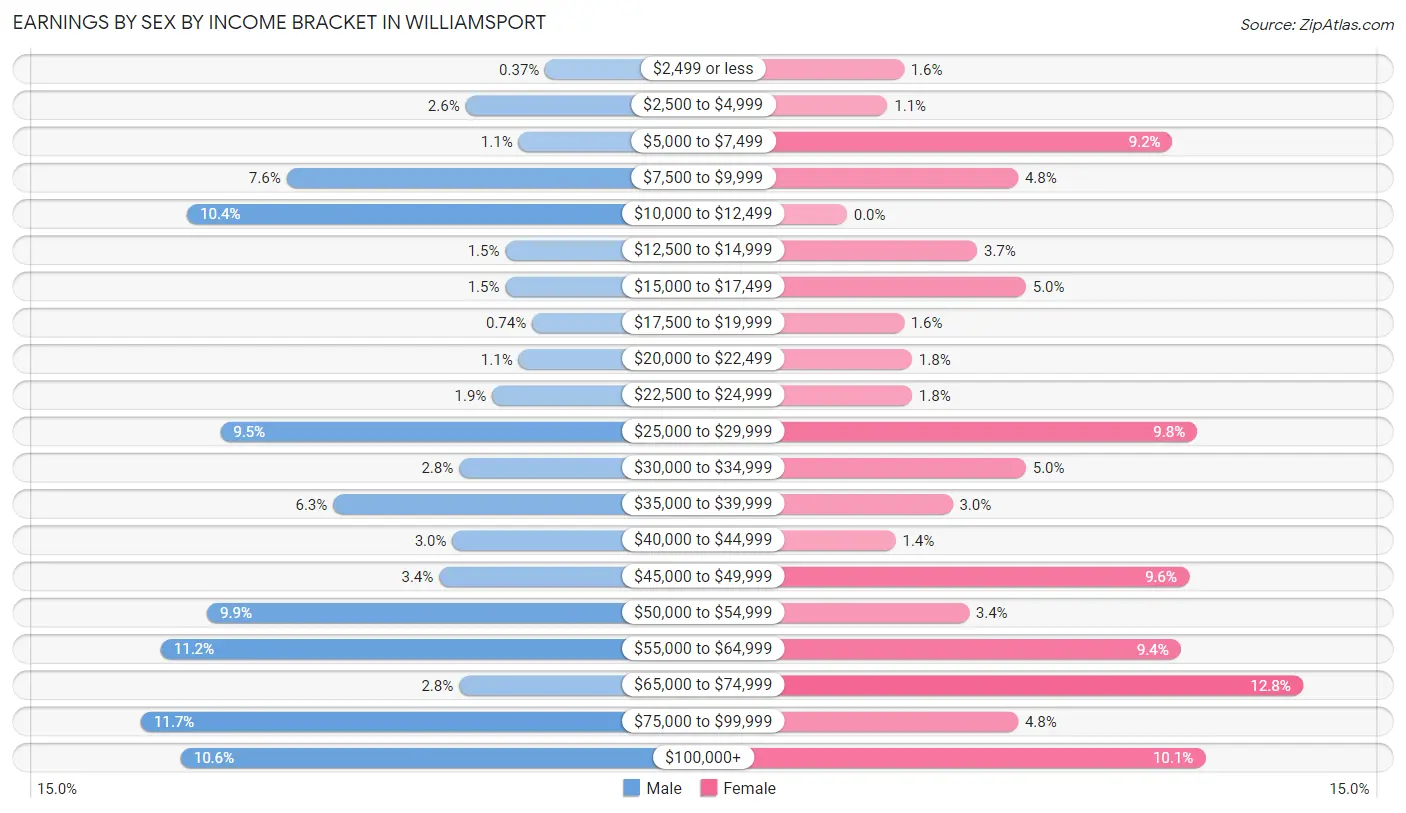
Earnings by Sex by Income Bracket in Williamsport
The most common earnings brackets in Williamsport are $75,000 to $99,999 for men (63 | 11.7%) and $65,000 to $74,999 for women (56 | 12.8%).
| Income | Male | Female |
| $2,499 or less | 2 (0.4%) | 7 (1.6%) |
| $2,500 to $4,999 | 14 (2.6%) | 5 (1.1%) |
| $5,000 to $7,499 | 6 (1.1%) | 40 (9.1%) |
| $7,500 to $9,999 | 41 (7.6%) | 21 (4.8%) |
| $10,000 to $12,499 | 56 (10.4%) | 0 (0.0%) |
| $12,500 to $14,999 | 8 (1.5%) | 16 (3.7%) |
| $15,000 to $17,499 | 8 (1.5%) | 22 (5.0%) |
| $17,500 to $19,999 | 4 (0.7%) | 7 (1.6%) |
| $20,000 to $22,499 | 6 (1.1%) | 8 (1.8%) |
| $22,500 to $24,999 | 10 (1.9%) | 8 (1.8%) |
| $25,000 to $29,999 | 51 (9.5%) | 43 (9.8%) |
| $30,000 to $34,999 | 15 (2.8%) | 22 (5.0%) |
| $35,000 to $39,999 | 34 (6.3%) | 13 (3.0%) |
| $40,000 to $44,999 | 16 (3.0%) | 6 (1.4%) |
| $45,000 to $49,999 | 18 (3.4%) | 42 (9.6%) |
| $50,000 to $54,999 | 53 (9.9%) | 15 (3.4%) |
| $55,000 to $64,999 | 60 (11.2%) | 41 (9.4%) |
| $65,000 to $74,999 | 15 (2.8%) | 56 (12.8%) |
| $75,000 to $99,999 | 63 (11.7%) | 21 (4.8%) |
| $100,000+ | 57 (10.6%) | 44 (10.1%) |
| Total | 537 (100.0%) | 437 (100.0%) |
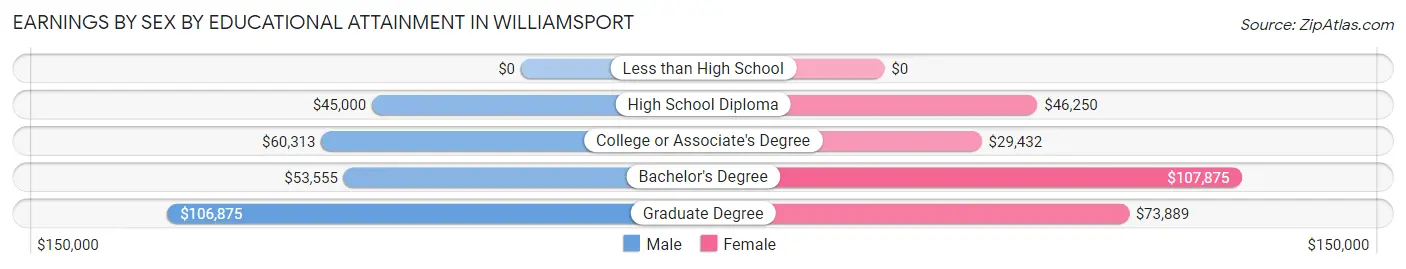
Earnings by Sex by Educational Attainment in Williamsport
Average earnings in Williamsport are $54,481 for men and $46,310 for women, a difference of 15.0%. Men with an educational attainment of graduate degree enjoy the highest average annual earnings of $106,875, while those with high school diploma education earn the least with $45,000. Women with an educational attainment of bachelor's degree earn the most with the average annual earnings of $107,875, while those with college or associate's degree education have the smallest earnings of $29,432.
| Educational Attainment | Male Income | Female Income |
| Less than High School | - | - |
| High School Diploma | $45,000 | $46,250 |
| College or Associate's Degree | $60,313 | $29,432 |
| Bachelor's Degree | $53,555 | $107,875 |
| Graduate Degree | $106,875 | $73,889 |
| Total | $54,481 | $46,310 |
Family Income in Williamsport
Family Income Brackets in Williamsport
According to the Williamsport family income data, there are 107 families falling into the $50,000 to $74,999 income range, which is the most common income bracket and makes up 23.4% of all families. Conversely, the $150,000 to $199,999 income bracket is the least frequent group with only 20 families (4.4%) belonging to this category.
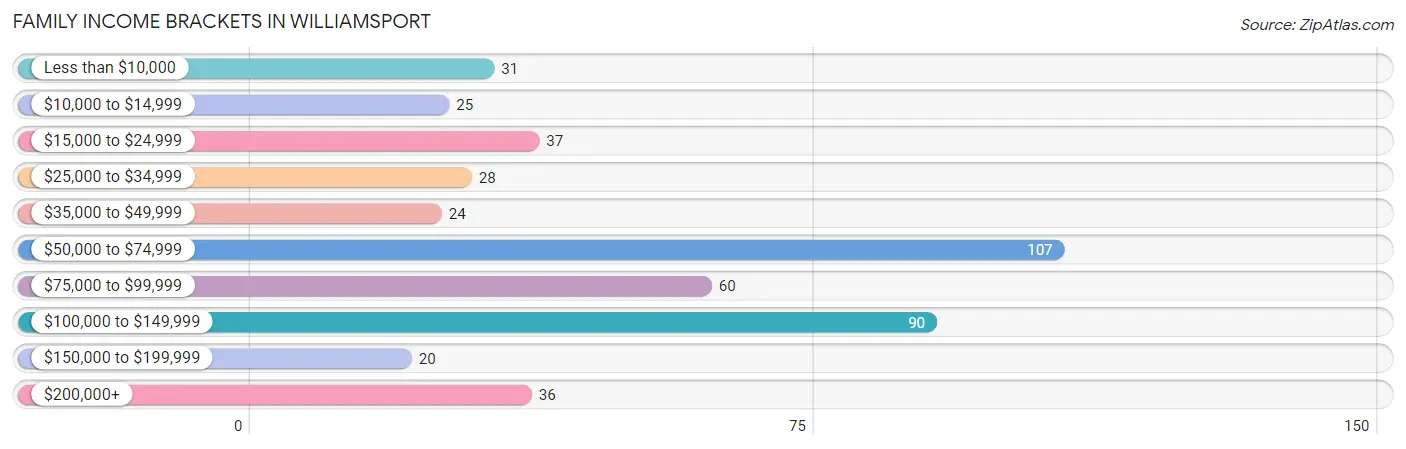
| Income Bracket | # Families | % Families |
| Less than $10,000 | 31 | 6.8% |
| $10,000 to $14,999 | 25 | 5.5% |
| $15,000 to $24,999 | 37 | 8.1% |
| $25,000 to $34,999 | 28 | 6.1% |
| $35,000 to $49,999 | 24 | 5.2% |
| $50,000 to $74,999 | 107 | 23.4% |
| $75,000 to $99,999 | 60 | 13.1% |
| $100,000 to $149,999 | 90 | 19.7% |
| $150,000 to $199,999 | 20 | 4.4% |
| $200,000+ | 36 | 7.9% |
Family Income by Famaliy Size in Williamsport
3-person families (151 | 33.0%) account for the highest median family income in Williamsport with $81,534 per family, while 2-person families (260 | 56.8%) have the highest median income of $34,176 per family member.
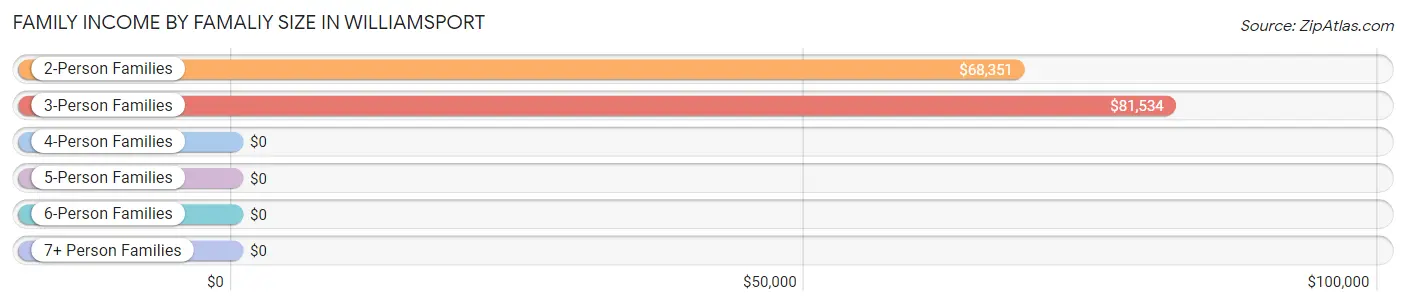
| Income Bracket | # Families | Median Income |
| 2-Person Families | 260 (56.8%) | $68,351 |
| 3-Person Families | 151 (33.0%) | $81,534 |
| 4-Person Families | 34 (7.4%) | $0 |
| 5-Person Families | 11 (2.4%) | $0 |
| 6-Person Families | 2 (0.4%) | $0 |
| 7+ Person Families | 0 (0.0%) | $0 |
| Total | 458 (100.0%) | $68,777 |
Family Income by Number of Earners in Williamsport
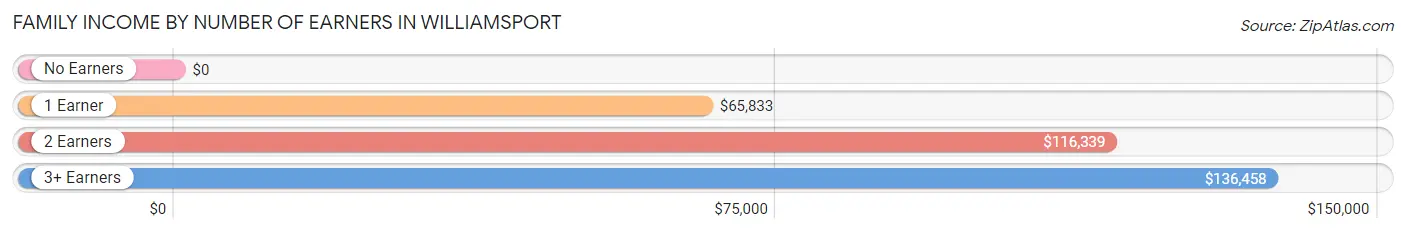
| Number of Earners | # Families | Median Income |
| No Earners | 90 (19.7%) | $0 |
| 1 Earner | 224 (48.9%) | $65,833 |
| 2 Earners | 127 (27.7%) | $116,339 |
| 3+ Earners | 17 (3.7%) | $136,458 |
| Total | 458 (100.0%) | $68,777 |
Household Income in Williamsport
Household Income Brackets in Williamsport
With 156 households falling in the category, the $50,000 to $74,999 income range is the most frequent in Williamsport, accounting for 18.0% of all households. In contrast, only 31 households (3.6%) fall into the $150,000 to $199,999 income bracket, making it the least populous group.
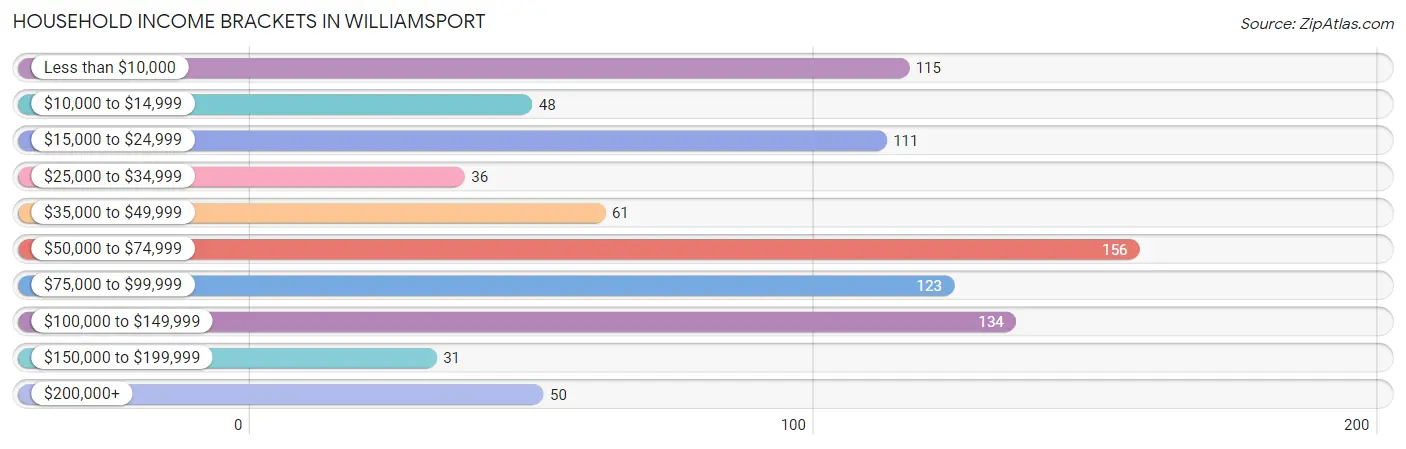
| Income Bracket | # Households | % Households |
| Less than $10,000 | 115 | 13.3% |
| $10,000 to $14,999 | 48 | 5.5% |
| $15,000 to $24,999 | 111 | 12.8% |
| $25,000 to $34,999 | 36 | 4.2% |
| $35,000 to $49,999 | 61 | 7.1% |
| $50,000 to $74,999 | 156 | 18.0% |
| $75,000 to $99,999 | 123 | 14.2% |
| $100,000 to $149,999 | 134 | 15.5% |
| $150,000 to $199,999 | 31 | 3.6% |
| $200,000+ | 50 | 5.8% |
Household Income by Householder Age in Williamsport
The median household income in Williamsport is $58,819, with the highest median household income of $82,530 found in the 25 to 44 years age bracket for the primary householder. A total of 337 households (39.0%) fall into this category. Meanwhile, the 15 to 24 years age bracket for the primary householder has the lowest median household income of $0, with 61 households (7.0%) in this group.
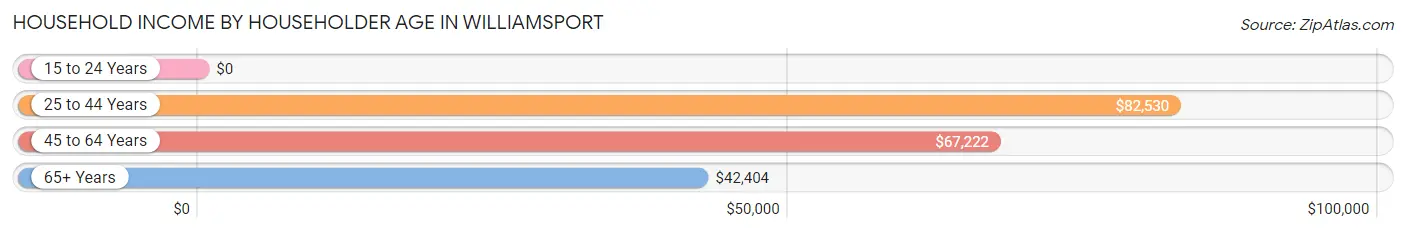
| Income Bracket | # Households | Median Income |
| 15 to 24 Years | 61 (7.0%) | $0 |
| 25 to 44 Years | 337 (39.0%) | $82,530 |
| 45 to 64 Years | 270 (31.2%) | $67,222 |
| 65+ Years | 197 (22.8%) | $42,404 |
| Total | 865 (100.0%) | $58,819 |
Poverty in Williamsport
Income Below Poverty by Sex and Age in Williamsport
With 21.1% poverty level for males and 22.0% for females among the residents of Williamsport, under 5 year old males and 25 to 34 year old females are the most vulnerable to poverty, with 28 males (100.0%) and 42 females (54.5%) in their respective age groups living below the poverty level.
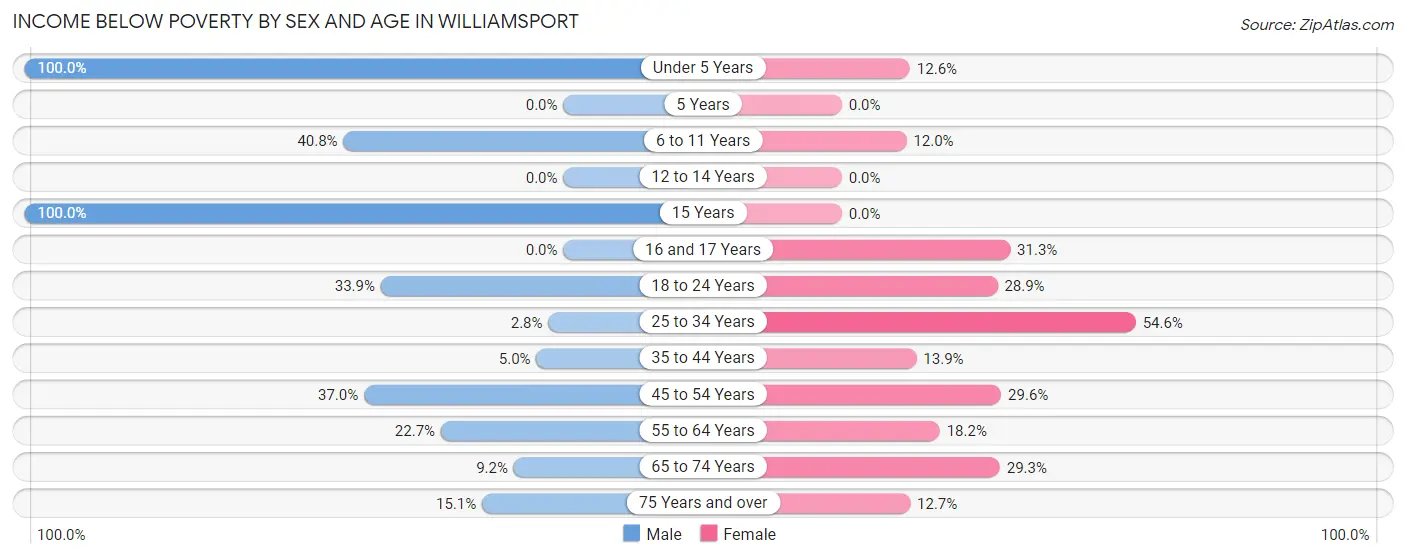
| Age Bracket | Male | Female |
| Under 5 Years | 28 (100.0%) | 11 (12.6%) |
| 5 Years | 0 (0.0%) | 0 (0.0%) |
| 6 to 11 Years | 20 (40.8%) | 6 (12.0%) |
| 12 to 14 Years | 0 (0.0%) | 0 (0.0%) |
| 15 Years | 21 (100.0%) | 0 (0.0%) |
| 16 and 17 Years | 0 (0.0%) | 5 (31.2%) |
| 18 to 24 Years | 41 (33.9%) | 13 (28.9%) |
| 25 to 34 Years | 5 (2.8%) | 42 (54.5%) |
| 35 to 44 Years | 5 (5.0%) | 27 (13.9%) |
| 45 to 54 Years | 27 (37.0%) | 42 (29.6%) |
| 55 to 64 Years | 20 (22.7%) | 20 (18.2%) |
| 65 to 74 Years | 8 (9.2%) | 22 (29.3%) |
| 75 Years and over | 8 (15.1%) | 9 (12.7%) |
| Total | 183 (21.1%) | 197 (22.0%) |
Income Above Poverty by Sex and Age in Williamsport
According to the poverty statistics in Williamsport, males aged 12 to 14 years and females aged 12 to 14 years are the age groups that are most secure financially, with 100.0% of males and 100.0% of females in these age groups living above the poverty line.
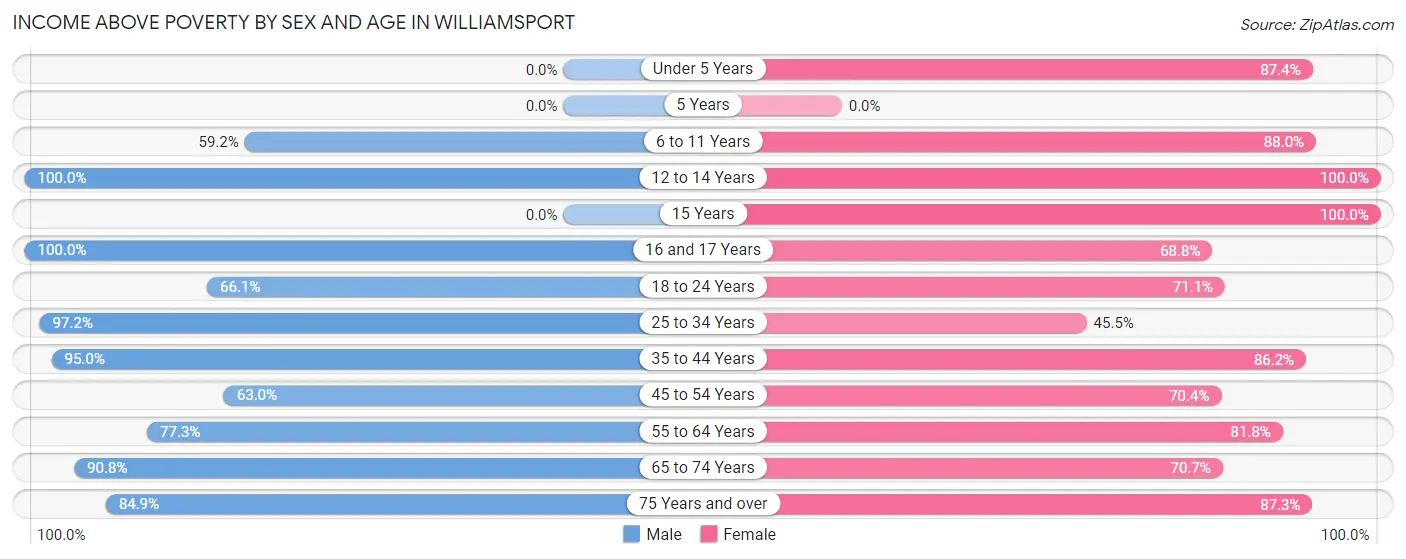
| Age Bracket | Male | Female |
| Under 5 Years | 0 (0.0%) | 76 (87.4%) |
| 5 Years | 0 (0.0%) | 0 (0.0%) |
| 6 to 11 Years | 29 (59.2%) | 44 (88.0%) |
| 12 to 14 Years | 32 (100.0%) | 20 (100.0%) |
| 15 Years | 0 (0.0%) | 6 (100.0%) |
| 16 and 17 Years | 35 (100.0%) | 11 (68.8%) |
| 18 to 24 Years | 80 (66.1%) | 32 (71.1%) |
| 25 to 34 Years | 175 (97.2%) | 35 (45.5%) |
| 35 to 44 Years | 95 (95.0%) | 168 (86.2%) |
| 45 to 54 Years | 46 (63.0%) | 100 (70.4%) |
| 55 to 64 Years | 68 (77.3%) | 90 (81.8%) |
| 65 to 74 Years | 79 (90.8%) | 53 (70.7%) |
| 75 Years and over | 45 (84.9%) | 62 (87.3%) |
| Total | 684 (78.9%) | 697 (78.0%) |
Income Below Poverty Among Married-Couple Families in Williamsport
The poverty statistics for married-couple families in Williamsport show that 17.6% or 37 of the total 210 families live below the poverty line. Families with 3 or 4 children have the highest poverty rate of 45.5%, comprising of 5 families. On the other hand, families with no children have the lowest poverty rate of 8.2%, which includes 11 families.
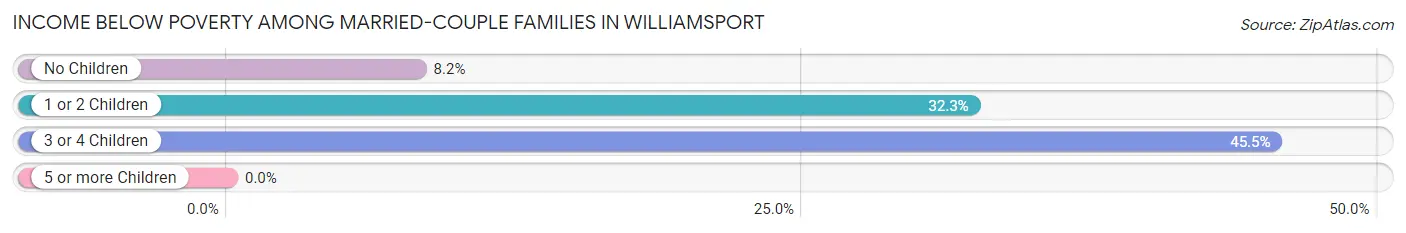
| Children | Above Poverty | Below Poverty |
| No Children | 123 (91.8%) | 11 (8.2%) |
| 1 or 2 Children | 44 (67.7%) | 21 (32.3%) |
| 3 or 4 Children | 6 (54.5%) | 5 (45.5%) |
| 5 or more Children | 0 (0.0%) | 0 (0.0%) |
| Total | 173 (82.4%) | 37 (17.6%) |
Income Below Poverty Among Single-Parent Households in Williamsport
According to the poverty data in Williamsport, 11.0% or 11 single-father households and 20.9% or 31 single-mother households are living below the poverty line. Among single-father households, those with no children have the highest poverty rate, with 5 households (16.7%) experiencing poverty. Likewise, among single-mother households, those with 1 or 2 children have the highest poverty rate, with 27 households (23.9%) falling below the poverty line.
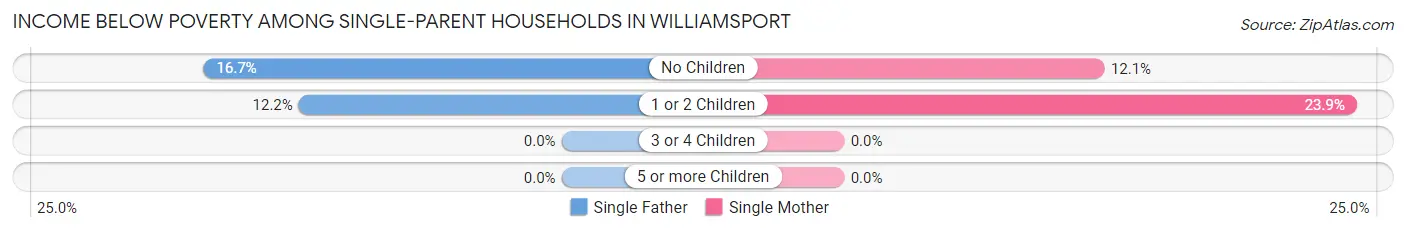
| Children | Single Father | Single Mother |
| No Children | 5 (16.7%) | 4 (12.1%) |
| 1 or 2 Children | 6 (12.2%) | 27 (23.9%) |
| 3 or 4 Children | 0 (0.0%) | 0 (0.0%) |
| 5 or more Children | 0 (0.0%) | 0 (0.0%) |
| Total | 11 (11.0%) | 31 (20.9%) |
Income Below Poverty Among Married-Couple vs Single-Parent Households in Williamsport
The poverty data for Williamsport shows that 37 of the married-couple family households (17.6%) and 42 of the single-parent households (16.9%) are living below the poverty level. Within the married-couple family households, those with 3 or 4 children have the highest poverty rate, with 5 households (45.5%) falling below the poverty line. Among the single-parent households, those with 1 or 2 children have the highest poverty rate, with 33 household (20.4%) living below poverty.
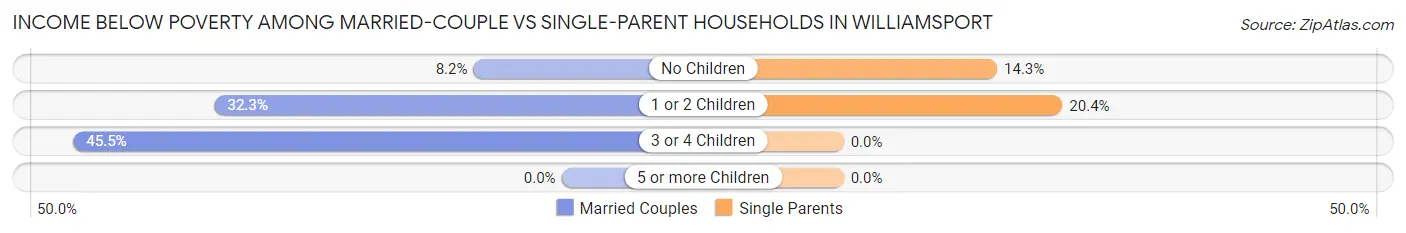
| Children | Married-Couple Families | Single-Parent Households |
| No Children | 11 (8.2%) | 9 (14.3%) |
| 1 or 2 Children | 21 (32.3%) | 33 (20.4%) |
| 3 or 4 Children | 5 (45.5%) | 0 (0.0%) |
| 5 or more Children | 0 (0.0%) | 0 (0.0%) |
| Total | 37 (17.6%) | 42 (16.9%) |
Race in Williamsport
The most populous races in Williamsport are White / Caucasian (1,643 | 85.8%), Two or more Races (138 | 7.2%), and Black / African American (125 | 6.5%).
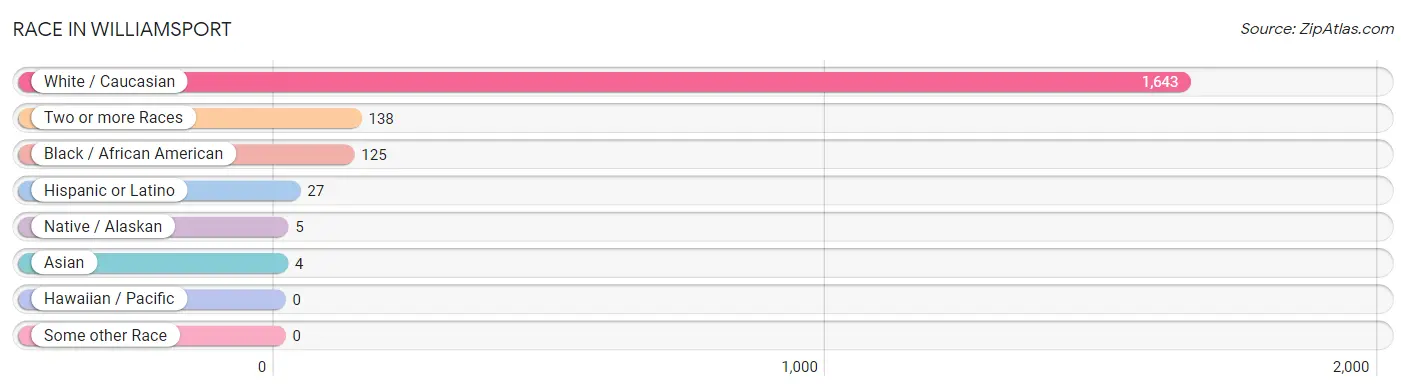
| Race | # Population | % Population |
| Asian | 4 | 0.2% |
| Black / African American | 125 | 6.5% |
| Hawaiian / Pacific | 0 | 0.0% |
| Hispanic or Latino | 27 | 1.4% |
| Native / Alaskan | 5 | 0.3% |
| White / Caucasian | 1,643 | 85.8% |
| Two or more Races | 138 | 7.2% |
| Some other Race | 0 | 0.0% |
| Total | 1,915 | 100.0% |
Ancestry in Williamsport
The most populous ancestries reported in Williamsport are German (537 | 28.0%), Irish (167 | 8.7%), English (152 | 7.9%), American (141 | 7.4%), and Italian (81 | 4.2%), together accounting for 56.3% of all Williamsport residents.
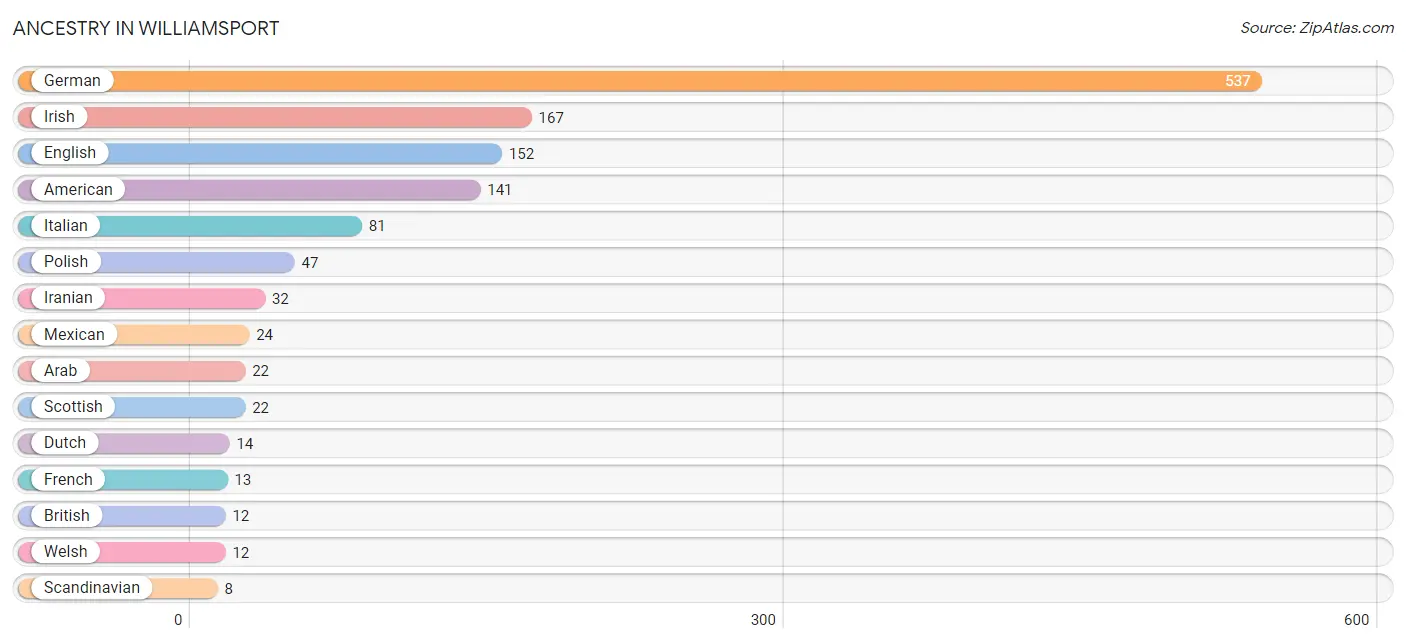
| Ancestry | # Population | % Population |
| African | 2 | 0.1% |
| American | 141 | 7.4% |
| Arab | 22 | 1.1% |
| British | 12 | 0.6% |
| Danish | 4 | 0.2% |
| Dutch | 14 | 0.7% |
| Eastern European | 4 | 0.2% |
| English | 152 | 7.9% |
| French | 13 | 0.7% |
| French Canadian | 4 | 0.2% |
| German | 537 | 28.0% |
| Iranian | 32 | 1.7% |
| Irish | 167 | 8.7% |
| Italian | 81 | 4.2% |
| Lithuanian | 6 | 0.3% |
| Mexican | 24 | 1.3% |
| Polish | 47 | 2.5% |
| Puerto Rican | 3 | 0.2% |
| Scandinavian | 8 | 0.4% |
| Scotch-Irish | 4 | 0.2% |
| Scottish | 22 | 1.1% |
| Senegalese | 2 | 0.1% |
| Subsaharan African | 2 | 0.1% |
| Swedish | 5 | 0.3% |
| Thai | 4 | 0.2% |
| Welsh | 12 | 0.6% | View All 26 Rows |
Immigrants in Williamsport
The most numerous immigrant groups reported in Williamsport came from Africa (52 | 2.7%), Asia (50 | 2.6%), Iran (32 | 1.7%), South Central Asia (32 | 1.7%), and Lebanon (14 | 0.7%), together accounting for 9.4% of all Williamsport residents.
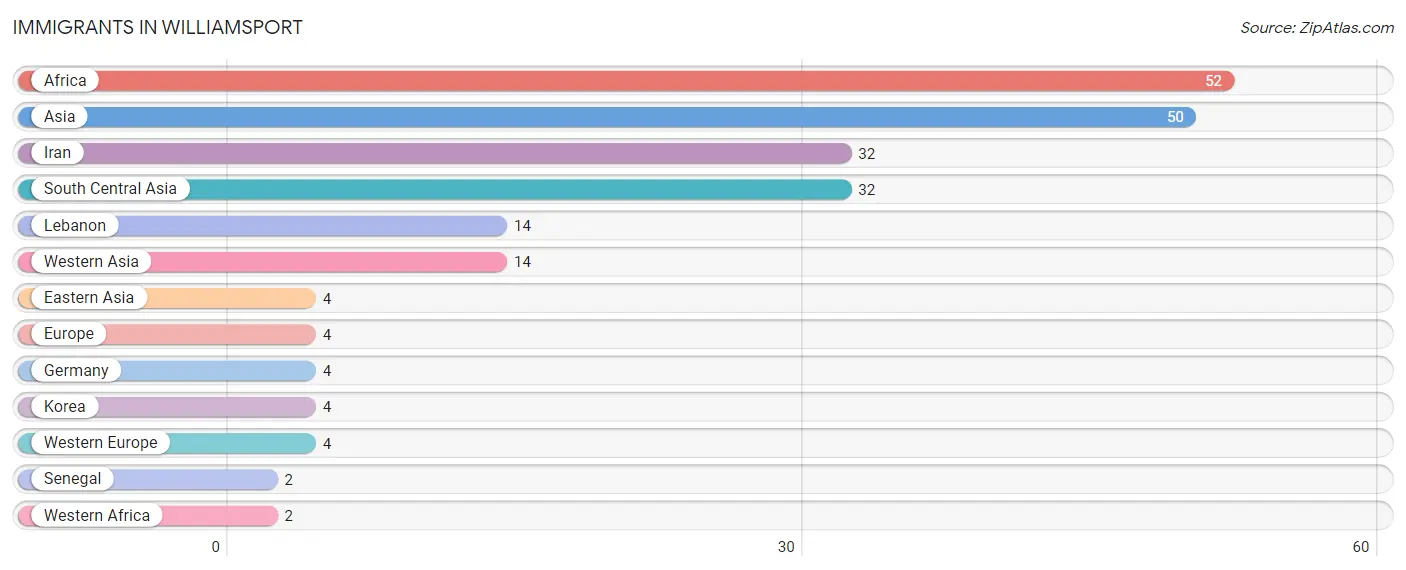
| Immigration Origin | # Population | % Population |
| Africa | 52 | 2.7% |
| Asia | 50 | 2.6% |
| Eastern Asia | 4 | 0.2% |
| Europe | 4 | 0.2% |
| Germany | 4 | 0.2% |
| Iran | 32 | 1.7% |
| Korea | 4 | 0.2% |
| Lebanon | 14 | 0.7% |
| Senegal | 2 | 0.1% |
| South Central Asia | 32 | 1.7% |
| Western Africa | 2 | 0.1% |
| Western Asia | 14 | 0.7% |
| Western Europe | 4 | 0.2% | View All 13 Rows |
Sex and Age in Williamsport
Sex and Age in Williamsport
The most populous age groups in Williamsport are 15 to 19 Years (119 | 12.9%) for men and 40 to 44 Years (98 | 9.9%) for women.
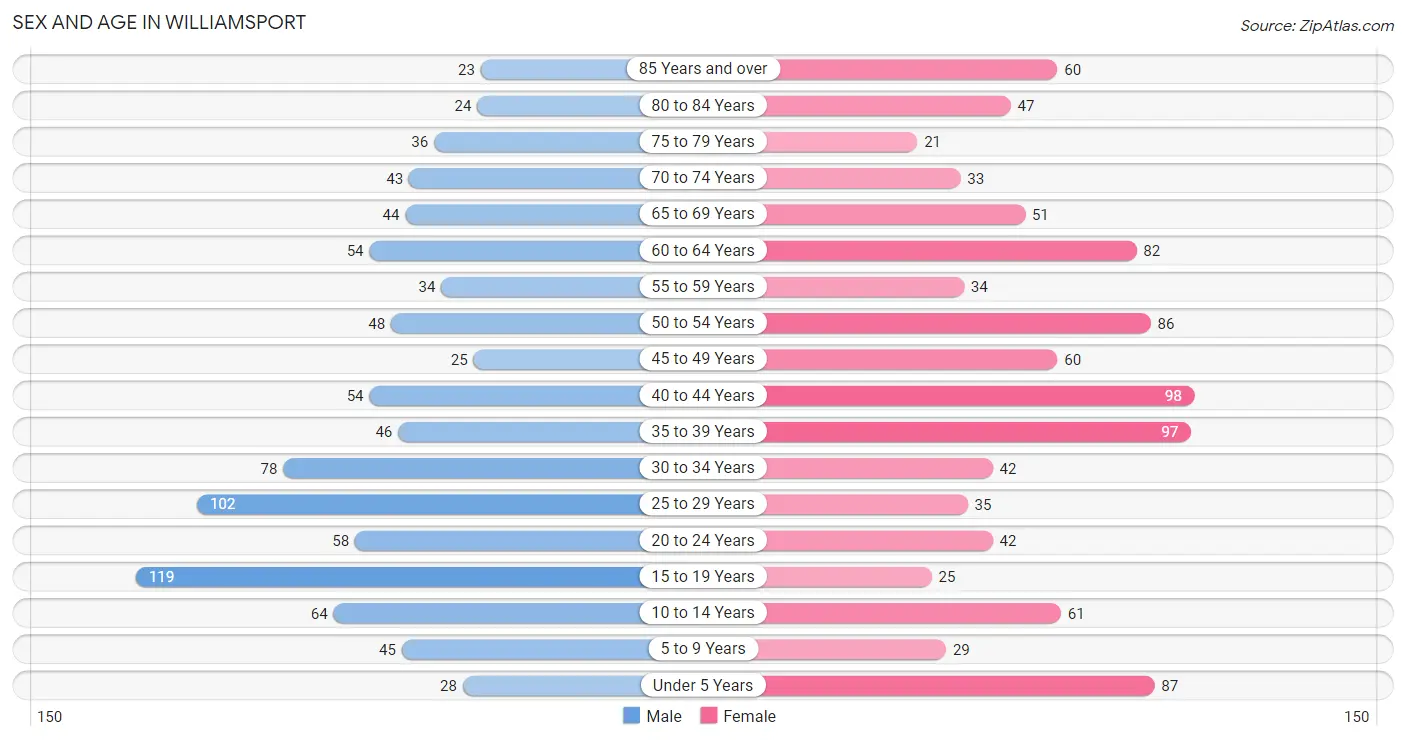
| Age Bracket | Male | Female |
| Under 5 Years | 28 (3.0%) | 87 (8.8%) |
| 5 to 9 Years | 45 (4.9%) | 29 (2.9%) |
| 10 to 14 Years | 64 (6.9%) | 61 (6.2%) |
| 15 to 19 Years | 119 (12.9%) | 25 (2.5%) |
| 20 to 24 Years | 58 (6.3%) | 42 (4.2%) |
| 25 to 29 Years | 102 (11.0%) | 35 (3.5%) |
| 30 to 34 Years | 78 (8.4%) | 42 (4.2%) |
| 35 to 39 Years | 46 (5.0%) | 97 (9.8%) |
| 40 to 44 Years | 54 (5.8%) | 98 (9.9%) |
| 45 to 49 Years | 25 (2.7%) | 60 (6.1%) |
| 50 to 54 Years | 48 (5.2%) | 86 (8.7%) |
| 55 to 59 Years | 34 (3.7%) | 34 (3.4%) |
| 60 to 64 Years | 54 (5.8%) | 82 (8.3%) |
| 65 to 69 Years | 44 (4.8%) | 51 (5.1%) |
| 70 to 74 Years | 43 (4.6%) | 33 (3.3%) |
| 75 to 79 Years | 36 (3.9%) | 21 (2.1%) |
| 80 to 84 Years | 24 (2.6%) | 47 (4.8%) |
| 85 Years and over | 23 (2.5%) | 60 (6.1%) |
| Total | 925 (100.0%) | 990 (100.0%) |
Families and Households in Williamsport
Median Family Size in Williamsport
The median family size in Williamsport is 2.58 persons per family, with married-couple families (210 | 45.9%) accounting for the largest median family size of 2.74 persons per family. On the other hand, single female/mother families (148 | 32.3%) represent the smallest median family size with 2.43 persons per family.
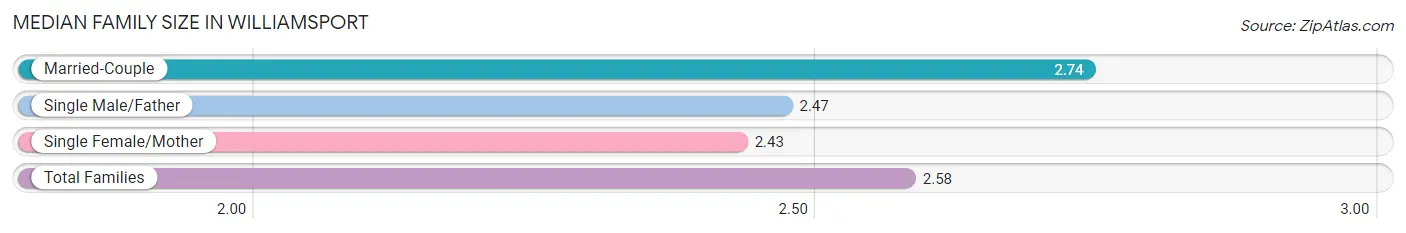
| Family Type | # Families | Family Size |
| Married-Couple | 210 (45.9%) | 2.74 |
| Single Male/Father | 100 (21.8%) | 2.47 |
| Single Female/Mother | 148 (32.3%) | 2.43 |
| Total Families | 458 (100.0%) | 2.58 |
Median Household Size in Williamsport
The median household size in Williamsport is 2.06 persons per household, with single male/father households (100 | 11.6%) accounting for the largest median household size of 2.76 persons per household. non-family households (407 | 47.0%) represent the smallest median household size with 1.31 persons per household.
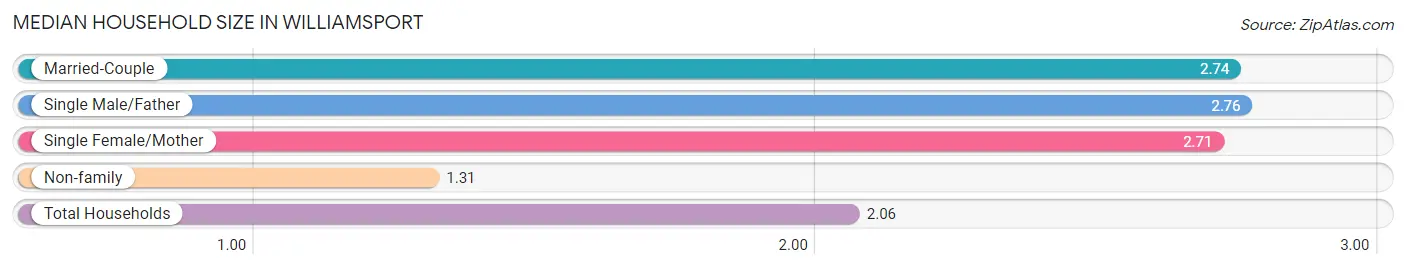
| Household Type | # Households | Household Size |
| Married-Couple | 210 (24.3%) | 2.74 |
| Single Male/Father | 100 (11.6%) | 2.76 |
| Single Female/Mother | 148 (17.1%) | 2.71 |
| Non-family | 407 (47.0%) | 1.31 |
| Total Households | 865 (100.0%) | 2.06 |
Household Size by Marriage Status in Williamsport
Out of a total of 865 households in Williamsport, 458 (52.9%) are family households, while 407 (47.0%) are nonfamily households. The most numerous type of family households are 2-person households, comprising 209, and the most common type of nonfamily households are 1-person households, comprising 320.
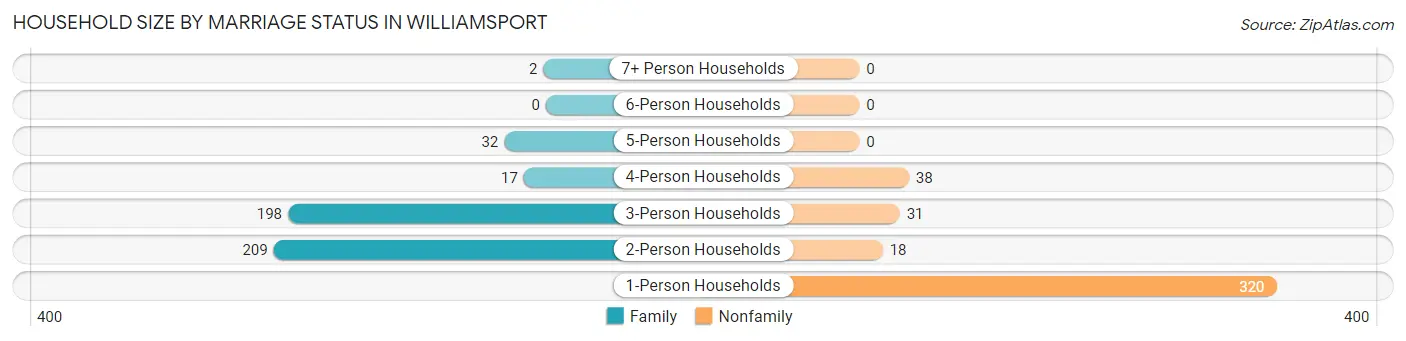
| Household Size | Family Households | Nonfamily Households |
| 1-Person Households | - | 320 (37.0%) |
| 2-Person Households | 209 (24.2%) | 18 (2.1%) |
| 3-Person Households | 198 (22.9%) | 31 (3.6%) |
| 4-Person Households | 17 (2.0%) | 38 (4.4%) |
| 5-Person Households | 32 (3.7%) | 0 (0.0%) |
| 6-Person Households | 0 (0.0%) | 0 (0.0%) |
| 7+ Person Households | 2 (0.2%) | 0 (0.0%) |
| Total | 458 (52.9%) | 407 (47.0%) |
Female Fertility in Williamsport
Fertility by Age in Williamsport
Average fertility rate in Williamsport is 61.0 births per 1,000 women. Women in the age bracket of 35 to 50 years have the highest fertility rate with 79.0 births per 1,000 women. Women in the age bracket of 35 to 50 years acount for 84.0% of all women with births.
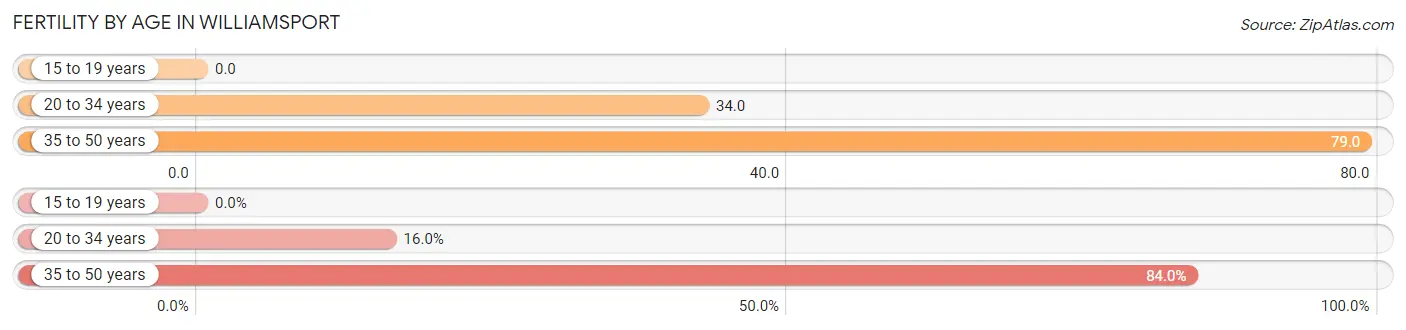
| Age Bracket | Women with Births | Births / 1,000 Women |
| 15 to 19 years | 0 (0.0%) | 0.0 |
| 20 to 34 years | 4 (16.0%) | 34.0 |
| 35 to 50 years | 21 (84.0%) | 79.0 |
| Total | 25 (100.0%) | 61.0 |
Fertility by Age by Marriage Status in Williamsport
16.0% of women with births (25) in Williamsport are married. The highest percentage of unmarried women with births falls into 35 to 50 years age bracket with 100.0% of them unmarried at the time of birth, while the lowest percentage of unmarried women with births belong to 20 to 34 years age bracket with 0.0% of them unmarried.
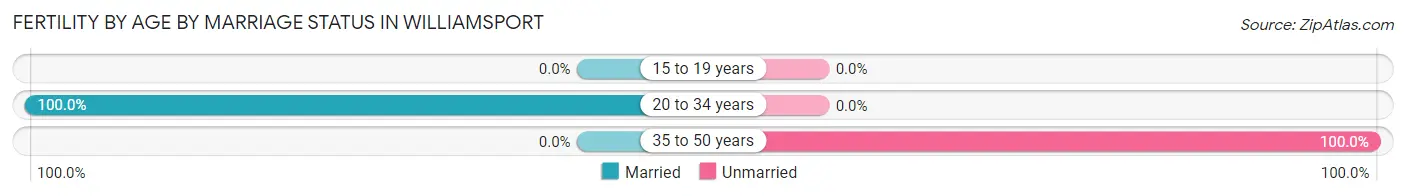
| Age Bracket | Married | Unmarried |
| 15 to 19 years | 0 (0.0%) | 0 (0.0%) |
| 20 to 34 years | 4 (100.0%) | 0 (0.0%) |
| 35 to 50 years | 0 (0.0%) | 21 (100.0%) |
| Total | 4 (16.0%) | 21 (84.0%) |
Fertility by Education in Williamsport
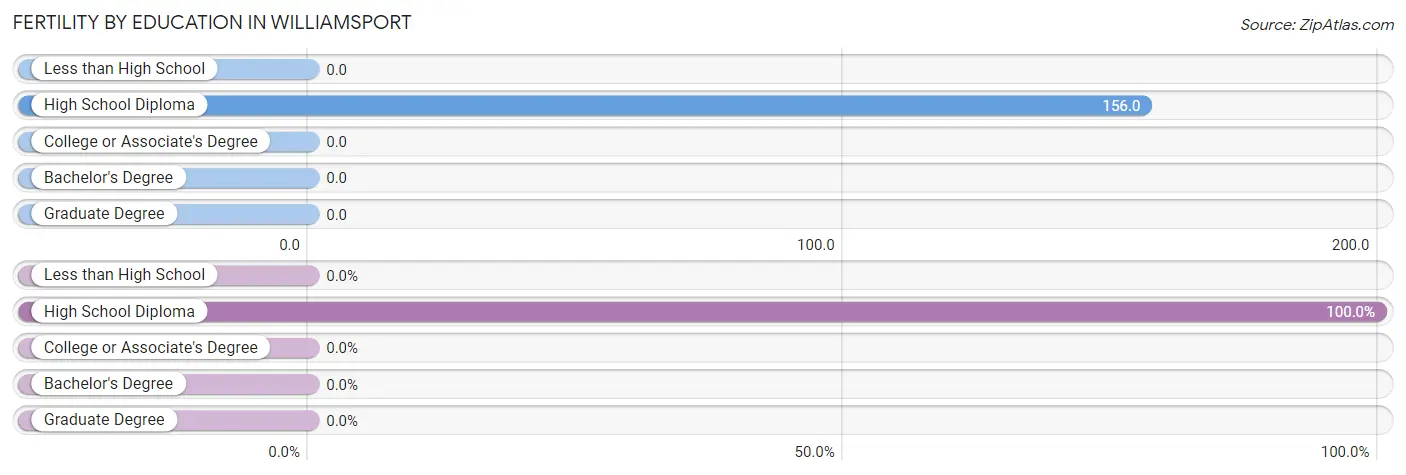
| Educational Attainment | Women with Births | Births / 1,000 Women |
| Less than High School | 0 (0.0%) | 0.0 |
| High School Diploma | 25 (100.0%) | 156.0 |
| College or Associate's Degree | 0 (0.0%) | 0.0 |
| Bachelor's Degree | 0 (0.0%) | 0.0 |
| Graduate Degree | 0 (0.0%) | 0.0 |
| Total | 25 (100.0%) | 61.0 |
Fertility by Education by Marriage Status in Williamsport
84.0% of women with births in Williamsport are unmarried. Women with the educational attainment of high school diploma are most likely to be married with 16.0% of them married at childbirth, while women with the educational attainment of high school diploma are least likely to be married with 84.0% of them unmarried at childbirth.
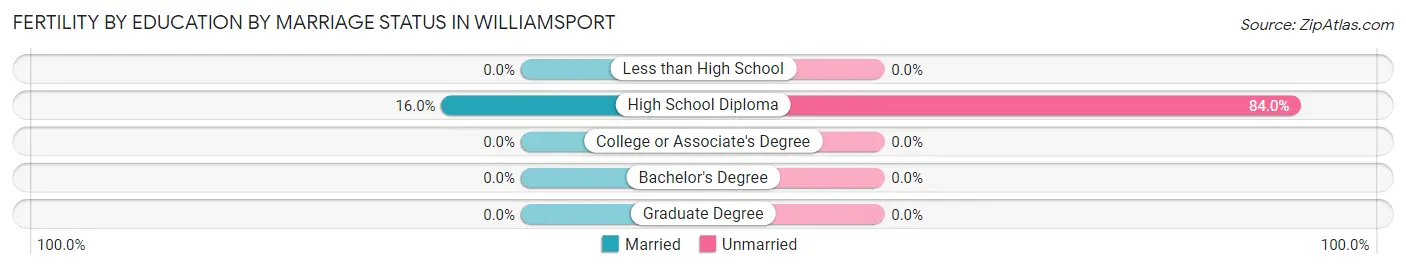
| Educational Attainment | Married | Unmarried |
| Less than High School | 0 (0.0%) | 0 (0.0%) |
| High School Diploma | 4 (16.0%) | 21 (84.0%) |
| College or Associate's Degree | 0 (0.0%) | 0 (0.0%) |
| Bachelor's Degree | 0 (0.0%) | 0 (0.0%) |
| Graduate Degree | 0 (0.0%) | 0 (0.0%) |
| Total | 4 (16.0%) | 21 (84.0%) |
Employment Characteristics in Williamsport
Employment by Class of Employer in Williamsport
Among the 885 employed individuals in Williamsport, private company employees (640 | 72.3%), local government employees (91 | 10.3%), and federal government employees (52 | 5.9%) make up the most common classes of employment.
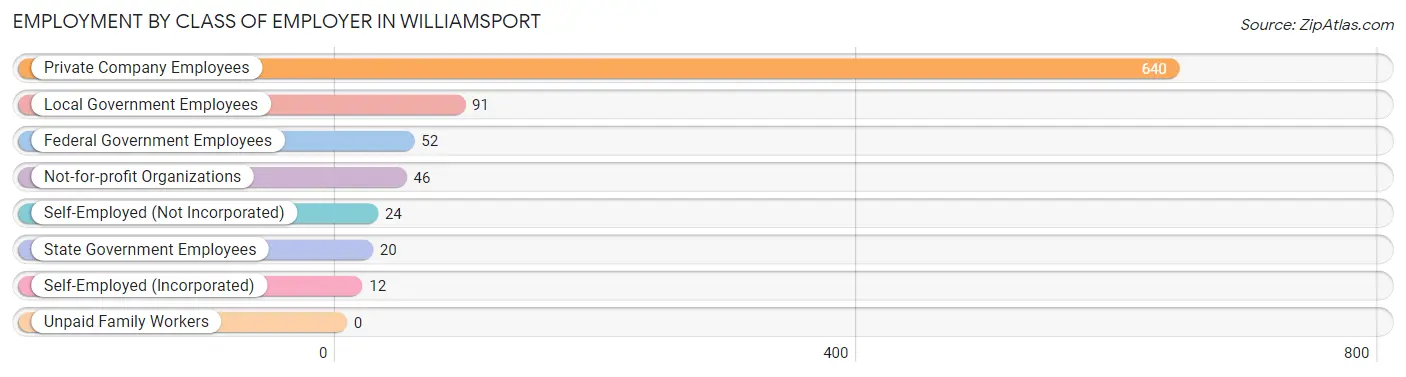
| Employer Class | # Employees | % Employees |
| Private Company Employees | 640 | 72.3% |
| Self-Employed (Incorporated) | 12 | 1.4% |
| Self-Employed (Not Incorporated) | 24 | 2.7% |
| Not-for-profit Organizations | 46 | 5.2% |
| Local Government Employees | 91 | 10.3% |
| State Government Employees | 20 | 2.3% |
| Federal Government Employees | 52 | 5.9% |
| Unpaid Family Workers | 0 | 0.0% |
| Total | 885 | 100.0% |
Employment Status by Age in Williamsport
According to the labor force statistics for Williamsport, out of the total population over 16 years of age (1,574), 58.6% or 922 individuals are in the labor force, with 4.1% or 38 of them unemployed. The age group with the highest labor force participation rate is 25 to 29 years, with 97.1% or 133 individuals in the labor force. Within the labor force, the 55 to 59 years age range has the highest percentage of unemployed individuals, with 15.4% or 6 of them being unemployed.
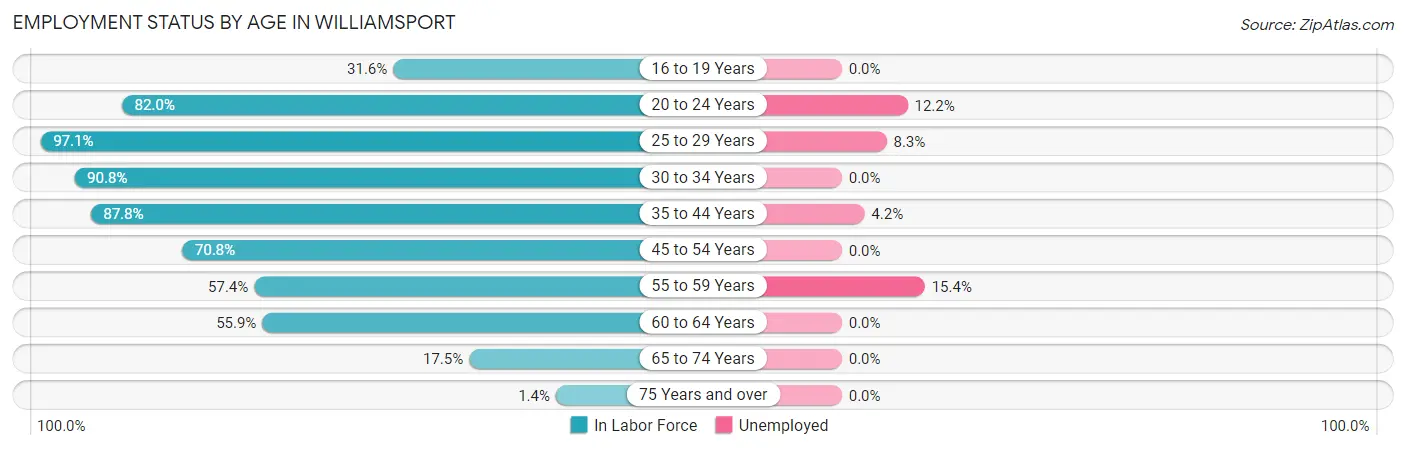
| Age Bracket | In Labor Force | Unemployed |
| 16 to 19 Years | 37 (31.6%) | 0 (0.0%) |
| 20 to 24 Years | 82 (82.0%) | 10 (12.2%) |
| 25 to 29 Years | 133 (97.1%) | 11 (8.3%) |
| 30 to 34 Years | 109 (90.8%) | 0 (0.0%) |
| 35 to 44 Years | 259 (87.8%) | 11 (4.2%) |
| 45 to 54 Years | 155 (70.8%) | 0 (0.0%) |
| 55 to 59 Years | 39 (57.4%) | 6 (15.4%) |
| 60 to 64 Years | 76 (55.9%) | 0 (0.0%) |
| 65 to 74 Years | 30 (17.5%) | 0 (0.0%) |
| 75 Years and over | 3 (1.4%) | 0 (0.0%) |
| Total | 922 (58.6%) | 38 (4.1%) |
Employment Status by Educational Attainment in Williamsport
According to labor force statistics for Williamsport, 79.1% of individuals (771) out of the total population between 25 and 64 years of age (975) are in the labor force, with 3.6% or 28 of them being unemployed. The group with the highest labor force participation rate are those with the educational attainment of bachelor's degree or higher, with 95.9% or 141 individuals in the labor force. Within the labor force, individuals with college / associate degree education have the highest percentage of unemployment, with 5.4% or 15 of them being unemployed.
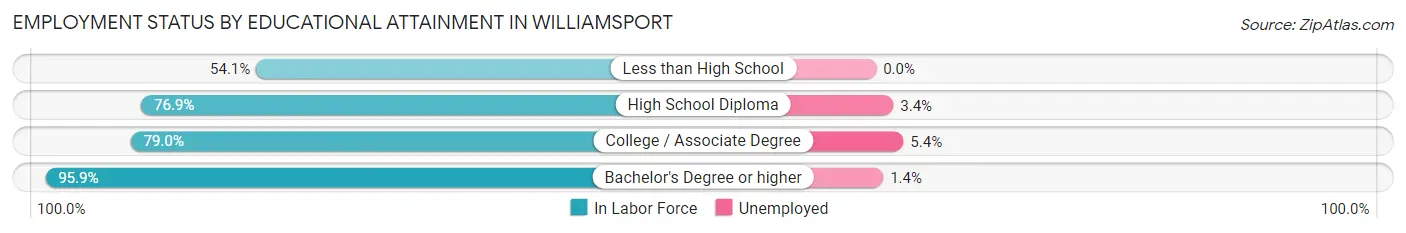
| Educational Attainment | In Labor Force | Unemployed |
| Less than High School | 33 (54.1%) | 0 (0.0%) |
| High School Diploma | 319 (76.9%) | 14 (3.4%) |
| College / Associate Degree | 278 (79.0%) | 19 (5.4%) |
| Bachelor's Degree or higher | 141 (95.9%) | 2 (1.4%) |
| Total | 771 (79.1%) | 35 (3.6%) |
Employment Occupations by Sex in Williamsport
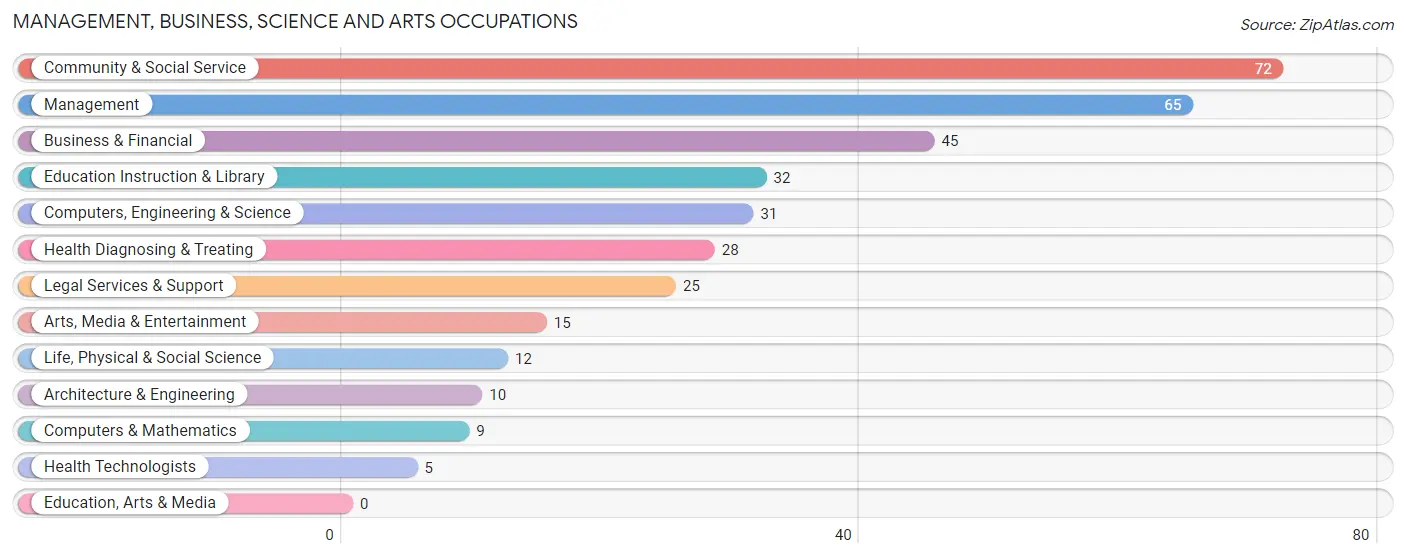
Management, Business, Science and Arts Occupations
The most common Management, Business, Science and Arts occupations in Williamsport are Community & Social Service (72 | 8.1%), Management (65 | 7.3%), Business & Financial (45 | 5.1%), Education Instruction & Library (32 | 3.6%), and Computers, Engineering & Science (31 | 3.5%).
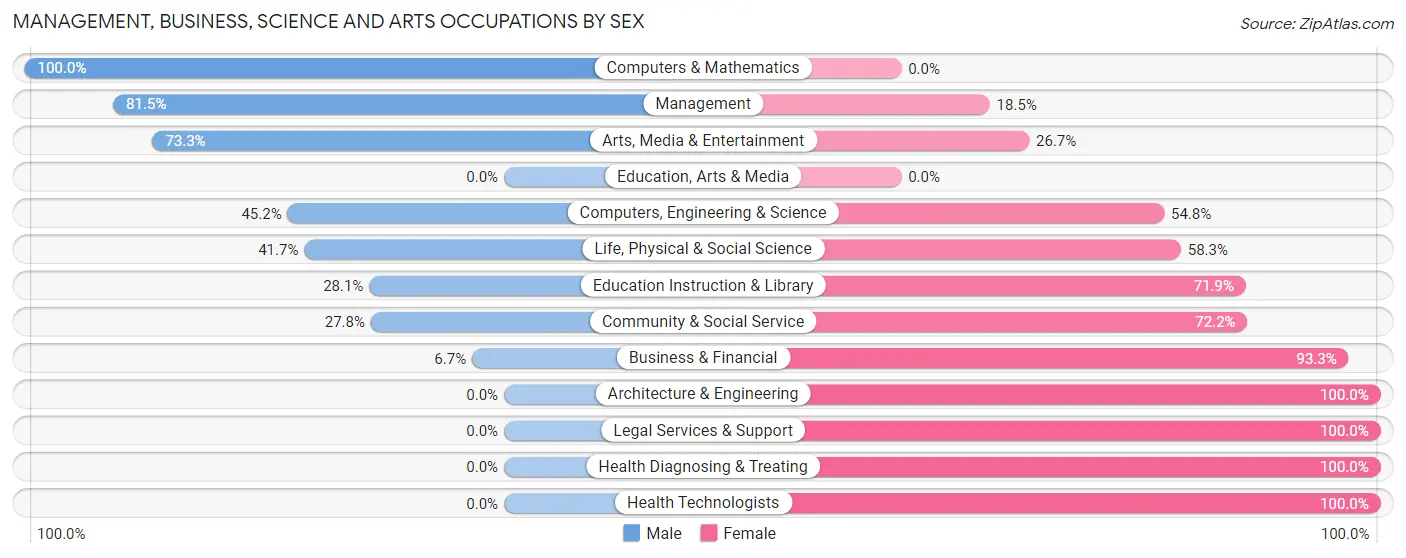
Management, Business, Science and Arts Occupations by Sex
Within the Management, Business, Science and Arts occupations in Williamsport, the most male-oriented occupations are Computers & Mathematics (100.0%), Management (81.5%), and Arts, Media & Entertainment (73.3%), while the most female-oriented occupations are Architecture & Engineering (100.0%), Legal Services & Support (100.0%), and Health Diagnosing & Treating (100.0%).
| Occupation | Male | Female |
| Management | 53 (81.5%) | 12 (18.5%) |
| Business & Financial | 3 (6.7%) | 42 (93.3%) |
| Computers, Engineering & Science | 14 (45.2%) | 17 (54.8%) |
| Computers & Mathematics | 9 (100.0%) | 0 (0.0%) |
| Architecture & Engineering | 0 (0.0%) | 10 (100.0%) |
| Life, Physical & Social Science | 5 (41.7%) | 7 (58.3%) |
| Community & Social Service | 20 (27.8%) | 52 (72.2%) |
| Education, Arts & Media | 0 (0.0%) | 0 (0.0%) |
| Legal Services & Support | 0 (0.0%) | 25 (100.0%) |
| Education Instruction & Library | 9 (28.1%) | 23 (71.9%) |
| Arts, Media & Entertainment | 11 (73.3%) | 4 (26.7%) |
| Health Diagnosing & Treating | 0 (0.0%) | 28 (100.0%) |
| Health Technologists | 0 (0.0%) | 5 (100.0%) |
| Total (Category) | 90 (37.3%) | 151 (62.7%) |
| Total (Overall) | 470 (53.1%) | 415 (46.9%) |
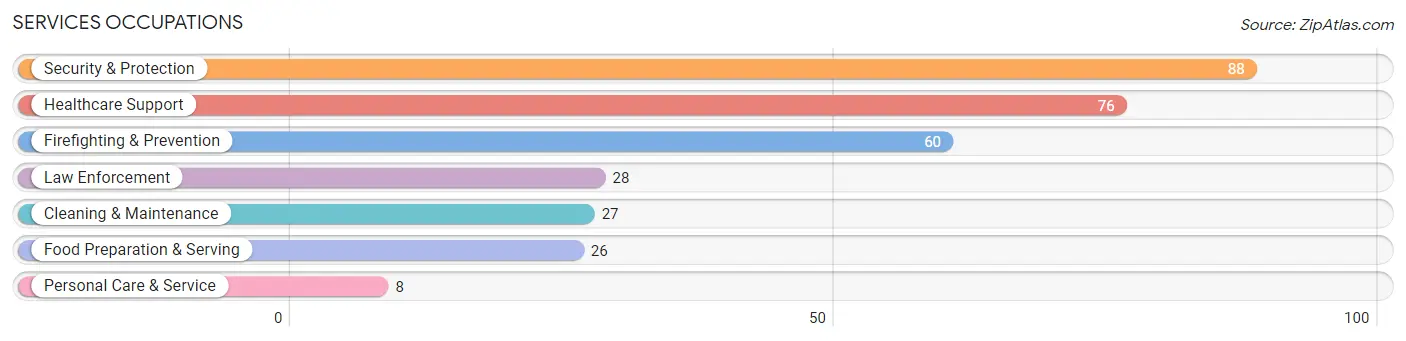
Services Occupations
The most common Services occupations in Williamsport are Security & Protection (88 | 9.9%), Healthcare Support (76 | 8.6%), Firefighting & Prevention (60 | 6.8%), Law Enforcement (28 | 3.2%), and Cleaning & Maintenance (27 | 3.0%).
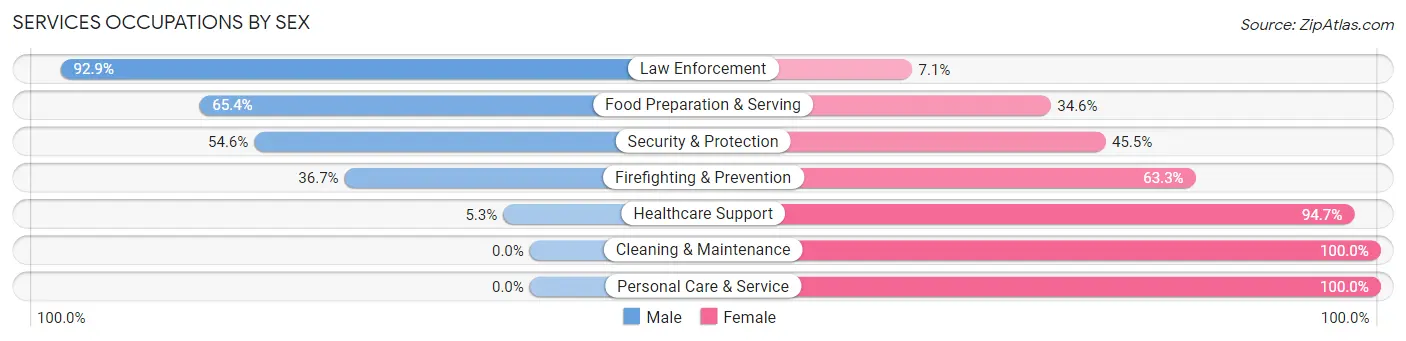
Services Occupations by Sex
Within the Services occupations in Williamsport, the most male-oriented occupations are Law Enforcement (92.9%), Food Preparation & Serving (65.4%), and Security & Protection (54.5%), while the most female-oriented occupations are Cleaning & Maintenance (100.0%), Personal Care & Service (100.0%), and Healthcare Support (94.7%).
| Occupation | Male | Female |
| Healthcare Support | 4 (5.3%) | 72 (94.7%) |
| Security & Protection | 48 (54.5%) | 40 (45.5%) |
| Firefighting & Prevention | 22 (36.7%) | 38 (63.3%) |
| Law Enforcement | 26 (92.9%) | 2 (7.1%) |
| Food Preparation & Serving | 17 (65.4%) | 9 (34.6%) |
| Cleaning & Maintenance | 0 (0.0%) | 27 (100.0%) |
| Personal Care & Service | 0 (0.0%) | 8 (100.0%) |
| Total (Category) | 69 (30.7%) | 156 (69.3%) |
| Total (Overall) | 470 (53.1%) | 415 (46.9%) |
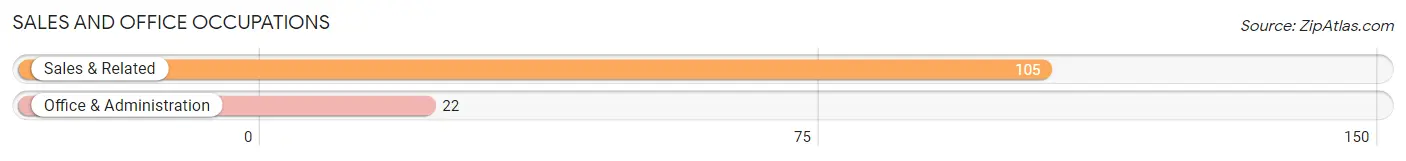
Sales and Office Occupations
The most common Sales and Office occupations in Williamsport are Sales & Related (105 | 11.9%), and Office & Administration (22 | 2.5%).
Sales and Office Occupations by Sex
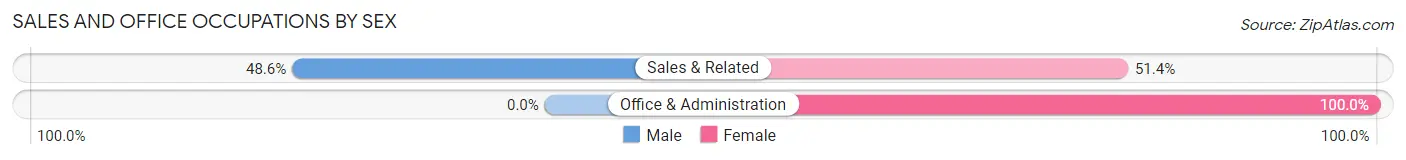
| Occupation | Male | Female |
| Sales & Related | 51 (48.6%) | 54 (51.4%) |
| Office & Administration | 0 (0.0%) | 22 (100.0%) |
| Total (Category) | 51 (40.2%) | 76 (59.8%) |
| Total (Overall) | 470 (53.1%) | 415 (46.9%) |
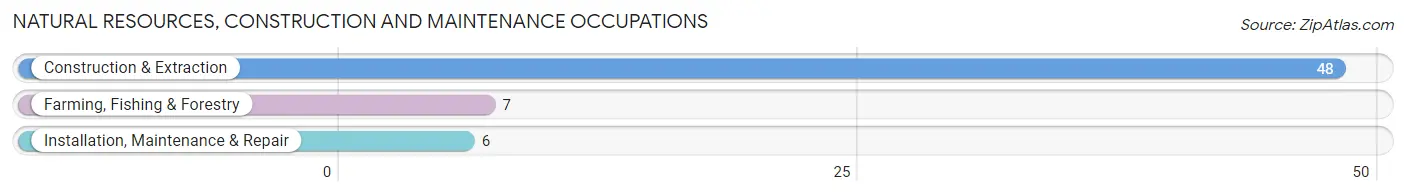
Natural Resources, Construction and Maintenance Occupations
The most common Natural Resources, Construction and Maintenance occupations in Williamsport are Construction & Extraction (48 | 5.4%), Farming, Fishing & Forestry (7 | 0.8%), and Installation, Maintenance & Repair (6 | 0.7%).
Natural Resources, Construction and Maintenance Occupations by Sex
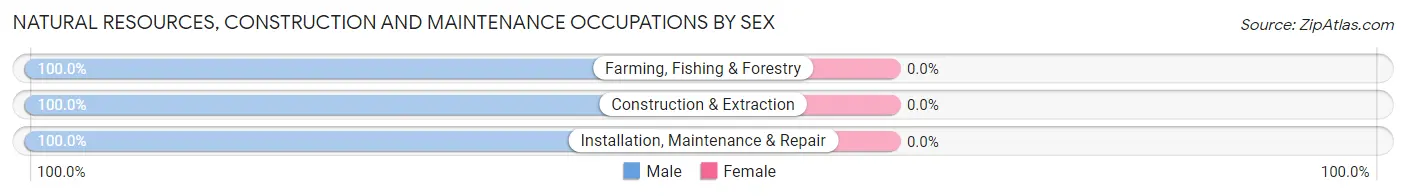
| Occupation | Male | Female |
| Farming, Fishing & Forestry | 7 (100.0%) | 0 (0.0%) |
| Construction & Extraction | 48 (100.0%) | 0 (0.0%) |
| Installation, Maintenance & Repair | 6 (100.0%) | 0 (0.0%) |
| Total (Category) | 61 (100.0%) | 0 (0.0%) |
| Total (Overall) | 470 (53.1%) | 415 (46.9%) |
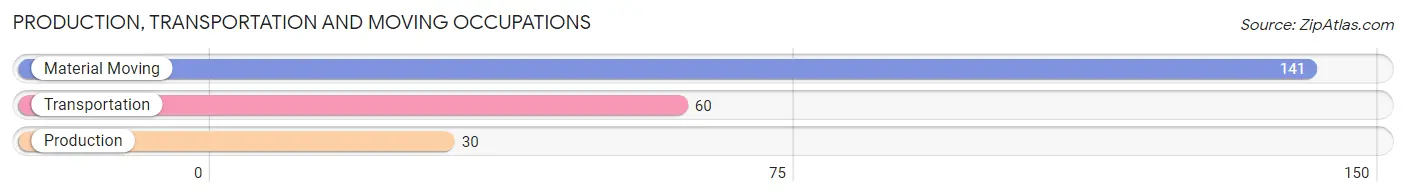
Production, Transportation and Moving Occupations
The most common Production, Transportation and Moving occupations in Williamsport are Material Moving (141 | 15.9%), Transportation (60 | 6.8%), and Production (30 | 3.4%).
Production, Transportation and Moving Occupations by Sex
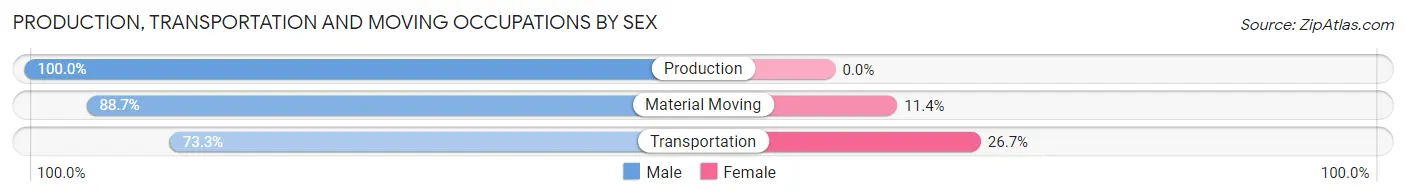
| Occupation | Male | Female |
| Production | 30 (100.0%) | 0 (0.0%) |
| Transportation | 44 (73.3%) | 16 (26.7%) |
| Material Moving | 125 (88.6%) | 16 (11.4%) |
| Total (Category) | 199 (86.2%) | 32 (13.9%) |
| Total (Overall) | 470 (53.1%) | 415 (46.9%) |
Employment Industries by Sex in Williamsport
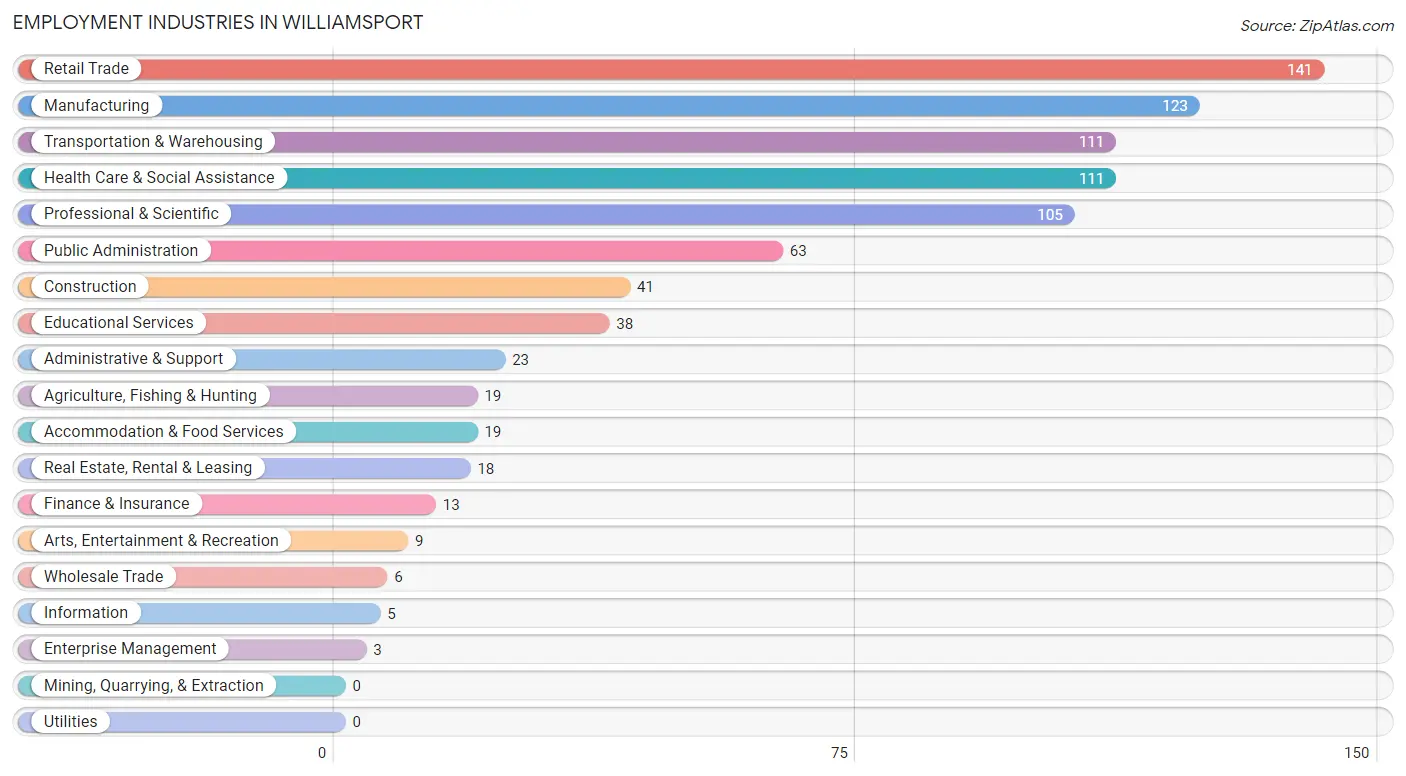
Employment Industries in Williamsport
The major employment industries in Williamsport include Retail Trade (141 | 15.9%), Manufacturing (123 | 13.9%), Transportation & Warehousing (111 | 12.5%), Health Care & Social Assistance (111 | 12.5%), and Professional & Scientific (105 | 11.9%).
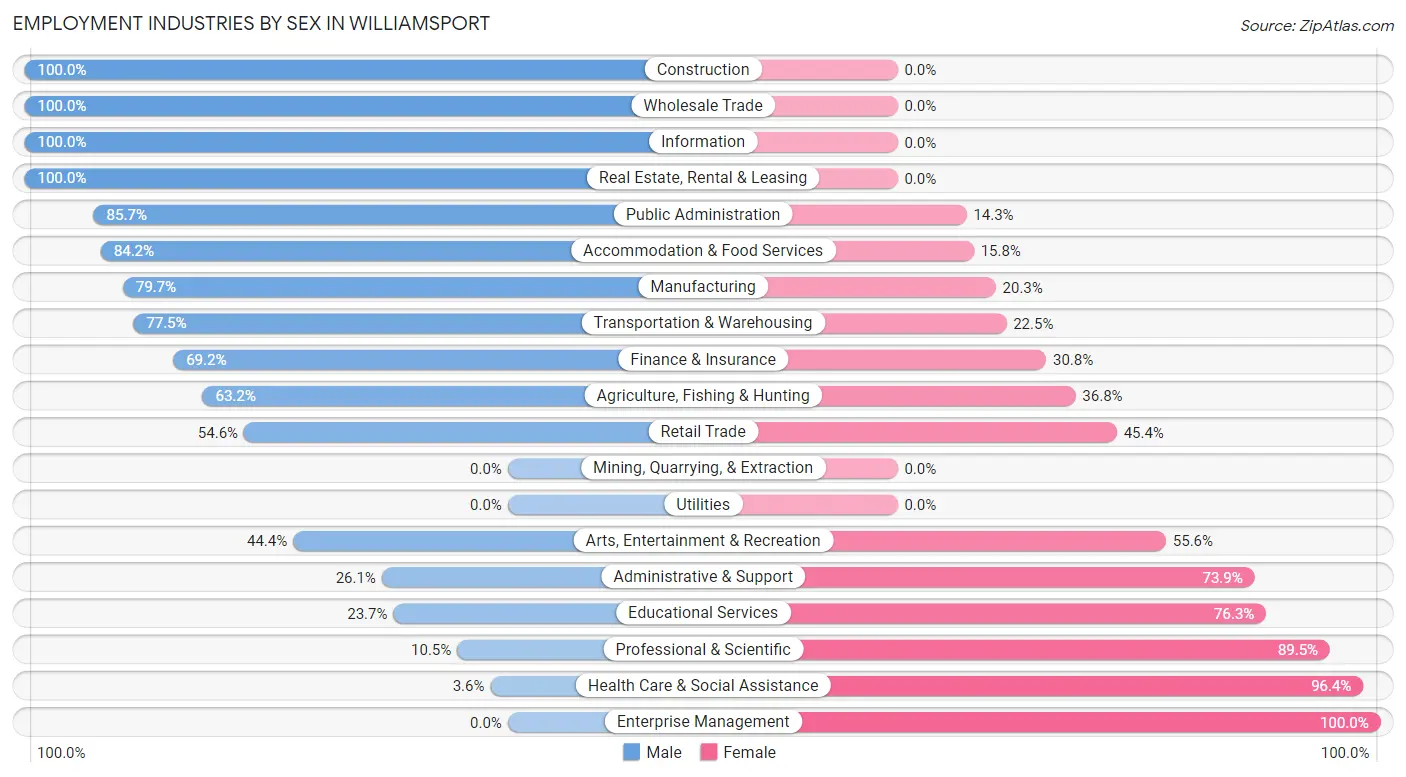
Employment Industries by Sex in Williamsport
The Williamsport industries that see more men than women are Construction (100.0%), Wholesale Trade (100.0%), and Information (100.0%), whereas the industries that tend to have a higher number of women are Enterprise Management (100.0%), Health Care & Social Assistance (96.4%), and Professional & Scientific (89.5%).
| Industry | Male | Female |
| Agriculture, Fishing & Hunting | 12 (63.2%) | 7 (36.8%) |
| Mining, Quarrying, & Extraction | 0 (0.0%) | 0 (0.0%) |
| Construction | 41 (100.0%) | 0 (0.0%) |
| Manufacturing | 98 (79.7%) | 25 (20.3%) |
| Wholesale Trade | 6 (100.0%) | 0 (0.0%) |
| Retail Trade | 77 (54.6%) | 64 (45.4%) |
| Transportation & Warehousing | 86 (77.5%) | 25 (22.5%) |
| Utilities | 0 (0.0%) | 0 (0.0%) |
| Information | 5 (100.0%) | 0 (0.0%) |
| Finance & Insurance | 9 (69.2%) | 4 (30.8%) |
| Real Estate, Rental & Leasing | 18 (100.0%) | 0 (0.0%) |
| Professional & Scientific | 11 (10.5%) | 94 (89.5%) |
| Enterprise Management | 0 (0.0%) | 3 (100.0%) |
| Administrative & Support | 6 (26.1%) | 17 (73.9%) |
| Educational Services | 9 (23.7%) | 29 (76.3%) |
| Health Care & Social Assistance | 4 (3.6%) | 107 (96.4%) |
| Arts, Entertainment & Recreation | 4 (44.4%) | 5 (55.6%) |
| Accommodation & Food Services | 16 (84.2%) | 3 (15.8%) |
| Public Administration | 54 (85.7%) | 9 (14.3%) |
| Total | 470 (53.1%) | 415 (46.9%) |
Education in Williamsport
School Enrollment in Williamsport
The most common levels of schooling among the 352 students in Williamsport are middle school (109 | 31.0%), high school (95 | 27.0%), and college / undergraduate (53 | 15.1%).
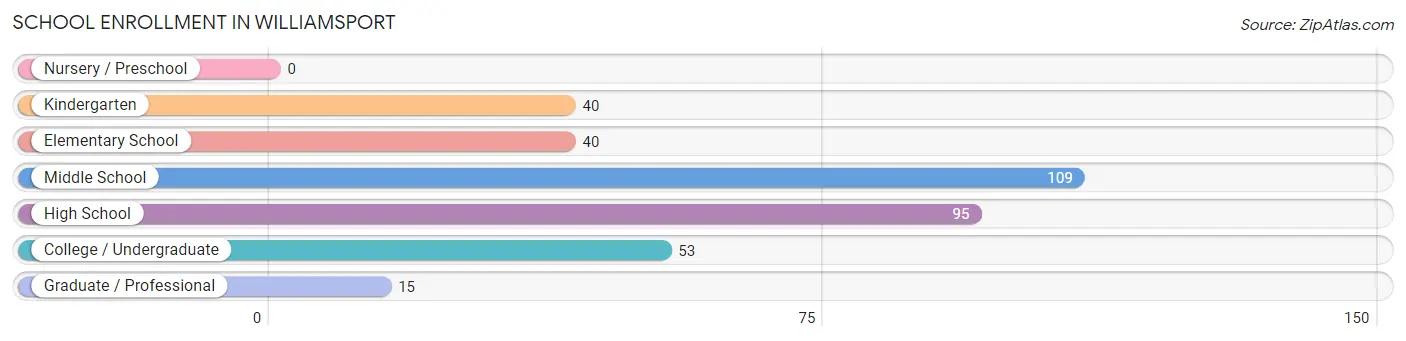
| School Level | # Students | % Students |
| Nursery / Preschool | 0 | 0.0% |
| Kindergarten | 40 | 11.4% |
| Elementary School | 40 | 11.4% |
| Middle School | 109 | 31.0% |
| High School | 95 | 27.0% |
| College / Undergraduate | 53 | 15.1% |
| Graduate / Professional | 15 | 4.3% |
| Total | 352 | 100.0% |
School Enrollment by Age by Funding Source in Williamsport
Out of a total of 352 students who are enrolled in schools in Williamsport, 12 (3.4%) attend a private institution, while the remaining 340 (96.6%) are enrolled in public schools. The age group of 10 to 14 year olds has the highest likelihood of being enrolled in private schools, with 12 (9.6% in the age bracket) enrolled. Conversely, the age group of 5 to 9 year old has the lowest likelihood of being enrolled in a private school, with 74 (100.0% in the age bracket) attending a public institution.
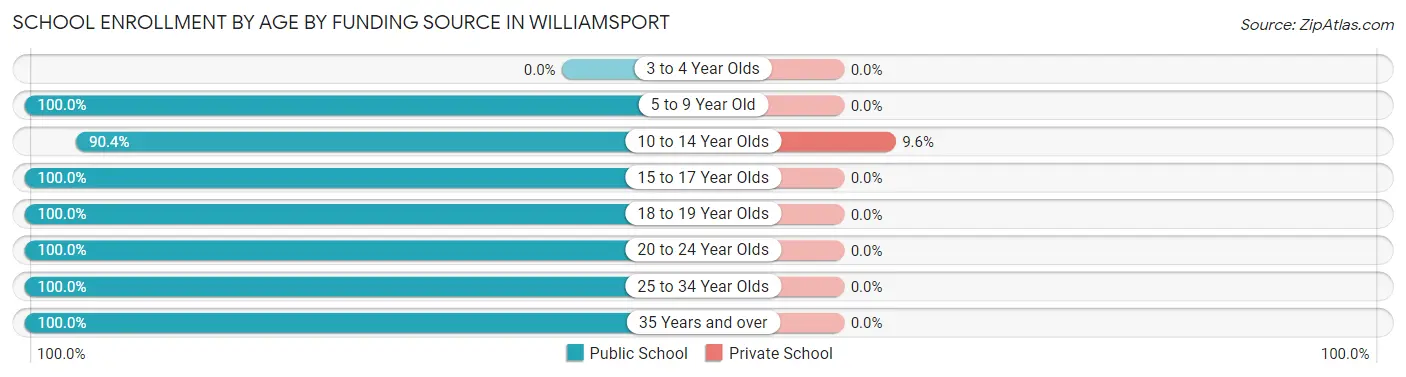
| Age Bracket | Public School | Private School |
| 3 to 4 Year Olds | 0 (0.0%) | 0 (0.0%) |
| 5 to 9 Year Old | 74 (100.0%) | 0 (0.0%) |
| 10 to 14 Year Olds | 113 (90.4%) | 12 (9.6%) |
| 15 to 17 Year Olds | 78 (100.0%) | 0 (0.0%) |
| 18 to 19 Year Olds | 3 (100.0%) | 0 (0.0%) |
| 20 to 24 Year Olds | 37 (100.0%) | 0 (0.0%) |
| 25 to 34 Year Olds | 23 (100.0%) | 0 (0.0%) |
| 35 Years and over | 12 (100.0%) | 0 (0.0%) |
| Total | 340 (96.6%) | 12 (3.4%) |
Educational Attainment by Field of Study in Williamsport
Business (64 | 27.0%), education (52 | 21.9%), social sciences (29 | 12.2%), literature & languages (25 | 10.5%), and visual & performing arts (21 | 8.9%) are the most common fields of study among 237 individuals in Williamsport who have obtained a bachelor's degree or higher.
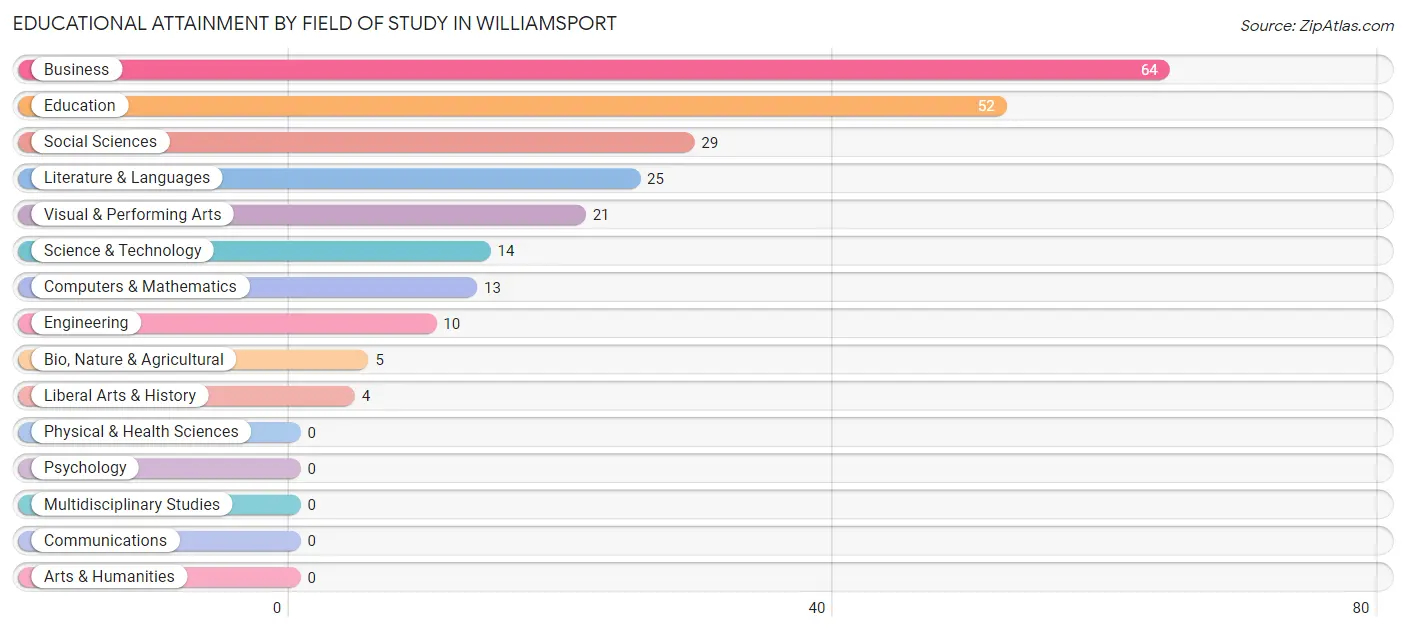
| Field of Study | # Graduates | % Graduates |
| Computers & Mathematics | 13 | 5.5% |
| Bio, Nature & Agricultural | 5 | 2.1% |
| Physical & Health Sciences | 0 | 0.0% |
| Psychology | 0 | 0.0% |
| Social Sciences | 29 | 12.2% |
| Engineering | 10 | 4.2% |
| Multidisciplinary Studies | 0 | 0.0% |
| Science & Technology | 14 | 5.9% |
| Business | 64 | 27.0% |
| Education | 52 | 21.9% |
| Literature & Languages | 25 | 10.5% |
| Liberal Arts & History | 4 | 1.7% |
| Visual & Performing Arts | 21 | 8.9% |
| Communications | 0 | 0.0% |
| Arts & Humanities | 0 | 0.0% |
| Total | 237 | 100.0% |
Transportation & Commute in Williamsport
Vehicle Availability by Sex in Williamsport
The most prevalent vehicle ownership categories in Williamsport are males with 2 vehicles (202, accounting for 43.0%) and females with 2 vehicles (222, making up 48.7%).
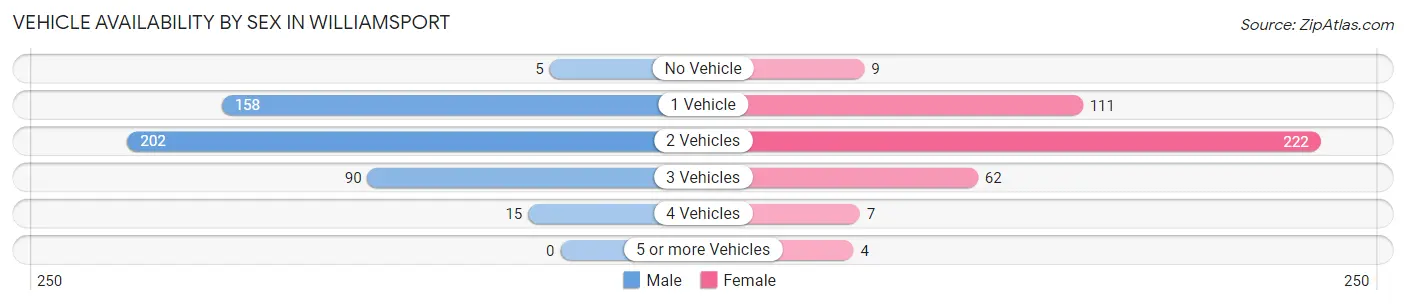
| Vehicles Available | Male | Female |
| No Vehicle | 5 (1.1%) | 9 (2.2%) |
| 1 Vehicle | 158 (33.6%) | 111 (26.8%) |
| 2 Vehicles | 202 (43.0%) | 222 (53.5%) |
| 3 Vehicles | 90 (19.2%) | 62 (14.9%) |
| 4 Vehicles | 15 (3.2%) | 7 (1.7%) |
| 5 or more Vehicles | 0 (0.0%) | 4 (1.0%) |
| Total | 470 (100.0%) | 415 (100.0%) |
Commute Time in Williamsport
The most frequently occuring commute durations in Williamsport are 10 to 14 minutes (231 commuters, 26.4%), 15 to 19 minutes (171 commuters, 19.5%), and 5 to 9 minutes (124 commuters, 14.2%).
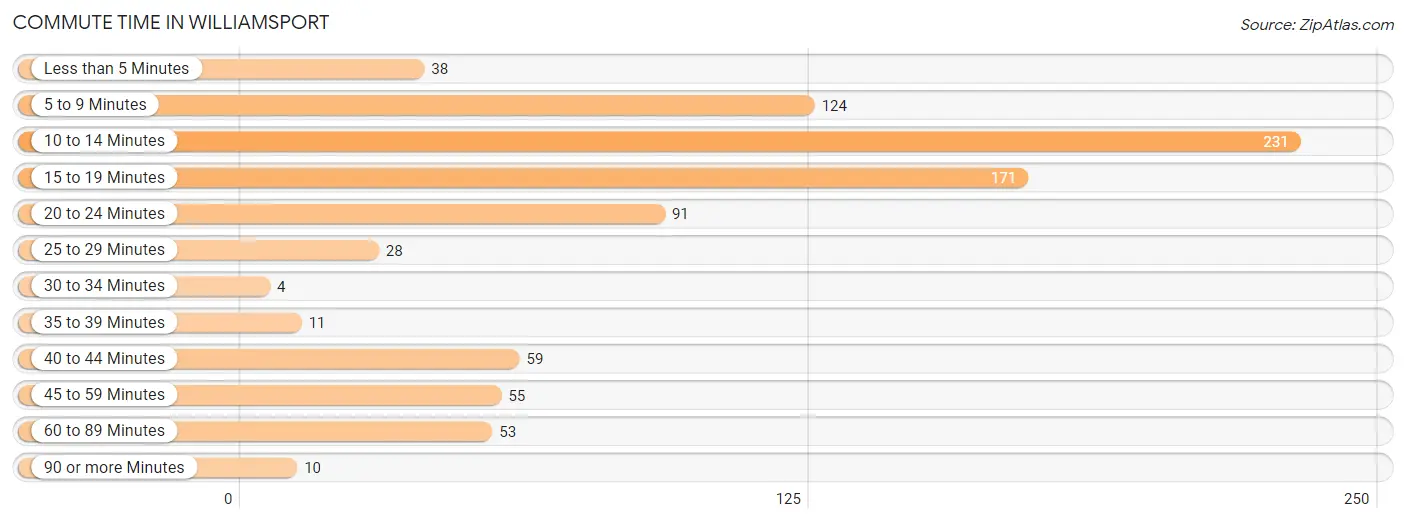
| Commute Time | # Commuters | % Commuters |
| Less than 5 Minutes | 38 | 4.3% |
| 5 to 9 Minutes | 124 | 14.2% |
| 10 to 14 Minutes | 231 | 26.4% |
| 15 to 19 Minutes | 171 | 19.5% |
| 20 to 24 Minutes | 91 | 10.4% |
| 25 to 29 Minutes | 28 | 3.2% |
| 30 to 34 Minutes | 4 | 0.5% |
| 35 to 39 Minutes | 11 | 1.3% |
| 40 to 44 Minutes | 59 | 6.7% |
| 45 to 59 Minutes | 55 | 6.3% |
| 60 to 89 Minutes | 53 | 6.1% |
| 90 or more Minutes | 10 | 1.1% |
Commute Time by Sex in Williamsport
The most common commute times in Williamsport are 10 to 14 minutes (113 commuters, 24.3%) for males and 10 to 14 minutes (118 commuters, 28.7%) for females.
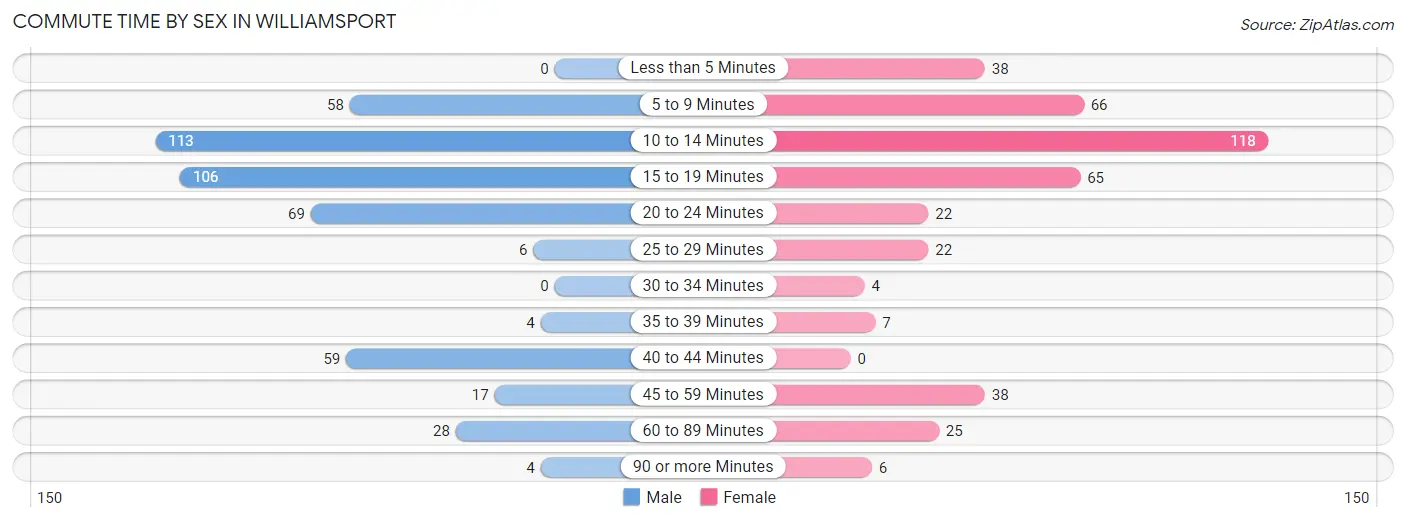
| Commute Time | Male | Female |
| Less than 5 Minutes | 0 (0.0%) | 38 (9.2%) |
| 5 to 9 Minutes | 58 (12.5%) | 66 (16.1%) |
| 10 to 14 Minutes | 113 (24.3%) | 118 (28.7%) |
| 15 to 19 Minutes | 106 (22.8%) | 65 (15.8%) |
| 20 to 24 Minutes | 69 (14.9%) | 22 (5.3%) |
| 25 to 29 Minutes | 6 (1.3%) | 22 (5.3%) |
| 30 to 34 Minutes | 0 (0.0%) | 4 (1.0%) |
| 35 to 39 Minutes | 4 (0.9%) | 7 (1.7%) |
| 40 to 44 Minutes | 59 (12.7%) | 0 (0.0%) |
| 45 to 59 Minutes | 17 (3.7%) | 38 (9.2%) |
| 60 to 89 Minutes | 28 (6.0%) | 25 (6.1%) |
| 90 or more Minutes | 4 (0.9%) | 6 (1.5%) |
Time of Departure to Work by Sex in Williamsport
The most frequent times of departure to work in Williamsport are 6:30 AM to 6:59 AM (110, 23.7%) for males and 8:00 AM to 8:29 AM (83, 20.2%) for females.
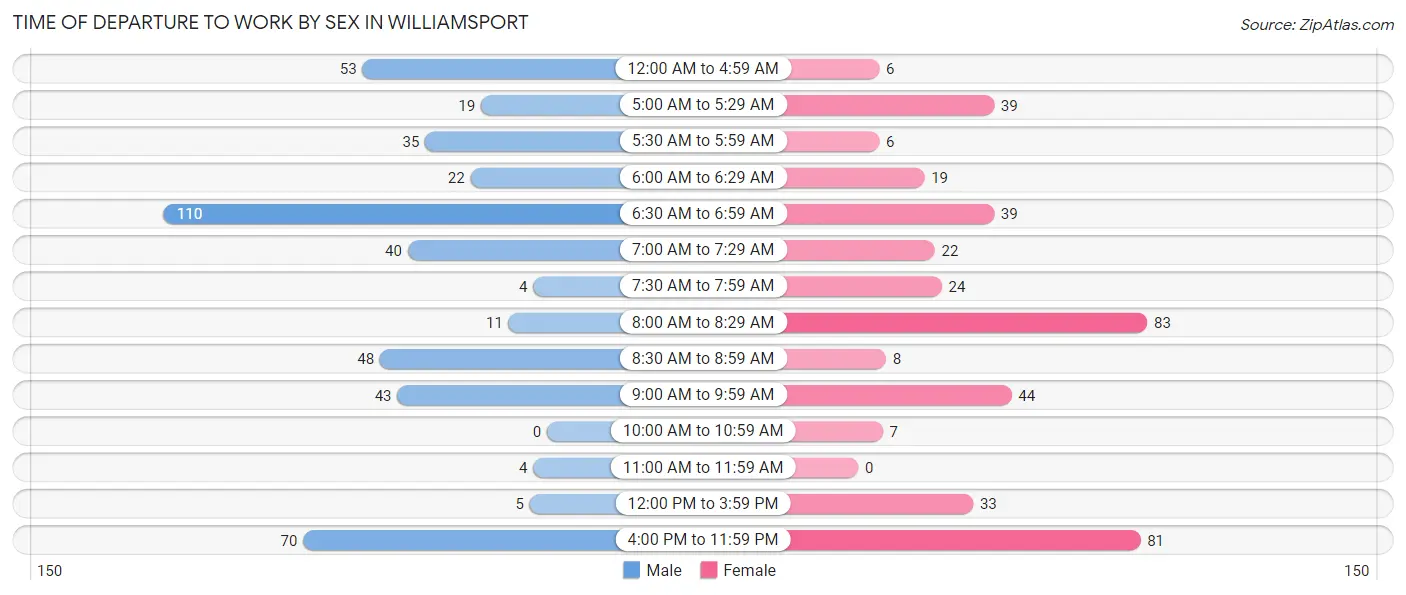
| Time of Departure | Male | Female |
| 12:00 AM to 4:59 AM | 53 (11.4%) | 6 (1.5%) |
| 5:00 AM to 5:29 AM | 19 (4.1%) | 39 (9.5%) |
| 5:30 AM to 5:59 AM | 35 (7.5%) | 6 (1.5%) |
| 6:00 AM to 6:29 AM | 22 (4.7%) | 19 (4.6%) |
| 6:30 AM to 6:59 AM | 110 (23.7%) | 39 (9.5%) |
| 7:00 AM to 7:29 AM | 40 (8.6%) | 22 (5.3%) |
| 7:30 AM to 7:59 AM | 4 (0.9%) | 24 (5.8%) |
| 8:00 AM to 8:29 AM | 11 (2.4%) | 83 (20.2%) |
| 8:30 AM to 8:59 AM | 48 (10.3%) | 8 (1.9%) |
| 9:00 AM to 9:59 AM | 43 (9.3%) | 44 (10.7%) |
| 10:00 AM to 10:59 AM | 0 (0.0%) | 7 (1.7%) |
| 11:00 AM to 11:59 AM | 4 (0.9%) | 0 (0.0%) |
| 12:00 PM to 3:59 PM | 5 (1.1%) | 33 (8.0%) |
| 4:00 PM to 11:59 PM | 70 (15.1%) | 81 (19.7%) |
| Total | 464 (100.0%) | 411 (100.0%) |
Housing Occupancy in Williamsport
Occupancy by Ownership in Williamsport
Of the total 865 dwellings in Williamsport, owner-occupied units account for 356 (41.2%), while renter-occupied units make up 509 (58.8%).
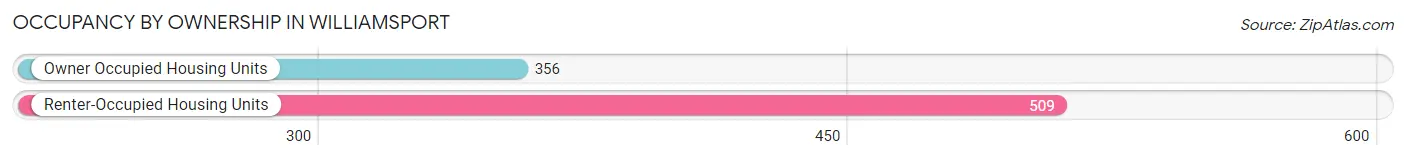
| Occupancy | # Housing Units | % Housing Units |
| Owner Occupied Housing Units | 356 | 41.2% |
| Renter-Occupied Housing Units | 509 | 58.8% |
| Total Occupied Housing Units | 865 | 100.0% |
Occupancy by Household Size in Williamsport
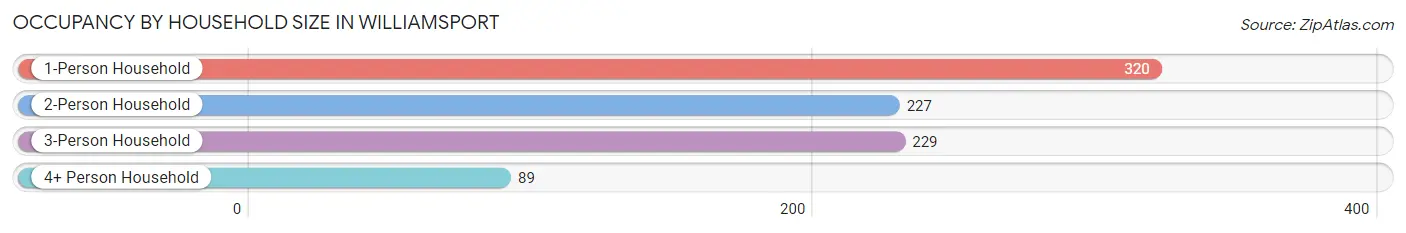
| Household Size | # Housing Units | % Housing Units |
| 1-Person Household | 320 | 37.0% |
| 2-Person Household | 227 | 26.2% |
| 3-Person Household | 229 | 26.5% |
| 4+ Person Household | 89 | 10.3% |
| Total Housing Units | 865 | 100.0% |
Occupancy by Ownership by Household Size in Williamsport
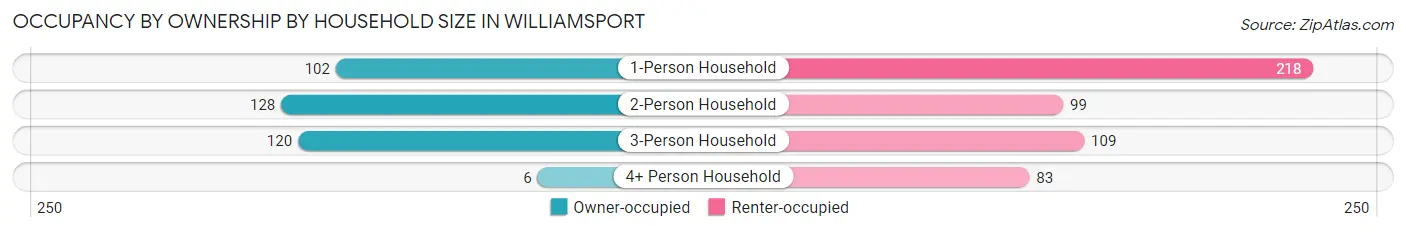
| Household Size | Owner-occupied | Renter-occupied |
| 1-Person Household | 102 (31.9%) | 218 (68.1%) |
| 2-Person Household | 128 (56.4%) | 99 (43.6%) |
| 3-Person Household | 120 (52.4%) | 109 (47.6%) |
| 4+ Person Household | 6 (6.7%) | 83 (93.3%) |
| Total Housing Units | 356 (41.2%) | 509 (58.8%) |
Occupancy by Educational Attainment in Williamsport
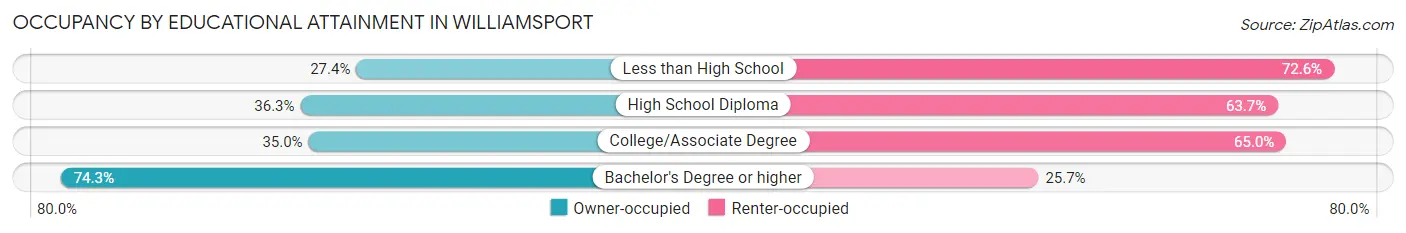
| Household Size | Owner-occupied | Renter-occupied |
| Less than High School | 20 (27.4%) | 53 (72.6%) |
| High School Diploma | 157 (36.3%) | 276 (63.7%) |
| College/Associate Degree | 78 (35.0%) | 145 (65.0%) |
| Bachelor's Degree or higher | 101 (74.3%) | 35 (25.7%) |
Occupancy by Age of Householder in Williamsport
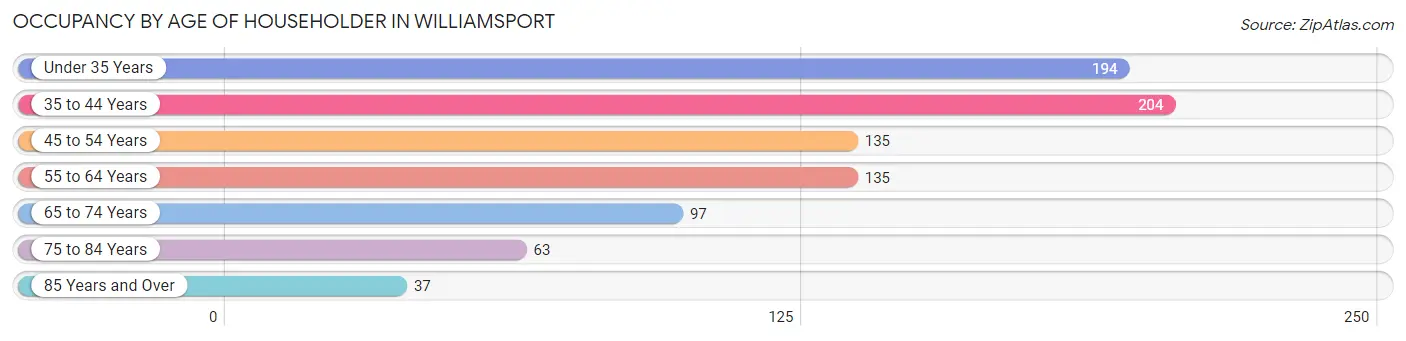
| Age Bracket | # Households | % Households |
| Under 35 Years | 194 | 22.4% |
| 35 to 44 Years | 204 | 23.6% |
| 45 to 54 Years | 135 | 15.6% |
| 55 to 64 Years | 135 | 15.6% |
| 65 to 74 Years | 97 | 11.2% |
| 75 to 84 Years | 63 | 7.3% |
| 85 Years and Over | 37 | 4.3% |
| Total | 865 | 100.0% |
Housing Finances in Williamsport
Median Income by Occupancy in Williamsport
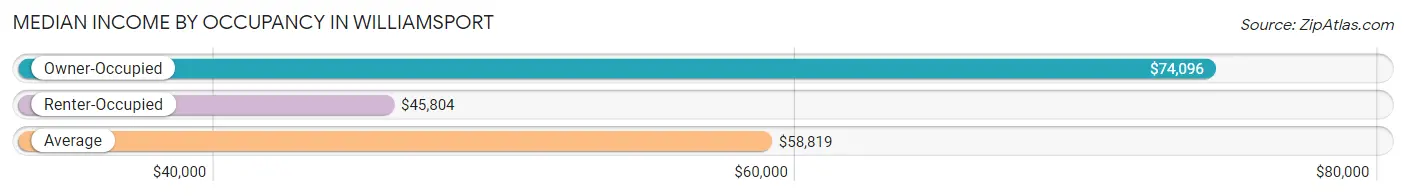
| Occupancy Type | # Households | Median Income |
| Owner-Occupied | 356 (41.2%) | $74,096 |
| Renter-Occupied | 509 (58.8%) | $45,804 |
| Average | 865 (100.0%) | $58,819 |
Occupancy by Householder Income Bracket in Williamsport
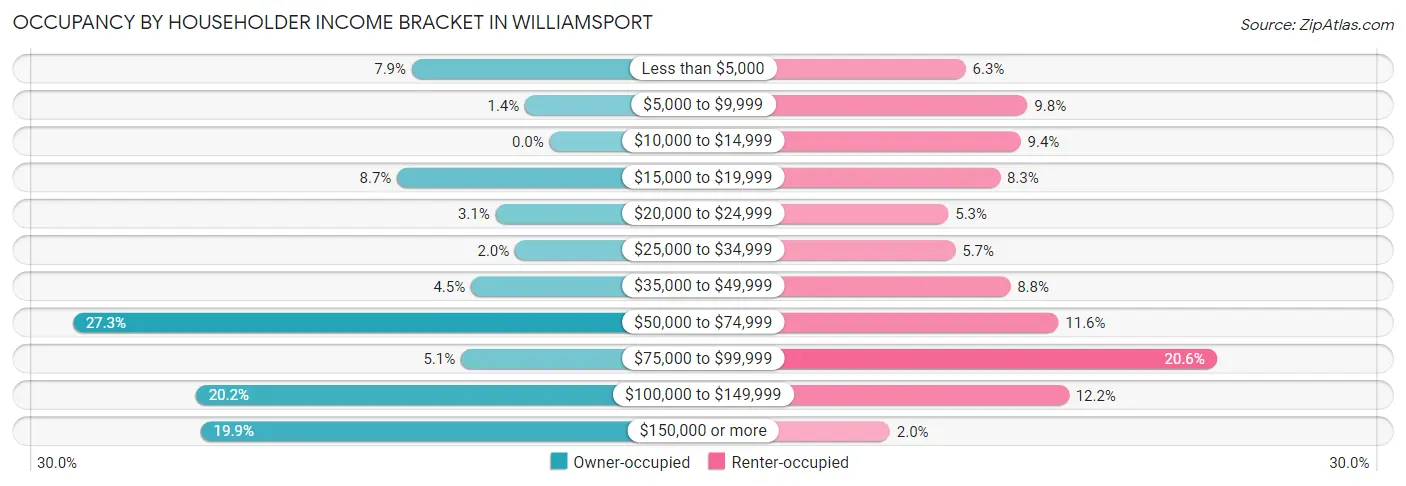
| Income Bracket | Owner-occupied | Renter-occupied |
| Less than $5,000 | 28 (7.9%) | 32 (6.3%) |
| $5,000 to $9,999 | 5 (1.4%) | 50 (9.8%) |
| $10,000 to $14,999 | 0 (0.0%) | 48 (9.4%) |
| $15,000 to $19,999 | 31 (8.7%) | 42 (8.3%) |
| $20,000 to $24,999 | 11 (3.1%) | 27 (5.3%) |
| $25,000 to $34,999 | 7 (2.0%) | 29 (5.7%) |
| $35,000 to $49,999 | 16 (4.5%) | 45 (8.8%) |
| $50,000 to $74,999 | 97 (27.3%) | 59 (11.6%) |
| $75,000 to $99,999 | 18 (5.1%) | 105 (20.6%) |
| $100,000 to $149,999 | 72 (20.2%) | 62 (12.2%) |
| $150,000 or more | 71 (19.9%) | 10 (2.0%) |
| Total | 356 (100.0%) | 509 (100.0%) |
Monthly Housing Cost Tiers in Williamsport
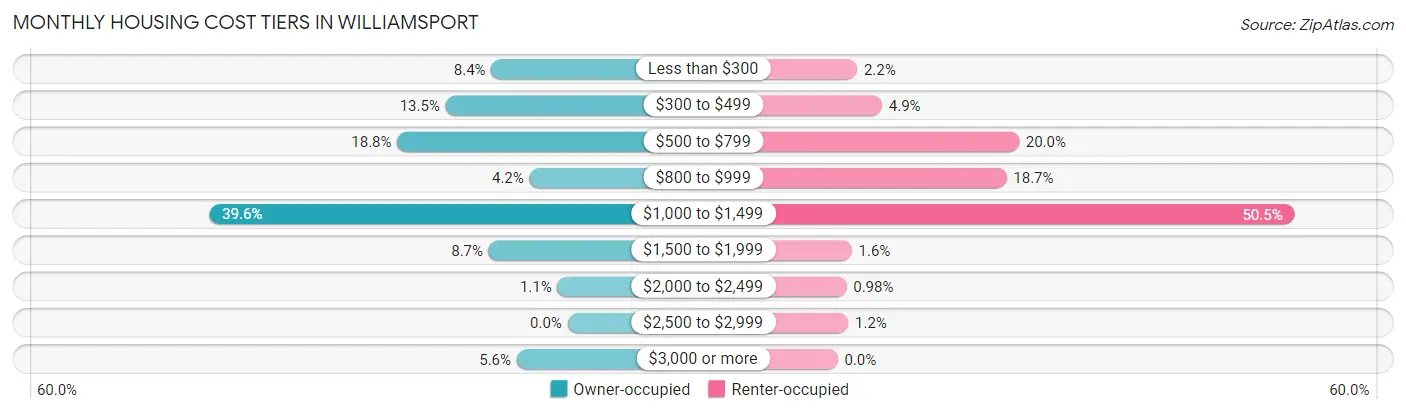
| Monthly Cost | Owner-occupied | Renter-occupied |
| Less than $300 | 30 (8.4%) | 11 (2.2%) |
| $300 to $499 | 48 (13.5%) | 25 (4.9%) |
| $500 to $799 | 67 (18.8%) | 102 (20.0%) |
| $800 to $999 | 15 (4.2%) | 95 (18.7%) |
| $1,000 to $1,499 | 141 (39.6%) | 257 (50.5%) |
| $1,500 to $1,999 | 31 (8.7%) | 8 (1.6%) |
| $2,000 to $2,499 | 4 (1.1%) | 5 (1.0%) |
| $2,500 to $2,999 | 0 (0.0%) | 6 (1.2%) |
| $3,000 or more | 20 (5.6%) | 0 (0.0%) |
| Total | 356 (100.0%) | 509 (100.0%) |
Physical Housing Characteristics in Williamsport
Housing Structures in Williamsport
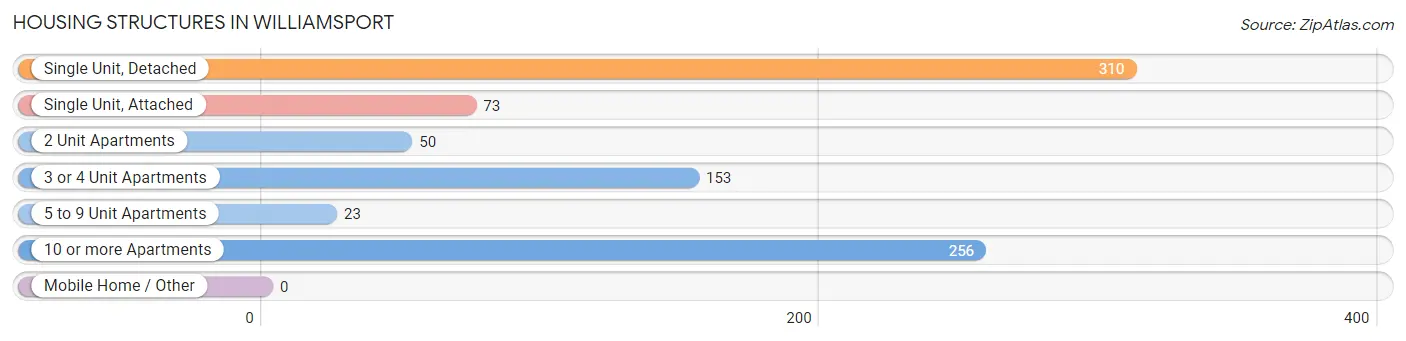
| Structure Type | # Housing Units | % Housing Units |
| Single Unit, Detached | 310 | 35.8% |
| Single Unit, Attached | 73 | 8.4% |
| 2 Unit Apartments | 50 | 5.8% |
| 3 or 4 Unit Apartments | 153 | 17.7% |
| 5 to 9 Unit Apartments | 23 | 2.7% |
| 10 or more Apartments | 256 | 29.6% |
| Mobile Home / Other | 0 | 0.0% |
| Total | 865 | 100.0% |
Housing Structures by Occupancy in Williamsport
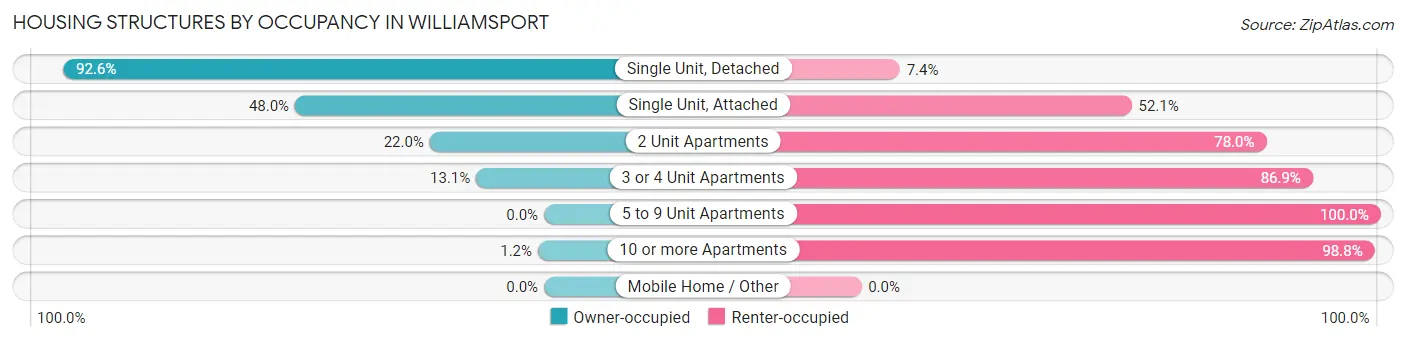
| Structure Type | Owner-occupied | Renter-occupied |
| Single Unit, Detached | 287 (92.6%) | 23 (7.4%) |
| Single Unit, Attached | 35 (47.9%) | 38 (52.0%) |
| 2 Unit Apartments | 11 (22.0%) | 39 (78.0%) |
| 3 or 4 Unit Apartments | 20 (13.1%) | 133 (86.9%) |
| 5 to 9 Unit Apartments | 0 (0.0%) | 23 (100.0%) |
| 10 or more Apartments | 3 (1.2%) | 253 (98.8%) |
| Mobile Home / Other | 0 (0.0%) | 0 (0.0%) |
| Total | 356 (41.2%) | 509 (58.8%) |
Housing Structures by Number of Rooms in Williamsport
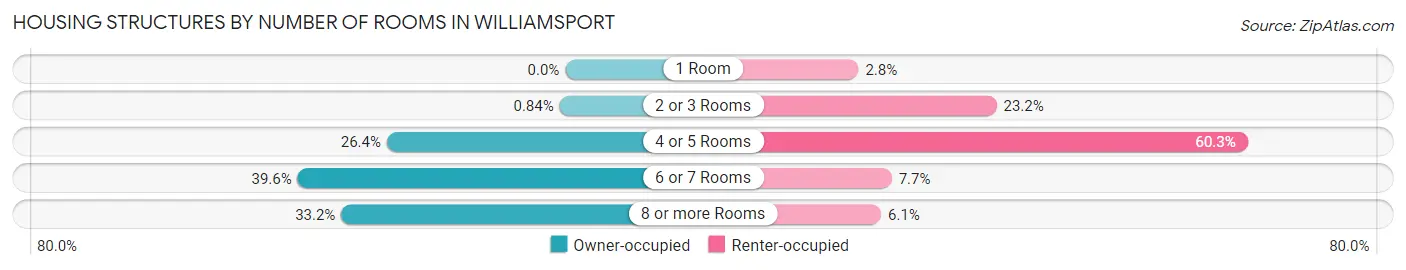
| Number of Rooms | Owner-occupied | Renter-occupied |
| 1 Room | 0 (0.0%) | 14 (2.8%) |
| 2 or 3 Rooms | 3 (0.8%) | 118 (23.2%) |
| 4 or 5 Rooms | 94 (26.4%) | 307 (60.3%) |
| 6 or 7 Rooms | 141 (39.6%) | 39 (7.7%) |
| 8 or more Rooms | 118 (33.2%) | 31 (6.1%) |
| Total | 356 (100.0%) | 509 (100.0%) |
Housing Structure by Heating Type in Williamsport
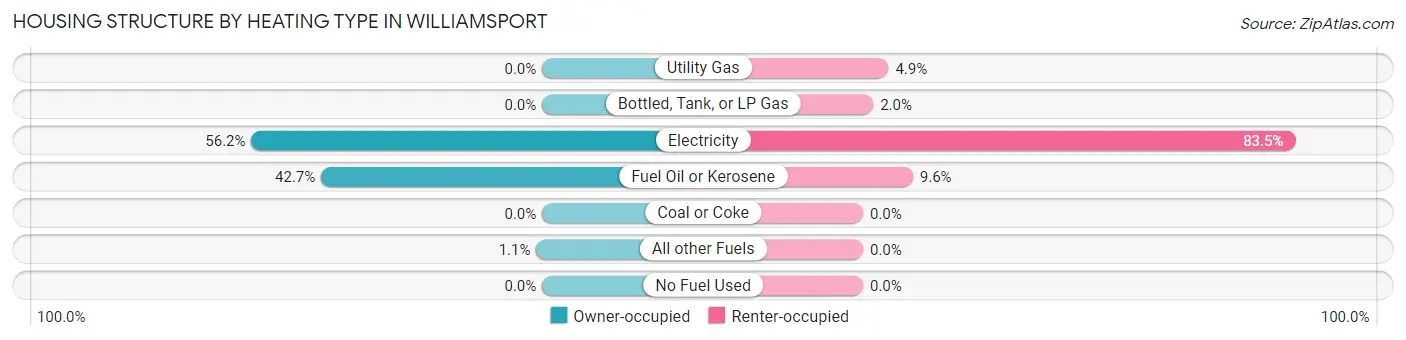
| Heating Type | Owner-occupied | Renter-occupied |
| Utility Gas | 0 (0.0%) | 25 (4.9%) |
| Bottled, Tank, or LP Gas | 0 (0.0%) | 10 (2.0%) |
| Electricity | 200 (56.2%) | 425 (83.5%) |
| Fuel Oil or Kerosene | 152 (42.7%) | 49 (9.6%) |
| Coal or Coke | 0 (0.0%) | 0 (0.0%) |
| All other Fuels | 4 (1.1%) | 0 (0.0%) |
| No Fuel Used | 0 (0.0%) | 0 (0.0%) |
| Total | 356 (100.0%) | 509 (100.0%) |
Household Vehicle Usage in Williamsport
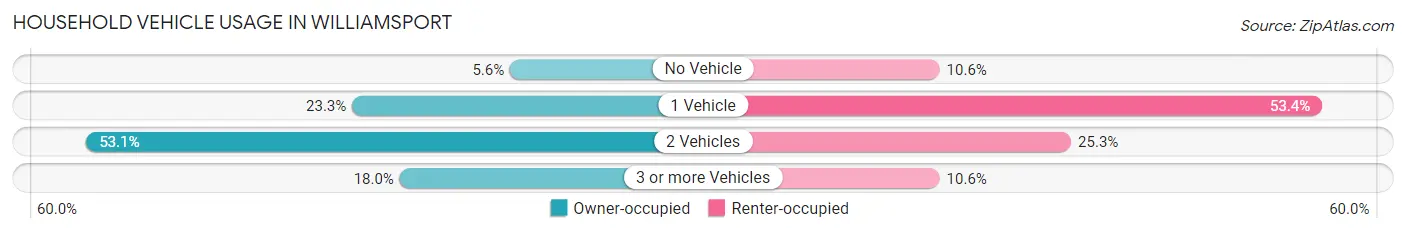
| Vehicles per Household | Owner-occupied | Renter-occupied |
| No Vehicle | 20 (5.6%) | 54 (10.6%) |
| 1 Vehicle | 83 (23.3%) | 272 (53.4%) |
| 2 Vehicles | 189 (53.1%) | 129 (25.3%) |
| 3 or more Vehicles | 64 (18.0%) | 54 (10.6%) |
| Total | 356 (100.0%) | 509 (100.0%) |
Real Estate & Mortgages in Williamsport
Real Estate and Mortgage Overview in Williamsport
| Characteristic | Without Mortgage | With Mortgage |
| Housing Units | 118 | 238 |
| Median Property Value | $155,000 | $224,700 |
| Median Household Income | $66,500 | $60 |
| Monthly Housing Costs | $470 | $20 |
| Real Estate Taxes | $2,060 | $0 |
Property Value by Mortgage Status in Williamsport
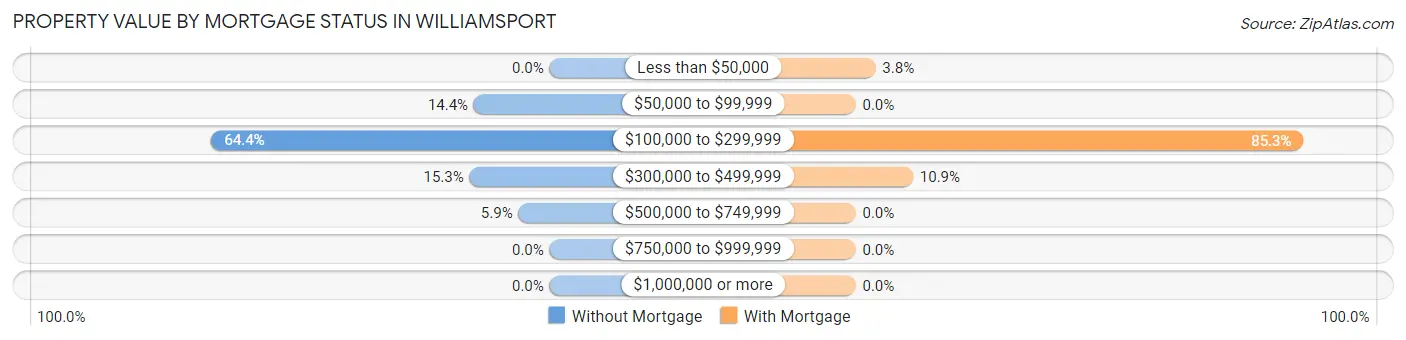
| Property Value | Without Mortgage | With Mortgage |
| Less than $50,000 | 0 (0.0%) | 9 (3.8%) |
| $50,000 to $99,999 | 17 (14.4%) | 0 (0.0%) |
| $100,000 to $299,999 | 76 (64.4%) | 203 (85.3%) |
| $300,000 to $499,999 | 18 (15.2%) | 26 (10.9%) |
| $500,000 to $749,999 | 7 (5.9%) | 0 (0.0%) |
| $750,000 to $999,999 | 0 (0.0%) | 0 (0.0%) |
| $1,000,000 or more | 0 (0.0%) | 0 (0.0%) |
| Total | 118 (100.0%) | 238 (100.0%) |
Household Income by Mortgage Status in Williamsport
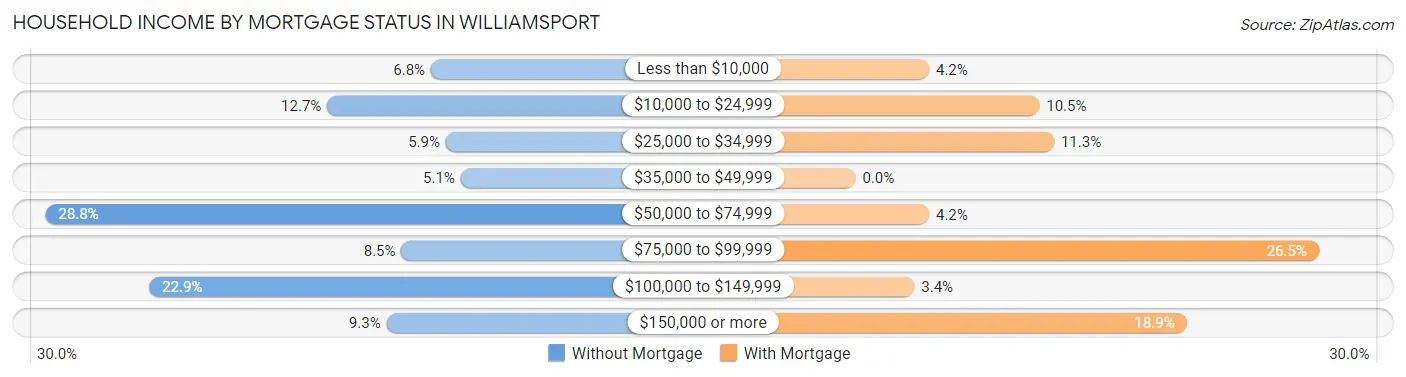
| Household Income | Without Mortgage | With Mortgage |
| Less than $10,000 | 8 (6.8%) | 10 (4.2%) |
| $10,000 to $24,999 | 15 (12.7%) | 25 (10.5%) |
| $25,000 to $34,999 | 7 (5.9%) | 27 (11.3%) |
| $35,000 to $49,999 | 6 (5.1%) | 0 (0.0%) |
| $50,000 to $74,999 | 34 (28.8%) | 10 (4.2%) |
| $75,000 to $99,999 | 10 (8.5%) | 63 (26.5%) |
| $100,000 to $149,999 | 27 (22.9%) | 8 (3.4%) |
| $150,000 or more | 11 (9.3%) | 45 (18.9%) |
| Total | 118 (100.0%) | 238 (100.0%) |
Property Value to Household Income Ratio in Williamsport
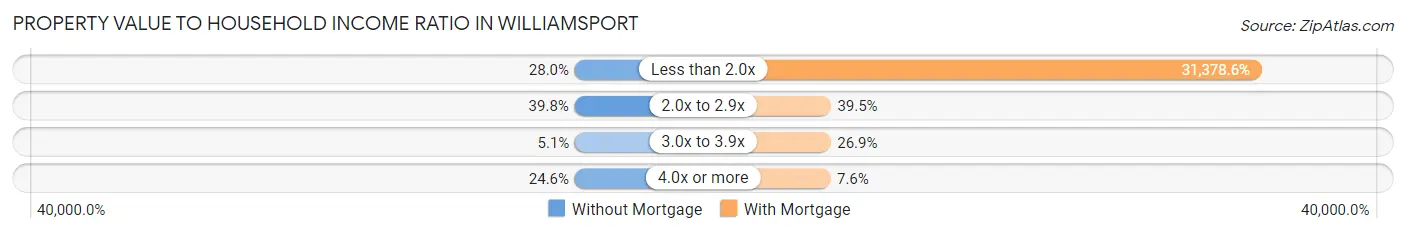
| Value-to-Income Ratio | Without Mortgage | With Mortgage |
| Less than 2.0x | 33 (28.0%) | 74,681 (31,378.6%) |
| 2.0x to 2.9x | 47 (39.8%) | 94 (39.5%) |
| 3.0x to 3.9x | 6 (5.1%) | 64 (26.9%) |
| 4.0x or more | 29 (24.6%) | 18 (7.6%) |
| Total | 118 (100.0%) | 238 (100.0%) |
Real Estate Taxes by Mortgage Status in Williamsport
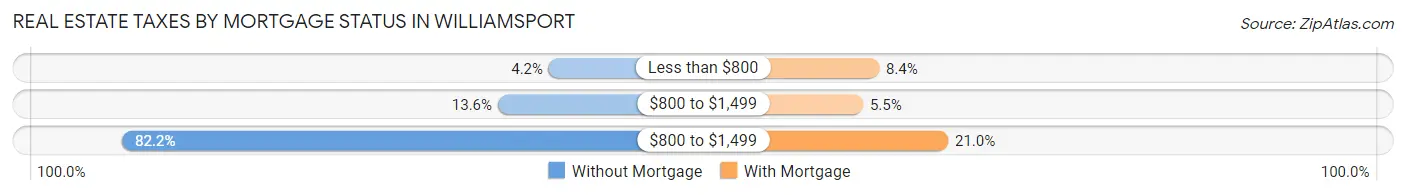
| Property Taxes | Without Mortgage | With Mortgage |
| Less than $800 | 5 (4.2%) | 20 (8.4%) |
| $800 to $1,499 | 16 (13.6%) | 13 (5.5%) |
| $800 to $1,499 | 97 (82.2%) | 50 (21.0%) |
| Total | 118 (100.0%) | 238 (100.0%) |
Health & Disability in Williamsport
Health Insurance Coverage by Age in Williamsport
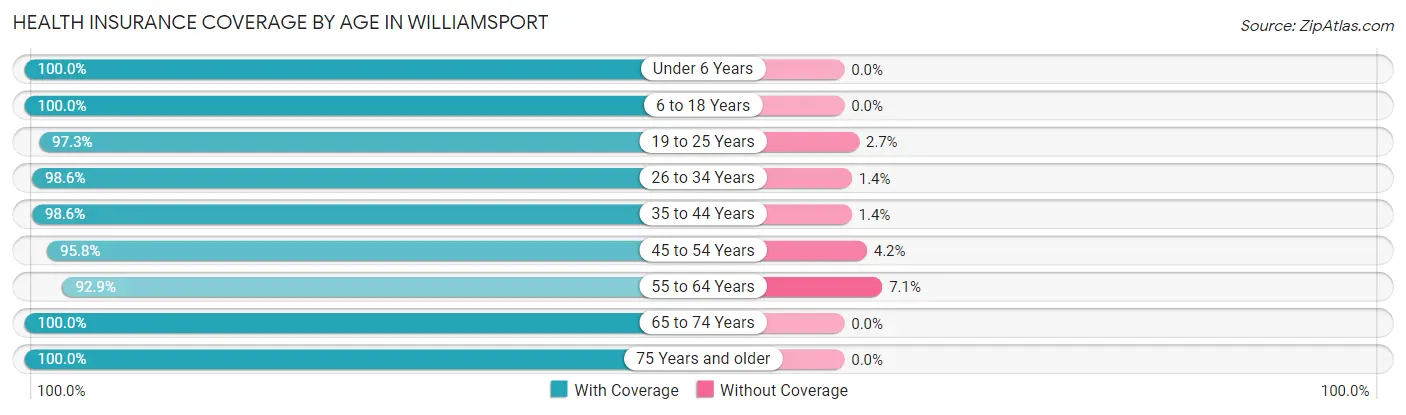
| Age Bracket | With Coverage | Without Coverage |
| Under 6 Years | 115 (100.0%) | 0 (0.0%) |
| 6 to 18 Years | 302 (100.0%) | 0 (0.0%) |
| 19 to 25 Years | 179 (97.3%) | 5 (2.7%) |
| 26 to 34 Years | 211 (98.6%) | 3 (1.4%) |
| 35 to 44 Years | 291 (98.6%) | 4 (1.4%) |
| 45 to 54 Years | 206 (95.8%) | 9 (4.2%) |
| 55 to 64 Years | 184 (92.9%) | 14 (7.1%) |
| 65 to 74 Years | 162 (100.0%) | 0 (0.0%) |
| 75 Years and older | 124 (100.0%) | 0 (0.0%) |
| Total | 1,774 (98.1%) | 35 (1.9%) |
Health Insurance Coverage by Citizenship Status in Williamsport
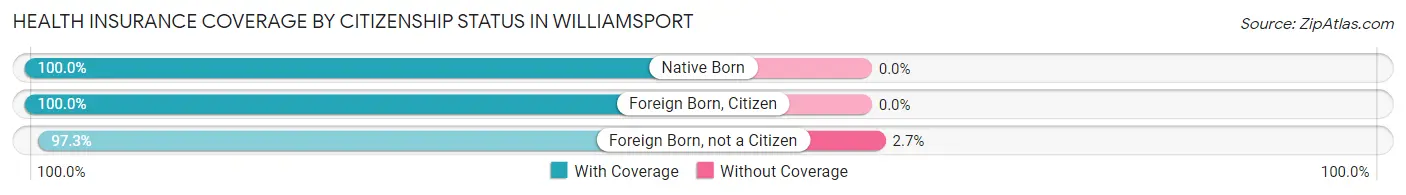
| Citizenship Status | With Coverage | Without Coverage |
| Native Born | 115 (100.0%) | 0 (0.0%) |
| Foreign Born, Citizen | 302 (100.0%) | 0 (0.0%) |
| Foreign Born, not a Citizen | 179 (97.3%) | 5 (2.7%) |
Health Insurance Coverage by Household Income in Williamsport
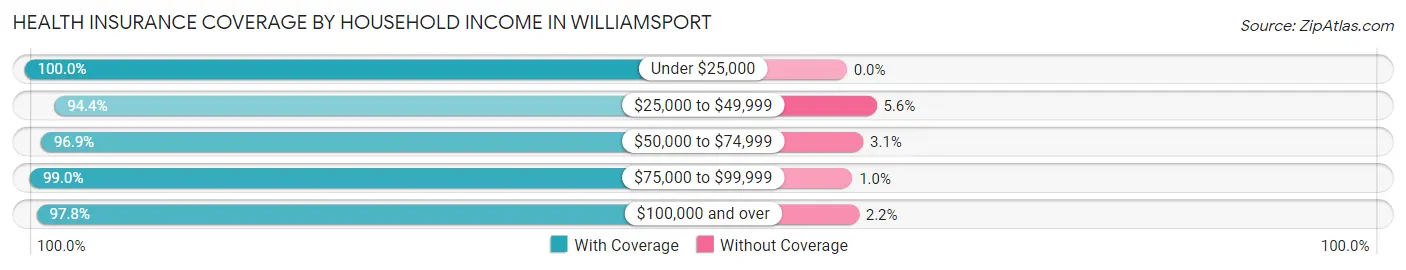
| Household Income | With Coverage | Without Coverage |
| Under $25,000 | 412 (100.0%) | 0 (0.0%) |
| $25,000 to $49,999 | 153 (94.4%) | 9 (5.6%) |
| $50,000 to $74,999 | 285 (96.9%) | 9 (3.1%) |
| $75,000 to $99,999 | 290 (99.0%) | 3 (1.0%) |
| $100,000 and over | 610 (97.8%) | 14 (2.2%) |
Public vs Private Health Insurance Coverage by Age in Williamsport
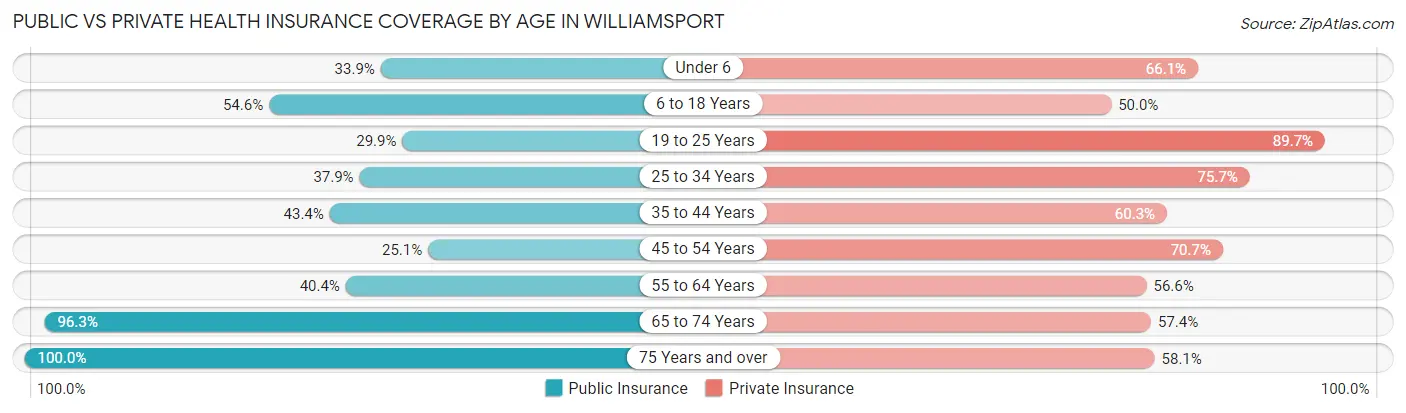
| Age Bracket | Public Insurance | Private Insurance |
| Under 6 | 39 (33.9%) | 76 (66.1%) |
| 6 to 18 Years | 165 (54.6%) | 151 (50.0%) |
| 19 to 25 Years | 55 (29.9%) | 165 (89.7%) |
| 25 to 34 Years | 81 (37.9%) | 162 (75.7%) |
| 35 to 44 Years | 128 (43.4%) | 178 (60.3%) |
| 45 to 54 Years | 54 (25.1%) | 152 (70.7%) |
| 55 to 64 Years | 80 (40.4%) | 112 (56.6%) |
| 65 to 74 Years | 156 (96.3%) | 93 (57.4%) |
| 75 Years and over | 124 (100.0%) | 72 (58.1%) |
| Total | 882 (48.8%) | 1,161 (64.2%) |
Disability Status by Sex by Age in Williamsport
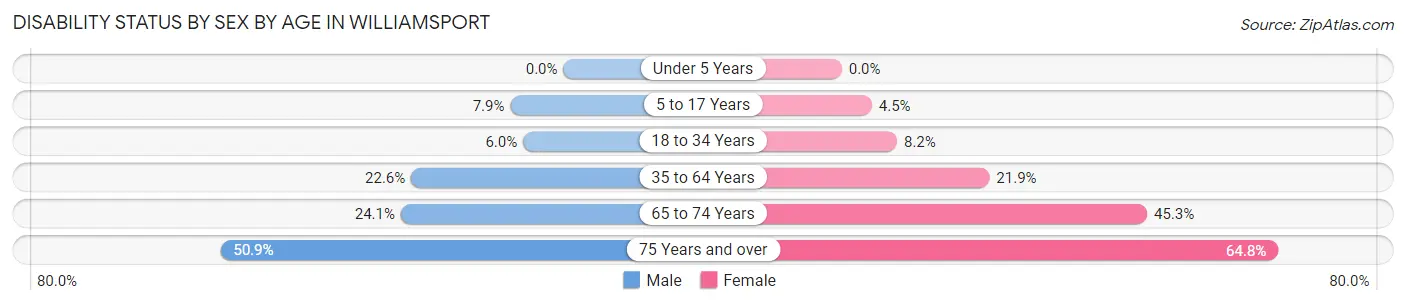
| Age Bracket | Male | Female |
| Under 5 Years | 0 (0.0%) | 0 (0.0%) |
| 5 to 17 Years | 13 (7.9%) | 5 (4.5%) |
| 18 to 34 Years | 18 (6.0%) | 10 (8.2%) |
| 35 to 64 Years | 59 (22.6%) | 98 (21.9%) |
| 65 to 74 Years | 21 (24.1%) | 34 (45.3%) |
| 75 Years and over | 27 (50.9%) | 46 (64.8%) |
Disability Class by Sex by Age in Williamsport
Disability Class: Hearing Difficulty
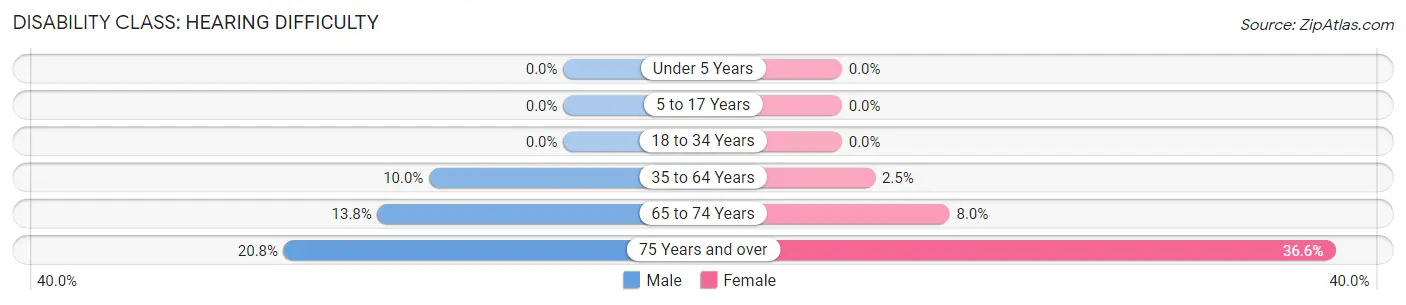
| Age Bracket | Male | Female |
| Under 5 Years | 0 (0.0%) | 0 (0.0%) |
| 5 to 17 Years | 0 (0.0%) | 0 (0.0%) |
| 18 to 34 Years | 0 (0.0%) | 0 (0.0%) |
| 35 to 64 Years | 26 (10.0%) | 11 (2.5%) |
| 65 to 74 Years | 12 (13.8%) | 6 (8.0%) |
| 75 Years and over | 11 (20.7%) | 26 (36.6%) |
Disability Class: Vision Difficulty
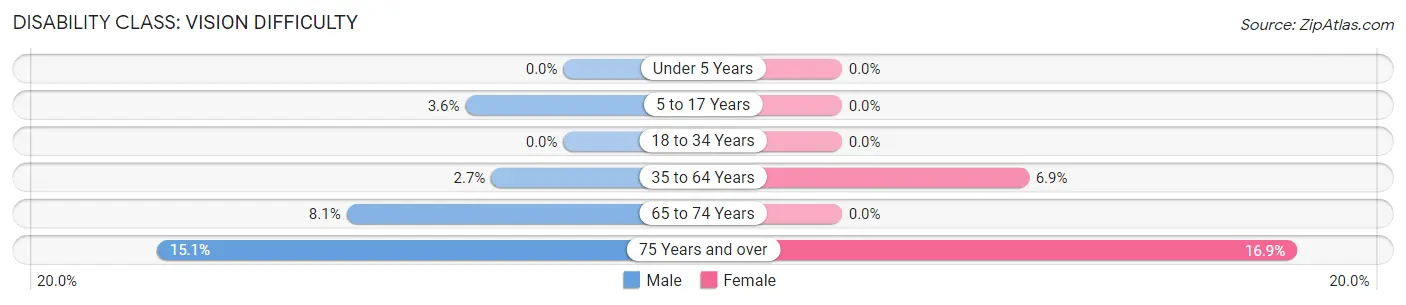
| Age Bracket | Male | Female |
| Under 5 Years | 0 (0.0%) | 0 (0.0%) |
| 5 to 17 Years | 6 (3.6%) | 0 (0.0%) |
| 18 to 34 Years | 0 (0.0%) | 0 (0.0%) |
| 35 to 64 Years | 7 (2.7%) | 31 (6.9%) |
| 65 to 74 Years | 7 (8.1%) | 0 (0.0%) |
| 75 Years and over | 8 (15.1%) | 12 (16.9%) |
Disability Class: Cognitive Difficulty
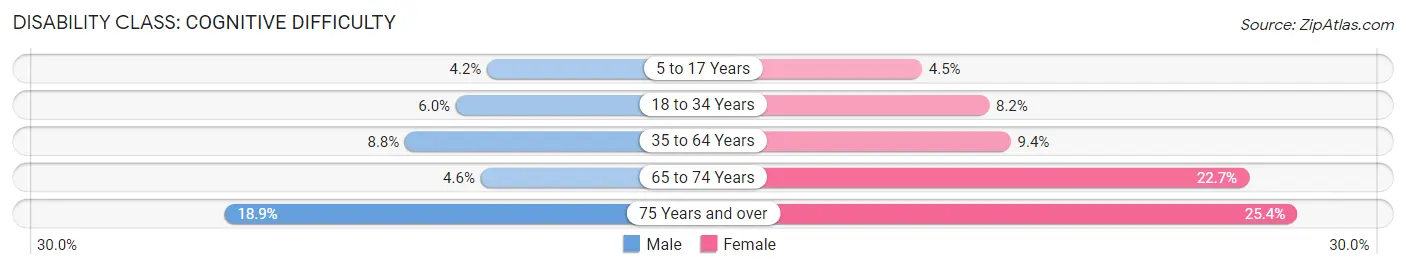
| Age Bracket | Male | Female |
| 5 to 17 Years | 7 (4.2%) | 5 (4.5%) |
| 18 to 34 Years | 18 (6.0%) | 10 (8.2%) |
| 35 to 64 Years | 23 (8.8%) | 42 (9.4%) |
| 65 to 74 Years | 4 (4.6%) | 17 (22.7%) |
| 75 Years and over | 10 (18.9%) | 18 (25.4%) |
Disability Class: Ambulatory Difficulty
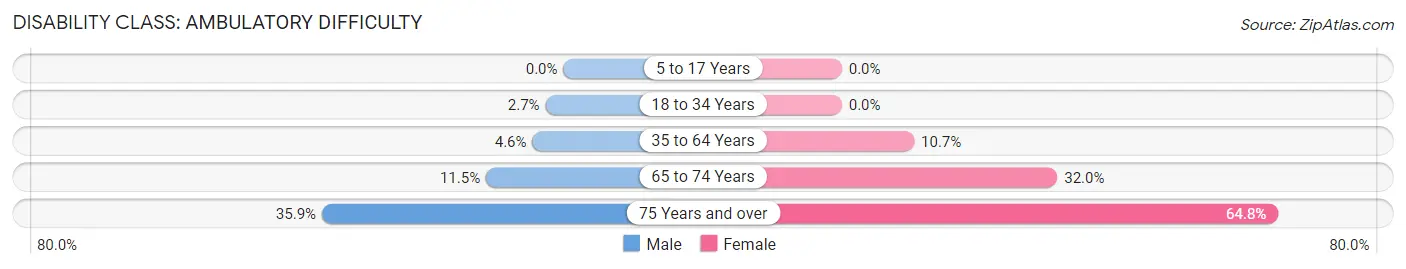
| Age Bracket | Male | Female |
| 5 to 17 Years | 0 (0.0%) | 0 (0.0%) |
| 18 to 34 Years | 8 (2.7%) | 0 (0.0%) |
| 35 to 64 Years | 12 (4.6%) | 48 (10.7%) |
| 65 to 74 Years | 10 (11.5%) | 24 (32.0%) |
| 75 Years and over | 19 (35.8%) | 46 (64.8%) |
Disability Class: Self-Care Difficulty
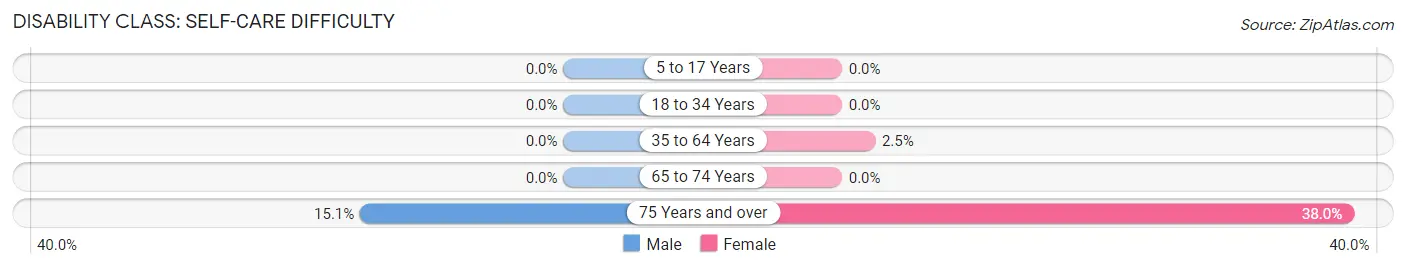
| Age Bracket | Male | Female |
| 5 to 17 Years | 0 (0.0%) | 0 (0.0%) |
| 18 to 34 Years | 0 (0.0%) | 0 (0.0%) |
| 35 to 64 Years | 0 (0.0%) | 11 (2.5%) |
| 65 to 74 Years | 0 (0.0%) | 0 (0.0%) |
| 75 Years and over | 8 (15.1%) | 27 (38.0%) |
Technology Access in Williamsport
Computing Device Access in Williamsport
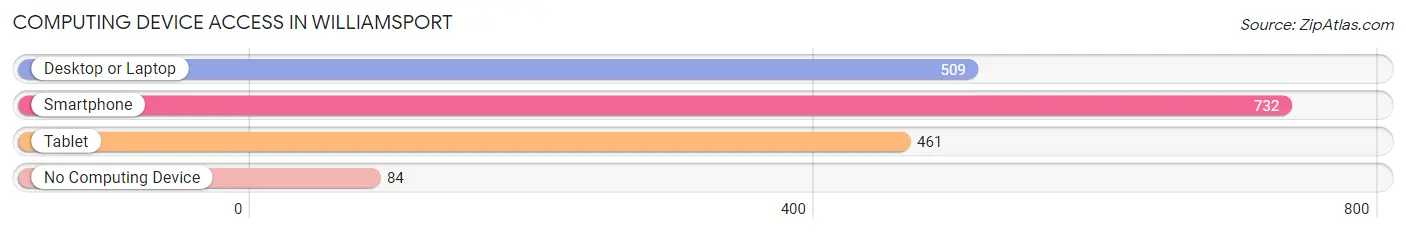
| Device Type | # Households | % Households |
| Desktop or Laptop | 509 | 58.8% |
| Smartphone | 732 | 84.6% |
| Tablet | 461 | 53.3% |
| No Computing Device | 84 | 9.7% |
| Total | 865 | 100.0% |
Internet Access in Williamsport
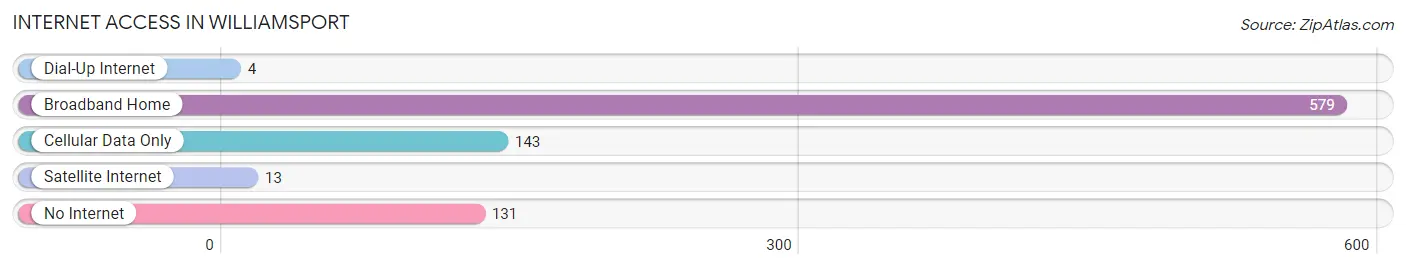
| Internet Type | # Households | % Households |
| Dial-Up Internet | 4 | 0.5% |
| Broadband Home | 579 | 66.9% |
| Cellular Data Only | 143 | 16.5% |
| Satellite Internet | 13 | 1.5% |
| No Internet | 131 | 15.1% |
| Total | 865 | 100.0% |
Williamsport Summary
Williamsport, Maryland is a small town located in Washington County, Maryland. It is situated along the Potomac River, just north of Hagerstown. The town has a population of approximately 2,000 people and is part of the Hagerstown-Martinsburg Metropolitan Statistical Area.
History
Williamsport was founded in 1792 by John Williams, a Revolutionary War veteran. He purchased the land from the local Native Americans and named the town after himself. The town was incorporated in 1802 and quickly became a thriving port town. It was a major stop on the Chesapeake and Ohio Canal, which connected the Potomac River to the Ohio River. The canal was a major transportation route for goods and people, and Williamsport was a major hub for the canal.
The town was also a major stop on the Baltimore and Ohio Railroad, which connected the east coast to the Midwest. The railroad was a major factor in the growth of the town, and it was the first town in Washington County to have a railroad station.
The town was also home to a number of industries, including a flour mill, a sawmill, a brickyard, and a tannery. The town was also home to a number of churches, including the Methodist Episcopal Church, the Presbyterian Church, and the Episcopal Church.
Geography
Williamsport is located in Washington County, Maryland, along the Potomac River. It is situated just north of Hagerstown and is part of the Hagerstown-Martinsburg Metropolitan Statistical Area. The town is located in a rural area and is surrounded by farmland and forests. The town is located at an elevation of approximately 500 feet above sea level.
The climate in Williamsport is humid subtropical, with hot, humid summers and cold, wet winters. The average temperature in the summer is around 80 degrees Fahrenheit, and the average temperature in the winter is around 40 degrees Fahrenheit.
Economy
Williamsport’s economy is largely based on agriculture and tourism. The town is home to a number of farms, which produce a variety of crops, including corn, soybeans, wheat, and hay. The town is also home to a number of tourist attractions, including the C&O Canal National Historic Park, the Williamsport Historic District, and the Williamsport Visitor Center.
The town is also home to a number of businesses, including restaurants, retail stores, and professional services. The town is also home to a number of manufacturing companies, including a furniture manufacturer, a plastics manufacturer, and a printing company.
Demographics
As of the 2010 census, the population of Williamsport was 2,000. The racial makeup of the town was 95.2% White, 1.7% African American, 0.3% Native American, 0.7% Asian, 0.1% Pacific Islander, 0.7% from other races, and 1.2% from two or more races. Hispanic or Latino of any race were 1.7% of the population.
The median household income in Williamsport was $45,000, and the median family income was $50,000. The per capita income in the town was $20,000. About 10.2% of the population was below the poverty line.
Williamsport is a small town with a rich history and a vibrant economy. It is home to a number of farms, businesses, and tourist attractions, and it is a great place to live and work.
Common Questions
What is Per Capita Income in Williamsport?
Per Capita income in Williamsport is $33,899.
What is the Median Family Income in Williamsport?
Median Family Income in Williamsport is $68,777.
What is the Median Household income in Williamsport?
Median Household Income in Williamsport is $58,819.
What is Income or Wage Gap in Williamsport?
Income or Wage Gap in Williamsport is 2.4%.
Women in Williamsport earn 97.6 cents for every dollar earned by a man.
What is Inequality or Gini Index in Williamsport?
Inequality or Gini Index in Williamsport is 0.46.
What is the Total Population of Williamsport?
Total Population of Williamsport is 1,915.
What is the Total Male Population of Williamsport?
Total Male Population of Williamsport is 925.
What is the Total Female Population of Williamsport?
Total Female Population of Williamsport is 990.
What is the Ratio of Males per 100 Females in Williamsport?
There are 93.43 Males per 100 Females in Williamsport.
What is the Ratio of Females per 100 Males in Williamsport?
There are 107.03 Females per 100 Males in Williamsport.
What is the Median Population Age in Williamsport?
Median Population Age in Williamsport is 40.0 Years.
What is the Average Family Size in Williamsport
Average Family Size in Williamsport is 2.6 People.
What is the Average Household Size in Williamsport
Average Household Size in Williamsport is 2.1 People.
How Large is the Labor Force in Williamsport?
There are 922 People in the Labor Forcein in Williamsport.
What is the Percentage of People in the Labor Force in Williamsport?
58.6% of People are in the Labor Force in Williamsport.
What is the Unemployment Rate in Williamsport?
Unemployment Rate in Williamsport is 4.1%.