Westernport, MD Map & Demographics
Westernport Map
Westernport Overview
$29,406
PER CAPITA INCOME
$56,691
AVG FAMILY INCOME
$50,938
AVG HOUSEHOLD INCOME
57.2%
WAGE / INCOME GAP [ % ]
42.8¢/ $1
WAGE / INCOME GAP [ $ ]
$17,123
FAMILY INCOME DEFICIT
0.49
INEQUALITY / GINI INDEX
1,993
TOTAL POPULATION
922
MALE POPULATION
1,071
FEMALE POPULATION
86.09
MALES / 100 FEMALES
116.16
FEMALES / 100 MALES
37.5
MEDIAN AGE
3.0
AVG FAMILY SIZE
2.5
AVG HOUSEHOLD SIZE
822
LABOR FORCE [ PEOPLE ]
52.8%
PERCENT IN LABOR FORCE
6.1%
UNEMPLOYMENT RATE
Westernport Zip Codes
Income in Westernport
Income Overview in Westernport
Per Capita Income in Westernport is $29,406, while median incomes of families and households are $56,691 and $50,938 respectively.
| Characteristic | Number | Measure |
| Per Capita Income | 1,993 | $29,406 |
| Median Family Income | 525 | $56,691 |
| Mean Family Income | 525 | $66,891 |
| Median Household Income | 786 | $50,938 |
| Mean Household Income | 786 | $72,814 |
| Income Deficit | 525 | $17,123 |
| Wage / Income Gap (%) | 1,993 | 57.18% |
| Wage / Income Gap ($) | 1,993 | 42.82¢ per $1 |
| Gini / Inequality Index | 1,993 | 0.49 |
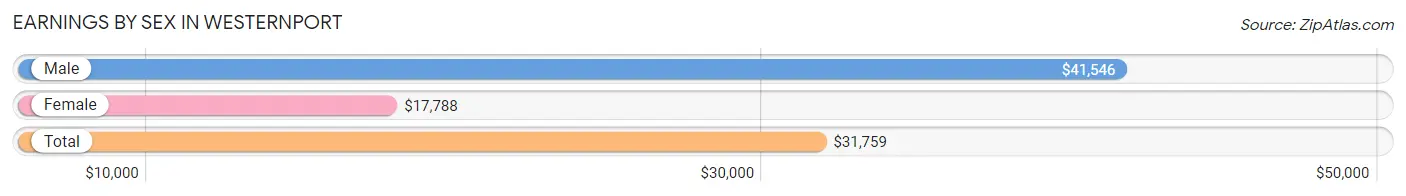
Earnings by Sex in Westernport
Average Earnings in Westernport are $31,759, $41,546 for men and $17,788 for women, a difference of 57.2%.
| Sex | Number | Average Earnings |
| Male | 453 (52.9%) | $41,546 |
| Female | 403 (47.1%) | $17,788 |
| Total | 856 (100.0%) | $31,759 |
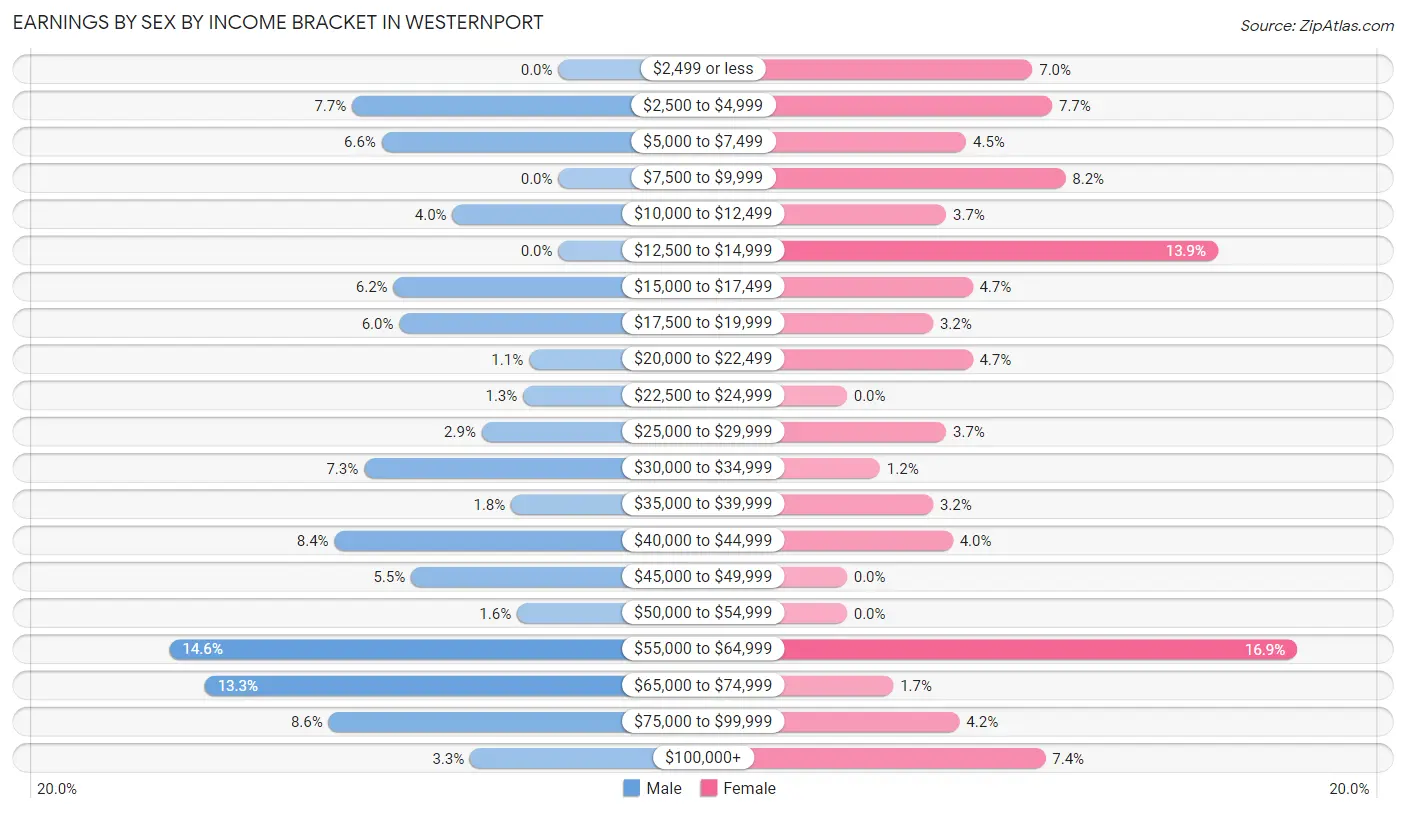
Earnings by Sex by Income Bracket in Westernport
The most common earnings brackets in Westernport are $55,000 to $64,999 for men (66 | 14.6%) and $55,000 to $64,999 for women (68 | 16.9%).
| Income | Male | Female |
| $2,499 or less | 0 (0.0%) | 28 (7.0%) |
| $2,500 to $4,999 | 35 (7.7%) | 31 (7.7%) |
| $5,000 to $7,499 | 30 (6.6%) | 18 (4.5%) |
| $7,500 to $9,999 | 0 (0.0%) | 33 (8.2%) |
| $10,000 to $12,499 | 18 (4.0%) | 15 (3.7%) |
| $12,500 to $14,999 | 0 (0.0%) | 56 (13.9%) |
| $15,000 to $17,499 | 28 (6.2%) | 19 (4.7%) |
| $17,500 to $19,999 | 27 (6.0%) | 13 (3.2%) |
| $20,000 to $22,499 | 5 (1.1%) | 19 (4.7%) |
| $22,500 to $24,999 | 6 (1.3%) | 0 (0.0%) |
| $25,000 to $29,999 | 13 (2.9%) | 15 (3.7%) |
| $30,000 to $34,999 | 33 (7.3%) | 5 (1.2%) |
| $35,000 to $39,999 | 8 (1.8%) | 13 (3.2%) |
| $40,000 to $44,999 | 38 (8.4%) | 16 (4.0%) |
| $45,000 to $49,999 | 25 (5.5%) | 0 (0.0%) |
| $50,000 to $54,999 | 7 (1.5%) | 0 (0.0%) |
| $55,000 to $64,999 | 66 (14.6%) | 68 (16.9%) |
| $65,000 to $74,999 | 60 (13.3%) | 7 (1.7%) |
| $75,000 to $99,999 | 39 (8.6%) | 17 (4.2%) |
| $100,000+ | 15 (3.3%) | 30 (7.4%) |
| Total | 453 (100.0%) | 403 (100.0%) |
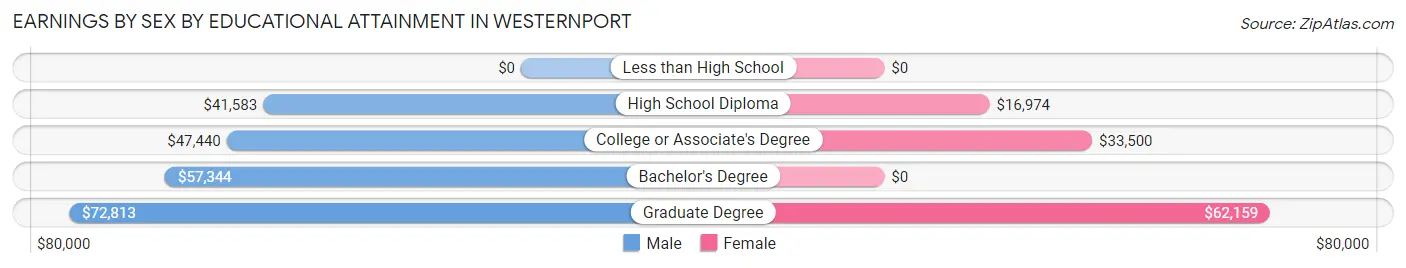
Earnings by Sex by Educational Attainment in Westernport
Average earnings in Westernport are $56,042 for men and $40,313 for women, a difference of 28.1%. Men with an educational attainment of graduate degree enjoy the highest average annual earnings of $72,813, while those with high school diploma education earn the least with $41,583. Women with an educational attainment of graduate degree earn the most with the average annual earnings of $62,159, while those with high school diploma education have the smallest earnings of $16,974.
| Educational Attainment | Male Income | Female Income |
| Less than High School | - | - |
| High School Diploma | $41,583 | $16,974 |
| College or Associate's Degree | $47,440 | $33,500 |
| Bachelor's Degree | $57,344 | $0 |
| Graduate Degree | $72,813 | $62,159 |
| Total | $56,042 | $40,313 |
Family Income in Westernport
Family Income Brackets in Westernport
According to the Westernport family income data, there are 138 families falling into the $50,000 to $74,999 income range, which is the most common income bracket and makes up 26.3% of all families. Conversely, the $200,000+ income bracket is the least frequent group with only 14 families (2.7%) belonging to this category.
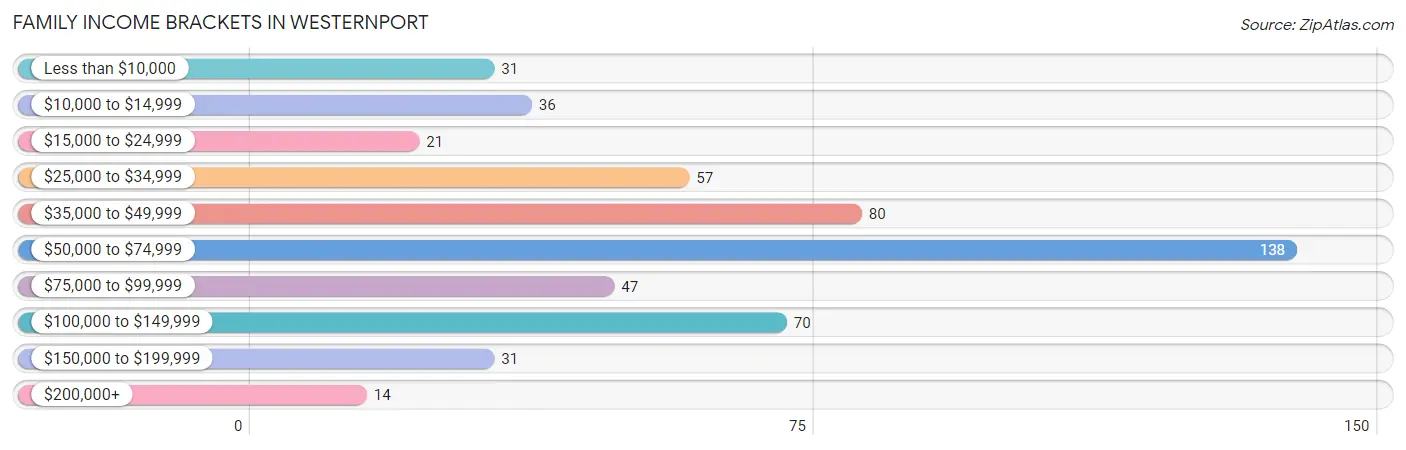
| Income Bracket | # Families | % Families |
| Less than $10,000 | 31 | 5.9% |
| $10,000 to $14,999 | 36 | 6.9% |
| $15,000 to $24,999 | 21 | 4.0% |
| $25,000 to $34,999 | 57 | 10.9% |
| $35,000 to $49,999 | 80 | 15.2% |
| $50,000 to $74,999 | 138 | 26.3% |
| $75,000 to $99,999 | 47 | 9.0% |
| $100,000 to $149,999 | 70 | 13.3% |
| $150,000 to $199,999 | 31 | 5.9% |
| $200,000+ | 14 | 2.7% |
Family Income by Famaliy Size in Westernport
3-person families (134 | 25.5%) account for the highest median family income in Westernport with $59,741 per family, while 2-person families (222 | 42.3%) have the highest median income of $27,250 per family member.
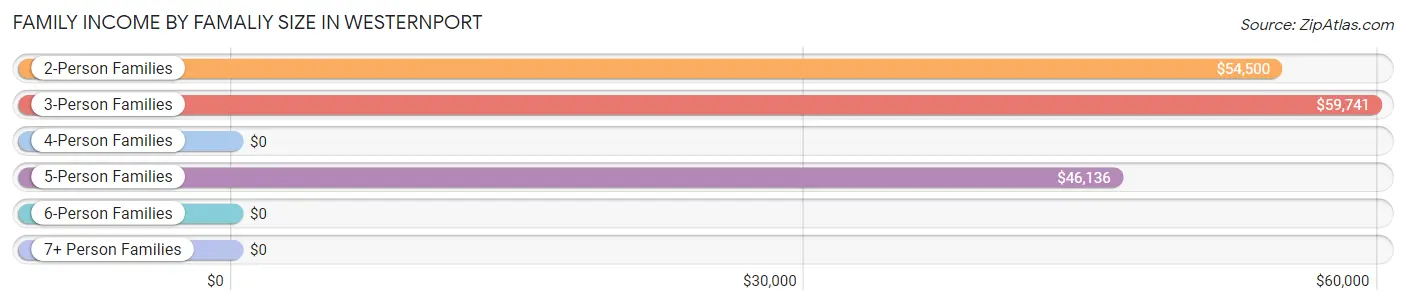
| Income Bracket | # Families | Median Income |
| 2-Person Families | 222 (42.3%) | $54,500 |
| 3-Person Families | 134 (25.5%) | $59,741 |
| 4-Person Families | 122 (23.2%) | $0 |
| 5-Person Families | 38 (7.2%) | $46,136 |
| 6-Person Families | 0 (0.0%) | $0 |
| 7+ Person Families | 9 (1.7%) | $0 |
| Total | 525 (100.0%) | $56,691 |
Family Income by Number of Earners in Westernport
The median family income in Westernport is $56,691, with families comprising 3+ earners (29) having the highest median family income of $83,516, while families with 1 earner (307) have the lowest median family income of $41,844, accounting for 5.5% and 58.5% of families, respectively.
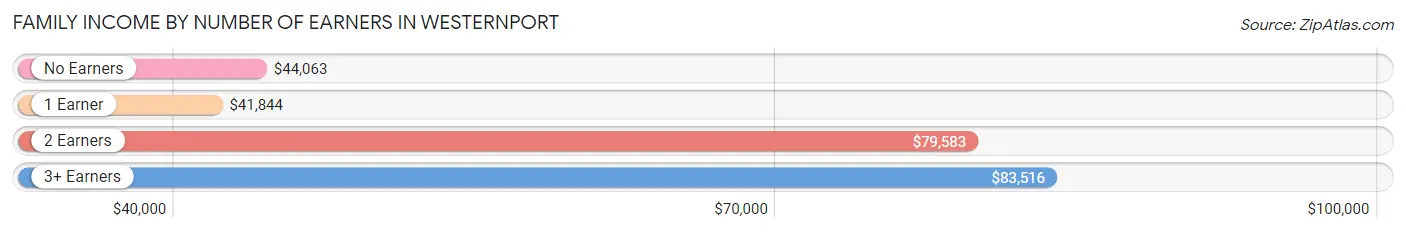
| Number of Earners | # Families | Median Income |
| No Earners | 61 (11.6%) | $44,063 |
| 1 Earner | 307 (58.5%) | $41,844 |
| 2 Earners | 128 (24.4%) | $79,583 |
| 3+ Earners | 29 (5.5%) | $83,516 |
| Total | 525 (100.0%) | $56,691 |
Household Income in Westernport
Household Income Brackets in Westernport
With 164 households falling in the category, the $50,000 to $74,999 income range is the most frequent in Westernport, accounting for 20.9% of all households. In contrast, only 19 households (2.4%) fall into the $200,000+ income bracket, making it the least populous group.
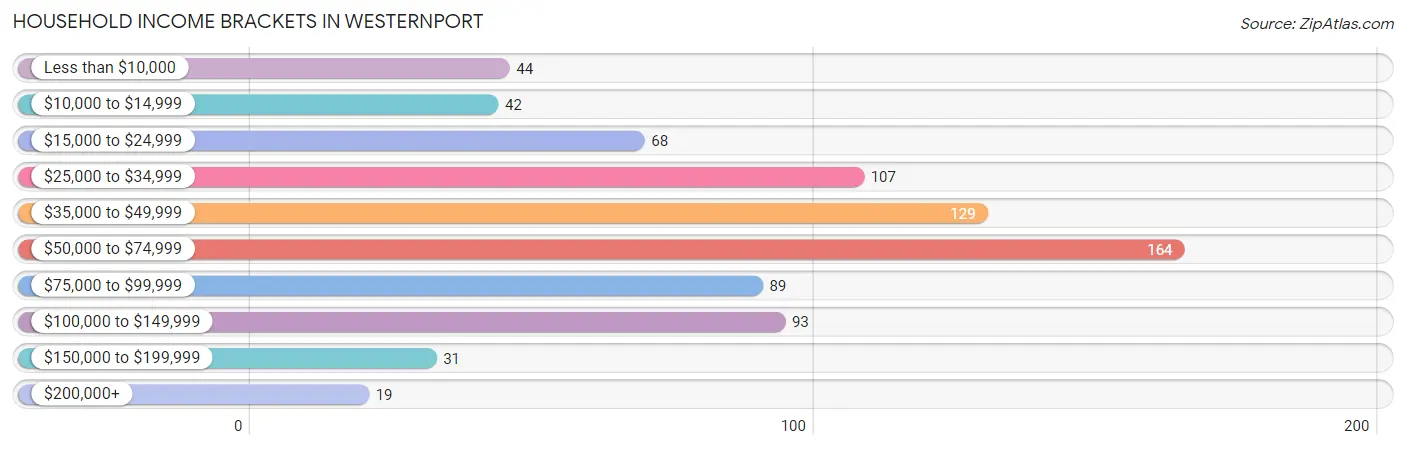
| Income Bracket | # Households | % Households |
| Less than $10,000 | 44 | 5.6% |
| $10,000 to $14,999 | 42 | 5.3% |
| $15,000 to $24,999 | 68 | 8.7% |
| $25,000 to $34,999 | 107 | 13.6% |
| $35,000 to $49,999 | 129 | 16.4% |
| $50,000 to $74,999 | 164 | 20.9% |
| $75,000 to $99,999 | 89 | 11.3% |
| $100,000 to $149,999 | 93 | 11.8% |
| $150,000 to $199,999 | 31 | 3.9% |
| $200,000+ | 19 | 2.4% |
Household Income by Householder Age in Westernport
The median household income in Westernport is $50,938, with the highest median household income of $63,313 found in the 25 to 44 years age bracket for the primary householder. A total of 183 households (23.3%) fall into this category. Meanwhile, the 15 to 24 years age bracket for the primary householder has the lowest median household income of $0, with 93 households (11.8%) in this group.
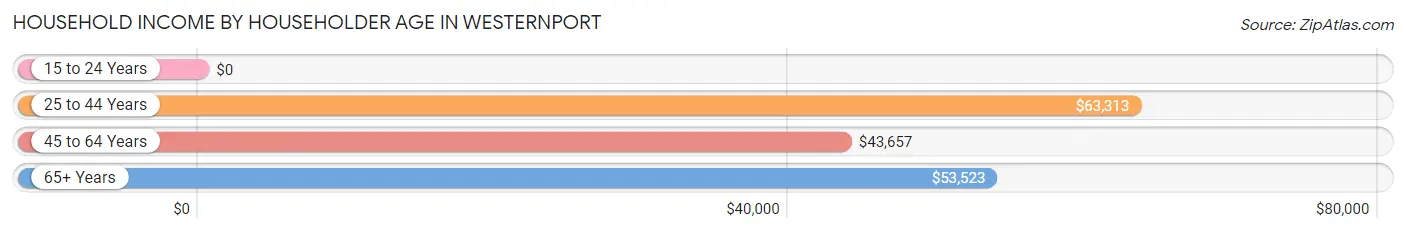
| Income Bracket | # Households | Median Income |
| 15 to 24 Years | 93 (11.8%) | $0 |
| 25 to 44 Years | 183 (23.3%) | $63,313 |
| 45 to 64 Years | 273 (34.7%) | $43,657 |
| 65+ Years | 237 (30.1%) | $53,523 |
| Total | 786 (100.0%) | $50,938 |
Poverty in Westernport
Income Below Poverty by Sex and Age in Westernport
With 14.2% poverty level for males and 28.8% for females among the residents of Westernport, under 5 year old males and 15 year old females are the most vulnerable to poverty, with 28 males (41.8%) and 31 females (86.1%) in their respective age groups living below the poverty level.
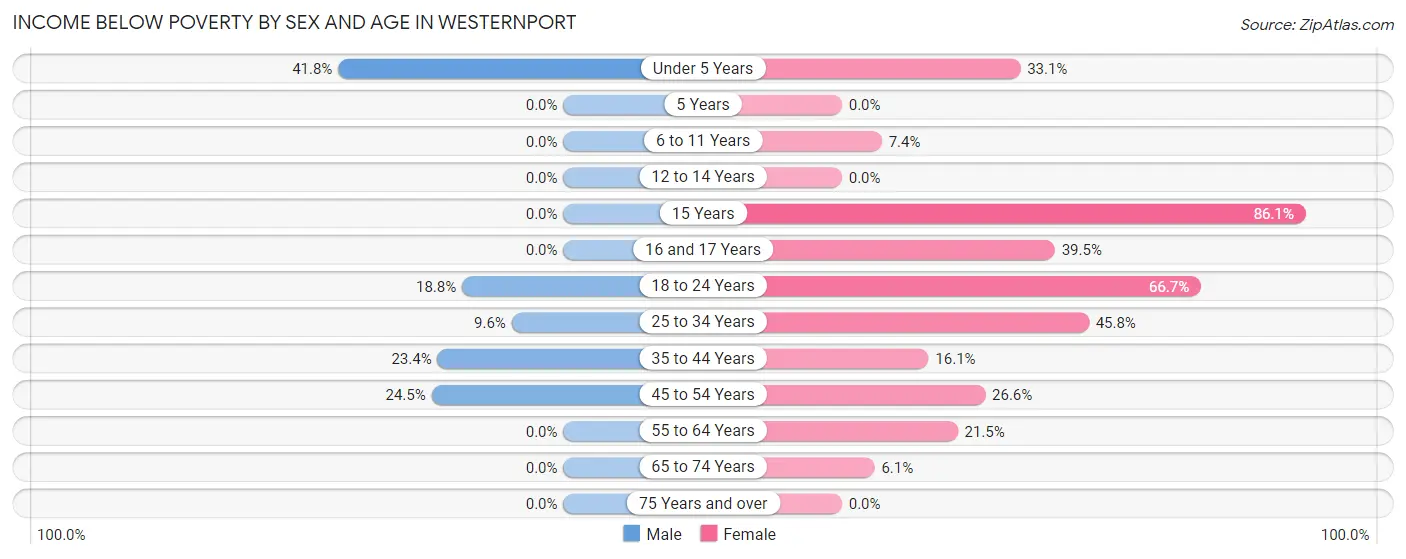
| Age Bracket | Male | Female |
| Under 5 Years | 28 (41.8%) | 50 (33.1%) |
| 5 Years | 0 (0.0%) | 0 (0.0%) |
| 6 to 11 Years | 0 (0.0%) | 4 (7.4%) |
| 12 to 14 Years | 0 (0.0%) | 0 (0.0%) |
| 15 Years | 0 (0.0%) | 31 (86.1%) |
| 16 and 17 Years | 0 (0.0%) | 17 (39.5%) |
| 18 to 24 Years | 25 (18.8%) | 104 (66.7%) |
| 25 to 34 Years | 7 (9.6%) | 22 (45.8%) |
| 35 to 44 Years | 25 (23.4%) | 23 (16.1%) |
| 45 to 54 Years | 46 (24.5%) | 25 (26.6%) |
| 55 to 64 Years | 0 (0.0%) | 26 (21.5%) |
| 65 to 74 Years | 0 (0.0%) | 6 (6.1%) |
| 75 Years and over | 0 (0.0%) | 0 (0.0%) |
| Total | 131 (14.2%) | 308 (28.8%) |
Income Above Poverty by Sex and Age in Westernport
According to the poverty statistics in Westernport, males aged 5 years and females aged 5 years are the age groups that are most secure financially, with 100.0% of males and 100.0% of females in these age groups living above the poverty line.
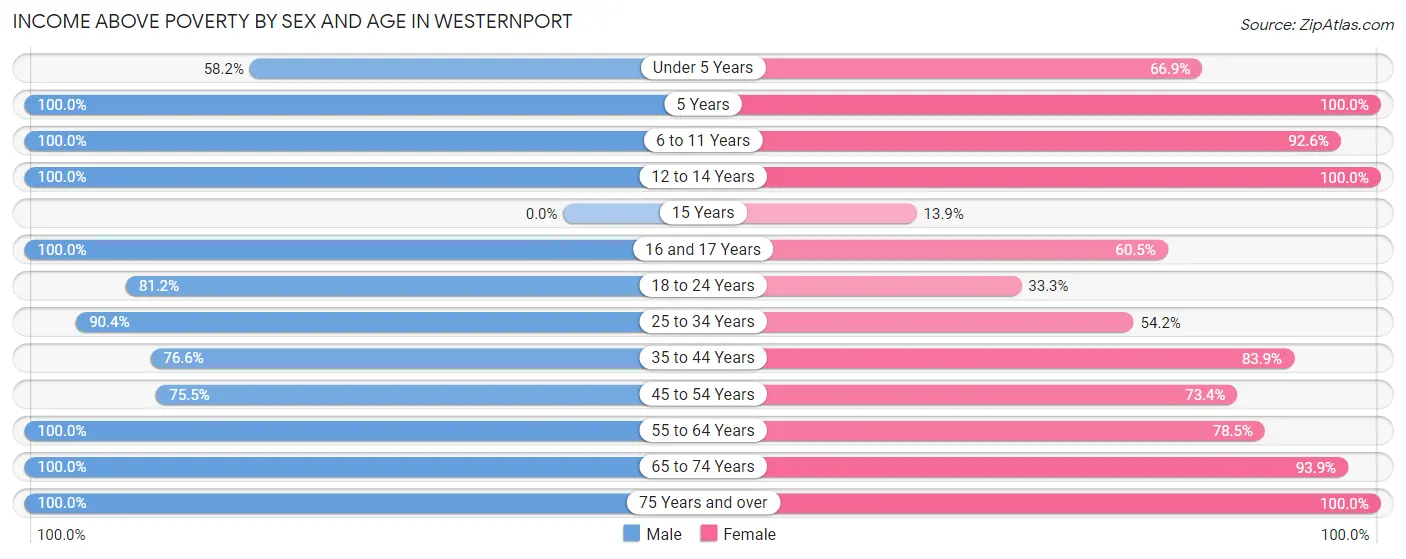
| Age Bracket | Male | Female |
| Under 5 Years | 39 (58.2%) | 101 (66.9%) |
| 5 Years | 27 (100.0%) | 15 (100.0%) |
| 6 to 11 Years | 59 (100.0%) | 50 (92.6%) |
| 12 to 14 Years | 5 (100.0%) | 23 (100.0%) |
| 15 Years | 0 (0.0%) | 5 (13.9%) |
| 16 and 17 Years | 46 (100.0%) | 26 (60.5%) |
| 18 to 24 Years | 108 (81.2%) | 52 (33.3%) |
| 25 to 34 Years | 66 (90.4%) | 26 (54.2%) |
| 35 to 44 Years | 82 (76.6%) | 120 (83.9%) |
| 45 to 54 Years | 142 (75.5%) | 69 (73.4%) |
| 55 to 64 Years | 93 (100.0%) | 95 (78.5%) |
| 65 to 74 Years | 49 (100.0%) | 93 (93.9%) |
| 75 Years and over | 75 (100.0%) | 88 (100.0%) |
| Total | 791 (85.8%) | 763 (71.2%) |
Income Below Poverty Among Married-Couple Families in Westernport
The poverty statistics for married-couple families in Westernport show that 6.9% or 22 of the total 317 families live below the poverty line. Families with 3 or 4 children have the highest poverty rate of 15.6%, comprising of 5 families. On the other hand, families with 1 or 2 children have the lowest poverty rate of 0.0%, which includes 0 families.
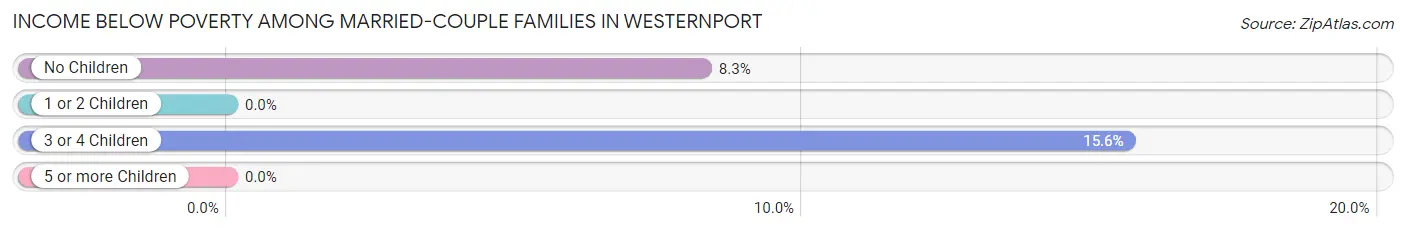
| Children | Above Poverty | Below Poverty |
| No Children | 189 (91.7%) | 17 (8.3%) |
| 1 or 2 Children | 79 (100.0%) | 0 (0.0%) |
| 3 or 4 Children | 27 (84.4%) | 5 (15.6%) |
| 5 or more Children | 0 (0.0%) | 0 (0.0%) |
| Total | 295 (93.1%) | 22 (6.9%) |
Income Below Poverty Among Single-Parent Households in Westernport
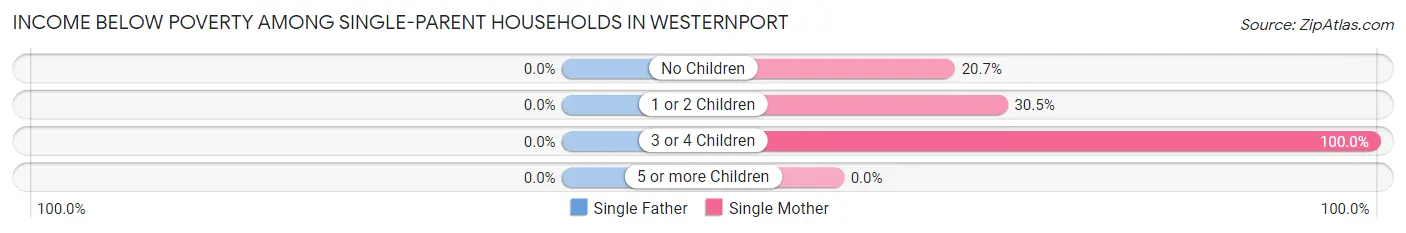
| Children | Single Father | Single Mother |
| No Children | 0 (0.0%) | 6 (20.7%) |
| 1 or 2 Children | 0 (0.0%) | 36 (30.5%) |
| 3 or 4 Children | 0 (0.0%) | 20 (100.0%) |
| 5 or more Children | 0 (0.0%) | 0 (0.0%) |
| Total | 0 (0.0%) | 62 (37.1%) |
Income Below Poverty Among Married-Couple vs Single-Parent Households in Westernport
The poverty data for Westernport shows that 22 of the married-couple family households (6.9%) and 62 of the single-parent households (29.8%) are living below the poverty level. Within the married-couple family households, those with 3 or 4 children have the highest poverty rate, with 5 households (15.6%) falling below the poverty line. Among the single-parent households, those with 3 or 4 children have the highest poverty rate, with 20 household (100.0%) living below poverty.
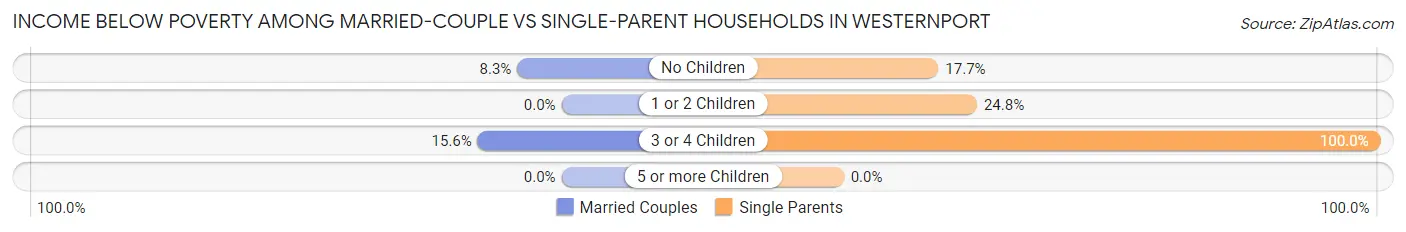
| Children | Married-Couple Families | Single-Parent Households |
| No Children | 17 (8.3%) | 6 (17.6%) |
| 1 or 2 Children | 0 (0.0%) | 36 (24.8%) |
| 3 or 4 Children | 5 (15.6%) | 20 (100.0%) |
| 5 or more Children | 0 (0.0%) | 0 (0.0%) |
| Total | 22 (6.9%) | 62 (29.8%) |
Race in Westernport
The most populous races in Westernport are White / Caucasian (1,943 | 97.5%), Hispanic or Latino (59 | 3.0%), and Two or more Races (30 | 1.5%).
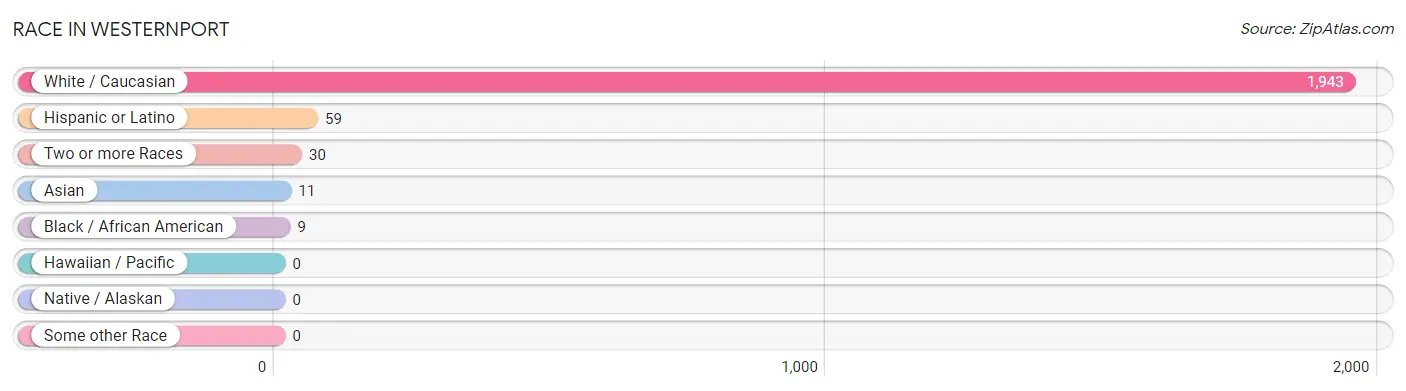
| Race | # Population | % Population |
| Asian | 11 | 0.5% |
| Black / African American | 9 | 0.4% |
| Hawaiian / Pacific | 0 | 0.0% |
| Hispanic or Latino | 59 | 3.0% |
| Native / Alaskan | 0 | 0.0% |
| White / Caucasian | 1,943 | 97.5% |
| Two or more Races | 30 | 1.5% |
| Some other Race | 0 | 0.0% |
| Total | 1,993 | 100.0% |
Ancestry in Westernport
The most populous ancestries reported in Westernport are German (661 | 33.2%), Irish (270 | 13.6%), Italian (206 | 10.3%), English (181 | 9.1%), and American (109 | 5.5%), together accounting for 71.6% of all Westernport residents.
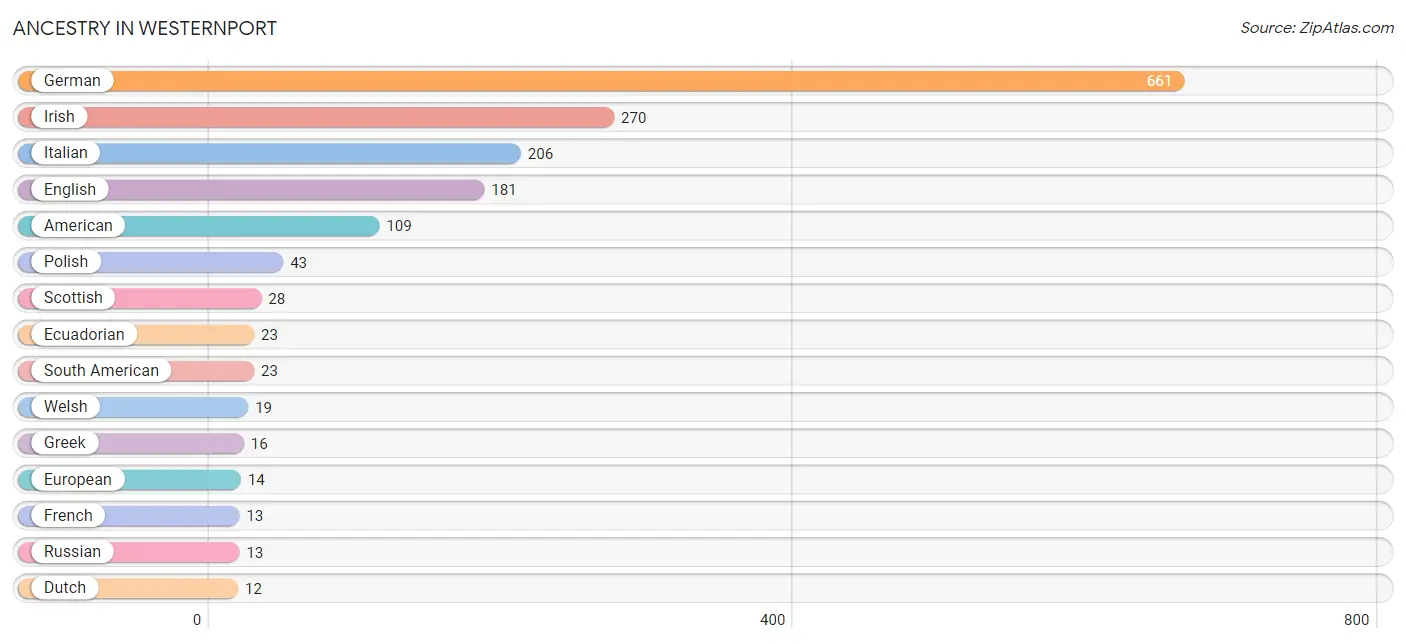
| Ancestry | # Population | % Population |
| American | 109 | 5.5% |
| British | 5 | 0.3% |
| Central American | 6 | 0.3% |
| Dutch | 12 | 0.6% |
| Ecuadorian | 23 | 1.1% |
| English | 181 | 9.1% |
| European | 14 | 0.7% |
| French | 13 | 0.6% |
| French Canadian | 2 | 0.1% |
| German | 661 | 33.2% |
| Greek | 16 | 0.8% |
| Guatemalan | 6 | 0.3% |
| Hungarian | 7 | 0.4% |
| Irish | 270 | 13.6% |
| Italian | 206 | 10.3% |
| Korean | 11 | 0.5% |
| Norwegian | 6 | 0.3% |
| Polish | 43 | 2.2% |
| Puerto Rican | 6 | 0.3% |
| Russian | 13 | 0.6% |
| Scotch-Irish | 5 | 0.3% |
| Scottish | 28 | 1.4% |
| South American | 23 | 1.1% |
| Spaniard | 10 | 0.5% |
| Swiss | 3 | 0.2% |
| Welsh | 19 | 0.9% | View All 26 Rows |
Immigrants in Westernport
The most numerous immigrant groups reported in Westernport came from Ecuador (8 | 0.4%), Latin America (8 | 0.4%), South America (8 | 0.4%), Asia (5 | 0.3%), and Philippines (5 | 0.3%), together accounting for 1.7% of all Westernport residents.
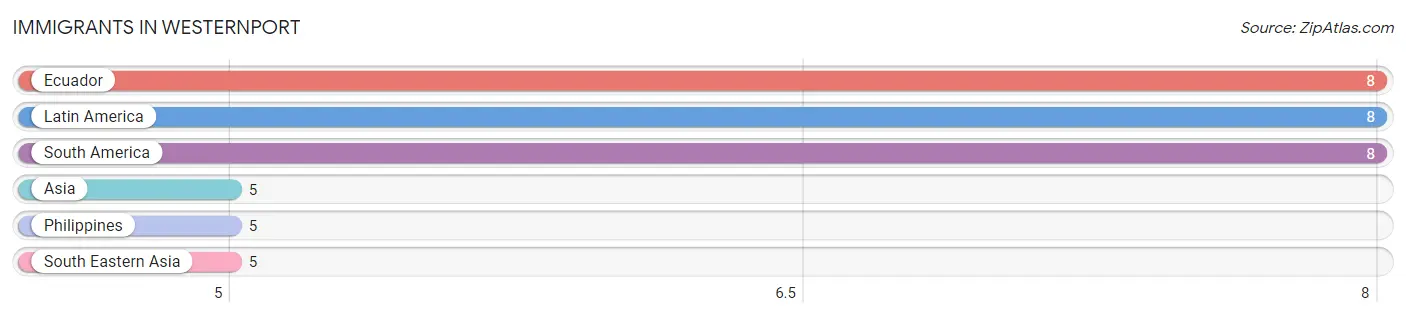
| Immigration Origin | # Population | % Population |
| Asia | 5 | 0.3% |
| Ecuador | 8 | 0.4% |
| Latin America | 8 | 0.4% |
| Philippines | 5 | 0.3% |
| South America | 8 | 0.4% |
| South Eastern Asia | 5 | 0.3% | View All 6 Rows |
Sex and Age in Westernport
Sex and Age in Westernport
The most populous age groups in Westernport are 45 to 49 Years (119 | 12.9%) for men and Under 5 Years (151 | 14.1%) for women.
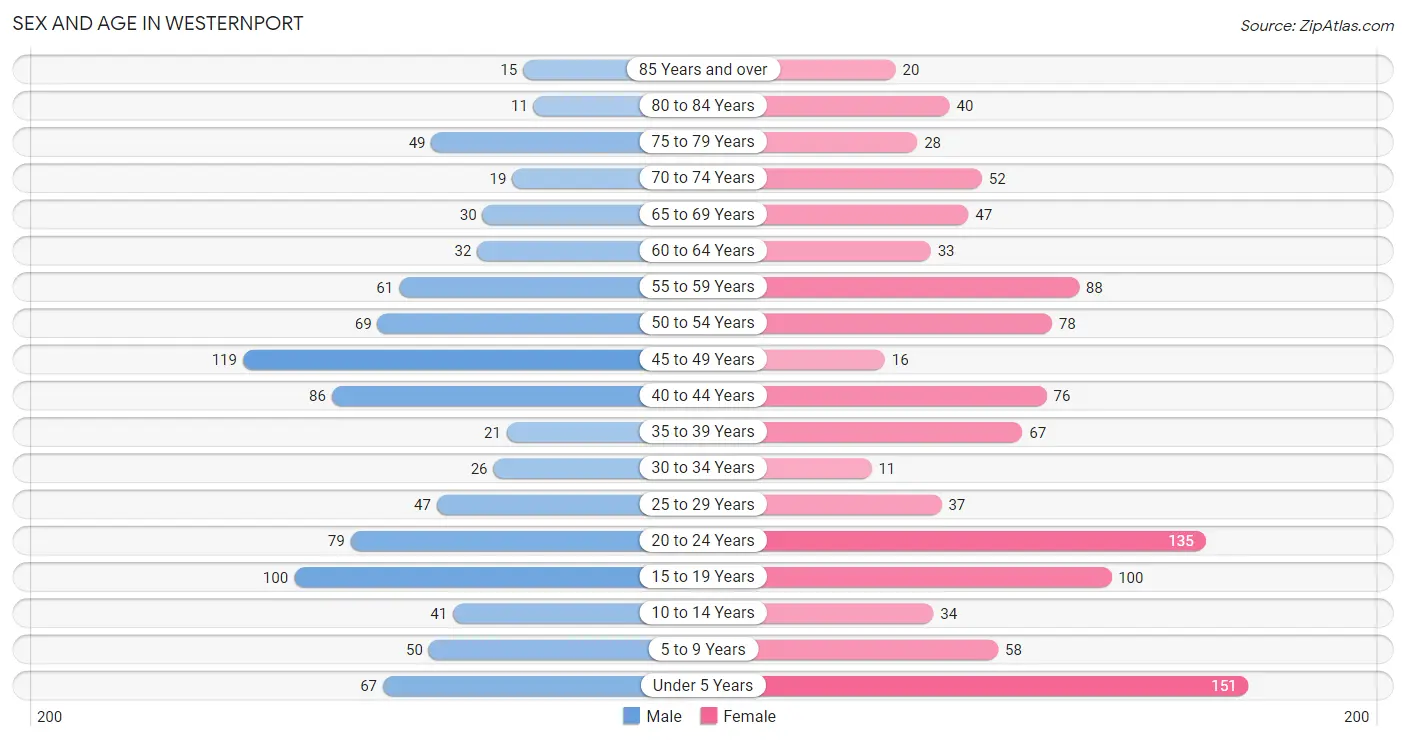
| Age Bracket | Male | Female |
| Under 5 Years | 67 (7.3%) | 151 (14.1%) |
| 5 to 9 Years | 50 (5.4%) | 58 (5.4%) |
| 10 to 14 Years | 41 (4.4%) | 34 (3.2%) |
| 15 to 19 Years | 100 (10.8%) | 100 (9.3%) |
| 20 to 24 Years | 79 (8.6%) | 135 (12.6%) |
| 25 to 29 Years | 47 (5.1%) | 37 (3.5%) |
| 30 to 34 Years | 26 (2.8%) | 11 (1.0%) |
| 35 to 39 Years | 21 (2.3%) | 67 (6.3%) |
| 40 to 44 Years | 86 (9.3%) | 76 (7.1%) |
| 45 to 49 Years | 119 (12.9%) | 16 (1.5%) |
| 50 to 54 Years | 69 (7.5%) | 78 (7.3%) |
| 55 to 59 Years | 61 (6.6%) | 88 (8.2%) |
| 60 to 64 Years | 32 (3.5%) | 33 (3.1%) |
| 65 to 69 Years | 30 (3.3%) | 47 (4.4%) |
| 70 to 74 Years | 19 (2.1%) | 52 (4.9%) |
| 75 to 79 Years | 49 (5.3%) | 28 (2.6%) |
| 80 to 84 Years | 11 (1.2%) | 40 (3.7%) |
| 85 Years and over | 15 (1.6%) | 20 (1.9%) |
| Total | 922 (100.0%) | 1,071 (100.0%) |
Families and Households in Westernport
Median Family Size in Westernport
The median family size in Westernport is 3.03 persons per family, with single male/father families (41 | 7.8%) accounting for the largest median family size of 3.22 persons per family. On the other hand, single female/mother families (167 | 31.8%) represent the smallest median family size with 2.90 persons per family.
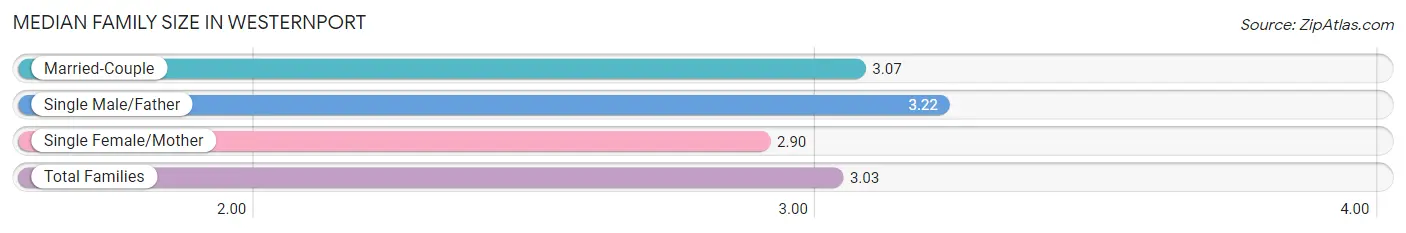
| Family Type | # Families | Family Size |
| Married-Couple | 317 (60.4%) | 3.07 |
| Single Male/Father | 41 (7.8%) | 3.22 |
| Single Female/Mother | 167 (31.8%) | 2.90 |
| Total Families | 525 (100.0%) | 3.03 |
Median Household Size in Westernport
The median household size in Westernport is 2.54 persons per household, with single male/father households (41 | 5.2%) accounting for the largest median household size of 4.07 persons per household. non-family households (261 | 33.2%) represent the smallest median household size with 1.22 persons per household.
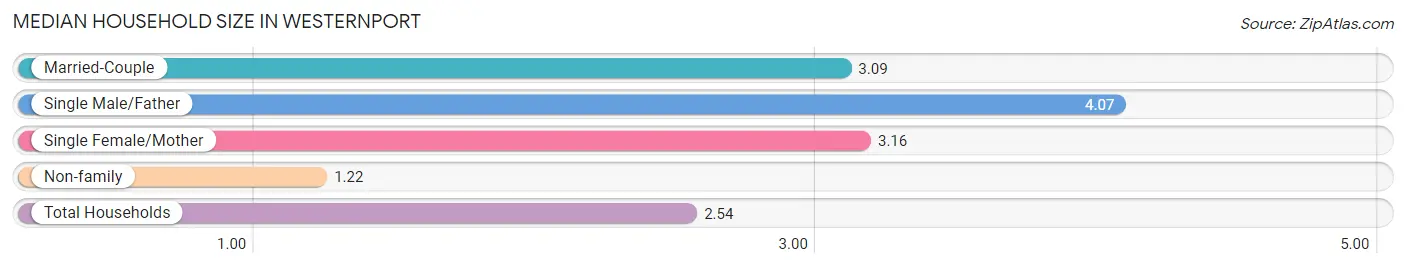
| Household Type | # Households | Household Size |
| Married-Couple | 317 (40.3%) | 3.09 |
| Single Male/Father | 41 (5.2%) | 4.07 |
| Single Female/Mother | 167 (21.2%) | 3.16 |
| Non-family | 261 (33.2%) | 1.22 |
| Total Households | 786 (100.0%) | 2.54 |
Household Size by Marriage Status in Westernport
Out of a total of 786 households in Westernport, 525 (66.8%) are family households, while 261 (33.2%) are nonfamily households. The most numerous type of family households are 2-person households, comprising 222, and the most common type of nonfamily households are 1-person households, comprising 210.
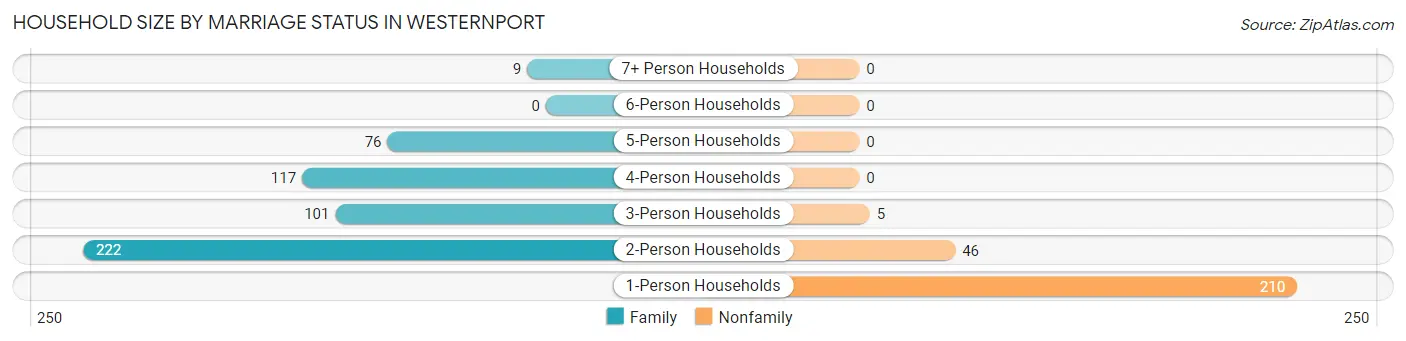
| Household Size | Family Households | Nonfamily Households |
| 1-Person Households | - | 210 (26.7%) |
| 2-Person Households | 222 (28.2%) | 46 (5.9%) |
| 3-Person Households | 101 (12.9%) | 5 (0.6%) |
| 4-Person Households | 117 (14.9%) | 0 (0.0%) |
| 5-Person Households | 76 (9.7%) | 0 (0.0%) |
| 6-Person Households | 0 (0.0%) | 0 (0.0%) |
| 7+ Person Households | 9 (1.1%) | 0 (0.0%) |
| Total | 525 (66.8%) | 261 (33.2%) |
Female Fertility in Westernport
Fertility by Age in Westernport
Average fertility rate in Westernport is 145.0 births per 1,000 women. Women in the age bracket of 20 to 34 years have the highest fertility rate with 240.0 births per 1,000 women. Women in the age bracket of 20 to 34 years acount for 67.7% of all women with births.
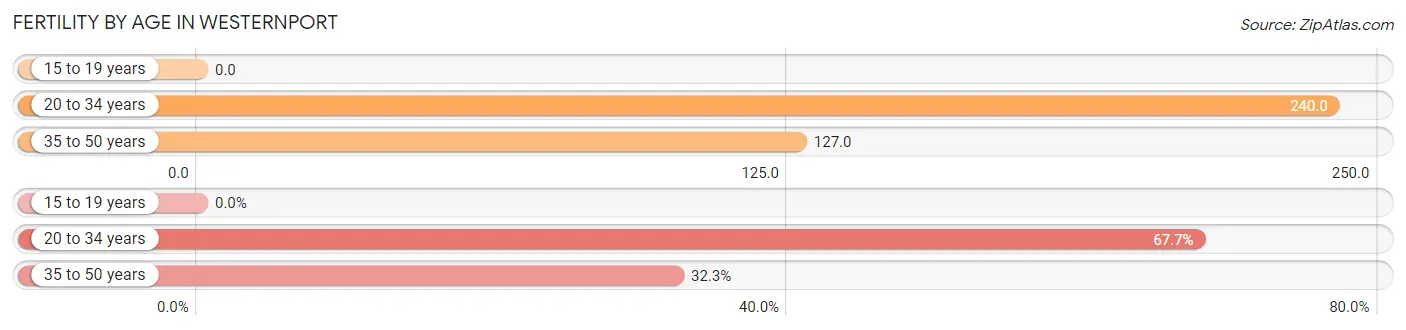
| Age Bracket | Women with Births | Births / 1,000 Women |
| 15 to 19 years | 0 (0.0%) | 0.0 |
| 20 to 34 years | 44 (67.7%) | 240.0 |
| 35 to 50 years | 21 (32.3%) | 127.0 |
| Total | 65 (100.0%) | 145.0 |
Fertility by Age by Marriage Status in Westernport
24.6% of women with births (65) in Westernport are married. The highest percentage of unmarried women with births falls into 35 to 50 years age bracket with 100.0% of them unmarried at the time of birth, while the lowest percentage of unmarried women with births belong to 20 to 34 years age bracket with 63.6% of them unmarried.
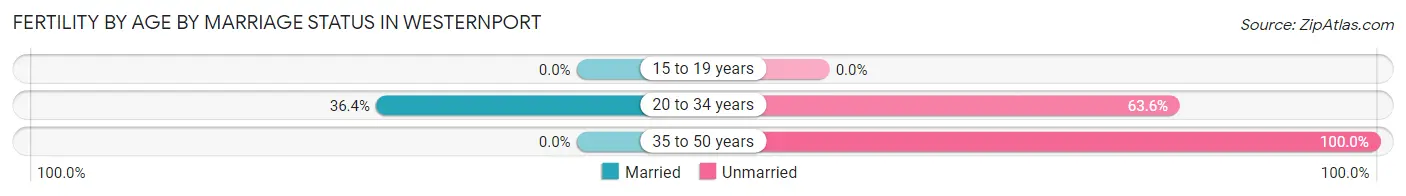
| Age Bracket | Married | Unmarried |
| 15 to 19 years | 0 (0.0%) | 0 (0.0%) |
| 20 to 34 years | 16 (36.4%) | 28 (63.6%) |
| 35 to 50 years | 0 (0.0%) | 21 (100.0%) |
| Total | 16 (24.6%) | 49 (75.4%) |
Fertility by Education in Westernport
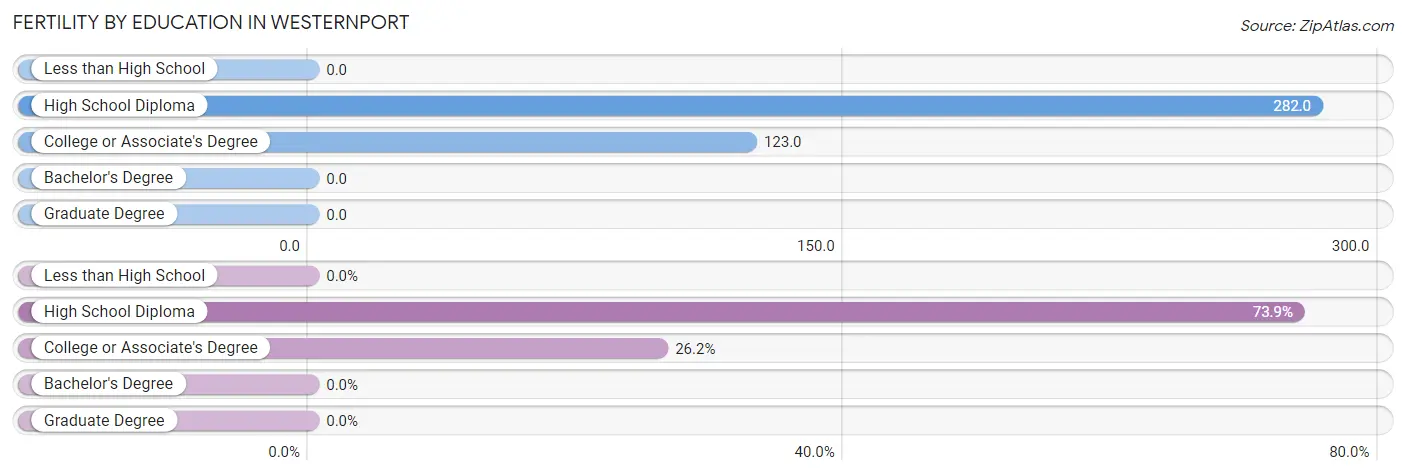
| Educational Attainment | Women with Births | Births / 1,000 Women |
| Less than High School | 0 (0.0%) | 0.0 |
| High School Diploma | 48 (73.9%) | 282.0 |
| College or Associate's Degree | 17 (26.2%) | 123.0 |
| Bachelor's Degree | 0 (0.0%) | 0.0 |
| Graduate Degree | 0 (0.0%) | 0.0 |
| Total | 65 (100.0%) | 145.0 |
Fertility by Education by Marriage Status in Westernport
75.4% of women with births in Westernport are unmarried. Women with the educational attainment of college or associate's degree are most likely to be married with 52.9% of them married at childbirth, while women with the educational attainment of high school diploma are least likely to be married with 85.4% of them unmarried at childbirth.
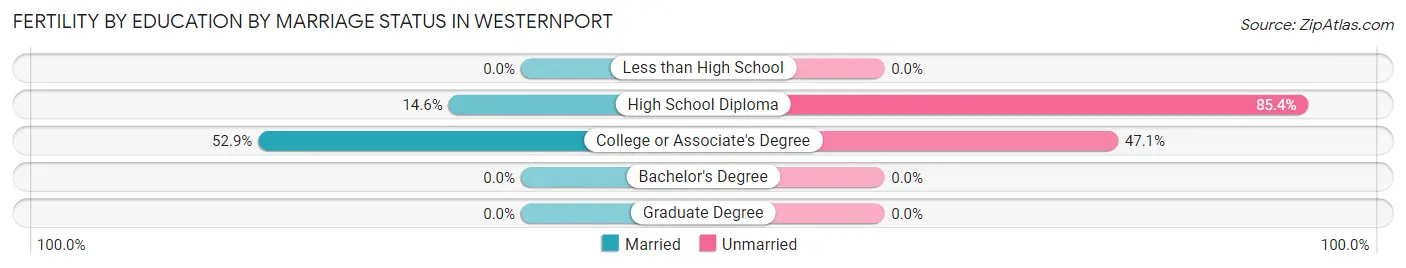
| Educational Attainment | Married | Unmarried |
| Less than High School | 0 (0.0%) | 0 (0.0%) |
| High School Diploma | 7 (14.6%) | 41 (85.4%) |
| College or Associate's Degree | 9 (52.9%) | 8 (47.1%) |
| Bachelor's Degree | 0 (0.0%) | 0 (0.0%) |
| Graduate Degree | 0 (0.0%) | 0 (0.0%) |
| Total | 16 (24.6%) | 49 (75.4%) |
Employment Characteristics in Westernport
Employment by Class of Employer in Westernport
Among the 759 employed individuals in Westernport, private company employees (459 | 60.5%), not-for-profit organizations (115 | 15.1%), and federal government employees (55 | 7.2%) make up the most common classes of employment.
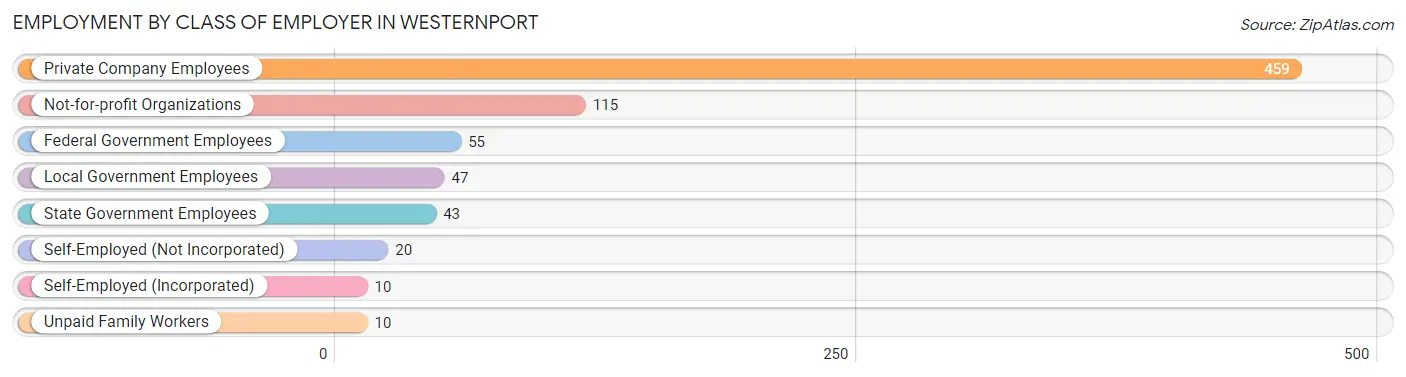
| Employer Class | # Employees | % Employees |
| Private Company Employees | 459 | 60.5% |
| Self-Employed (Incorporated) | 10 | 1.3% |
| Self-Employed (Not Incorporated) | 20 | 2.6% |
| Not-for-profit Organizations | 115 | 15.1% |
| Local Government Employees | 47 | 6.2% |
| State Government Employees | 43 | 5.7% |
| Federal Government Employees | 55 | 7.2% |
| Unpaid Family Workers | 10 | 1.3% |
| Total | 759 | 100.0% |
Employment Status by Age in Westernport
According to the labor force statistics for Westernport, out of the total population over 16 years of age (1,556), 52.8% or 822 individuals are in the labor force, with 6.1% or 50 of them unemployed. The age group with the highest labor force participation rate is 30 to 34 years, with 89.2% or 33 individuals in the labor force. Within the labor force, the 16 to 19 years age range has the highest percentage of unemployed individuals, with 46.0% or 23 of them being unemployed.
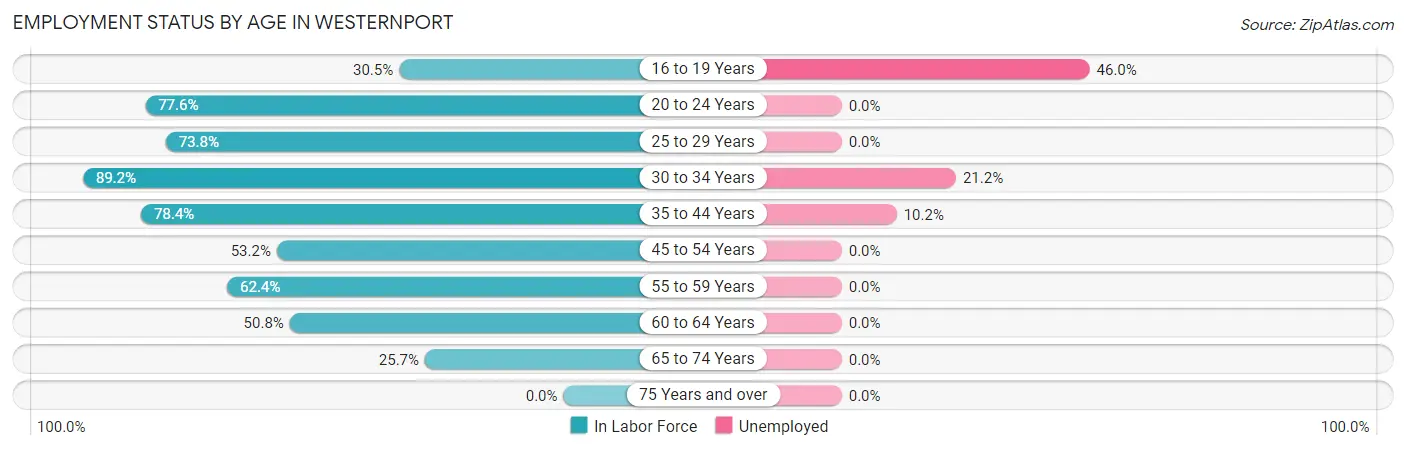
| Age Bracket | In Labor Force | Unemployed |
| 16 to 19 Years | 50 (30.5%) | 23 (46.0%) |
| 20 to 24 Years | 166 (77.6%) | 0 (0.0%) |
| 25 to 29 Years | 62 (73.8%) | 0 (0.0%) |
| 30 to 34 Years | 33 (89.2%) | 7 (21.2%) |
| 35 to 44 Years | 196 (78.4%) | 20 (10.2%) |
| 45 to 54 Years | 150 (53.2%) | 0 (0.0%) |
| 55 to 59 Years | 93 (62.4%) | 0 (0.0%) |
| 60 to 64 Years | 33 (50.8%) | 0 (0.0%) |
| 65 to 74 Years | 38 (25.7%) | 0 (0.0%) |
| 75 Years and over | 0 (0.0%) | 0 (0.0%) |
| Total | 822 (52.8%) | 50 (6.1%) |
Employment Status by Educational Attainment in Westernport
According to labor force statistics for Westernport, 65.4% of individuals (567) out of the total population between 25 and 64 years of age (867) are in the labor force, with 4.8% or 27 of them being unemployed. The group with the highest labor force participation rate are those with the educational attainment of bachelor's degree or higher, with 82.9% or 131 individuals in the labor force. Within the labor force, individuals with less than high school education have the highest percentage of unemployment, with 45.5% or 20 of them being unemployed.
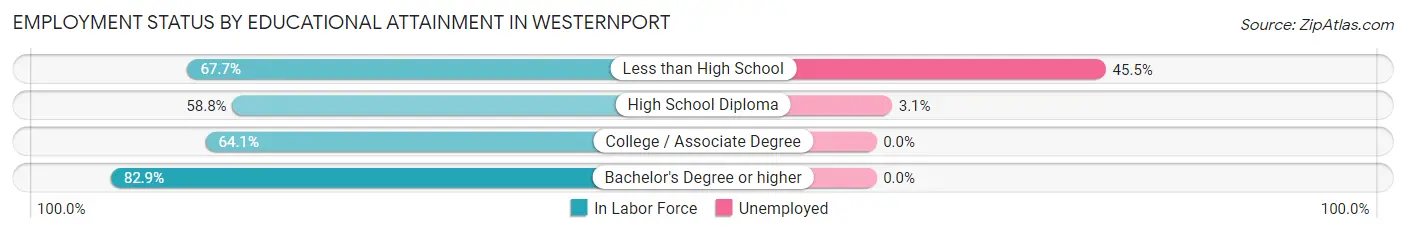
| Educational Attainment | In Labor Force | Unemployed |
| Less than High School | 44 (67.7%) | 30 (45.5%) |
| High School Diploma | 228 (58.8%) | 12 (3.1%) |
| College / Associate Degree | 164 (64.1%) | 0 (0.0%) |
| Bachelor's Degree or higher | 131 (82.9%) | 0 (0.0%) |
| Total | 567 (65.4%) | 42 (4.8%) |
Employment Occupations by Sex in Westernport
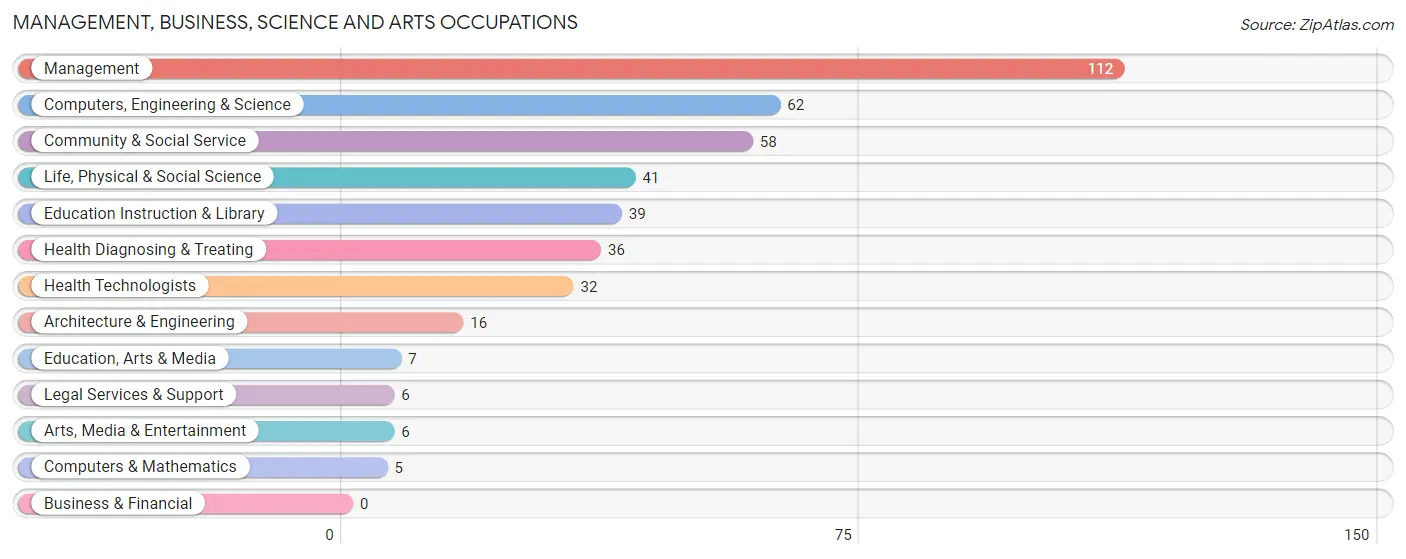
Management, Business, Science and Arts Occupations
The most common Management, Business, Science and Arts occupations in Westernport are Management (112 | 14.5%), Computers, Engineering & Science (62 | 8.0%), Community & Social Service (58 | 7.5%), Life, Physical & Social Science (41 | 5.3%), and Education Instruction & Library (39 | 5.1%).
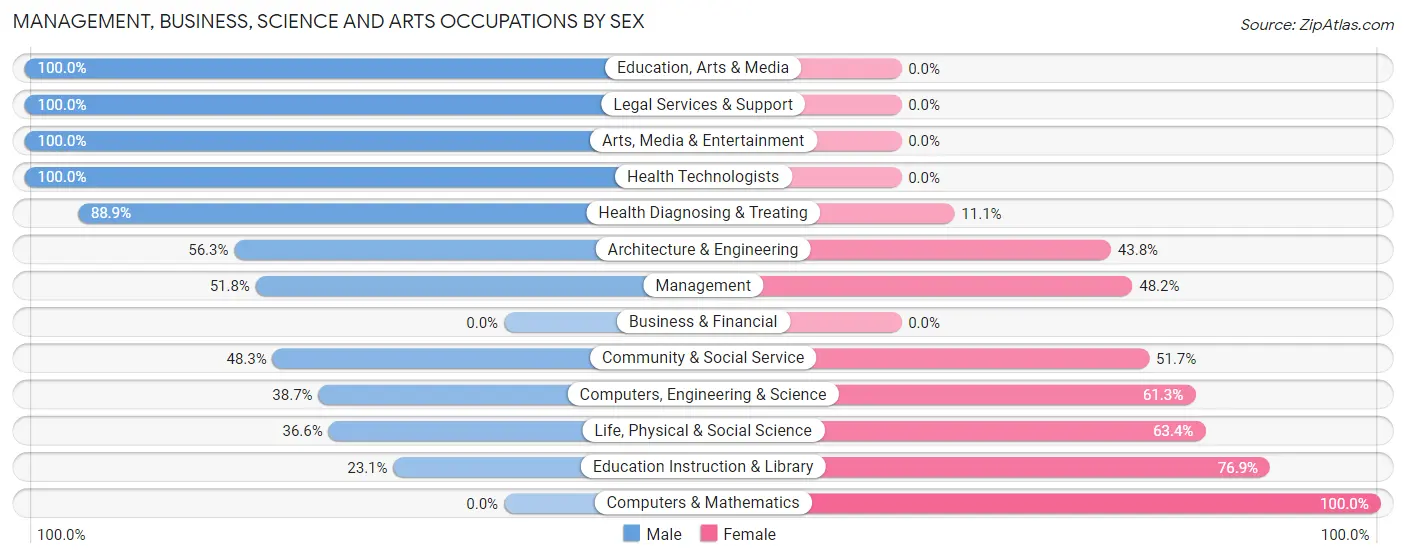
Management, Business, Science and Arts Occupations by Sex
Within the Management, Business, Science and Arts occupations in Westernport, the most male-oriented occupations are Education, Arts & Media (100.0%), Legal Services & Support (100.0%), and Arts, Media & Entertainment (100.0%), while the most female-oriented occupations are Computers & Mathematics (100.0%), Education Instruction & Library (76.9%), and Life, Physical & Social Science (63.4%).
| Occupation | Male | Female |
| Management | 58 (51.8%) | 54 (48.2%) |
| Business & Financial | 0 (0.0%) | 0 (0.0%) |
| Computers, Engineering & Science | 24 (38.7%) | 38 (61.3%) |
| Computers & Mathematics | 0 (0.0%) | 5 (100.0%) |
| Architecture & Engineering | 9 (56.2%) | 7 (43.8%) |
| Life, Physical & Social Science | 15 (36.6%) | 26 (63.4%) |
| Community & Social Service | 28 (48.3%) | 30 (51.7%) |
| Education, Arts & Media | 7 (100.0%) | 0 (0.0%) |
| Legal Services & Support | 6 (100.0%) | 0 (0.0%) |
| Education Instruction & Library | 9 (23.1%) | 30 (76.9%) |
| Arts, Media & Entertainment | 6 (100.0%) | 0 (0.0%) |
| Health Diagnosing & Treating | 32 (88.9%) | 4 (11.1%) |
| Health Technologists | 32 (100.0%) | 0 (0.0%) |
| Total (Category) | 142 (53.0%) | 126 (47.0%) |
| Total (Overall) | 418 (54.2%) | 353 (45.8%) |
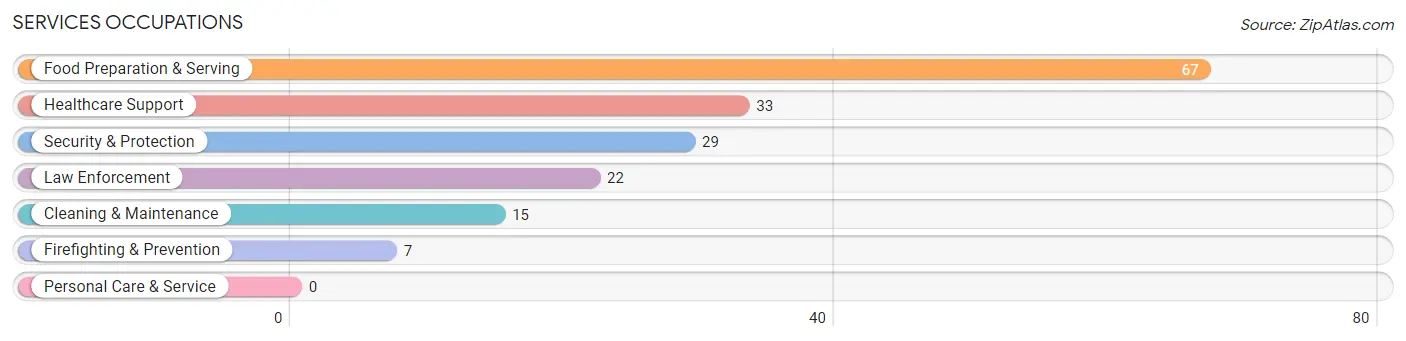
Services Occupations
The most common Services occupations in Westernport are Food Preparation & Serving (67 | 8.7%), Healthcare Support (33 | 4.3%), Security & Protection (29 | 3.8%), Law Enforcement (22 | 2.9%), and Cleaning & Maintenance (15 | 1.9%).
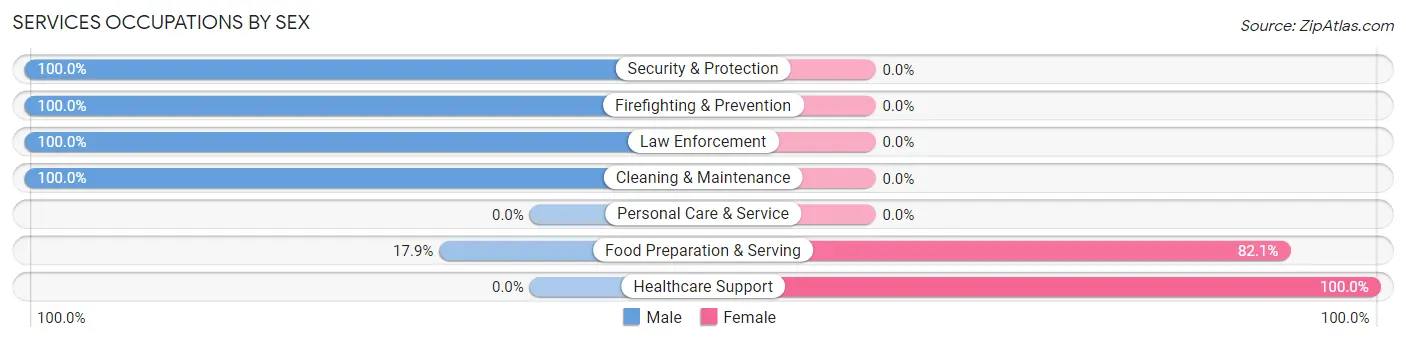
Services Occupations by Sex
Within the Services occupations in Westernport, the most male-oriented occupations are Security & Protection (100.0%), Firefighting & Prevention (100.0%), and Law Enforcement (100.0%), while the most female-oriented occupations are Healthcare Support (100.0%), and Food Preparation & Serving (82.1%).
| Occupation | Male | Female |
| Healthcare Support | 0 (0.0%) | 33 (100.0%) |
| Security & Protection | 29 (100.0%) | 0 (0.0%) |
| Firefighting & Prevention | 7 (100.0%) | 0 (0.0%) |
| Law Enforcement | 22 (100.0%) | 0 (0.0%) |
| Food Preparation & Serving | 12 (17.9%) | 55 (82.1%) |
| Cleaning & Maintenance | 15 (100.0%) | 0 (0.0%) |
| Personal Care & Service | 0 (0.0%) | 0 (0.0%) |
| Total (Category) | 56 (38.9%) | 88 (61.1%) |
| Total (Overall) | 418 (54.2%) | 353 (45.8%) |
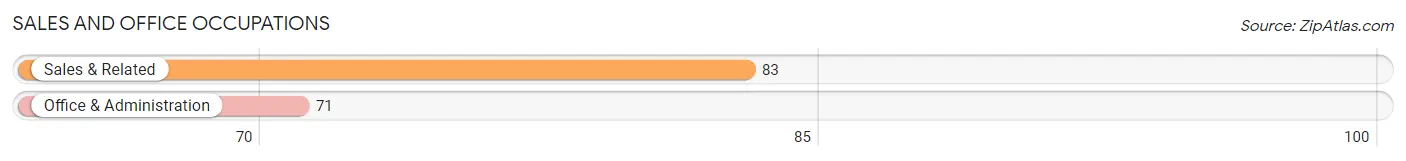
Sales and Office Occupations
The most common Sales and Office occupations in Westernport are Sales & Related (83 | 10.8%), and Office & Administration (71 | 9.2%).
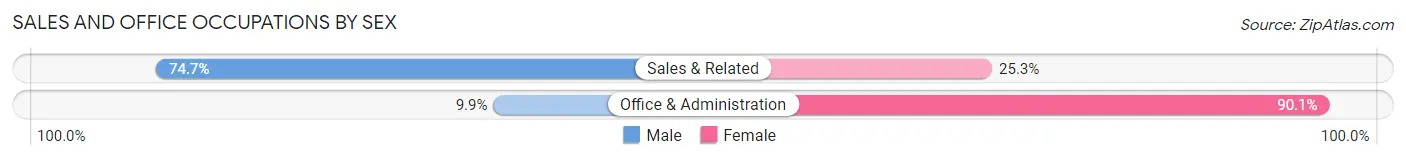
Sales and Office Occupations by Sex
| Occupation | Male | Female |
| Sales & Related | 62 (74.7%) | 21 (25.3%) |
| Office & Administration | 7 (9.9%) | 64 (90.1%) |
| Total (Category) | 69 (44.8%) | 85 (55.2%) |
| Total (Overall) | 418 (54.2%) | 353 (45.8%) |
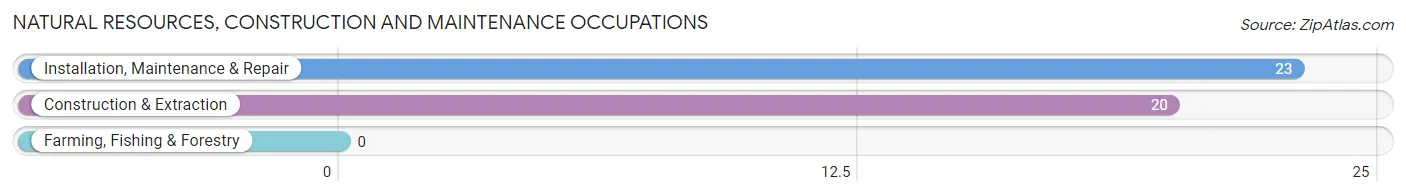
Natural Resources, Construction and Maintenance Occupations
The most common Natural Resources, Construction and Maintenance occupations in Westernport are Installation, Maintenance & Repair (23 | 3.0%), and Construction & Extraction (20 | 2.6%).
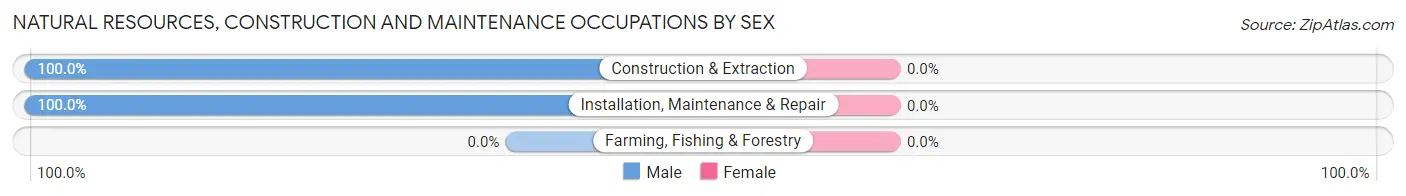
Natural Resources, Construction and Maintenance Occupations by Sex
| Occupation | Male | Female |
| Farming, Fishing & Forestry | 0 (0.0%) | 0 (0.0%) |
| Construction & Extraction | 20 (100.0%) | 0 (0.0%) |
| Installation, Maintenance & Repair | 23 (100.0%) | 0 (0.0%) |
| Total (Category) | 43 (100.0%) | 0 (0.0%) |
| Total (Overall) | 418 (54.2%) | 353 (45.8%) |
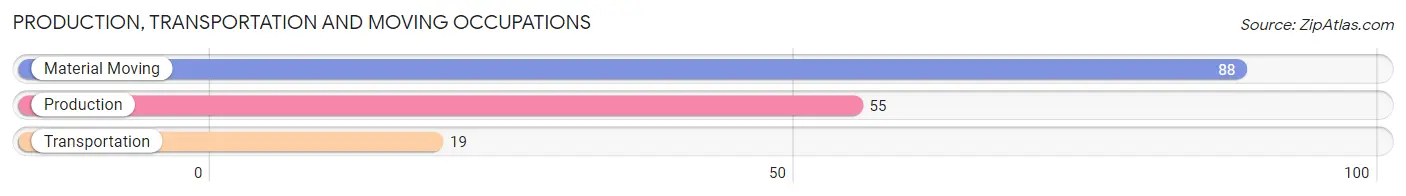
Production, Transportation and Moving Occupations
The most common Production, Transportation and Moving occupations in Westernport are Material Moving (88 | 11.4%), Production (55 | 7.1%), and Transportation (19 | 2.5%).
Production, Transportation and Moving Occupations by Sex
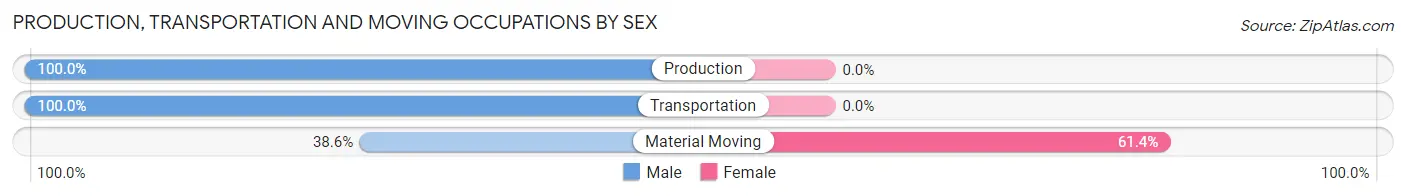
| Occupation | Male | Female |
| Production | 55 (100.0%) | 0 (0.0%) |
| Transportation | 19 (100.0%) | 0 (0.0%) |
| Material Moving | 34 (38.6%) | 54 (61.4%) |
| Total (Category) | 108 (66.7%) | 54 (33.3%) |
| Total (Overall) | 418 (54.2%) | 353 (45.8%) |
Employment Industries by Sex in Westernport
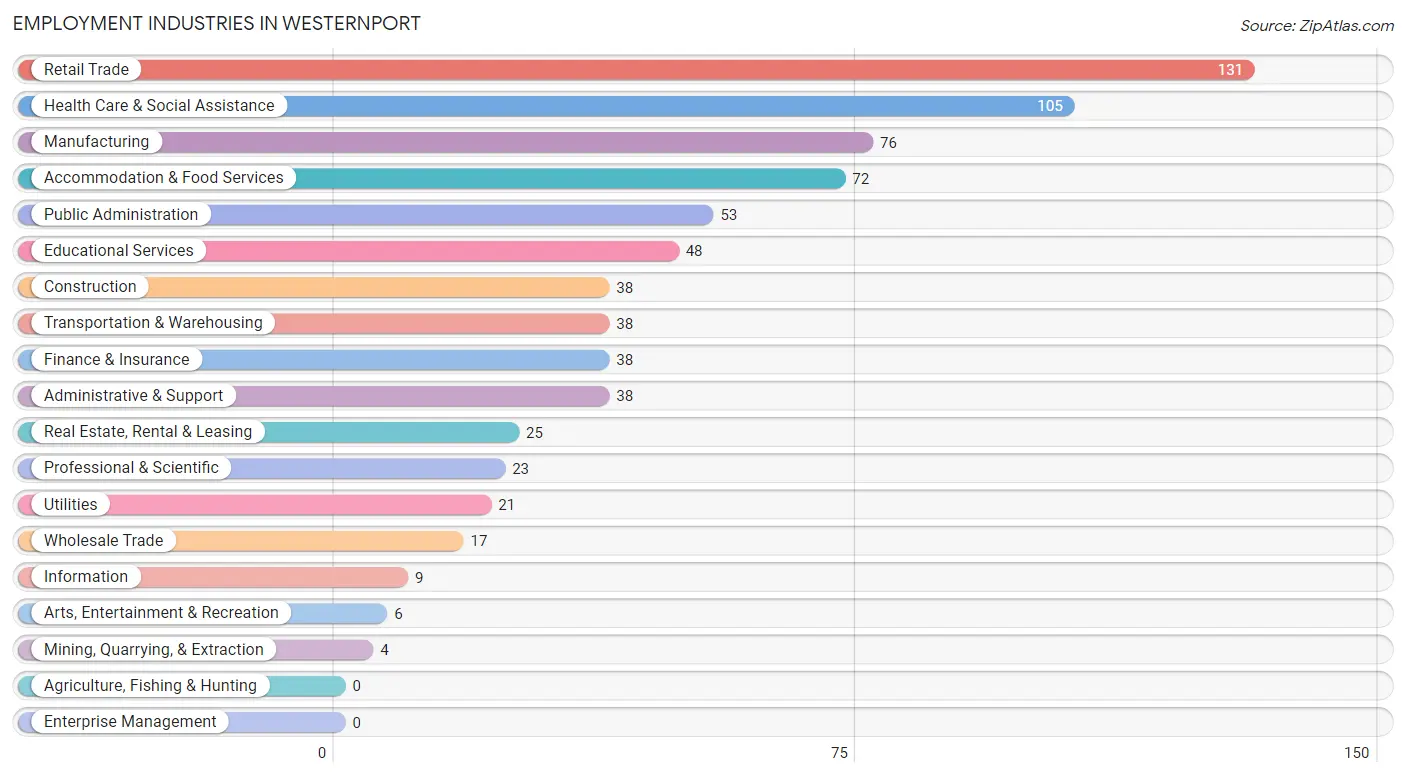
Employment Industries in Westernport
The major employment industries in Westernport include Retail Trade (131 | 17.0%), Health Care & Social Assistance (105 | 13.6%), Manufacturing (76 | 9.9%), Accommodation & Food Services (72 | 9.3%), and Public Administration (53 | 6.9%).
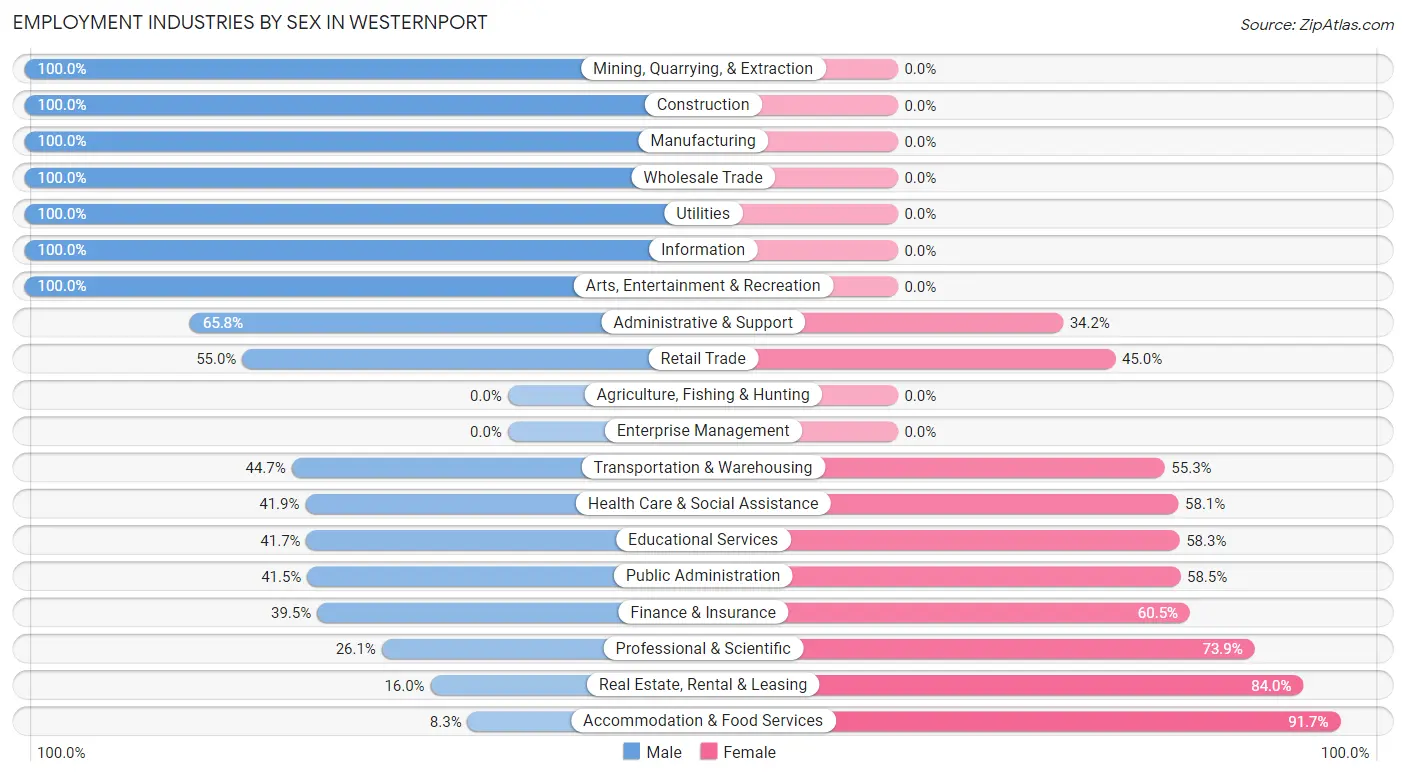
Employment Industries by Sex in Westernport
The Westernport industries that see more men than women are Mining, Quarrying, & Extraction (100.0%), Construction (100.0%), and Manufacturing (100.0%), whereas the industries that tend to have a higher number of women are Accommodation & Food Services (91.7%), Real Estate, Rental & Leasing (84.0%), and Professional & Scientific (73.9%).
| Industry | Male | Female |
| Agriculture, Fishing & Hunting | 0 (0.0%) | 0 (0.0%) |
| Mining, Quarrying, & Extraction | 4 (100.0%) | 0 (0.0%) |
| Construction | 38 (100.0%) | 0 (0.0%) |
| Manufacturing | 76 (100.0%) | 0 (0.0%) |
| Wholesale Trade | 17 (100.0%) | 0 (0.0%) |
| Retail Trade | 72 (55.0%) | 59 (45.0%) |
| Transportation & Warehousing | 17 (44.7%) | 21 (55.3%) |
| Utilities | 21 (100.0%) | 0 (0.0%) |
| Information | 9 (100.0%) | 0 (0.0%) |
| Finance & Insurance | 15 (39.5%) | 23 (60.5%) |
| Real Estate, Rental & Leasing | 4 (16.0%) | 21 (84.0%) |
| Professional & Scientific | 6 (26.1%) | 17 (73.9%) |
| Enterprise Management | 0 (0.0%) | 0 (0.0%) |
| Administrative & Support | 25 (65.8%) | 13 (34.2%) |
| Educational Services | 20 (41.7%) | 28 (58.3%) |
| Health Care & Social Assistance | 44 (41.9%) | 61 (58.1%) |
| Arts, Entertainment & Recreation | 6 (100.0%) | 0 (0.0%) |
| Accommodation & Food Services | 6 (8.3%) | 66 (91.7%) |
| Public Administration | 22 (41.5%) | 31 (58.5%) |
| Total | 418 (54.2%) | 353 (45.8%) |
Education in Westernport
School Enrollment in Westernport
The most common levels of schooling among the 468 students in Westernport are high school (155 | 33.1%), college / undergraduate (112 | 23.9%), and middle school (70 | 15.0%).
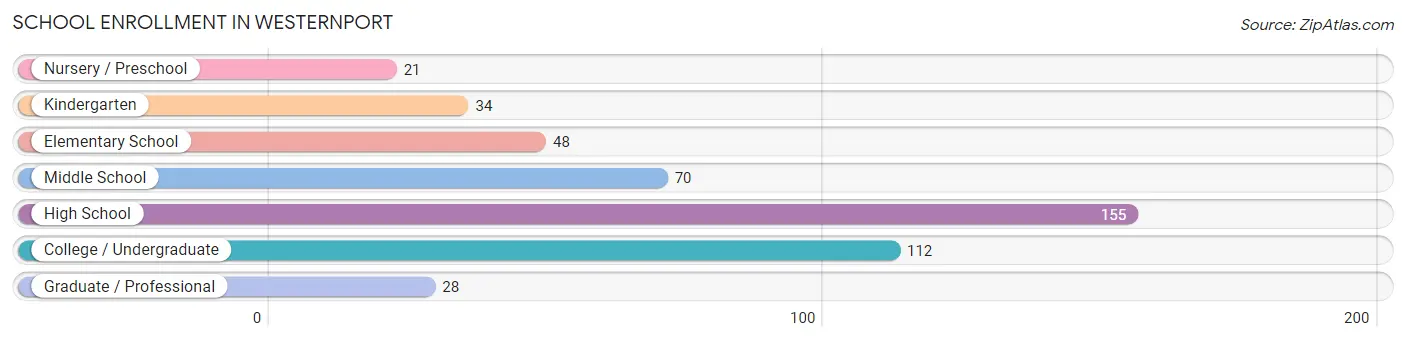
| School Level | # Students | % Students |
| Nursery / Preschool | 21 | 4.5% |
| Kindergarten | 34 | 7.3% |
| Elementary School | 48 | 10.3% |
| Middle School | 70 | 15.0% |
| High School | 155 | 33.1% |
| College / Undergraduate | 112 | 23.9% |
| Graduate / Professional | 28 | 6.0% |
| Total | 468 | 100.0% |
School Enrollment by Age by Funding Source in Westernport
Out of a total of 468 students who are enrolled in schools in Westernport, 6 (1.3%) attend a private institution, while the remaining 462 (98.7%) are enrolled in public schools. The age group of 5 to 9 year old has the highest likelihood of being enrolled in private schools, with 6 (7.3% in the age bracket) enrolled. Conversely, the age group of 3 to 4 year olds has the lowest likelihood of being enrolled in a private school, with 21 (100.0% in the age bracket) attending a public institution.
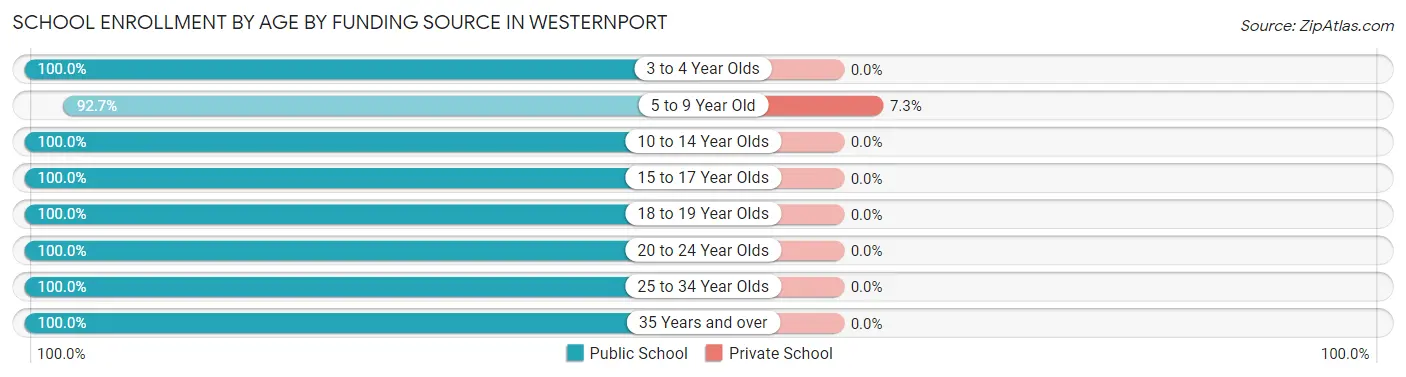
| Age Bracket | Public School | Private School |
| 3 to 4 Year Olds | 21 (100.0%) | 0 (0.0%) |
| 5 to 9 Year Old | 76 (92.7%) | 6 (7.3%) |
| 10 to 14 Year Olds | 75 (100.0%) | 0 (0.0%) |
| 15 to 17 Year Olds | 125 (100.0%) | 0 (0.0%) |
| 18 to 19 Year Olds | 51 (100.0%) | 0 (0.0%) |
| 20 to 24 Year Olds | 78 (100.0%) | 0 (0.0%) |
| 25 to 34 Year Olds | 4 (100.0%) | 0 (0.0%) |
| 35 Years and over | 32 (100.0%) | 0 (0.0%) |
| Total | 462 (98.7%) | 6 (1.3%) |
Educational Attainment by Field of Study in Westernport
Education (62 | 27.4%), science & technology (36 | 15.9%), physical & health sciences (25 | 11.1%), computers & mathematics (19 | 8.4%), and liberal arts & history (19 | 8.4%) are the most common fields of study among 226 individuals in Westernport who have obtained a bachelor's degree or higher.
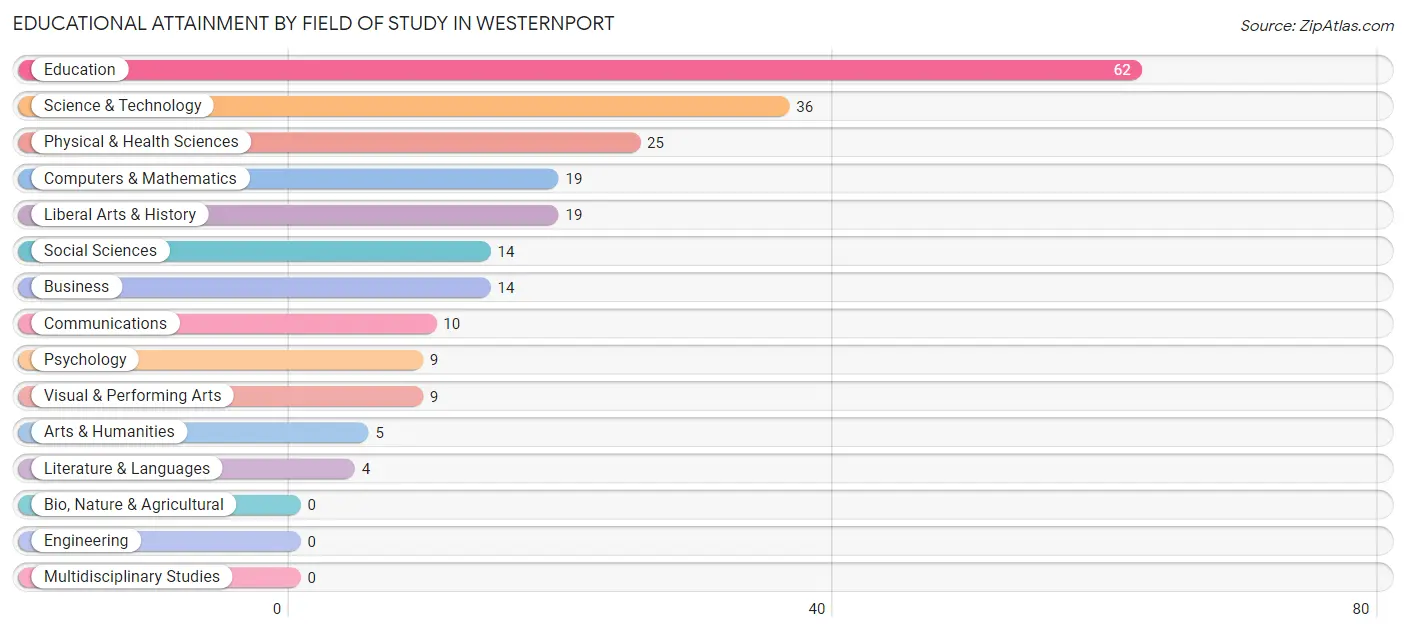
| Field of Study | # Graduates | % Graduates |
| Computers & Mathematics | 19 | 8.4% |
| Bio, Nature & Agricultural | 0 | 0.0% |
| Physical & Health Sciences | 25 | 11.1% |
| Psychology | 9 | 4.0% |
| Social Sciences | 14 | 6.2% |
| Engineering | 0 | 0.0% |
| Multidisciplinary Studies | 0 | 0.0% |
| Science & Technology | 36 | 15.9% |
| Business | 14 | 6.2% |
| Education | 62 | 27.4% |
| Literature & Languages | 4 | 1.8% |
| Liberal Arts & History | 19 | 8.4% |
| Visual & Performing Arts | 9 | 4.0% |
| Communications | 10 | 4.4% |
| Arts & Humanities | 5 | 2.2% |
| Total | 226 | 100.0% |
Transportation & Commute in Westernport
Vehicle Availability by Sex in Westernport
The most prevalent vehicle ownership categories in Westernport are males with 2 vehicles (156, accounting for 37.3%) and females with 2 vehicles (154, making up 45.8%).
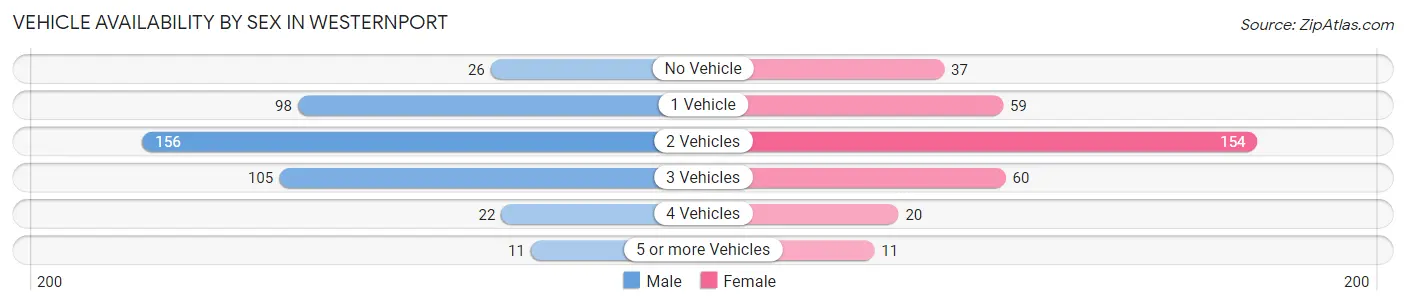
| Vehicles Available | Male | Female |
| No Vehicle | 26 (6.2%) | 37 (10.8%) |
| 1 Vehicle | 98 (23.4%) | 59 (17.3%) |
| 2 Vehicles | 156 (37.3%) | 154 (45.2%) |
| 3 Vehicles | 105 (25.1%) | 60 (17.6%) |
| 4 Vehicles | 22 (5.3%) | 20 (5.9%) |
| 5 or more Vehicles | 11 (2.6%) | 11 (3.2%) |
| Total | 418 (100.0%) | 341 (100.0%) |
Commute Time in Westernport
The most frequently occuring commute durations in Westernport are 15 to 19 minutes (128 commuters, 17.7%), 90 or more minutes (92 commuters, 12.7%), and 30 to 34 minutes (87 commuters, 12.0%).
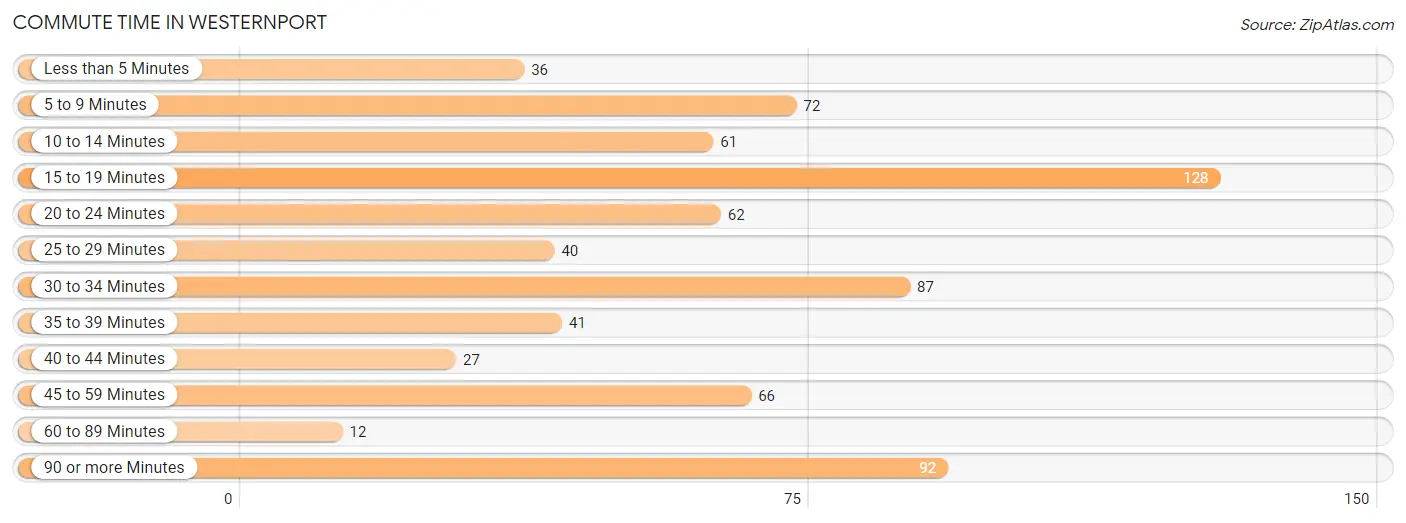
| Commute Time | # Commuters | % Commuters |
| Less than 5 Minutes | 36 | 5.0% |
| 5 to 9 Minutes | 72 | 9.9% |
| 10 to 14 Minutes | 61 | 8.4% |
| 15 to 19 Minutes | 128 | 17.7% |
| 20 to 24 Minutes | 62 | 8.6% |
| 25 to 29 Minutes | 40 | 5.5% |
| 30 to 34 Minutes | 87 | 12.0% |
| 35 to 39 Minutes | 41 | 5.7% |
| 40 to 44 Minutes | 27 | 3.7% |
| 45 to 59 Minutes | 66 | 9.1% |
| 60 to 89 Minutes | 12 | 1.7% |
| 90 or more Minutes | 92 | 12.7% |
Commute Time by Sex in Westernport
The most common commute times in Westernport are 90 or more minutes (80 commuters, 19.8%) for males and 15 to 19 minutes (56 commuters, 17.5%) for females.
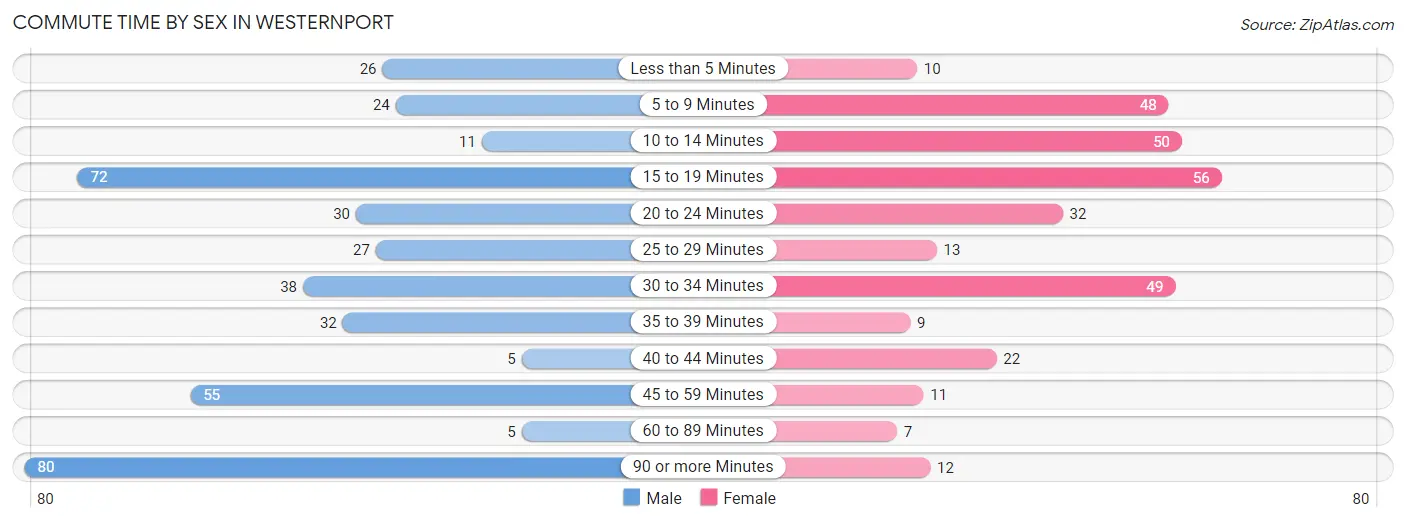
| Commute Time | Male | Female |
| Less than 5 Minutes | 26 (6.4%) | 10 (3.1%) |
| 5 to 9 Minutes | 24 (5.9%) | 48 (15.0%) |
| 10 to 14 Minutes | 11 (2.7%) | 50 (15.7%) |
| 15 to 19 Minutes | 72 (17.8%) | 56 (17.5%) |
| 20 to 24 Minutes | 30 (7.4%) | 32 (10.0%) |
| 25 to 29 Minutes | 27 (6.7%) | 13 (4.1%) |
| 30 to 34 Minutes | 38 (9.4%) | 49 (15.4%) |
| 35 to 39 Minutes | 32 (7.9%) | 9 (2.8%) |
| 40 to 44 Minutes | 5 (1.2%) | 22 (6.9%) |
| 45 to 59 Minutes | 55 (13.6%) | 11 (3.5%) |
| 60 to 89 Minutes | 5 (1.2%) | 7 (2.2%) |
| 90 or more Minutes | 80 (19.8%) | 12 (3.8%) |
Time of Departure to Work by Sex in Westernport
The most frequent times of departure to work in Westernport are 7:30 AM to 7:59 AM (70, 17.3%) for males and 12:00 PM to 3:59 PM (72, 22.6%) for females.
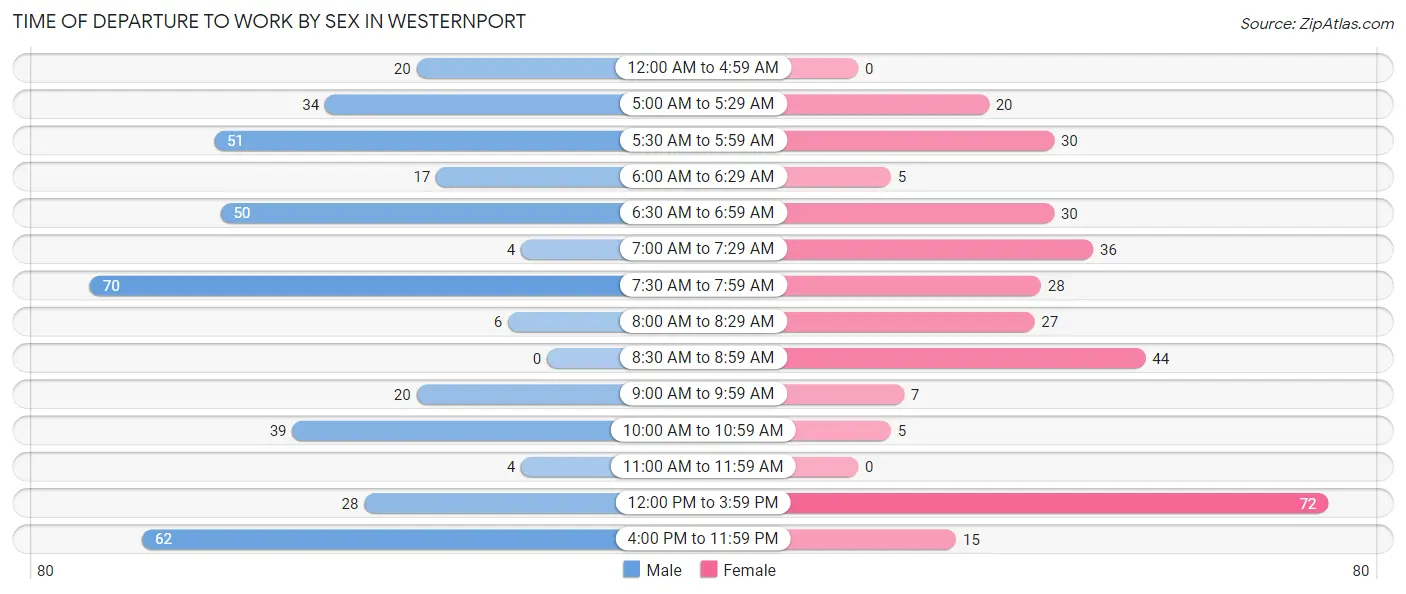
| Time of Departure | Male | Female |
| 12:00 AM to 4:59 AM | 20 (4.9%) | 0 (0.0%) |
| 5:00 AM to 5:29 AM | 34 (8.4%) | 20 (6.3%) |
| 5:30 AM to 5:59 AM | 51 (12.6%) | 30 (9.4%) |
| 6:00 AM to 6:29 AM | 17 (4.2%) | 5 (1.6%) |
| 6:30 AM to 6:59 AM | 50 (12.3%) | 30 (9.4%) |
| 7:00 AM to 7:29 AM | 4 (1.0%) | 36 (11.3%) |
| 7:30 AM to 7:59 AM | 70 (17.3%) | 28 (8.8%) |
| 8:00 AM to 8:29 AM | 6 (1.5%) | 27 (8.5%) |
| 8:30 AM to 8:59 AM | 0 (0.0%) | 44 (13.8%) |
| 9:00 AM to 9:59 AM | 20 (4.9%) | 7 (2.2%) |
| 10:00 AM to 10:59 AM | 39 (9.6%) | 5 (1.6%) |
| 11:00 AM to 11:59 AM | 4 (1.0%) | 0 (0.0%) |
| 12:00 PM to 3:59 PM | 28 (6.9%) | 72 (22.6%) |
| 4:00 PM to 11:59 PM | 62 (15.3%) | 15 (4.7%) |
| Total | 405 (100.0%) | 319 (100.0%) |
Housing Occupancy in Westernport
Occupancy by Ownership in Westernport
Of the total 786 dwellings in Westernport, owner-occupied units account for 621 (79.0%), while renter-occupied units make up 165 (21.0%).
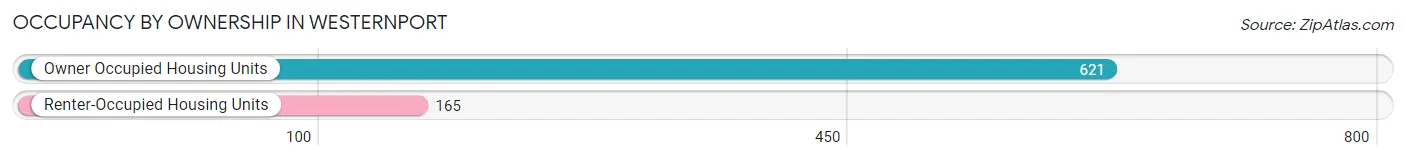
| Occupancy | # Housing Units | % Housing Units |
| Owner Occupied Housing Units | 621 | 79.0% |
| Renter-Occupied Housing Units | 165 | 21.0% |
| Total Occupied Housing Units | 786 | 100.0% |
Occupancy by Household Size in Westernport
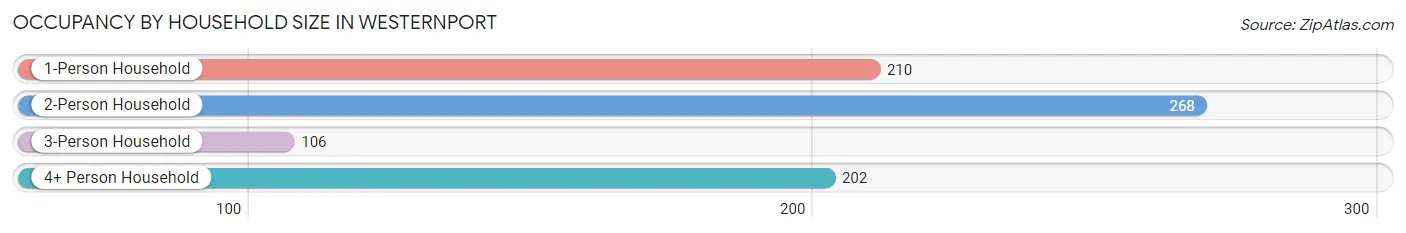
| Household Size | # Housing Units | % Housing Units |
| 1-Person Household | 210 | 26.7% |
| 2-Person Household | 268 | 34.1% |
| 3-Person Household | 106 | 13.5% |
| 4+ Person Household | 202 | 25.7% |
| Total Housing Units | 786 | 100.0% |
Occupancy by Ownership by Household Size in Westernport
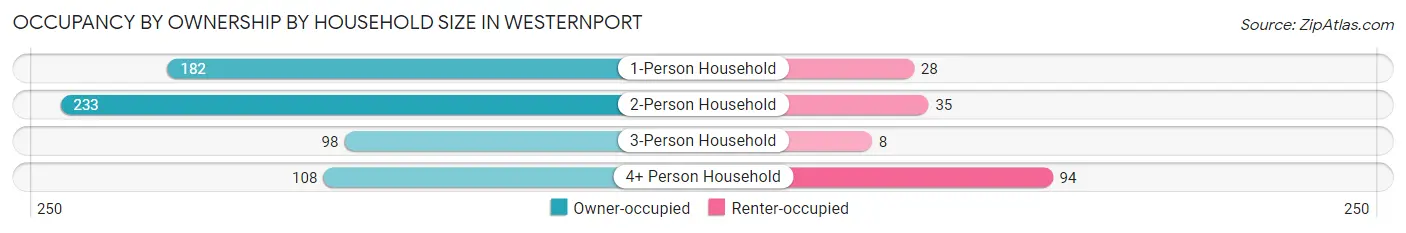
| Household Size | Owner-occupied | Renter-occupied |
| 1-Person Household | 182 (86.7%) | 28 (13.3%) |
| 2-Person Household | 233 (86.9%) | 35 (13.1%) |
| 3-Person Household | 98 (92.4%) | 8 (7.5%) |
| 4+ Person Household | 108 (53.5%) | 94 (46.5%) |
| Total Housing Units | 621 (79.0%) | 165 (21.0%) |
Occupancy by Educational Attainment in Westernport
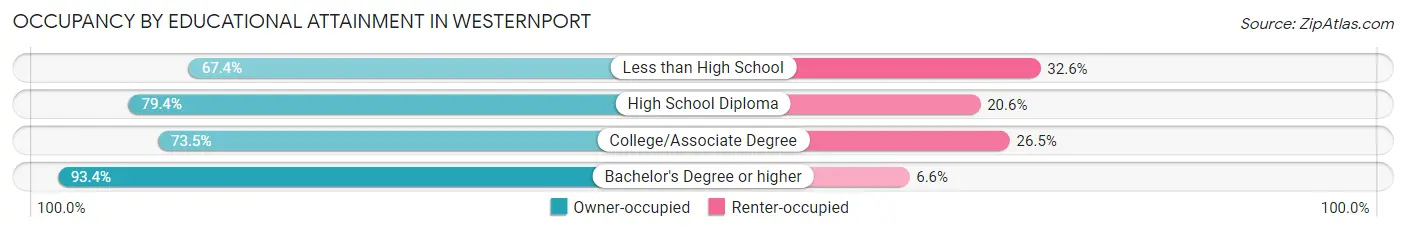
| Household Size | Owner-occupied | Renter-occupied |
| Less than High School | 29 (67.4%) | 14 (32.6%) |
| High School Diploma | 250 (79.4%) | 65 (20.6%) |
| College/Associate Degree | 214 (73.5%) | 77 (26.5%) |
| Bachelor's Degree or higher | 128 (93.4%) | 9 (6.6%) |
Occupancy by Age of Householder in Westernport
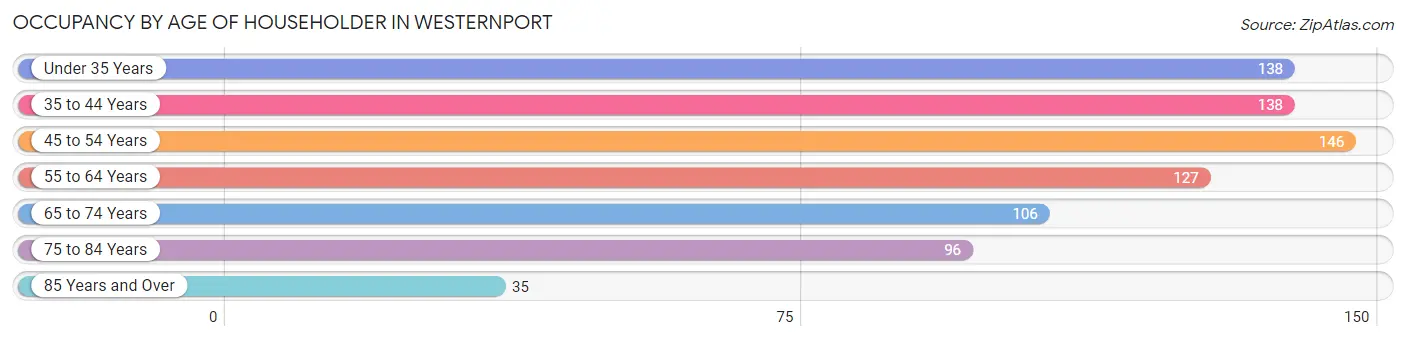
| Age Bracket | # Households | % Households |
| Under 35 Years | 138 | 17.6% |
| 35 to 44 Years | 138 | 17.6% |
| 45 to 54 Years | 146 | 18.6% |
| 55 to 64 Years | 127 | 16.2% |
| 65 to 74 Years | 106 | 13.5% |
| 75 to 84 Years | 96 | 12.2% |
| 85 Years and Over | 35 | 4.4% |
| Total | 786 | 100.0% |
Housing Finances in Westernport
Median Income by Occupancy in Westernport
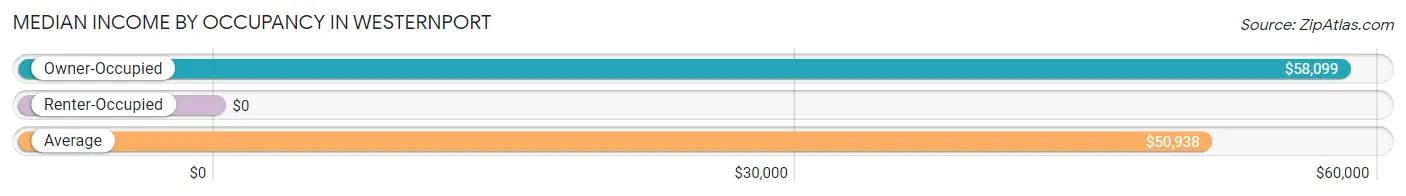
| Occupancy Type | # Households | Median Income |
| Owner-Occupied | 621 (79.0%) | $58,099 |
| Renter-Occupied | 165 (21.0%) | $0 |
| Average | 786 (100.0%) | $50,938 |
Occupancy by Householder Income Bracket in Westernport
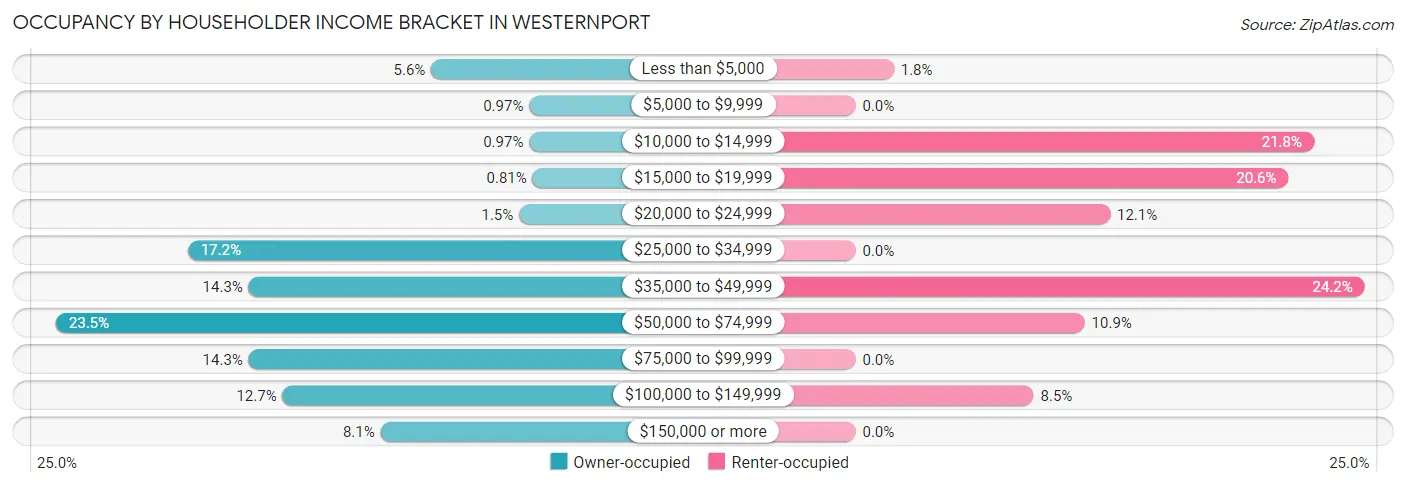
| Income Bracket | Owner-occupied | Renter-occupied |
| Less than $5,000 | 35 (5.6%) | 3 (1.8%) |
| $5,000 to $9,999 | 6 (1.0%) | 0 (0.0%) |
| $10,000 to $14,999 | 6 (1.0%) | 36 (21.8%) |
| $15,000 to $19,999 | 5 (0.8%) | 34 (20.6%) |
| $20,000 to $24,999 | 9 (1.5%) | 20 (12.1%) |
| $25,000 to $34,999 | 107 (17.2%) | 0 (0.0%) |
| $35,000 to $49,999 | 89 (14.3%) | 40 (24.2%) |
| $50,000 to $74,999 | 146 (23.5%) | 18 (10.9%) |
| $75,000 to $99,999 | 89 (14.3%) | 0 (0.0%) |
| $100,000 to $149,999 | 79 (12.7%) | 14 (8.5%) |
| $150,000 or more | 50 (8.1%) | 0 (0.0%) |
| Total | 621 (100.0%) | 165 (100.0%) |
Monthly Housing Cost Tiers in Westernport
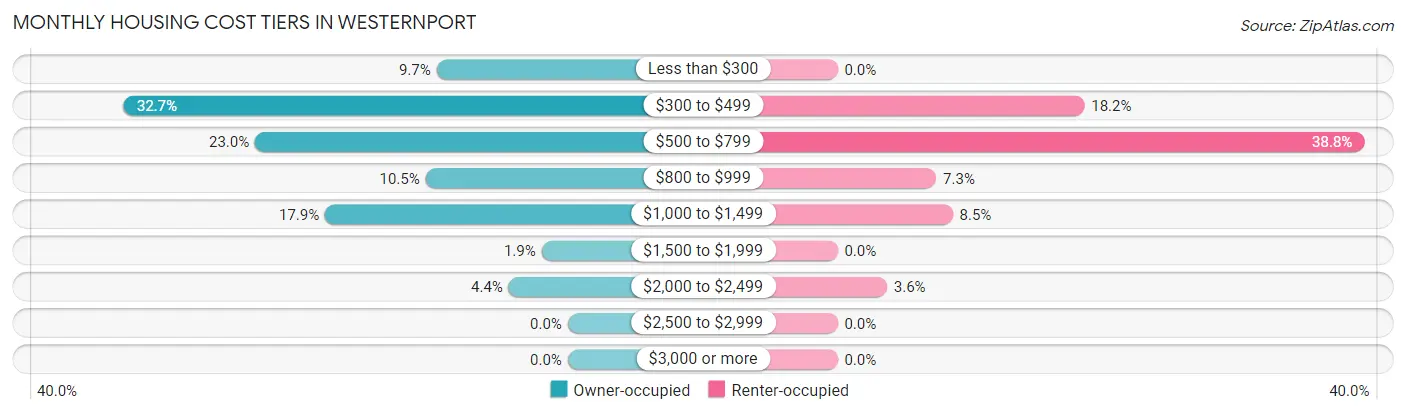
| Monthly Cost | Owner-occupied | Renter-occupied |
| Less than $300 | 60 (9.7%) | 0 (0.0%) |
| $300 to $499 | 203 (32.7%) | 30 (18.2%) |
| $500 to $799 | 143 (23.0%) | 64 (38.8%) |
| $800 to $999 | 65 (10.5%) | 12 (7.3%) |
| $1,000 to $1,499 | 111 (17.9%) | 14 (8.5%) |
| $1,500 to $1,999 | 12 (1.9%) | 0 (0.0%) |
| $2,000 to $2,499 | 27 (4.3%) | 6 (3.6%) |
| $2,500 to $2,999 | 0 (0.0%) | 0 (0.0%) |
| $3,000 or more | 0 (0.0%) | 0 (0.0%) |
| Total | 621 (100.0%) | 165 (100.0%) |
Physical Housing Characteristics in Westernport
Housing Structures in Westernport
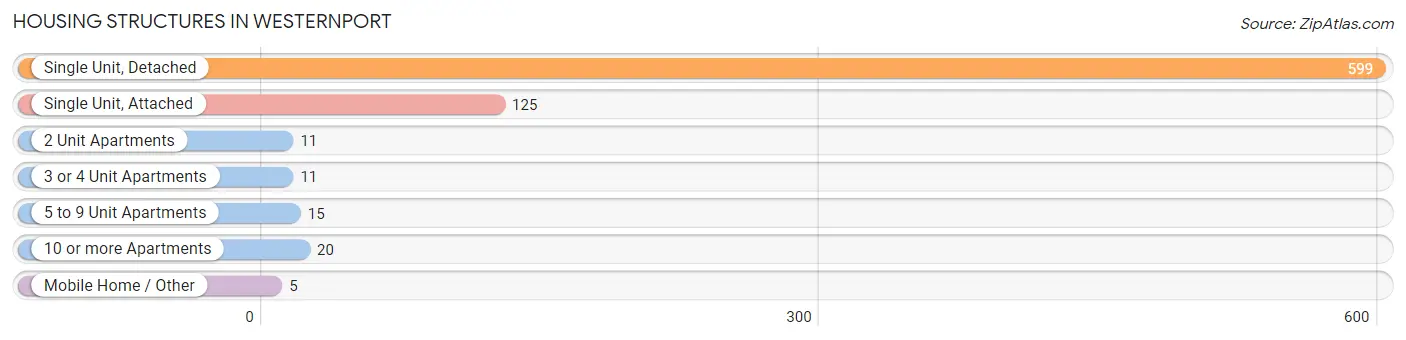
| Structure Type | # Housing Units | % Housing Units |
| Single Unit, Detached | 599 | 76.2% |
| Single Unit, Attached | 125 | 15.9% |
| 2 Unit Apartments | 11 | 1.4% |
| 3 or 4 Unit Apartments | 11 | 1.4% |
| 5 to 9 Unit Apartments | 15 | 1.9% |
| 10 or more Apartments | 20 | 2.5% |
| Mobile Home / Other | 5 | 0.6% |
| Total | 786 | 100.0% |
Housing Structures by Occupancy in Westernport
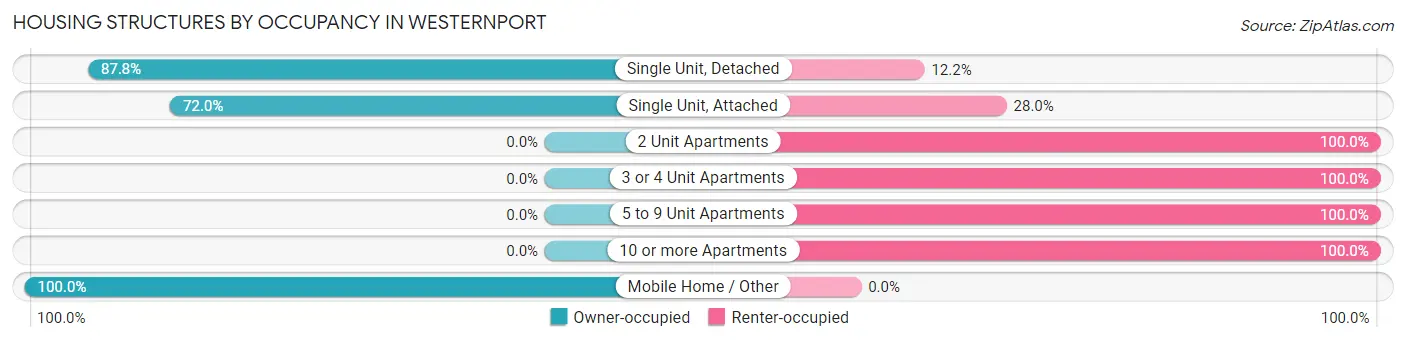
| Structure Type | Owner-occupied | Renter-occupied |
| Single Unit, Detached | 526 (87.8%) | 73 (12.2%) |
| Single Unit, Attached | 90 (72.0%) | 35 (28.0%) |
| 2 Unit Apartments | 0 (0.0%) | 11 (100.0%) |
| 3 or 4 Unit Apartments | 0 (0.0%) | 11 (100.0%) |
| 5 to 9 Unit Apartments | 0 (0.0%) | 15 (100.0%) |
| 10 or more Apartments | 0 (0.0%) | 20 (100.0%) |
| Mobile Home / Other | 5 (100.0%) | 0 (0.0%) |
| Total | 621 (79.0%) | 165 (21.0%) |
Housing Structures by Number of Rooms in Westernport
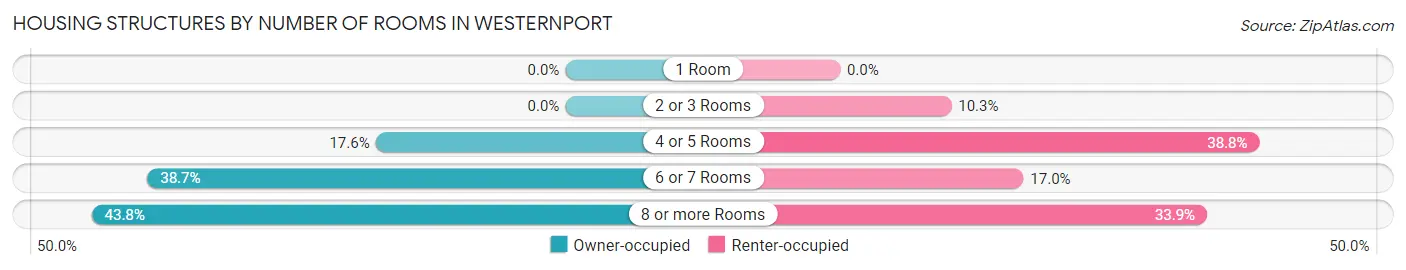
| Number of Rooms | Owner-occupied | Renter-occupied |
| 1 Room | 0 (0.0%) | 0 (0.0%) |
| 2 or 3 Rooms | 0 (0.0%) | 17 (10.3%) |
| 4 or 5 Rooms | 109 (17.5%) | 64 (38.8%) |
| 6 or 7 Rooms | 240 (38.7%) | 28 (17.0%) |
| 8 or more Rooms | 272 (43.8%) | 56 (33.9%) |
| Total | 621 (100.0%) | 165 (100.0%) |
Housing Structure by Heating Type in Westernport
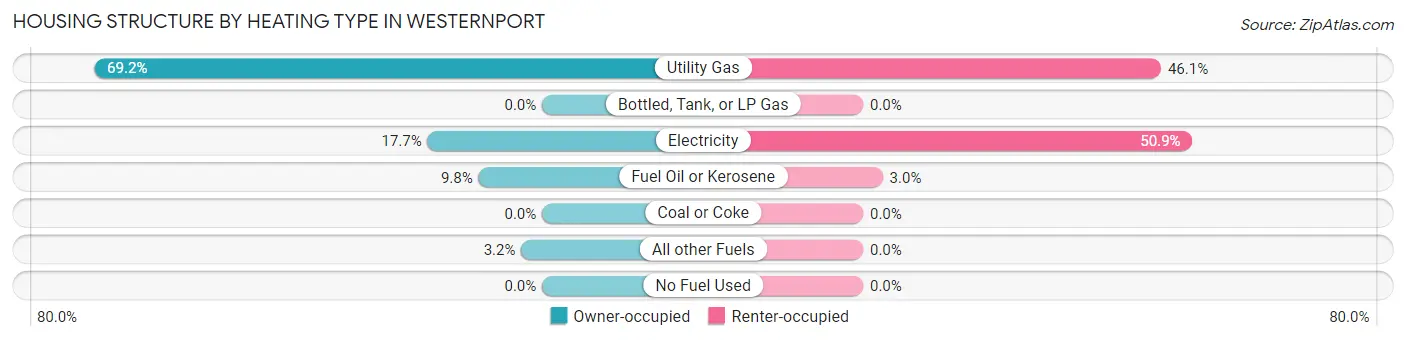
| Heating Type | Owner-occupied | Renter-occupied |
| Utility Gas | 430 (69.2%) | 76 (46.1%) |
| Bottled, Tank, or LP Gas | 0 (0.0%) | 0 (0.0%) |
| Electricity | 110 (17.7%) | 84 (50.9%) |
| Fuel Oil or Kerosene | 61 (9.8%) | 5 (3.0%) |
| Coal or Coke | 0 (0.0%) | 0 (0.0%) |
| All other Fuels | 20 (3.2%) | 0 (0.0%) |
| No Fuel Used | 0 (0.0%) | 0 (0.0%) |
| Total | 621 (100.0%) | 165 (100.0%) |
Household Vehicle Usage in Westernport
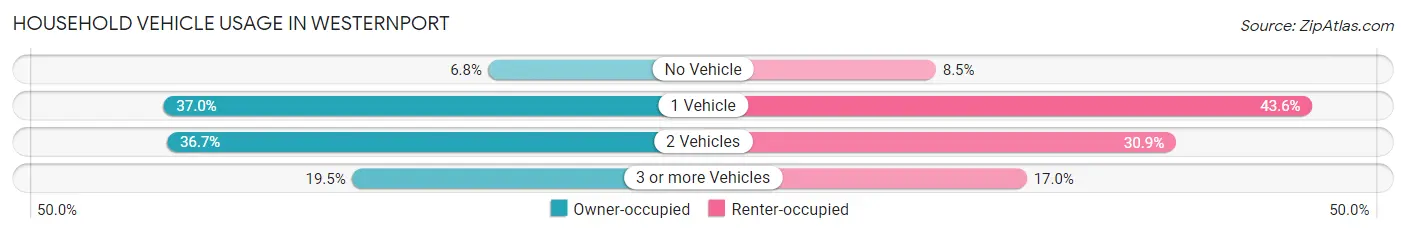
| Vehicles per Household | Owner-occupied | Renter-occupied |
| No Vehicle | 42 (6.8%) | 14 (8.5%) |
| 1 Vehicle | 230 (37.0%) | 72 (43.6%) |
| 2 Vehicles | 228 (36.7%) | 51 (30.9%) |
| 3 or more Vehicles | 121 (19.5%) | 28 (17.0%) |
| Total | 621 (100.0%) | 165 (100.0%) |
Real Estate & Mortgages in Westernport
Real Estate and Mortgage Overview in Westernport
| Characteristic | Without Mortgage | With Mortgage |
| Housing Units | 351 | 270 |
| Median Property Value | $57,500 | $121,500 |
| Median Household Income | $48,194 | $7 |
| Monthly Housing Costs | $413 | $0 |
| Real Estate Taxes | $914 | $0 |
Property Value by Mortgage Status in Westernport
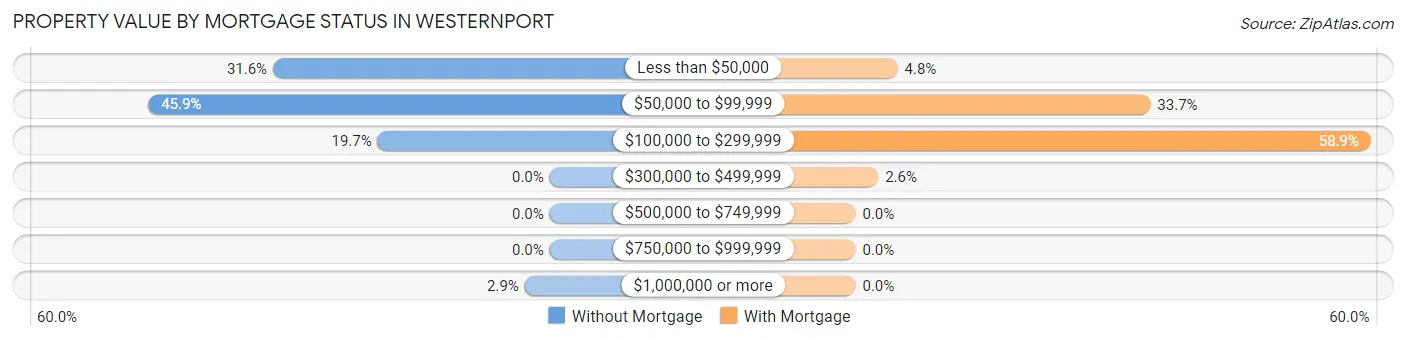
| Property Value | Without Mortgage | With Mortgage |
| Less than $50,000 | 111 (31.6%) | 13 (4.8%) |
| $50,000 to $99,999 | 161 (45.9%) | 91 (33.7%) |
| $100,000 to $299,999 | 69 (19.7%) | 159 (58.9%) |
| $300,000 to $499,999 | 0 (0.0%) | 7 (2.6%) |
| $500,000 to $749,999 | 0 (0.0%) | 0 (0.0%) |
| $750,000 to $999,999 | 0 (0.0%) | 0 (0.0%) |
| $1,000,000 or more | 10 (2.9%) | 0 (0.0%) |
| Total | 351 (100.0%) | 270 (100.0%) |
Household Income by Mortgage Status in Westernport
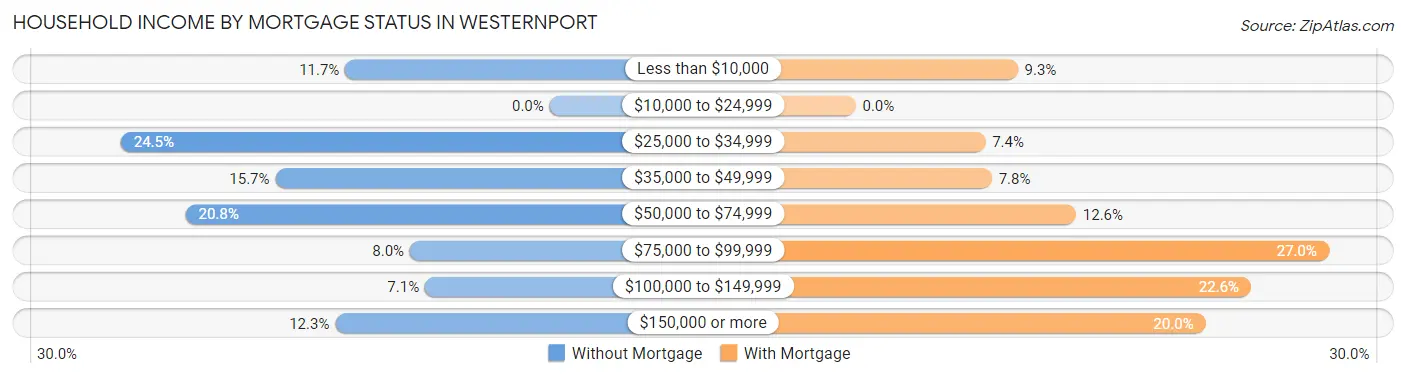
| Household Income | Without Mortgage | With Mortgage |
| Less than $10,000 | 41 (11.7%) | 25 (9.3%) |
| $10,000 to $24,999 | 0 (0.0%) | 0 (0.0%) |
| $25,000 to $34,999 | 86 (24.5%) | 20 (7.4%) |
| $35,000 to $49,999 | 55 (15.7%) | 21 (7.8%) |
| $50,000 to $74,999 | 73 (20.8%) | 34 (12.6%) |
| $75,000 to $99,999 | 28 (8.0%) | 73 (27.0%) |
| $100,000 to $149,999 | 25 (7.1%) | 61 (22.6%) |
| $150,000 or more | 43 (12.2%) | 54 (20.0%) |
| Total | 351 (100.0%) | 270 (100.0%) |
Property Value to Household Income Ratio in Westernport
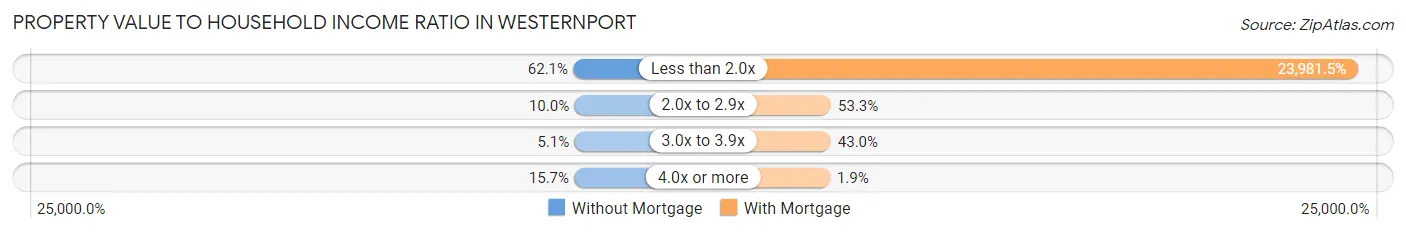
| Value-to-Income Ratio | Without Mortgage | With Mortgage |
| Less than 2.0x | 218 (62.1%) | 64,750 (23,981.5%) |
| 2.0x to 2.9x | 35 (10.0%) | 144 (53.3%) |
| 3.0x to 3.9x | 18 (5.1%) | 116 (43.0%) |
| 4.0x or more | 55 (15.7%) | 5 (1.8%) |
| Total | 351 (100.0%) | 270 (100.0%) |
Real Estate Taxes by Mortgage Status in Westernport
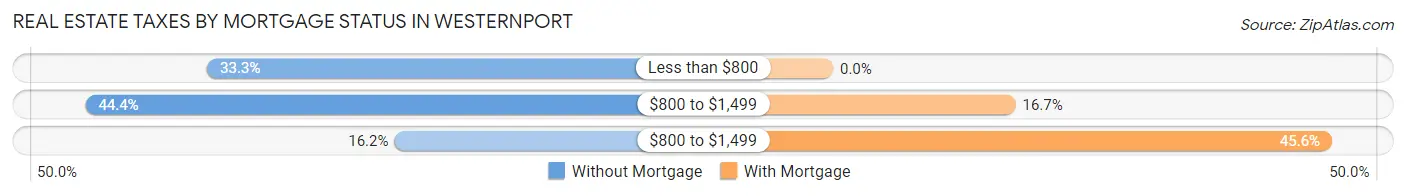
| Property Taxes | Without Mortgage | With Mortgage |
| Less than $800 | 117 (33.3%) | 0 (0.0%) |
| $800 to $1,499 | 156 (44.4%) | 45 (16.7%) |
| $800 to $1,499 | 57 (16.2%) | 123 (45.6%) |
| Total | 351 (100.0%) | 270 (100.0%) |
Health & Disability in Westernport
Health Insurance Coverage by Age in Westernport
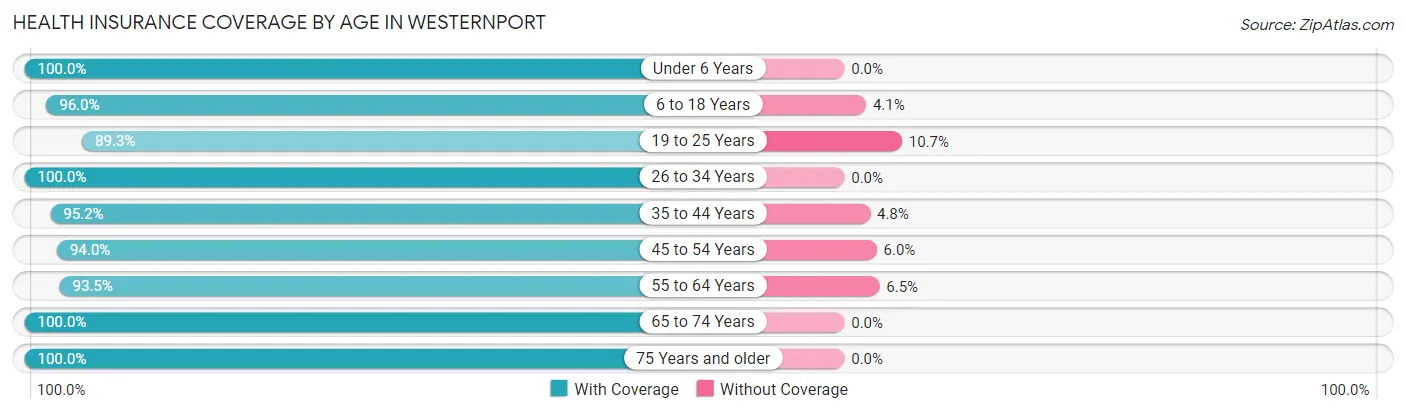
| Age Bracket | With Coverage | Without Coverage |
| Under 6 Years | 260 (100.0%) | 0 (0.0%) |
| 6 to 18 Years | 308 (96.0%) | 13 (4.1%) |
| 19 to 25 Years | 233 (89.3%) | 28 (10.7%) |
| 26 to 34 Years | 94 (100.0%) | 0 (0.0%) |
| 35 to 44 Years | 238 (95.2%) | 12 (4.8%) |
| 45 to 54 Years | 265 (94.0%) | 17 (6.0%) |
| 55 to 64 Years | 200 (93.5%) | 14 (6.5%) |
| 65 to 74 Years | 148 (100.0%) | 0 (0.0%) |
| 75 Years and older | 163 (100.0%) | 0 (0.0%) |
| Total | 1,909 (95.8%) | 84 (4.2%) |
Health Insurance Coverage by Citizenship Status in Westernport
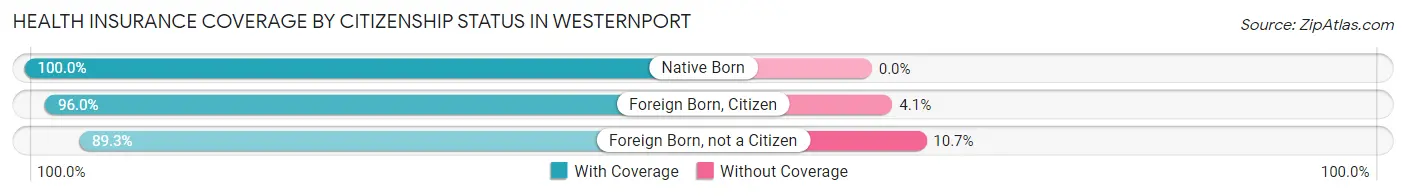
| Citizenship Status | With Coverage | Without Coverage |
| Native Born | 260 (100.0%) | 0 (0.0%) |
| Foreign Born, Citizen | 308 (96.0%) | 13 (4.1%) |
| Foreign Born, not a Citizen | 233 (89.3%) | 28 (10.7%) |
Health Insurance Coverage by Household Income in Westernport
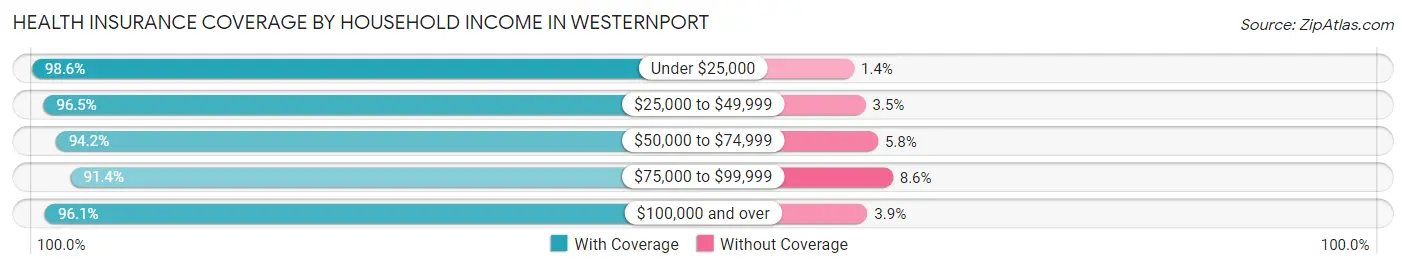
| Household Income | With Coverage | Without Coverage |
| Under $25,000 | 432 (98.6%) | 6 (1.4%) |
| $25,000 to $49,999 | 439 (96.5%) | 16 (3.5%) |
| $50,000 to $74,999 | 403 (94.2%) | 25 (5.8%) |
| $75,000 to $99,999 | 212 (91.4%) | 20 (8.6%) |
| $100,000 and over | 423 (96.1%) | 17 (3.9%) |
Public vs Private Health Insurance Coverage by Age in Westernport
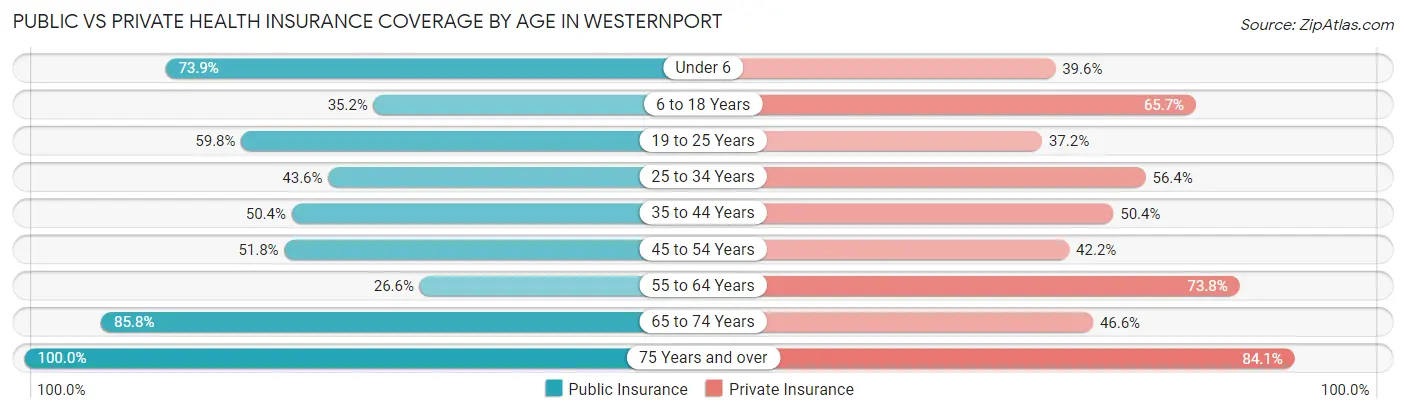
| Age Bracket | Public Insurance | Private Insurance |
| Under 6 | 192 (73.9%) | 103 (39.6%) |
| 6 to 18 Years | 113 (35.2%) | 211 (65.7%) |
| 19 to 25 Years | 156 (59.8%) | 97 (37.2%) |
| 25 to 34 Years | 41 (43.6%) | 53 (56.4%) |
| 35 to 44 Years | 126 (50.4%) | 126 (50.4%) |
| 45 to 54 Years | 146 (51.8%) | 119 (42.2%) |
| 55 to 64 Years | 57 (26.6%) | 158 (73.8%) |
| 65 to 74 Years | 127 (85.8%) | 69 (46.6%) |
| 75 Years and over | 163 (100.0%) | 137 (84.1%) |
| Total | 1,121 (56.2%) | 1,073 (53.8%) |
Disability Status by Sex by Age in Westernport
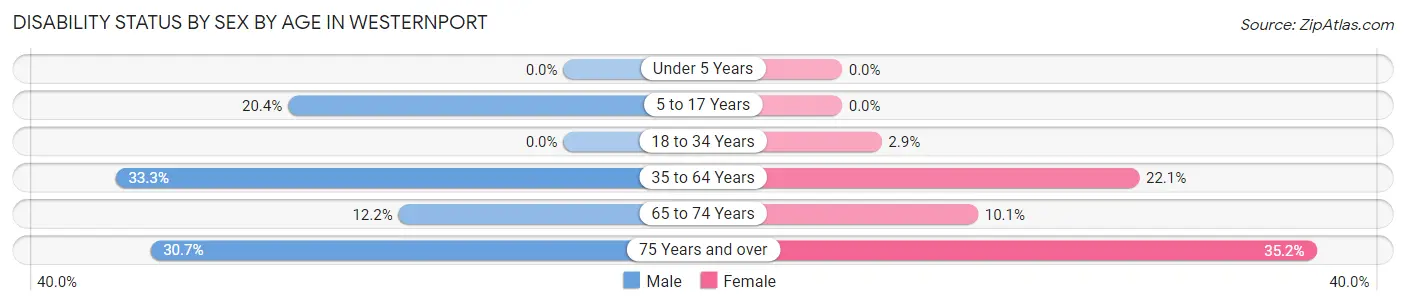
| Age Bracket | Male | Female |
| Under 5 Years | 0 (0.0%) | 0 (0.0%) |
| 5 to 17 Years | 28 (20.4%) | 0 (0.0%) |
| 18 to 34 Years | 0 (0.0%) | 6 (2.9%) |
| 35 to 64 Years | 129 (33.3%) | 79 (22.1%) |
| 65 to 74 Years | 6 (12.2%) | 10 (10.1%) |
| 75 Years and over | 23 (30.7%) | 31 (35.2%) |
Disability Class by Sex by Age in Westernport
Disability Class: Hearing Difficulty
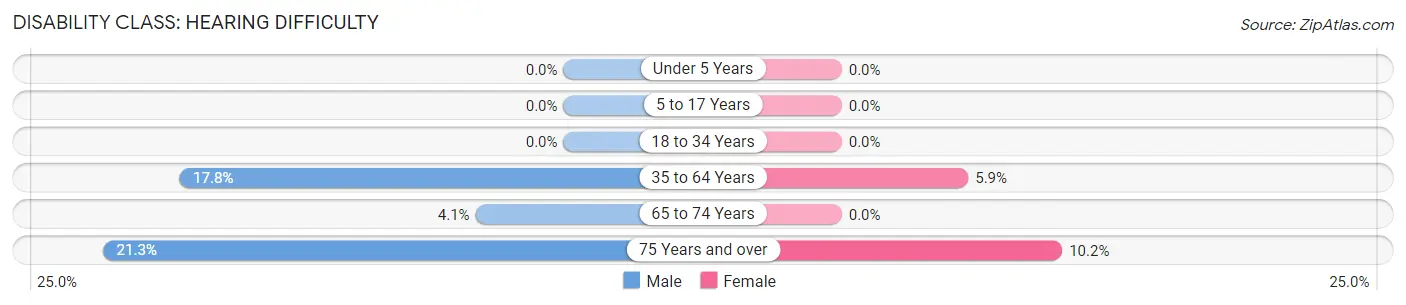
| Age Bracket | Male | Female |
| Under 5 Years | 0 (0.0%) | 0 (0.0%) |
| 5 to 17 Years | 0 (0.0%) | 0 (0.0%) |
| 18 to 34 Years | 0 (0.0%) | 0 (0.0%) |
| 35 to 64 Years | 69 (17.8%) | 21 (5.9%) |
| 65 to 74 Years | 2 (4.1%) | 0 (0.0%) |
| 75 Years and over | 16 (21.3%) | 9 (10.2%) |
Disability Class: Vision Difficulty
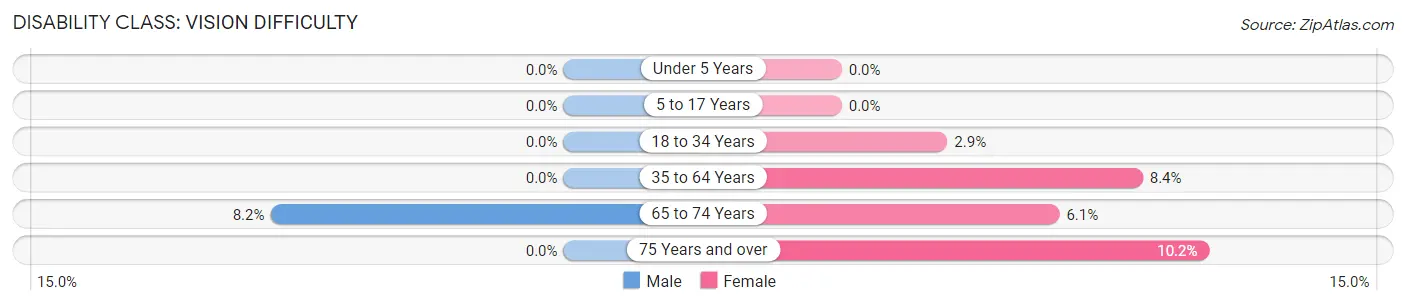
| Age Bracket | Male | Female |
| Under 5 Years | 0 (0.0%) | 0 (0.0%) |
| 5 to 17 Years | 0 (0.0%) | 0 (0.0%) |
| 18 to 34 Years | 0 (0.0%) | 6 (2.9%) |
| 35 to 64 Years | 0 (0.0%) | 30 (8.4%) |
| 65 to 74 Years | 4 (8.2%) | 6 (6.1%) |
| 75 Years and over | 0 (0.0%) | 9 (10.2%) |
Disability Class: Cognitive Difficulty
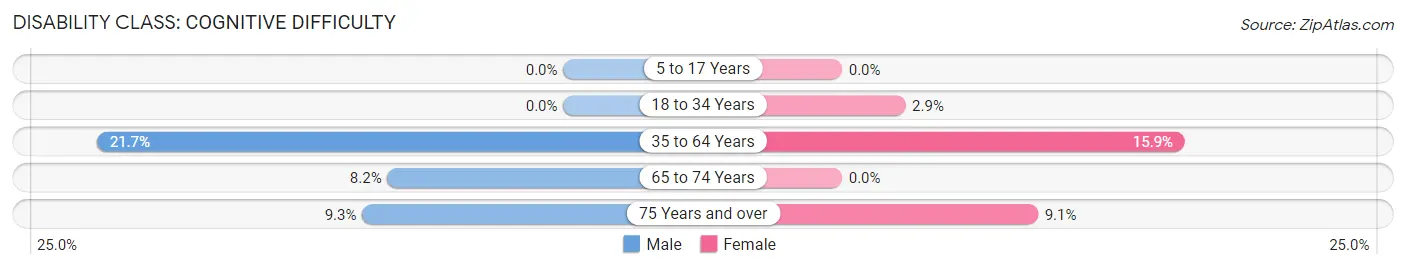
| Age Bracket | Male | Female |
| 5 to 17 Years | 0 (0.0%) | 0 (0.0%) |
| 18 to 34 Years | 0 (0.0%) | 6 (2.9%) |
| 35 to 64 Years | 84 (21.6%) | 57 (15.9%) |
| 65 to 74 Years | 4 (8.2%) | 0 (0.0%) |
| 75 Years and over | 7 (9.3%) | 8 (9.1%) |
Disability Class: Ambulatory Difficulty
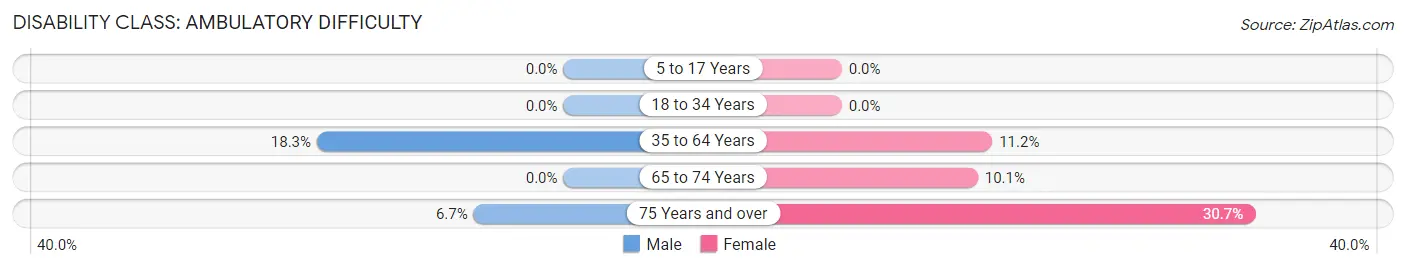
| Age Bracket | Male | Female |
| 5 to 17 Years | 0 (0.0%) | 0 (0.0%) |
| 18 to 34 Years | 0 (0.0%) | 0 (0.0%) |
| 35 to 64 Years | 71 (18.3%) | 40 (11.2%) |
| 65 to 74 Years | 0 (0.0%) | 10 (10.1%) |
| 75 Years and over | 5 (6.7%) | 27 (30.7%) |
Disability Class: Self-Care Difficulty
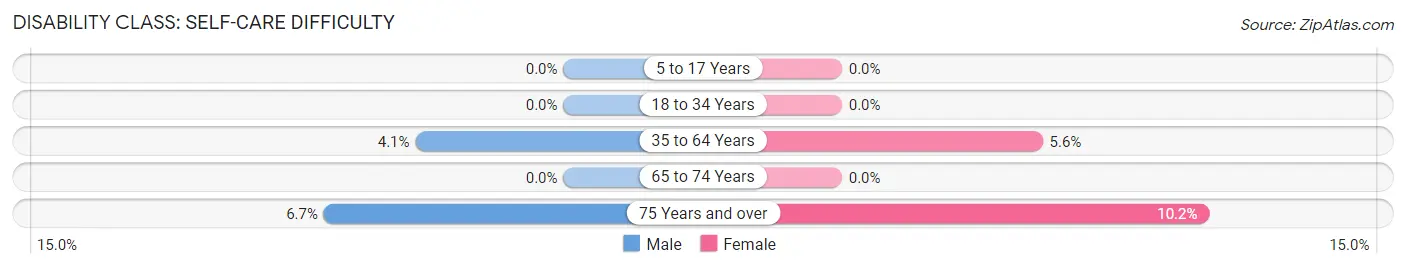
| Age Bracket | Male | Female |
| 5 to 17 Years | 0 (0.0%) | 0 (0.0%) |
| 18 to 34 Years | 0 (0.0%) | 0 (0.0%) |
| 35 to 64 Years | 16 (4.1%) | 20 (5.6%) |
| 65 to 74 Years | 0 (0.0%) | 0 (0.0%) |
| 75 Years and over | 5 (6.7%) | 9 (10.2%) |
Technology Access in Westernport
Computing Device Access in Westernport
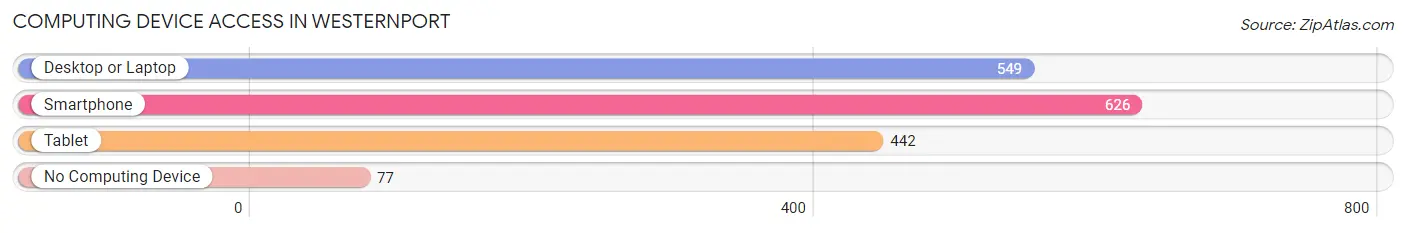
| Device Type | # Households | % Households |
| Desktop or Laptop | 549 | 69.9% |
| Smartphone | 626 | 79.6% |
| Tablet | 442 | 56.2% |
| No Computing Device | 77 | 9.8% |
| Total | 786 | 100.0% |
Internet Access in Westernport
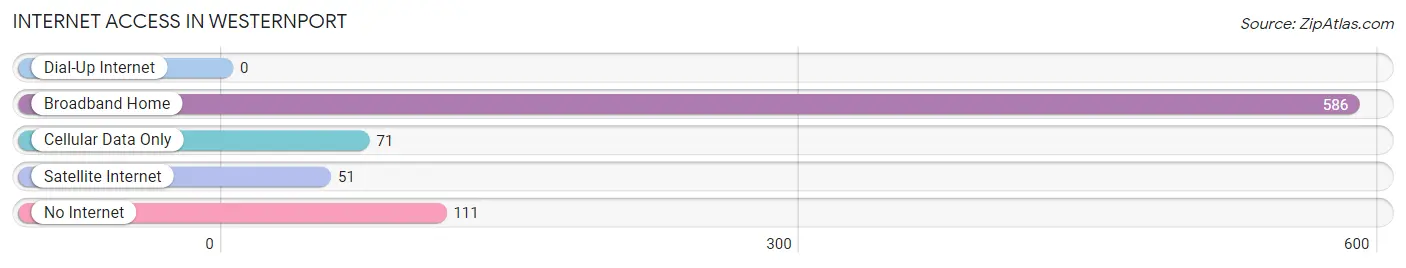
| Internet Type | # Households | % Households |
| Dial-Up Internet | 0 | 0.0% |
| Broadband Home | 586 | 74.6% |
| Cellular Data Only | 71 | 9.0% |
| Satellite Internet | 51 | 6.5% |
| No Internet | 111 | 14.1% |
| Total | 786 | 100.0% |
Westernport Summary
Westernport is a town located in Allegany County, Maryland. It is situated in the Appalachian Mountains, near the border of West Virginia. The town has a population of 1,845 as of the 2010 census.
History
The town of Westernport was founded in 1837 by a group of settlers from Pennsylvania. The town was named after the nearby Westernport Creek, which was named by early settlers for its location at the westernmost point of the Potomac River. The town was incorporated in 1871.
In the late 19th century, Westernport was a major coal mining center. The town was home to several coal mines, including the Westernport Coal Company, which operated from 1887 to 1902. The coal industry in Westernport declined in the early 20th century, and the town shifted its focus to other industries, such as manufacturing and tourism.
Geography
Westernport is located in the Appalachian Mountains, near the border of West Virginia. The town is situated at the confluence of the North Branch of the Potomac River and the Westernport Creek. The town is surrounded by mountains, including the Allegheny Front, which is the highest point in Maryland.
The town has a total area of 1.2 square miles, all of which is land. The town is located at an elevation of 1,845 feet above sea level.
Economy
The economy of Westernport is largely based on tourism and manufacturing. The town is home to several tourist attractions, including the Westernport Heritage Museum, which showcases the town’s history and culture. The town is also home to several manufacturing companies, including a paper mill and a furniture factory.
Demographics
As of the 2010 census, the town of Westernport had a population of 1,845. The racial makeup of the town was 95.2% White, 1.2% African American, 0.3% Native American, 0.7% Asian, 0.1% Pacific Islander, 0.7% from other races, and 1.8% from two or more races. Hispanic or Latino of any race were 1.7% of the population.
The median income for a household in the town was $35,938, and the median income for a family was $41,250. The per capita income for the town was $17,845. About 11.2% of families and 14.2% of the population were below the poverty line, including 19.2% of those under age 18 and 8.3% of those age 65 or over.
Common Questions
What is Per Capita Income in Westernport?
Per Capita income in Westernport is $29,406.
What is the Median Family Income in Westernport?
Median Family Income in Westernport is $56,691.
What is the Median Household income in Westernport?
Median Household Income in Westernport is $50,938.
What is Income or Wage Gap in Westernport?
Income or Wage Gap in Westernport is 57.2%.
Women in Westernport earn 42.8 cents for every dollar earned by a man.
What is Family Income Deficit in Westernport?
Family Income Deficit in Westernport is $17,123.
Families that are below poverty line in Westernport earn $17,123 less on average than the poverty threshold level.
What is Inequality or Gini Index in Westernport?
Inequality or Gini Index in Westernport is 0.49.
What is the Total Population of Westernport?
Total Population of Westernport is 1,993.
What is the Total Male Population of Westernport?
Total Male Population of Westernport is 922.
What is the Total Female Population of Westernport?
Total Female Population of Westernport is 1,071.
What is the Ratio of Males per 100 Females in Westernport?
There are 86.09 Males per 100 Females in Westernport.
What is the Ratio of Females per 100 Males in Westernport?
There are 116.16 Females per 100 Males in Westernport.
What is the Median Population Age in Westernport?
Median Population Age in Westernport is 37.5 Years.
What is the Average Family Size in Westernport
Average Family Size in Westernport is 3.0 People.
What is the Average Household Size in Westernport
Average Household Size in Westernport is 2.5 People.
How Large is the Labor Force in Westernport?
There are 822 People in the Labor Forcein in Westernport.
What is the Percentage of People in the Labor Force in Westernport?
52.8% of People are in the Labor Force in Westernport.
What is the Unemployment Rate in Westernport?
Unemployment Rate in Westernport is 6.1%.