Union Bridge, MD Map & Demographics
Union Bridge Map
Union Bridge Overview
$32,231
PER CAPITA INCOME
$66,136
AVG FAMILY INCOME
$62,841
AVG HOUSEHOLD INCOME
40.8%
WAGE / INCOME GAP [ % ]
59.2¢/ $1
WAGE / INCOME GAP [ $ ]
0.34
INEQUALITY / GINI INDEX
939
TOTAL POPULATION
526
MALE POPULATION
413
FEMALE POPULATION
127.36
MALES / 100 FEMALES
78.52
FEMALES / 100 MALES
36.5
MEDIAN AGE
3.1
AVG FAMILY SIZE
2.1
AVG HOUSEHOLD SIZE
531
LABOR FORCE [ PEOPLE ]
69.7%
PERCENT IN LABOR FORCE
0.9%
UNEMPLOYMENT RATE
Union Bridge Zip Codes
Income in Union Bridge
Income Overview in Union Bridge
Per Capita Income in Union Bridge is $32,231, while median incomes of families and households are $66,136 and $62,841 respectively.
| Characteristic | Number | Measure |
| Per Capita Income | 939 | $32,231 |
| Median Family Income | 190 | $66,136 |
| Mean Family Income | 190 | $77,864 |
| Median Household Income | 447 | $62,841 |
| Mean Household Income | 447 | $67,252 |
| Income Deficit | 190 | $0 |
| Wage / Income Gap (%) | 939 | 40.82% |
| Wage / Income Gap ($) | 939 | 59.18¢ per $1 |
| Gini / Inequality Index | 939 | 0.34 |
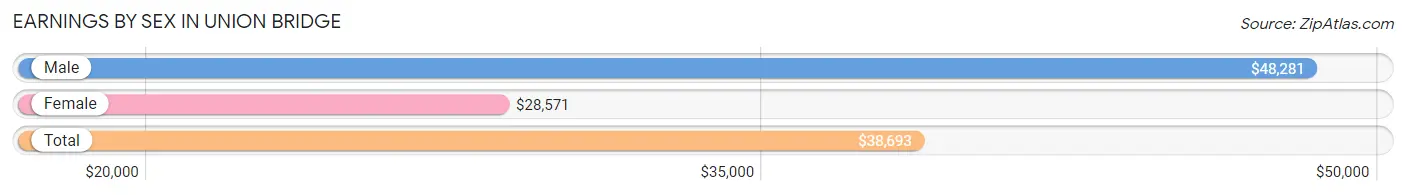
Earnings by Sex in Union Bridge
Average Earnings in Union Bridge are $38,693, $48,281 for men and $28,571 for women, a difference of 40.8%.
| Sex | Number | Average Earnings |
| Male | 351 (65.4%) | $48,281 |
| Female | 186 (34.6%) | $28,571 |
| Total | 537 (100.0%) | $38,693 |
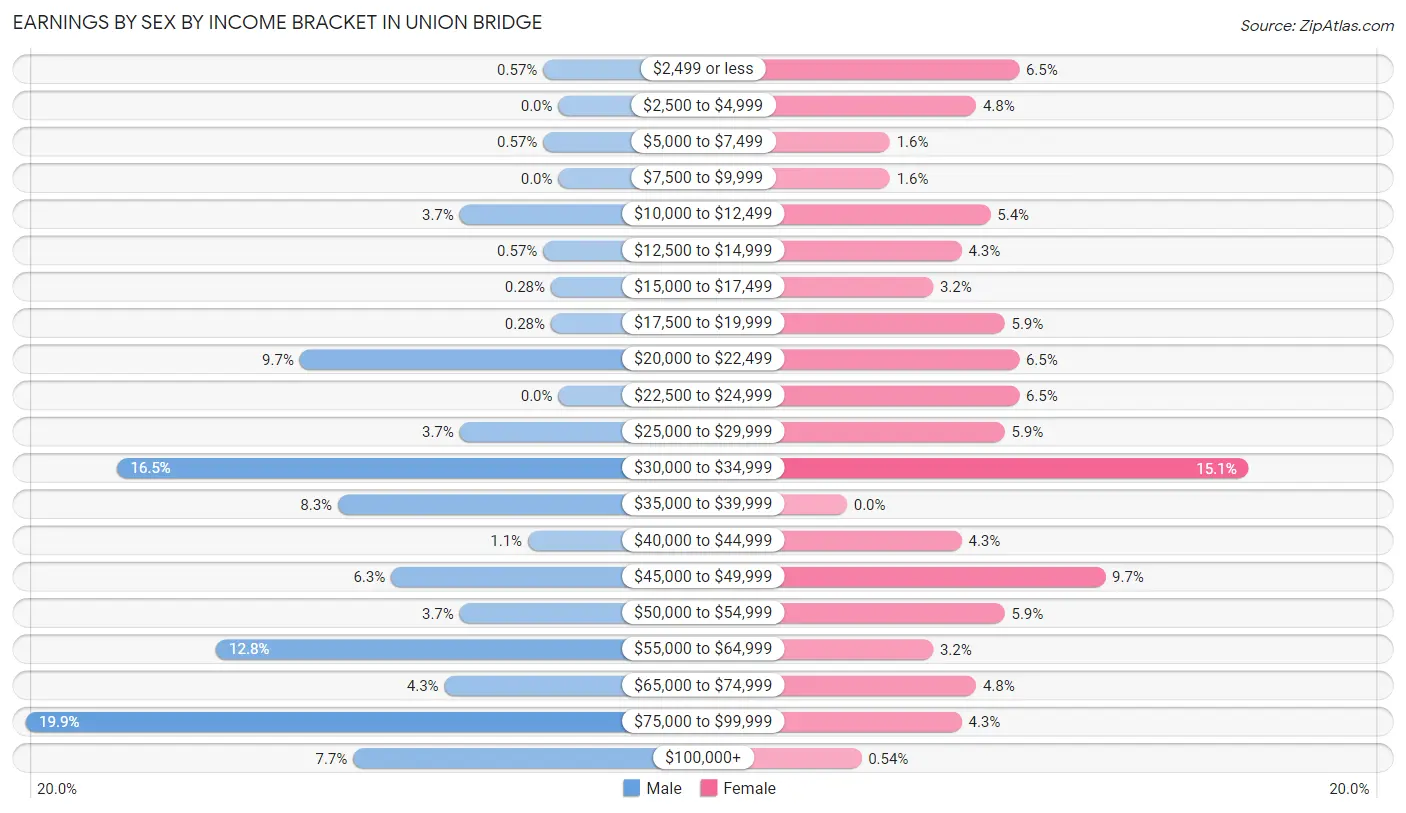
Earnings by Sex by Income Bracket in Union Bridge
The most common earnings brackets in Union Bridge are $75,000 to $99,999 for men (70 | 19.9%) and $30,000 to $34,999 for women (28 | 15.0%).
| Income | Male | Female |
| $2,499 or less | 2 (0.6%) | 12 (6.5%) |
| $2,500 to $4,999 | 0 (0.0%) | 9 (4.8%) |
| $5,000 to $7,499 | 2 (0.6%) | 3 (1.6%) |
| $7,500 to $9,999 | 0 (0.0%) | 3 (1.6%) |
| $10,000 to $12,499 | 13 (3.7%) | 10 (5.4%) |
| $12,500 to $14,999 | 2 (0.6%) | 8 (4.3%) |
| $15,000 to $17,499 | 1 (0.3%) | 6 (3.2%) |
| $17,500 to $19,999 | 1 (0.3%) | 11 (5.9%) |
| $20,000 to $22,499 | 34 (9.7%) | 12 (6.5%) |
| $22,500 to $24,999 | 0 (0.0%) | 12 (6.5%) |
| $25,000 to $29,999 | 13 (3.7%) | 11 (5.9%) |
| $30,000 to $34,999 | 58 (16.5%) | 28 (15.0%) |
| $35,000 to $39,999 | 29 (8.3%) | 0 (0.0%) |
| $40,000 to $44,999 | 4 (1.1%) | 8 (4.3%) |
| $45,000 to $49,999 | 22 (6.3%) | 18 (9.7%) |
| $50,000 to $54,999 | 13 (3.7%) | 11 (5.9%) |
| $55,000 to $64,999 | 45 (12.8%) | 6 (3.2%) |
| $65,000 to $74,999 | 15 (4.3%) | 9 (4.8%) |
| $75,000 to $99,999 | 70 (19.9%) | 8 (4.3%) |
| $100,000+ | 27 (7.7%) | 1 (0.5%) |
| Total | 351 (100.0%) | 186 (100.0%) |
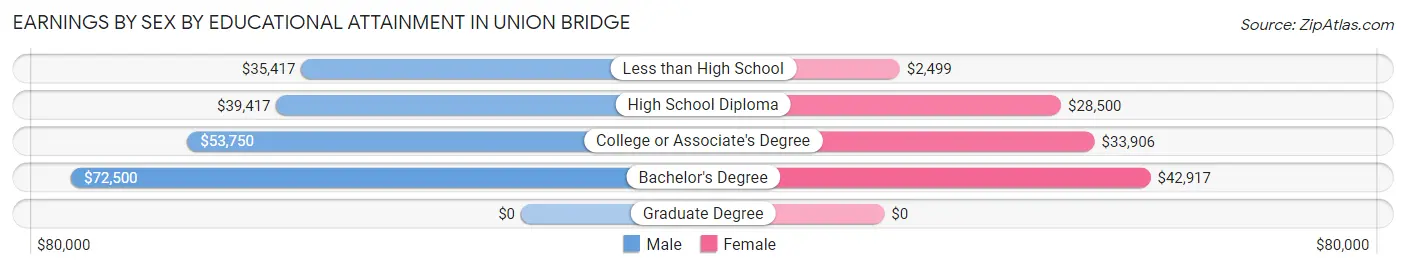
Earnings by Sex by Educational Attainment in Union Bridge
Average earnings in Union Bridge are $54,250 for men and $31,875 for women, a difference of 41.2%. Men with an educational attainment of bachelor's degree enjoy the highest average annual earnings of $72,500, while those with less than high school education earn the least with $35,417. Women with an educational attainment of bachelor's degree earn the most with the average annual earnings of $42,917, while those with less than high school education have the smallest earnings of $2,499.
| Educational Attainment | Male Income | Female Income |
| Less than High School | $35,417 | $2,499 |
| High School Diploma | $39,417 | $28,500 |
| College or Associate's Degree | $53,750 | $33,906 |
| Bachelor's Degree | $72,500 | $42,917 |
| Graduate Degree | - | - |
| Total | $54,250 | $31,875 |
Family Income in Union Bridge
Family Income Brackets in Union Bridge
According to the Union Bridge family income data, there are 35 families falling into the $50,000 to $74,999 income range, which is the most common income bracket and makes up 18.4% of all families.
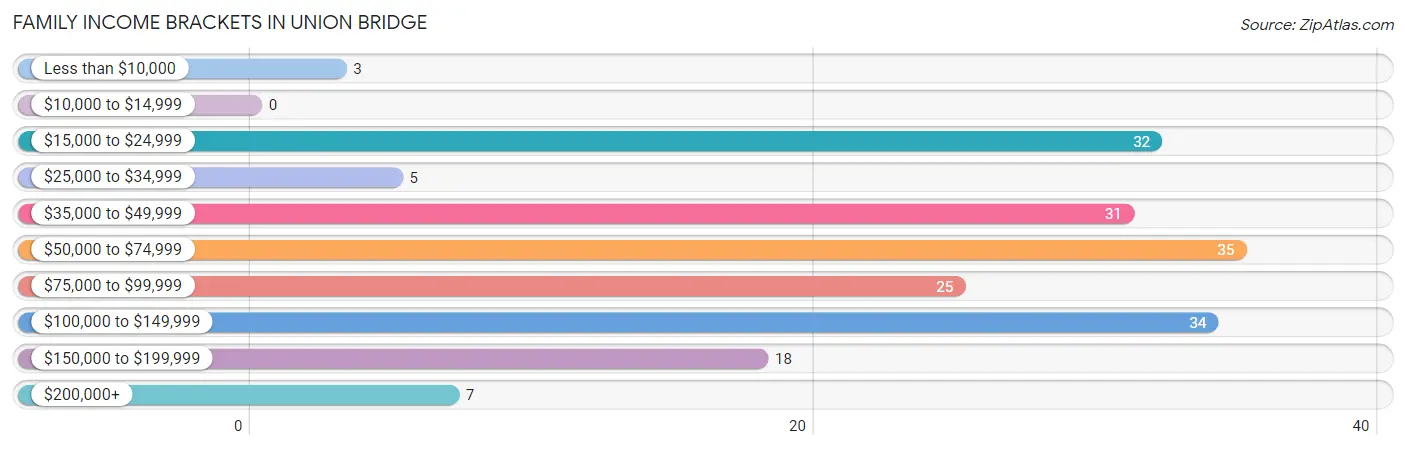
| Income Bracket | # Families | % Families |
| Less than $10,000 | 3 | 1.6% |
| $10,000 to $14,999 | 0 | 0.0% |
| $15,000 to $24,999 | 32 | 16.8% |
| $25,000 to $34,999 | 5 | 2.6% |
| $35,000 to $49,999 | 31 | 16.3% |
| $50,000 to $74,999 | 35 | 18.4% |
| $75,000 to $99,999 | 25 | 13.2% |
| $100,000 to $149,999 | 34 | 17.9% |
| $150,000 to $199,999 | 18 | 9.5% |
| $200,000+ | 7 | 3.7% |
Family Income by Famaliy Size in Union Bridge
5-person families (11 | 5.8%) account for the highest median family income in Union Bridge with $99,583 per family, while 2-person families (76 | 40.0%) have the highest median income of $34,375 per family member.
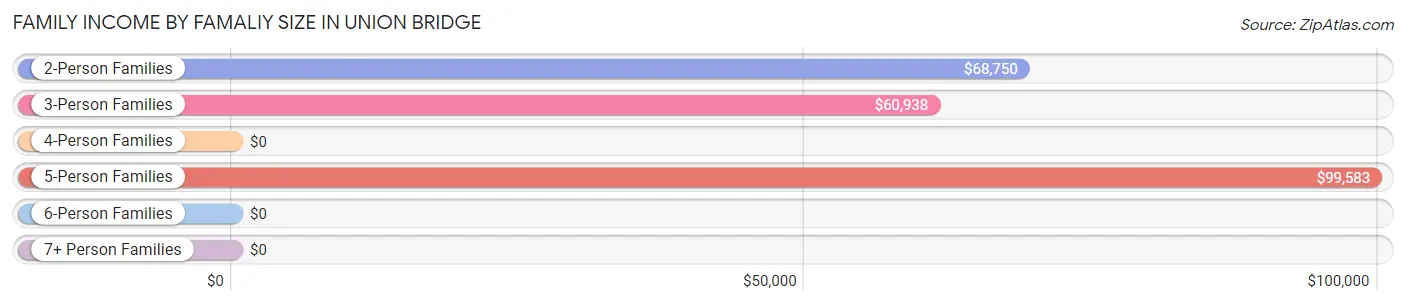
| Income Bracket | # Families | Median Income |
| 2-Person Families | 76 (40.0%) | $68,750 |
| 3-Person Families | 53 (27.9%) | $60,938 |
| 4-Person Families | 46 (24.2%) | $0 |
| 5-Person Families | 11 (5.8%) | $99,583 |
| 6-Person Families | 4 (2.1%) | $0 |
| 7+ Person Families | 0 (0.0%) | $0 |
| Total | 190 (100.0%) | $66,136 |
Family Income by Number of Earners in Union Bridge
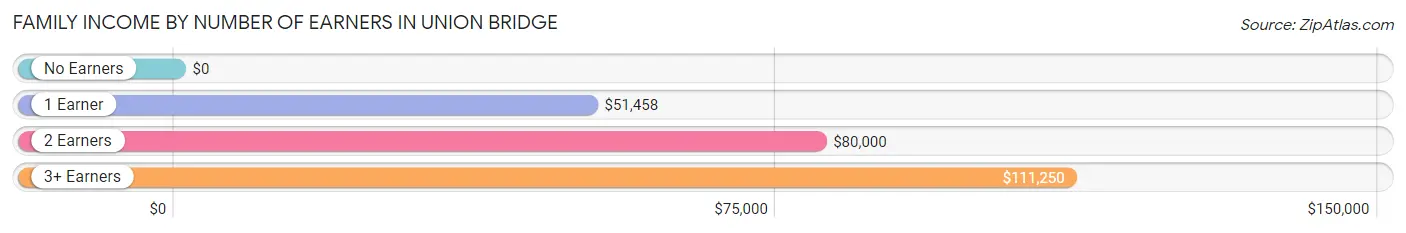
| Number of Earners | # Families | Median Income |
| No Earners | 40 (21.0%) | $0 |
| 1 Earner | 49 (25.8%) | $51,458 |
| 2 Earners | 80 (42.1%) | $80,000 |
| 3+ Earners | 21 (11.1%) | $111,250 |
| Total | 190 (100.0%) | $66,136 |
Household Income in Union Bridge
Household Income Brackets in Union Bridge
With 103 households falling in the category, the $50,000 to $74,999 income range is the most frequent in Union Bridge, accounting for 23.0% of all households. In contrast, only 4 households (0.9%) fall into the less than $10,000 income bracket, making it the least populous group.
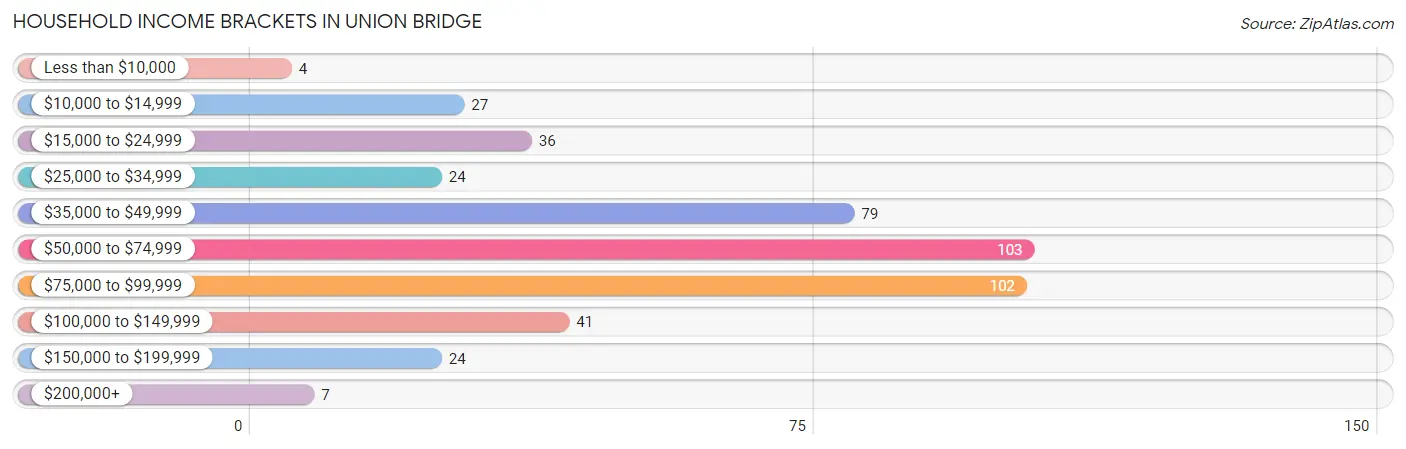
| Income Bracket | # Households | % Households |
| Less than $10,000 | 4 | 0.9% |
| $10,000 to $14,999 | 27 | 6.0% |
| $15,000 to $24,999 | 36 | 8.1% |
| $25,000 to $34,999 | 24 | 5.4% |
| $35,000 to $49,999 | 79 | 17.7% |
| $50,000 to $74,999 | 103 | 23.0% |
| $75,000 to $99,999 | 102 | 22.8% |
| $100,000 to $149,999 | 41 | 9.2% |
| $150,000 to $199,999 | 24 | 5.4% |
| $200,000+ | 7 | 1.6% |
Household Income by Householder Age in Union Bridge
The median household income in Union Bridge is $62,841, with the highest median household income of $80,043 found in the 25 to 44 years age bracket for the primary householder. A total of 186 households (41.6%) fall into this category. Meanwhile, the 15 to 24 years age bracket for the primary householder has the lowest median household income of $0, with 26 households (5.8%) in this group.
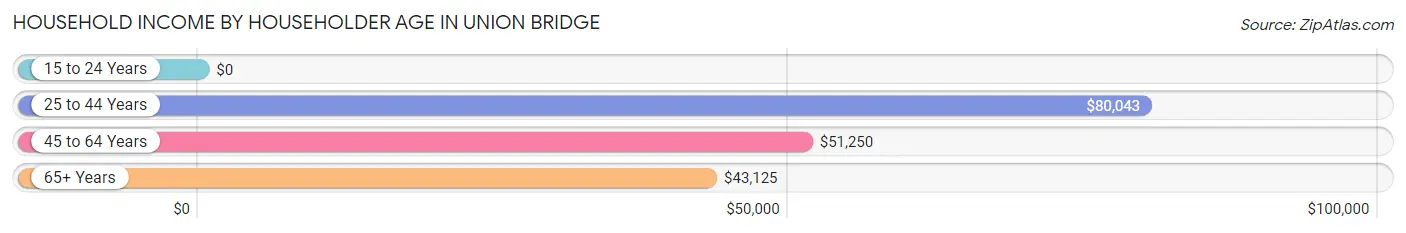
| Income Bracket | # Households | Median Income |
| 15 to 24 Years | 26 (5.8%) | $0 |
| 25 to 44 Years | 186 (41.6%) | $80,043 |
| 45 to 64 Years | 140 (31.3%) | $51,250 |
| 65+ Years | 95 (21.2%) | $43,125 |
| Total | 447 (100.0%) | $62,841 |
Poverty in Union Bridge
Income Below Poverty by Sex and Age in Union Bridge
With 14.6% poverty level for males and 18.4% for females among the residents of Union Bridge, 6 to 11 year old males and under 5 year old females are the most vulnerable to poverty, with 25 males (71.4%) and 16 females (69.6%) in their respective age groups living below the poverty level.
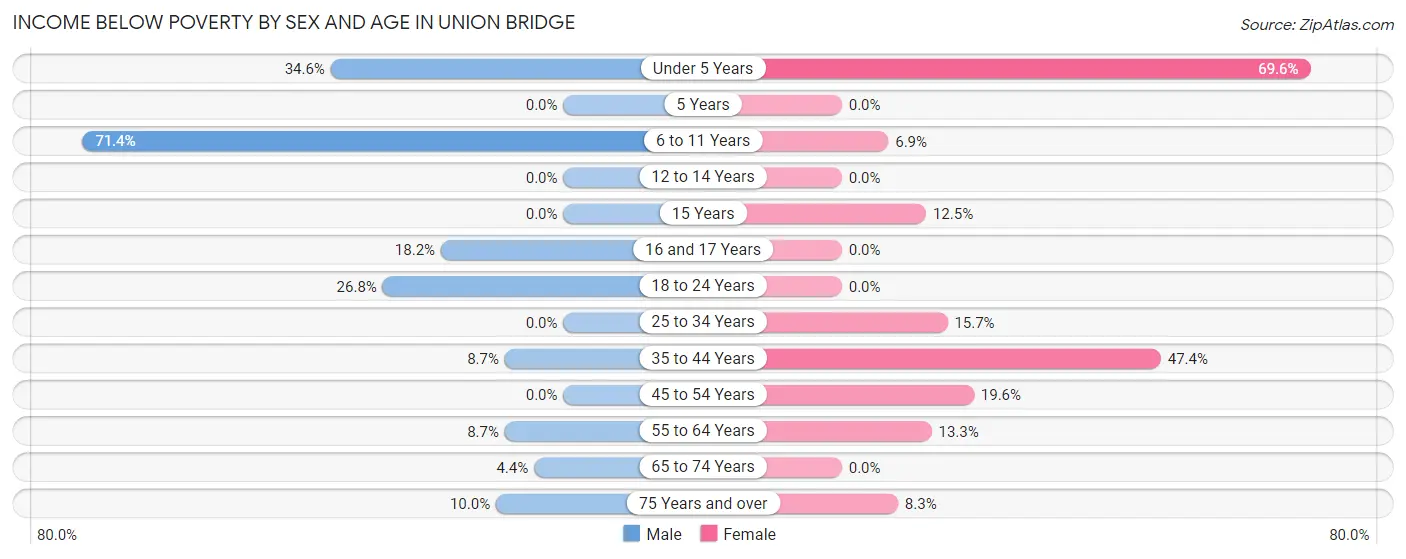
| Age Bracket | Male | Female |
| Under 5 Years | 19 (34.5%) | 16 (69.6%) |
| 5 Years | 0 (0.0%) | 0 (0.0%) |
| 6 to 11 Years | 25 (71.4%) | 2 (6.9%) |
| 12 to 14 Years | 0 (0.0%) | 0 (0.0%) |
| 15 Years | 0 (0.0%) | 2 (12.5%) |
| 16 and 17 Years | 2 (18.2%) | 0 (0.0%) |
| 18 to 24 Years | 11 (26.8%) | 0 (0.0%) |
| 25 to 34 Years | 0 (0.0%) | 8 (15.7%) |
| 35 to 44 Years | 8 (8.7%) | 27 (47.4%) |
| 45 to 54 Years | 0 (0.0%) | 10 (19.6%) |
| 55 to 64 Years | 8 (8.7%) | 8 (13.3%) |
| 65 to 74 Years | 1 (4.3%) | 0 (0.0%) |
| 75 Years and over | 3 (10.0%) | 3 (8.3%) |
| Total | 77 (14.6%) | 76 (18.4%) |
Income Above Poverty by Sex and Age in Union Bridge
According to the poverty statistics in Union Bridge, males aged 5 years and females aged 5 years are the age groups that are most secure financially, with 100.0% of males and 100.0% of females in these age groups living above the poverty line.
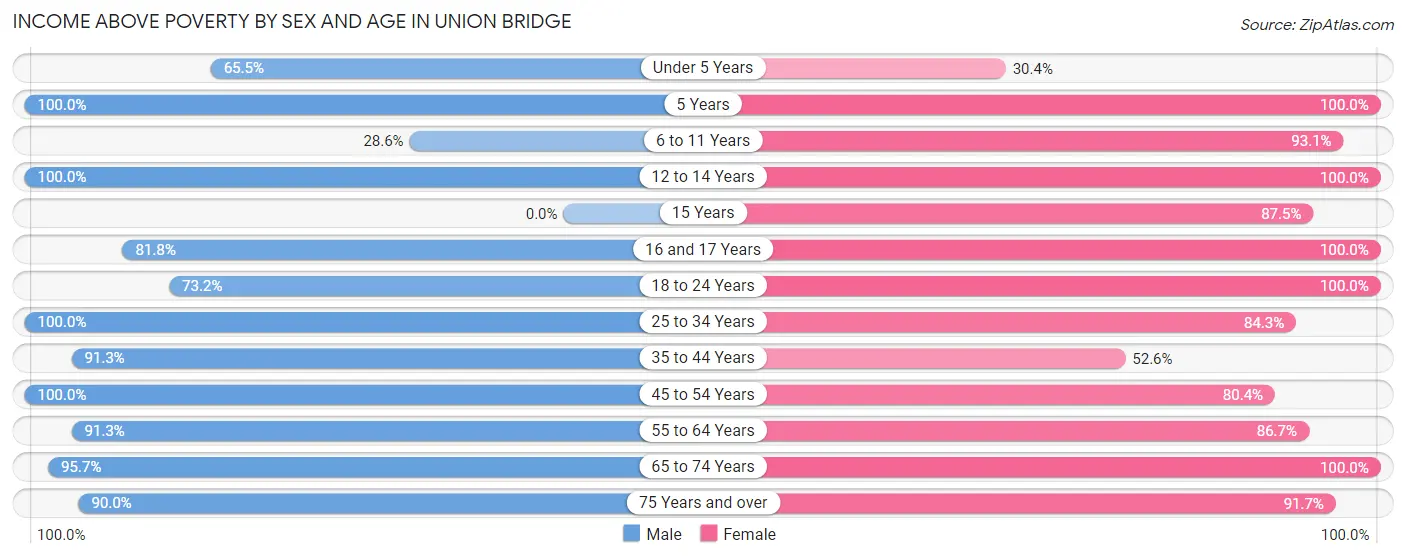
| Age Bracket | Male | Female |
| Under 5 Years | 36 (65.4%) | 7 (30.4%) |
| 5 Years | 2 (100.0%) | 5 (100.0%) |
| 6 to 11 Years | 10 (28.6%) | 27 (93.1%) |
| 12 to 14 Years | 2 (100.0%) | 10 (100.0%) |
| 15 Years | 0 (0.0%) | 14 (87.5%) |
| 16 and 17 Years | 9 (81.8%) | 3 (100.0%) |
| 18 to 24 Years | 30 (73.2%) | 32 (100.0%) |
| 25 to 34 Years | 113 (100.0%) | 43 (84.3%) |
| 35 to 44 Years | 84 (91.3%) | 30 (52.6%) |
| 45 to 54 Years | 30 (100.0%) | 41 (80.4%) |
| 55 to 64 Years | 84 (91.3%) | 52 (86.7%) |
| 65 to 74 Years | 22 (95.7%) | 40 (100.0%) |
| 75 Years and over | 27 (90.0%) | 33 (91.7%) |
| Total | 449 (85.4%) | 337 (81.6%) |
Income Below Poverty Among Married-Couple Families in Union Bridge
The poverty statistics for married-couple families in Union Bridge show that 2.7% or 3 of the total 110 families live below the poverty line. Families with 3 or 4 children have the highest poverty rate of 7.7%, comprising of 1 families. On the other hand, families with 1 or 2 children have the lowest poverty rate of 0.0%, which includes 0 families.
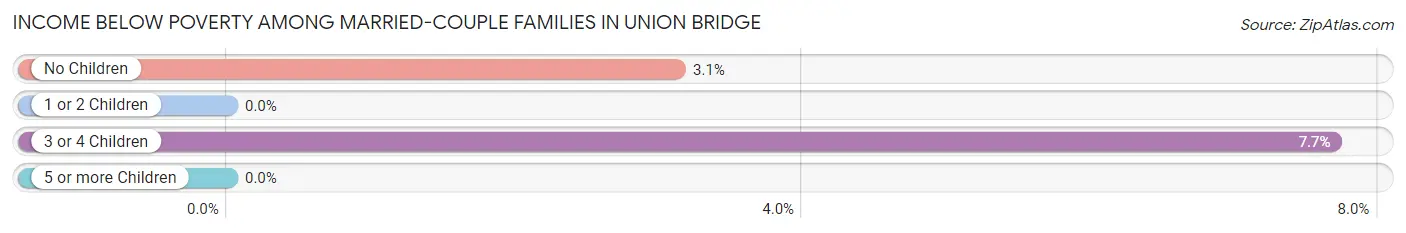
| Children | Above Poverty | Below Poverty |
| No Children | 62 (96.9%) | 2 (3.1%) |
| 1 or 2 Children | 33 (100.0%) | 0 (0.0%) |
| 3 or 4 Children | 12 (92.3%) | 1 (7.7%) |
| 5 or more Children | 0 (0.0%) | 0 (0.0%) |
| Total | 107 (97.3%) | 3 (2.7%) |
Income Below Poverty Among Single-Parent Households in Union Bridge
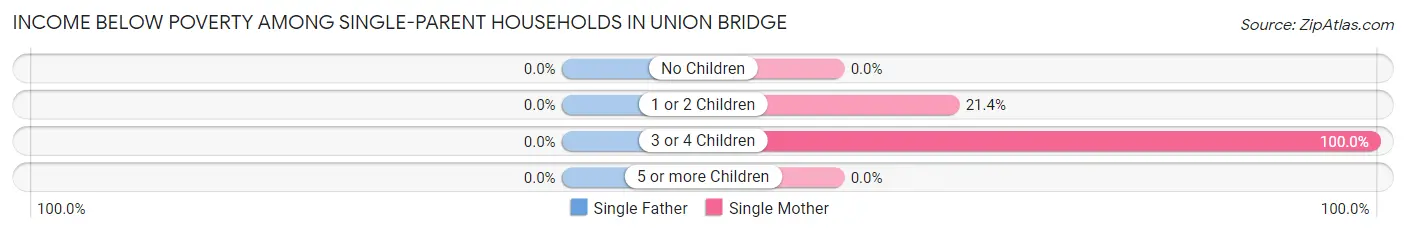
| Children | Single Father | Single Mother |
| No Children | 0 (0.0%) | 0 (0.0%) |
| 1 or 2 Children | 0 (0.0%) | 3 (21.4%) |
| 3 or 4 Children | 0 (0.0%) | 22 (100.0%) |
| 5 or more Children | 0 (0.0%) | 0 (0.0%) |
| Total | 0 (0.0%) | 25 (43.1%) |
Income Below Poverty Among Married-Couple vs Single-Parent Households in Union Bridge
The poverty data for Union Bridge shows that 3 of the married-couple family households (2.7%) and 25 of the single-parent households (31.2%) are living below the poverty level. Within the married-couple family households, those with 3 or 4 children have the highest poverty rate, with 1 households (7.7%) falling below the poverty line. Among the single-parent households, those with 3 or 4 children have the highest poverty rate, with 22 household (100.0%) living below poverty.
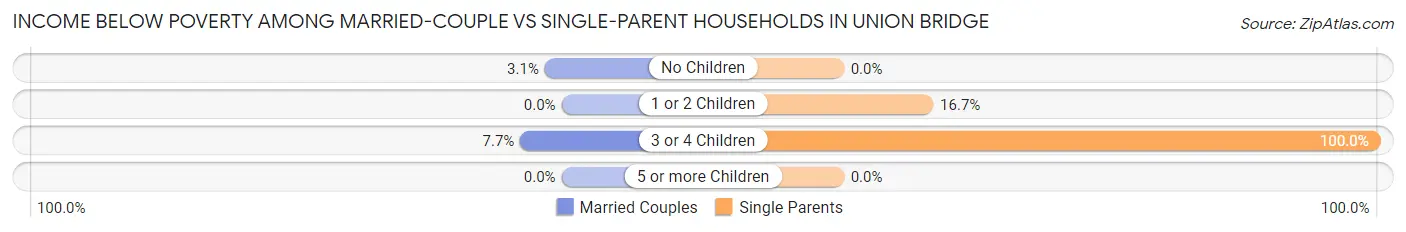
| Children | Married-Couple Families | Single-Parent Households |
| No Children | 2 (3.1%) | 0 (0.0%) |
| 1 or 2 Children | 0 (0.0%) | 3 (16.7%) |
| 3 or 4 Children | 1 (7.7%) | 22 (100.0%) |
| 5 or more Children | 0 (0.0%) | 0 (0.0%) |
| Total | 3 (2.7%) | 25 (31.2%) |
Race in Union Bridge
The most populous races in Union Bridge are White / Caucasian (840 | 89.5%), Asian (58 | 6.2%), and Black / African American (22 | 2.3%).
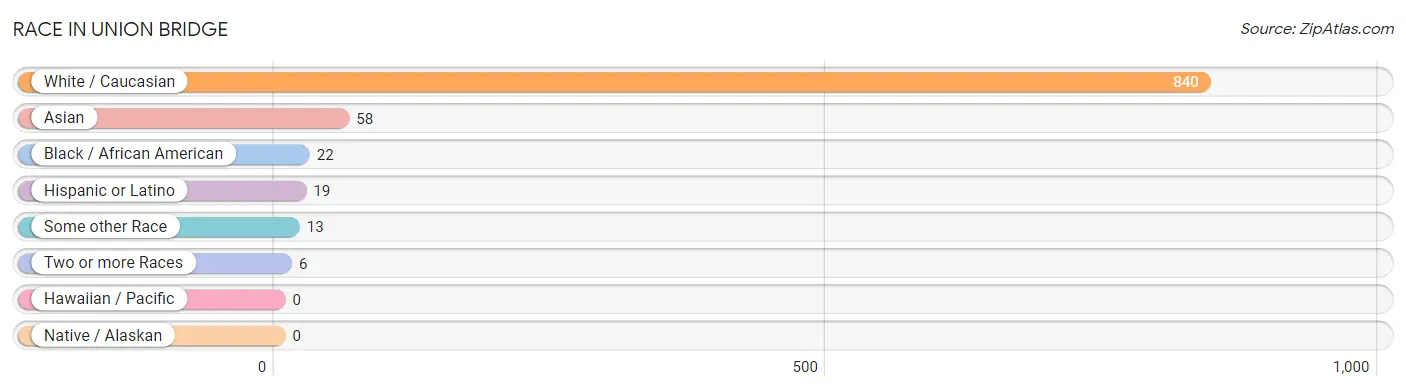
| Race | # Population | % Population |
| Asian | 58 | 6.2% |
| Black / African American | 22 | 2.3% |
| Hawaiian / Pacific | 0 | 0.0% |
| Hispanic or Latino | 19 | 2.0% |
| Native / Alaskan | 0 | 0.0% |
| White / Caucasian | 840 | 89.5% |
| Two or more Races | 6 | 0.6% |
| Some other Race | 13 | 1.4% |
| Total | 939 | 100.0% |
Ancestry in Union Bridge
The most populous ancestries reported in Union Bridge are American (294 | 31.3%), German (201 | 21.4%), Irish (114 | 12.1%), English (90 | 9.6%), and Burmese (58 | 6.2%), together accounting for 80.6% of all Union Bridge residents.
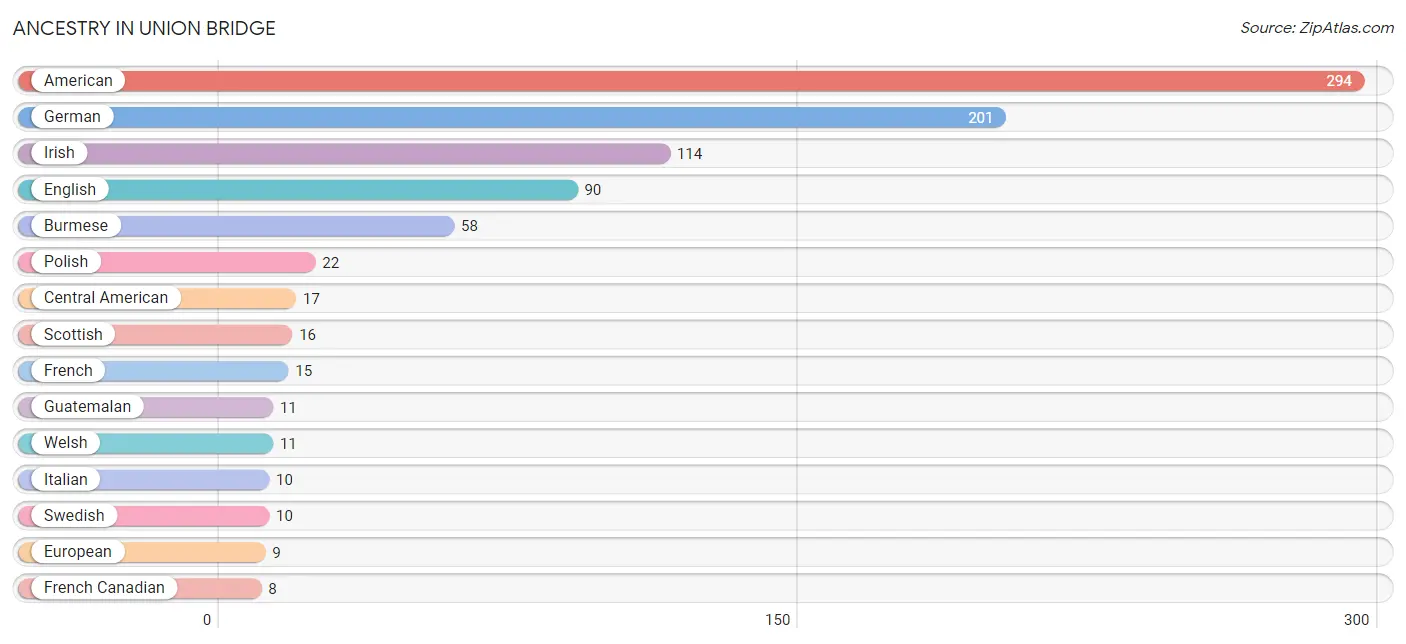
| Ancestry | # Population | % Population |
| American | 294 | 31.3% |
| Burmese | 58 | 6.2% |
| Central American | 17 | 1.8% |
| Czechoslovakian | 4 | 0.4% |
| Dutch | 6 | 0.6% |
| English | 90 | 9.6% |
| European | 9 | 1.0% |
| Finnish | 3 | 0.3% |
| French | 15 | 1.6% |
| French Canadian | 8 | 0.9% |
| German | 201 | 21.4% |
| Guatemalan | 11 | 1.2% |
| Irish | 114 | 12.1% |
| Italian | 10 | 1.1% |
| Mexican | 2 | 0.2% |
| Nigerian | 2 | 0.2% |
| Norwegian | 1 | 0.1% |
| Polish | 22 | 2.3% |
| Russian | 1 | 0.1% |
| Salvadoran | 6 | 0.6% |
| Scandinavian | 6 | 0.6% |
| Scotch-Irish | 6 | 0.6% |
| Scottish | 16 | 1.7% |
| Subsaharan African | 2 | 0.2% |
| Swedish | 10 | 1.1% |
| Swiss | 5 | 0.5% |
| Ukrainian | 3 | 0.3% |
| Welsh | 11 | 1.2% | View All 28 Rows |
Immigrants in Union Bridge
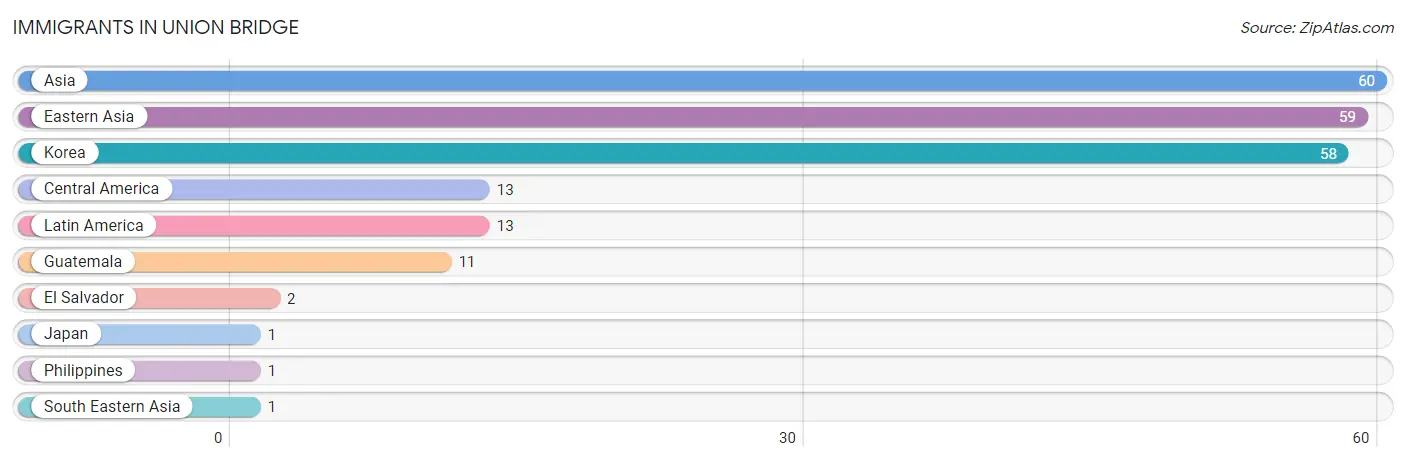
The most numerous immigrant groups reported in Union Bridge came from Asia (60 | 6.4%), Eastern Asia (59 | 6.3%), Korea (58 | 6.2%), Central America (13 | 1.4%), and Latin America (13 | 1.4%), together accounting for 21.6% of all Union Bridge residents.
| Immigration Origin | # Population | % Population |
| Asia | 60 | 6.4% |
| Central America | 13 | 1.4% |
| Eastern Asia | 59 | 6.3% |
| El Salvador | 2 | 0.2% |
| Guatemala | 11 | 1.2% |
| Japan | 1 | 0.1% |
| Korea | 58 | 6.2% |
| Latin America | 13 | 1.4% |
| Philippines | 1 | 0.1% |
| South Eastern Asia | 1 | 0.1% | View All 10 Rows |
Sex and Age in Union Bridge
Sex and Age in Union Bridge
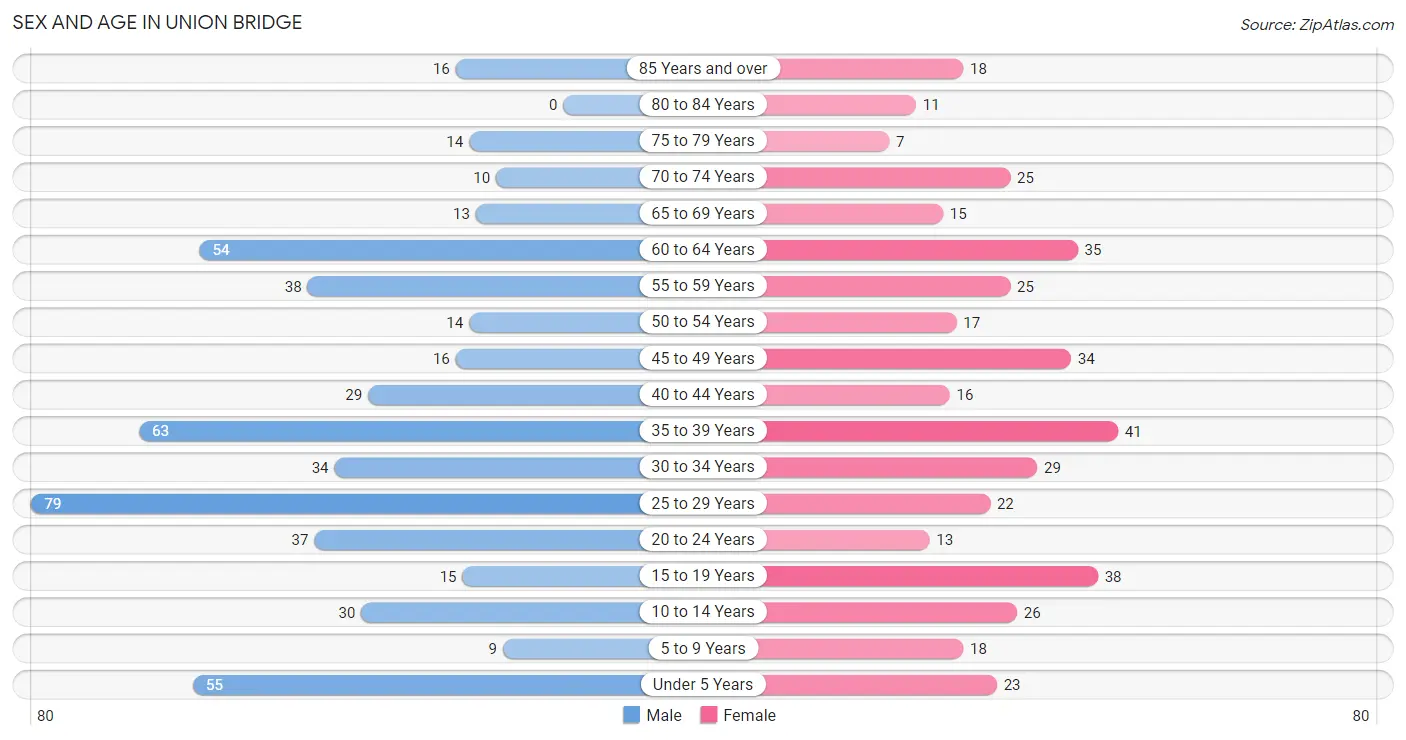
The most populous age groups in Union Bridge are 25 to 29 Years (79 | 15.0%) for men and 35 to 39 Years (41 | 9.9%) for women.
| Age Bracket | Male | Female |
| Under 5 Years | 55 (10.5%) | 23 (5.6%) |
| 5 to 9 Years | 9 (1.7%) | 18 (4.4%) |
| 10 to 14 Years | 30 (5.7%) | 26 (6.3%) |
| 15 to 19 Years | 15 (2.9%) | 38 (9.2%) |
| 20 to 24 Years | 37 (7.0%) | 13 (3.2%) |
| 25 to 29 Years | 79 (15.0%) | 22 (5.3%) |
| 30 to 34 Years | 34 (6.5%) | 29 (7.0%) |
| 35 to 39 Years | 63 (12.0%) | 41 (9.9%) |
| 40 to 44 Years | 29 (5.5%) | 16 (3.9%) |
| 45 to 49 Years | 16 (3.0%) | 34 (8.2%) |
| 50 to 54 Years | 14 (2.7%) | 17 (4.1%) |
| 55 to 59 Years | 38 (7.2%) | 25 (6.0%) |
| 60 to 64 Years | 54 (10.3%) | 35 (8.5%) |
| 65 to 69 Years | 13 (2.5%) | 15 (3.6%) |
| 70 to 74 Years | 10 (1.9%) | 25 (6.0%) |
| 75 to 79 Years | 14 (2.7%) | 7 (1.7%) |
| 80 to 84 Years | 0 (0.0%) | 11 (2.7%) |
| 85 Years and over | 16 (3.0%) | 18 (4.4%) |
| Total | 526 (100.0%) | 413 (100.0%) |
Families and Households in Union Bridge
Median Family Size in Union Bridge
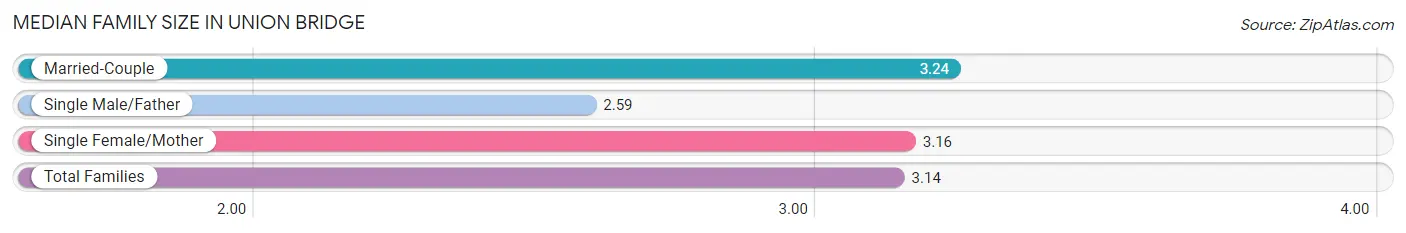
The median family size in Union Bridge is 3.14 persons per family, with married-couple families (110 | 57.9%) accounting for the largest median family size of 3.24 persons per family. On the other hand, single male/father families (22 | 11.6%) represent the smallest median family size with 2.59 persons per family.
| Family Type | # Families | Family Size |
| Married-Couple | 110 (57.9%) | 3.24 |
| Single Male/Father | 22 (11.6%) | 2.59 |
| Single Female/Mother | 58 (30.5%) | 3.16 |
| Total Families | 190 (100.0%) | 3.14 |
Median Household Size in Union Bridge
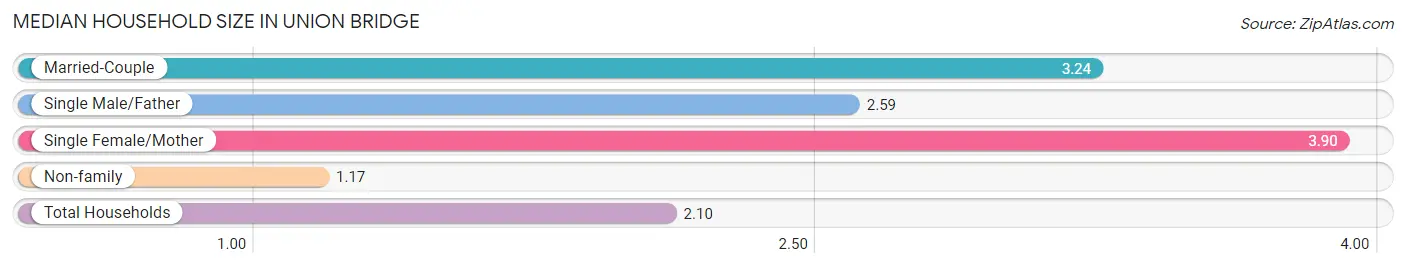
The median household size in Union Bridge is 2.10 persons per household, with single female/mother households (58 | 13.0%) accounting for the largest median household size of 3.9 persons per household. non-family households (257 | 57.5%) represent the smallest median household size with 1.17 persons per household.
| Household Type | # Households | Household Size |
| Married-Couple | 110 (24.6%) | 3.24 |
| Single Male/Father | 22 (4.9%) | 2.59 |
| Single Female/Mother | 58 (13.0%) | 3.90 |
| Non-family | 257 (57.5%) | 1.17 |
| Total Households | 447 (100.0%) | 2.10 |
Household Size by Marriage Status in Union Bridge
Out of a total of 447 households in Union Bridge, 190 (42.5%) are family households, while 257 (57.5%) are nonfamily households. The most numerous type of family households are 2-person households, comprising 70, and the most common type of nonfamily households are 1-person households, comprising 212.
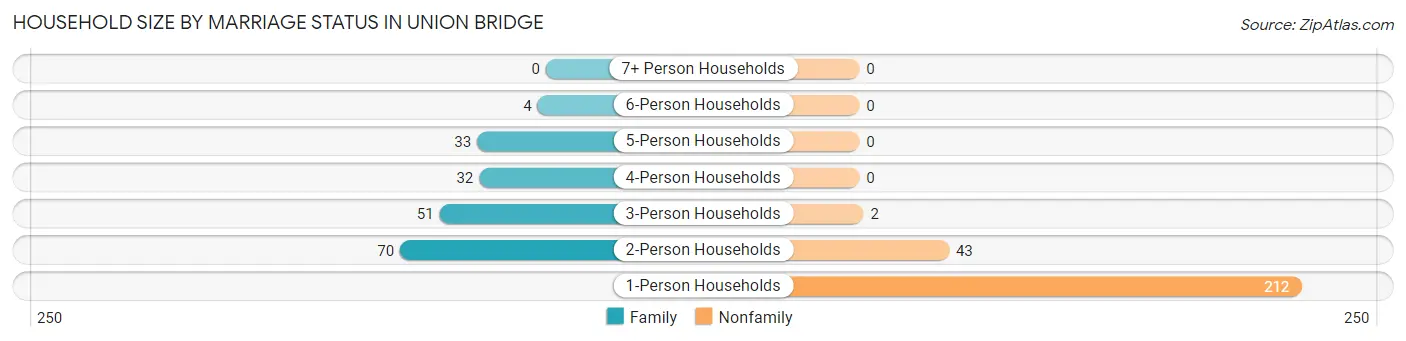
| Household Size | Family Households | Nonfamily Households |
| 1-Person Households | - | 212 (47.4%) |
| 2-Person Households | 70 (15.7%) | 43 (9.6%) |
| 3-Person Households | 51 (11.4%) | 2 (0.4%) |
| 4-Person Households | 32 (7.2%) | 0 (0.0%) |
| 5-Person Households | 33 (7.4%) | 0 (0.0%) |
| 6-Person Households | 4 (0.9%) | 0 (0.0%) |
| 7+ Person Households | 0 (0.0%) | 0 (0.0%) |
| Total | 190 (42.5%) | 257 (57.5%) |
Female Fertility in Union Bridge
Fertility by Age in Union Bridge
Average fertility rate in Union Bridge is 64.0 births per 1,000 women. Women in the age bracket of 20 to 34 years have the highest fertility rate with 203.0 births per 1,000 women. Women in the age bracket of 20 to 34 years acount for 100.0% of all women with births.
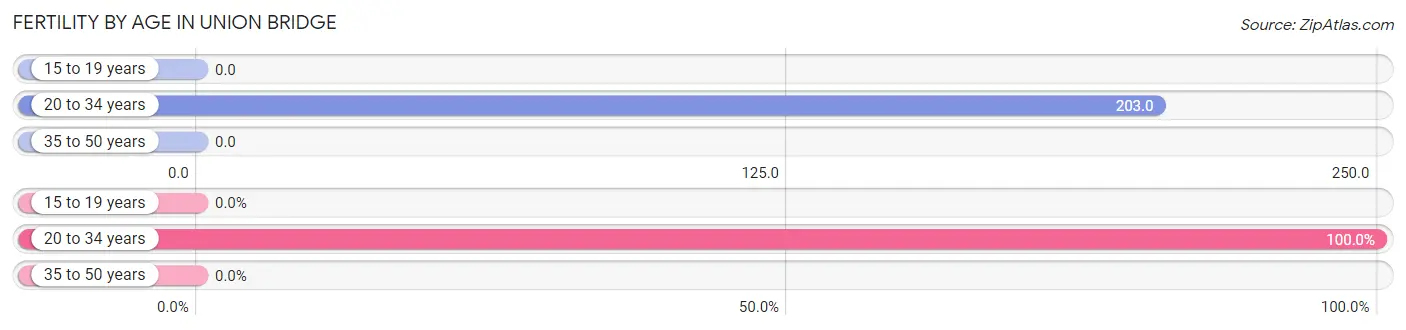
| Age Bracket | Women with Births | Births / 1,000 Women |
| 15 to 19 years | 0 (0.0%) | 0.0 |
| 20 to 34 years | 13 (100.0%) | 203.0 |
| 35 to 50 years | 0 (0.0%) | 0.0 |
| Total | 13 (100.0%) | 64.0 |
Fertility by Age by Marriage Status in Union Bridge
46.2% of women with births (13) in Union Bridge are married. The highest percentage of unmarried women with births falls into 20 to 34 years age bracket with 53.8% of them unmarried at the time of birth, while the lowest percentage of unmarried women with births belong to 20 to 34 years age bracket with 53.8% of them unmarried.
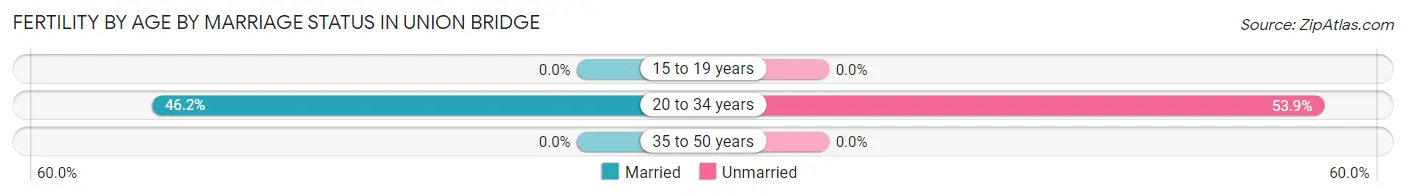
| Age Bracket | Married | Unmarried |
| 15 to 19 years | 0 (0.0%) | 0 (0.0%) |
| 20 to 34 years | 6 (46.2%) | 7 (53.8%) |
| 35 to 50 years | 0 (0.0%) | 0 (0.0%) |
| Total | 6 (46.2%) | 7 (53.8%) |
Fertility by Education in Union Bridge
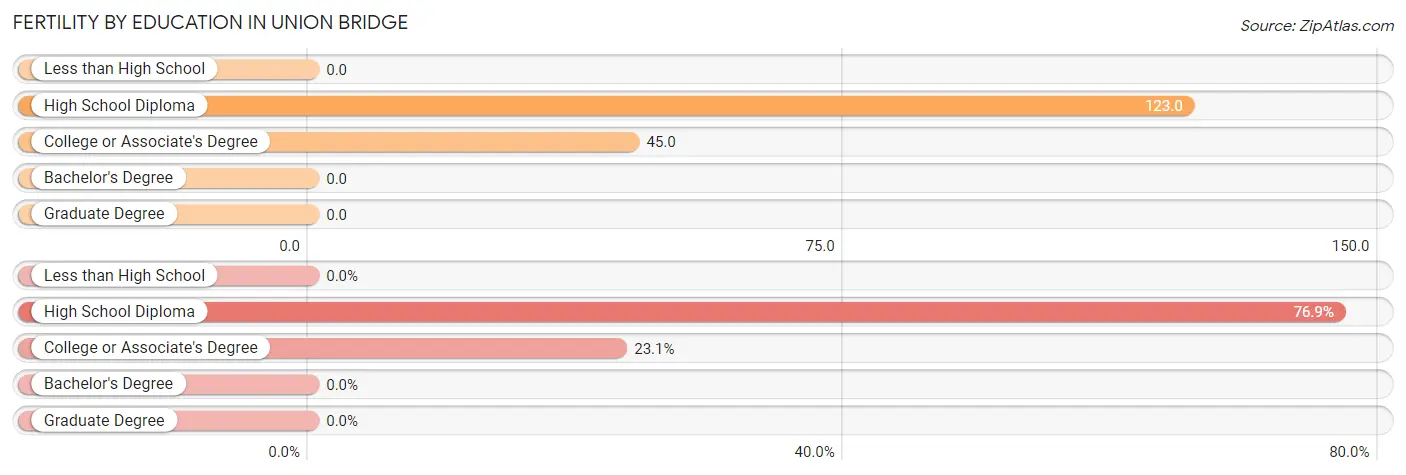
| Educational Attainment | Women with Births | Births / 1,000 Women |
| Less than High School | 0 (0.0%) | 0.0 |
| High School Diploma | 10 (76.9%) | 123.0 |
| College or Associate's Degree | 3 (23.1%) | 45.0 |
| Bachelor's Degree | 0 (0.0%) | 0.0 |
| Graduate Degree | 0 (0.0%) | 0.0 |
| Total | 13 (100.0%) | 64.0 |
Fertility by Education by Marriage Status in Union Bridge
53.8% of women with births in Union Bridge are unmarried. Women with the educational attainment of college or associate's degree are most likely to be married with 100.0% of them married at childbirth, while women with the educational attainment of high school diploma are least likely to be married with 70.0% of them unmarried at childbirth.
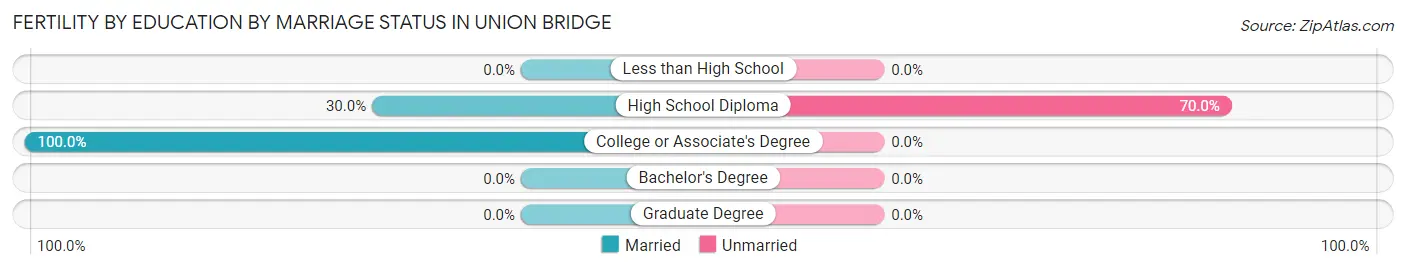
| Educational Attainment | Married | Unmarried |
| Less than High School | 0 (0.0%) | 0 (0.0%) |
| High School Diploma | 3 (30.0%) | 7 (70.0%) |
| College or Associate's Degree | 3 (100.0%) | 0 (0.0%) |
| Bachelor's Degree | 0 (0.0%) | 0 (0.0%) |
| Graduate Degree | 0 (0.0%) | 0 (0.0%) |
| Total | 6 (46.2%) | 7 (53.8%) |
Employment Characteristics in Union Bridge
Employment by Class of Employer in Union Bridge
Among the 500 employed individuals in Union Bridge, private company employees (316 | 63.2%), local government employees (74 | 14.8%), and self-employed (not incorporated) (52 | 10.4%) make up the most common classes of employment.
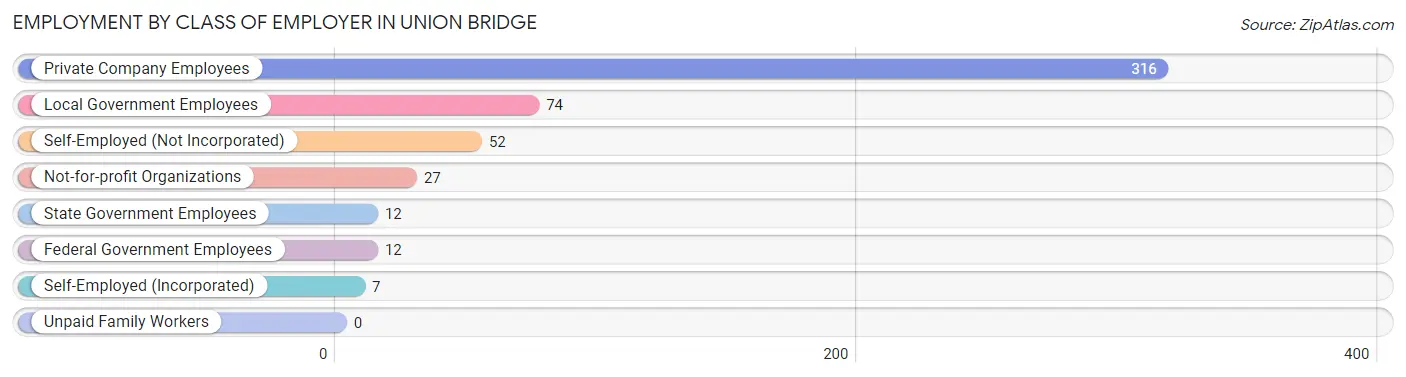
| Employer Class | # Employees | % Employees |
| Private Company Employees | 316 | 63.2% |
| Self-Employed (Incorporated) | 7 | 1.4% |
| Self-Employed (Not Incorporated) | 52 | 10.4% |
| Not-for-profit Organizations | 27 | 5.4% |
| Local Government Employees | 74 | 14.8% |
| State Government Employees | 12 | 2.4% |
| Federal Government Employees | 12 | 2.4% |
| Unpaid Family Workers | 0 | 0.0% |
| Total | 500 | 100.0% |
Employment Status by Age in Union Bridge
According to the labor force statistics for Union Bridge, out of the total population over 16 years of age (762), 69.7% or 531 individuals are in the labor force, with 0.9% or 5 of them unemployed. The age group with the highest labor force participation rate is 25 to 29 years, with 98.0% or 99 individuals in the labor force. Within the labor force, the 65 to 74 years age range has the highest percentage of unemployed individuals, with 6.3% or 1 of them being unemployed.
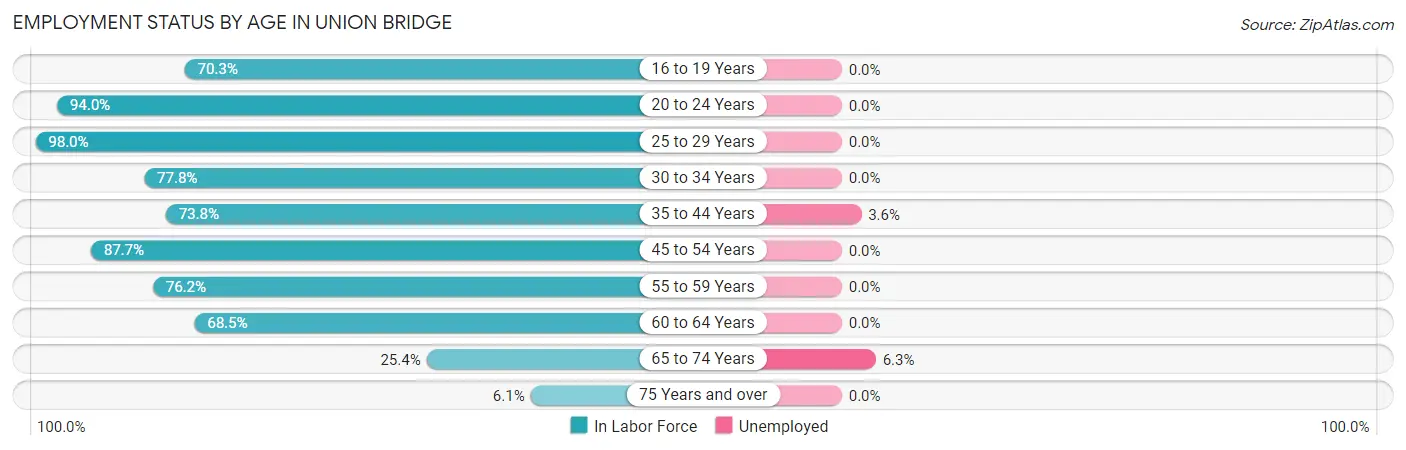
| Age Bracket | In Labor Force | Unemployed |
| 16 to 19 Years | 26 (70.3%) | 0 (0.0%) |
| 20 to 24 Years | 47 (94.0%) | 0 (0.0%) |
| 25 to 29 Years | 99 (98.0%) | 0 (0.0%) |
| 30 to 34 Years | 49 (77.8%) | 0 (0.0%) |
| 35 to 44 Years | 110 (73.8%) | 4 (3.6%) |
| 45 to 54 Years | 71 (87.7%) | 0 (0.0%) |
| 55 to 59 Years | 48 (76.2%) | 0 (0.0%) |
| 60 to 64 Years | 61 (68.5%) | 0 (0.0%) |
| 65 to 74 Years | 16 (25.4%) | 1 (6.3%) |
| 75 Years and over | 4 (6.1%) | 0 (0.0%) |
| Total | 531 (69.7%) | 5 (0.9%) |
Employment Status by Educational Attainment in Union Bridge
According to labor force statistics for Union Bridge, 80.2% of individuals (438) out of the total population between 25 and 64 years of age (546) are in the labor force, with 0.9% or 4 of them being unemployed. The group with the highest labor force participation rate are those with the educational attainment of bachelor's degree or higher, with 91.9% or 102 individuals in the labor force. Within the labor force, individuals with high school diploma education have the highest percentage of unemployment, with 2.3% or 4 of them being unemployed.
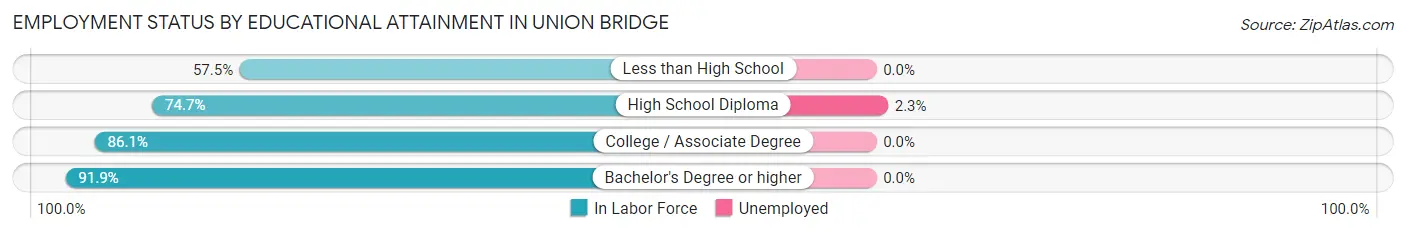
| Educational Attainment | In Labor Force | Unemployed |
| Less than High School | 23 (57.5%) | 0 (0.0%) |
| High School Diploma | 177 (74.7%) | 5 (2.3%) |
| College / Associate Degree | 136 (86.1%) | 0 (0.0%) |
| Bachelor's Degree or higher | 102 (91.9%) | 0 (0.0%) |
| Total | 438 (80.2%) | 5 (0.9%) |
Employment Occupations by Sex in Union Bridge
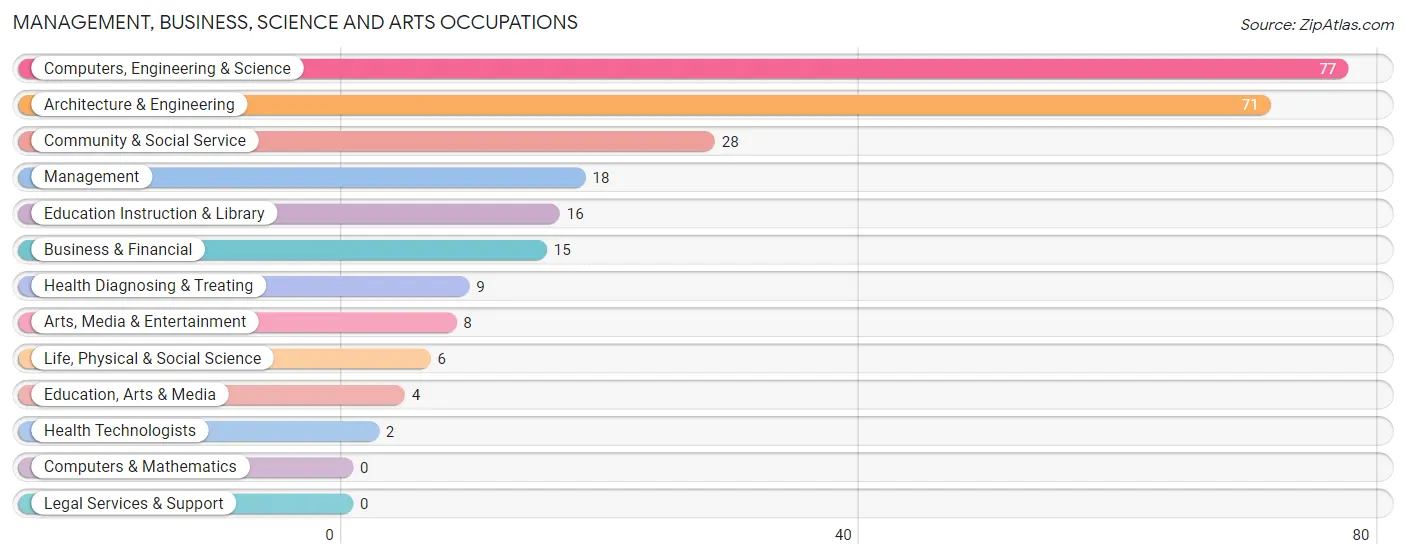
Management, Business, Science and Arts Occupations
The most common Management, Business, Science and Arts occupations in Union Bridge are Computers, Engineering & Science (77 | 14.6%), Architecture & Engineering (71 | 13.5%), Community & Social Service (28 | 5.3%), Management (18 | 3.4%), and Education Instruction & Library (16 | 3.0%).
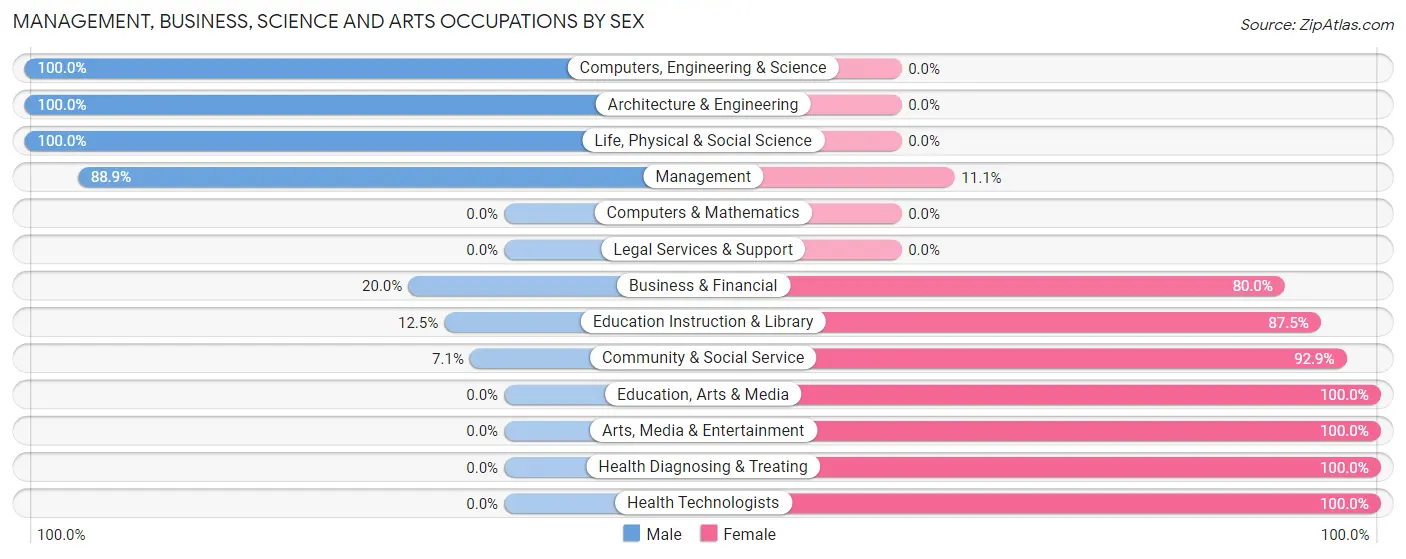
Management, Business, Science and Arts Occupations by Sex
Within the Management, Business, Science and Arts occupations in Union Bridge, the most male-oriented occupations are Computers, Engineering & Science (100.0%), Architecture & Engineering (100.0%), and Life, Physical & Social Science (100.0%), while the most female-oriented occupations are Education, Arts & Media (100.0%), Arts, Media & Entertainment (100.0%), and Health Diagnosing & Treating (100.0%).
| Occupation | Male | Female |
| Management | 16 (88.9%) | 2 (11.1%) |
| Business & Financial | 3 (20.0%) | 12 (80.0%) |
| Computers, Engineering & Science | 77 (100.0%) | 0 (0.0%) |
| Computers & Mathematics | 0 (0.0%) | 0 (0.0%) |
| Architecture & Engineering | 71 (100.0%) | 0 (0.0%) |
| Life, Physical & Social Science | 6 (100.0%) | 0 (0.0%) |
| Community & Social Service | 2 (7.1%) | 26 (92.9%) |
| Education, Arts & Media | 0 (0.0%) | 4 (100.0%) |
| Legal Services & Support | 0 (0.0%) | 0 (0.0%) |
| Education Instruction & Library | 2 (12.5%) | 14 (87.5%) |
| Arts, Media & Entertainment | 0 (0.0%) | 8 (100.0%) |
| Health Diagnosing & Treating | 0 (0.0%) | 9 (100.0%) |
| Health Technologists | 0 (0.0%) | 2 (100.0%) |
| Total (Category) | 98 (66.7%) | 49 (33.3%) |
| Total (Overall) | 349 (66.3%) | 177 (33.7%) |
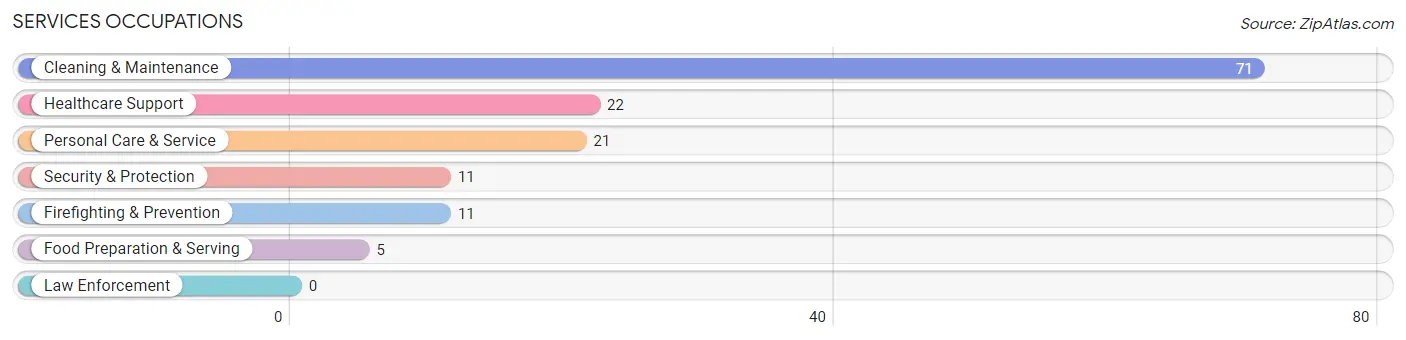
Services Occupations
The most common Services occupations in Union Bridge are Cleaning & Maintenance (71 | 13.5%), Healthcare Support (22 | 4.2%), Personal Care & Service (21 | 4.0%), Security & Protection (11 | 2.1%), and Firefighting & Prevention (11 | 2.1%).
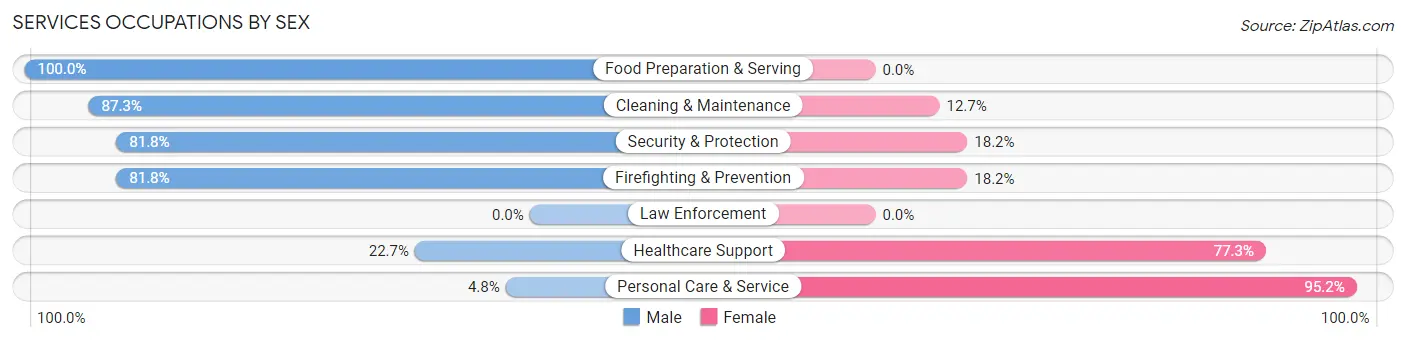
Services Occupations by Sex
Within the Services occupations in Union Bridge, the most male-oriented occupations are Food Preparation & Serving (100.0%), Cleaning & Maintenance (87.3%), and Security & Protection (81.8%), while the most female-oriented occupations are Personal Care & Service (95.2%), Healthcare Support (77.3%), and Security & Protection (18.2%).
| Occupation | Male | Female |
| Healthcare Support | 5 (22.7%) | 17 (77.3%) |
| Security & Protection | 9 (81.8%) | 2 (18.2%) |
| Firefighting & Prevention | 9 (81.8%) | 2 (18.2%) |
| Law Enforcement | 0 (0.0%) | 0 (0.0%) |
| Food Preparation & Serving | 5 (100.0%) | 0 (0.0%) |
| Cleaning & Maintenance | 62 (87.3%) | 9 (12.7%) |
| Personal Care & Service | 1 (4.8%) | 20 (95.2%) |
| Total (Category) | 82 (63.1%) | 48 (36.9%) |
| Total (Overall) | 349 (66.3%) | 177 (33.7%) |
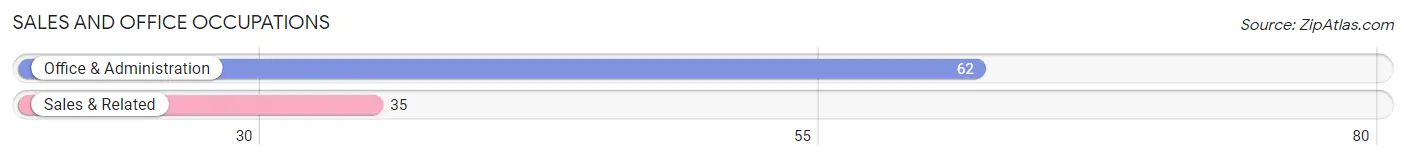
Sales and Office Occupations
The most common Sales and Office occupations in Union Bridge are Office & Administration (62 | 11.8%), and Sales & Related (35 | 6.7%).
Sales and Office Occupations by Sex
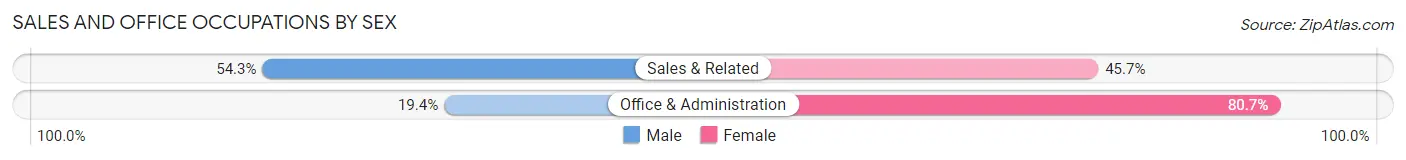
| Occupation | Male | Female |
| Sales & Related | 19 (54.3%) | 16 (45.7%) |
| Office & Administration | 12 (19.4%) | 50 (80.6%) |
| Total (Category) | 31 (32.0%) | 66 (68.0%) |
| Total (Overall) | 349 (66.3%) | 177 (33.7%) |
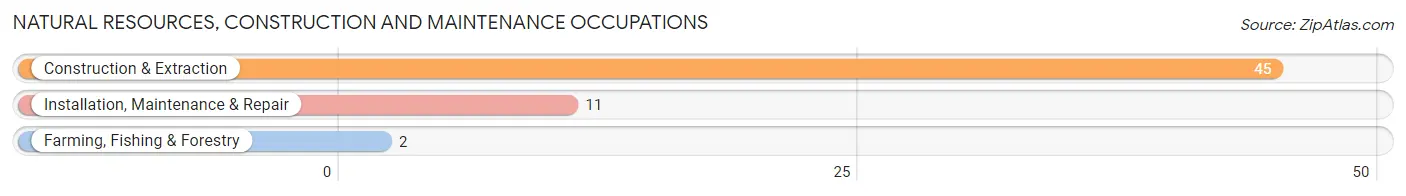
Natural Resources, Construction and Maintenance Occupations
The most common Natural Resources, Construction and Maintenance occupations in Union Bridge are Construction & Extraction (45 | 8.6%), Installation, Maintenance & Repair (11 | 2.1%), and Farming, Fishing & Forestry (2 | 0.4%).
Natural Resources, Construction and Maintenance Occupations by Sex
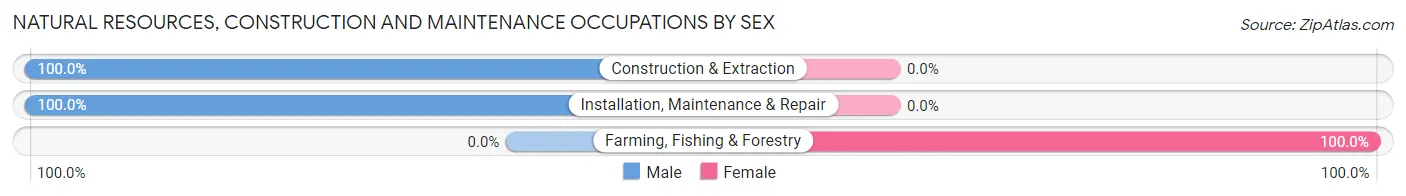
| Occupation | Male | Female |
| Farming, Fishing & Forestry | 0 (0.0%) | 2 (100.0%) |
| Construction & Extraction | 45 (100.0%) | 0 (0.0%) |
| Installation, Maintenance & Repair | 11 (100.0%) | 0 (0.0%) |
| Total (Category) | 56 (96.6%) | 2 (3.5%) |
| Total (Overall) | 349 (66.3%) | 177 (33.7%) |
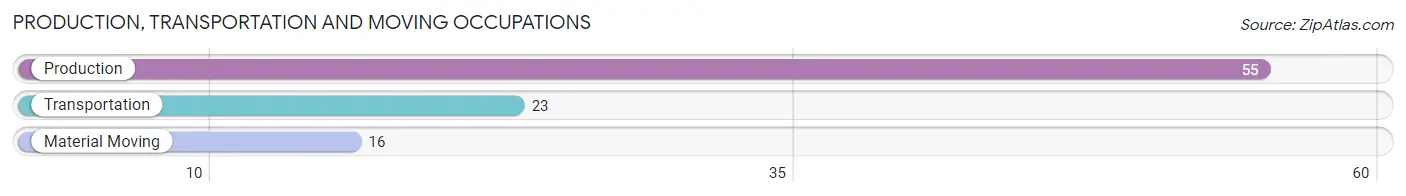
Production, Transportation and Moving Occupations
The most common Production, Transportation and Moving occupations in Union Bridge are Production (55 | 10.5%), Transportation (23 | 4.4%), and Material Moving (16 | 3.0%).
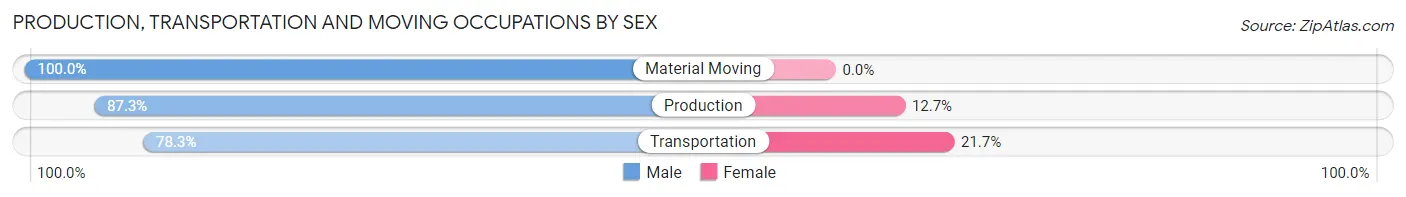
Production, Transportation and Moving Occupations by Sex
| Occupation | Male | Female |
| Production | 48 (87.3%) | 7 (12.7%) |
| Transportation | 18 (78.3%) | 5 (21.7%) |
| Material Moving | 16 (100.0%) | 0 (0.0%) |
| Total (Category) | 82 (87.2%) | 12 (12.8%) |
| Total (Overall) | 349 (66.3%) | 177 (33.7%) |
Employment Industries by Sex in Union Bridge
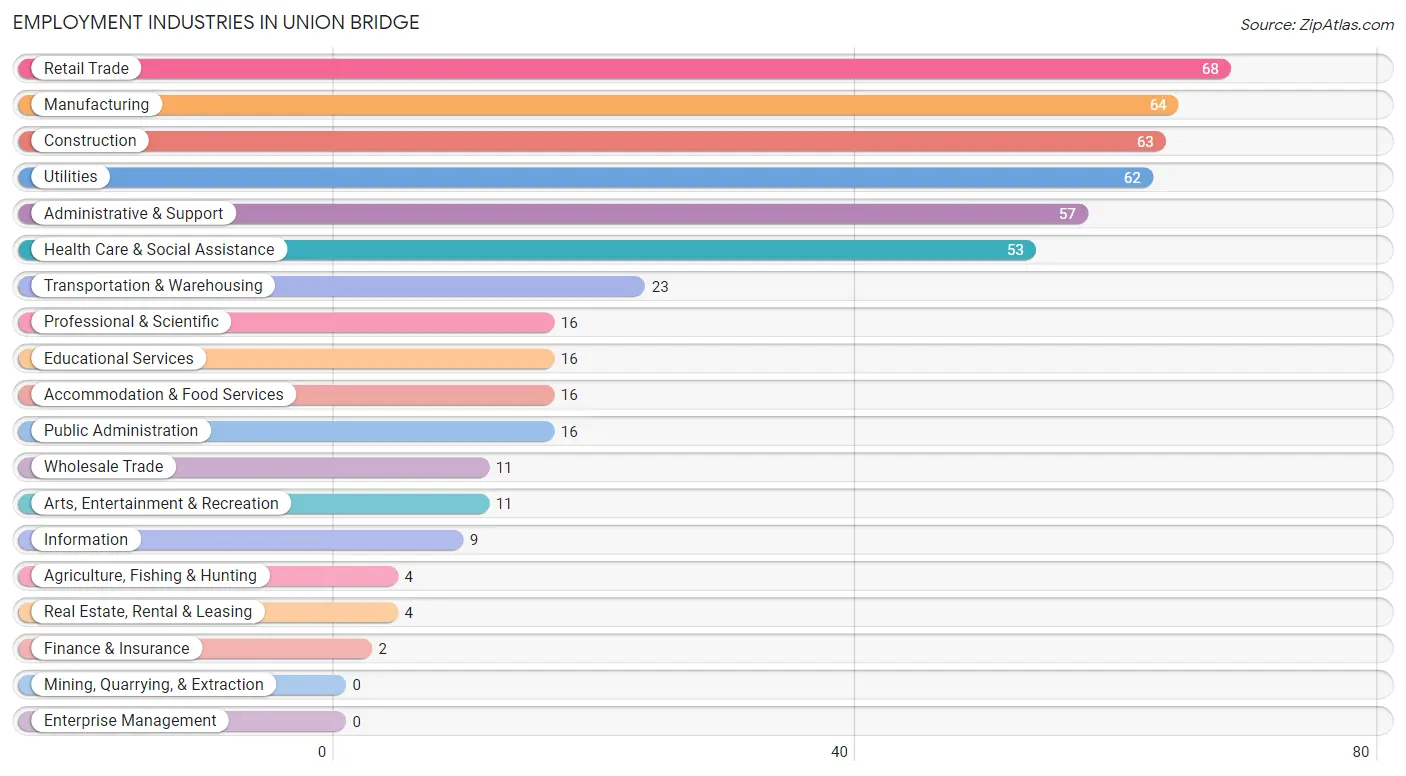
Employment Industries in Union Bridge
The major employment industries in Union Bridge include Retail Trade (68 | 12.9%), Manufacturing (64 | 12.2%), Construction (63 | 12.0%), Utilities (62 | 11.8%), and Administrative & Support (57 | 10.8%).
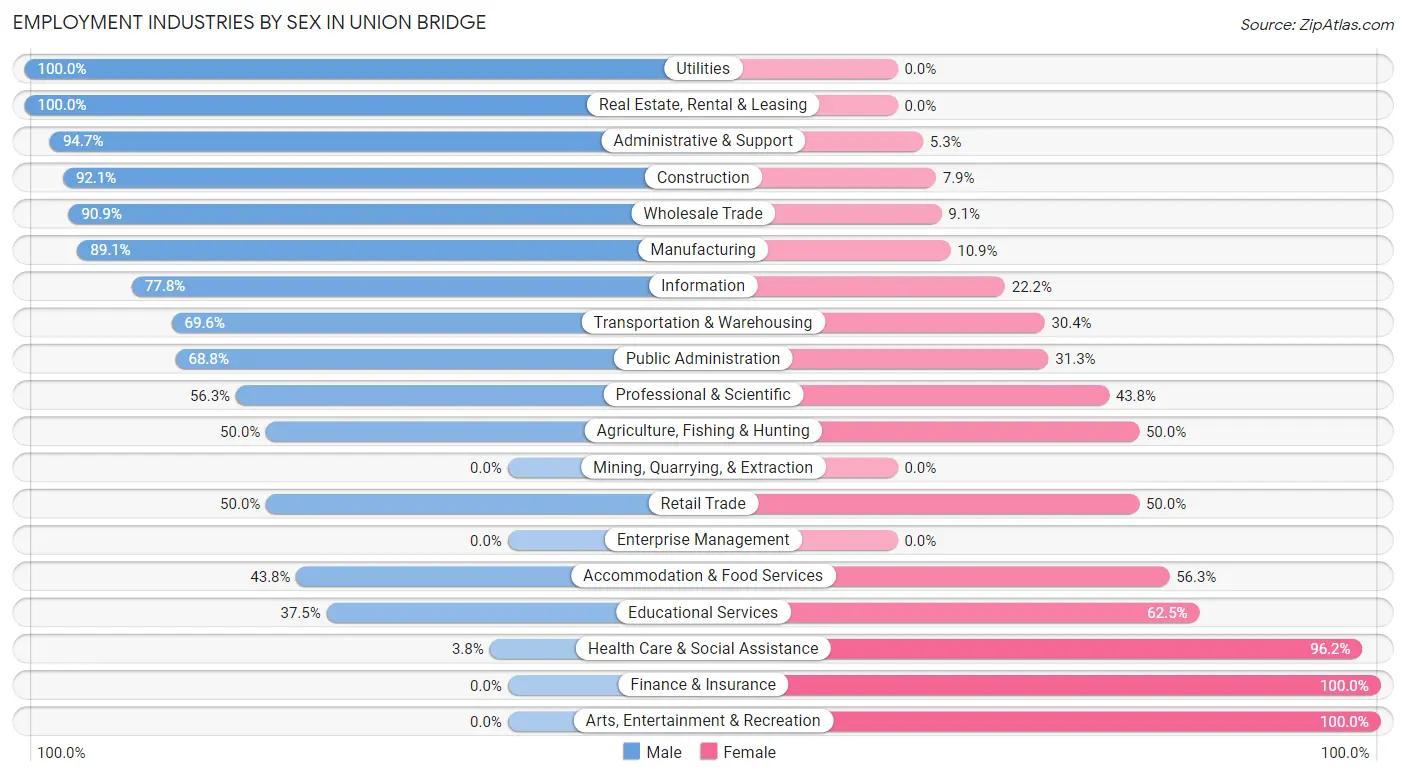
Employment Industries by Sex in Union Bridge
The Union Bridge industries that see more men than women are Utilities (100.0%), Real Estate, Rental & Leasing (100.0%), and Administrative & Support (94.7%), whereas the industries that tend to have a higher number of women are Finance & Insurance (100.0%), Arts, Entertainment & Recreation (100.0%), and Health Care & Social Assistance (96.2%).
| Industry | Male | Female |
| Agriculture, Fishing & Hunting | 2 (50.0%) | 2 (50.0%) |
| Mining, Quarrying, & Extraction | 0 (0.0%) | 0 (0.0%) |
| Construction | 58 (92.1%) | 5 (7.9%) |
| Manufacturing | 57 (89.1%) | 7 (10.9%) |
| Wholesale Trade | 10 (90.9%) | 1 (9.1%) |
| Retail Trade | 34 (50.0%) | 34 (50.0%) |
| Transportation & Warehousing | 16 (69.6%) | 7 (30.4%) |
| Utilities | 62 (100.0%) | 0 (0.0%) |
| Information | 7 (77.8%) | 2 (22.2%) |
| Finance & Insurance | 0 (0.0%) | 2 (100.0%) |
| Real Estate, Rental & Leasing | 4 (100.0%) | 0 (0.0%) |
| Professional & Scientific | 9 (56.2%) | 7 (43.8%) |
| Enterprise Management | 0 (0.0%) | 0 (0.0%) |
| Administrative & Support | 54 (94.7%) | 3 (5.3%) |
| Educational Services | 6 (37.5%) | 10 (62.5%) |
| Health Care & Social Assistance | 2 (3.8%) | 51 (96.2%) |
| Arts, Entertainment & Recreation | 0 (0.0%) | 11 (100.0%) |
| Accommodation & Food Services | 7 (43.8%) | 9 (56.2%) |
| Public Administration | 11 (68.8%) | 5 (31.2%) |
| Total | 349 (66.3%) | 177 (33.7%) |
Education in Union Bridge
School Enrollment in Union Bridge
The most common levels of schooling among the 159 students in Union Bridge are middle school (49 | 30.8%), high school (28 | 17.6%), and college / undergraduate (28 | 17.6%).
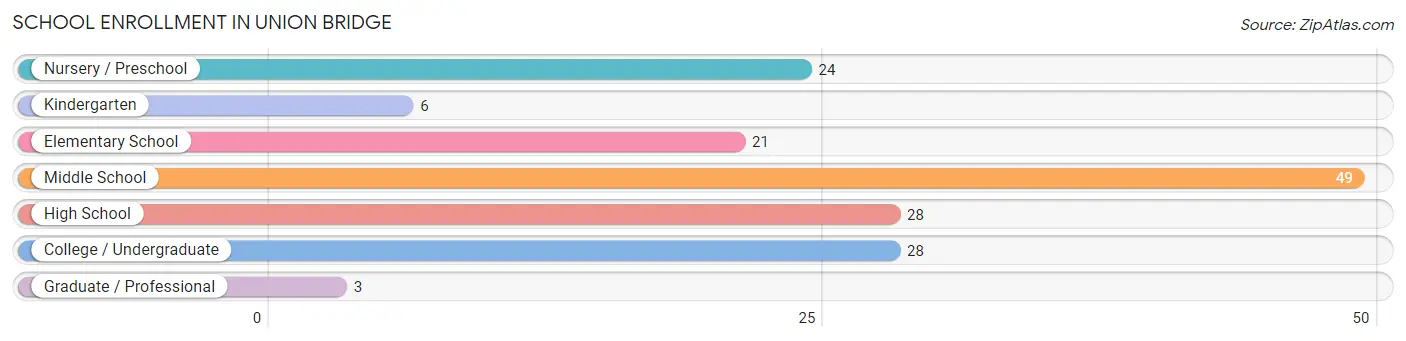
| School Level | # Students | % Students |
| Nursery / Preschool | 24 | 15.1% |
| Kindergarten | 6 | 3.8% |
| Elementary School | 21 | 13.2% |
| Middle School | 49 | 30.8% |
| High School | 28 | 17.6% |
| College / Undergraduate | 28 | 17.6% |
| Graduate / Professional | 3 | 1.9% |
| Total | 159 | 100.0% |
School Enrollment by Age by Funding Source in Union Bridge
Out of a total of 159 students who are enrolled in schools in Union Bridge, 3 (1.9%) attend a private institution, while the remaining 156 (98.1%) are enrolled in public schools. The age group of 25 to 34 year olds has the highest likelihood of being enrolled in private schools, with 3 (18.8% in the age bracket) enrolled. Conversely, the age group of 3 to 4 year olds has the lowest likelihood of being enrolled in a private school, with 21 (100.0% in the age bracket) attending a public institution.
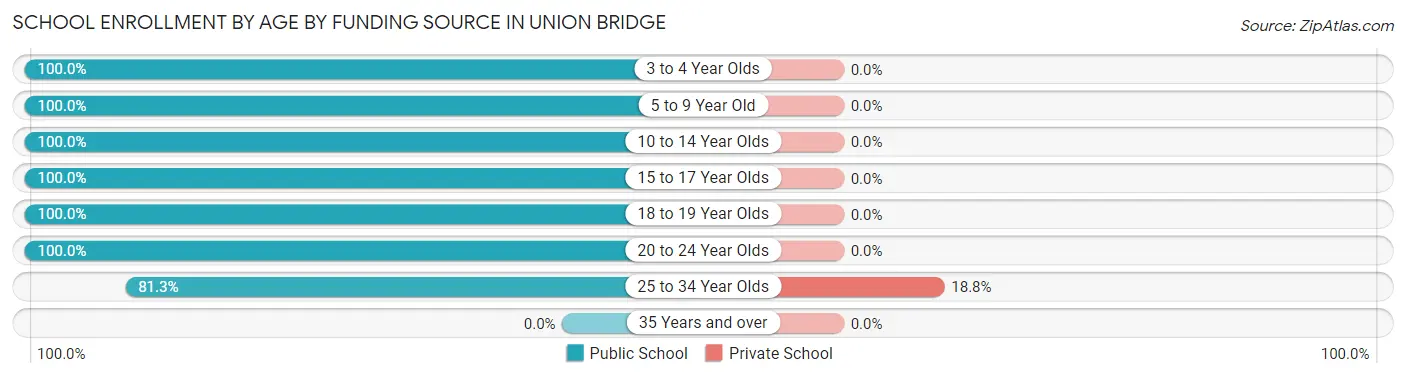
| Age Bracket | Public School | Private School |
| 3 to 4 Year Olds | 21 (100.0%) | 0 (0.0%) |
| 5 to 9 Year Old | 23 (100.0%) | 0 (0.0%) |
| 10 to 14 Year Olds | 56 (100.0%) | 0 (0.0%) |
| 15 to 17 Year Olds | 28 (100.0%) | 0 (0.0%) |
| 18 to 19 Year Olds | 8 (100.0%) | 0 (0.0%) |
| 20 to 24 Year Olds | 7 (100.0%) | 0 (0.0%) |
| 25 to 34 Year Olds | 13 (81.2%) | 3 (18.8%) |
| 35 Years and over | 0 (0.0%) | 0 (0.0%) |
| Total | 156 (98.1%) | 3 (1.9%) |
Educational Attainment by Field of Study in Union Bridge
Business (71 | 33.3%), visual & performing arts (62 | 29.1%), education (29 | 13.6%), engineering (11 | 5.2%), and psychology (9 | 4.2%) are the most common fields of study among 213 individuals in Union Bridge who have obtained a bachelor's degree or higher.
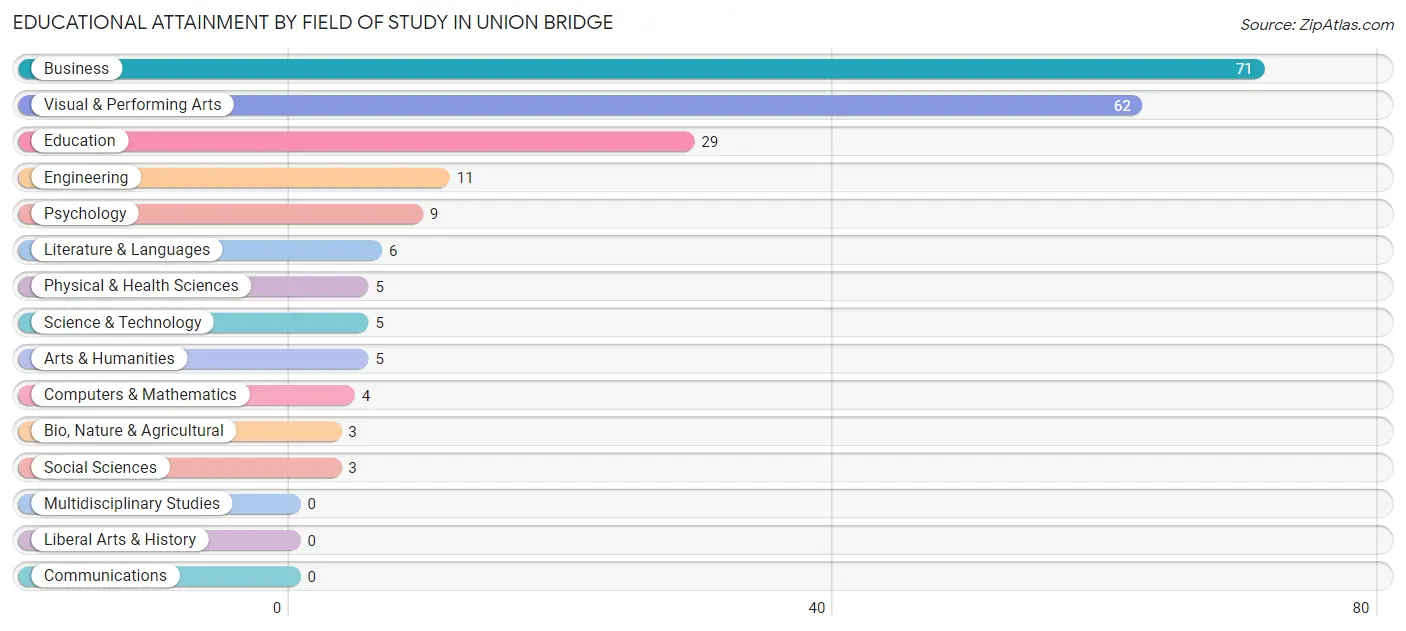
| Field of Study | # Graduates | % Graduates |
| Computers & Mathematics | 4 | 1.9% |
| Bio, Nature & Agricultural | 3 | 1.4% |
| Physical & Health Sciences | 5 | 2.4% |
| Psychology | 9 | 4.2% |
| Social Sciences | 3 | 1.4% |
| Engineering | 11 | 5.2% |
| Multidisciplinary Studies | 0 | 0.0% |
| Science & Technology | 5 | 2.4% |
| Business | 71 | 33.3% |
| Education | 29 | 13.6% |
| Literature & Languages | 6 | 2.8% |
| Liberal Arts & History | 0 | 0.0% |
| Visual & Performing Arts | 62 | 29.1% |
| Communications | 0 | 0.0% |
| Arts & Humanities | 5 | 2.4% |
| Total | 213 | 100.0% |
Transportation & Commute in Union Bridge
Vehicle Availability by Sex in Union Bridge
The most prevalent vehicle ownership categories in Union Bridge are males with 1 vehicle (128, accounting for 37.2%) and females with 1 vehicle (6, making up 82.1%).
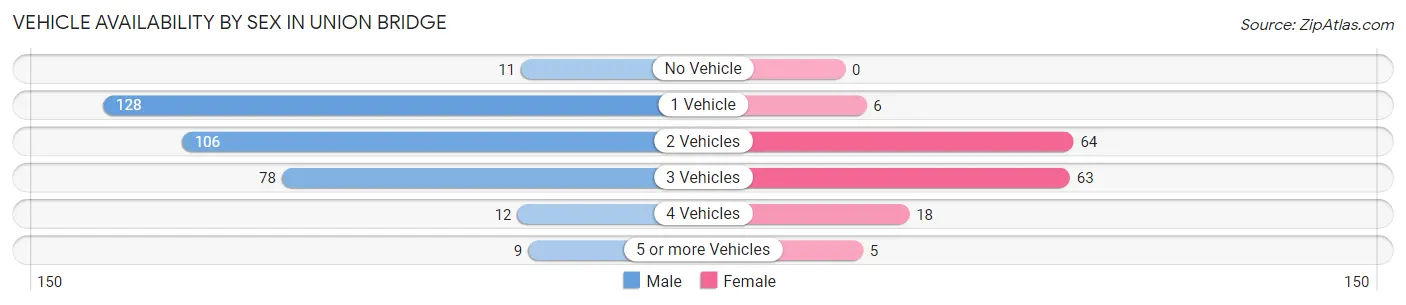
| Vehicles Available | Male | Female |
| No Vehicle | 11 (3.2%) | 0 (0.0%) |
| 1 Vehicle | 128 (37.2%) | 6 (3.8%) |
| 2 Vehicles | 106 (30.8%) | 64 (41.0%) |
| 3 Vehicles | 78 (22.7%) | 63 (40.4%) |
| 4 Vehicles | 12 (3.5%) | 18 (11.5%) |
| 5 or more Vehicles | 9 (2.6%) | 5 (3.2%) |
| Total | 344 (100.0%) | 156 (100.0%) |
Commute Time in Union Bridge
The most frequently occuring commute durations in Union Bridge are 20 to 24 minutes (99 commuters, 20.6%), 45 to 59 minutes (81 commuters, 16.8%), and 30 to 34 minutes (60 commuters, 12.5%).
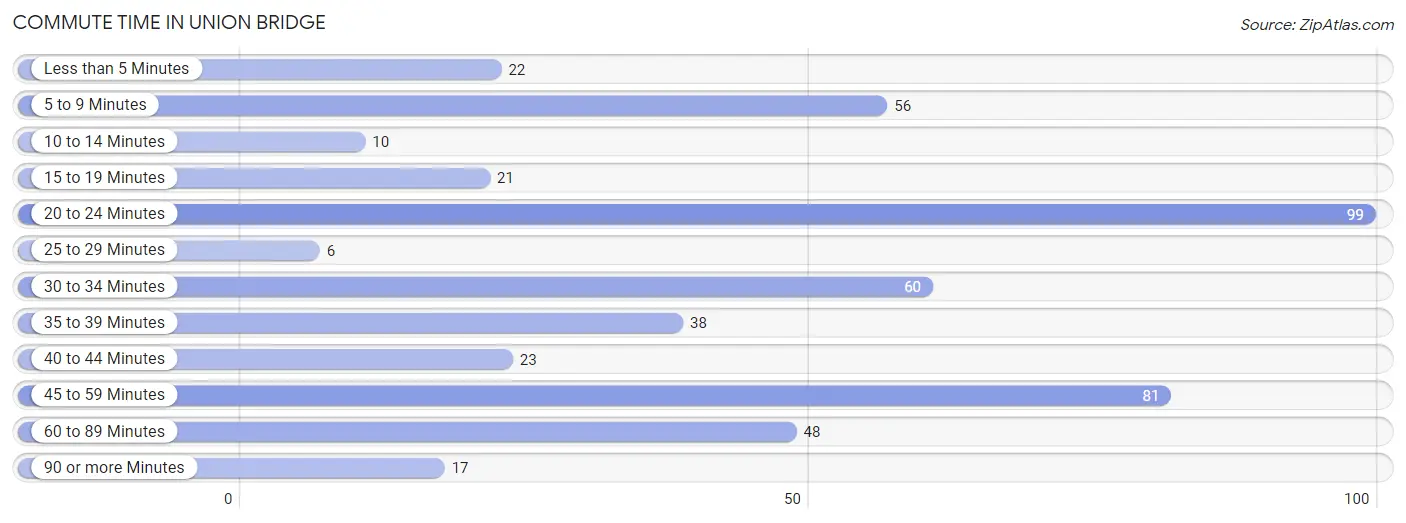
| Commute Time | # Commuters | % Commuters |
| Less than 5 Minutes | 22 | 4.6% |
| 5 to 9 Minutes | 56 | 11.6% |
| 10 to 14 Minutes | 10 | 2.1% |
| 15 to 19 Minutes | 21 | 4.4% |
| 20 to 24 Minutes | 99 | 20.6% |
| 25 to 29 Minutes | 6 | 1.3% |
| 30 to 34 Minutes | 60 | 12.5% |
| 35 to 39 Minutes | 38 | 7.9% |
| 40 to 44 Minutes | 23 | 4.8% |
| 45 to 59 Minutes | 81 | 16.8% |
| 60 to 89 Minutes | 48 | 10.0% |
| 90 or more Minutes | 17 | 3.5% |
Commute Time by Sex in Union Bridge
The most common commute times in Union Bridge are 45 to 59 minutes (70 commuters, 21.0%) for males and 20 to 24 minutes (37 commuters, 25.0%) for females.
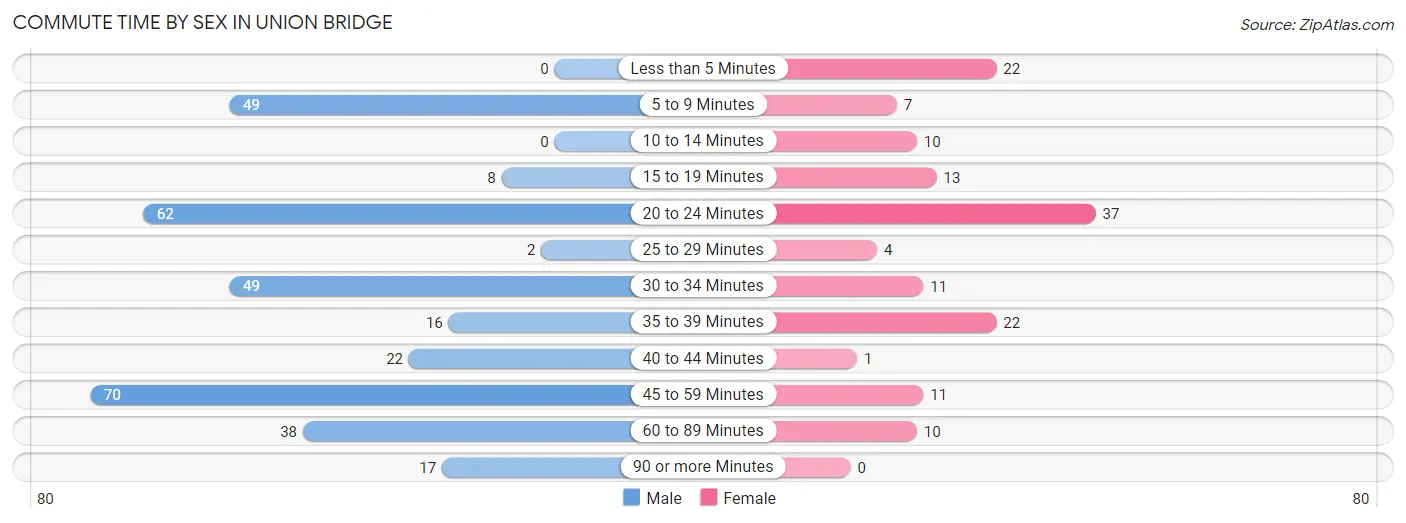
| Commute Time | Male | Female |
| Less than 5 Minutes | 0 (0.0%) | 22 (14.9%) |
| 5 to 9 Minutes | 49 (14.7%) | 7 (4.7%) |
| 10 to 14 Minutes | 0 (0.0%) | 10 (6.8%) |
| 15 to 19 Minutes | 8 (2.4%) | 13 (8.8%) |
| 20 to 24 Minutes | 62 (18.6%) | 37 (25.0%) |
| 25 to 29 Minutes | 2 (0.6%) | 4 (2.7%) |
| 30 to 34 Minutes | 49 (14.7%) | 11 (7.4%) |
| 35 to 39 Minutes | 16 (4.8%) | 22 (14.9%) |
| 40 to 44 Minutes | 22 (6.6%) | 1 (0.7%) |
| 45 to 59 Minutes | 70 (21.0%) | 11 (7.4%) |
| 60 to 89 Minutes | 38 (11.4%) | 10 (6.8%) |
| 90 or more Minutes | 17 (5.1%) | 0 (0.0%) |
Time of Departure to Work by Sex in Union Bridge
The most frequent times of departure to work in Union Bridge are 7:30 AM to 7:59 AM (71, 21.3%) for males and 7:30 AM to 7:59 AM (30, 20.3%) for females.
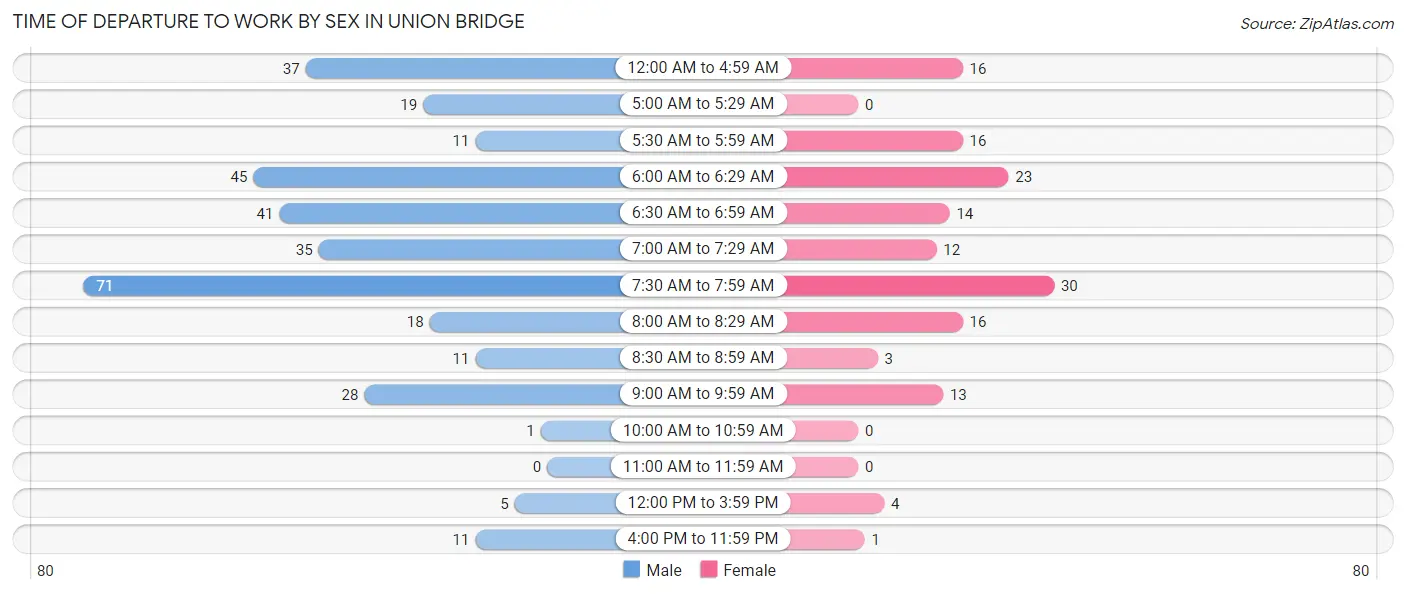
| Time of Departure | Male | Female |
| 12:00 AM to 4:59 AM | 37 (11.1%) | 16 (10.8%) |
| 5:00 AM to 5:29 AM | 19 (5.7%) | 0 (0.0%) |
| 5:30 AM to 5:59 AM | 11 (3.3%) | 16 (10.8%) |
| 6:00 AM to 6:29 AM | 45 (13.5%) | 23 (15.5%) |
| 6:30 AM to 6:59 AM | 41 (12.3%) | 14 (9.5%) |
| 7:00 AM to 7:29 AM | 35 (10.5%) | 12 (8.1%) |
| 7:30 AM to 7:59 AM | 71 (21.3%) | 30 (20.3%) |
| 8:00 AM to 8:29 AM | 18 (5.4%) | 16 (10.8%) |
| 8:30 AM to 8:59 AM | 11 (3.3%) | 3 (2.0%) |
| 9:00 AM to 9:59 AM | 28 (8.4%) | 13 (8.8%) |
| 10:00 AM to 10:59 AM | 1 (0.3%) | 0 (0.0%) |
| 11:00 AM to 11:59 AM | 0 (0.0%) | 0 (0.0%) |
| 12:00 PM to 3:59 PM | 5 (1.5%) | 4 (2.7%) |
| 4:00 PM to 11:59 PM | 11 (3.3%) | 1 (0.7%) |
| Total | 333 (100.0%) | 148 (100.0%) |
Housing Occupancy in Union Bridge
Occupancy by Ownership in Union Bridge
Of the total 447 dwellings in Union Bridge, owner-occupied units account for 278 (62.2%), while renter-occupied units make up 169 (37.8%).
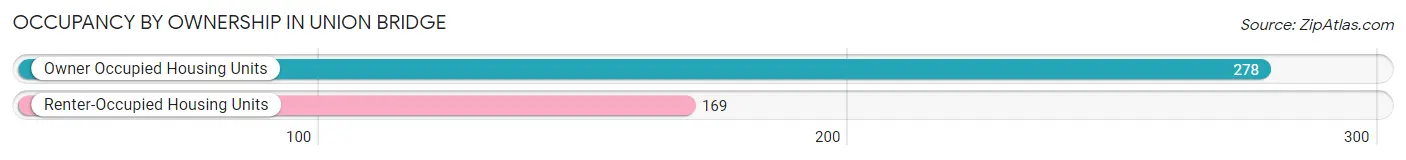
| Occupancy | # Housing Units | % Housing Units |
| Owner Occupied Housing Units | 278 | 62.2% |
| Renter-Occupied Housing Units | 169 | 37.8% |
| Total Occupied Housing Units | 447 | 100.0% |
Occupancy by Household Size in Union Bridge
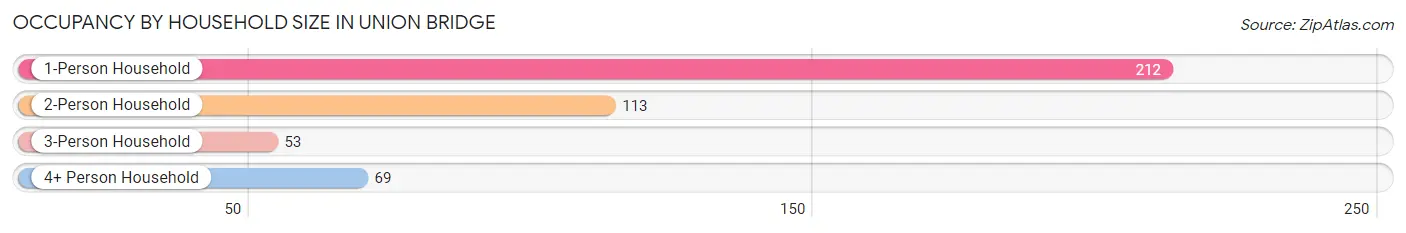
| Household Size | # Housing Units | % Housing Units |
| 1-Person Household | 212 | 47.4% |
| 2-Person Household | 113 | 25.3% |
| 3-Person Household | 53 | 11.9% |
| 4+ Person Household | 69 | 15.4% |
| Total Housing Units | 447 | 100.0% |
Occupancy by Ownership by Household Size in Union Bridge
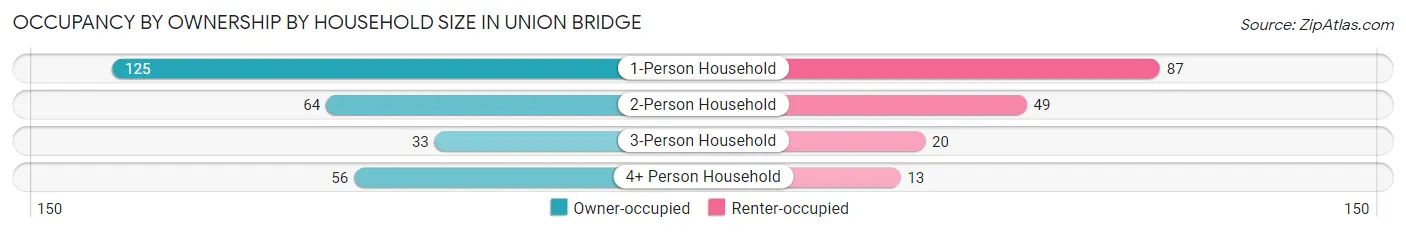
| Household Size | Owner-occupied | Renter-occupied |
| 1-Person Household | 125 (59.0%) | 87 (41.0%) |
| 2-Person Household | 64 (56.6%) | 49 (43.4%) |
| 3-Person Household | 33 (62.3%) | 20 (37.7%) |
| 4+ Person Household | 56 (81.2%) | 13 (18.8%) |
| Total Housing Units | 278 (62.2%) | 169 (37.8%) |
Occupancy by Educational Attainment in Union Bridge
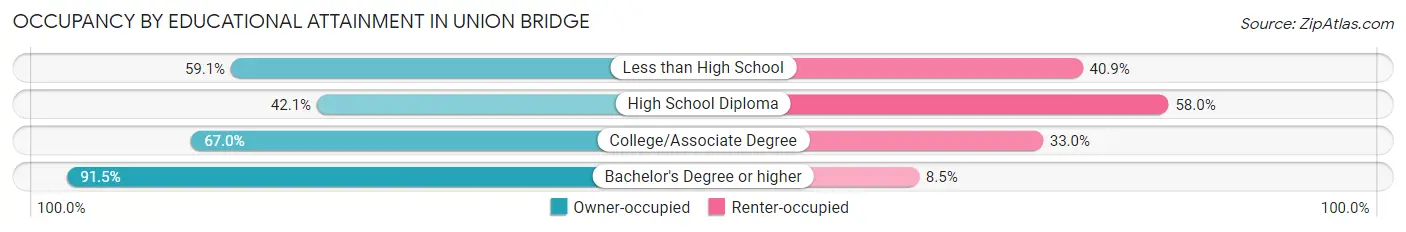
| Household Size | Owner-occupied | Renter-occupied |
| Less than High School | 13 (59.1%) | 9 (40.9%) |
| High School Diploma | 82 (42.0%) | 113 (58.0%) |
| College/Associate Degree | 75 (67.0%) | 37 (33.0%) |
| Bachelor's Degree or higher | 108 (91.5%) | 10 (8.5%) |
Occupancy by Age of Householder in Union Bridge
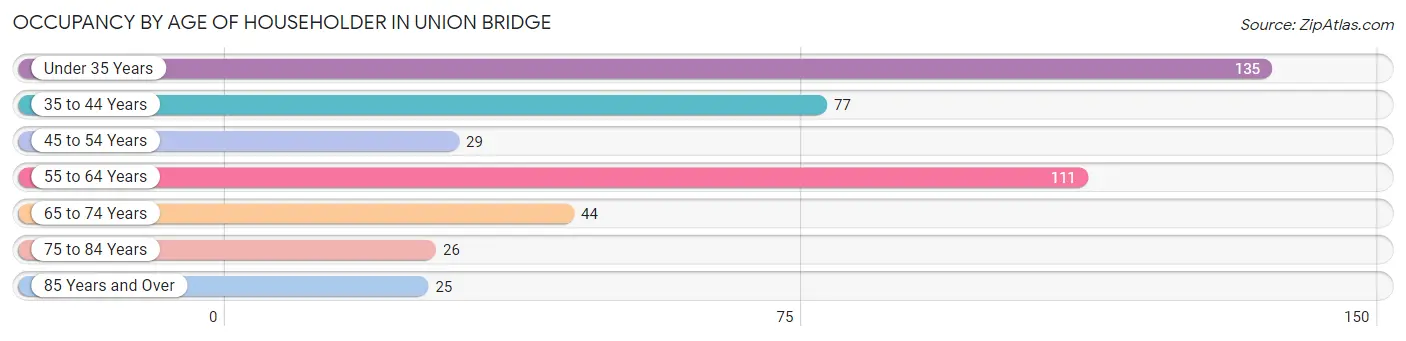
| Age Bracket | # Households | % Households |
| Under 35 Years | 135 | 30.2% |
| 35 to 44 Years | 77 | 17.2% |
| 45 to 54 Years | 29 | 6.5% |
| 55 to 64 Years | 111 | 24.8% |
| 65 to 74 Years | 44 | 9.8% |
| 75 to 84 Years | 26 | 5.8% |
| 85 Years and Over | 25 | 5.6% |
| Total | 447 | 100.0% |
Housing Finances in Union Bridge
Median Income by Occupancy in Union Bridge
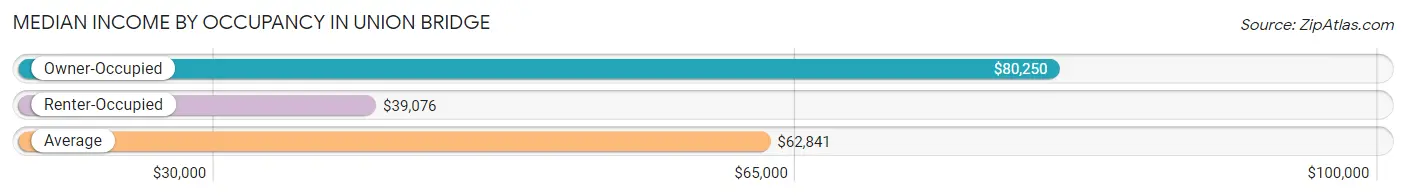
| Occupancy Type | # Households | Median Income |
| Owner-Occupied | 278 (62.2%) | $80,250 |
| Renter-Occupied | 169 (37.8%) | $39,076 |
| Average | 447 (100.0%) | $62,841 |
Occupancy by Householder Income Bracket in Union Bridge
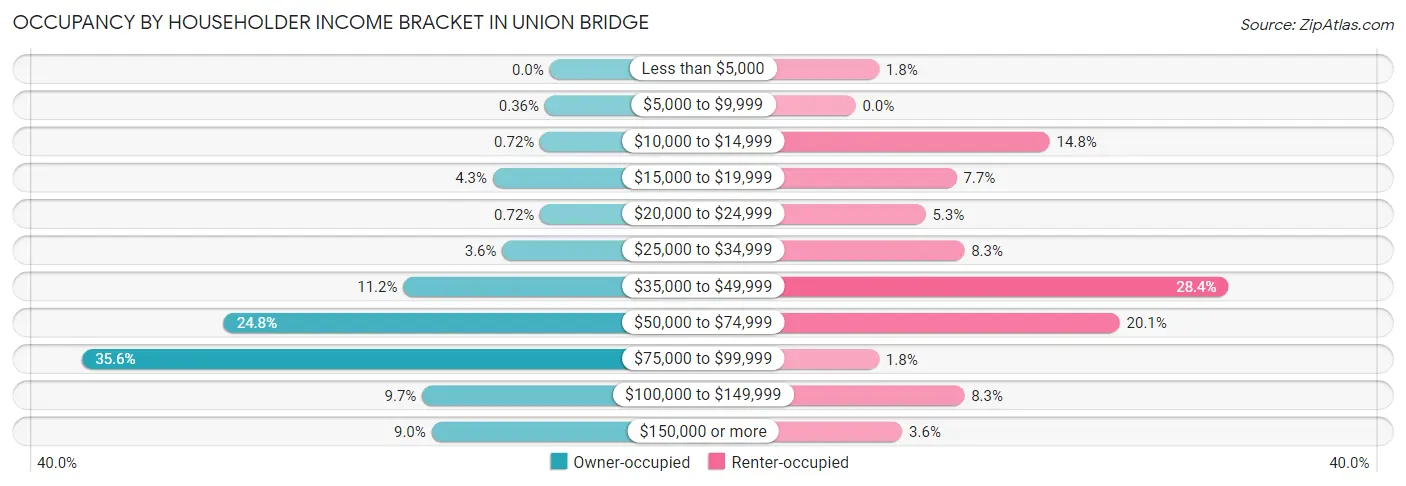
| Income Bracket | Owner-occupied | Renter-occupied |
| Less than $5,000 | 0 (0.0%) | 3 (1.8%) |
| $5,000 to $9,999 | 1 (0.4%) | 0 (0.0%) |
| $10,000 to $14,999 | 2 (0.7%) | 25 (14.8%) |
| $15,000 to $19,999 | 12 (4.3%) | 13 (7.7%) |
| $20,000 to $24,999 | 2 (0.7%) | 9 (5.3%) |
| $25,000 to $34,999 | 10 (3.6%) | 14 (8.3%) |
| $35,000 to $49,999 | 31 (11.2%) | 48 (28.4%) |
| $50,000 to $74,999 | 69 (24.8%) | 34 (20.1%) |
| $75,000 to $99,999 | 99 (35.6%) | 3 (1.8%) |
| $100,000 to $149,999 | 27 (9.7%) | 14 (8.3%) |
| $150,000 or more | 25 (9.0%) | 6 (3.5%) |
| Total | 278 (100.0%) | 169 (100.0%) |
Monthly Housing Cost Tiers in Union Bridge
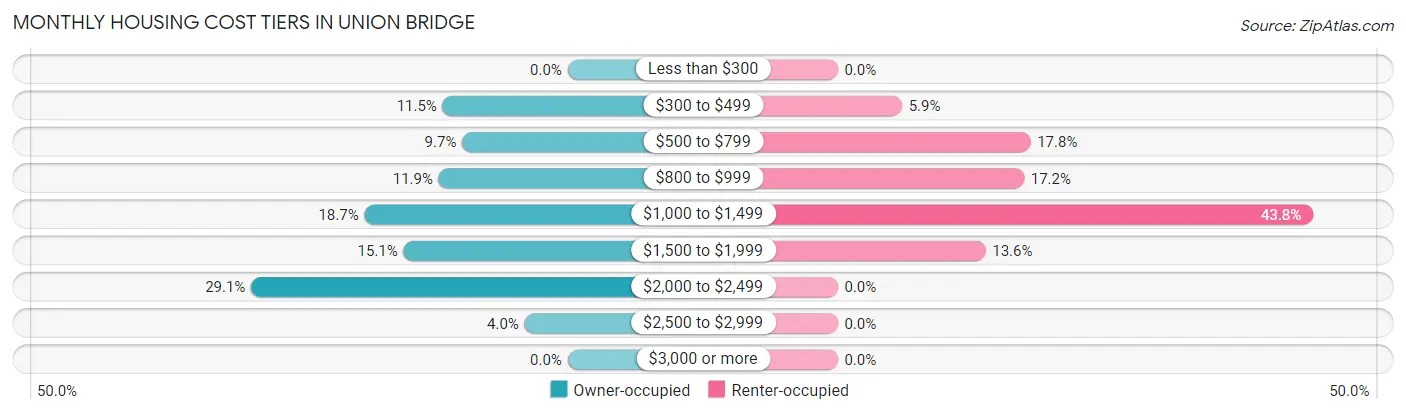
| Monthly Cost | Owner-occupied | Renter-occupied |
| Less than $300 | 0 (0.0%) | 0 (0.0%) |
| $300 to $499 | 32 (11.5%) | 10 (5.9%) |
| $500 to $799 | 27 (9.7%) | 30 (17.7%) |
| $800 to $999 | 33 (11.9%) | 29 (17.2%) |
| $1,000 to $1,499 | 52 (18.7%) | 74 (43.8%) |
| $1,500 to $1,999 | 42 (15.1%) | 23 (13.6%) |
| $2,000 to $2,499 | 81 (29.1%) | 0 (0.0%) |
| $2,500 to $2,999 | 11 (4.0%) | 0 (0.0%) |
| $3,000 or more | 0 (0.0%) | 0 (0.0%) |
| Total | 278 (100.0%) | 169 (100.0%) |
Physical Housing Characteristics in Union Bridge
Housing Structures in Union Bridge

| Structure Type | # Housing Units | % Housing Units |
| Single Unit, Detached | 318 | 71.1% |
| Single Unit, Attached | 29 | 6.5% |
| 2 Unit Apartments | 42 | 9.4% |
| 3 or 4 Unit Apartments | 30 | 6.7% |
| 5 to 9 Unit Apartments | 28 | 6.3% |
| 10 or more Apartments | 0 | 0.0% |
| Mobile Home / Other | 0 | 0.0% |
| Total | 447 | 100.0% |
Housing Structures by Occupancy in Union Bridge
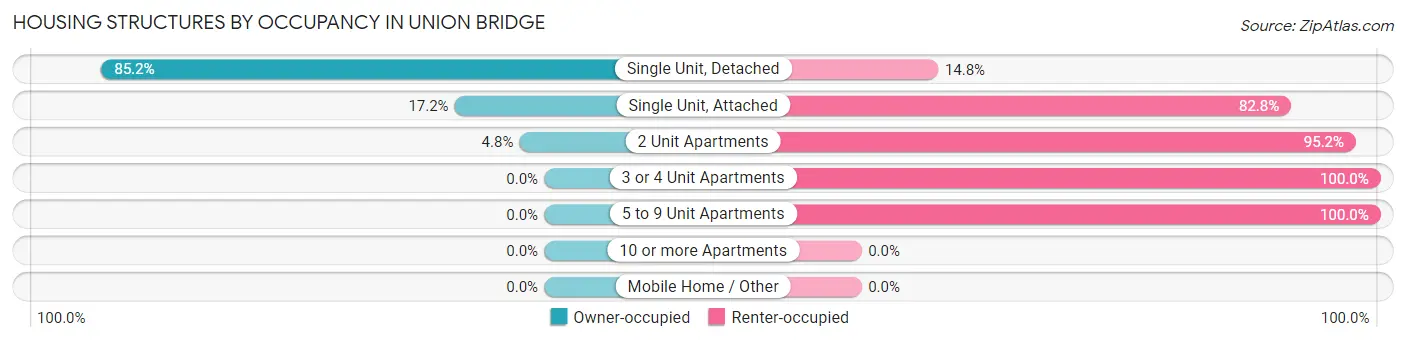
| Structure Type | Owner-occupied | Renter-occupied |
| Single Unit, Detached | 271 (85.2%) | 47 (14.8%) |
| Single Unit, Attached | 5 (17.2%) | 24 (82.8%) |
| 2 Unit Apartments | 2 (4.8%) | 40 (95.2%) |
| 3 or 4 Unit Apartments | 0 (0.0%) | 30 (100.0%) |
| 5 to 9 Unit Apartments | 0 (0.0%) | 28 (100.0%) |
| 10 or more Apartments | 0 (0.0%) | 0 (0.0%) |
| Mobile Home / Other | 0 (0.0%) | 0 (0.0%) |
| Total | 278 (62.2%) | 169 (37.8%) |
Housing Structures by Number of Rooms in Union Bridge
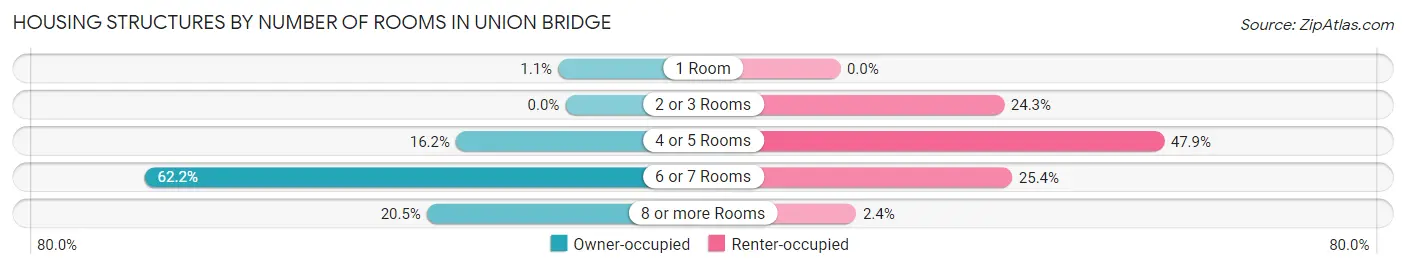
| Number of Rooms | Owner-occupied | Renter-occupied |
| 1 Room | 3 (1.1%) | 0 (0.0%) |
| 2 or 3 Rooms | 0 (0.0%) | 41 (24.3%) |
| 4 or 5 Rooms | 45 (16.2%) | 81 (47.9%) |
| 6 or 7 Rooms | 173 (62.2%) | 43 (25.4%) |
| 8 or more Rooms | 57 (20.5%) | 4 (2.4%) |
| Total | 278 (100.0%) | 169 (100.0%) |
Housing Structure by Heating Type in Union Bridge
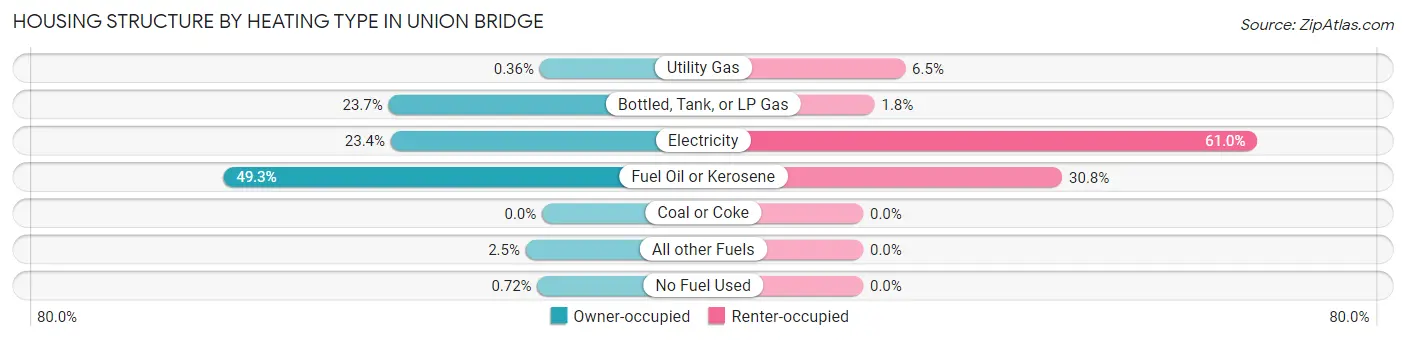
| Heating Type | Owner-occupied | Renter-occupied |
| Utility Gas | 1 (0.4%) | 11 (6.5%) |
| Bottled, Tank, or LP Gas | 66 (23.7%) | 3 (1.8%) |
| Electricity | 65 (23.4%) | 103 (61.0%) |
| Fuel Oil or Kerosene | 137 (49.3%) | 52 (30.8%) |
| Coal or Coke | 0 (0.0%) | 0 (0.0%) |
| All other Fuels | 7 (2.5%) | 0 (0.0%) |
| No Fuel Used | 2 (0.7%) | 0 (0.0%) |
| Total | 278 (100.0%) | 169 (100.0%) |
Household Vehicle Usage in Union Bridge
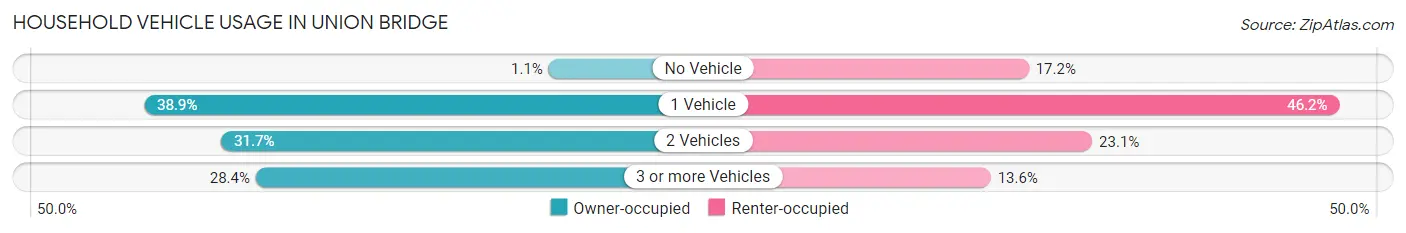
| Vehicles per Household | Owner-occupied | Renter-occupied |
| No Vehicle | 3 (1.1%) | 29 (17.2%) |
| 1 Vehicle | 108 (38.9%) | 78 (46.2%) |
| 2 Vehicles | 88 (31.7%) | 39 (23.1%) |
| 3 or more Vehicles | 79 (28.4%) | 23 (13.6%) |
| Total | 278 (100.0%) | 169 (100.0%) |
Real Estate & Mortgages in Union Bridge
Real Estate and Mortgage Overview in Union Bridge
| Characteristic | Without Mortgage | With Mortgage |
| Housing Units | 62 | 216 |
| Median Property Value | $212,500 | $253,100 |
| Median Household Income | $63,750 | $21 |
| Monthly Housing Costs | $492 | $0 |
| Real Estate Taxes | $2,521 | $0 |
Property Value by Mortgage Status in Union Bridge
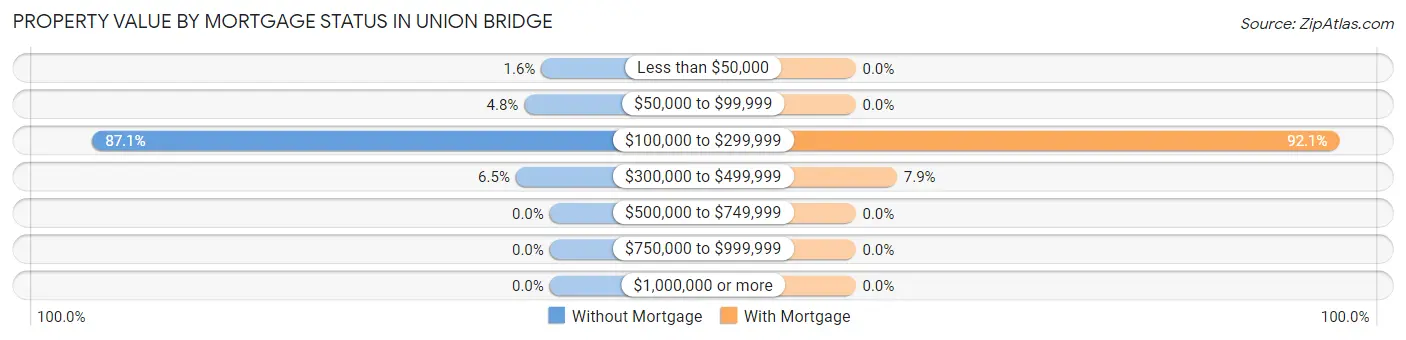
| Property Value | Without Mortgage | With Mortgage |
| Less than $50,000 | 1 (1.6%) | 0 (0.0%) |
| $50,000 to $99,999 | 3 (4.8%) | 0 (0.0%) |
| $100,000 to $299,999 | 54 (87.1%) | 199 (92.1%) |
| $300,000 to $499,999 | 4 (6.5%) | 17 (7.9%) |
| $500,000 to $749,999 | 0 (0.0%) | 0 (0.0%) |
| $750,000 to $999,999 | 0 (0.0%) | 0 (0.0%) |
| $1,000,000 or more | 0 (0.0%) | 0 (0.0%) |
| Total | 62 (100.0%) | 216 (100.0%) |
Household Income by Mortgage Status in Union Bridge
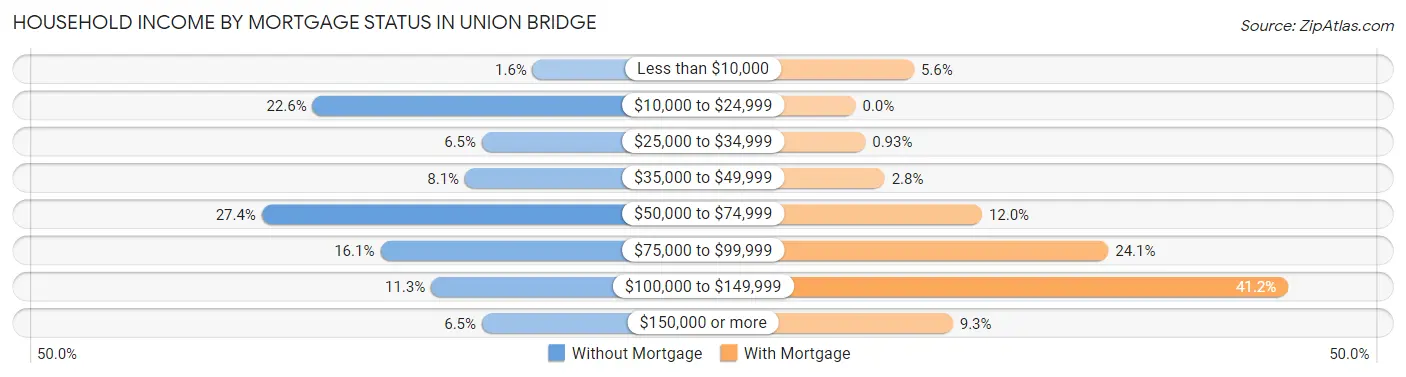
| Household Income | Without Mortgage | With Mortgage |
| Less than $10,000 | 1 (1.6%) | 12 (5.6%) |
| $10,000 to $24,999 | 14 (22.6%) | 0 (0.0%) |
| $25,000 to $34,999 | 4 (6.5%) | 2 (0.9%) |
| $35,000 to $49,999 | 5 (8.1%) | 6 (2.8%) |
| $50,000 to $74,999 | 17 (27.4%) | 26 (12.0%) |
| $75,000 to $99,999 | 10 (16.1%) | 52 (24.1%) |
| $100,000 to $149,999 | 7 (11.3%) | 89 (41.2%) |
| $150,000 or more | 4 (6.5%) | 20 (9.3%) |
| Total | 62 (100.0%) | 216 (100.0%) |
Property Value to Household Income Ratio in Union Bridge
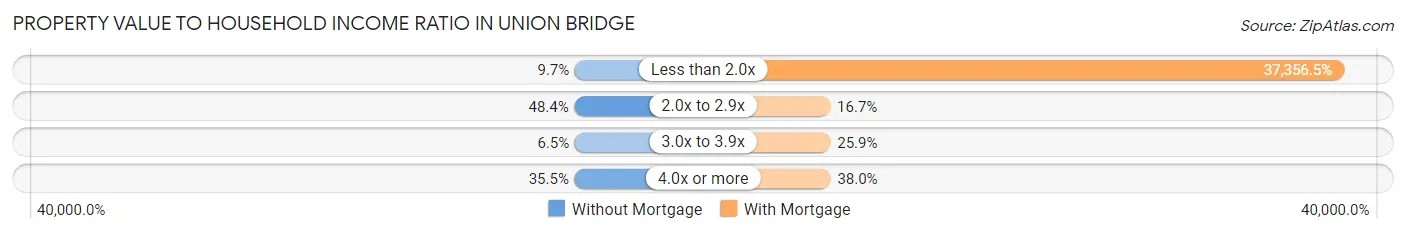
| Value-to-Income Ratio | Without Mortgage | With Mortgage |
| Less than 2.0x | 6 (9.7%) | 80,690 (37,356.5%) |
| 2.0x to 2.9x | 30 (48.4%) | 36 (16.7%) |
| 3.0x to 3.9x | 4 (6.5%) | 56 (25.9%) |
| 4.0x or more | 22 (35.5%) | 82 (38.0%) |
| Total | 62 (100.0%) | 216 (100.0%) |
Real Estate Taxes by Mortgage Status in Union Bridge
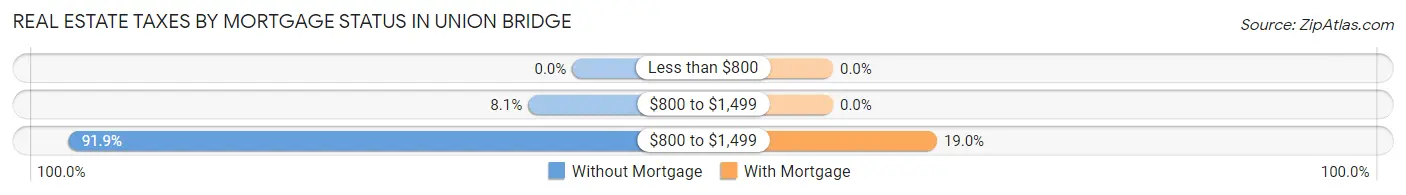
| Property Taxes | Without Mortgage | With Mortgage |
| Less than $800 | 0 (0.0%) | 0 (0.0%) |
| $800 to $1,499 | 5 (8.1%) | 0 (0.0%) |
| $800 to $1,499 | 57 (91.9%) | 41 (19.0%) |
| Total | 62 (100.0%) | 216 (100.0%) |
Health & Disability in Union Bridge
Health Insurance Coverage by Age in Union Bridge
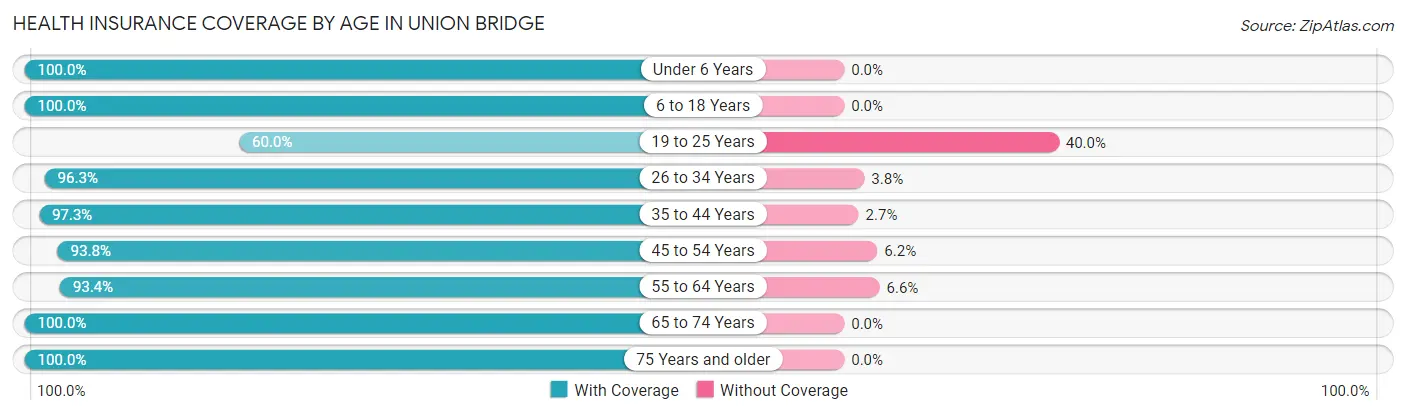
| Age Bracket | With Coverage | Without Coverage |
| Under 6 Years | 85 (100.0%) | 0 (0.0%) |
| 6 to 18 Years | 123 (100.0%) | 0 (0.0%) |
| 19 to 25 Years | 36 (60.0%) | 24 (40.0%) |
| 26 to 34 Years | 154 (96.3%) | 6 (3.7%) |
| 35 to 44 Years | 145 (97.3%) | 4 (2.7%) |
| 45 to 54 Years | 76 (93.8%) | 5 (6.2%) |
| 55 to 64 Years | 142 (93.4%) | 10 (6.6%) |
| 65 to 74 Years | 63 (100.0%) | 0 (0.0%) |
| 75 Years and older | 66 (100.0%) | 0 (0.0%) |
| Total | 890 (94.8%) | 49 (5.2%) |
Health Insurance Coverage by Citizenship Status in Union Bridge
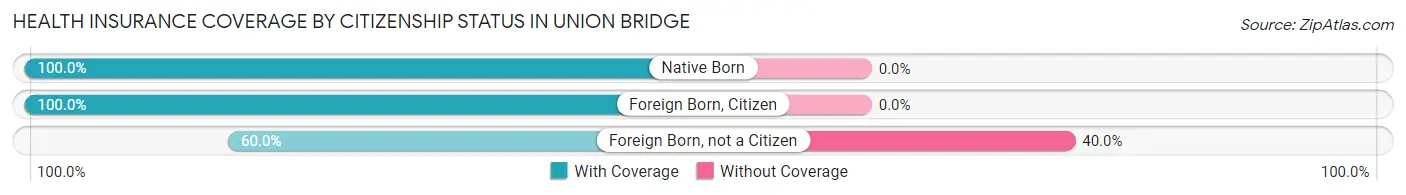
| Citizenship Status | With Coverage | Without Coverage |
| Native Born | 85 (100.0%) | 0 (0.0%) |
| Foreign Born, Citizen | 123 (100.0%) | 0 (0.0%) |
| Foreign Born, not a Citizen | 36 (60.0%) | 24 (40.0%) |
Health Insurance Coverage by Household Income in Union Bridge
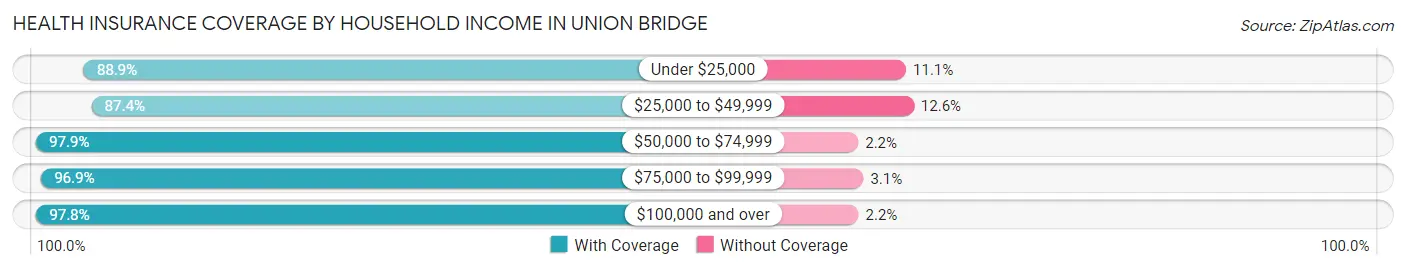
| Household Income | With Coverage | Without Coverage |
| Under $25,000 | 88 (88.9%) | 11 (11.1%) |
| $25,000 to $49,999 | 153 (87.4%) | 22 (12.6%) |
| $50,000 to $74,999 | 273 (97.9%) | 6 (2.1%) |
| $75,000 to $99,999 | 155 (96.9%) | 5 (3.1%) |
| $100,000 and over | 221 (97.8%) | 5 (2.2%) |
Public vs Private Health Insurance Coverage by Age in Union Bridge
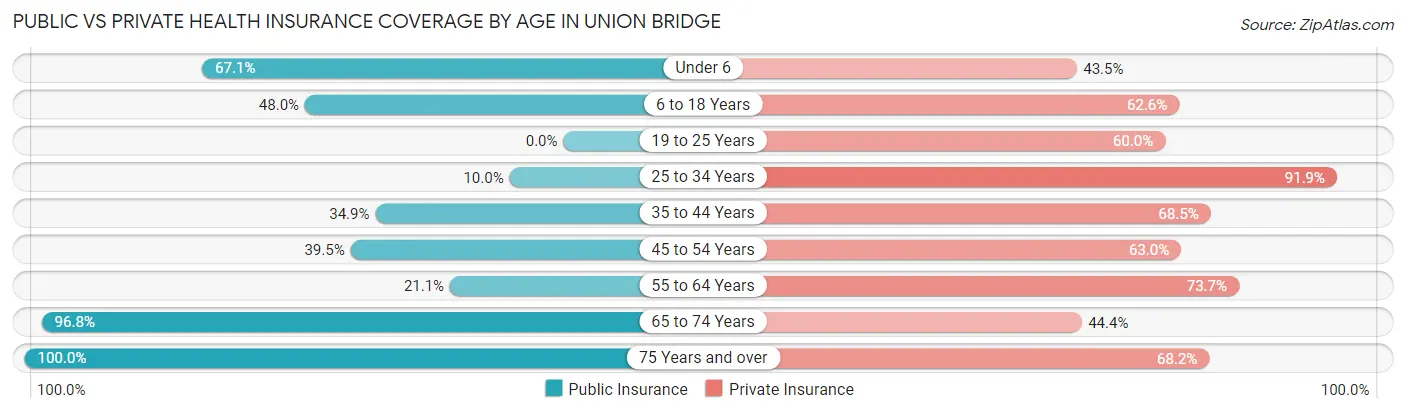
| Age Bracket | Public Insurance | Private Insurance |
| Under 6 | 57 (67.1%) | 37 (43.5%) |
| 6 to 18 Years | 59 (48.0%) | 77 (62.6%) |
| 19 to 25 Years | 0 (0.0%) | 36 (60.0%) |
| 25 to 34 Years | 16 (10.0%) | 147 (91.9%) |
| 35 to 44 Years | 52 (34.9%) | 102 (68.5%) |
| 45 to 54 Years | 32 (39.5%) | 51 (63.0%) |
| 55 to 64 Years | 32 (21.0%) | 112 (73.7%) |
| 65 to 74 Years | 61 (96.8%) | 28 (44.4%) |
| 75 Years and over | 66 (100.0%) | 45 (68.2%) |
| Total | 375 (39.9%) | 635 (67.6%) |
Disability Status by Sex by Age in Union Bridge
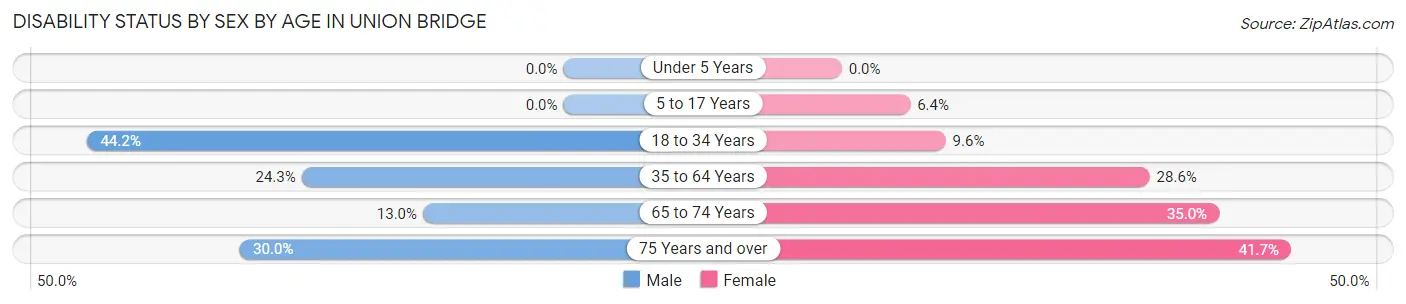
| Age Bracket | Male | Female |
| Under 5 Years | 0 (0.0%) | 0 (0.0%) |
| 5 to 17 Years | 0 (0.0%) | 4 (6.4%) |
| 18 to 34 Years | 68 (44.2%) | 8 (9.6%) |
| 35 to 64 Years | 52 (24.3%) | 48 (28.6%) |
| 65 to 74 Years | 3 (13.0%) | 14 (35.0%) |
| 75 Years and over | 9 (30.0%) | 15 (41.7%) |
Disability Class by Sex by Age in Union Bridge
Disability Class: Hearing Difficulty
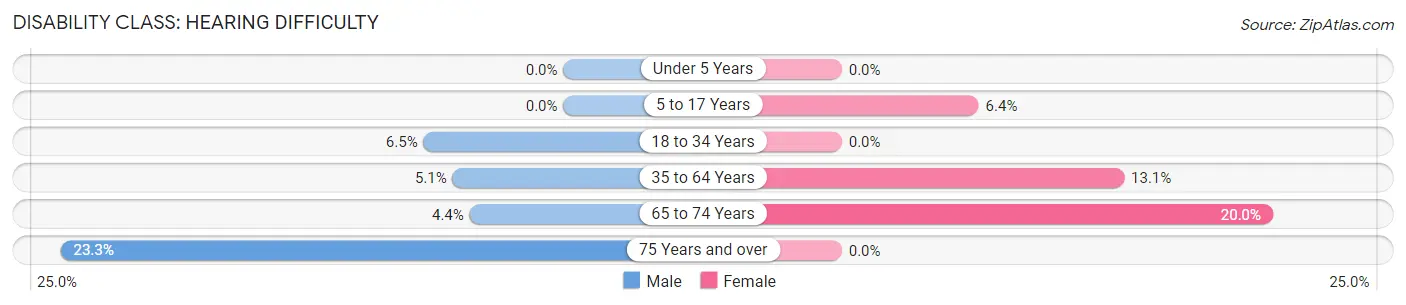
| Age Bracket | Male | Female |
| Under 5 Years | 0 (0.0%) | 0 (0.0%) |
| 5 to 17 Years | 0 (0.0%) | 4 (6.4%) |
| 18 to 34 Years | 10 (6.5%) | 0 (0.0%) |
| 35 to 64 Years | 11 (5.1%) | 22 (13.1%) |
| 65 to 74 Years | 1 (4.3%) | 8 (20.0%) |
| 75 Years and over | 7 (23.3%) | 0 (0.0%) |
Disability Class: Vision Difficulty
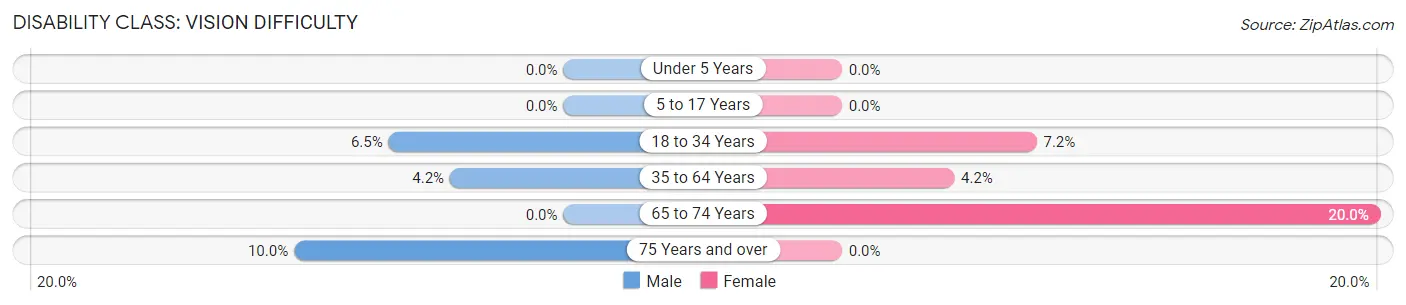
| Age Bracket | Male | Female |
| Under 5 Years | 0 (0.0%) | 0 (0.0%) |
| 5 to 17 Years | 0 (0.0%) | 0 (0.0%) |
| 18 to 34 Years | 10 (6.5%) | 6 (7.2%) |
| 35 to 64 Years | 9 (4.2%) | 7 (4.2%) |
| 65 to 74 Years | 0 (0.0%) | 8 (20.0%) |
| 75 Years and over | 3 (10.0%) | 0 (0.0%) |
Disability Class: Cognitive Difficulty
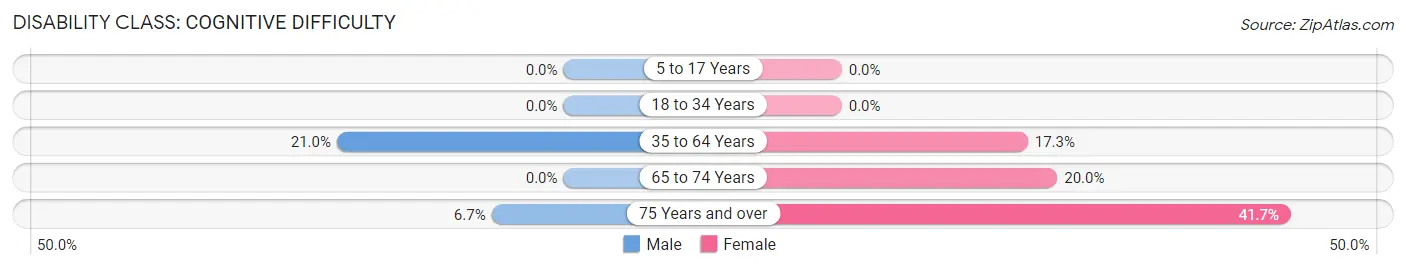
| Age Bracket | Male | Female |
| 5 to 17 Years | 0 (0.0%) | 0 (0.0%) |
| 18 to 34 Years | 0 (0.0%) | 0 (0.0%) |
| 35 to 64 Years | 45 (21.0%) | 29 (17.3%) |
| 65 to 74 Years | 0 (0.0%) | 8 (20.0%) |
| 75 Years and over | 2 (6.7%) | 15 (41.7%) |
Disability Class: Ambulatory Difficulty
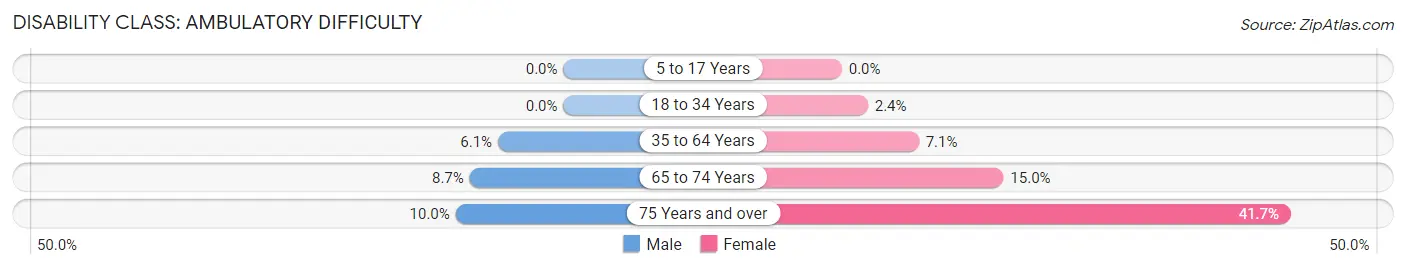
| Age Bracket | Male | Female |
| 5 to 17 Years | 0 (0.0%) | 0 (0.0%) |
| 18 to 34 Years | 0 (0.0%) | 2 (2.4%) |
| 35 to 64 Years | 13 (6.1%) | 12 (7.1%) |
| 65 to 74 Years | 2 (8.7%) | 6 (15.0%) |
| 75 Years and over | 3 (10.0%) | 15 (41.7%) |
Disability Class: Self-Care Difficulty
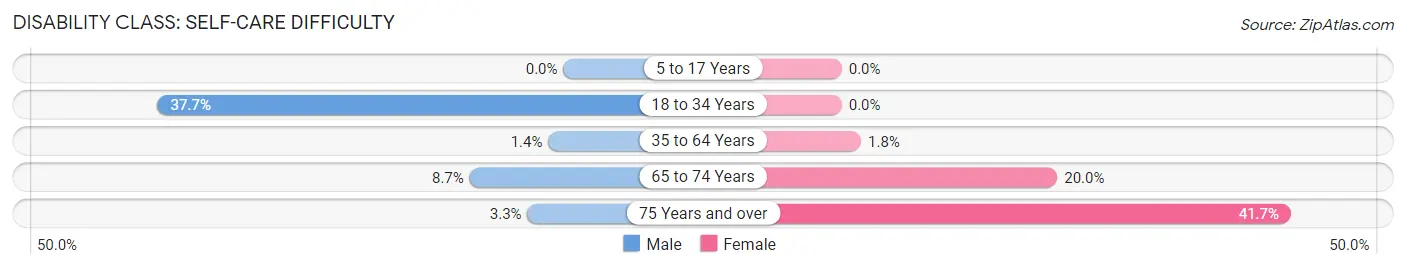
| Age Bracket | Male | Female |
| 5 to 17 Years | 0 (0.0%) | 0 (0.0%) |
| 18 to 34 Years | 58 (37.7%) | 0 (0.0%) |
| 35 to 64 Years | 3 (1.4%) | 3 (1.8%) |
| 65 to 74 Years | 2 (8.7%) | 8 (20.0%) |
| 75 Years and over | 1 (3.3%) | 15 (41.7%) |
Technology Access in Union Bridge
Computing Device Access in Union Bridge
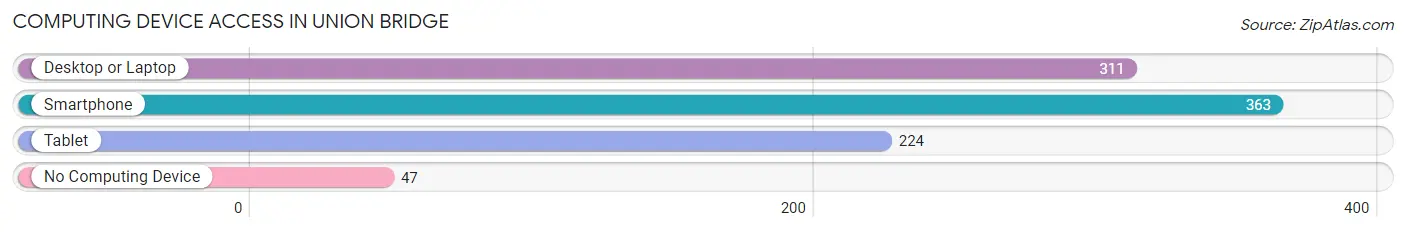
| Device Type | # Households | % Households |
| Desktop or Laptop | 311 | 69.6% |
| Smartphone | 363 | 81.2% |
| Tablet | 224 | 50.1% |
| No Computing Device | 47 | 10.5% |
| Total | 447 | 100.0% |
Internet Access in Union Bridge
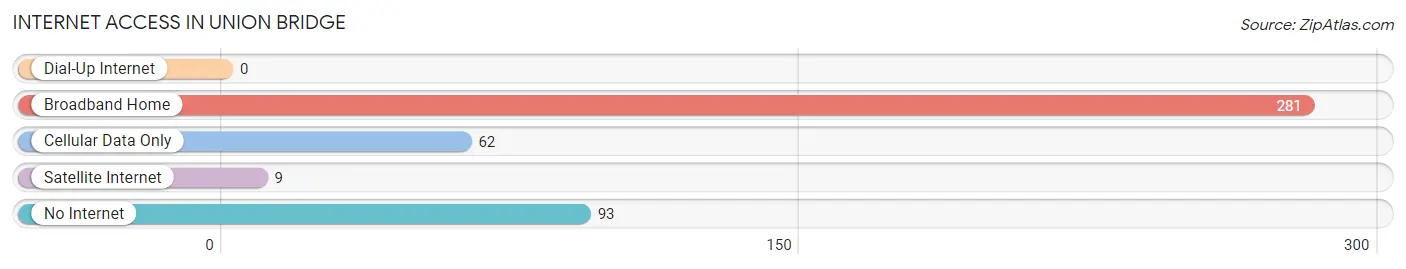
| Internet Type | # Households | % Households |
| Dial-Up Internet | 0 | 0.0% |
| Broadband Home | 281 | 62.9% |
| Cellular Data Only | 62 | 13.9% |
| Satellite Internet | 9 | 2.0% |
| No Internet | 93 | 20.8% |
| Total | 447 | 100.0% |
Union Bridge Summary
Union Bridge is a small town located in Carroll County, Maryland. It is situated along the Monocacy River, approximately 30 miles northwest of Baltimore. The town has a population of 1,521 as of the 2010 census.
History
Union Bridge was founded in 1797 by a group of German settlers who had migrated from Pennsylvania. The town was named after the Union Bridge, which was built in 1813 to span the Monocacy River. The bridge was the first of its kind in the United States and was the first bridge to span the Monocacy River.
The town was an important stop on the Baltimore and Ohio Railroad, which ran through the town from 1831 to 1971. The railroad was a major factor in the town’s growth and development.
The town was also home to a number of mills, including a flour mill, a saw mill, and a paper mill. The paper mill was the largest employer in the town until it closed in the late 1970s.
Geography
Union Bridge is located in the Piedmont region of Maryland. The town is situated along the Monocacy River, which is a tributary of the Potomac River. The town is surrounded by rolling hills and farmland.
The town has a total area of 1.2 square miles, all of which is land. The town is located at an elevation of 545 feet above sea level.
Economy
The economy of Union Bridge is largely based on agriculture and tourism. The town is home to a number of farms, including dairy farms, beef farms, and vegetable farms. The town is also home to a number of wineries and vineyards.
The town is also home to a number of small businesses, including restaurants, shops, and services. The town is also home to a number of bed and breakfasts.
Demographics
As of the 2010 census, the population of Union Bridge was 1,521. The racial makeup of the town was 95.3% White, 1.2% African American, 0.3% Native American, 0.7% Asian, 0.1% Pacific Islander, 0.7% from other races, and 1.9% from two or more races. Hispanic or Latino of any race were 2.2% of the population.
The median income for a household in the town was $50,938, and the median income for a family was $60,000. The per capita income for the town was $22,845. About 8.2% of families and 10.2% of the population were below the poverty line, including 14.3% of those under age 18 and 8.3% of those age 65 or over.
Common Questions
What is Per Capita Income in Union Bridge?
Per Capita income in Union Bridge is $32,231.
What is the Median Family Income in Union Bridge?
Median Family Income in Union Bridge is $66,136.
What is the Median Household income in Union Bridge?
Median Household Income in Union Bridge is $62,841.
What is Income or Wage Gap in Union Bridge?
Income or Wage Gap in Union Bridge is 40.8%.
Women in Union Bridge earn 59.2 cents for every dollar earned by a man.
What is Inequality or Gini Index in Union Bridge?
Inequality or Gini Index in Union Bridge is 0.34.
What is the Total Population of Union Bridge?
Total Population of Union Bridge is 939.
What is the Total Male Population of Union Bridge?
Total Male Population of Union Bridge is 526.
What is the Total Female Population of Union Bridge?
Total Female Population of Union Bridge is 413.
What is the Ratio of Males per 100 Females in Union Bridge?
There are 127.36 Males per 100 Females in Union Bridge.
What is the Ratio of Females per 100 Males in Union Bridge?
There are 78.52 Females per 100 Males in Union Bridge.
What is the Median Population Age in Union Bridge?
Median Population Age in Union Bridge is 36.5 Years.
What is the Average Family Size in Union Bridge
Average Family Size in Union Bridge is 3.1 People.
What is the Average Household Size in Union Bridge
Average Household Size in Union Bridge is 2.1 People.
How Large is the Labor Force in Union Bridge?
There are 531 People in the Labor Forcein in Union Bridge.
What is the Percentage of People in the Labor Force in Union Bridge?
69.7% of People are in the Labor Force in Union Bridge.
What is the Unemployment Rate in Union Bridge?
Unemployment Rate in Union Bridge is 0.9%.