Bel Air, MD Map & Demographics
Bel Air Map
Bel Air Overview
$42,103
PER CAPITA INCOME
$112,581
AVG FAMILY INCOME
$66,950
AVG HOUSEHOLD INCOME
50.8%
WAGE / INCOME GAP [ % ]
49.2¢/ $1
WAGE / INCOME GAP [ $ ]
0.44
INEQUALITY / GINI INDEX
10,630
TOTAL POPULATION
5,215
MALE POPULATION
5,415
FEMALE POPULATION
96.31
MALES / 100 FEMALES
103.84
FEMALES / 100 MALES
41.4
MEDIAN AGE
3.1
AVG FAMILY SIZE
2.1
AVG HOUSEHOLD SIZE
5,686
LABOR FORCE [ PEOPLE ]
63.0%
PERCENT IN LABOR FORCE
5.0%
UNEMPLOYMENT RATE
Income in Bel Air
Income Overview in Bel Air
Per Capita Income in Bel Air is $42,103, while median incomes of families and households are $112,581 and $66,950 respectively.
| Characteristic | Number | Measure |
| Per Capita Income | 10,630 | $42,103 |
| Median Family Income | 2,258 | $112,581 |
| Mean Family Income | 2,258 | $116,232 |
| Median Household Income | 4,897 | $66,950 |
| Mean Household Income | 4,897 | $90,335 |
| Income Deficit | 2,258 | $0 |
| Wage / Income Gap (%) | 10,630 | 50.82% |
| Wage / Income Gap ($) | 10,630 | 49.18¢ per $1 |
| Gini / Inequality Index | 10,630 | 0.44 |
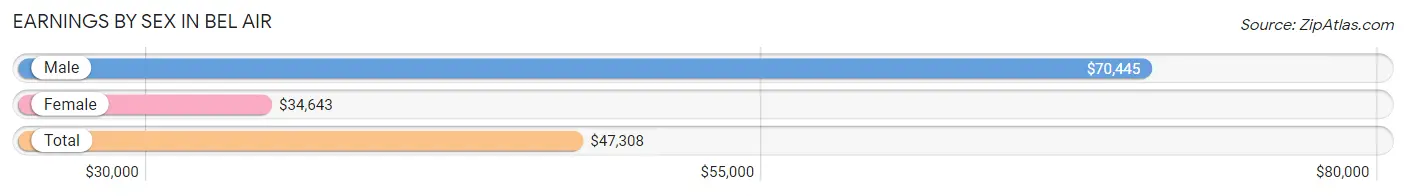
Earnings by Sex in Bel Air
Average Earnings in Bel Air are $47,308, $70,445 for men and $34,643 for women, a difference of 50.8%.
| Sex | Number | Average Earnings |
| Male | 2,918 (51.1%) | $70,445 |
| Female | 2,789 (48.9%) | $34,643 |
| Total | 5,707 (100.0%) | $47,308 |
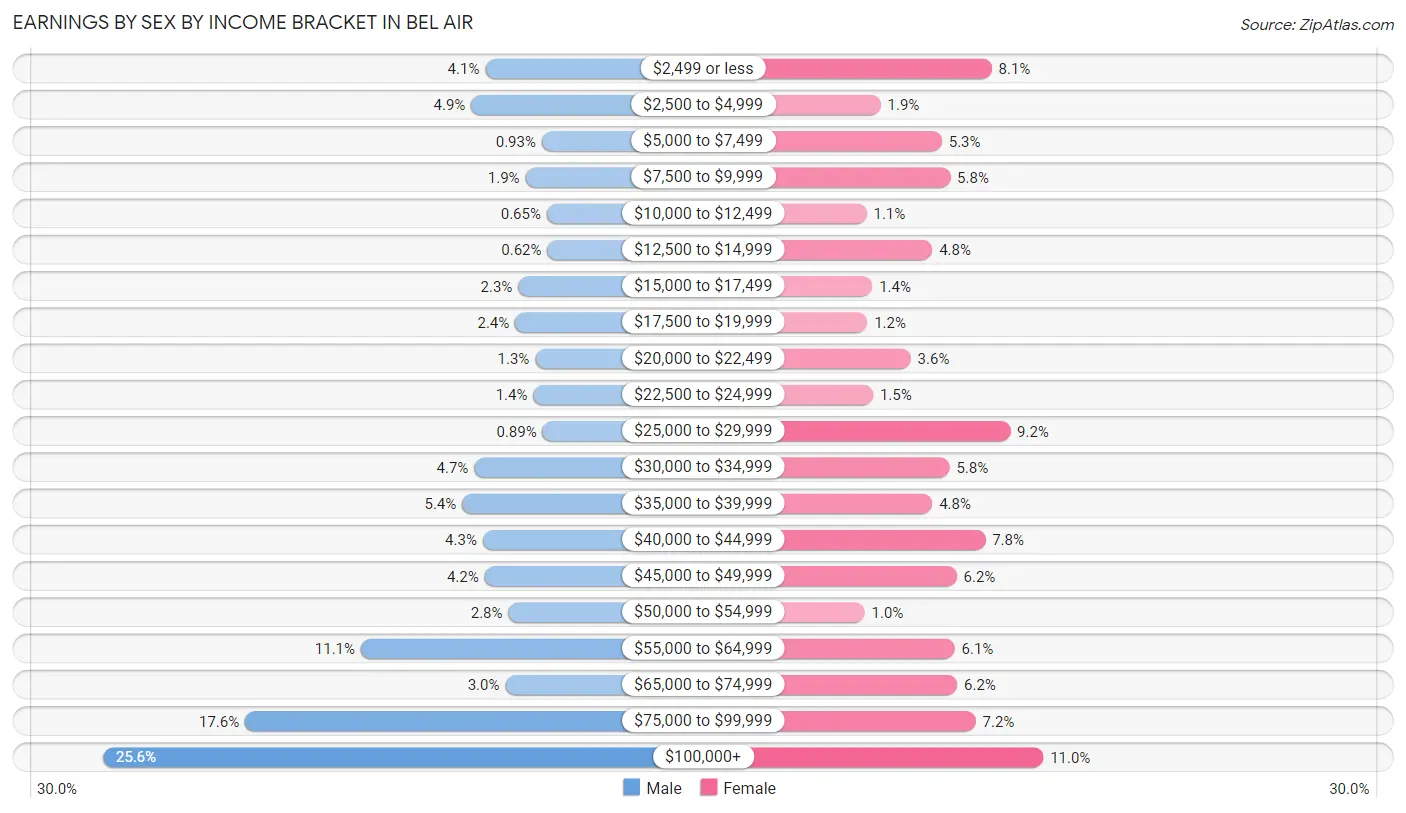
Earnings by Sex by Income Bracket in Bel Air
The most common earnings brackets in Bel Air are $100,000+ for men (747 | 25.6%) and $100,000+ for women (308 | 11.0%).
| Income | Male | Female |
| $2,499 or less | 120 (4.1%) | 227 (8.1%) |
| $2,500 to $4,999 | 143 (4.9%) | 53 (1.9%) |
| $5,000 to $7,499 | 27 (0.9%) | 149 (5.3%) |
| $7,500 to $9,999 | 54 (1.8%) | 162 (5.8%) |
| $10,000 to $12,499 | 19 (0.6%) | 31 (1.1%) |
| $12,500 to $14,999 | 18 (0.6%) | 134 (4.8%) |
| $15,000 to $17,499 | 66 (2.3%) | 40 (1.4%) |
| $17,500 to $19,999 | 71 (2.4%) | 32 (1.1%) |
| $20,000 to $22,499 | 38 (1.3%) | 100 (3.6%) |
| $22,500 to $24,999 | 41 (1.4%) | 41 (1.5%) |
| $25,000 to $29,999 | 26 (0.9%) | 256 (9.2%) |
| $30,000 to $34,999 | 138 (4.7%) | 161 (5.8%) |
| $35,000 to $39,999 | 158 (5.4%) | 134 (4.8%) |
| $40,000 to $44,999 | 124 (4.3%) | 217 (7.8%) |
| $45,000 to $49,999 | 121 (4.2%) | 172 (6.2%) |
| $50,000 to $54,999 | 82 (2.8%) | 28 (1.0%) |
| $55,000 to $64,999 | 324 (11.1%) | 169 (6.1%) |
| $65,000 to $74,999 | 87 (3.0%) | 173 (6.2%) |
| $75,000 to $99,999 | 514 (17.6%) | 202 (7.2%) |
| $100,000+ | 747 (25.6%) | 308 (11.0%) |
| Total | 2,918 (100.0%) | 2,789 (100.0%) |
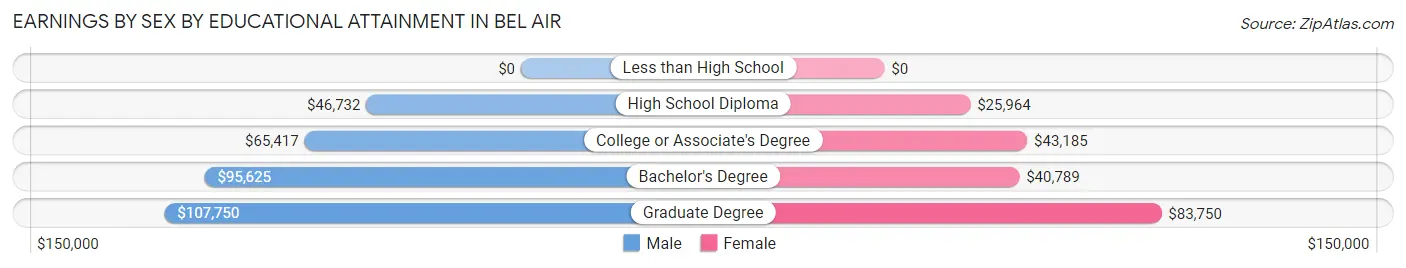
Earnings by Sex by Educational Attainment in Bel Air
Average earnings in Bel Air are $69,041 for men and $41,082 for women, a difference of 40.5%. Men with an educational attainment of graduate degree enjoy the highest average annual earnings of $107,750, while those with high school diploma education earn the least with $46,732. Women with an educational attainment of graduate degree earn the most with the average annual earnings of $83,750, while those with high school diploma education have the smallest earnings of $25,964.
| Educational Attainment | Male Income | Female Income |
| Less than High School | - | - |
| High School Diploma | $46,732 | $25,964 |
| College or Associate's Degree | $65,417 | $43,185 |
| Bachelor's Degree | $95,625 | $40,789 |
| Graduate Degree | $107,750 | $83,750 |
| Total | $69,041 | $41,082 |
Family Income in Bel Air
Family Income Brackets in Bel Air
According to the Bel Air family income data, there are 770 families falling into the $100,000 to $149,999 income range, which is the most common income bracket and makes up 34.1% of all families. Conversely, the $10,000 to $14,999 income bracket is the least frequent group with only 11 families (0.5%) belonging to this category.
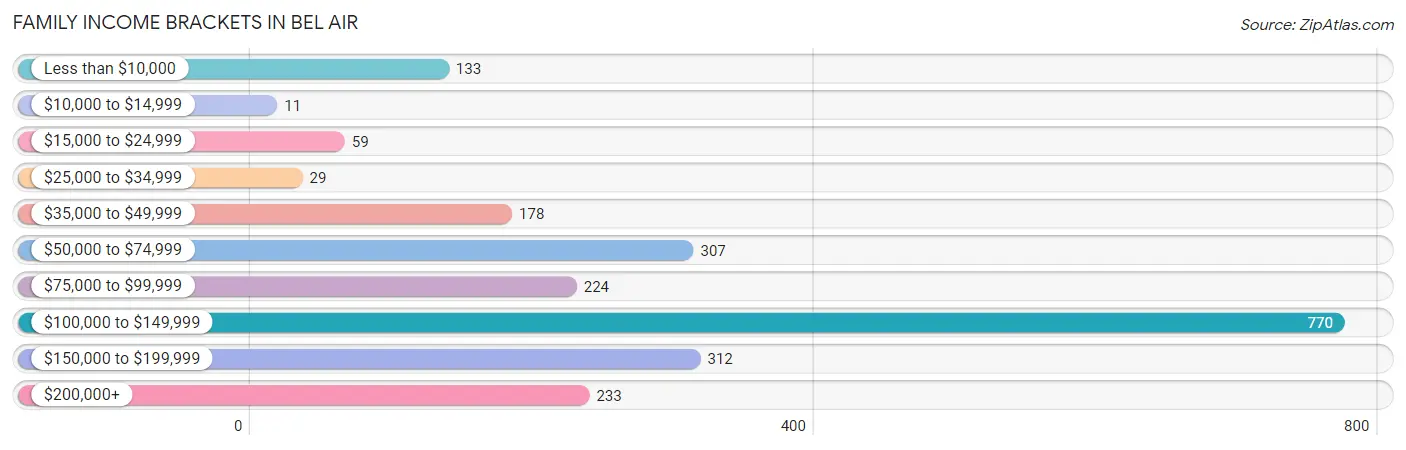
| Income Bracket | # Families | % Families |
| Less than $10,000 | 133 | 5.9% |
| $10,000 to $14,999 | 11 | 0.5% |
| $15,000 to $24,999 | 59 | 2.6% |
| $25,000 to $34,999 | 29 | 1.3% |
| $35,000 to $49,999 | 178 | 7.9% |
| $50,000 to $74,999 | 307 | 13.6% |
| $75,000 to $99,999 | 224 | 9.9% |
| $100,000 to $149,999 | 770 | 34.1% |
| $150,000 to $199,999 | 312 | 13.8% |
| $200,000+ | 233 | 10.3% |
Family Income by Famaliy Size in Bel Air
3-person families (513 | 22.7%) account for the highest median family income in Bel Air with $127,784 per family, while 2-person families (1,033 | 45.8%) have the highest median income of $49,866 per family member.
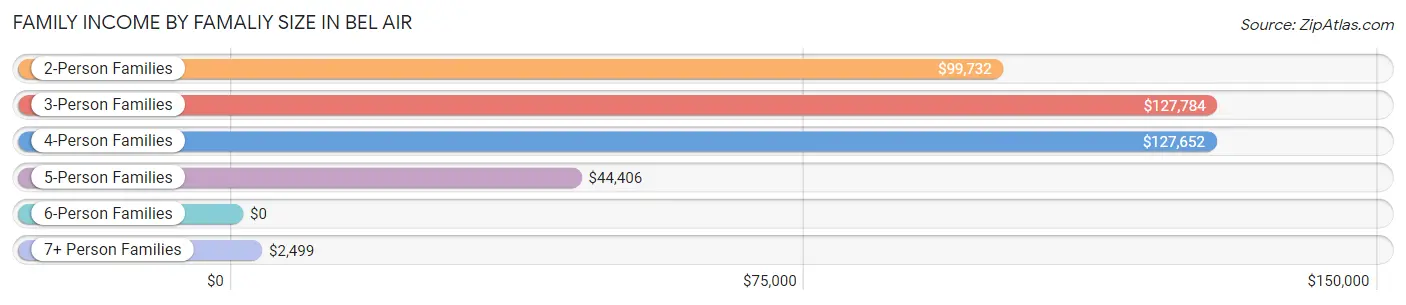
| Income Bracket | # Families | Median Income |
| 2-Person Families | 1,033 (45.8%) | $99,732 |
| 3-Person Families | 513 (22.7%) | $127,784 |
| 4-Person Families | 532 (23.6%) | $127,652 |
| 5-Person Families | 139 (6.2%) | $44,406 |
| 6-Person Families | 18 (0.8%) | $0 |
| 7+ Person Families | 23 (1.0%) | $2,499 |
| Total | 2,258 (100.0%) | $112,581 |
Family Income by Number of Earners in Bel Air
The median family income in Bel Air is $112,581, with families comprising 3+ earners (377) having the highest median family income of $160,250, while families with no earners (350) have the lowest median family income of $73,529, accounting for 16.7% and 15.5% of families, respectively.
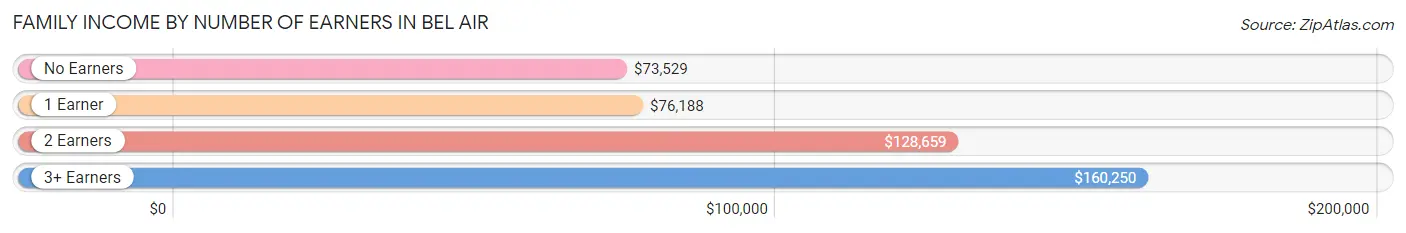
| Number of Earners | # Families | Median Income |
| No Earners | 350 (15.5%) | $73,529 |
| 1 Earner | 726 (32.2%) | $76,188 |
| 2 Earners | 805 (35.6%) | $128,659 |
| 3+ Earners | 377 (16.7%) | $160,250 |
| Total | 2,258 (100.0%) | $112,581 |
Household Income in Bel Air
Household Income Brackets in Bel Air
With 1,019 households falling in the category, the $100,000 to $149,999 income range is the most frequent in Bel Air, accounting for 20.8% of all households. In contrast, only 152 households (3.1%) fall into the $10,000 to $14,999 income bracket, making it the least populous group.
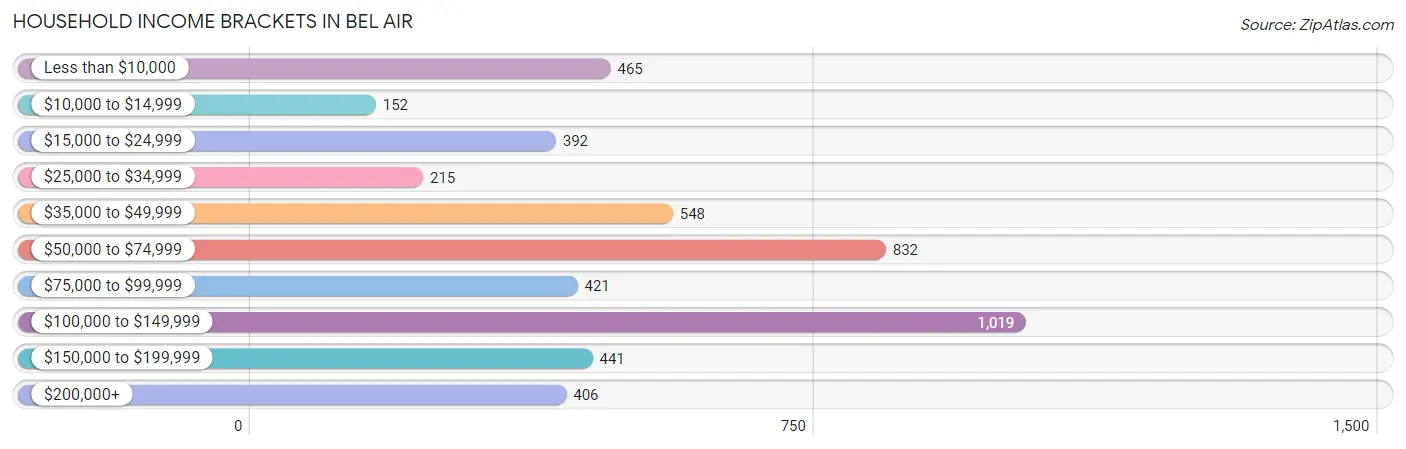
| Income Bracket | # Households | % Households |
| Less than $10,000 | 465 | 9.5% |
| $10,000 to $14,999 | 152 | 3.1% |
| $15,000 to $24,999 | 392 | 8.0% |
| $25,000 to $34,999 | 215 | 4.4% |
| $35,000 to $49,999 | 548 | 11.2% |
| $50,000 to $74,999 | 832 | 17.0% |
| $75,000 to $99,999 | 421 | 8.6% |
| $100,000 to $149,999 | 1,019 | 20.8% |
| $150,000 to $199,999 | 441 | 9.0% |
| $200,000+ | 406 | 8.3% |
Household Income by Householder Age in Bel Air
The median household income in Bel Air is $66,950, with the highest median household income of $105,154 found in the 45 to 64 years age bracket for the primary householder. A total of 1,609 households (32.9%) fall into this category. Meanwhile, the 15 to 24 years age bracket for the primary householder has the lowest median household income of $34,422, with 125 households (2.5%) in this group.
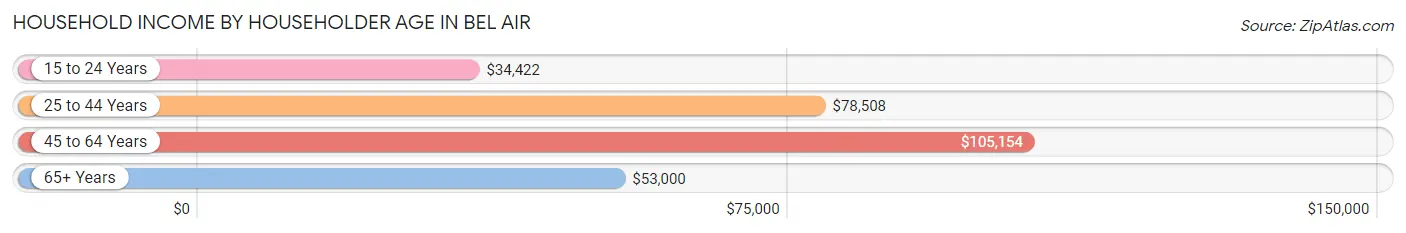
| Income Bracket | # Households | Median Income |
| 15 to 24 Years | 125 (2.5%) | $34,422 |
| 25 to 44 Years | 1,691 (34.5%) | $78,508 |
| 45 to 64 Years | 1,609 (32.9%) | $105,154 |
| 65+ Years | 1,472 (30.1%) | $53,000 |
| Total | 4,897 (100.0%) | $66,950 |
Poverty in Bel Air
Income Below Poverty by Sex and Age in Bel Air
With 17.7% poverty level for males and 18.0% for females among the residents of Bel Air, 16 and 17 year old males and 65 to 74 year old females are the most vulnerable to poverty, with 80 males (38.8%) and 212 females (31.0%) in their respective age groups living below the poverty level.
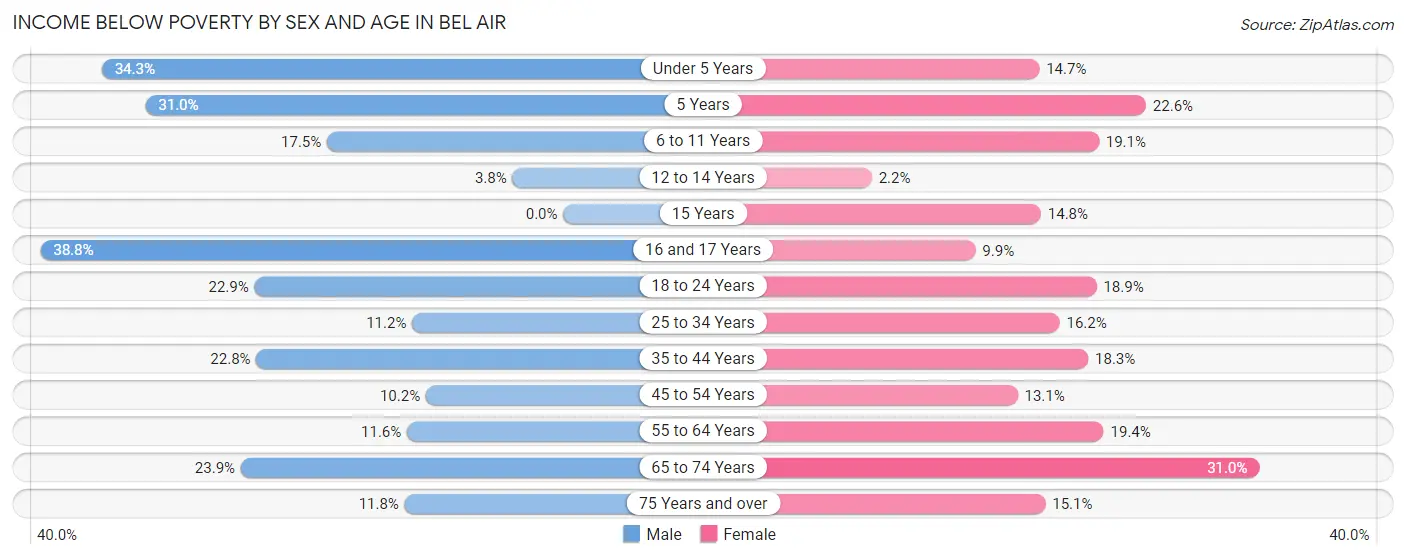
| Age Bracket | Male | Female |
| Under 5 Years | 73 (34.3%) | 28 (14.7%) |
| 5 Years | 18 (31.0%) | 14 (22.6%) |
| 6 to 11 Years | 40 (17.5%) | 54 (19.1%) |
| 12 to 14 Years | 4 (3.8%) | 5 (2.2%) |
| 15 Years | 0 (0.0%) | 17 (14.8%) |
| 16 and 17 Years | 80 (38.8%) | 13 (9.9%) |
| 18 to 24 Years | 105 (22.9%) | 97 (18.9%) |
| 25 to 34 Years | 89 (11.2%) | 87 (16.2%) |
| 35 to 44 Years | 206 (22.8%) | 139 (18.3%) |
| 45 to 54 Years | 47 (10.2%) | 74 (13.1%) |
| 55 to 64 Years | 81 (11.6%) | 132 (19.4%) |
| 65 to 74 Years | 130 (23.9%) | 212 (31.0%) |
| 75 Years and over | 47 (11.8%) | 89 (15.1%) |
| Total | 920 (17.7%) | 961 (18.0%) |
Income Above Poverty by Sex and Age in Bel Air
According to the poverty statistics in Bel Air, males aged 15 years and females aged 12 to 14 years are the age groups that are most secure financially, with 100.0% of males and 97.8% of females in these age groups living above the poverty line.
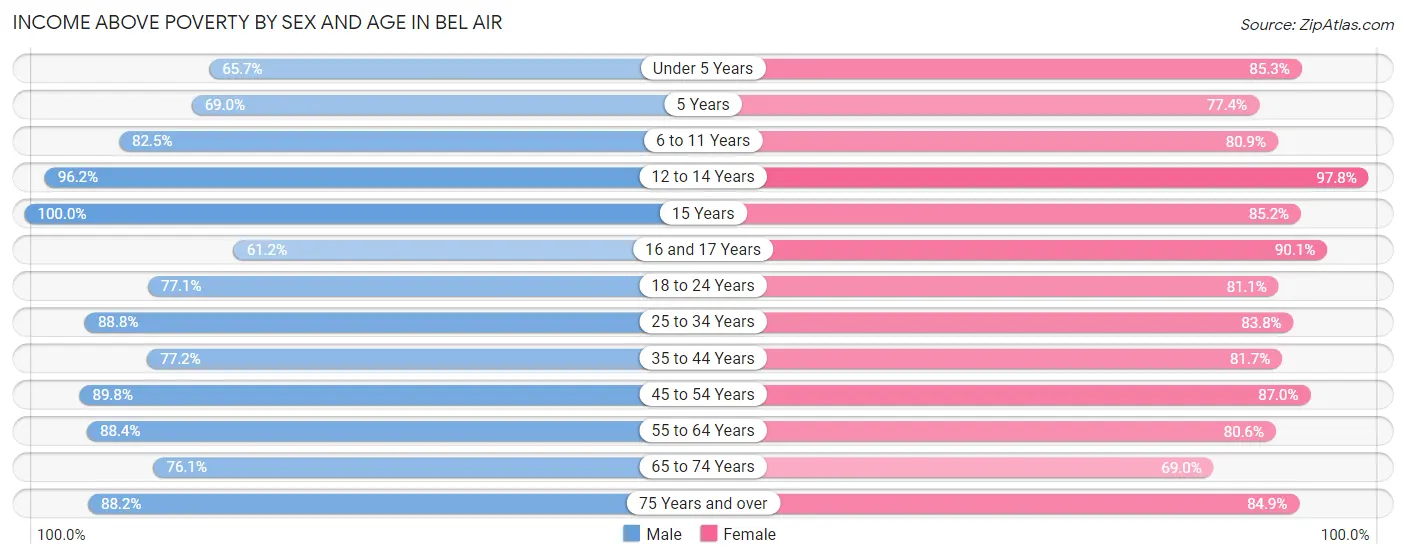
| Age Bracket | Male | Female |
| Under 5 Years | 140 (65.7%) | 163 (85.3%) |
| 5 Years | 40 (69.0%) | 48 (77.4%) |
| 6 to 11 Years | 188 (82.5%) | 229 (80.9%) |
| 12 to 14 Years | 102 (96.2%) | 220 (97.8%) |
| 15 Years | 124 (100.0%) | 98 (85.2%) |
| 16 and 17 Years | 126 (61.2%) | 118 (90.1%) |
| 18 to 24 Years | 353 (77.1%) | 416 (81.1%) |
| 25 to 34 Years | 704 (88.8%) | 451 (83.8%) |
| 35 to 44 Years | 698 (77.2%) | 621 (81.7%) |
| 45 to 54 Years | 414 (89.8%) | 493 (87.0%) |
| 55 to 64 Years | 617 (88.4%) | 547 (80.6%) |
| 65 to 74 Years | 413 (76.1%) | 472 (69.0%) |
| 75 Years and over | 352 (88.2%) | 500 (84.9%) |
| Total | 4,271 (82.3%) | 4,376 (82.0%) |
Income Below Poverty Among Married-Couple Families in Bel Air
The poverty statistics for married-couple families in Bel Air show that 9.0% or 157 of the total 1,753 families live below the poverty line. Families with 3 or 4 children have the highest poverty rate of 32.4%, comprising of 23 families. On the other hand, families with 5 or more children have the lowest poverty rate of 0.0%, which includes 0 families.
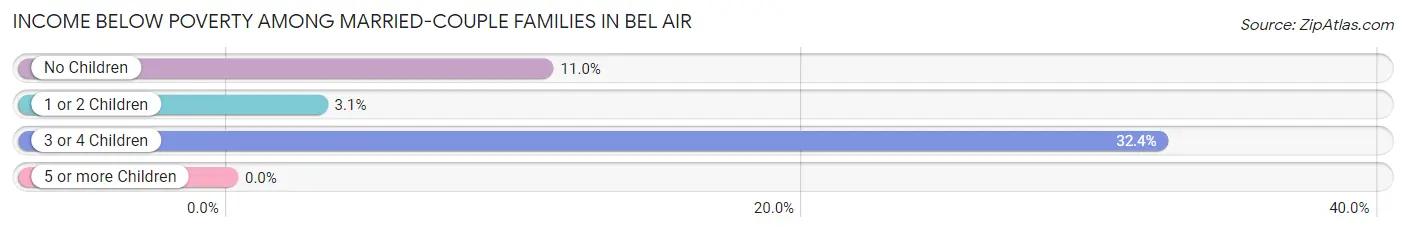
| Children | Above Poverty | Below Poverty |
| No Children | 923 (89.0%) | 114 (11.0%) |
| 1 or 2 Children | 622 (96.9%) | 20 (3.1%) |
| 3 or 4 Children | 48 (67.6%) | 23 (32.4%) |
| 5 or more Children | 3 (100.0%) | 0 (0.0%) |
| Total | 1,596 (91.0%) | 157 (9.0%) |
Income Below Poverty Among Single-Parent Households in Bel Air
According to the poverty data in Bel Air, 2.7% or 5 single-father households and 17.7% or 56 single-mother households are living below the poverty line. Among single-father households, those with 1 or 2 children have the highest poverty rate, with 5 households (6.7%) experiencing poverty. Likewise, among single-mother households, those with 5 or more children have the highest poverty rate, with 12 households (100.0%) falling below the poverty line.
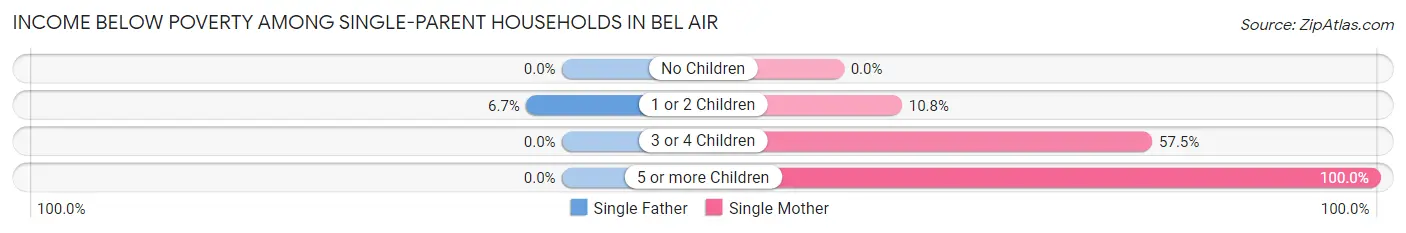
| Children | Single Father | Single Mother |
| No Children | 0 (0.0%) | 0 (0.0%) |
| 1 or 2 Children | 5 (6.7%) | 17 (10.8%) |
| 3 or 4 Children | 0 (0.0%) | 27 (57.5%) |
| 5 or more Children | 0 (0.0%) | 12 (100.0%) |
| Total | 5 (2.7%) | 56 (17.7%) |
Income Below Poverty Among Married-Couple vs Single-Parent Households in Bel Air
The poverty data for Bel Air shows that 157 of the married-couple family households (9.0%) and 61 of the single-parent households (12.1%) are living below the poverty level. Within the married-couple family households, those with 3 or 4 children have the highest poverty rate, with 23 households (32.4%) falling below the poverty line. Among the single-parent households, those with 5 or more children have the highest poverty rate, with 12 household (100.0%) living below poverty.
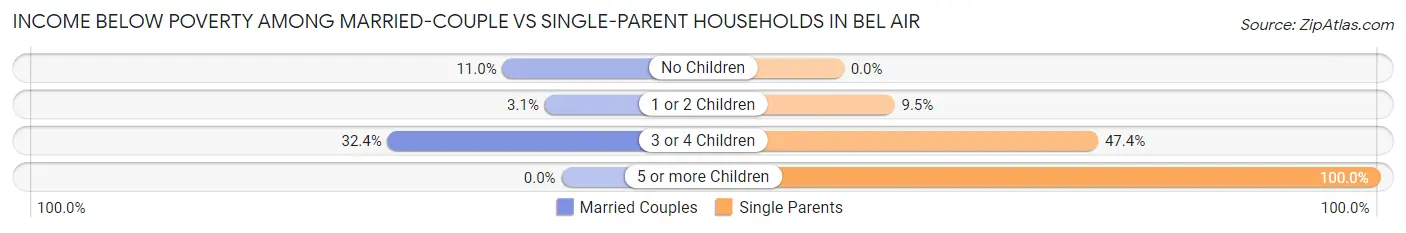
| Children | Married-Couple Families | Single-Parent Households |
| No Children | 114 (11.0%) | 0 (0.0%) |
| 1 or 2 Children | 20 (3.1%) | 22 (9.5%) |
| 3 or 4 Children | 23 (32.4%) | 27 (47.4%) |
| 5 or more Children | 0 (0.0%) | 12 (100.0%) |
| Total | 157 (9.0%) | 61 (12.1%) |
Race in Bel Air
The most populous races in Bel Air are White / Caucasian (8,628 | 81.2%), Hispanic or Latino (918 | 8.6%), and Some other Race (505 | 4.8%).
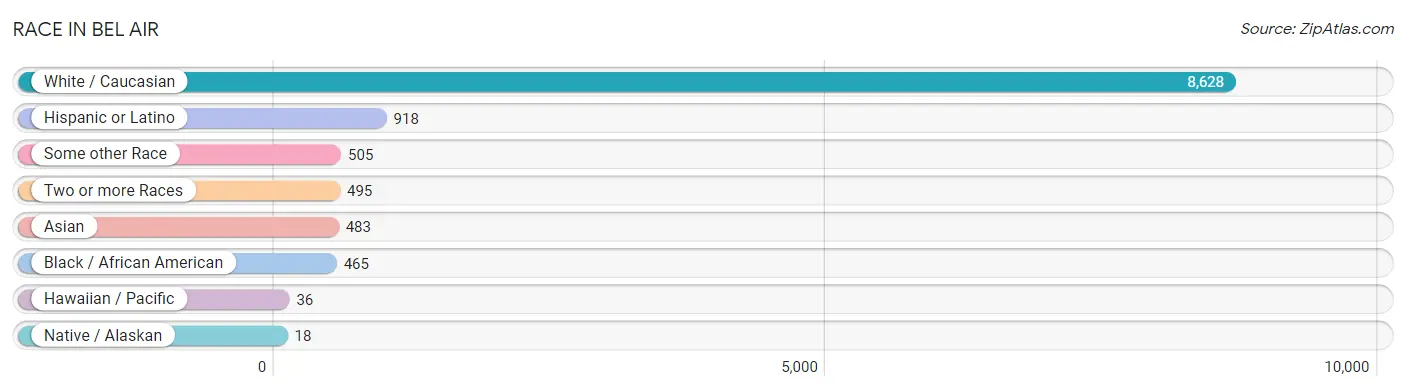
| Race | # Population | % Population |
| Asian | 483 | 4.5% |
| Black / African American | 465 | 4.4% |
| Hawaiian / Pacific | 36 | 0.3% |
| Hispanic or Latino | 918 | 8.6% |
| Native / Alaskan | 18 | 0.2% |
| White / Caucasian | 8,628 | 81.2% |
| Two or more Races | 495 | 4.7% |
| Some other Race | 505 | 4.8% |
| Total | 10,630 | 100.0% |
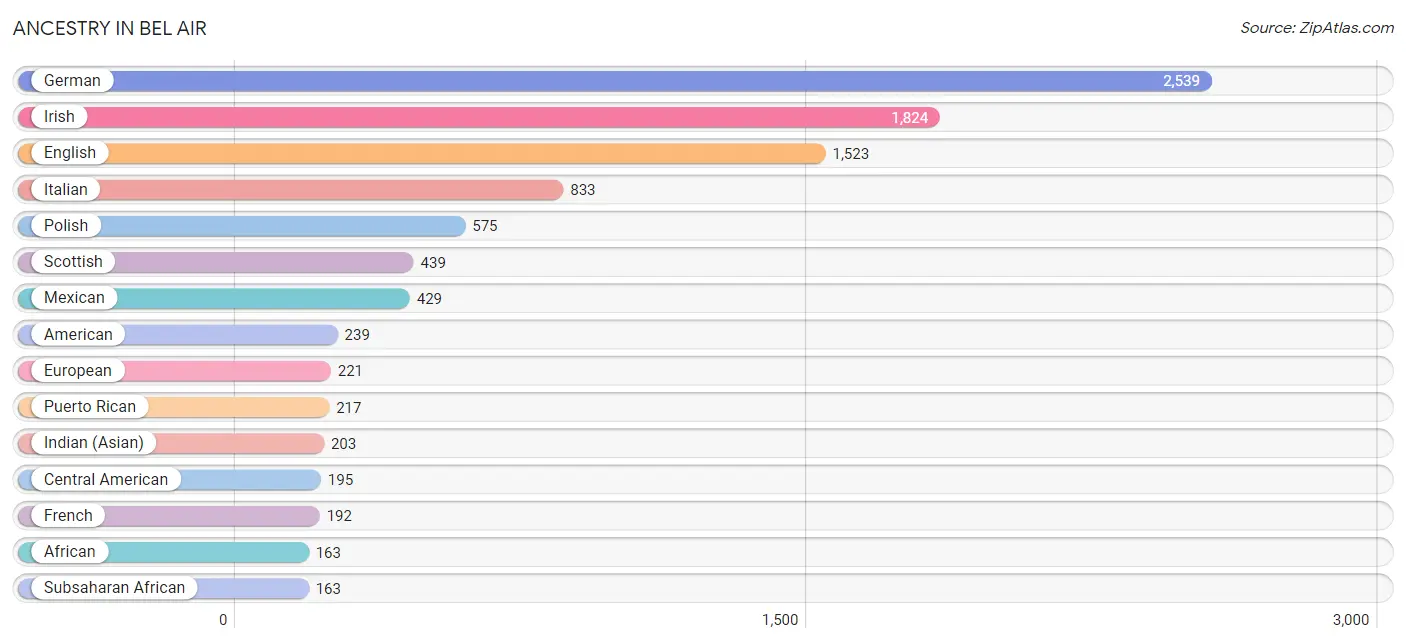
Ancestry in Bel Air
The most populous ancestries reported in Bel Air are German (2,539 | 23.9%), Irish (1,824 | 17.2%), English (1,523 | 14.3%), Italian (833 | 7.8%), and Polish (575 | 5.4%), together accounting for 68.6% of all Bel Air residents.
| Ancestry | # Population | % Population |
| African | 163 | 1.5% |
| American | 239 | 2.2% |
| Arab | 45 | 0.4% |
| Austrian | 13 | 0.1% |
| Belgian | 10 | 0.1% |
| British | 89 | 0.8% |
| Burmese | 48 | 0.4% |
| Central American | 195 | 1.8% |
| Central American Indian | 6 | 0.1% |
| Cherokee | 7 | 0.1% |
| Chippewa | 12 | 0.1% |
| Comanche | 8 | 0.1% |
| Croatian | 16 | 0.2% |
| Danish | 11 | 0.1% |
| Dutch | 142 | 1.3% |
| Ecuadorian | 53 | 0.5% |
| Egyptian | 5 | 0.1% |
| English | 1,523 | 14.3% |
| European | 221 | 2.1% |
| Finnish | 32 | 0.3% |
| French | 192 | 1.8% |
| French Canadian | 12 | 0.1% |
| German | 2,539 | 23.9% |
| Greek | 151 | 1.4% |
| Guatemalan | 21 | 0.2% |
| Indian (Asian) | 203 | 1.9% |
| Iranian | 40 | 0.4% |
| Irish | 1,824 | 17.2% |
| Iroquois | 7 | 0.1% |
| Italian | 833 | 7.8% |
| Laotian | 147 | 1.4% |
| Lebanese | 19 | 0.2% |
| Lithuanian | 30 | 0.3% |
| Maltese | 8 | 0.1% |
| Mexican | 429 | 4.0% |
| Native Hawaiian | 104 | 1.0% |
| Norwegian | 153 | 1.4% |
| Pakistani | 28 | 0.3% |
| Panamanian | 21 | 0.2% |
| Pennsylvania German | 5 | 0.1% |
| Polish | 575 | 5.4% |
| Puerto Rican | 217 | 2.0% |
| Russian | 46 | 0.4% |
| Salvadoran | 153 | 1.4% |
| Samoan | 104 | 1.0% |
| Scandinavian | 6 | 0.1% |
| Scotch-Irish | 107 | 1.0% |
| Scottish | 439 | 4.1% |
| Slavic | 12 | 0.1% |
| Slovak | 4 | 0.0% |
| Slovene | 9 | 0.1% |
| South American | 53 | 0.5% |
| Spaniard | 24 | 0.2% |
| Sri Lankan | 70 | 0.7% |
| Subsaharan African | 163 | 1.5% |
| Swedish | 30 | 0.3% |
| Swiss | 77 | 0.7% |
| Thai | 24 | 0.2% |
| Ukrainian | 110 | 1.0% |
| Welsh | 49 | 0.5% | View All 60 Rows |
Immigrants in Bel Air
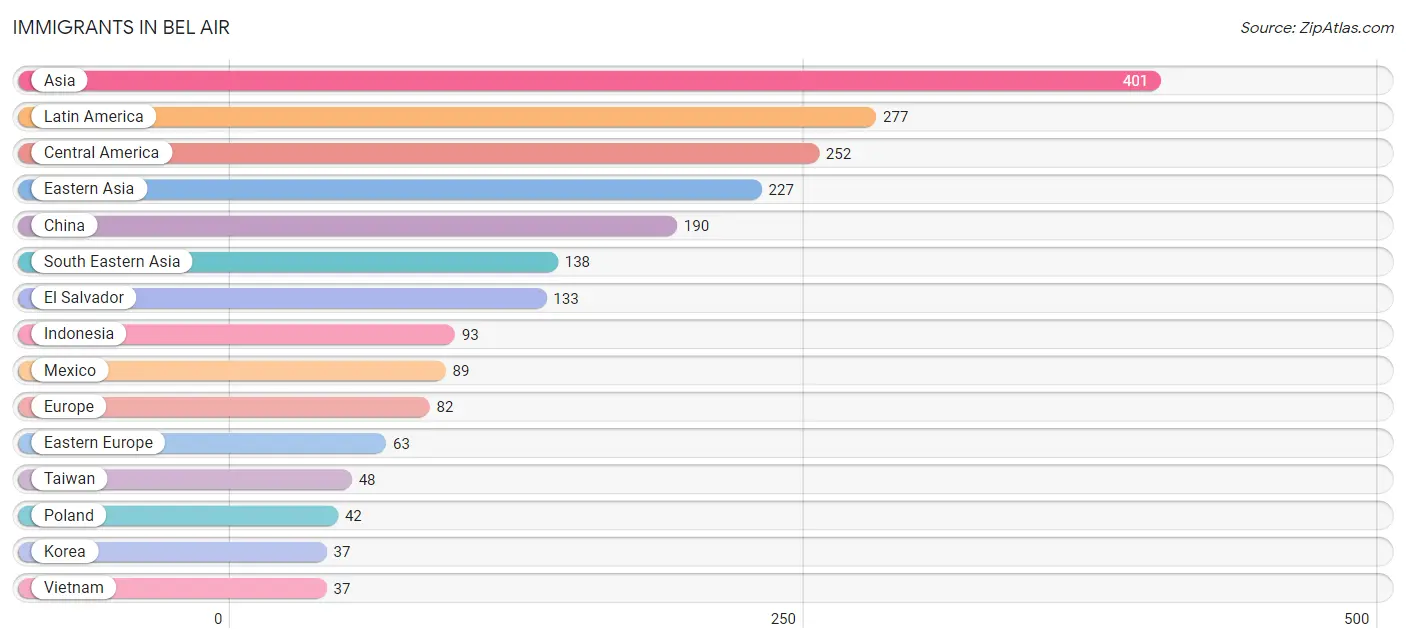
The most numerous immigrant groups reported in Bel Air came from Asia (401 | 3.8%), Latin America (277 | 2.6%), Central America (252 | 2.4%), Eastern Asia (227 | 2.1%), and China (190 | 1.8%), together accounting for 12.7% of all Bel Air residents.
| Immigration Origin | # Population | % Population |
| Asia | 401 | 3.8% |
| Central America | 252 | 2.4% |
| Chile | 8 | 0.1% |
| China | 190 | 1.8% |
| Eastern Asia | 227 | 2.1% |
| Eastern Europe | 63 | 0.6% |
| Ecuador | 17 | 0.2% |
| El Salvador | 133 | 1.3% |
| Europe | 82 | 0.8% |
| Guatemala | 9 | 0.1% |
| India | 15 | 0.1% |
| Indonesia | 93 | 0.9% |
| Korea | 37 | 0.4% |
| Latin America | 277 | 2.6% |
| Mexico | 89 | 0.8% |
| Northern Europe | 8 | 0.1% |
| Panama | 21 | 0.2% |
| Poland | 42 | 0.4% |
| Saudi Arabia | 21 | 0.2% |
| South America | 25 | 0.2% |
| South Central Asia | 15 | 0.1% |
| South Eastern Asia | 138 | 1.3% |
| Southern Europe | 11 | 0.1% |
| Spain | 11 | 0.1% |
| Taiwan | 48 | 0.4% |
| Thailand | 8 | 0.1% |
| Ukraine | 21 | 0.2% |
| Vietnam | 37 | 0.4% |
| Western Asia | 21 | 0.2% | View All 29 Rows |
Sex and Age in Bel Air
Sex and Age in Bel Air
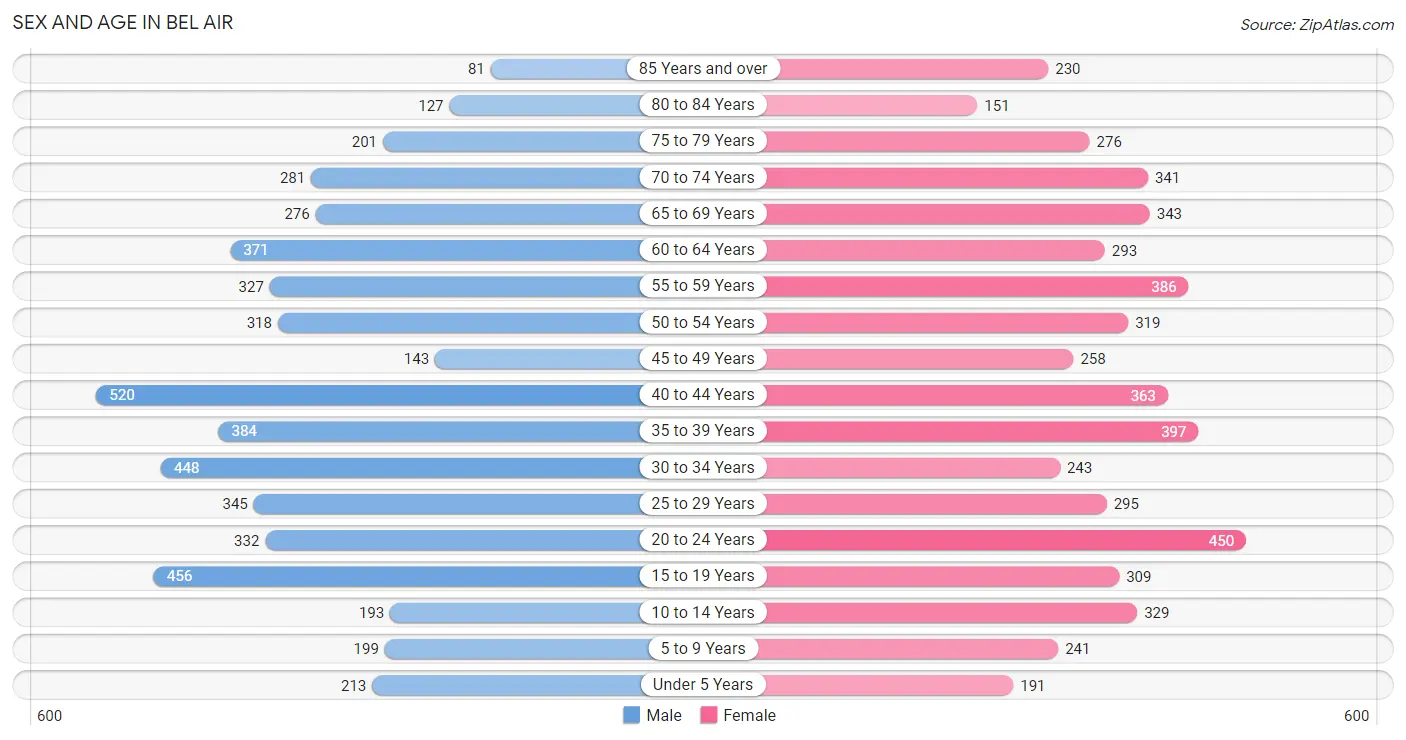
The most populous age groups in Bel Air are 40 to 44 Years (520 | 10.0%) for men and 20 to 24 Years (450 | 8.3%) for women.
| Age Bracket | Male | Female |
| Under 5 Years | 213 (4.1%) | 191 (3.5%) |
| 5 to 9 Years | 199 (3.8%) | 241 (4.4%) |
| 10 to 14 Years | 193 (3.7%) | 329 (6.1%) |
| 15 to 19 Years | 456 (8.7%) | 309 (5.7%) |
| 20 to 24 Years | 332 (6.4%) | 450 (8.3%) |
| 25 to 29 Years | 345 (6.6%) | 295 (5.4%) |
| 30 to 34 Years | 448 (8.6%) | 243 (4.5%) |
| 35 to 39 Years | 384 (7.4%) | 397 (7.3%) |
| 40 to 44 Years | 520 (10.0%) | 363 (6.7%) |
| 45 to 49 Years | 143 (2.7%) | 258 (4.8%) |
| 50 to 54 Years | 318 (6.1%) | 319 (5.9%) |
| 55 to 59 Years | 327 (6.3%) | 386 (7.1%) |
| 60 to 64 Years | 371 (7.1%) | 293 (5.4%) |
| 65 to 69 Years | 276 (5.3%) | 343 (6.3%) |
| 70 to 74 Years | 281 (5.4%) | 341 (6.3%) |
| 75 to 79 Years | 201 (3.8%) | 276 (5.1%) |
| 80 to 84 Years | 127 (2.4%) | 151 (2.8%) |
| 85 Years and over | 81 (1.5%) | 230 (4.3%) |
| Total | 5,215 (100.0%) | 5,415 (100.0%) |
Families and Households in Bel Air
Median Family Size in Bel Air
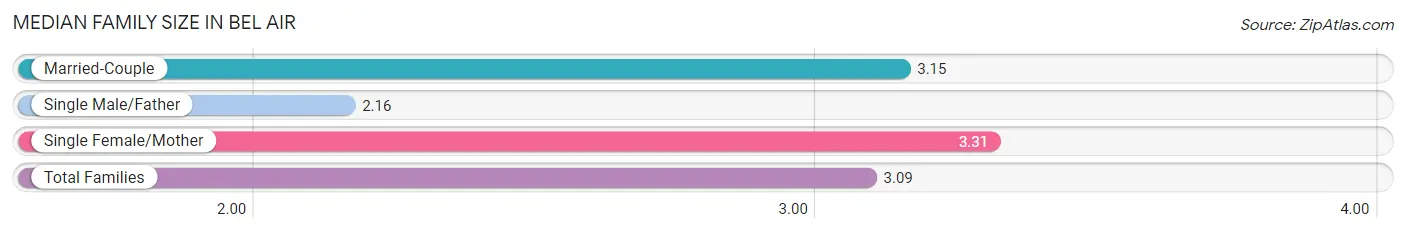
The median family size in Bel Air is 3.09 persons per family, with single female/mother families (317 | 14.0%) accounting for the largest median family size of 3.31 persons per family. On the other hand, single male/father families (188 | 8.3%) represent the smallest median family size with 2.16 persons per family.
| Family Type | # Families | Family Size |
| Married-Couple | 1,753 (77.6%) | 3.15 |
| Single Male/Father | 188 (8.3%) | 2.16 |
| Single Female/Mother | 317 (14.0%) | 3.31 |
| Total Families | 2,258 (100.0%) | 3.09 |
Median Household Size in Bel Air
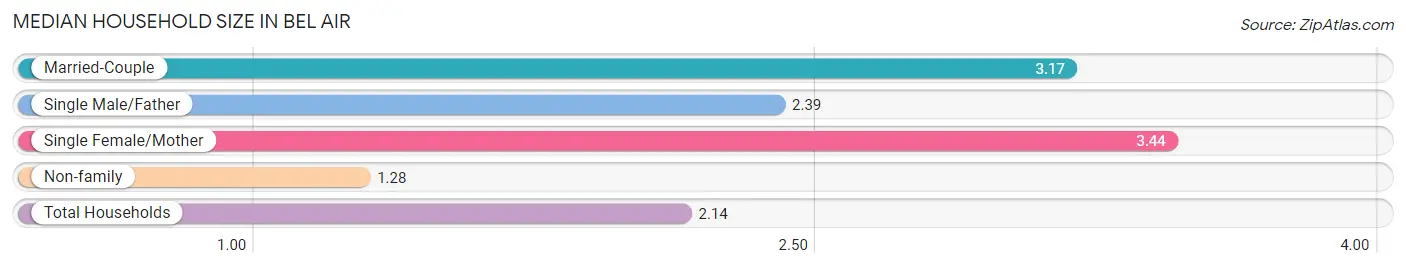
The median household size in Bel Air is 2.14 persons per household, with single female/mother households (317 | 6.5%) accounting for the largest median household size of 3.44 persons per household. non-family households (2,639 | 53.9%) represent the smallest median household size with 1.28 persons per household.
| Household Type | # Households | Household Size |
| Married-Couple | 1,753 (35.8%) | 3.17 |
| Single Male/Father | 188 (3.8%) | 2.39 |
| Single Female/Mother | 317 (6.5%) | 3.44 |
| Non-family | 2,639 (53.9%) | 1.28 |
| Total Households | 4,897 (100.0%) | 2.14 |
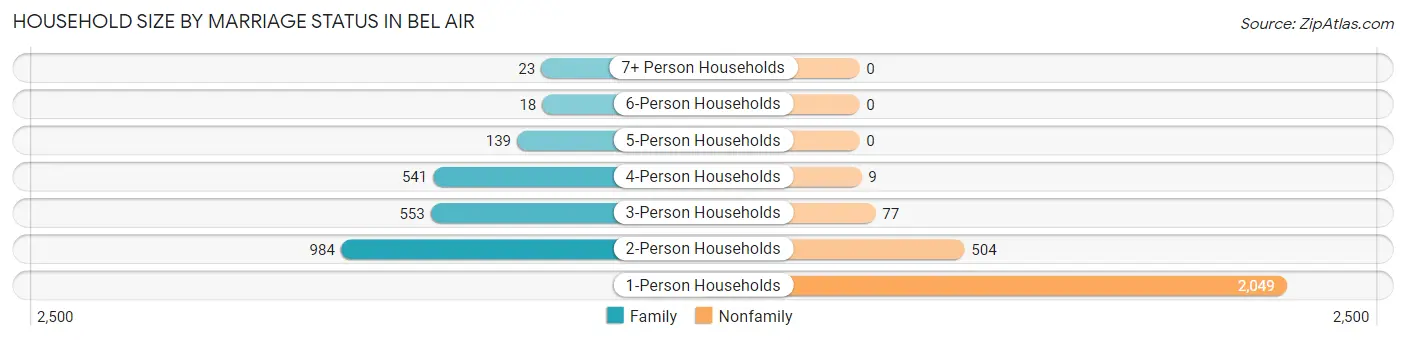
Household Size by Marriage Status in Bel Air
Out of a total of 4,897 households in Bel Air, 2,258 (46.1%) are family households, while 2,639 (53.9%) are nonfamily households. The most numerous type of family households are 2-person households, comprising 984, and the most common type of nonfamily households are 1-person households, comprising 2,049.
| Household Size | Family Households | Nonfamily Households |
| 1-Person Households | - | 2,049 (41.8%) |
| 2-Person Households | 984 (20.1%) | 504 (10.3%) |
| 3-Person Households | 553 (11.3%) | 77 (1.6%) |
| 4-Person Households | 541 (11.1%) | 9 (0.2%) |
| 5-Person Households | 139 (2.8%) | 0 (0.0%) |
| 6-Person Households | 18 (0.4%) | 0 (0.0%) |
| 7+ Person Households | 23 (0.5%) | 0 (0.0%) |
| Total | 2,258 (46.1%) | 2,639 (53.9%) |
Female Fertility in Bel Air
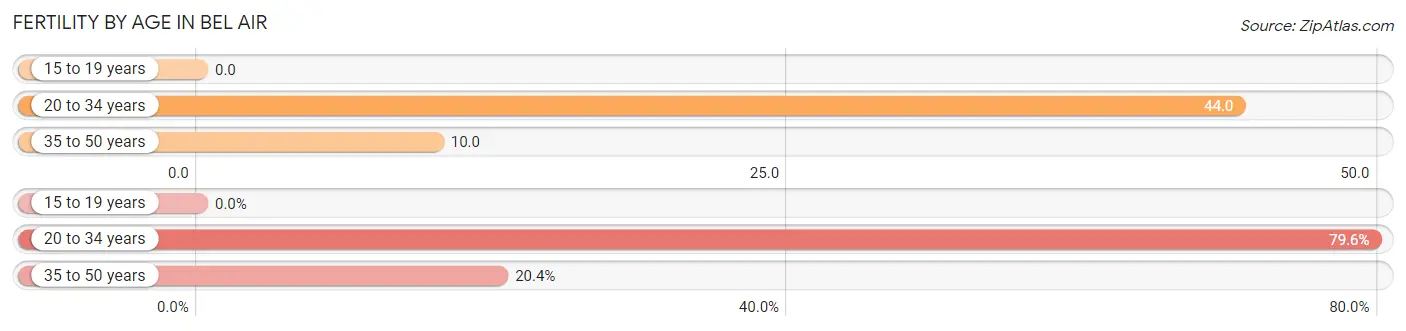
Fertility by Age in Bel Air
Average fertility rate in Bel Air is 23.0 births per 1,000 women. Women in the age bracket of 20 to 34 years have the highest fertility rate with 44.0 births per 1,000 women. Women in the age bracket of 20 to 34 years acount for 79.6% of all women with births.
| Age Bracket | Women with Births | Births / 1,000 Women |
| 15 to 19 years | 0 (0.0%) | 0.0 |
| 20 to 34 years | 43 (79.6%) | 44.0 |
| 35 to 50 years | 11 (20.4%) | 10.0 |
| Total | 54 (100.0%) | 23.0 |
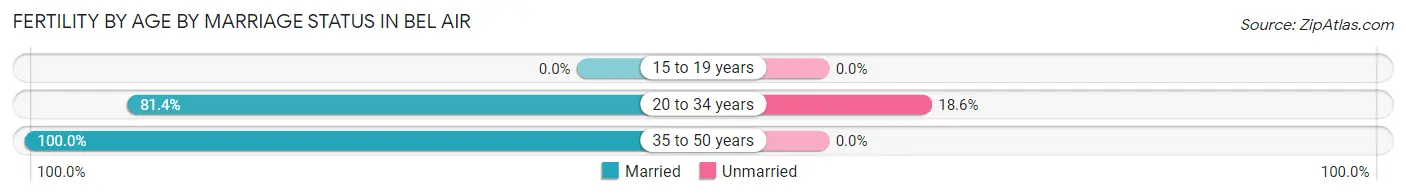
Fertility by Age by Marriage Status in Bel Air
85.2% of women with births (54) in Bel Air are married. The highest percentage of unmarried women with births falls into 20 to 34 years age bracket with 18.6% of them unmarried at the time of birth, while the lowest percentage of unmarried women with births belong to 35 to 50 years age bracket with 0.0% of them unmarried.
| Age Bracket | Married | Unmarried |
| 15 to 19 years | 0 (0.0%) | 0 (0.0%) |
| 20 to 34 years | 35 (81.4%) | 8 (18.6%) |
| 35 to 50 years | 11 (100.0%) | 0 (0.0%) |
| Total | 46 (85.2%) | 8 (14.8%) |
Fertility by Education in Bel Air
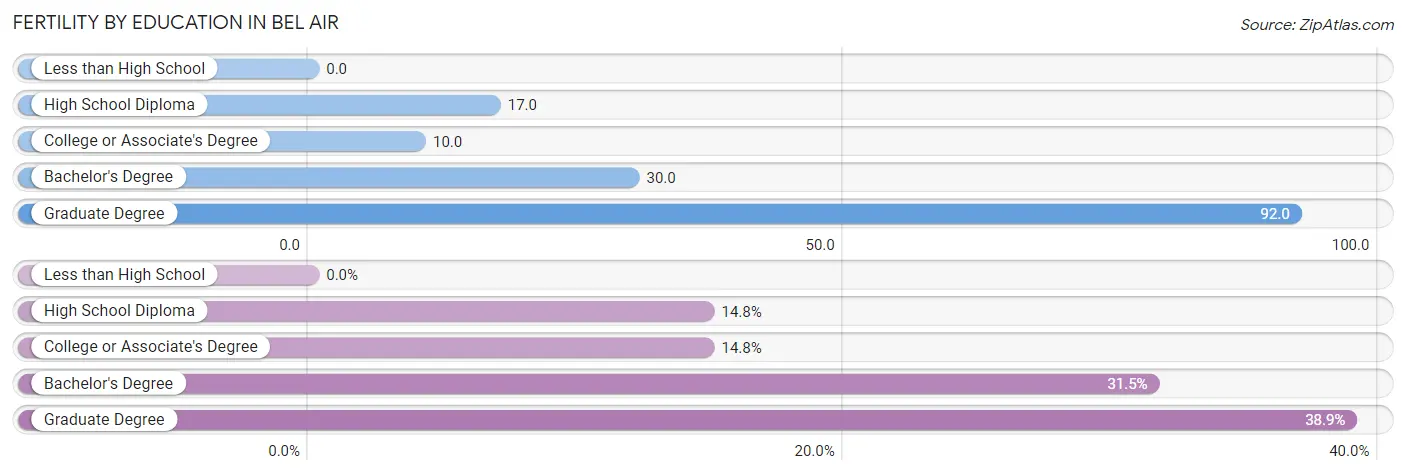
| Educational Attainment | Women with Births | Births / 1,000 Women |
| Less than High School | 0 (0.0%) | 0.0 |
| High School Diploma | 8 (14.8%) | 17.0 |
| College or Associate's Degree | 8 (14.8%) | 10.0 |
| Bachelor's Degree | 17 (31.5%) | 30.0 |
| Graduate Degree | 21 (38.9%) | 92.0 |
| Total | 54 (100.0%) | 23.0 |
Fertility by Education by Marriage Status in Bel Air
14.8% of women with births in Bel Air are unmarried. Women with the educational attainment of high school diploma are most likely to be married with 100.0% of them married at childbirth, while women with the educational attainment of college or associate's degree are least likely to be married with 100.0% of them unmarried at childbirth.
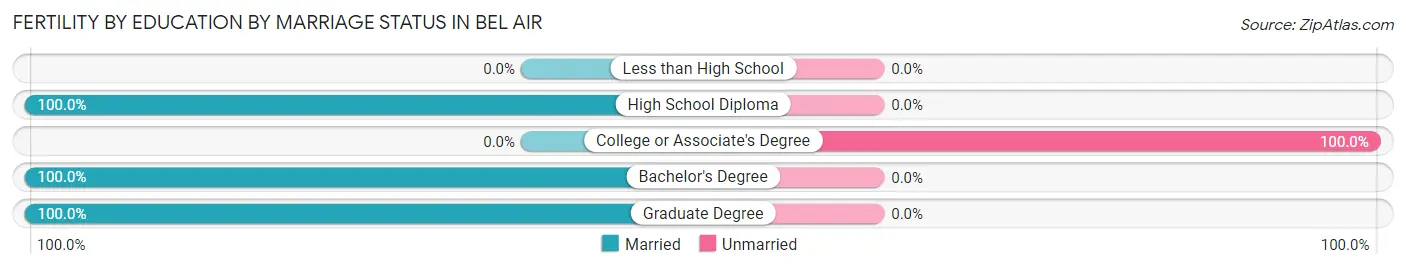
| Educational Attainment | Married | Unmarried |
| Less than High School | 0 (0.0%) | 0 (0.0%) |
| High School Diploma | 8 (100.0%) | 0 (0.0%) |
| College or Associate's Degree | 0 (0.0%) | 8 (100.0%) |
| Bachelor's Degree | 17 (100.0%) | 0 (0.0%) |
| Graduate Degree | 21 (100.0%) | 0 (0.0%) |
| Total | 46 (85.2%) | 8 (14.8%) |
Employment Characteristics in Bel Air
Employment by Class of Employer in Bel Air
Among the 5,307 employed individuals in Bel Air, private company employees (3,498 | 65.9%), not-for-profit organizations (572 | 10.8%), and federal government employees (408 | 7.7%) make up the most common classes of employment.
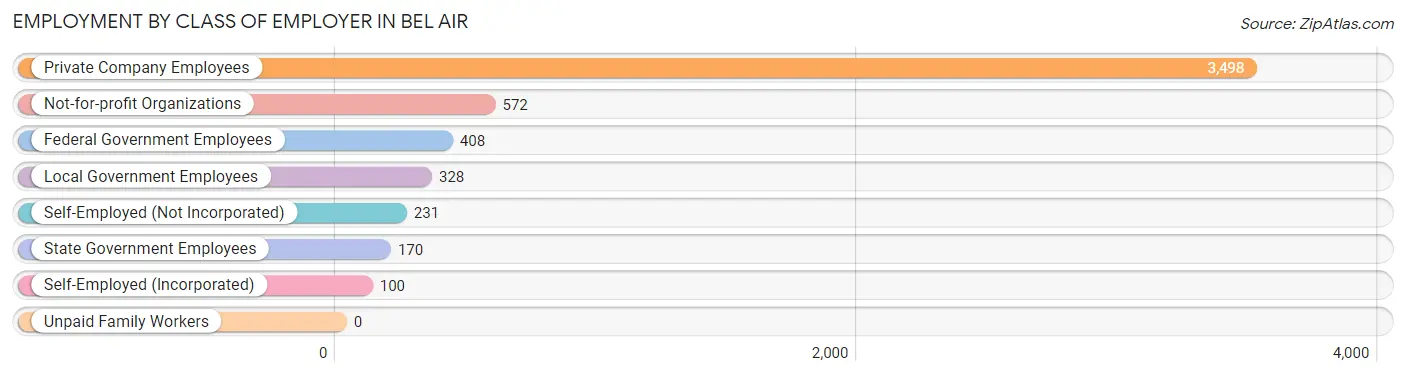
| Employer Class | # Employees | % Employees |
| Private Company Employees | 3,498 | 65.9% |
| Self-Employed (Incorporated) | 100 | 1.9% |
| Self-Employed (Not Incorporated) | 231 | 4.3% |
| Not-for-profit Organizations | 572 | 10.8% |
| Local Government Employees | 328 | 6.2% |
| State Government Employees | 170 | 3.2% |
| Federal Government Employees | 408 | 7.7% |
| Unpaid Family Workers | 0 | 0.0% |
| Total | 5,307 | 100.0% |
Employment Status by Age in Bel Air
According to the labor force statistics for Bel Air, out of the total population over 16 years of age (9,025), 63.0% or 5,686 individuals are in the labor force, with 5.0% or 284 of them unemployed. The age group with the highest labor force participation rate is 25 to 29 years, with 93.6% or 599 individuals in the labor force. Within the labor force, the 20 to 24 years age range has the highest percentage of unemployed individuals, with 31.9% or 196 of them being unemployed.
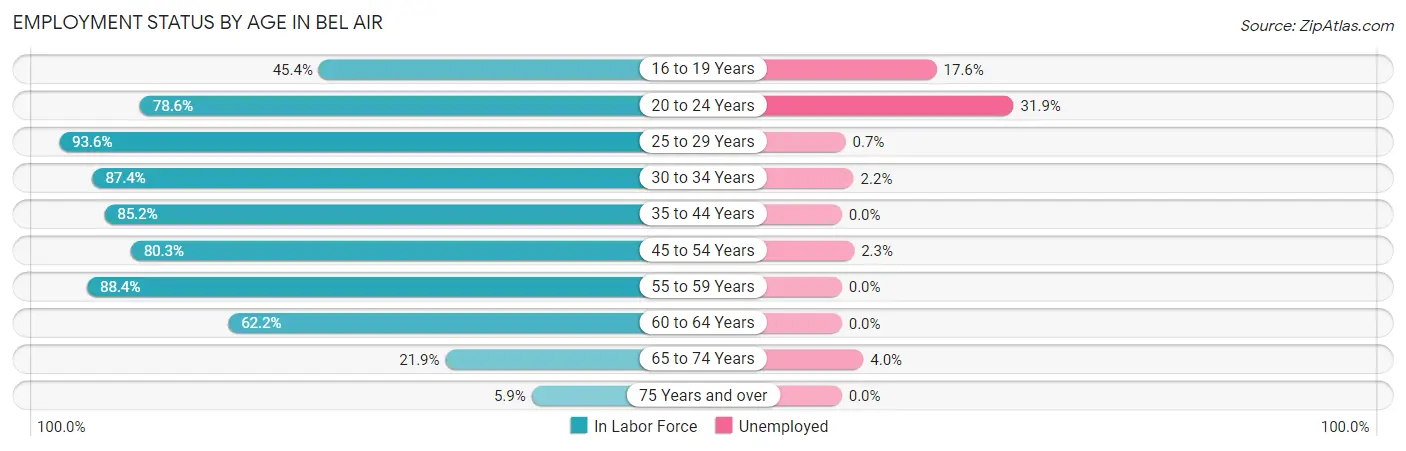
| Age Bracket | In Labor Force | Unemployed |
| 16 to 19 Years | 239 (45.4%) | 42 (17.6%) |
| 20 to 24 Years | 615 (78.6%) | 196 (31.9%) |
| 25 to 29 Years | 599 (93.6%) | 4 (0.7%) |
| 30 to 34 Years | 604 (87.4%) | 13 (2.2%) |
| 35 to 44 Years | 1,418 (85.2%) | 0 (0.0%) |
| 45 to 54 Years | 834 (80.3%) | 19 (2.3%) |
| 55 to 59 Years | 630 (88.4%) | 0 (0.0%) |
| 60 to 64 Years | 413 (62.2%) | 0 (0.0%) |
| 65 to 74 Years | 272 (21.9%) | 11 (4.0%) |
| 75 Years and over | 63 (5.9%) | 0 (0.0%) |
| Total | 5,686 (63.0%) | 284 (5.0%) |
Employment Status by Educational Attainment in Bel Air
According to labor force statistics for Bel Air, 83.1% of individuals (4,496) out of the total population between 25 and 64 years of age (5,410) are in the labor force, with 0.8% or 36 of them being unemployed. The group with the highest labor force participation rate are those with the educational attainment of bachelor's degree or higher, with 94.2% or 1,973 individuals in the labor force. Within the labor force, individuals with bachelor's degree or higher education have the highest percentage of unemployment, with 1.3% or 26 of them being unemployed.
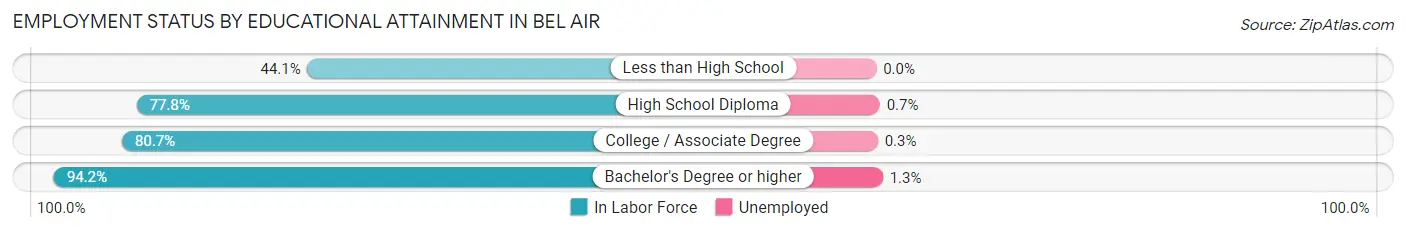
| Educational Attainment | In Labor Force | Unemployed |
| Less than High School | 135 (44.1%) | 0 (0.0%) |
| High School Diploma | 1,072 (77.8%) | 10 (0.7%) |
| College / Associate Degree | 1,316 (80.7%) | 5 (0.3%) |
| Bachelor's Degree or higher | 1,973 (94.2%) | 27 (1.3%) |
| Total | 4,496 (83.1%) | 43 (0.8%) |
Employment Occupations by Sex in Bel Air
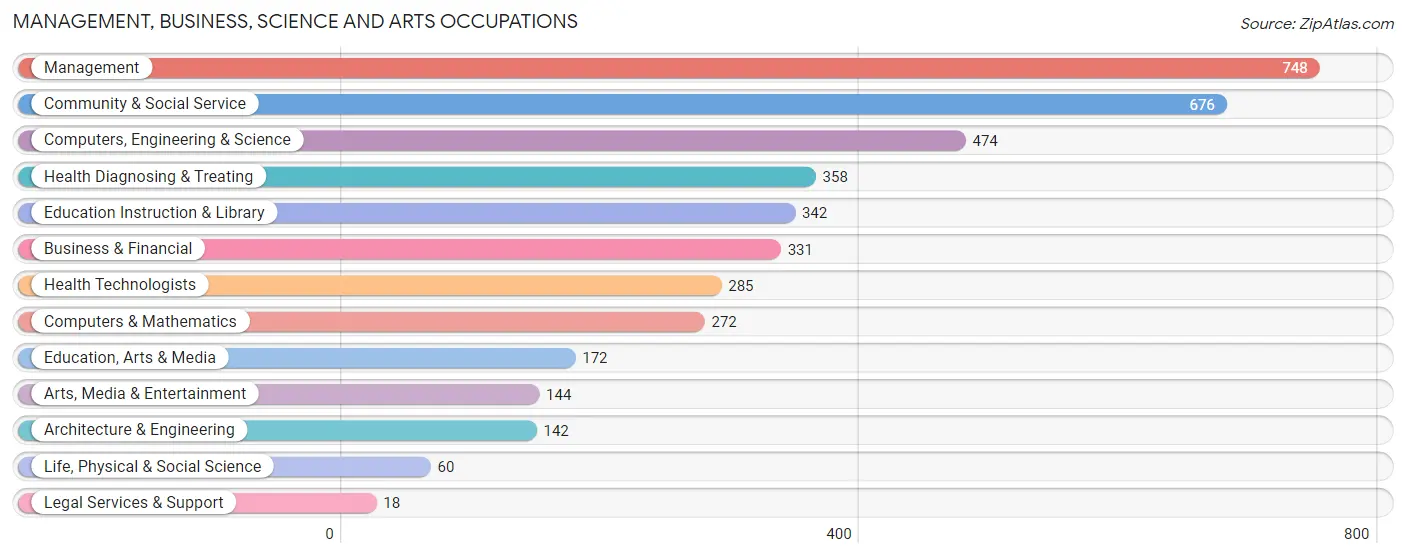
Management, Business, Science and Arts Occupations
The most common Management, Business, Science and Arts occupations in Bel Air are Management (748 | 13.9%), Community & Social Service (676 | 12.5%), Computers, Engineering & Science (474 | 8.8%), Health Diagnosing & Treating (358 | 6.6%), and Education Instruction & Library (342 | 6.3%).
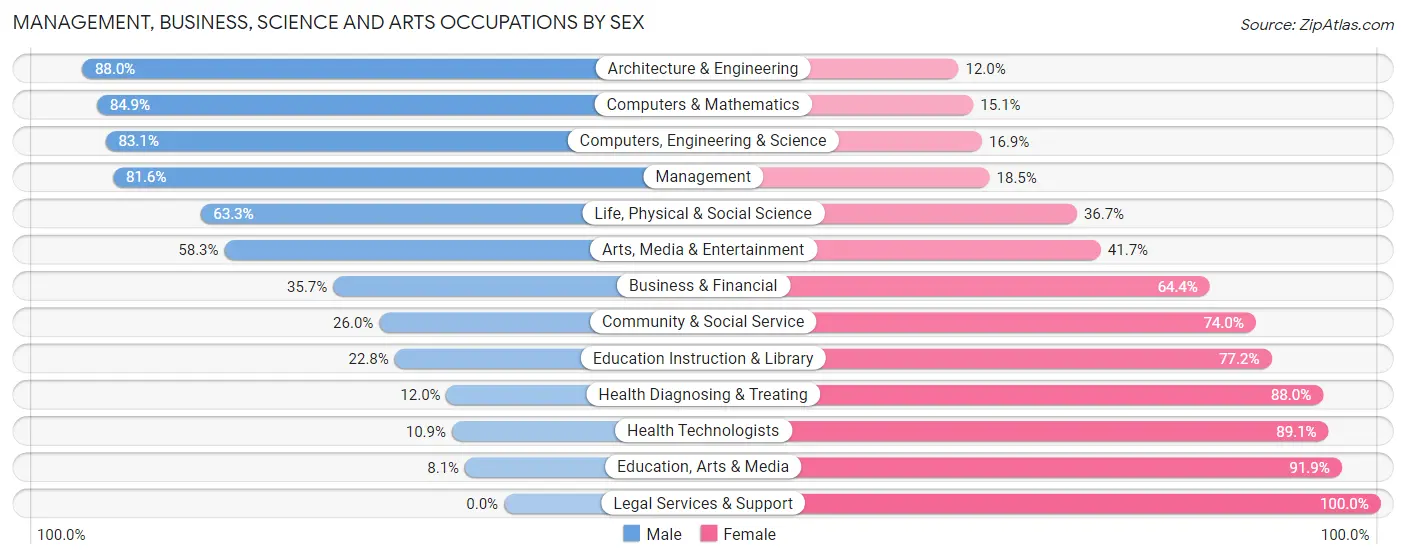
Management, Business, Science and Arts Occupations by Sex
Within the Management, Business, Science and Arts occupations in Bel Air, the most male-oriented occupations are Architecture & Engineering (88.0%), Computers & Mathematics (84.9%), and Computers, Engineering & Science (83.1%), while the most female-oriented occupations are Legal Services & Support (100.0%), Education, Arts & Media (91.9%), and Health Technologists (89.1%).
| Occupation | Male | Female |
| Management | 610 (81.6%) | 138 (18.4%) |
| Business & Financial | 118 (35.6%) | 213 (64.3%) |
| Computers, Engineering & Science | 394 (83.1%) | 80 (16.9%) |
| Computers & Mathematics | 231 (84.9%) | 41 (15.1%) |
| Architecture & Engineering | 125 (88.0%) | 17 (12.0%) |
| Life, Physical & Social Science | 38 (63.3%) | 22 (36.7%) |
| Community & Social Service | 176 (26.0%) | 500 (74.0%) |
| Education, Arts & Media | 14 (8.1%) | 158 (91.9%) |
| Legal Services & Support | 0 (0.0%) | 18 (100.0%) |
| Education Instruction & Library | 78 (22.8%) | 264 (77.2%) |
| Arts, Media & Entertainment | 84 (58.3%) | 60 (41.7%) |
| Health Diagnosing & Treating | 43 (12.0%) | 315 (88.0%) |
| Health Technologists | 31 (10.9%) | 254 (89.1%) |
| Total (Category) | 1,341 (51.8%) | 1,246 (48.2%) |
| Total (Overall) | 2,837 (52.5%) | 2,563 (47.5%) |
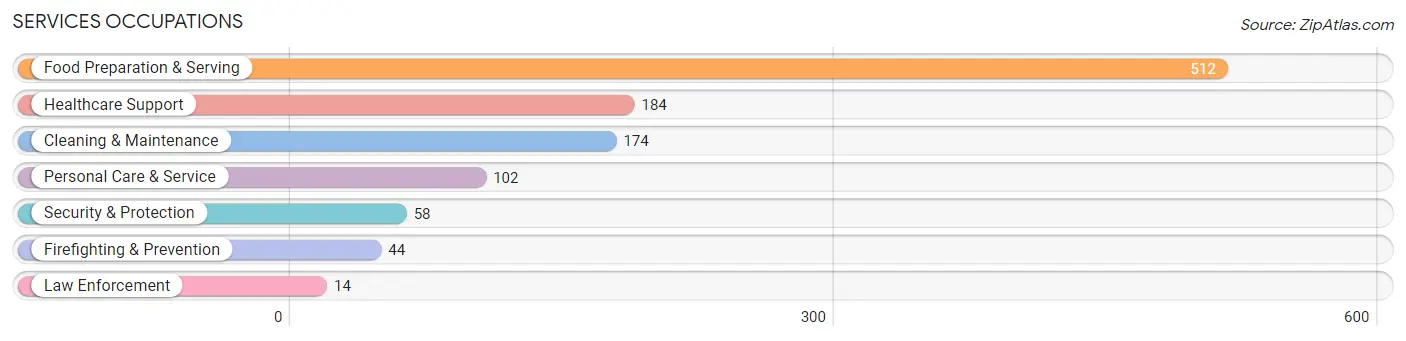
Services Occupations
The most common Services occupations in Bel Air are Food Preparation & Serving (512 | 9.5%), Healthcare Support (184 | 3.4%), Cleaning & Maintenance (174 | 3.2%), Personal Care & Service (102 | 1.9%), and Security & Protection (58 | 1.1%).
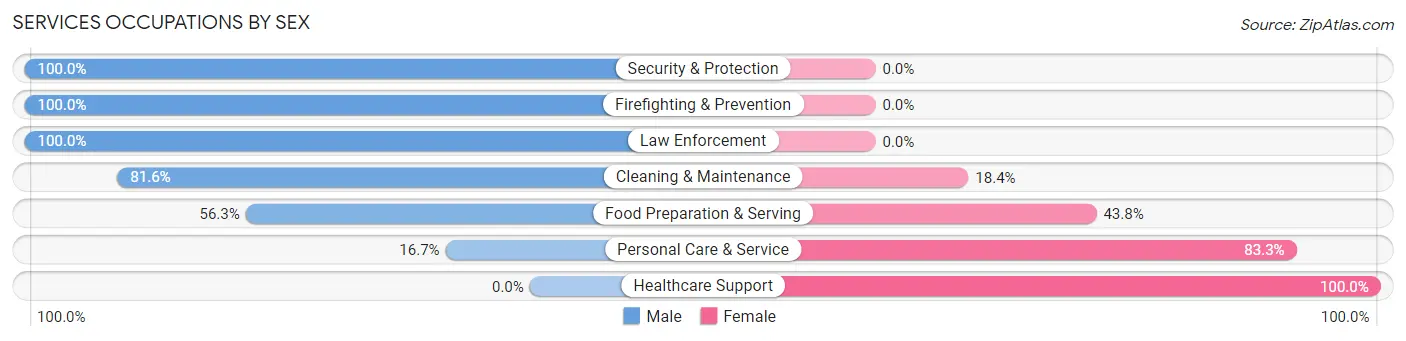
Services Occupations by Sex
Within the Services occupations in Bel Air, the most male-oriented occupations are Security & Protection (100.0%), Firefighting & Prevention (100.0%), and Law Enforcement (100.0%), while the most female-oriented occupations are Healthcare Support (100.0%), Personal Care & Service (83.3%), and Food Preparation & Serving (43.8%).
| Occupation | Male | Female |
| Healthcare Support | 0 (0.0%) | 184 (100.0%) |
| Security & Protection | 58 (100.0%) | 0 (0.0%) |
| Firefighting & Prevention | 44 (100.0%) | 0 (0.0%) |
| Law Enforcement | 14 (100.0%) | 0 (0.0%) |
| Food Preparation & Serving | 288 (56.2%) | 224 (43.8%) |
| Cleaning & Maintenance | 142 (81.6%) | 32 (18.4%) |
| Personal Care & Service | 17 (16.7%) | 85 (83.3%) |
| Total (Category) | 505 (49.0%) | 525 (51.0%) |
| Total (Overall) | 2,837 (52.5%) | 2,563 (47.5%) |
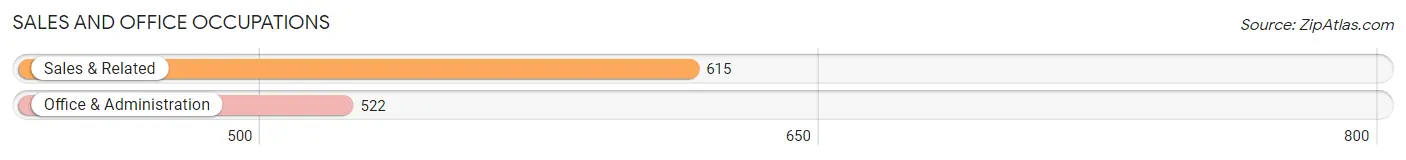
Sales and Office Occupations
The most common Sales and Office occupations in Bel Air are Sales & Related (615 | 11.4%), and Office & Administration (522 | 9.7%).
Sales and Office Occupations by Sex
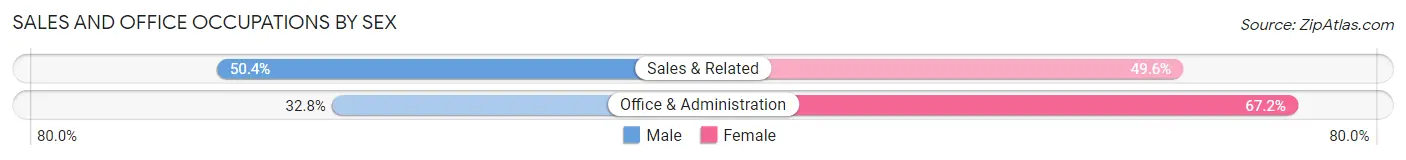
| Occupation | Male | Female |
| Sales & Related | 310 (50.4%) | 305 (49.6%) |
| Office & Administration | 171 (32.8%) | 351 (67.2%) |
| Total (Category) | 481 (42.3%) | 656 (57.7%) |
| Total (Overall) | 2,837 (52.5%) | 2,563 (47.5%) |
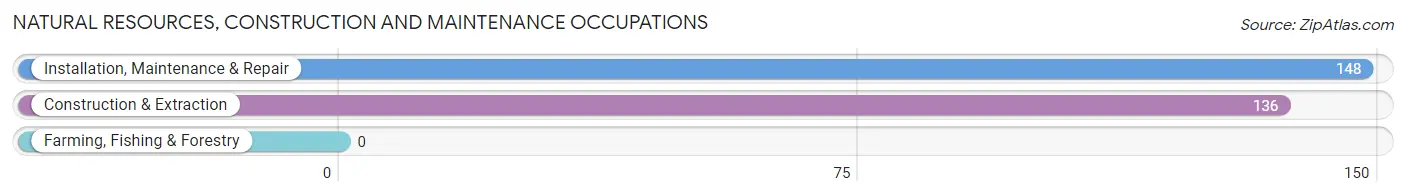
Natural Resources, Construction and Maintenance Occupations
The most common Natural Resources, Construction and Maintenance occupations in Bel Air are Installation, Maintenance & Repair (148 | 2.7%), and Construction & Extraction (136 | 2.5%).
Natural Resources, Construction and Maintenance Occupations by Sex
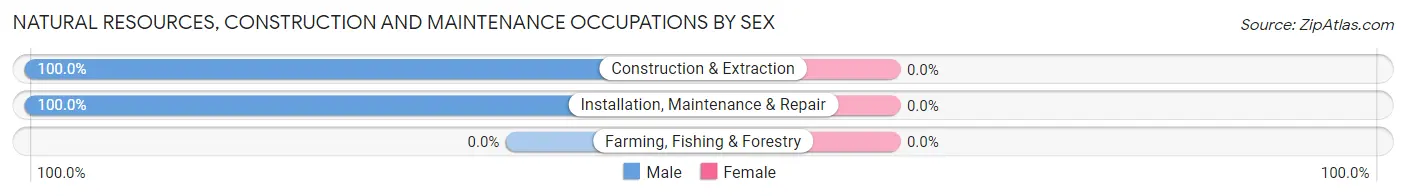
| Occupation | Male | Female |
| Farming, Fishing & Forestry | 0 (0.0%) | 0 (0.0%) |
| Construction & Extraction | 136 (100.0%) | 0 (0.0%) |
| Installation, Maintenance & Repair | 148 (100.0%) | 0 (0.0%) |
| Total (Category) | 284 (100.0%) | 0 (0.0%) |
| Total (Overall) | 2,837 (52.5%) | 2,563 (47.5%) |
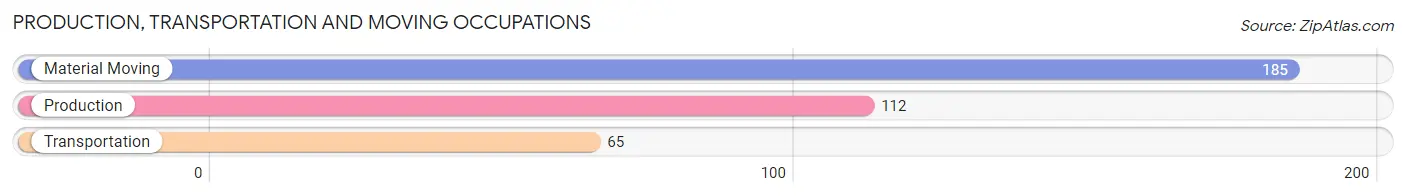
Production, Transportation and Moving Occupations
The most common Production, Transportation and Moving occupations in Bel Air are Material Moving (185 | 3.4%), Production (112 | 2.1%), and Transportation (65 | 1.2%).
Production, Transportation and Moving Occupations by Sex
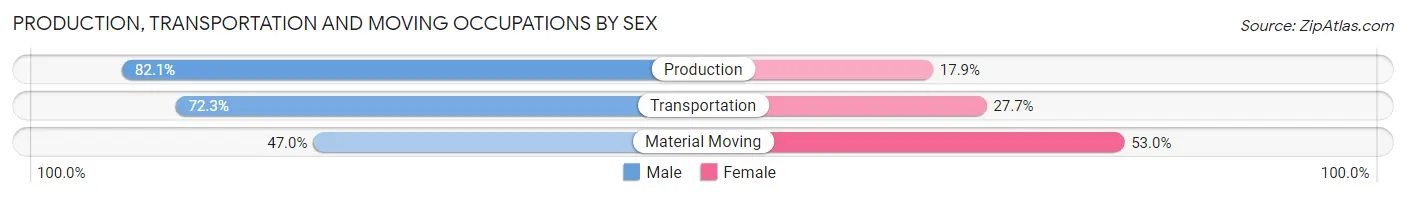
| Occupation | Male | Female |
| Production | 92 (82.1%) | 20 (17.9%) |
| Transportation | 47 (72.3%) | 18 (27.7%) |
| Material Moving | 87 (47.0%) | 98 (53.0%) |
| Total (Category) | 226 (62.4%) | 136 (37.6%) |
| Total (Overall) | 2,837 (52.5%) | 2,563 (47.5%) |
Employment Industries by Sex in Bel Air
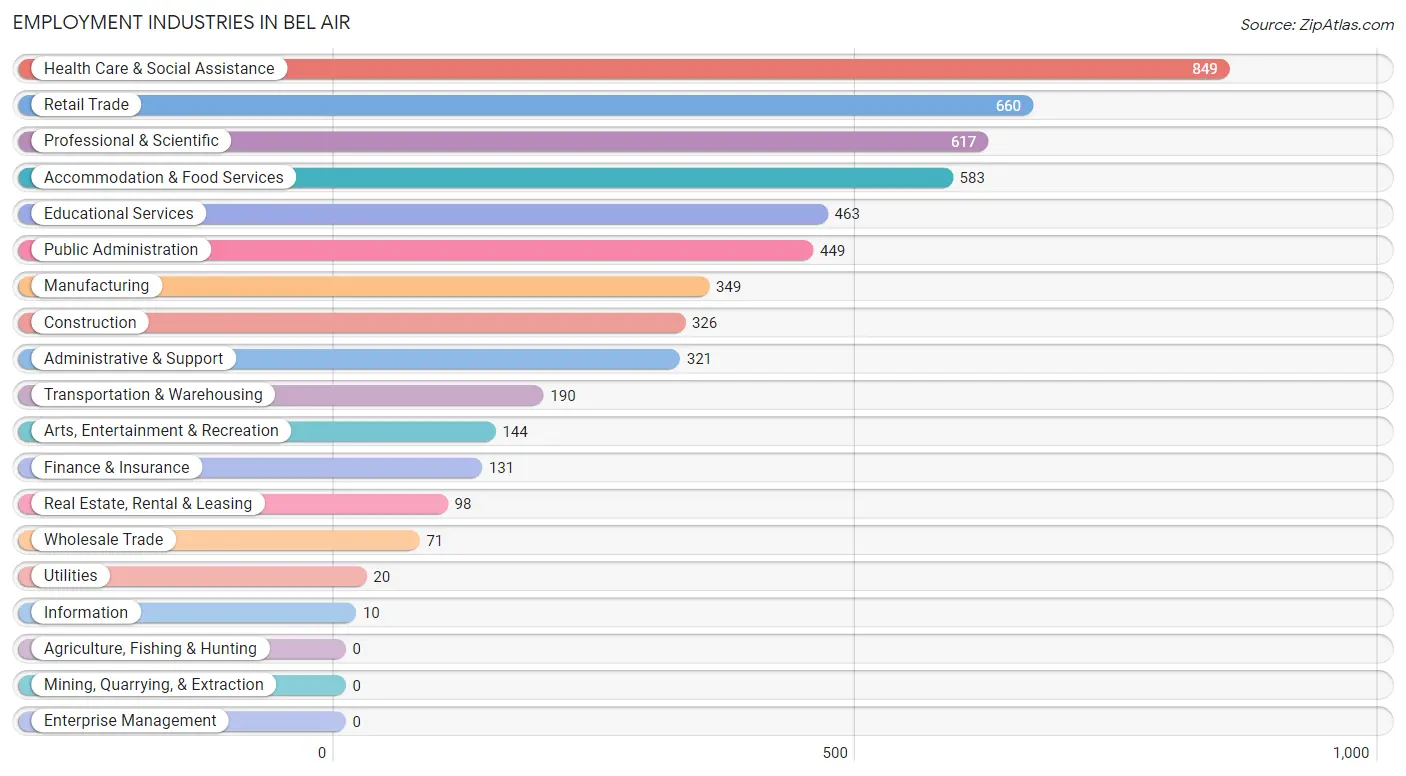
Employment Industries in Bel Air
The major employment industries in Bel Air include Health Care & Social Assistance (849 | 15.7%), Retail Trade (660 | 12.2%), Professional & Scientific (617 | 11.4%), Accommodation & Food Services (583 | 10.8%), and Educational Services (463 | 8.6%).
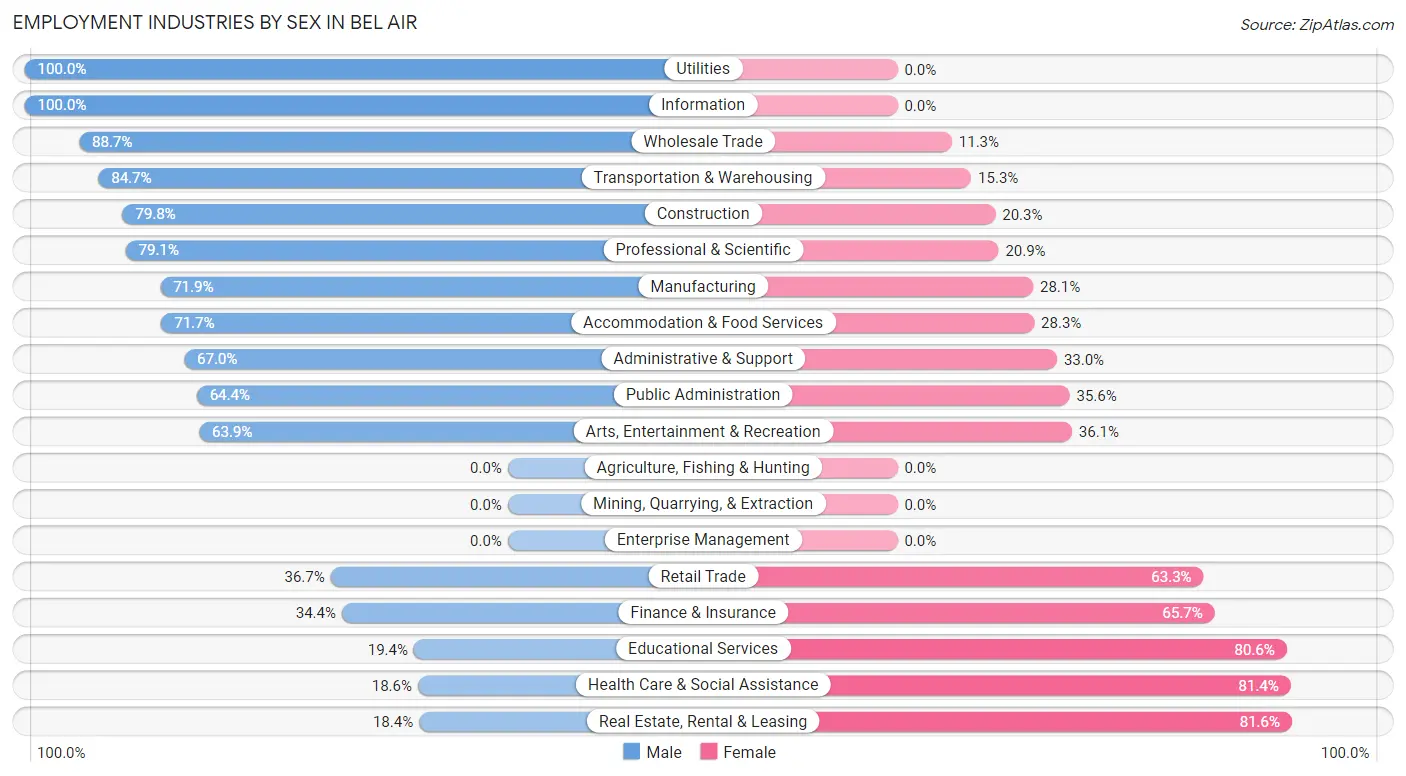
Employment Industries by Sex in Bel Air
The Bel Air industries that see more men than women are Utilities (100.0%), Information (100.0%), and Wholesale Trade (88.7%), whereas the industries that tend to have a higher number of women are Real Estate, Rental & Leasing (81.6%), Health Care & Social Assistance (81.4%), and Educational Services (80.6%).
| Industry | Male | Female |
| Agriculture, Fishing & Hunting | 0 (0.0%) | 0 (0.0%) |
| Mining, Quarrying, & Extraction | 0 (0.0%) | 0 (0.0%) |
| Construction | 260 (79.7%) | 66 (20.3%) |
| Manufacturing | 251 (71.9%) | 98 (28.1%) |
| Wholesale Trade | 63 (88.7%) | 8 (11.3%) |
| Retail Trade | 242 (36.7%) | 418 (63.3%) |
| Transportation & Warehousing | 161 (84.7%) | 29 (15.3%) |
| Utilities | 20 (100.0%) | 0 (0.0%) |
| Information | 10 (100.0%) | 0 (0.0%) |
| Finance & Insurance | 45 (34.4%) | 86 (65.6%) |
| Real Estate, Rental & Leasing | 18 (18.4%) | 80 (81.6%) |
| Professional & Scientific | 488 (79.1%) | 129 (20.9%) |
| Enterprise Management | 0 (0.0%) | 0 (0.0%) |
| Administrative & Support | 215 (67.0%) | 106 (33.0%) |
| Educational Services | 90 (19.4%) | 373 (80.6%) |
| Health Care & Social Assistance | 158 (18.6%) | 691 (81.4%) |
| Arts, Entertainment & Recreation | 92 (63.9%) | 52 (36.1%) |
| Accommodation & Food Services | 418 (71.7%) | 165 (28.3%) |
| Public Administration | 289 (64.4%) | 160 (35.6%) |
| Total | 2,837 (52.5%) | 2,563 (47.5%) |
Education in Bel Air
School Enrollment in Bel Air
The most common levels of schooling among the 2,357 students in Bel Air are high school (830 | 35.2%), college / undergraduate (465 | 19.7%), and middle school (386 | 16.4%).
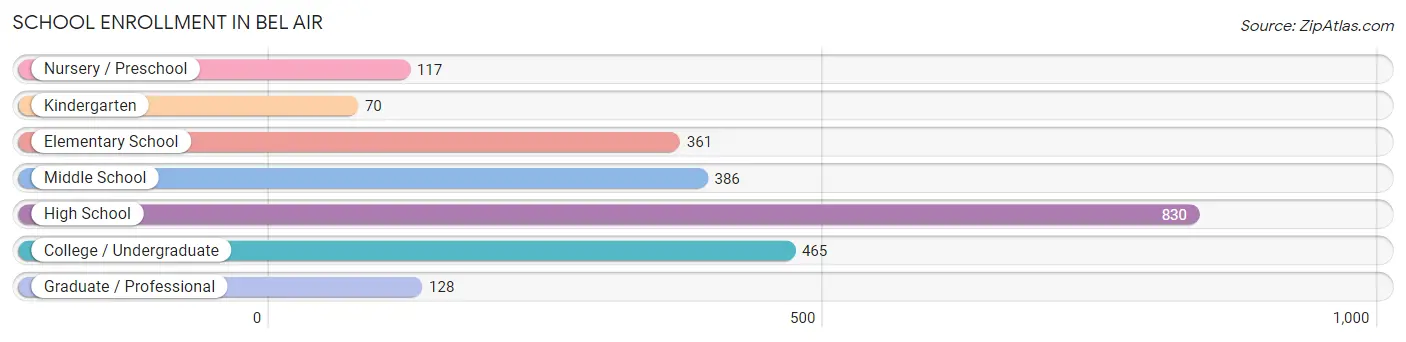
| School Level | # Students | % Students |
| Nursery / Preschool | 117 | 5.0% |
| Kindergarten | 70 | 3.0% |
| Elementary School | 361 | 15.3% |
| Middle School | 386 | 16.4% |
| High School | 830 | 35.2% |
| College / Undergraduate | 465 | 19.7% |
| Graduate / Professional | 128 | 5.4% |
| Total | 2,357 | 100.0% |
School Enrollment by Age by Funding Source in Bel Air
Out of a total of 2,357 students who are enrolled in schools in Bel Air, 342 (14.5%) attend a private institution, while the remaining 2,015 (85.5%) are enrolled in public schools. The age group of 3 to 4 year olds has the highest likelihood of being enrolled in private schools, with 55 (69.6% in the age bracket) enrolled. Conversely, the age group of 10 to 14 year olds has the lowest likelihood of being enrolled in a private school, with 512 (100.0% in the age bracket) attending a public institution.
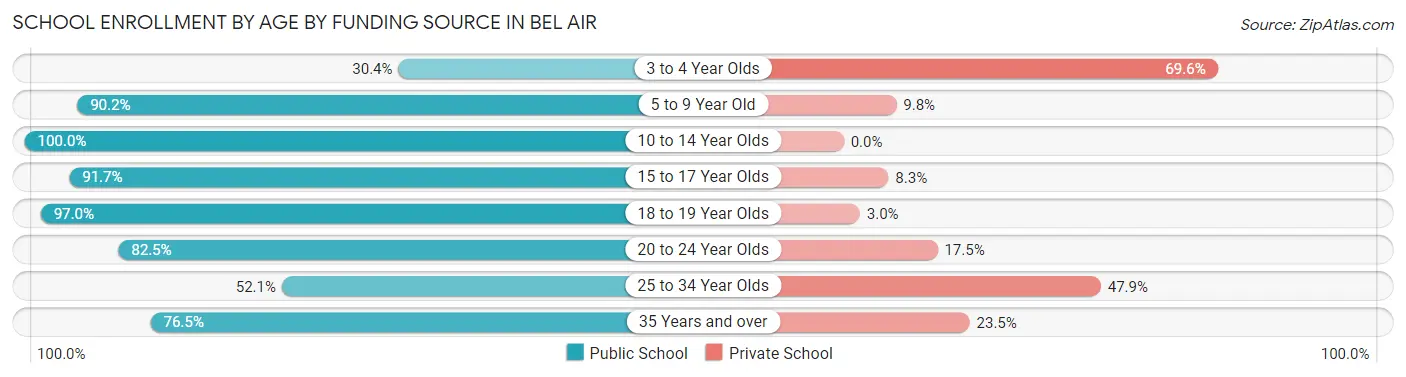
| Age Bracket | Public School | Private School |
| 3 to 4 Year Olds | 24 (30.4%) | 55 (69.6%) |
| 5 to 9 Year Old | 386 (90.2%) | 42 (9.8%) |
| 10 to 14 Year Olds | 512 (100.0%) | 0 (0.0%) |
| 15 to 17 Year Olds | 528 (91.7%) | 48 (8.3%) |
| 18 to 19 Year Olds | 129 (97.0%) | 4 (3.0%) |
| 20 to 24 Year Olds | 189 (82.5%) | 40 (17.5%) |
| 25 to 34 Year Olds | 124 (52.1%) | 114 (47.9%) |
| 35 Years and over | 124 (76.5%) | 38 (23.5%) |
| Total | 2,015 (85.5%) | 342 (14.5%) |
Educational Attainment by Field of Study in Bel Air
Business (527 | 16.5%), education (355 | 11.1%), psychology (334 | 10.5%), science & technology (272 | 8.5%), and liberal arts & history (242 | 7.6%) are the most common fields of study among 3,188 individuals in Bel Air who have obtained a bachelor's degree or higher.
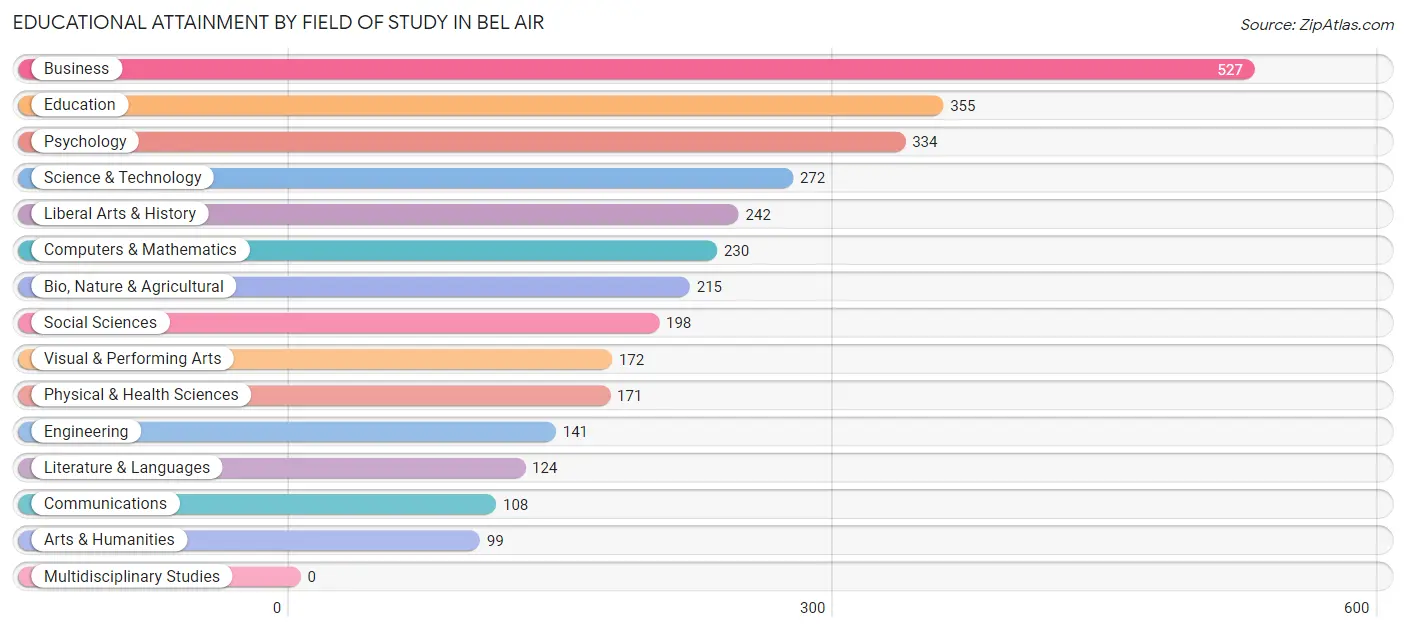
| Field of Study | # Graduates | % Graduates |
| Computers & Mathematics | 230 | 7.2% |
| Bio, Nature & Agricultural | 215 | 6.7% |
| Physical & Health Sciences | 171 | 5.4% |
| Psychology | 334 | 10.5% |
| Social Sciences | 198 | 6.2% |
| Engineering | 141 | 4.4% |
| Multidisciplinary Studies | 0 | 0.0% |
| Science & Technology | 272 | 8.5% |
| Business | 527 | 16.5% |
| Education | 355 | 11.1% |
| Literature & Languages | 124 | 3.9% |
| Liberal Arts & History | 242 | 7.6% |
| Visual & Performing Arts | 172 | 5.4% |
| Communications | 108 | 3.4% |
| Arts & Humanities | 99 | 3.1% |
| Total | 3,188 | 100.0% |
Transportation & Commute in Bel Air
Vehicle Availability by Sex in Bel Air
The most prevalent vehicle ownership categories in Bel Air are males with 2 vehicles (1,016, accounting for 36.4%) and females with 2 vehicles (833, making up 40.3%).
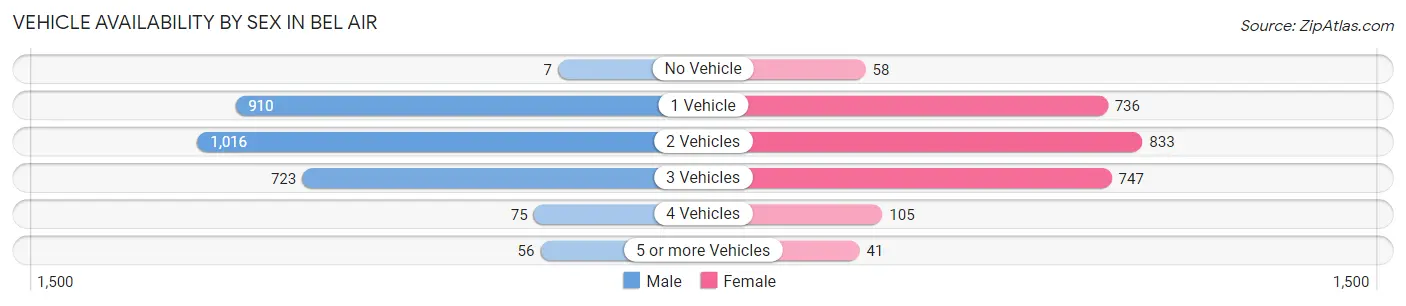
| Vehicles Available | Male | Female |
| No Vehicle | 7 (0.3%) | 58 (2.3%) |
| 1 Vehicle | 910 (32.7%) | 736 (29.2%) |
| 2 Vehicles | 1,016 (36.4%) | 833 (33.1%) |
| 3 Vehicles | 723 (25.9%) | 747 (29.6%) |
| 4 Vehicles | 75 (2.7%) | 105 (4.2%) |
| 5 or more Vehicles | 56 (2.0%) | 41 (1.6%) |
| Total | 2,787 (100.0%) | 2,520 (100.0%) |
Commute Time in Bel Air
The most frequently occuring commute durations in Bel Air are 10 to 14 minutes (721 commuters, 14.6%), 5 to 9 minutes (715 commuters, 14.4%), and 30 to 34 minutes (687 commuters, 13.9%).
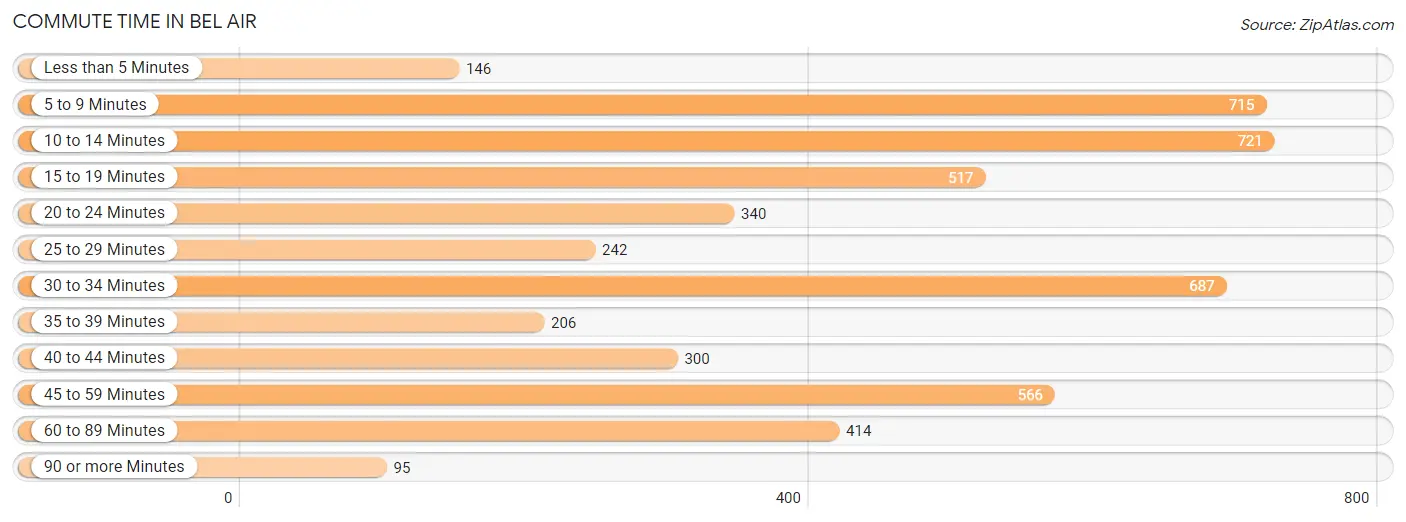
| Commute Time | # Commuters | % Commuters |
| Less than 5 Minutes | 146 | 2.9% |
| 5 to 9 Minutes | 715 | 14.4% |
| 10 to 14 Minutes | 721 | 14.6% |
| 15 to 19 Minutes | 517 | 10.4% |
| 20 to 24 Minutes | 340 | 6.9% |
| 25 to 29 Minutes | 242 | 4.9% |
| 30 to 34 Minutes | 687 | 13.9% |
| 35 to 39 Minutes | 206 | 4.2% |
| 40 to 44 Minutes | 300 | 6.1% |
| 45 to 59 Minutes | 566 | 11.4% |
| 60 to 89 Minutes | 414 | 8.4% |
| 90 or more Minutes | 95 | 1.9% |
Commute Time by Sex in Bel Air
The most common commute times in Bel Air are 10 to 14 minutes (436 commuters, 16.6%) for males and 5 to 9 minutes (486 commuters, 20.9%) for females.
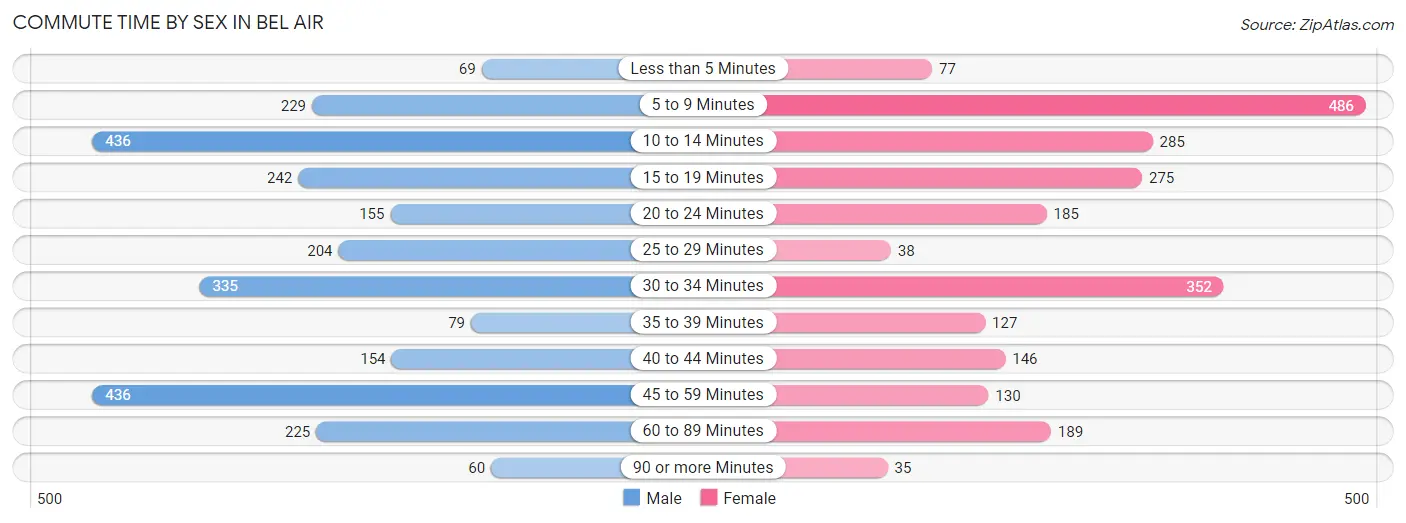
| Commute Time | Male | Female |
| Less than 5 Minutes | 69 (2.6%) | 77 (3.3%) |
| 5 to 9 Minutes | 229 (8.7%) | 486 (20.9%) |
| 10 to 14 Minutes | 436 (16.6%) | 285 (12.3%) |
| 15 to 19 Minutes | 242 (9.2%) | 275 (11.8%) |
| 20 to 24 Minutes | 155 (5.9%) | 185 (8.0%) |
| 25 to 29 Minutes | 204 (7.8%) | 38 (1.6%) |
| 30 to 34 Minutes | 335 (12.8%) | 352 (15.1%) |
| 35 to 39 Minutes | 79 (3.0%) | 127 (5.5%) |
| 40 to 44 Minutes | 154 (5.9%) | 146 (6.3%) |
| 45 to 59 Minutes | 436 (16.6%) | 130 (5.6%) |
| 60 to 89 Minutes | 225 (8.6%) | 189 (8.1%) |
| 90 or more Minutes | 60 (2.3%) | 35 (1.5%) |
Time of Departure to Work by Sex in Bel Air
The most frequent times of departure to work in Bel Air are 7:00 AM to 7:29 AM (385, 14.7%) for males and 7:30 AM to 7:59 AM (483, 20.8%) for females.
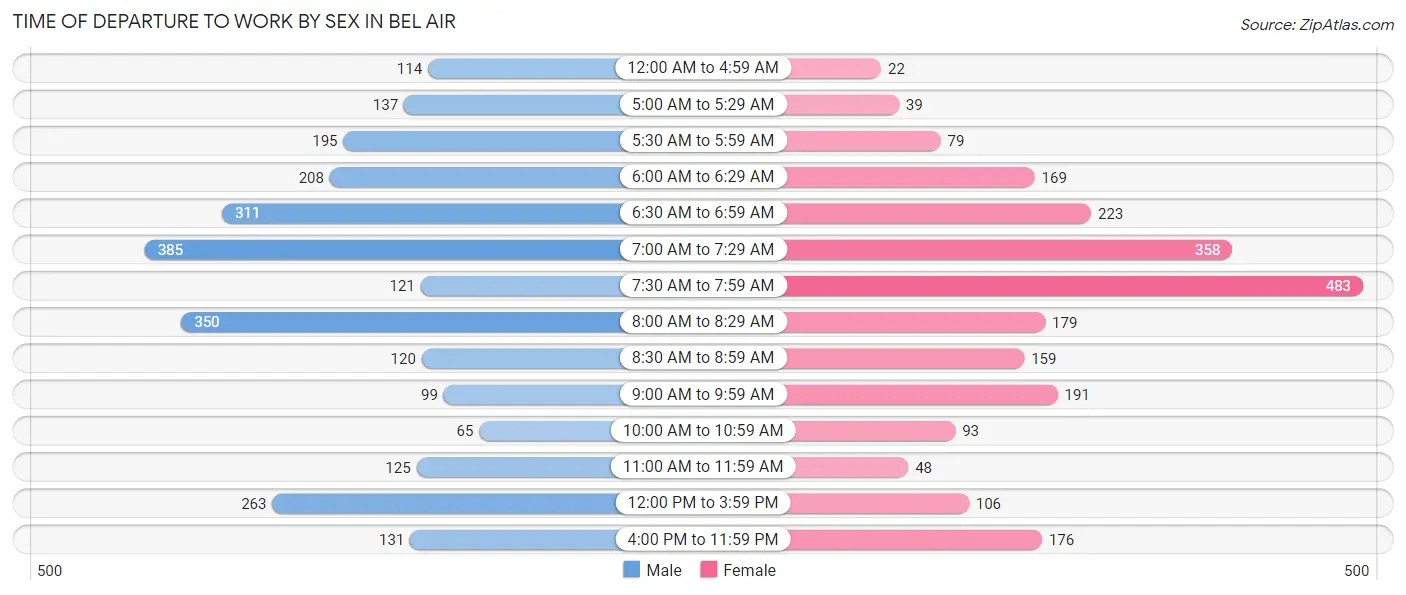
| Time of Departure | Male | Female |
| 12:00 AM to 4:59 AM | 114 (4.3%) | 22 (0.9%) |
| 5:00 AM to 5:29 AM | 137 (5.2%) | 39 (1.7%) |
| 5:30 AM to 5:59 AM | 195 (7.4%) | 79 (3.4%) |
| 6:00 AM to 6:29 AM | 208 (7.9%) | 169 (7.3%) |
| 6:30 AM to 6:59 AM | 311 (11.8%) | 223 (9.6%) |
| 7:00 AM to 7:29 AM | 385 (14.7%) | 358 (15.4%) |
| 7:30 AM to 7:59 AM | 121 (4.6%) | 483 (20.8%) |
| 8:00 AM to 8:29 AM | 350 (13.3%) | 179 (7.7%) |
| 8:30 AM to 8:59 AM | 120 (4.6%) | 159 (6.8%) |
| 9:00 AM to 9:59 AM | 99 (3.8%) | 191 (8.2%) |
| 10:00 AM to 10:59 AM | 65 (2.5%) | 93 (4.0%) |
| 11:00 AM to 11:59 AM | 125 (4.8%) | 48 (2.1%) |
| 12:00 PM to 3:59 PM | 263 (10.0%) | 106 (4.6%) |
| 4:00 PM to 11:59 PM | 131 (5.0%) | 176 (7.6%) |
| Total | 2,624 (100.0%) | 2,325 (100.0%) |
Housing Occupancy in Bel Air
Occupancy by Ownership in Bel Air
Of the total 721 dwellings in Bel Air, owner-occupied units account for 582 (80.7%), while renter-occupied units make up 139 (19.3%).
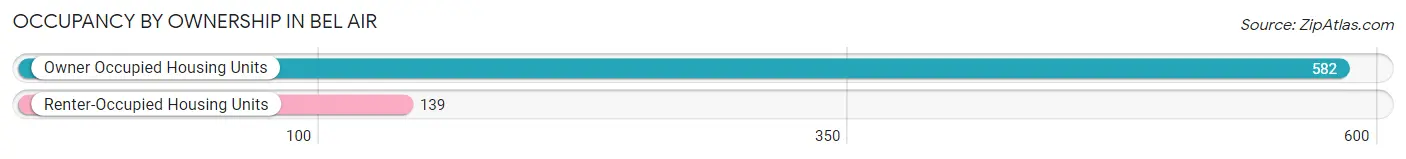
| Occupancy | # Housing Units | % Housing Units |
| Owner Occupied Housing Units | 582 | 80.7% |
| Renter-Occupied Housing Units | 139 | 19.3% |
| Total Occupied Housing Units | 721 | 100.0% |
Occupancy by Household Size in Bel Air
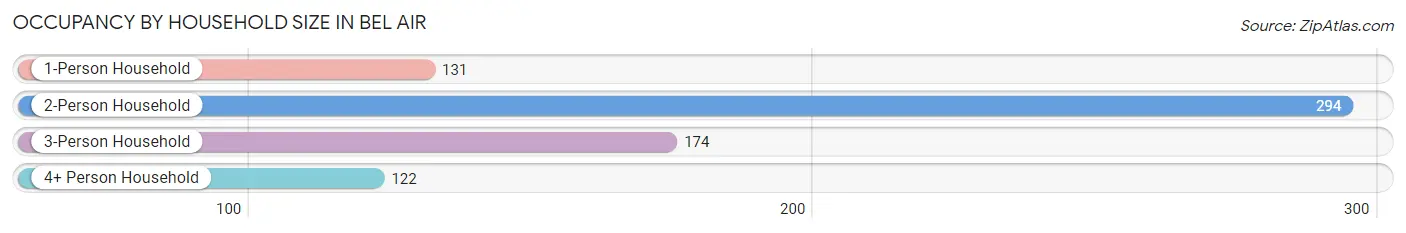
| Household Size | # Housing Units | % Housing Units |
| 1-Person Household | 131 | 18.2% |
| 2-Person Household | 294 | 40.8% |
| 3-Person Household | 174 | 24.1% |
| 4+ Person Household | 122 | 16.9% |
| Total Housing Units | 721 | 100.0% |
Occupancy by Ownership by Household Size in Bel Air
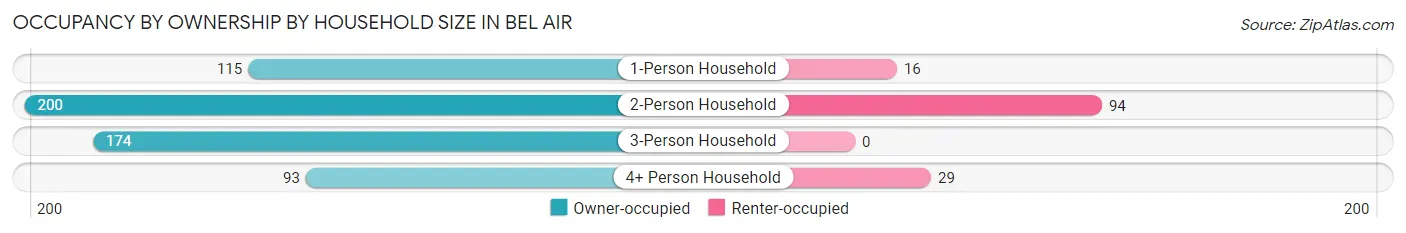
| Household Size | Owner-occupied | Renter-occupied |
| 1-Person Household | 115 (87.8%) | 16 (12.2%) |
| 2-Person Household | 200 (68.0%) | 94 (32.0%) |
| 3-Person Household | 174 (100.0%) | 0 (0.0%) |
| 4+ Person Household | 93 (76.2%) | 29 (23.8%) |
| Total Housing Units | 582 (80.7%) | 139 (19.3%) |
Occupancy by Educational Attainment in Bel Air
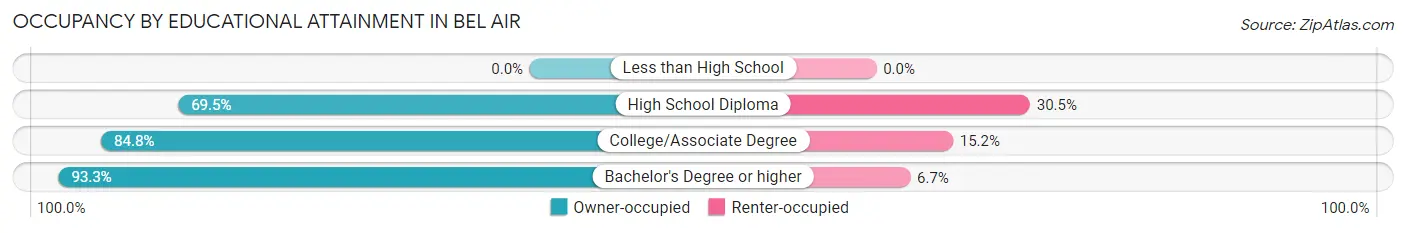
| Household Size | Owner-occupied | Renter-occupied |
| Less than High School | 0 (0.0%) | 0 (0.0%) |
| High School Diploma | 226 (69.5%) | 99 (30.5%) |
| College/Associate Degree | 134 (84.8%) | 24 (15.2%) |
| Bachelor's Degree or higher | 222 (93.3%) | 16 (6.7%) |
Occupancy by Age of Householder in Bel Air
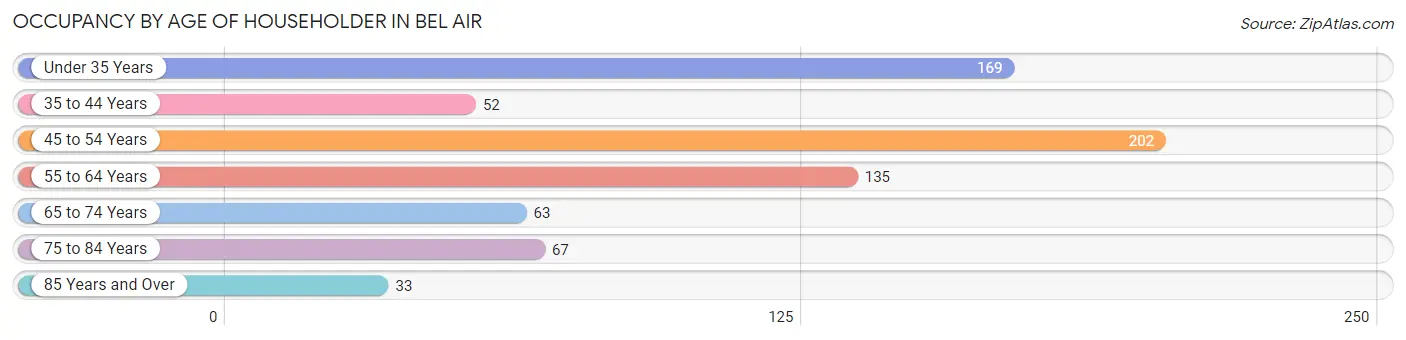
| Age Bracket | # Households | % Households |
| Under 35 Years | 169 | 23.4% |
| 35 to 44 Years | 52 | 7.2% |
| 45 to 54 Years | 202 | 28.0% |
| 55 to 64 Years | 135 | 18.7% |
| 65 to 74 Years | 63 | 8.7% |
| 75 to 84 Years | 67 | 9.3% |
| 85 Years and Over | 33 | 4.6% |
| Total | 721 | 100.0% |
Housing Finances in Bel Air
Median Income by Occupancy in Bel Air
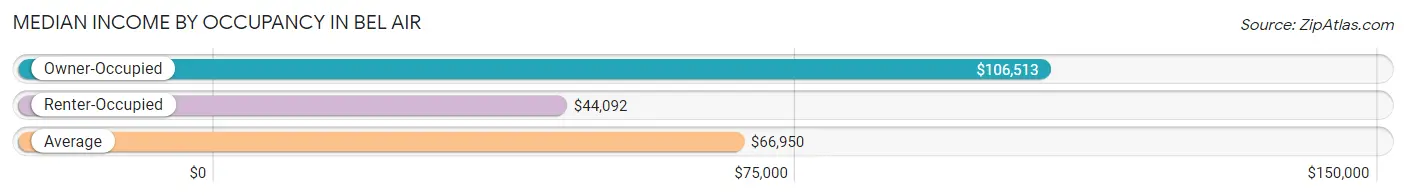
| Occupancy Type | # Households | Median Income |
| Owner-Occupied | 2,918 (59.6%) | $106,513 |
| Renter-Occupied | 1,979 (40.4%) | $44,092 |
| Average | 4,897 (100.0%) | $66,950 |
Occupancy by Householder Income Bracket in Bel Air
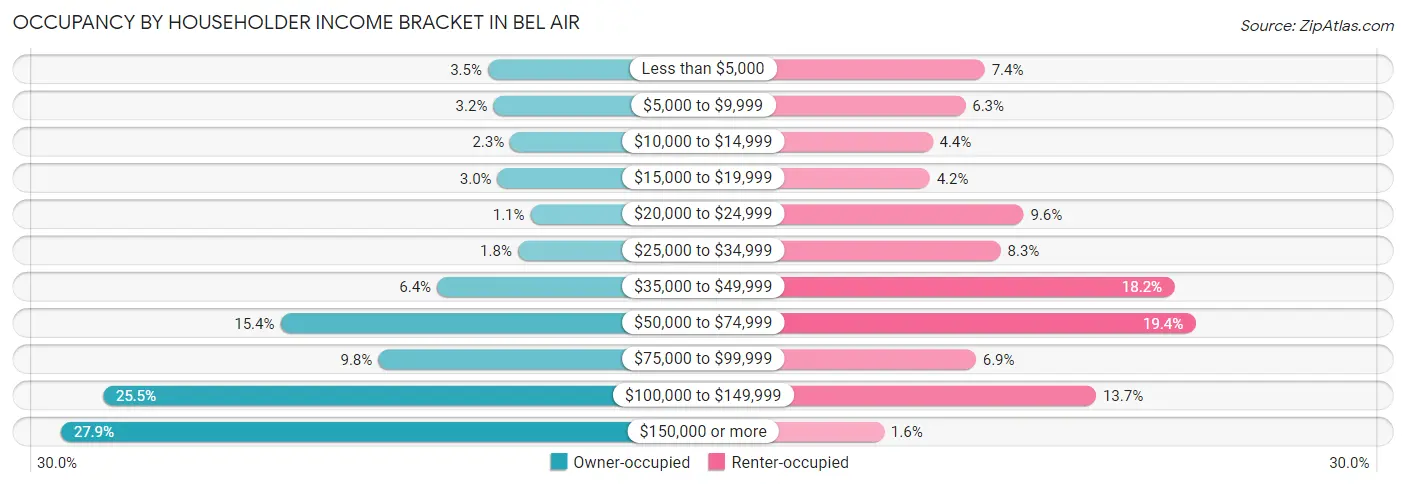
| Income Bracket | Owner-occupied | Renter-occupied |
| Less than $5,000 | 103 (3.5%) | 146 (7.4%) |
| $5,000 to $9,999 | 94 (3.2%) | 124 (6.3%) |
| $10,000 to $14,999 | 66 (2.3%) | 87 (4.4%) |
| $15,000 to $19,999 | 87 (3.0%) | 84 (4.2%) |
| $20,000 to $24,999 | 32 (1.1%) | 190 (9.6%) |
| $25,000 to $34,999 | 53 (1.8%) | 164 (8.3%) |
| $35,000 to $49,999 | 188 (6.4%) | 360 (18.2%) |
| $50,000 to $74,999 | 449 (15.4%) | 384 (19.4%) |
| $75,000 to $99,999 | 286 (9.8%) | 136 (6.9%) |
| $100,000 to $149,999 | 745 (25.5%) | 272 (13.7%) |
| $150,000 or more | 815 (27.9%) | 32 (1.6%) |
| Total | 2,918 (100.0%) | 1,979 (100.0%) |
Monthly Housing Cost Tiers in Bel Air
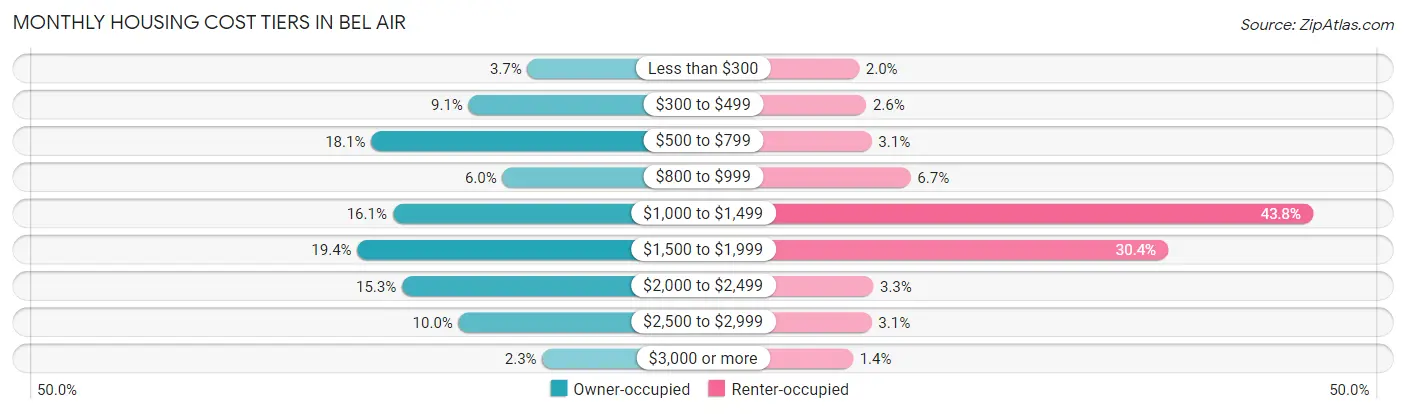
| Monthly Cost | Owner-occupied | Renter-occupied |
| Less than $300 | 108 (3.7%) | 39 (2.0%) |
| $300 to $499 | 266 (9.1%) | 52 (2.6%) |
| $500 to $799 | 528 (18.1%) | 62 (3.1%) |
| $800 to $999 | 175 (6.0%) | 133 (6.7%) |
| $1,000 to $1,499 | 470 (16.1%) | 866 (43.8%) |
| $1,500 to $1,999 | 565 (19.4%) | 602 (30.4%) |
| $2,000 to $2,499 | 445 (15.2%) | 65 (3.3%) |
| $2,500 to $2,999 | 293 (10.0%) | 62 (3.1%) |
| $3,000 or more | 68 (2.3%) | 28 (1.4%) |
| Total | 2,918 (100.0%) | 1,979 (100.0%) |
Physical Housing Characteristics in Bel Air
Housing Structures in Bel Air
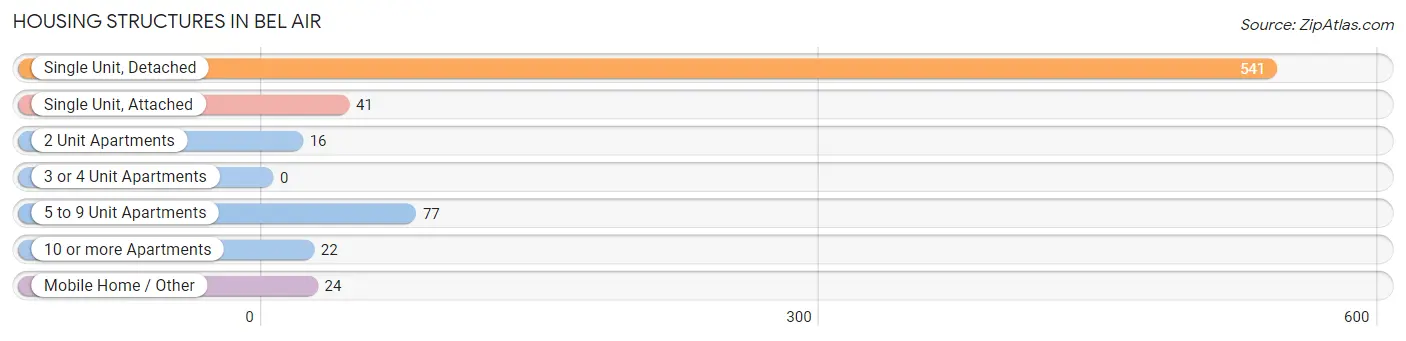
| Structure Type | # Housing Units | % Housing Units |
| Single Unit, Detached | 541 | 75.0% |
| Single Unit, Attached | 41 | 5.7% |
| 2 Unit Apartments | 16 | 2.2% |
| 3 or 4 Unit Apartments | 0 | 0.0% |
| 5 to 9 Unit Apartments | 77 | 10.7% |
| 10 or more Apartments | 22 | 3.0% |
| Mobile Home / Other | 24 | 3.3% |
| Total | 721 | 100.0% |
Housing Structures by Occupancy in Bel Air
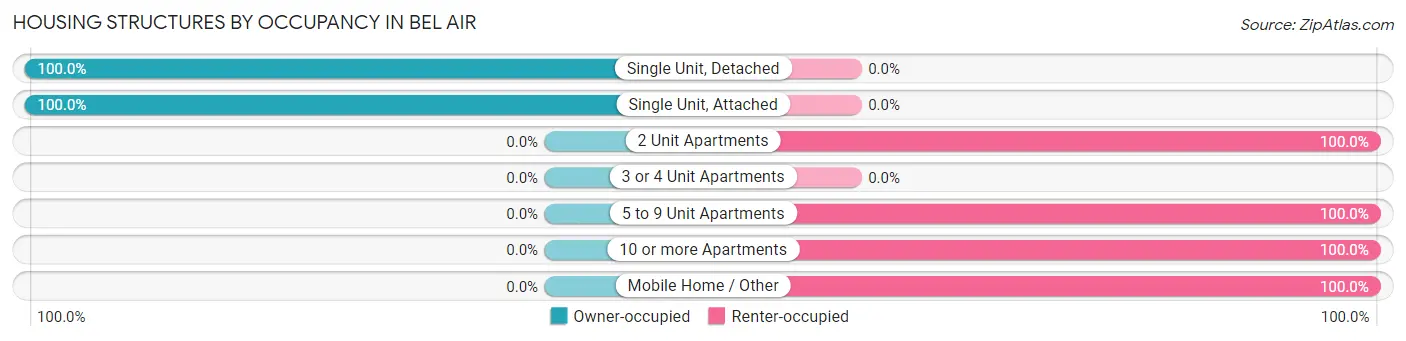
| Structure Type | Owner-occupied | Renter-occupied |
| Single Unit, Detached | 541 (100.0%) | 0 (0.0%) |
| Single Unit, Attached | 41 (100.0%) | 0 (0.0%) |
| 2 Unit Apartments | 0 (0.0%) | 16 (100.0%) |
| 3 or 4 Unit Apartments | 0 (0.0%) | 0 (0.0%) |
| 5 to 9 Unit Apartments | 0 (0.0%) | 77 (100.0%) |
| 10 or more Apartments | 0 (0.0%) | 22 (100.0%) |
| Mobile Home / Other | 0 (0.0%) | 24 (100.0%) |
| Total | 582 (80.7%) | 139 (19.3%) |
Housing Structures by Number of Rooms in Bel Air
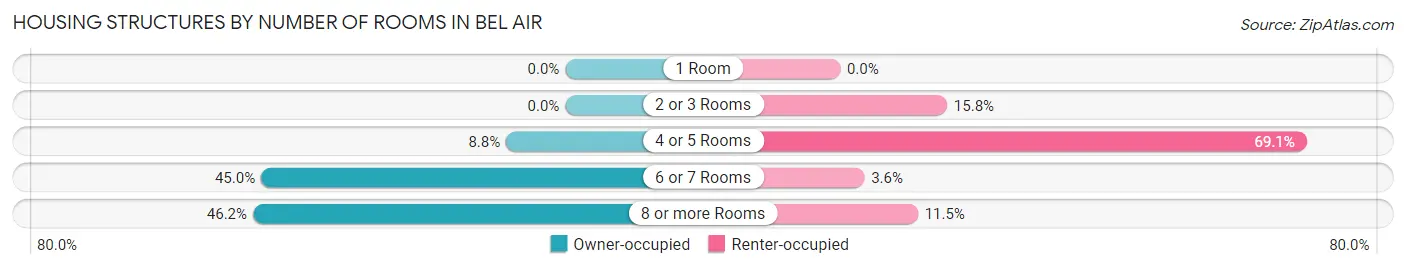
| Number of Rooms | Owner-occupied | Renter-occupied |
| 1 Room | 0 (0.0%) | 0 (0.0%) |
| 2 or 3 Rooms | 0 (0.0%) | 22 (15.8%) |
| 4 or 5 Rooms | 51 (8.8%) | 96 (69.1%) |
| 6 or 7 Rooms | 262 (45.0%) | 5 (3.6%) |
| 8 or more Rooms | 269 (46.2%) | 16 (11.5%) |
| Total | 582 (100.0%) | 139 (100.0%) |
Housing Structure by Heating Type in Bel Air
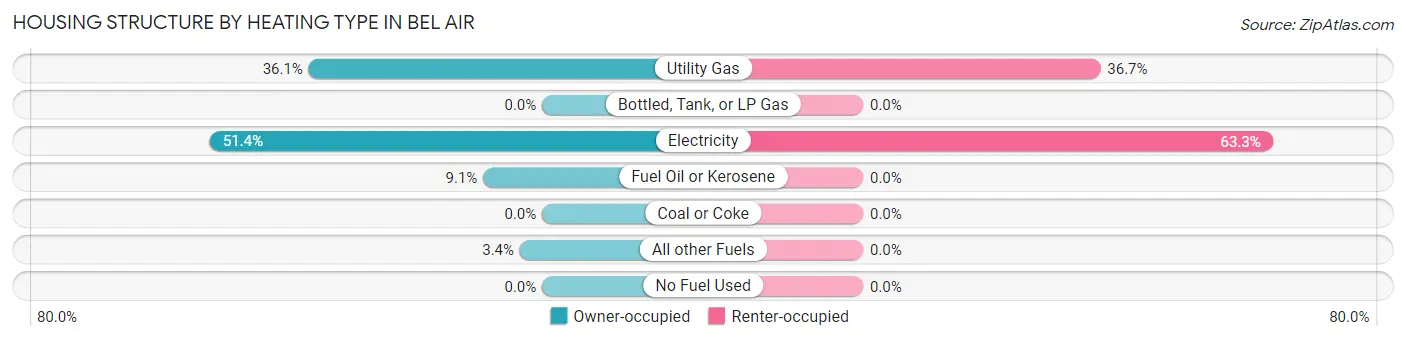
| Heating Type | Owner-occupied | Renter-occupied |
| Utility Gas | 210 (36.1%) | 51 (36.7%) |
| Bottled, Tank, or LP Gas | 0 (0.0%) | 0 (0.0%) |
| Electricity | 299 (51.4%) | 88 (63.3%) |
| Fuel Oil or Kerosene | 53 (9.1%) | 0 (0.0%) |
| Coal or Coke | 0 (0.0%) | 0 (0.0%) |
| All other Fuels | 20 (3.4%) | 0 (0.0%) |
| No Fuel Used | 0 (0.0%) | 0 (0.0%) |
| Total | 582 (100.0%) | 139 (100.0%) |
Household Vehicle Usage in Bel Air
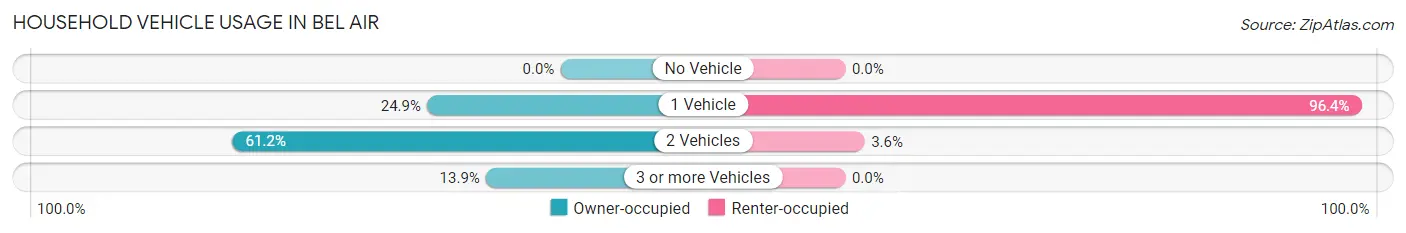
| Vehicles per Household | Owner-occupied | Renter-occupied |
| No Vehicle | 0 (0.0%) | 0 (0.0%) |
| 1 Vehicle | 145 (24.9%) | 134 (96.4%) |
| 2 Vehicles | 356 (61.2%) | 5 (3.6%) |
| 3 or more Vehicles | 81 (13.9%) | 0 (0.0%) |
| Total | 582 (100.0%) | 139 (100.0%) |
Real Estate & Mortgages in Bel Air
Real Estate and Mortgage Overview in Bel Air
| Characteristic | Without Mortgage | With Mortgage |
| Housing Units | 219 | 1,845 |
| Median Property Value | $181,400 | $319,200 |
| Median Household Income | $92,563 | $618 |
| Monthly Housing Costs | $488 | $68 |
| Real Estate Taxes | $1,877 | $45 |
Property Value by Mortgage Status in Bel Air
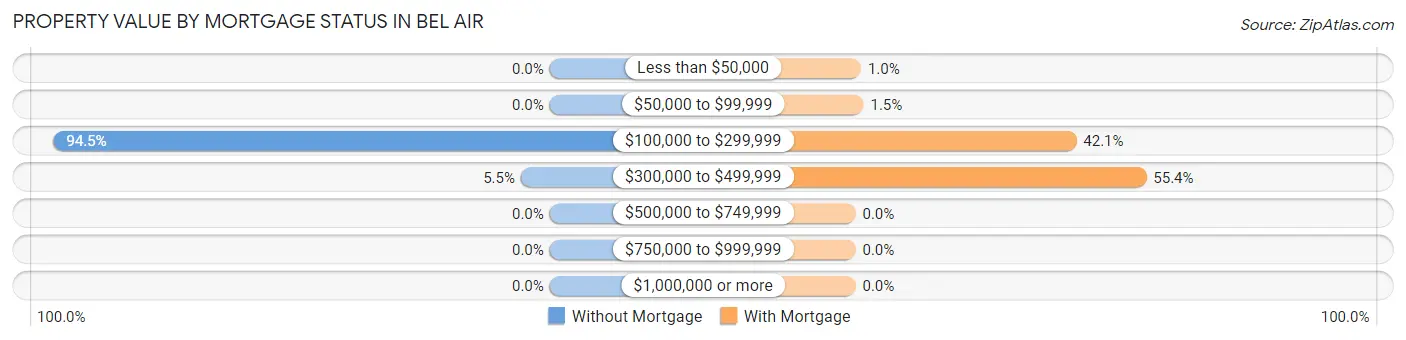
| Property Value | Without Mortgage | With Mortgage |
| Less than $50,000 | 0 (0.0%) | 19 (1.0%) |
| $50,000 to $99,999 | 0 (0.0%) | 28 (1.5%) |
| $100,000 to $299,999 | 207 (94.5%) | 776 (42.1%) |
| $300,000 to $499,999 | 12 (5.5%) | 1,022 (55.4%) |
| $500,000 to $749,999 | 0 (0.0%) | 0 (0.0%) |
| $750,000 to $999,999 | 0 (0.0%) | 0 (0.0%) |
| $1,000,000 or more | 0 (0.0%) | 0 (0.0%) |
| Total | 219 (100.0%) | 1,845 (100.0%) |
Household Income by Mortgage Status in Bel Air
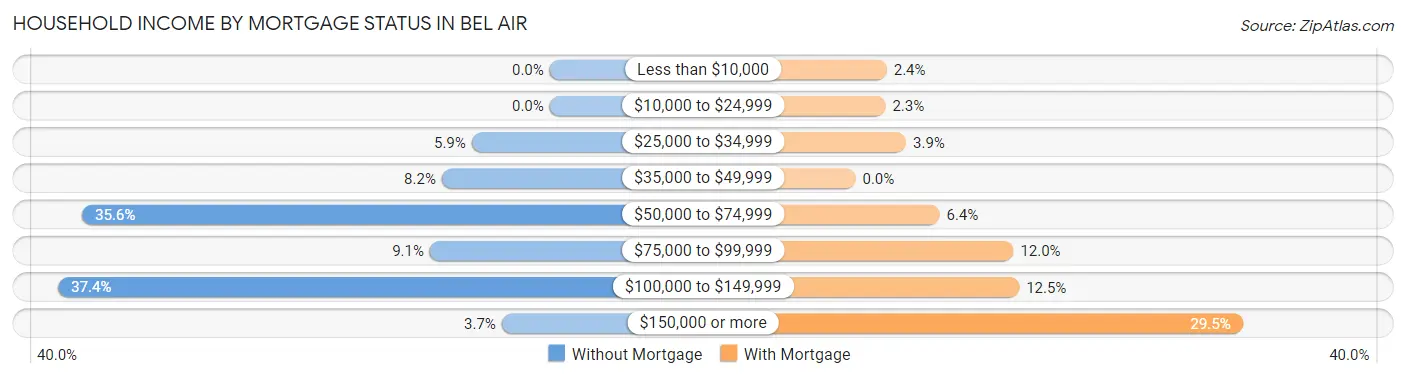
| Household Income | Without Mortgage | With Mortgage |
| Less than $10,000 | 0 (0.0%) | 44 (2.4%) |
| $10,000 to $24,999 | 0 (0.0%) | 42 (2.3%) |
| $25,000 to $34,999 | 13 (5.9%) | 71 (3.8%) |
| $35,000 to $49,999 | 18 (8.2%) | 0 (0.0%) |
| $50,000 to $74,999 | 78 (35.6%) | 118 (6.4%) |
| $75,000 to $99,999 | 20 (9.1%) | 222 (12.0%) |
| $100,000 to $149,999 | 82 (37.4%) | 230 (12.5%) |
| $150,000 or more | 8 (3.6%) | 544 (29.5%) |
| Total | 219 (100.0%) | 1,845 (100.0%) |
Property Value to Household Income Ratio in Bel Air
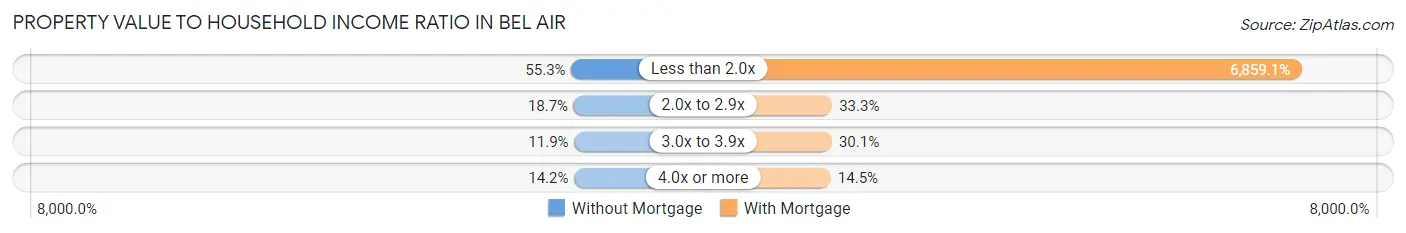
| Value-to-Income Ratio | Without Mortgage | With Mortgage |
| Less than 2.0x | 121 (55.2%) | 126,551 (6,859.1%) |
| 2.0x to 2.9x | 41 (18.7%) | 614 (33.3%) |
| 3.0x to 3.9x | 26 (11.9%) | 555 (30.1%) |
| 4.0x or more | 31 (14.2%) | 268 (14.5%) |
| Total | 219 (100.0%) | 1,845 (100.0%) |
Real Estate Taxes by Mortgage Status in Bel Air
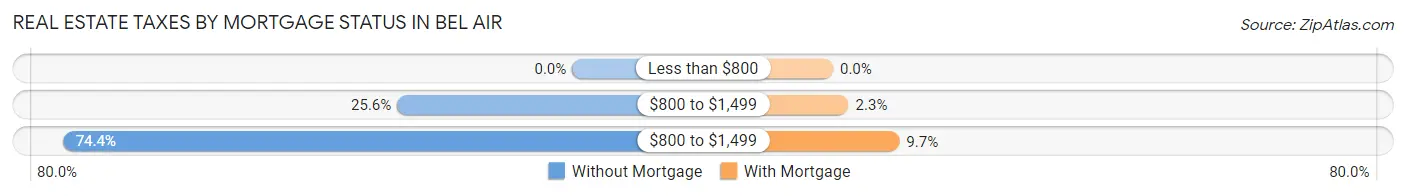
| Property Taxes | Without Mortgage | With Mortgage |
| Less than $800 | 0 (0.0%) | 0 (0.0%) |
| $800 to $1,499 | 56 (25.6%) | 42 (2.3%) |
| $800 to $1,499 | 163 (74.4%) | 179 (9.7%) |
| Total | 219 (100.0%) | 1,845 (100.0%) |
Health & Disability in Bel Air
Health Insurance Coverage by Age in Bel Air
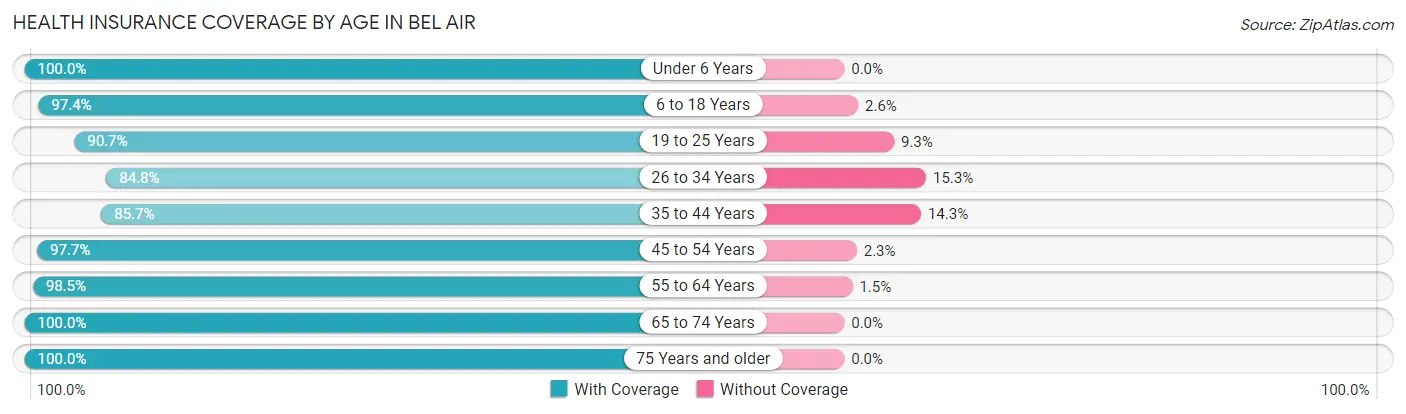
| Age Bracket | With Coverage | Without Coverage |
| Under 6 Years | 524 (100.0%) | 0 (0.0%) |
| 6 to 18 Years | 1,508 (97.4%) | 40 (2.6%) |
| 19 to 25 Years | 793 (90.7%) | 81 (9.3%) |
| 26 to 34 Years | 1,100 (84.8%) | 198 (15.2%) |
| 35 to 44 Years | 1,426 (85.7%) | 238 (14.3%) |
| 45 to 54 Years | 1,004 (97.7%) | 24 (2.3%) |
| 55 to 64 Years | 1,356 (98.5%) | 21 (1.5%) |
| 65 to 74 Years | 1,227 (100.0%) | 0 (0.0%) |
| 75 Years and older | 988 (100.0%) | 0 (0.0%) |
| Total | 9,926 (94.3%) | 602 (5.7%) |
Health Insurance Coverage by Citizenship Status in Bel Air
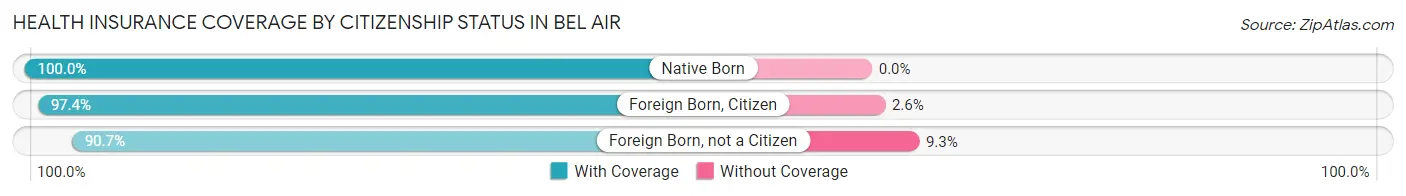
| Citizenship Status | With Coverage | Without Coverage |
| Native Born | 524 (100.0%) | 0 (0.0%) |
| Foreign Born, Citizen | 1,508 (97.4%) | 40 (2.6%) |
| Foreign Born, not a Citizen | 793 (90.7%) | 81 (9.3%) |
Health Insurance Coverage by Household Income in Bel Air
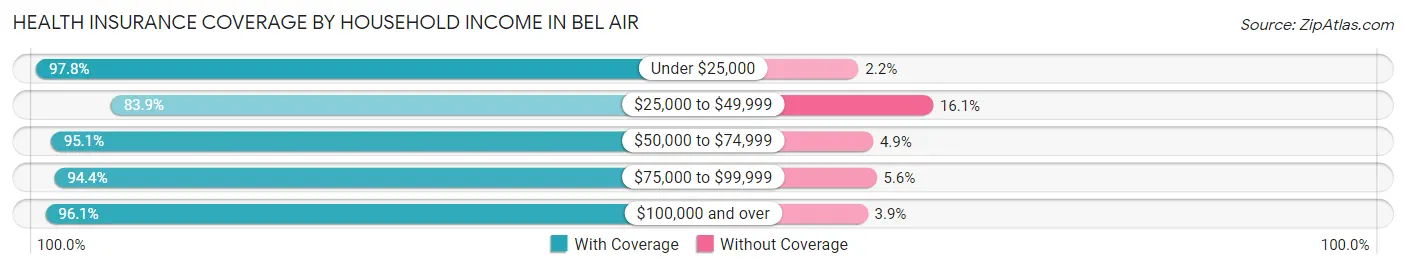
| Household Income | With Coverage | Without Coverage |
| Under $25,000 | 1,536 (97.8%) | 34 (2.2%) |
| $25,000 to $49,999 | 1,283 (83.9%) | 247 (16.1%) |
| $50,000 to $74,999 | 1,394 (95.1%) | 72 (4.9%) |
| $75,000 to $99,999 | 899 (94.4%) | 53 (5.6%) |
| $100,000 and over | 4,758 (96.1%) | 193 (3.9%) |
Public vs Private Health Insurance Coverage by Age in Bel Air
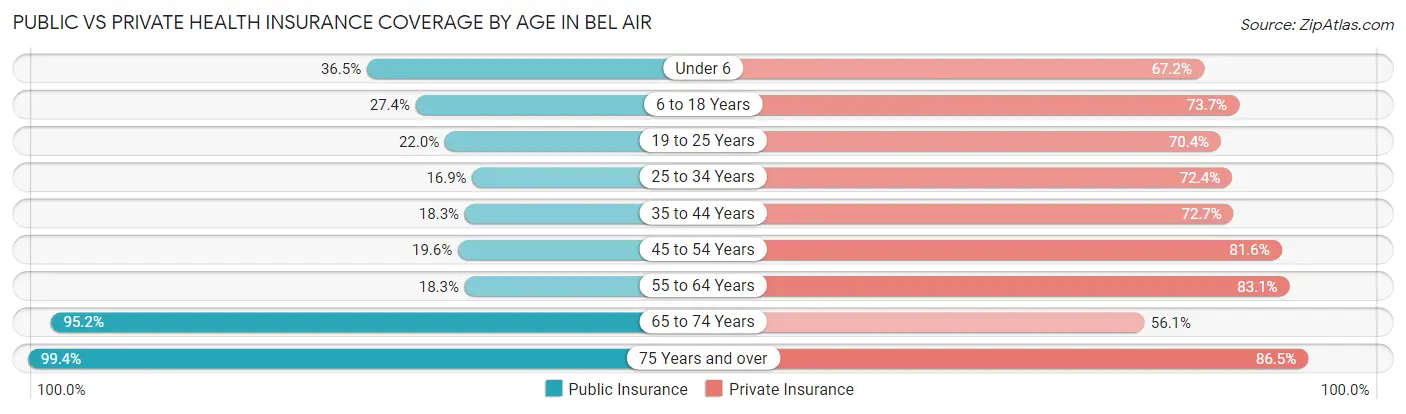
| Age Bracket | Public Insurance | Private Insurance |
| Under 6 | 191 (36.4%) | 352 (67.2%) |
| 6 to 18 Years | 424 (27.4%) | 1,141 (73.7%) |
| 19 to 25 Years | 192 (22.0%) | 615 (70.4%) |
| 25 to 34 Years | 219 (16.9%) | 940 (72.4%) |
| 35 to 44 Years | 304 (18.3%) | 1,210 (72.7%) |
| 45 to 54 Years | 201 (19.6%) | 839 (81.6%) |
| 55 to 64 Years | 252 (18.3%) | 1,144 (83.1%) |
| 65 to 74 Years | 1,168 (95.2%) | 688 (56.1%) |
| 75 Years and over | 982 (99.4%) | 855 (86.5%) |
| Total | 3,933 (37.4%) | 7,784 (73.9%) |
Disability Status by Sex by Age in Bel Air
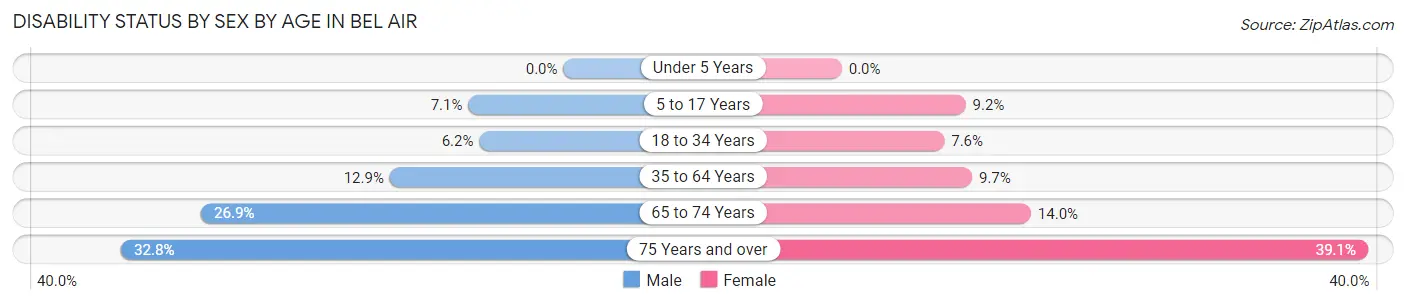
| Age Bracket | Male | Female |
| Under 5 Years | 0 (0.0%) | 0 (0.0%) |
| 5 to 17 Years | 51 (7.1%) | 75 (9.2%) |
| 18 to 34 Years | 78 (6.2%) | 80 (7.6%) |
| 35 to 64 Years | 266 (12.9%) | 194 (9.7%) |
| 65 to 74 Years | 146 (26.9%) | 96 (14.0%) |
| 75 Years and over | 131 (32.8%) | 230 (39.1%) |
Disability Class by Sex by Age in Bel Air
Disability Class: Hearing Difficulty
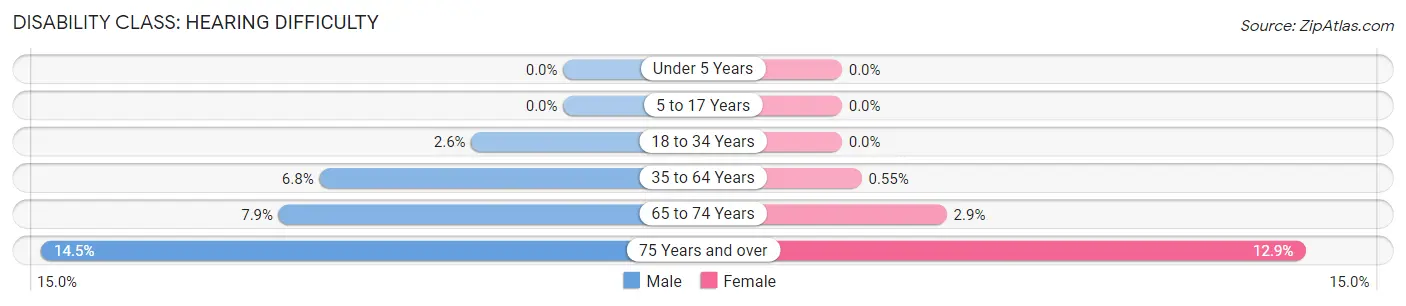
| Age Bracket | Male | Female |
| Under 5 Years | 0 (0.0%) | 0 (0.0%) |
| 5 to 17 Years | 0 (0.0%) | 0 (0.0%) |
| 18 to 34 Years | 32 (2.6%) | 0 (0.0%) |
| 35 to 64 Years | 140 (6.8%) | 11 (0.5%) |
| 65 to 74 Years | 43 (7.9%) | 20 (2.9%) |
| 75 Years and over | 58 (14.5%) | 76 (12.9%) |
Disability Class: Vision Difficulty
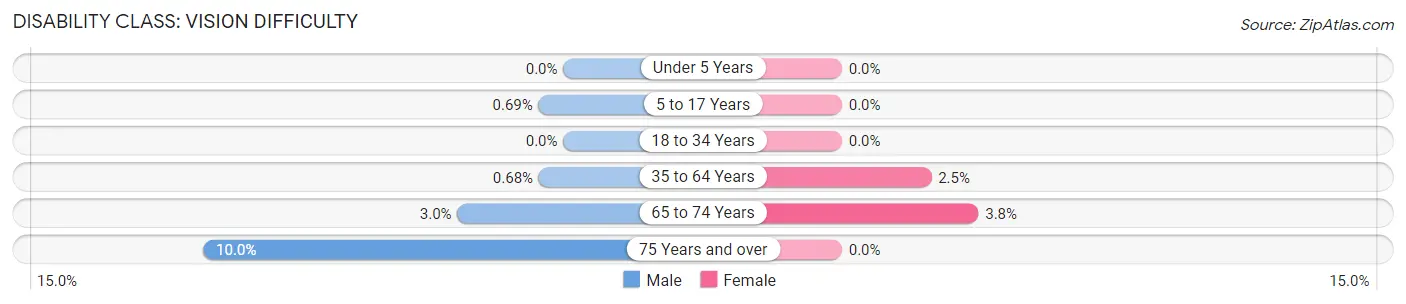
| Age Bracket | Male | Female |
| Under 5 Years | 0 (0.0%) | 0 (0.0%) |
| 5 to 17 Years | 5 (0.7%) | 0 (0.0%) |
| 18 to 34 Years | 0 (0.0%) | 0 (0.0%) |
| 35 to 64 Years | 14 (0.7%) | 50 (2.5%) |
| 65 to 74 Years | 16 (2.9%) | 26 (3.8%) |
| 75 Years and over | 40 (10.0%) | 0 (0.0%) |
Disability Class: Cognitive Difficulty
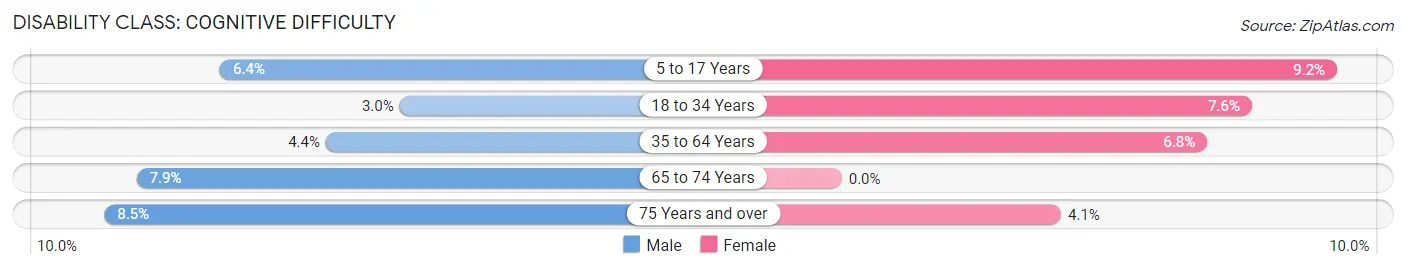
| Age Bracket | Male | Female |
| 5 to 17 Years | 46 (6.4%) | 75 (9.2%) |
| 18 to 34 Years | 38 (3.0%) | 80 (7.6%) |
| 35 to 64 Years | 91 (4.4%) | 136 (6.8%) |
| 65 to 74 Years | 43 (7.9%) | 0 (0.0%) |
| 75 Years and over | 34 (8.5%) | 24 (4.1%) |
Disability Class: Ambulatory Difficulty
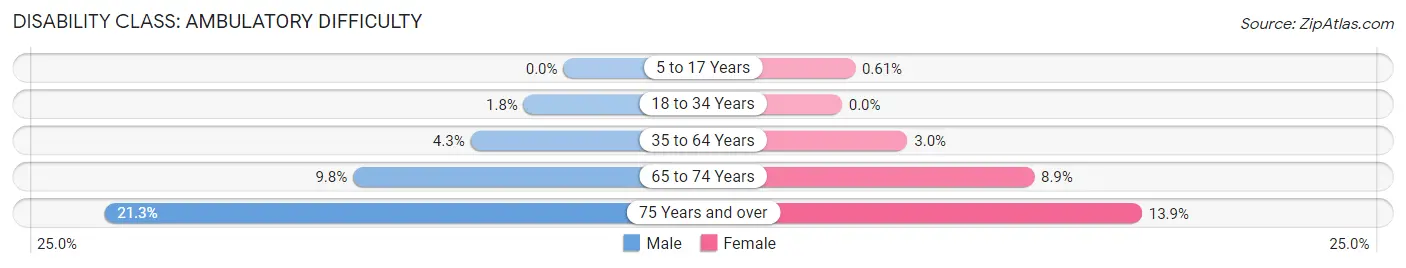
| Age Bracket | Male | Female |
| 5 to 17 Years | 0 (0.0%) | 5 (0.6%) |
| 18 to 34 Years | 23 (1.8%) | 0 (0.0%) |
| 35 to 64 Years | 89 (4.3%) | 61 (3.0%) |
| 65 to 74 Years | 53 (9.8%) | 61 (8.9%) |
| 75 Years and over | 85 (21.3%) | 82 (13.9%) |
Disability Class: Self-Care Difficulty
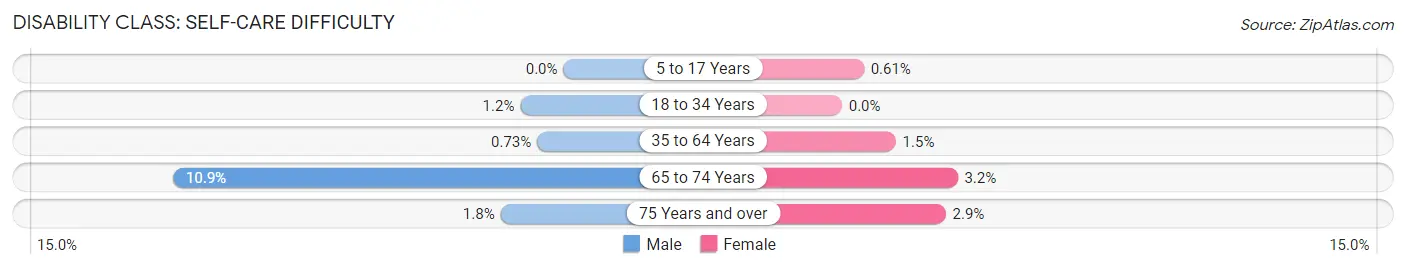
| Age Bracket | Male | Female |
| 5 to 17 Years | 0 (0.0%) | 5 (0.6%) |
| 18 to 34 Years | 15 (1.2%) | 0 (0.0%) |
| 35 to 64 Years | 15 (0.7%) | 30 (1.5%) |
| 65 to 74 Years | 59 (10.9%) | 22 (3.2%) |
| 75 Years and over | 7 (1.8%) | 17 (2.9%) |
Technology Access in Bel Air
Computing Device Access in Bel Air
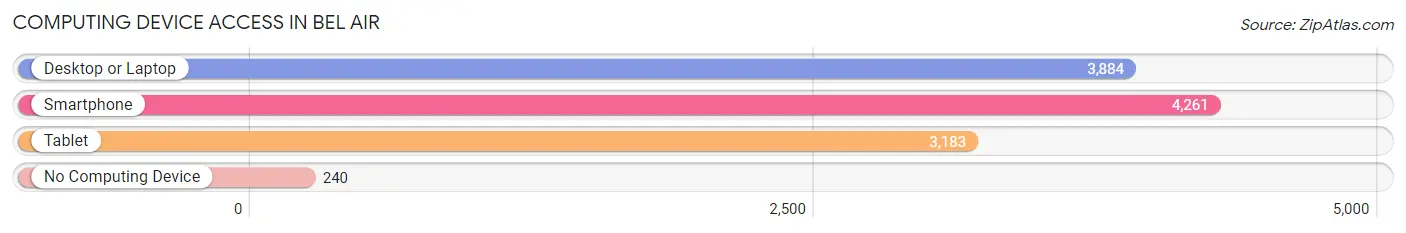
| Device Type | # Households | % Households |
| Desktop or Laptop | 3,884 | 79.3% |
| Smartphone | 4,261 | 87.0% |
| Tablet | 3,183 | 65.0% |
| No Computing Device | 240 | 4.9% |
| Total | 4,897 | 100.0% |
Internet Access in Bel Air
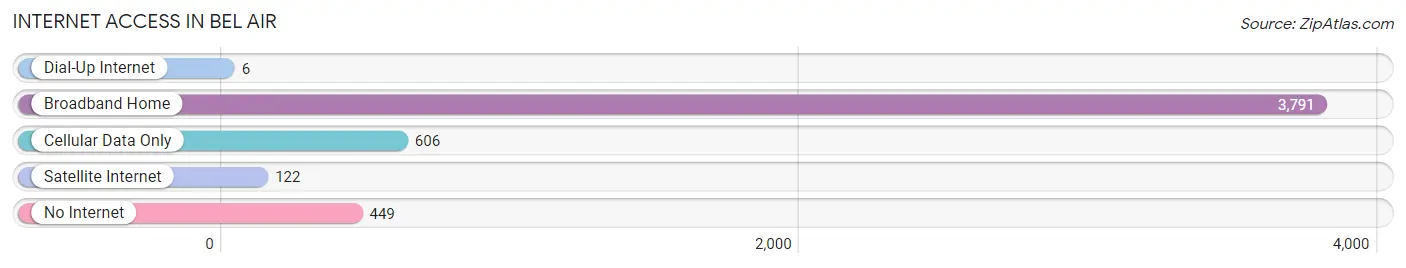
| Internet Type | # Households | % Households |
| Dial-Up Internet | 6 | 0.1% |
| Broadband Home | 3,791 | 77.4% |
| Cellular Data Only | 606 | 12.4% |
| Satellite Internet | 122 | 2.5% |
| No Internet | 449 | 9.2% |
| Total | 4,897 | 100.0% |
Bel Air Summary
Introduction
Bel Air, Maryland is a small town located in Harford County, Maryland. It is situated in the northeastern part of the state, about 25 miles northeast of Baltimore. The town is known for its historic downtown area, which is home to a variety of shops, restaurants, and other businesses. Bel Air is also home to a number of parks and recreational areas, including the Ma & Pa Trail, a popular hiking and biking trail. The town has a population of approximately 10,000 people, and is part of the Baltimore-Washington metropolitan area.
History
Bel Air was first settled in 1745 by a group of Quakers from Pennsylvania. The town was originally known as Scott’s Old Fields, and was later renamed Bel Air after the estate of a local landowner. The town was officially incorporated in 1874, and has since grown to become a thriving community.
Geography
Bel Air is located in Harford County, Maryland, about 25 miles northeast of Baltimore. The town is situated in the northeastern part of the state, and is bordered by the Susquehanna River to the north and the Chesapeake Bay to the east. The town is located in a rural area, and is surrounded by rolling hills and farmland.
Economy
Bel Air’s economy is largely based on agriculture and tourism. The town is home to a number of farms, which produce a variety of crops, including corn, soybeans, and wheat. The town is also home to a number of wineries, which produce a variety of wines. In addition, Bel Air is home to a number of businesses, including restaurants, retail stores, and professional services.
Demographics
As of the 2010 census, Bel Air had a population of 10,120 people. The town is predominantly white, with a population that is approximately 90% white. The town also has a significant Hispanic population, with approximately 8% of the population identifying as Hispanic or Latino. The median household income in Bel Air is $68,000, and the median home value is $250,000.
Conclusion
Bel Air, Maryland is a small town located in Harford County, Maryland. It is situated in the northeastern part of the state, about 25 miles northeast of Baltimore. The town is known for its historic downtown area, which is home to a variety of shops, restaurants, and other businesses. Bel Air is also home to a number of parks and recreational areas, including the Ma & Pa Trail, a popular hiking and biking trail. The town has a population of approximately 10,000 people, and is part of the Baltimore-Washington metropolitan area. The town’s economy is largely based on agriculture and tourism, and the town is predominantly white, with a significant Hispanic population.
Common Questions
What is Per Capita Income in Bel Air?
Per Capita income in Bel Air is $42,103.
What is the Median Family Income in Bel Air?
Median Family Income in Bel Air is $112,581.
What is the Median Household income in Bel Air?
Median Household Income in Bel Air is $66,950.
What is Income or Wage Gap in Bel Air?
Income or Wage Gap in Bel Air is 50.8%.
Women in Bel Air earn 49.2 cents for every dollar earned by a man.
What is Inequality or Gini Index in Bel Air?
Inequality or Gini Index in Bel Air is 0.44.
What is the Total Population of Bel Air?
Total Population of Bel Air is 10,630.
What is the Total Male Population of Bel Air?
Total Male Population of Bel Air is 5,215.
What is the Total Female Population of Bel Air?
Total Female Population of Bel Air is 5,415.
What is the Ratio of Males per 100 Females in Bel Air?
There are 96.31 Males per 100 Females in Bel Air.
What is the Ratio of Females per 100 Males in Bel Air?
There are 103.84 Females per 100 Males in Bel Air.
What is the Median Population Age in Bel Air?
Median Population Age in Bel Air is 41.4 Years.
What is the Average Family Size in Bel Air
Average Family Size in Bel Air is 3.1 People.
What is the Average Household Size in Bel Air
Average Household Size in Bel Air is 2.1 People.
How Large is the Labor Force in Bel Air?
There are 5,686 People in the Labor Forcein in Bel Air.
What is the Percentage of People in the Labor Force in Bel Air?
63.0% of People are in the Labor Force in Bel Air.
What is the Unemployment Rate in Bel Air?
Unemployment Rate in Bel Air is 5.0%.