Walkersville, MD Map & Demographics
Walkersville Map
Walkersville Overview
$56,711
PER CAPITA INCOME
$149,487
AVG FAMILY INCOME
$138,190
AVG HOUSEHOLD INCOME
29.4%
WAGE / INCOME GAP [ % ]
70.6¢/ $1
WAGE / INCOME GAP [ $ ]
0.35
INEQUALITY / GINI INDEX
6,239
TOTAL POPULATION
2,841
MALE POPULATION
3,398
FEMALE POPULATION
83.61
MALES / 100 FEMALES
119.61
FEMALES / 100 MALES
44.1
MEDIAN AGE
3.0
AVG FAMILY SIZE
2.5
AVG HOUSEHOLD SIZE
3,670
LABOR FORCE [ PEOPLE ]
72.1%
PERCENT IN LABOR FORCE
1.3%
UNEMPLOYMENT RATE
Walkersville Zip Codes
Walkersville Area Codes
Income in Walkersville
Income Overview in Walkersville
Per Capita Income in Walkersville is $56,711, while median incomes of families and households are $149,487 and $138,190 respectively.
| Characteristic | Number | Measure |
| Per Capita Income | 6,239 | $56,711 |
| Median Family Income | 1,792 | $149,487 |
| Mean Family Income | 1,792 | $165,070 |
| Median Household Income | 2,440 | $138,190 |
| Mean Household Income | 2,440 | $140,944 |
| Income Deficit | 1,792 | $0 |
| Wage / Income Gap (%) | 6,239 | 29.41% |
| Wage / Income Gap ($) | 6,239 | 70.59¢ per $1 |
| Gini / Inequality Index | 6,239 | 0.35 |
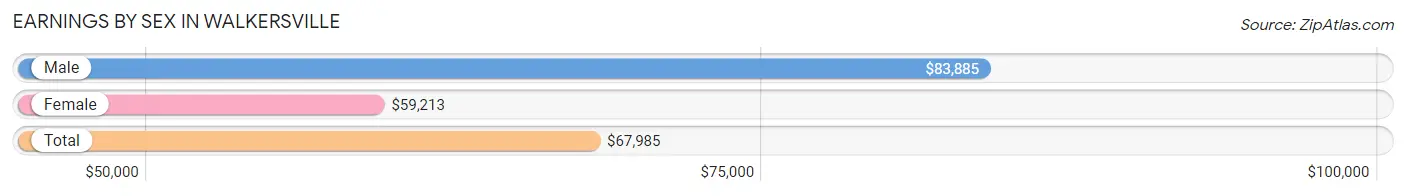
Earnings by Sex in Walkersville
Average Earnings in Walkersville are $67,985, $83,885 for men and $59,213 for women, a difference of 29.4%.
| Sex | Number | Average Earnings |
| Male | 1,991 (52.0%) | $83,885 |
| Female | 1,836 (48.0%) | $59,213 |
| Total | 3,827 (100.0%) | $67,985 |
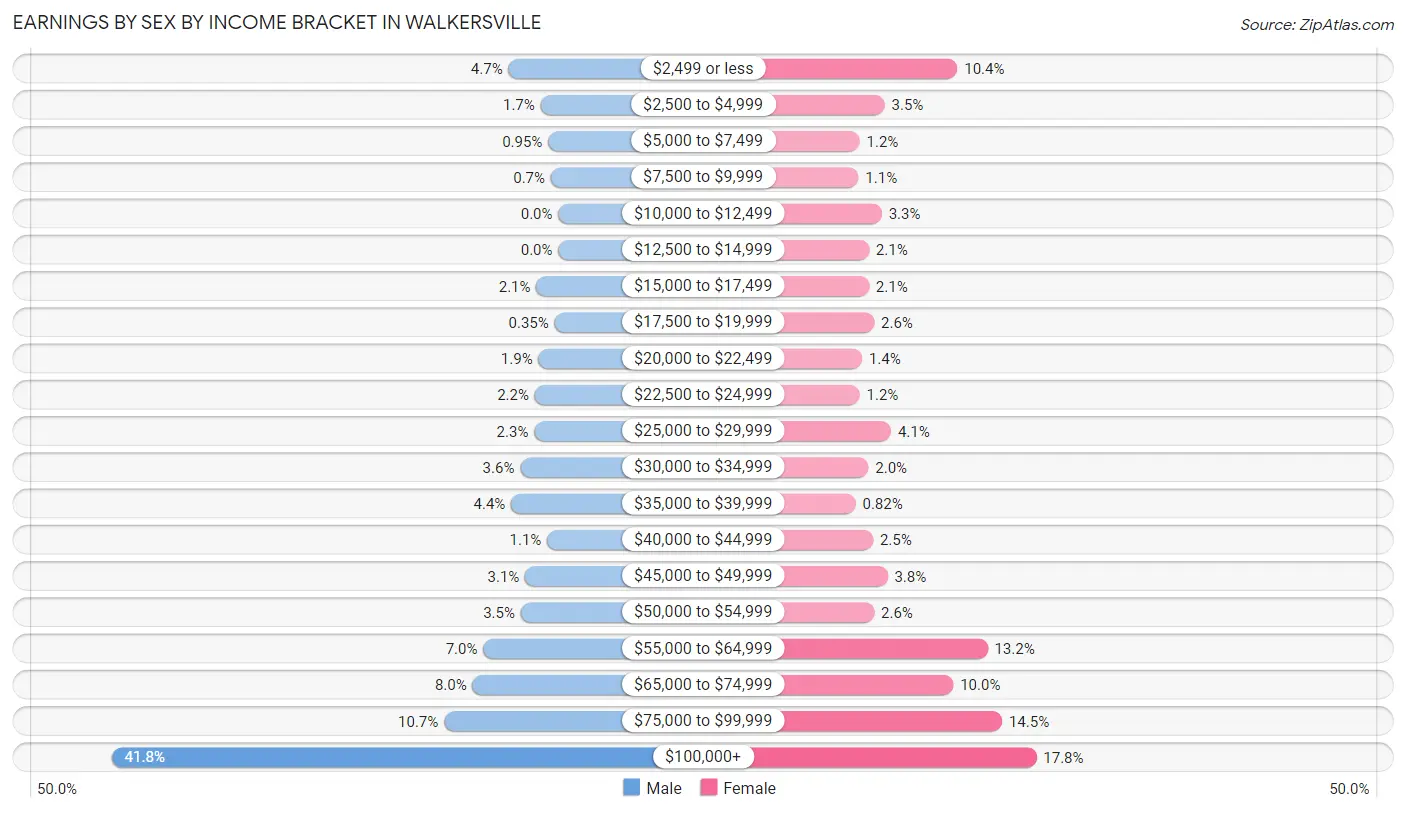
Earnings by Sex by Income Bracket in Walkersville
The most common earnings brackets in Walkersville are $100,000+ for men (833 | 41.8%) and $100,000+ for women (326 | 17.8%).
| Income | Male | Female |
| $2,499 or less | 93 (4.7%) | 190 (10.3%) |
| $2,500 to $4,999 | 33 (1.7%) | 65 (3.5%) |
| $5,000 to $7,499 | 19 (0.9%) | 22 (1.2%) |
| $7,500 to $9,999 | 14 (0.7%) | 20 (1.1%) |
| $10,000 to $12,499 | 0 (0.0%) | 60 (3.3%) |
| $12,500 to $14,999 | 0 (0.0%) | 38 (2.1%) |
| $15,000 to $17,499 | 41 (2.1%) | 38 (2.1%) |
| $17,500 to $19,999 | 7 (0.4%) | 47 (2.6%) |
| $20,000 to $22,499 | 37 (1.9%) | 26 (1.4%) |
| $22,500 to $24,999 | 44 (2.2%) | 22 (1.2%) |
| $25,000 to $29,999 | 45 (2.3%) | 76 (4.1%) |
| $30,000 to $34,999 | 71 (3.6%) | 37 (2.0%) |
| $35,000 to $39,999 | 88 (4.4%) | 15 (0.8%) |
| $40,000 to $44,999 | 21 (1.1%) | 45 (2.5%) |
| $45,000 to $49,999 | 62 (3.1%) | 70 (3.8%) |
| $50,000 to $54,999 | 70 (3.5%) | 47 (2.6%) |
| $55,000 to $64,999 | 140 (7.0%) | 242 (13.2%) |
| $65,000 to $74,999 | 160 (8.0%) | 183 (10.0%) |
| $75,000 to $99,999 | 213 (10.7%) | 267 (14.5%) |
| $100,000+ | 833 (41.8%) | 326 (17.8%) |
| Total | 1,991 (100.0%) | 1,836 (100.0%) |
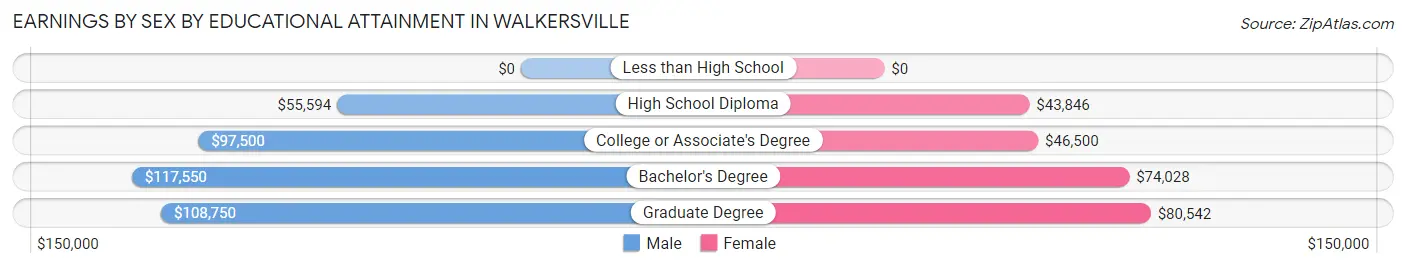
Earnings by Sex by Educational Attainment in Walkersville
Average earnings in Walkersville are $97,897 for men and $63,339 for women, a difference of 35.3%. Men with an educational attainment of bachelor's degree enjoy the highest average annual earnings of $117,550, while those with high school diploma education earn the least with $55,594. Women with an educational attainment of graduate degree earn the most with the average annual earnings of $80,542, while those with high school diploma education have the smallest earnings of $43,846.
| Educational Attainment | Male Income | Female Income |
| Less than High School | - | - |
| High School Diploma | $55,594 | $43,846 |
| College or Associate's Degree | $97,500 | $46,500 |
| Bachelor's Degree | $117,550 | $74,028 |
| Graduate Degree | $108,750 | $80,542 |
| Total | $97,897 | $63,339 |
Family Income in Walkersville
Family Income Brackets in Walkersville
According to the Walkersville family income data, there are 616 families falling into the $100,000 to $149,999 income range, which is the most common income bracket and makes up 34.4% of all families.
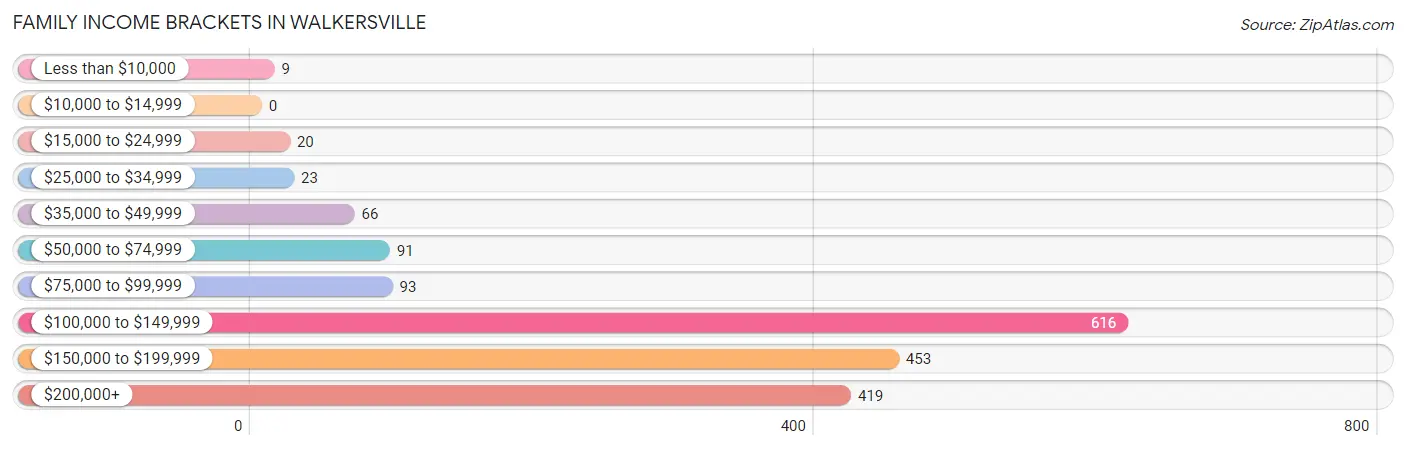
| Income Bracket | # Families | % Families |
| Less than $10,000 | 9 | 0.5% |
| $10,000 to $14,999 | 0 | 0.0% |
| $15,000 to $24,999 | 20 | 1.1% |
| $25,000 to $34,999 | 23 | 1.3% |
| $35,000 to $49,999 | 66 | 3.7% |
| $50,000 to $74,999 | 91 | 5.1% |
| $75,000 to $99,999 | 93 | 5.2% |
| $100,000 to $149,999 | 616 | 34.4% |
| $150,000 to $199,999 | 453 | 25.3% |
| $200,000+ | 419 | 23.4% |
Family Income by Famaliy Size in Walkersville
3-person families (316 | 17.6%) account for the highest median family income in Walkersville with $179,286 per family, while 2-person families (878 | 49.0%) have the highest median income of $72,536 per family member.
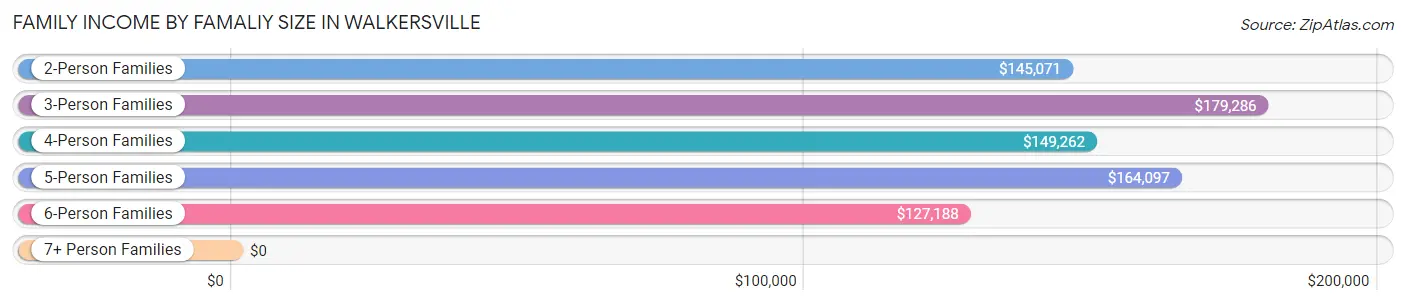
| Income Bracket | # Families | Median Income |
| 2-Person Families | 878 (49.0%) | $145,071 |
| 3-Person Families | 316 (17.6%) | $179,286 |
| 4-Person Families | 435 (24.3%) | $149,262 |
| 5-Person Families | 110 (6.1%) | $164,097 |
| 6-Person Families | 47 (2.6%) | $127,188 |
| 7+ Person Families | 6 (0.3%) | $0 |
| Total | 1,792 (100.0%) | $149,487 |
Family Income by Number of Earners in Walkersville
The median family income in Walkersville is $149,487, with families comprising 2 earners (916) having the highest median family income of $155,000, while families with no earners (119) have the lowest median family income of $49,879, accounting for 51.1% and 6.6% of families, respectively.
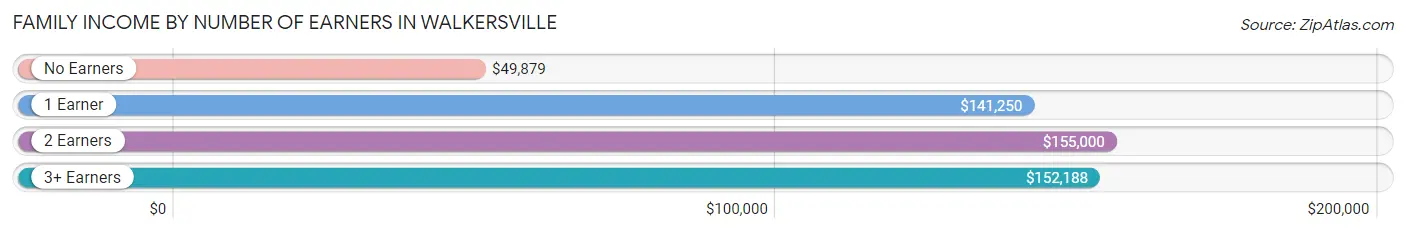
| Number of Earners | # Families | Median Income |
| No Earners | 119 (6.6%) | $49,879 |
| 1 Earner | 434 (24.2%) | $141,250 |
| 2 Earners | 916 (51.1%) | $155,000 |
| 3+ Earners | 323 (18.0%) | $152,188 |
| Total | 1,792 (100.0%) | $149,487 |
Household Income in Walkersville
Household Income Brackets in Walkersville
With 688 households falling in the category, the $100,000 to $149,999 income range is the most frequent in Walkersville, accounting for 28.2% of all households.
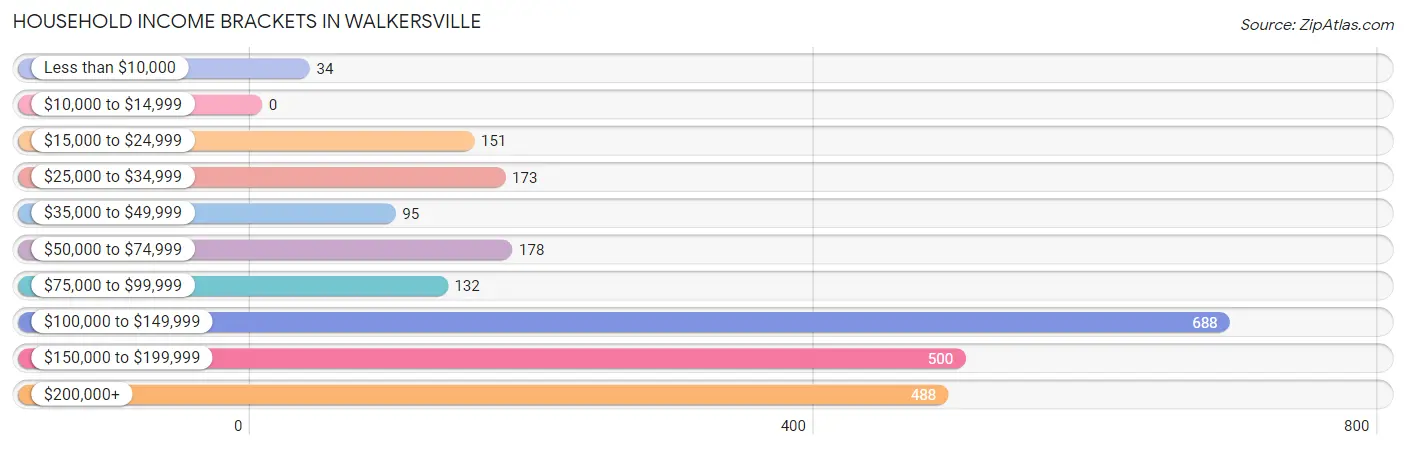
| Income Bracket | # Households | % Households |
| Less than $10,000 | 34 | 1.4% |
| $10,000 to $14,999 | 0 | 0.0% |
| $15,000 to $24,999 | 151 | 6.2% |
| $25,000 to $34,999 | 173 | 7.1% |
| $35,000 to $49,999 | 95 | 3.9% |
| $50,000 to $74,999 | 178 | 7.3% |
| $75,000 to $99,999 | 132 | 5.4% |
| $100,000 to $149,999 | 688 | 28.2% |
| $150,000 to $199,999 | 500 | 20.5% |
| $200,000+ | 488 | 20.0% |
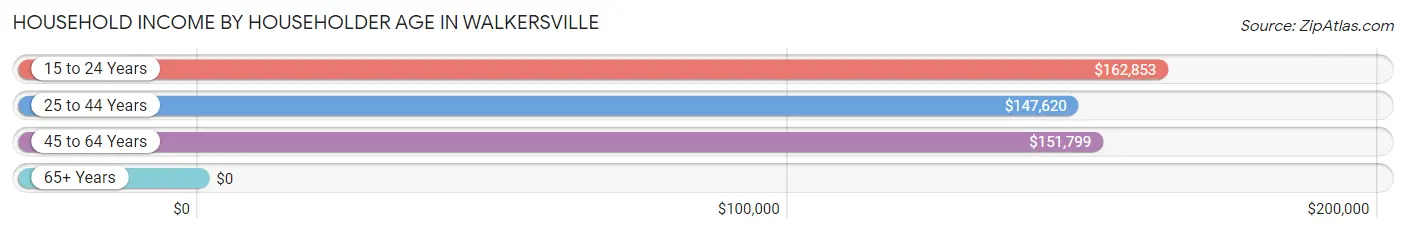
Household Income by Householder Age in Walkersville
The median household income in Walkersville is $138,190, with the highest median household income of $162,853 found in the 15 to 24 years age bracket for the primary householder. A total of 67 households (2.8%) fall into this category. Meanwhile, the 65+ years age bracket for the primary householder has the lowest median household income of $0, with 726 households (29.7%) in this group.
| Income Bracket | # Households | Median Income |
| 15 to 24 Years | 67 (2.8%) | $162,853 |
| 25 to 44 Years | 616 (25.3%) | $147,620 |
| 45 to 64 Years | 1,031 (42.2%) | $151,799 |
| 65+ Years | 726 (29.7%) | $0 |
| Total | 2,440 (100.0%) | $138,190 |
Poverty in Walkersville
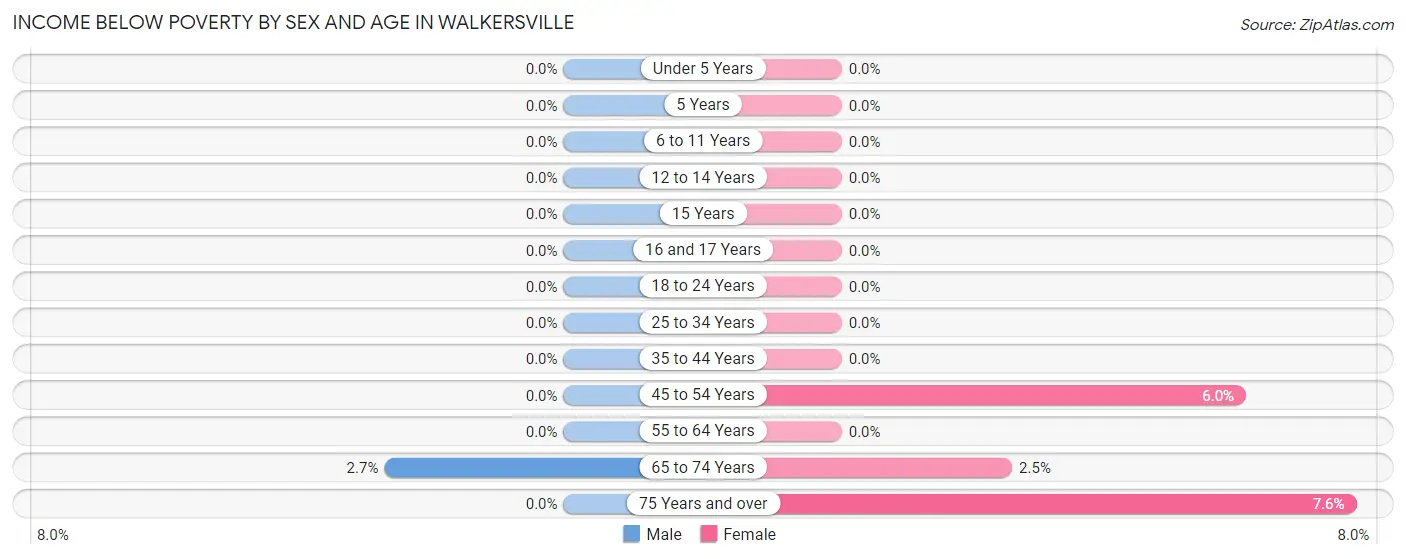
Income Below Poverty by Sex and Age in Walkersville
With 0.3% poverty level for males and 1.8% for females among the residents of Walkersville, 65 to 74 year old males and 75 year old and over females are the most vulnerable to poverty, with 9 males (2.7%) and 24 females (7.6%) in their respective age groups living below the poverty level.
| Age Bracket | Male | Female |
| Under 5 Years | 0 (0.0%) | 0 (0.0%) |
| 5 Years | 0 (0.0%) | 0 (0.0%) |
| 6 to 11 Years | 0 (0.0%) | 0 (0.0%) |
| 12 to 14 Years | 0 (0.0%) | 0 (0.0%) |
| 15 Years | 0 (0.0%) | 0 (0.0%) |
| 16 and 17 Years | 0 (0.0%) | 0 (0.0%) |
| 18 to 24 Years | 0 (0.0%) | 0 (0.0%) |
| 25 to 34 Years | 0 (0.0%) | 0 (0.0%) |
| 35 to 44 Years | 0 (0.0%) | 0 (0.0%) |
| 45 to 54 Years | 0 (0.0%) | 28 (6.0%) |
| 55 to 64 Years | 0 (0.0%) | 0 (0.0%) |
| 65 to 74 Years | 9 (2.7%) | 9 (2.5%) |
| 75 Years and over | 0 (0.0%) | 24 (7.6%) |
| Total | 9 (0.3%) | 61 (1.8%) |
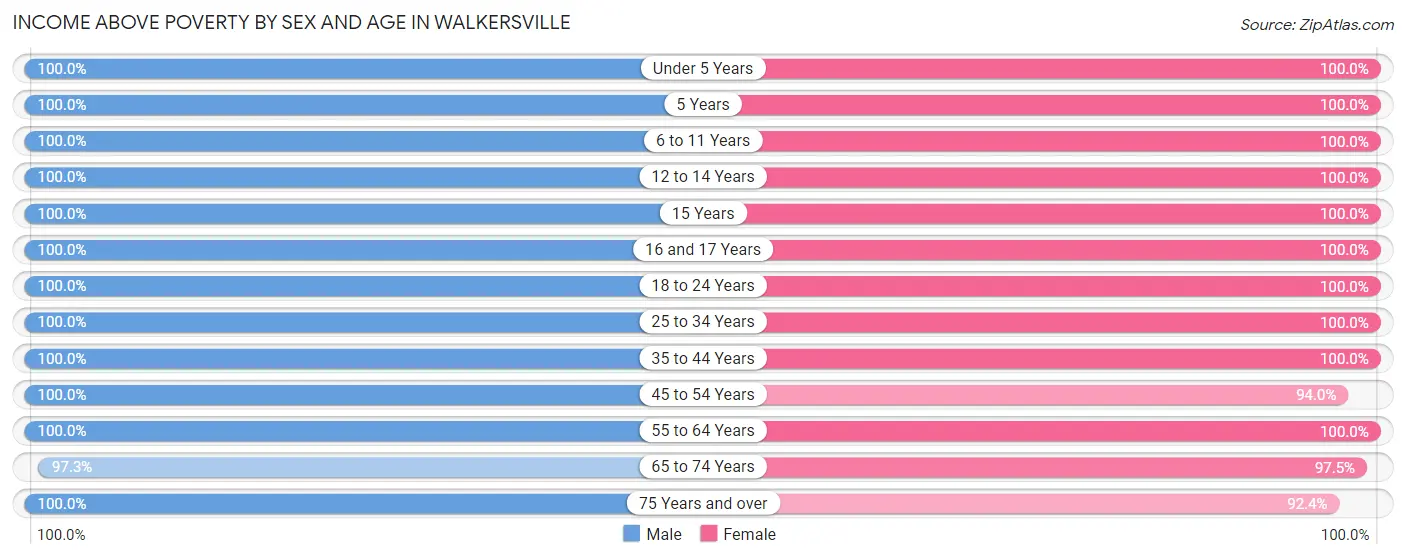
Income Above Poverty by Sex and Age in Walkersville
According to the poverty statistics in Walkersville, males aged under 5 years and females aged under 5 years are the age groups that are most secure financially, with 100.0% of males and 100.0% of females in these age groups living above the poverty line.
| Age Bracket | Male | Female |
| Under 5 Years | 87 (100.0%) | 179 (100.0%) |
| 5 Years | 41 (100.0%) | 21 (100.0%) |
| 6 to 11 Years | 184 (100.0%) | 184 (100.0%) |
| 12 to 14 Years | 129 (100.0%) | 180 (100.0%) |
| 15 Years | 83 (100.0%) | 61 (100.0%) |
| 16 and 17 Years | 56 (100.0%) | 89 (100.0%) |
| 18 to 24 Years | 194 (100.0%) | 190 (100.0%) |
| 25 to 34 Years | 226 (100.0%) | 344 (100.0%) |
| 35 to 44 Years | 454 (100.0%) | 537 (100.0%) |
| 45 to 54 Years | 478 (100.0%) | 439 (94.0%) |
| 55 to 64 Years | 468 (100.0%) | 409 (100.0%) |
| 65 to 74 Years | 329 (97.3%) | 347 (97.5%) |
| 75 Years and over | 78 (100.0%) | 290 (92.4%) |
| Total | 2,807 (99.7%) | 3,270 (98.2%) |
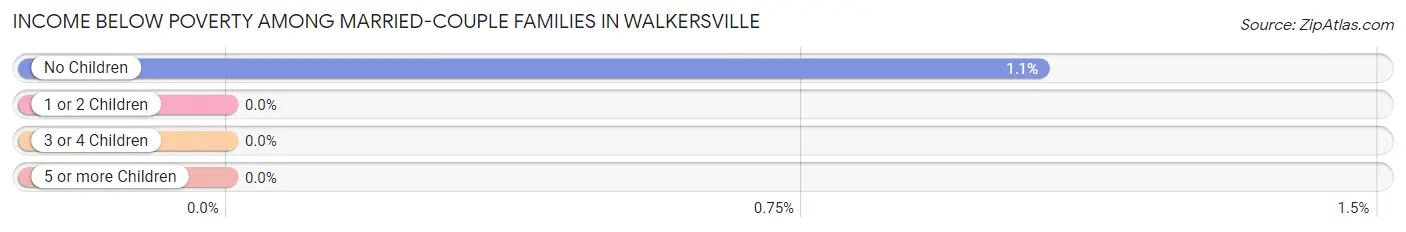
Income Below Poverty Among Married-Couple Families in Walkersville
The poverty statistics for married-couple families in Walkersville show that 0.6% or 9 of the total 1,533 families live below the poverty line. Families with no children have the highest poverty rate of 1.1%, comprising of 9 families. On the other hand, families with 1 or 2 children have the lowest poverty rate of 0.0%, which includes 0 families.
| Children | Above Poverty | Below Poverty |
| No Children | 838 (98.9%) | 9 (1.1%) |
| 1 or 2 Children | 609 (100.0%) | 0 (0.0%) |
| 3 or 4 Children | 77 (100.0%) | 0 (0.0%) |
| 5 or more Children | 0 (0.0%) | 0 (0.0%) |
| Total | 1,524 (99.4%) | 9 (0.6%) |
Income Below Poverty Among Single-Parent Households in Walkersville
| Children | Single Father | Single Mother |
| No Children | 0 (0.0%) | 0 (0.0%) |
| 1 or 2 Children | 0 (0.0%) | 0 (0.0%) |
| 3 or 4 Children | 0 (0.0%) | 0 (0.0%) |
| 5 or more Children | 0 (0.0%) | 0 (0.0%) |
| Total | 0 (0.0%) | 0 (0.0%) |
Income Below Poverty Among Married-Couple vs Single-Parent Households in Walkersville
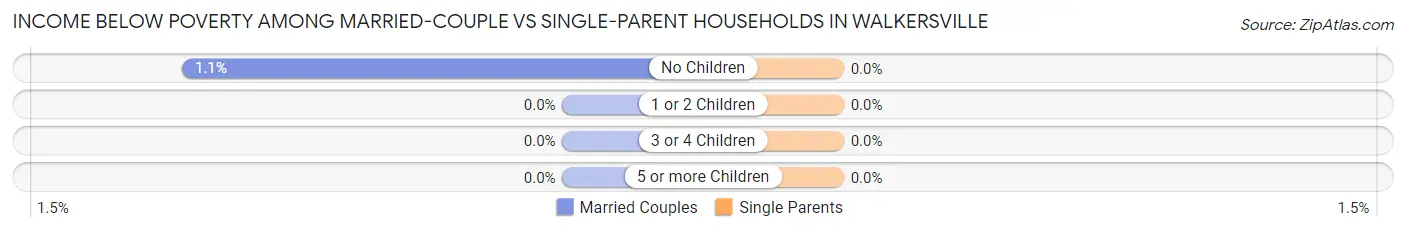
| Children | Married-Couple Families | Single-Parent Households |
| No Children | 9 (1.1%) | 0 (0.0%) |
| 1 or 2 Children | 0 (0.0%) | 0 (0.0%) |
| 3 or 4 Children | 0 (0.0%) | 0 (0.0%) |
| 5 or more Children | 0 (0.0%) | 0 (0.0%) |
| Total | 9 (0.6%) | 0 (0.0%) |
Race in Walkersville
The most populous races in Walkersville are White / Caucasian (5,107 | 81.9%), Two or more Races (492 | 7.9%), and Black / African American (367 | 5.9%).
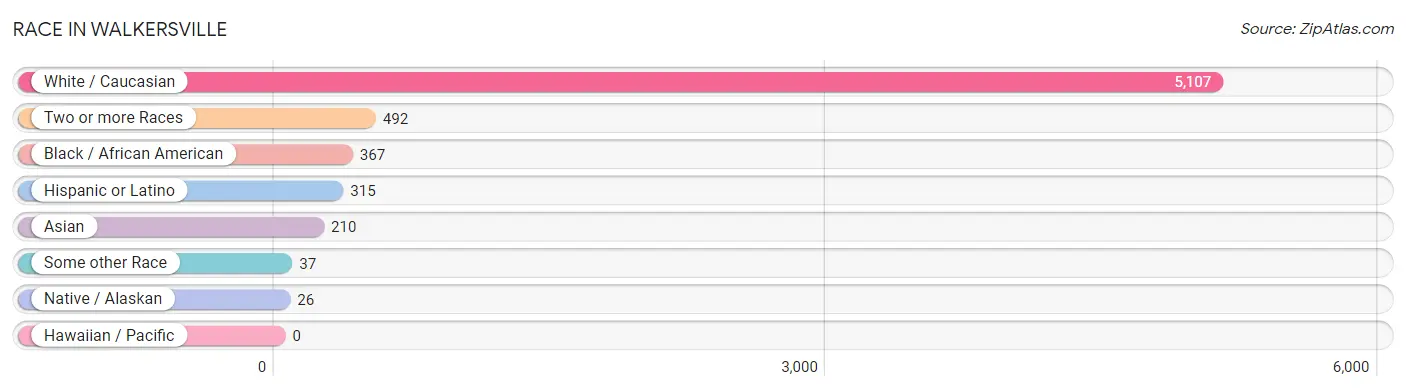
| Race | # Population | % Population |
| Asian | 210 | 3.4% |
| Black / African American | 367 | 5.9% |
| Hawaiian / Pacific | 0 | 0.0% |
| Hispanic or Latino | 315 | 5.1% |
| Native / Alaskan | 26 | 0.4% |
| White / Caucasian | 5,107 | 81.9% |
| Two or more Races | 492 | 7.9% |
| Some other Race | 37 | 0.6% |
| Total | 6,239 | 100.0% |
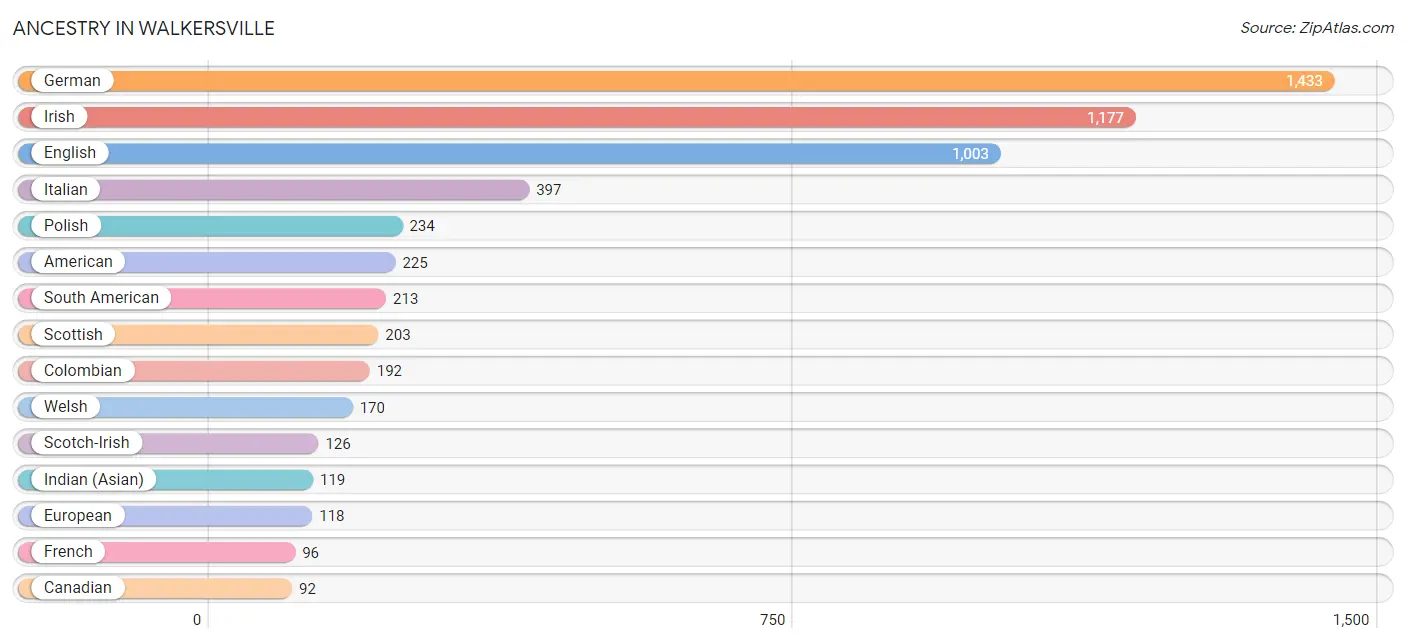
Ancestry in Walkersville
The most populous ancestries reported in Walkersville are German (1,433 | 23.0%), Irish (1,177 | 18.9%), English (1,003 | 16.1%), Italian (397 | 6.4%), and Polish (234 | 3.7%), together accounting for 68.0% of all Walkersville residents.
| Ancestry | # Population | % Population |
| American | 225 | 3.6% |
| Arab | 15 | 0.2% |
| Australian | 29 | 0.5% |
| Austrian | 24 | 0.4% |
| British | 36 | 0.6% |
| Bulgarian | 7 | 0.1% |
| Burmese | 13 | 0.2% |
| Canadian | 92 | 1.5% |
| Central American | 26 | 0.4% |
| Cherokee | 22 | 0.4% |
| Colombian | 192 | 3.1% |
| Croatian | 11 | 0.2% |
| Czech | 9 | 0.1% |
| Danish | 11 | 0.2% |
| Dutch | 69 | 1.1% |
| Eastern European | 26 | 0.4% |
| English | 1,003 | 16.1% |
| European | 118 | 1.9% |
| French | 96 | 1.5% |
| French Canadian | 23 | 0.4% |
| German | 1,433 | 23.0% |
| Greek | 43 | 0.7% |
| Hungarian | 10 | 0.2% |
| Icelander | 7 | 0.1% |
| Indian (Asian) | 119 | 1.9% |
| Irish | 1,177 | 18.9% |
| Italian | 397 | 6.4% |
| Korean | 32 | 0.5% |
| Lebanese | 9 | 0.1% |
| Lithuanian | 15 | 0.2% |
| Mexican | 29 | 0.5% |
| Nigerian | 5 | 0.1% |
| Northern European | 12 | 0.2% |
| Norwegian | 22 | 0.4% |
| Pakistani | 64 | 1.0% |
| Peruvian | 21 | 0.3% |
| Polish | 234 | 3.7% |
| Portuguese | 31 | 0.5% |
| Puerto Rican | 41 | 0.7% |
| Russian | 64 | 1.0% |
| Salvadoran | 26 | 0.4% |
| Scandinavian | 8 | 0.1% |
| Scotch-Irish | 126 | 2.0% |
| Scottish | 203 | 3.3% |
| Serbian | 12 | 0.2% |
| Slavic | 12 | 0.2% |
| South American | 213 | 3.4% |
| Spanish | 6 | 0.1% |
| Spanish American Indian | 20 | 0.3% |
| Subsaharan African | 5 | 0.1% |
| Swedish | 38 | 0.6% |
| Syrian | 6 | 0.1% |
| Thai | 52 | 0.8% |
| Ukrainian | 18 | 0.3% |
| Welsh | 170 | 2.7% | View All 55 Rows |
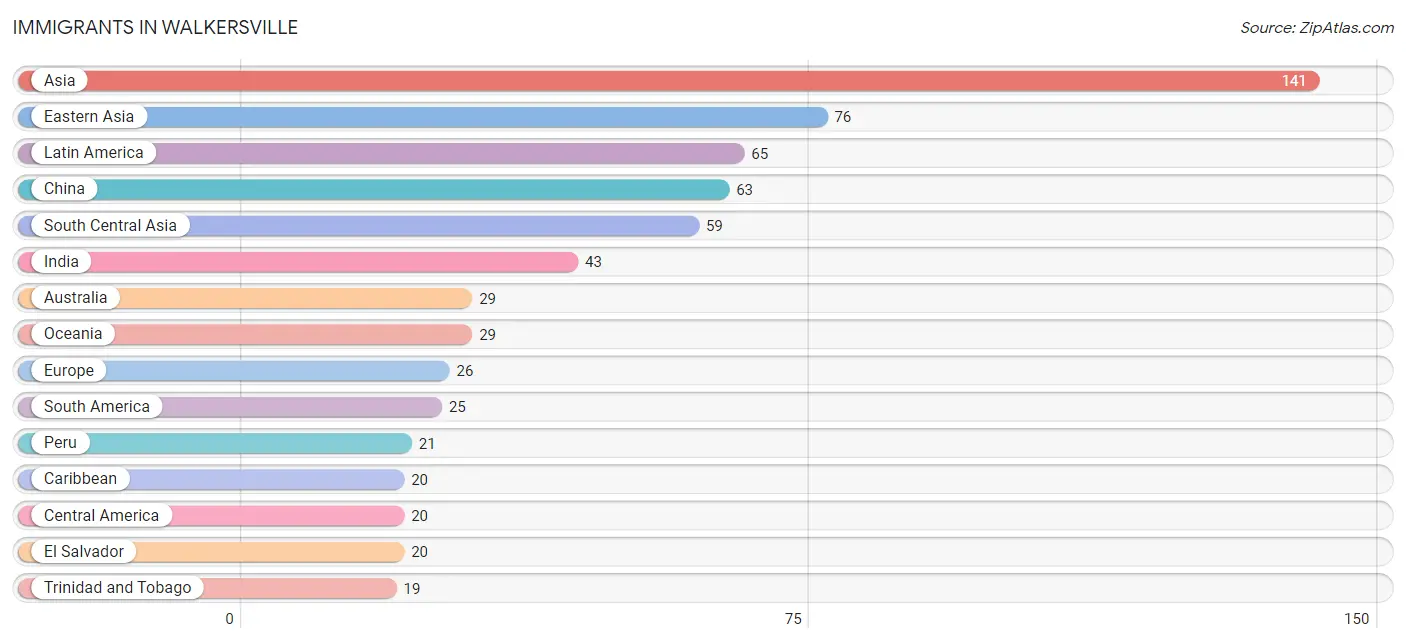
Immigrants in Walkersville
The most numerous immigrant groups reported in Walkersville came from Asia (141 | 2.3%), Eastern Asia (76 | 1.2%), Latin America (65 | 1.0%), China (63 | 1.0%), and South Central Asia (59 | 0.9%), together accounting for 6.5% of all Walkersville residents.
| Immigration Origin | # Population | % Population |
| Asia | 141 | 2.3% |
| Australia | 29 | 0.5% |
| Bulgaria | 7 | 0.1% |
| Caribbean | 20 | 0.3% |
| Central America | 20 | 0.3% |
| China | 63 | 1.0% |
| Colombia | 4 | 0.1% |
| Dominican Republic | 1 | 0.0% |
| Eastern Asia | 76 | 1.2% |
| Eastern Europe | 14 | 0.2% |
| El Salvador | 20 | 0.3% |
| Europe | 26 | 0.4% |
| India | 43 | 0.7% |
| Korea | 13 | 0.2% |
| Latin America | 65 | 1.0% |
| Nepal | 16 | 0.3% |
| Northern Europe | 12 | 0.2% |
| Oceania | 29 | 0.5% |
| Peru | 21 | 0.3% |
| South America | 25 | 0.4% |
| South Central Asia | 59 | 0.9% |
| Syria | 6 | 0.1% |
| Trinidad and Tobago | 19 | 0.3% |
| Ukraine | 7 | 0.1% |
| Western Asia | 6 | 0.1% | View All 25 Rows |
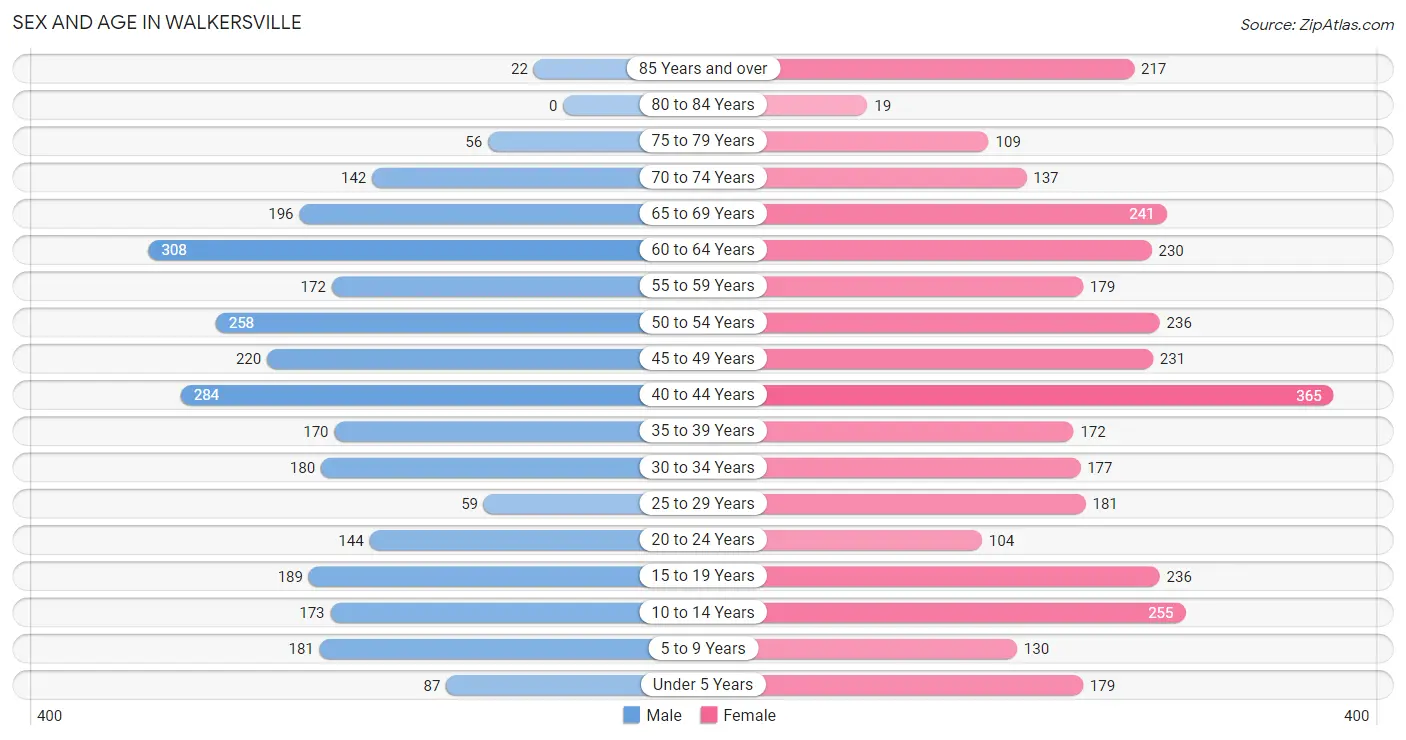
Sex and Age in Walkersville
Sex and Age in Walkersville
The most populous age groups in Walkersville are 60 to 64 Years (308 | 10.8%) for men and 40 to 44 Years (365 | 10.7%) for women.
| Age Bracket | Male | Female |
| Under 5 Years | 87 (3.1%) | 179 (5.3%) |
| 5 to 9 Years | 181 (6.4%) | 130 (3.8%) |
| 10 to 14 Years | 173 (6.1%) | 255 (7.5%) |
| 15 to 19 Years | 189 (6.7%) | 236 (7.0%) |
| 20 to 24 Years | 144 (5.1%) | 104 (3.1%) |
| 25 to 29 Years | 59 (2.1%) | 181 (5.3%) |
| 30 to 34 Years | 180 (6.3%) | 177 (5.2%) |
| 35 to 39 Years | 170 (6.0%) | 172 (5.1%) |
| 40 to 44 Years | 284 (10.0%) | 365 (10.7%) |
| 45 to 49 Years | 220 (7.7%) | 231 (6.8%) |
| 50 to 54 Years | 258 (9.1%) | 236 (7.0%) |
| 55 to 59 Years | 172 (6.0%) | 179 (5.3%) |
| 60 to 64 Years | 308 (10.8%) | 230 (6.8%) |
| 65 to 69 Years | 196 (6.9%) | 241 (7.1%) |
| 70 to 74 Years | 142 (5.0%) | 137 (4.0%) |
| 75 to 79 Years | 56 (2.0%) | 109 (3.2%) |
| 80 to 84 Years | 0 (0.0%) | 19 (0.6%) |
| 85 Years and over | 22 (0.8%) | 217 (6.4%) |
| Total | 2,841 (100.0%) | 3,398 (100.0%) |
Families and Households in Walkersville
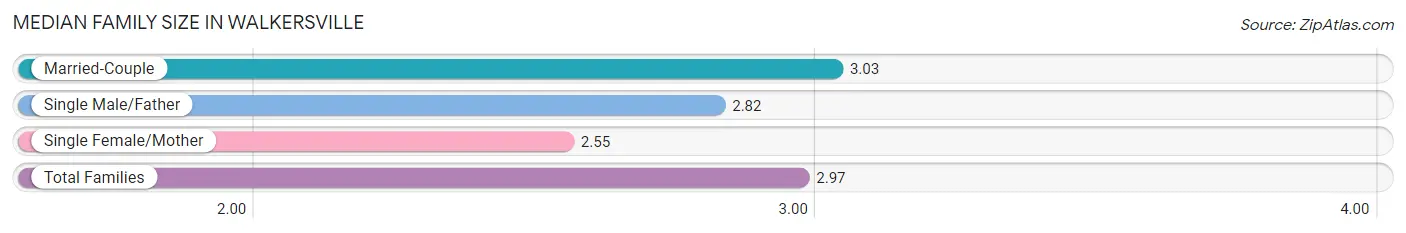
Median Family Size in Walkersville
The median family size in Walkersville is 2.97 persons per family, with married-couple families (1,533 | 85.6%) accounting for the largest median family size of 3.03 persons per family. On the other hand, single female/mother families (161 | 9.0%) represent the smallest median family size with 2.55 persons per family.
| Family Type | # Families | Family Size |
| Married-Couple | 1,533 (85.6%) | 3.03 |
| Single Male/Father | 98 (5.5%) | 2.82 |
| Single Female/Mother | 161 (9.0%) | 2.55 |
| Total Families | 1,792 (100.0%) | 2.97 |
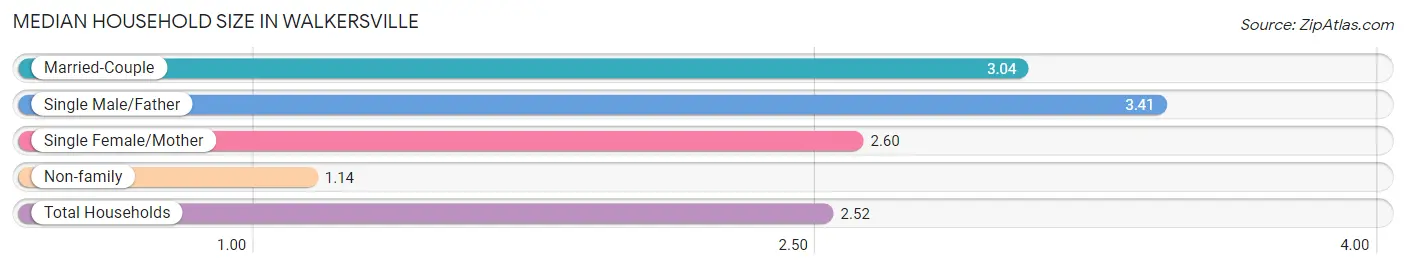
Median Household Size in Walkersville
The median household size in Walkersville is 2.52 persons per household, with single male/father households (98 | 4.0%) accounting for the largest median household size of 3.41 persons per household. non-family households (648 | 26.6%) represent the smallest median household size with 1.14 persons per household.
| Household Type | # Households | Household Size |
| Married-Couple | 1,533 (62.8%) | 3.04 |
| Single Male/Father | 98 (4.0%) | 3.41 |
| Single Female/Mother | 161 (6.6%) | 2.60 |
| Non-family | 648 (26.6%) | 1.14 |
| Total Households | 2,440 (100.0%) | 2.52 |
Household Size by Marriage Status in Walkersville
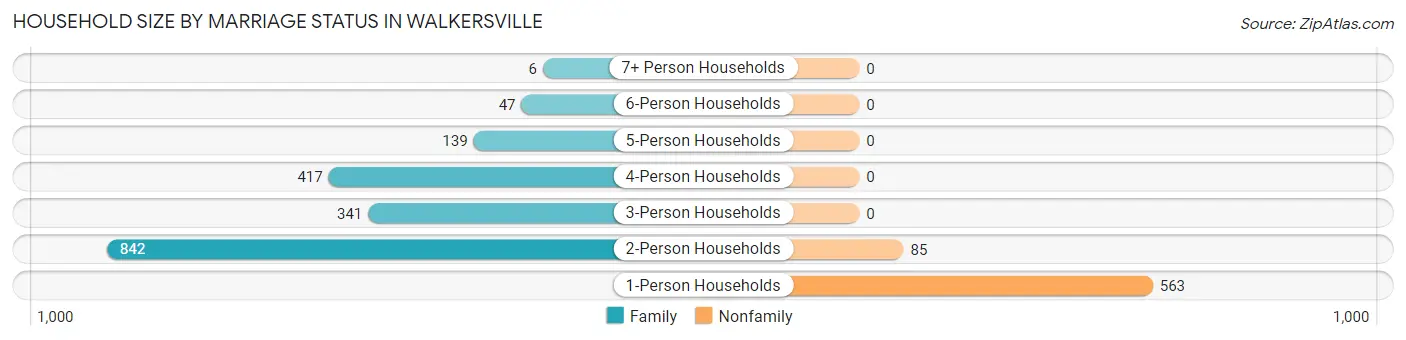
Out of a total of 2,440 households in Walkersville, 1,792 (73.4%) are family households, while 648 (26.6%) are nonfamily households. The most numerous type of family households are 2-person households, comprising 842, and the most common type of nonfamily households are 1-person households, comprising 563.
| Household Size | Family Households | Nonfamily Households |
| 1-Person Households | - | 563 (23.1%) |
| 2-Person Households | 842 (34.5%) | 85 (3.5%) |
| 3-Person Households | 341 (14.0%) | 0 (0.0%) |
| 4-Person Households | 417 (17.1%) | 0 (0.0%) |
| 5-Person Households | 139 (5.7%) | 0 (0.0%) |
| 6-Person Households | 47 (1.9%) | 0 (0.0%) |
| 7+ Person Households | 6 (0.3%) | 0 (0.0%) |
| Total | 1,792 (73.4%) | 648 (26.6%) |
Female Fertility in Walkersville
Fertility by Age in Walkersville
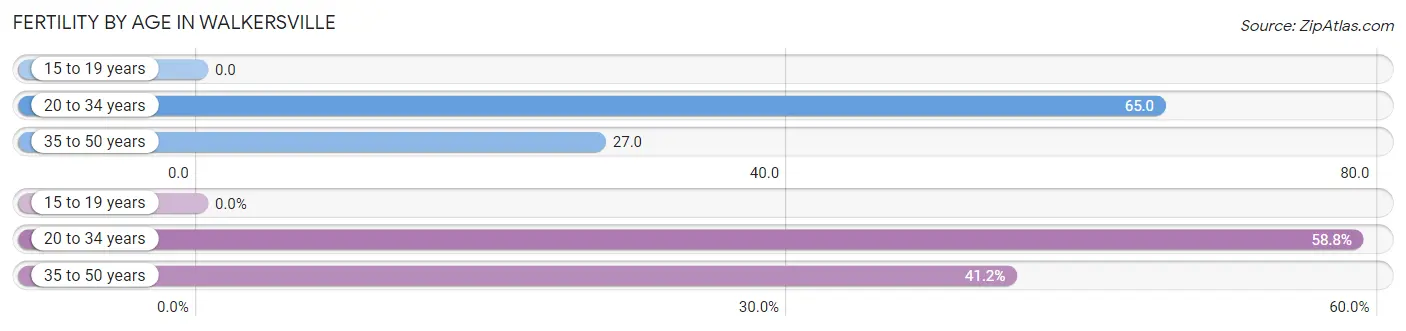
Average fertility rate in Walkersville is 35.0 births per 1,000 women. Women in the age bracket of 20 to 34 years have the highest fertility rate with 65.0 births per 1,000 women. Women in the age bracket of 20 to 34 years acount for 58.8% of all women with births.
| Age Bracket | Women with Births | Births / 1,000 Women |
| 15 to 19 years | 0 (0.0%) | 0.0 |
| 20 to 34 years | 30 (58.8%) | 65.0 |
| 35 to 50 years | 21 (41.2%) | 27.0 |
| Total | 51 (100.0%) | 35.0 |
Fertility by Age by Marriage Status in Walkersville
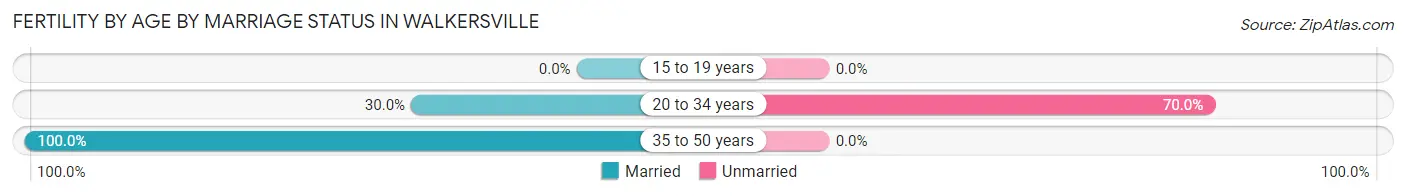
58.8% of women with births (51) in Walkersville are married. The highest percentage of unmarried women with births falls into 20 to 34 years age bracket with 70.0% of them unmarried at the time of birth, while the lowest percentage of unmarried women with births belong to 35 to 50 years age bracket with 0.0% of them unmarried.
| Age Bracket | Married | Unmarried |
| 15 to 19 years | 0 (0.0%) | 0 (0.0%) |
| 20 to 34 years | 9 (30.0%) | 21 (70.0%) |
| 35 to 50 years | 21 (100.0%) | 0 (0.0%) |
| Total | 30 (58.8%) | 21 (41.2%) |
Fertility by Education in Walkersville
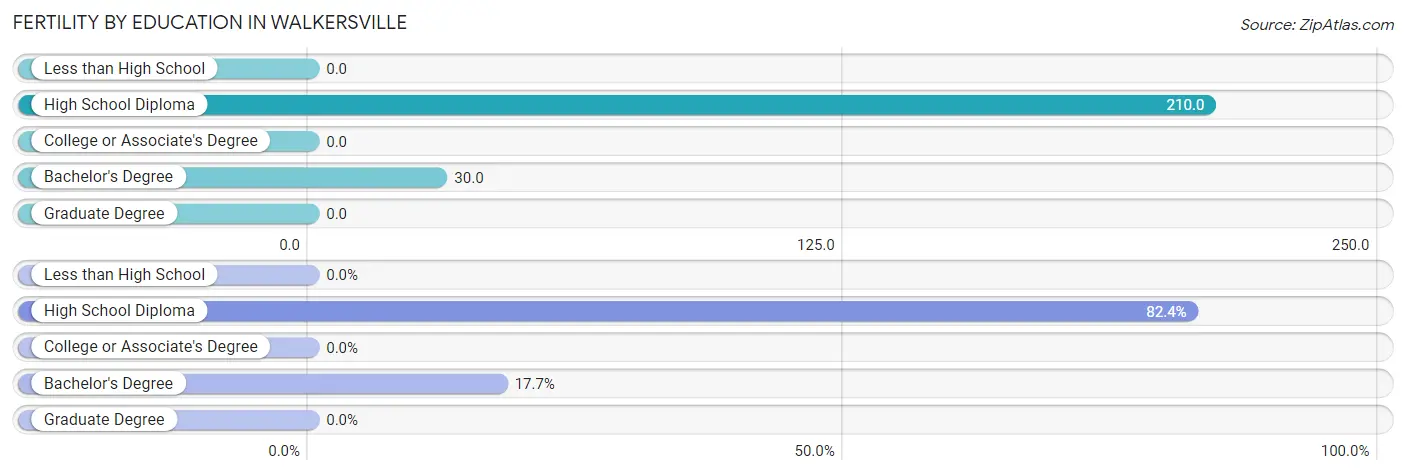
| Educational Attainment | Women with Births | Births / 1,000 Women |
| Less than High School | 0 (0.0%) | 0.0 |
| High School Diploma | 42 (82.4%) | 210.0 |
| College or Associate's Degree | 0 (0.0%) | 0.0 |
| Bachelor's Degree | 9 (17.6%) | 30.0 |
| Graduate Degree | 0 (0.0%) | 0.0 |
| Total | 51 (100.0%) | 35.0 |
Fertility by Education by Marriage Status in Walkersville
41.2% of women with births in Walkersville are unmarried. Women with the educational attainment of bachelor's degree are most likely to be married with 100.0% of them married at childbirth, while women with the educational attainment of high school diploma are least likely to be married with 50.0% of them unmarried at childbirth.
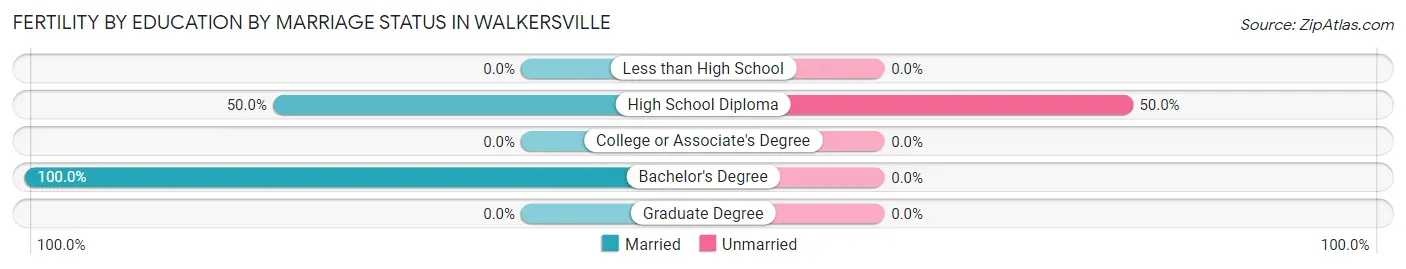
| Educational Attainment | Married | Unmarried |
| Less than High School | 0 (0.0%) | 0 (0.0%) |
| High School Diploma | 21 (50.0%) | 21 (50.0%) |
| College or Associate's Degree | 0 (0.0%) | 0 (0.0%) |
| Bachelor's Degree | 9 (100.0%) | 0 (0.0%) |
| Graduate Degree | 0 (0.0%) | 0 (0.0%) |
| Total | 30 (58.8%) | 21 (41.2%) |
Employment Characteristics in Walkersville
Employment by Class of Employer in Walkersville
Among the 3,450 employed individuals in Walkersville, private company employees (2,076 | 60.2%), not-for-profit organizations (456 | 13.2%), and local government employees (456 | 13.2%) make up the most common classes of employment.
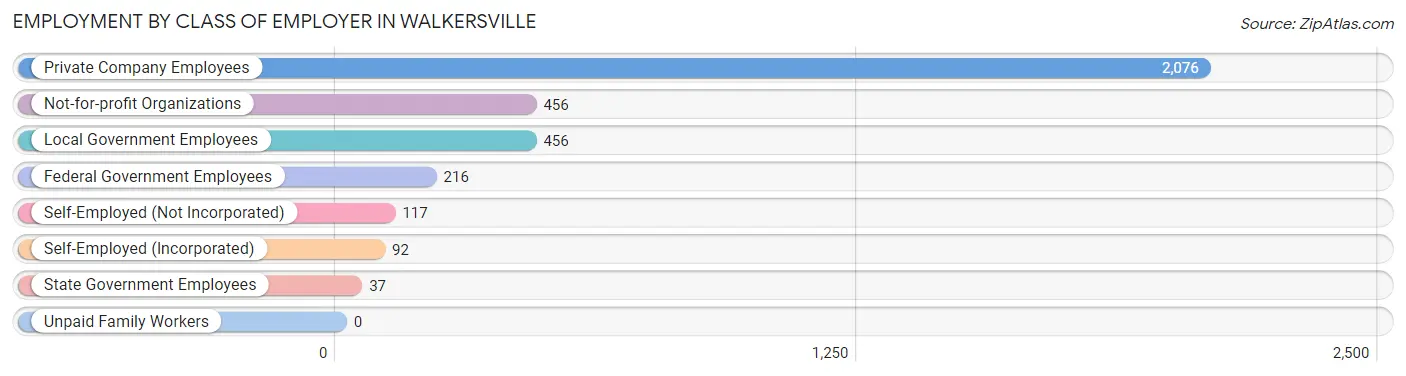
| Employer Class | # Employees | % Employees |
| Private Company Employees | 2,076 | 60.2% |
| Self-Employed (Incorporated) | 92 | 2.7% |
| Self-Employed (Not Incorporated) | 117 | 3.4% |
| Not-for-profit Organizations | 456 | 13.2% |
| Local Government Employees | 456 | 13.2% |
| State Government Employees | 37 | 1.1% |
| Federal Government Employees | 216 | 6.3% |
| Unpaid Family Workers | 0 | 0.0% |
| Total | 3,450 | 100.0% |
Employment Status by Age in Walkersville
According to the labor force statistics for Walkersville, out of the total population over 16 years of age (5,090), 72.1% or 3,670 individuals are in the labor force, with 1.3% or 48 of them unemployed. The age group with the highest labor force participation rate is 35 to 44 years, with 96.7% or 958 individuals in the labor force. Within the labor force, the 75 years and over age range has the highest percentage of unemployed individuals, with 31.0% or 13 of them being unemployed.
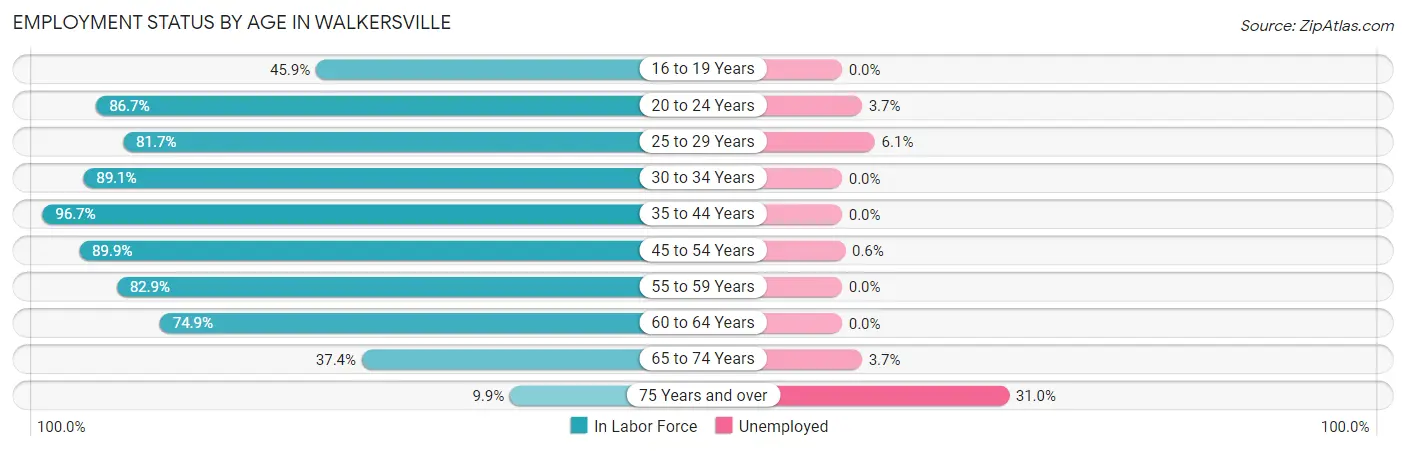
| Age Bracket | In Labor Force | Unemployed |
| 16 to 19 Years | 129 (45.9%) | 0 (0.0%) |
| 20 to 24 Years | 215 (86.7%) | 8 (3.7%) |
| 25 to 29 Years | 196 (81.7%) | 12 (6.1%) |
| 30 to 34 Years | 318 (89.1%) | 0 (0.0%) |
| 35 to 44 Years | 958 (96.7%) | 0 (0.0%) |
| 45 to 54 Years | 850 (89.9%) | 5 (0.6%) |
| 55 to 59 Years | 291 (82.9%) | 0 (0.0%) |
| 60 to 64 Years | 403 (74.9%) | 0 (0.0%) |
| 65 to 74 Years | 268 (37.4%) | 10 (3.7%) |
| 75 Years and over | 42 (9.9%) | 13 (31.0%) |
| Total | 3,670 (72.1%) | 48 (1.3%) |
Employment Status by Educational Attainment in Walkersville
According to labor force statistics for Walkersville, 88.1% of individuals (3,015) out of the total population between 25 and 64 years of age (3,422) are in the labor force, with 0.6% or 18 of them being unemployed. The group with the highest labor force participation rate are those with the educational attainment of bachelor's degree or higher, with 92.2% or 1,539 individuals in the labor force. Within the labor force, individuals with college / associate degree education have the highest percentage of unemployment, with 1.8% or 17 of them being unemployed.
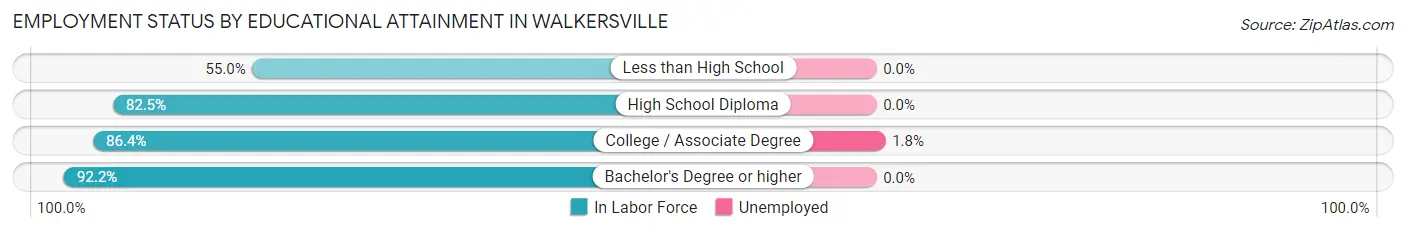
| Educational Attainment | In Labor Force | Unemployed |
| Less than High School | 22 (55.0%) | 0 (0.0%) |
| High School Diploma | 525 (82.5%) | 0 (0.0%) |
| College / Associate Degree | 931 (86.4%) | 19 (1.8%) |
| Bachelor's Degree or higher | 1,539 (92.2%) | 0 (0.0%) |
| Total | 3,015 (88.1%) | 21 (0.6%) |
Employment Occupations by Sex in Walkersville
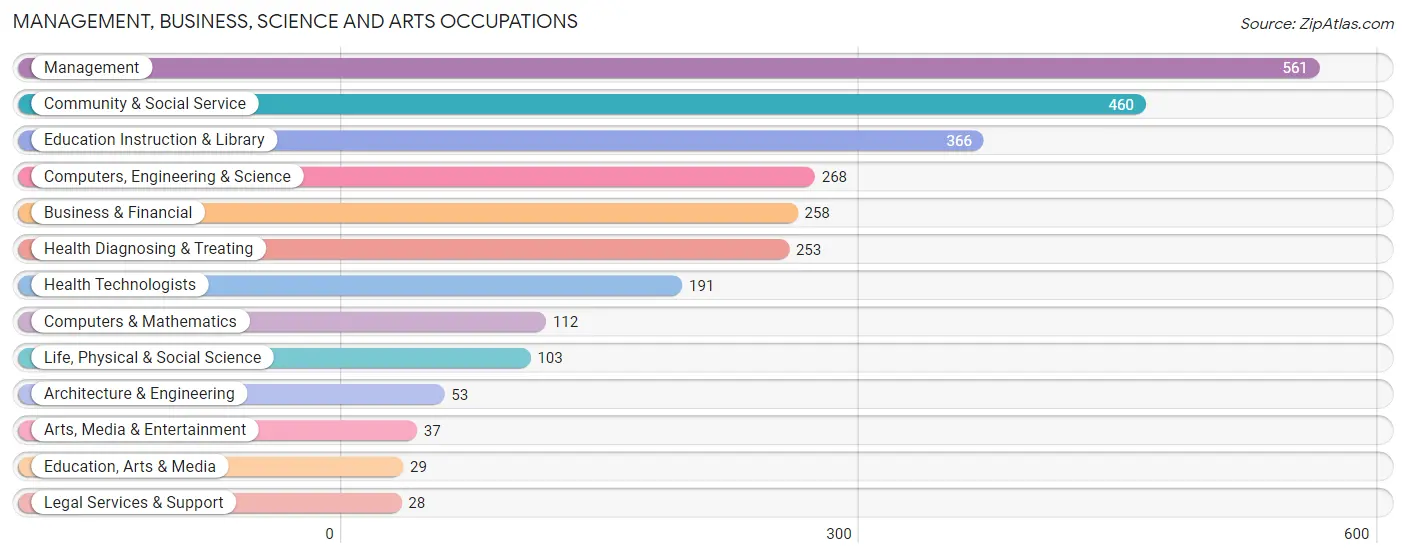
Management, Business, Science and Arts Occupations
The most common Management, Business, Science and Arts occupations in Walkersville are Management (561 | 15.6%), Community & Social Service (460 | 12.8%), Education Instruction & Library (366 | 10.2%), Computers, Engineering & Science (268 | 7.4%), and Business & Financial (258 | 7.2%).
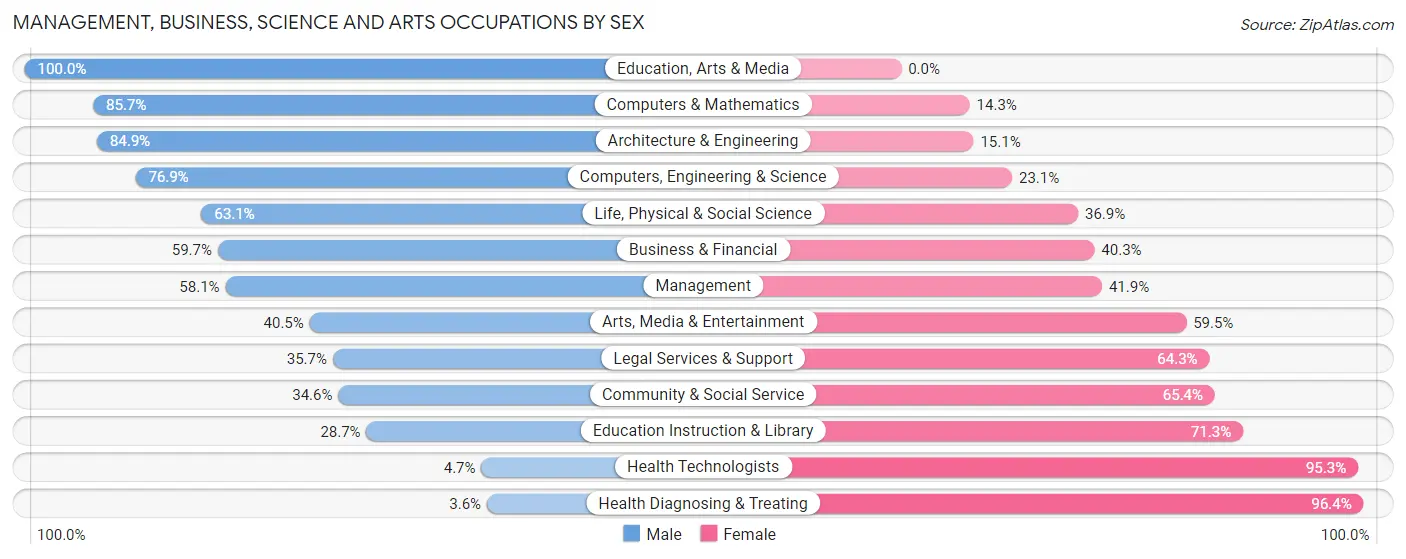
Management, Business, Science and Arts Occupations by Sex
Within the Management, Business, Science and Arts occupations in Walkersville, the most male-oriented occupations are Education, Arts & Media (100.0%), Computers & Mathematics (85.7%), and Architecture & Engineering (84.9%), while the most female-oriented occupations are Health Diagnosing & Treating (96.4%), Health Technologists (95.3%), and Education Instruction & Library (71.3%).
| Occupation | Male | Female |
| Management | 326 (58.1%) | 235 (41.9%) |
| Business & Financial | 154 (59.7%) | 104 (40.3%) |
| Computers, Engineering & Science | 206 (76.9%) | 62 (23.1%) |
| Computers & Mathematics | 96 (85.7%) | 16 (14.3%) |
| Architecture & Engineering | 45 (84.9%) | 8 (15.1%) |
| Life, Physical & Social Science | 65 (63.1%) | 38 (36.9%) |
| Community & Social Service | 159 (34.6%) | 301 (65.4%) |
| Education, Arts & Media | 29 (100.0%) | 0 (0.0%) |
| Legal Services & Support | 10 (35.7%) | 18 (64.3%) |
| Education Instruction & Library | 105 (28.7%) | 261 (71.3%) |
| Arts, Media & Entertainment | 15 (40.5%) | 22 (59.5%) |
| Health Diagnosing & Treating | 9 (3.6%) | 244 (96.4%) |
| Health Technologists | 9 (4.7%) | 182 (95.3%) |
| Total (Category) | 854 (47.4%) | 946 (52.6%) |
| Total (Overall) | 1,892 (52.6%) | 1,705 (47.4%) |
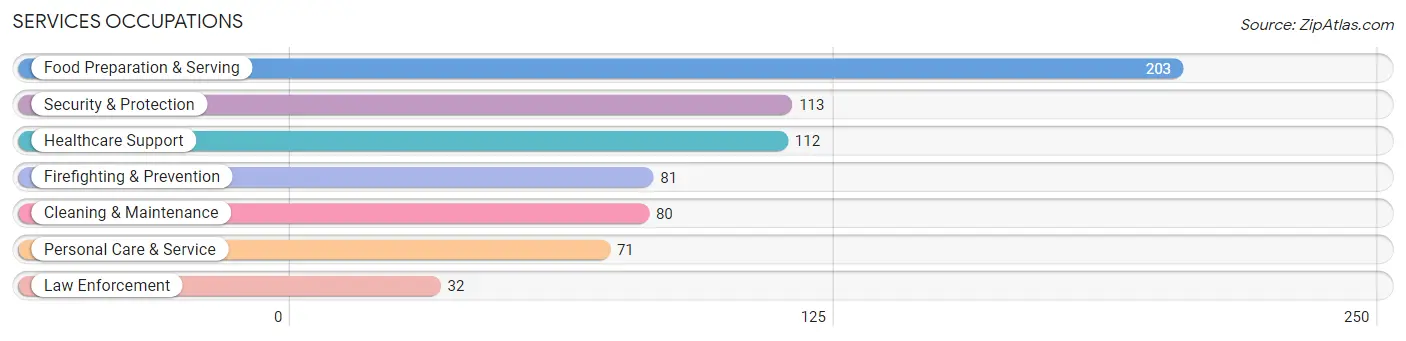
Services Occupations
The most common Services occupations in Walkersville are Food Preparation & Serving (203 | 5.6%), Security & Protection (113 | 3.1%), Healthcare Support (112 | 3.1%), Firefighting & Prevention (81 | 2.2%), and Cleaning & Maintenance (80 | 2.2%).
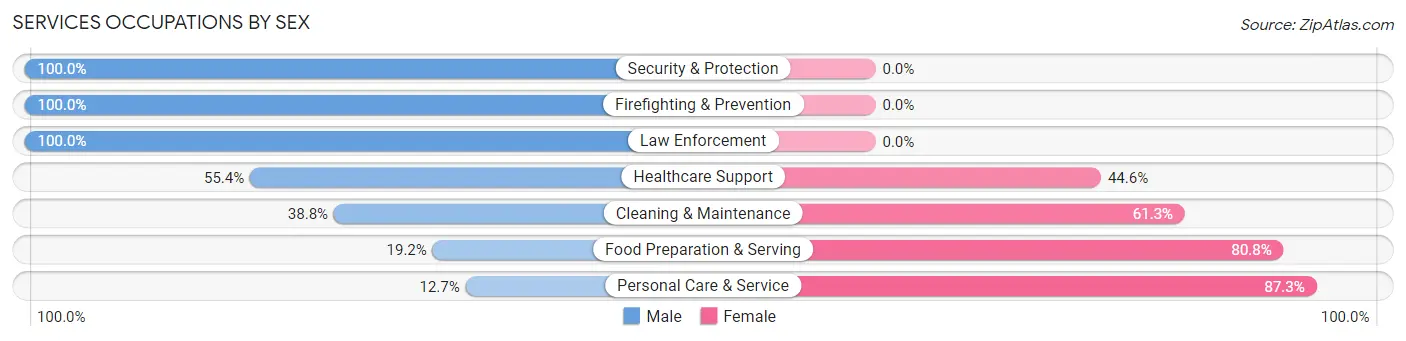
Services Occupations by Sex
Within the Services occupations in Walkersville, the most male-oriented occupations are Security & Protection (100.0%), Firefighting & Prevention (100.0%), and Law Enforcement (100.0%), while the most female-oriented occupations are Personal Care & Service (87.3%), Food Preparation & Serving (80.8%), and Cleaning & Maintenance (61.3%).
| Occupation | Male | Female |
| Healthcare Support | 62 (55.4%) | 50 (44.6%) |
| Security & Protection | 113 (100.0%) | 0 (0.0%) |
| Firefighting & Prevention | 81 (100.0%) | 0 (0.0%) |
| Law Enforcement | 32 (100.0%) | 0 (0.0%) |
| Food Preparation & Serving | 39 (19.2%) | 164 (80.8%) |
| Cleaning & Maintenance | 31 (38.8%) | 49 (61.3%) |
| Personal Care & Service | 9 (12.7%) | 62 (87.3%) |
| Total (Category) | 254 (43.9%) | 325 (56.1%) |
| Total (Overall) | 1,892 (52.6%) | 1,705 (47.4%) |
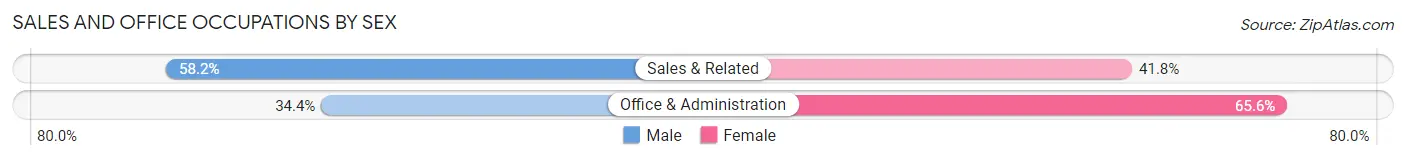
Sales and Office Occupations
The most common Sales and Office occupations in Walkersville are Office & Administration (451 | 12.5%), and Sales & Related (292 | 8.1%).

Sales and Office Occupations by Sex
| Occupation | Male | Female |
| Sales & Related | 170 (58.2%) | 122 (41.8%) |
| Office & Administration | 155 (34.4%) | 296 (65.6%) |
| Total (Category) | 325 (43.7%) | 418 (56.3%) |
| Total (Overall) | 1,892 (52.6%) | 1,705 (47.4%) |
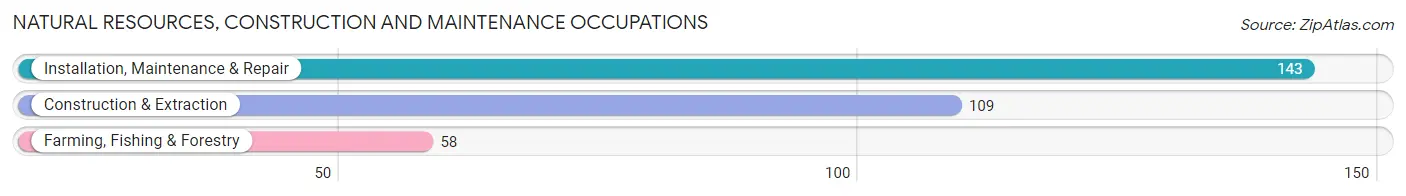
Natural Resources, Construction and Maintenance Occupations
The most common Natural Resources, Construction and Maintenance occupations in Walkersville are Installation, Maintenance & Repair (143 | 4.0%), Construction & Extraction (109 | 3.0%), and Farming, Fishing & Forestry (58 | 1.6%).
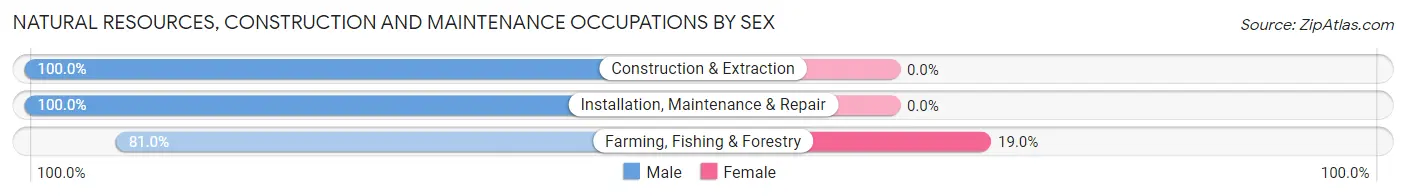
Natural Resources, Construction and Maintenance Occupations by Sex
| Occupation | Male | Female |
| Farming, Fishing & Forestry | 47 (81.0%) | 11 (19.0%) |
| Construction & Extraction | 109 (100.0%) | 0 (0.0%) |
| Installation, Maintenance & Repair | 143 (100.0%) | 0 (0.0%) |
| Total (Category) | 299 (96.5%) | 11 (3.5%) |
| Total (Overall) | 1,892 (52.6%) | 1,705 (47.4%) |
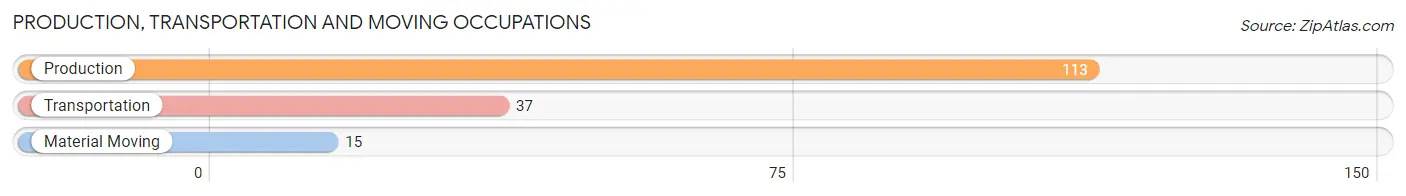
Production, Transportation and Moving Occupations
The most common Production, Transportation and Moving occupations in Walkersville are Production (113 | 3.1%), Transportation (37 | 1.0%), and Material Moving (15 | 0.4%).
Production, Transportation and Moving Occupations by Sex
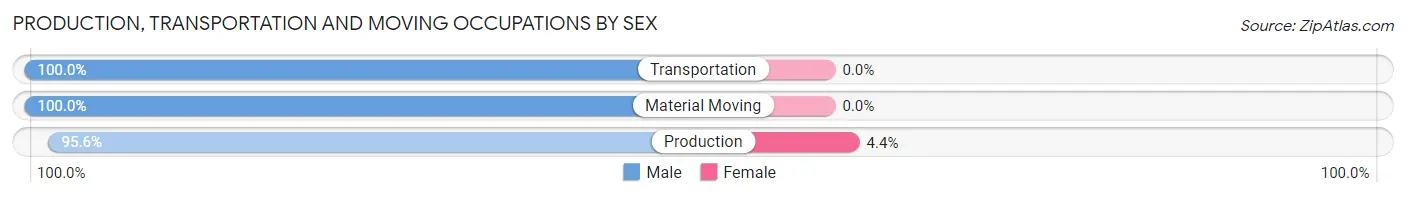
| Occupation | Male | Female |
| Production | 108 (95.6%) | 5 (4.4%) |
| Transportation | 37 (100.0%) | 0 (0.0%) |
| Material Moving | 15 (100.0%) | 0 (0.0%) |
| Total (Category) | 160 (97.0%) | 5 (3.0%) |
| Total (Overall) | 1,892 (52.6%) | 1,705 (47.4%) |
Employment Industries by Sex in Walkersville
Employment Industries in Walkersville
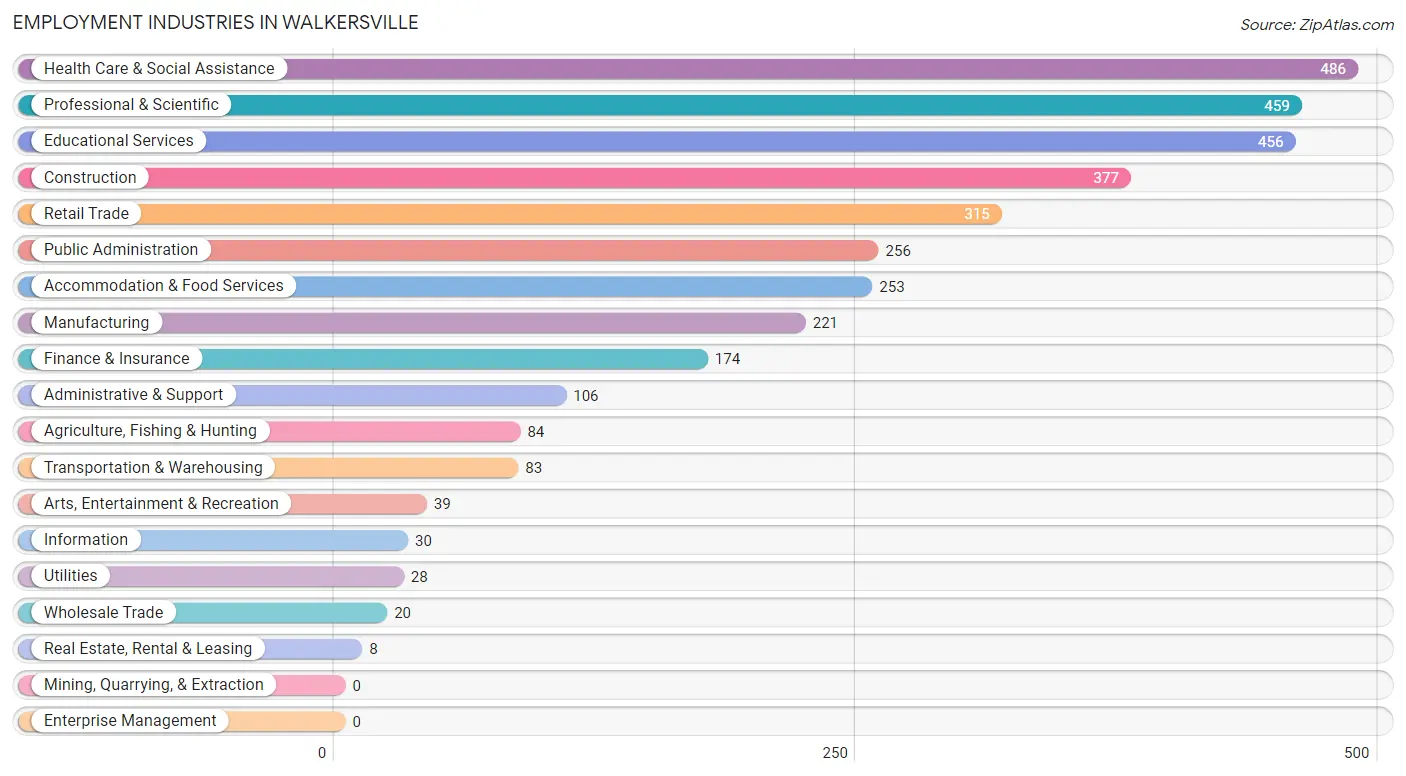
The major employment industries in Walkersville include Health Care & Social Assistance (486 | 13.5%), Professional & Scientific (459 | 12.8%), Educational Services (456 | 12.7%), Construction (377 | 10.5%), and Retail Trade (315 | 8.8%).
Employment Industries by Sex in Walkersville
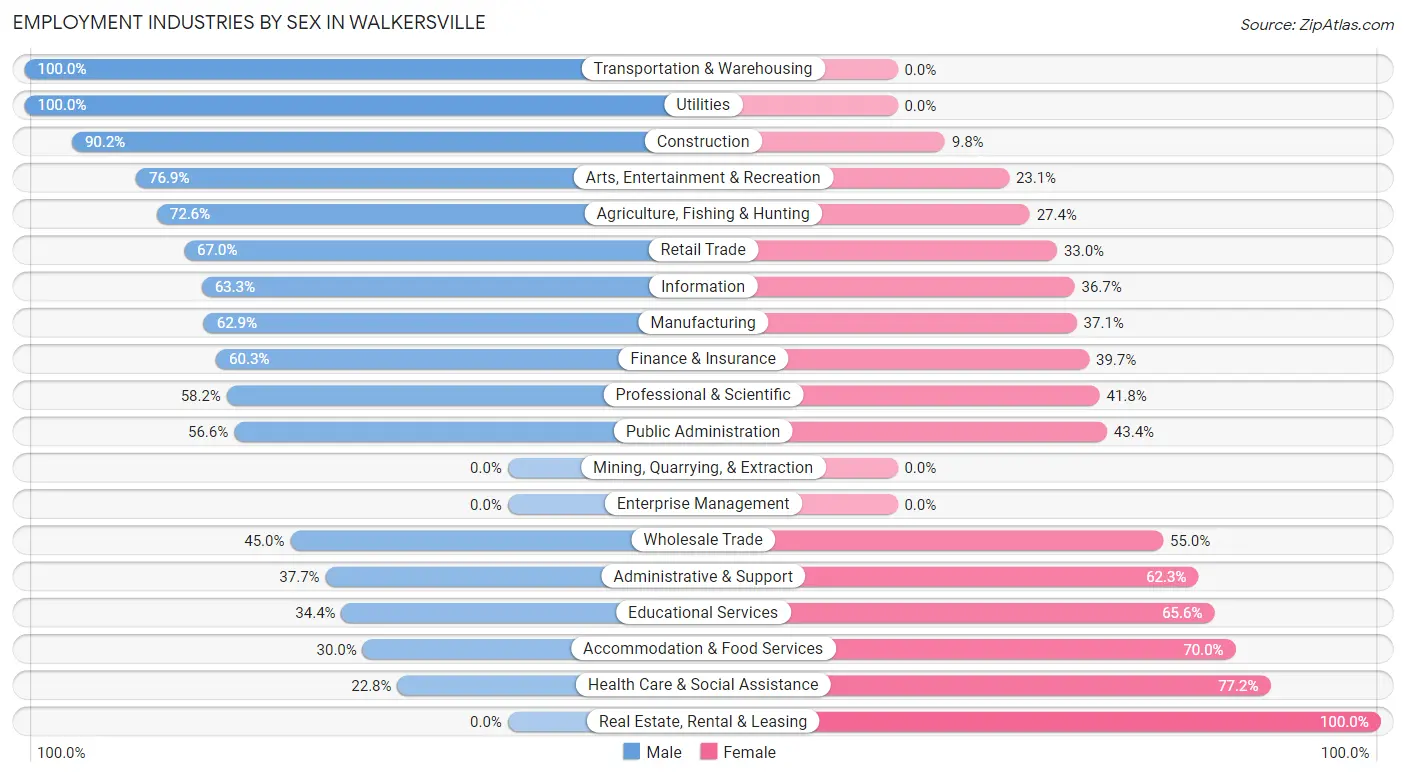
The Walkersville industries that see more men than women are Transportation & Warehousing (100.0%), Utilities (100.0%), and Construction (90.2%), whereas the industries that tend to have a higher number of women are Real Estate, Rental & Leasing (100.0%), Health Care & Social Assistance (77.2%), and Accommodation & Food Services (70.0%).
| Industry | Male | Female |
| Agriculture, Fishing & Hunting | 61 (72.6%) | 23 (27.4%) |
| Mining, Quarrying, & Extraction | 0 (0.0%) | 0 (0.0%) |
| Construction | 340 (90.2%) | 37 (9.8%) |
| Manufacturing | 139 (62.9%) | 82 (37.1%) |
| Wholesale Trade | 9 (45.0%) | 11 (55.0%) |
| Retail Trade | 211 (67.0%) | 104 (33.0%) |
| Transportation & Warehousing | 83 (100.0%) | 0 (0.0%) |
| Utilities | 28 (100.0%) | 0 (0.0%) |
| Information | 19 (63.3%) | 11 (36.7%) |
| Finance & Insurance | 105 (60.3%) | 69 (39.7%) |
| Real Estate, Rental & Leasing | 0 (0.0%) | 8 (100.0%) |
| Professional & Scientific | 267 (58.2%) | 192 (41.8%) |
| Enterprise Management | 0 (0.0%) | 0 (0.0%) |
| Administrative & Support | 40 (37.7%) | 66 (62.3%) |
| Educational Services | 157 (34.4%) | 299 (65.6%) |
| Health Care & Social Assistance | 111 (22.8%) | 375 (77.2%) |
| Arts, Entertainment & Recreation | 30 (76.9%) | 9 (23.1%) |
| Accommodation & Food Services | 76 (30.0%) | 177 (70.0%) |
| Public Administration | 145 (56.6%) | 111 (43.4%) |
| Total | 1,892 (52.6%) | 1,705 (47.4%) |
Education in Walkersville
School Enrollment in Walkersville
The most common levels of schooling among the 1,555 students in Walkersville are high school (443 | 28.5%), middle school (344 | 22.1%), and elementary school (240 | 15.4%).
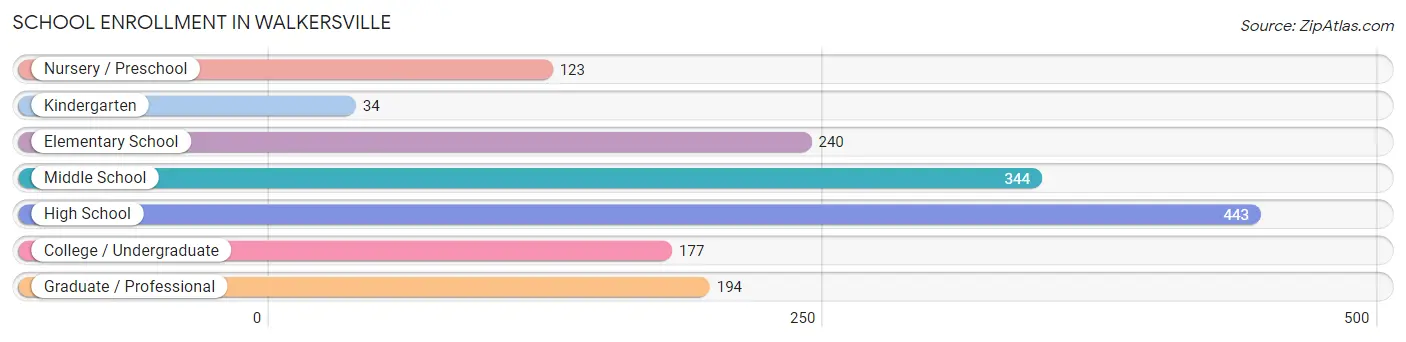
| School Level | # Students | % Students |
| Nursery / Preschool | 123 | 7.9% |
| Kindergarten | 34 | 2.2% |
| Elementary School | 240 | 15.4% |
| Middle School | 344 | 22.1% |
| High School | 443 | 28.5% |
| College / Undergraduate | 177 | 11.4% |
| Graduate / Professional | 194 | 12.5% |
| Total | 1,555 | 100.0% |
School Enrollment by Age by Funding Source in Walkersville
Out of a total of 1,555 students who are enrolled in schools in Walkersville, 211 (13.6%) attend a private institution, while the remaining 1,344 (86.4%) are enrolled in public schools. The age group of 25 to 34 year olds has the highest likelihood of being enrolled in private schools, with 26 (57.8% in the age bracket) enrolled. Conversely, the age group of 15 to 17 year olds has the lowest likelihood of being enrolled in a private school, with 278 (96.2% in the age bracket) attending a public institution.
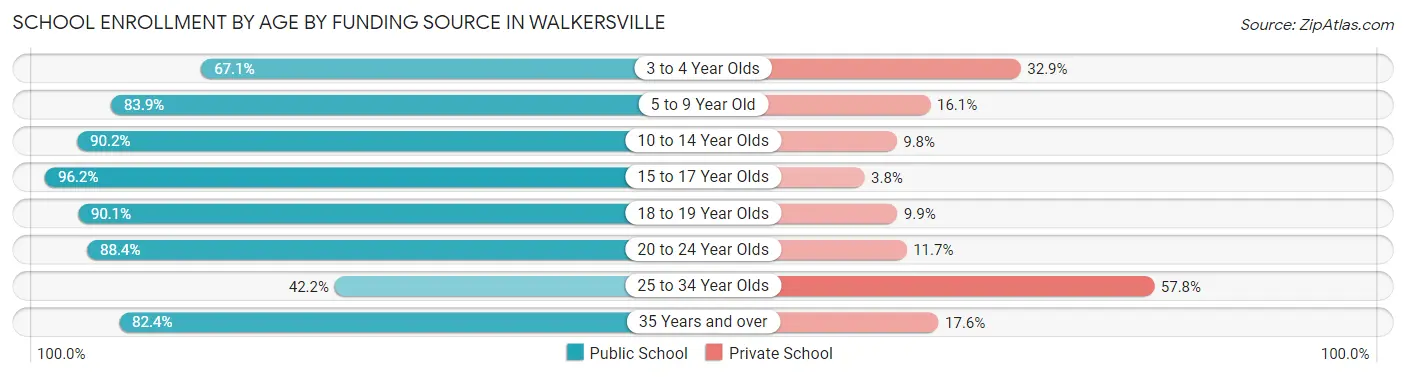
| Age Bracket | Public School | Private School |
| 3 to 4 Year Olds | 53 (67.1%) | 26 (32.9%) |
| 5 to 9 Year Old | 261 (83.9%) | 50 (16.1%) |
| 10 to 14 Year Olds | 368 (90.2%) | 40 (9.8%) |
| 15 to 17 Year Olds | 278 (96.2%) | 11 (3.8%) |
| 18 to 19 Year Olds | 109 (90.1%) | 12 (9.9%) |
| 20 to 24 Year Olds | 91 (88.3%) | 12 (11.7%) |
| 25 to 34 Year Olds | 19 (42.2%) | 26 (57.8%) |
| 35 Years and over | 164 (82.4%) | 35 (17.6%) |
| Total | 1,344 (86.4%) | 211 (13.6%) |
Educational Attainment by Field of Study in Walkersville
Business (495 | 21.7%), science & technology (369 | 16.2%), education (289 | 12.7%), bio, nature & agricultural (208 | 9.1%), and social sciences (172 | 7.5%) are the most common fields of study among 2,281 individuals in Walkersville who have obtained a bachelor's degree or higher.
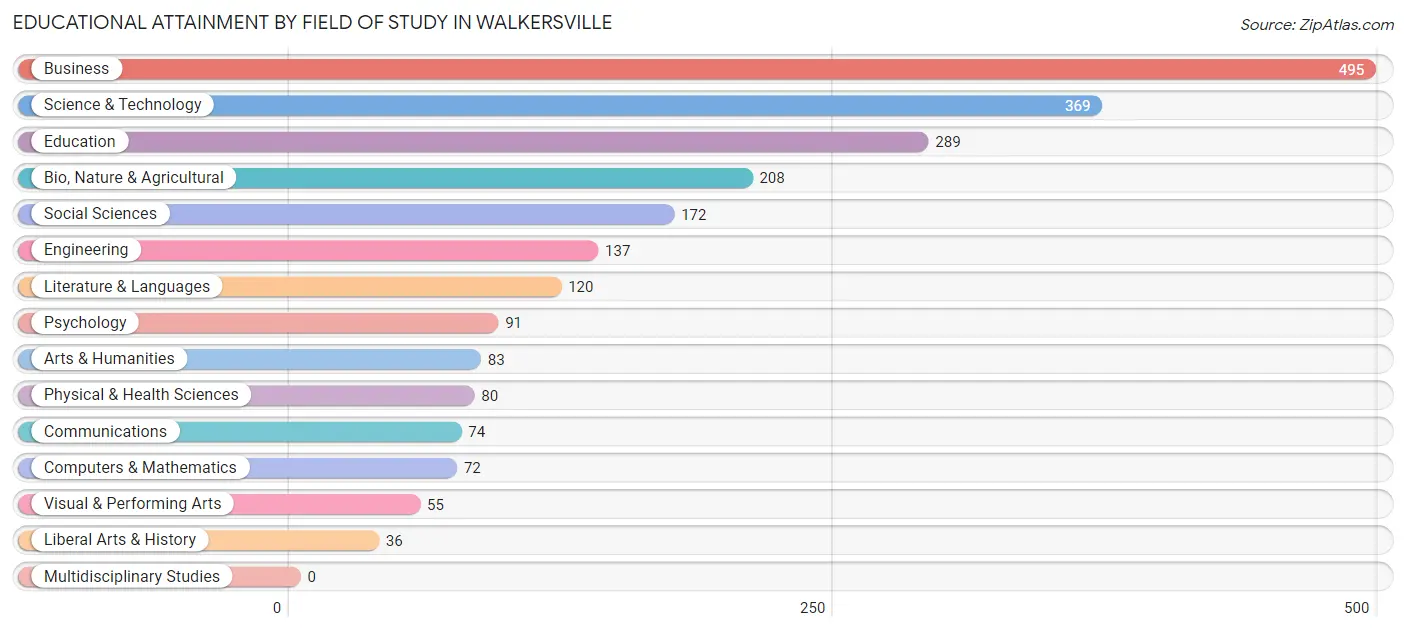
| Field of Study | # Graduates | % Graduates |
| Computers & Mathematics | 72 | 3.2% |
| Bio, Nature & Agricultural | 208 | 9.1% |
| Physical & Health Sciences | 80 | 3.5% |
| Psychology | 91 | 4.0% |
| Social Sciences | 172 | 7.5% |
| Engineering | 137 | 6.0% |
| Multidisciplinary Studies | 0 | 0.0% |
| Science & Technology | 369 | 16.2% |
| Business | 495 | 21.7% |
| Education | 289 | 12.7% |
| Literature & Languages | 120 | 5.3% |
| Liberal Arts & History | 36 | 1.6% |
| Visual & Performing Arts | 55 | 2.4% |
| Communications | 74 | 3.2% |
| Arts & Humanities | 83 | 3.6% |
| Total | 2,281 | 100.0% |
Transportation & Commute in Walkersville
Vehicle Availability by Sex in Walkersville
The most prevalent vehicle ownership categories in Walkersville are males with 2 vehicles (932, accounting for 49.7%) and females with 2 vehicles (785, making up 59.2%).
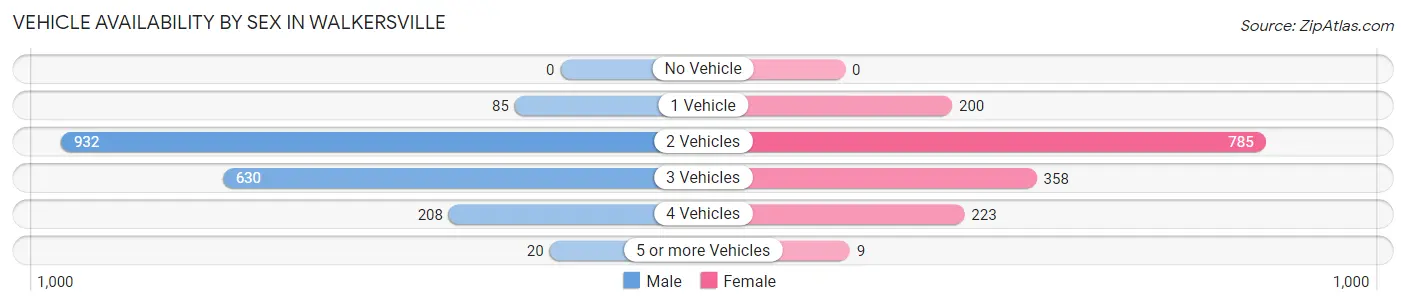
| Vehicles Available | Male | Female |
| No Vehicle | 0 (0.0%) | 0 (0.0%) |
| 1 Vehicle | 85 (4.5%) | 200 (12.7%) |
| 2 Vehicles | 932 (49.7%) | 785 (49.8%) |
| 3 Vehicles | 630 (33.6%) | 358 (22.7%) |
| 4 Vehicles | 208 (11.1%) | 223 (14.2%) |
| 5 or more Vehicles | 20 (1.1%) | 9 (0.6%) |
| Total | 1,875 (100.0%) | 1,575 (100.0%) |
Commute Time in Walkersville
The most frequently occuring commute durations in Walkersville are 60 to 89 minutes (528 commuters, 17.9%), 15 to 19 minutes (471 commuters, 15.9%), and 20 to 24 minutes (414 commuters, 14.0%).
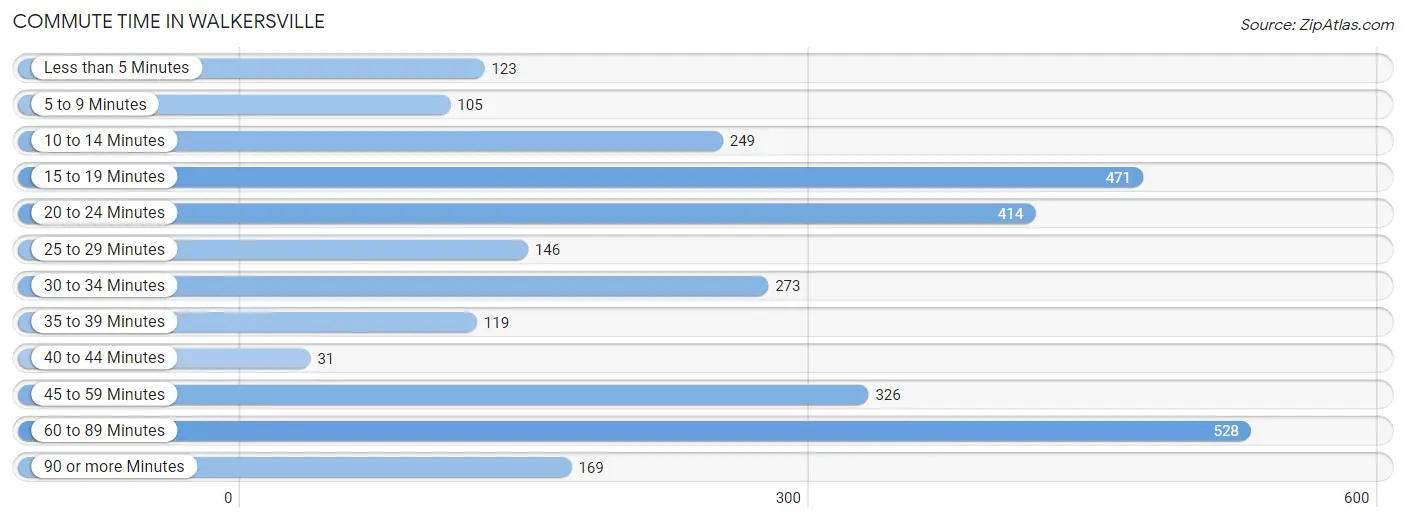
| Commute Time | # Commuters | % Commuters |
| Less than 5 Minutes | 123 | 4.2% |
| 5 to 9 Minutes | 105 | 3.5% |
| 10 to 14 Minutes | 249 | 8.4% |
| 15 to 19 Minutes | 471 | 15.9% |
| 20 to 24 Minutes | 414 | 14.0% |
| 25 to 29 Minutes | 146 | 4.9% |
| 30 to 34 Minutes | 273 | 9.2% |
| 35 to 39 Minutes | 119 | 4.0% |
| 40 to 44 Minutes | 31 | 1.1% |
| 45 to 59 Minutes | 326 | 11.0% |
| 60 to 89 Minutes | 528 | 17.9% |
| 90 or more Minutes | 169 | 5.7% |
Commute Time by Sex in Walkersville
The most common commute times in Walkersville are 60 to 89 minutes (352 commuters, 21.7%) for males and 15 to 19 minutes (198 commuters, 14.8%) for females.
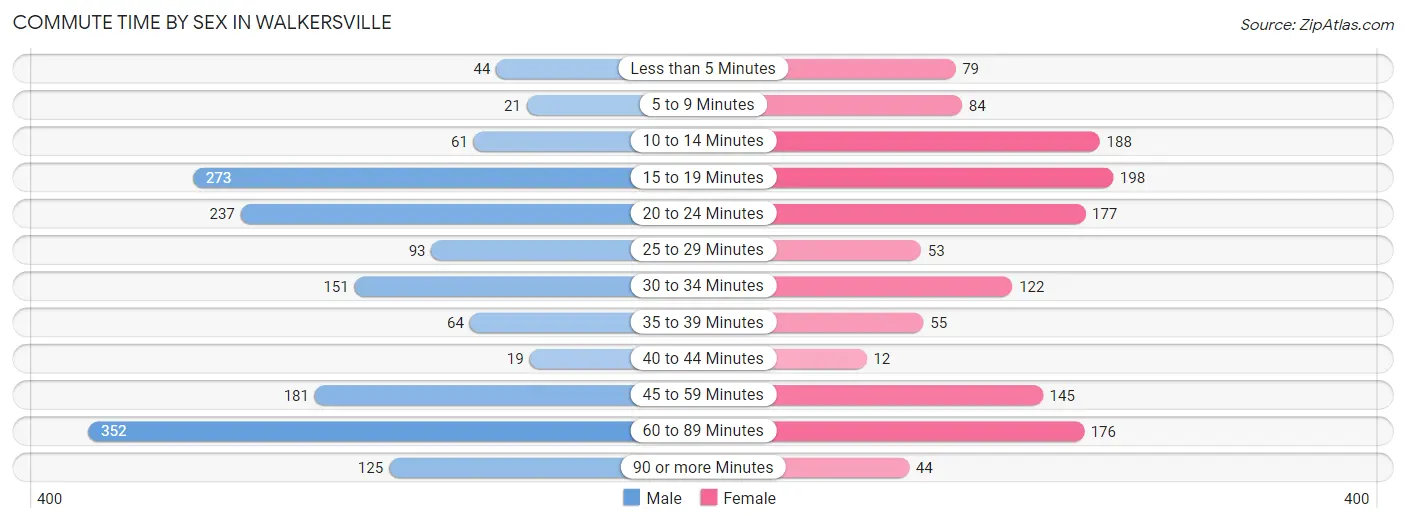
| Commute Time | Male | Female |
| Less than 5 Minutes | 44 (2.7%) | 79 (5.9%) |
| 5 to 9 Minutes | 21 (1.3%) | 84 (6.3%) |
| 10 to 14 Minutes | 61 (3.8%) | 188 (14.1%) |
| 15 to 19 Minutes | 273 (16.8%) | 198 (14.8%) |
| 20 to 24 Minutes | 237 (14.6%) | 177 (13.3%) |
| 25 to 29 Minutes | 93 (5.7%) | 53 (4.0%) |
| 30 to 34 Minutes | 151 (9.3%) | 122 (9.1%) |
| 35 to 39 Minutes | 64 (4.0%) | 55 (4.1%) |
| 40 to 44 Minutes | 19 (1.2%) | 12 (0.9%) |
| 45 to 59 Minutes | 181 (11.2%) | 145 (10.9%) |
| 60 to 89 Minutes | 352 (21.7%) | 176 (13.2%) |
| 90 or more Minutes | 125 (7.7%) | 44 (3.3%) |
Time of Departure to Work by Sex in Walkersville
The most frequent times of departure to work in Walkersville are 7:00 AM to 7:29 AM (276, 17.0%) for males and 6:30 AM to 6:59 AM (184, 13.8%) for females.
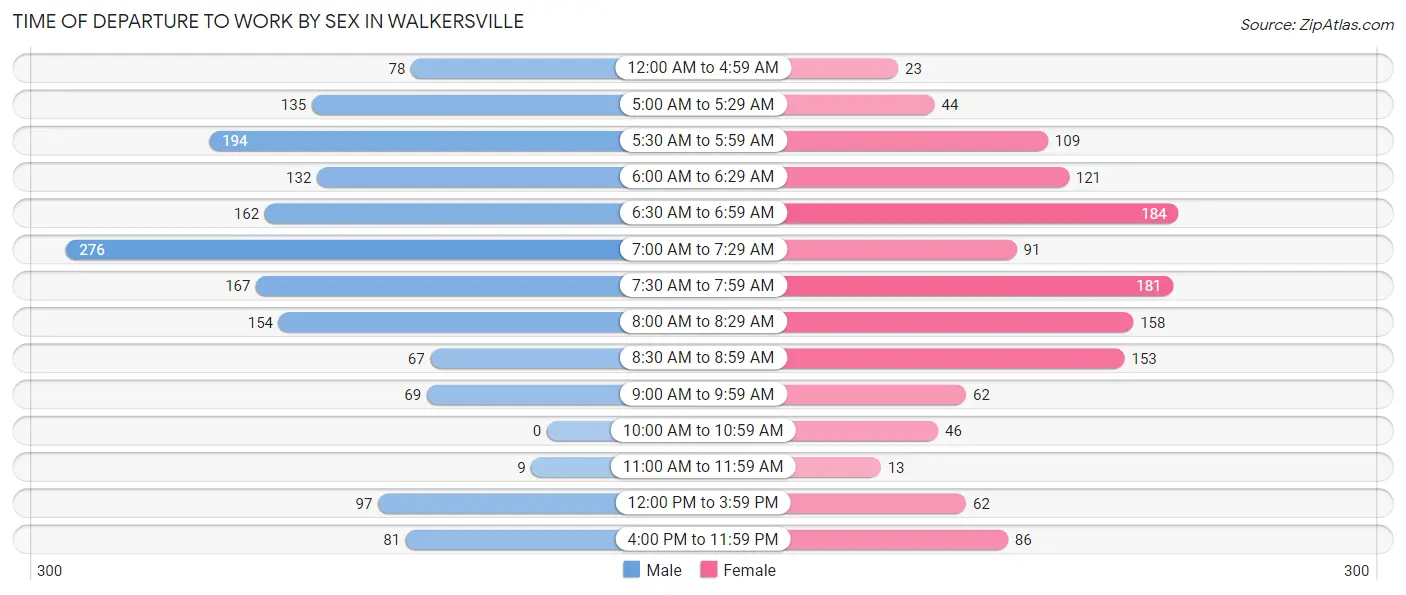
| Time of Departure | Male | Female |
| 12:00 AM to 4:59 AM | 78 (4.8%) | 23 (1.7%) |
| 5:00 AM to 5:29 AM | 135 (8.3%) | 44 (3.3%) |
| 5:30 AM to 5:59 AM | 194 (12.0%) | 109 (8.2%) |
| 6:00 AM to 6:29 AM | 132 (8.1%) | 121 (9.1%) |
| 6:30 AM to 6:59 AM | 162 (10.0%) | 184 (13.8%) |
| 7:00 AM to 7:29 AM | 276 (17.0%) | 91 (6.8%) |
| 7:30 AM to 7:59 AM | 167 (10.3%) | 181 (13.6%) |
| 8:00 AM to 8:29 AM | 154 (9.5%) | 158 (11.8%) |
| 8:30 AM to 8:59 AM | 67 (4.1%) | 153 (11.5%) |
| 9:00 AM to 9:59 AM | 69 (4.3%) | 62 (4.6%) |
| 10:00 AM to 10:59 AM | 0 (0.0%) | 46 (3.5%) |
| 11:00 AM to 11:59 AM | 9 (0.6%) | 13 (1.0%) |
| 12:00 PM to 3:59 PM | 97 (6.0%) | 62 (4.6%) |
| 4:00 PM to 11:59 PM | 81 (5.0%) | 86 (6.5%) |
| Total | 1,621 (100.0%) | 1,333 (100.0%) |
Housing Occupancy in Walkersville
Occupancy by Ownership in Walkersville
Of the total 2,440 dwellings in Walkersville, owner-occupied units account for 2,136 (87.5%), while renter-occupied units make up 304 (12.5%).
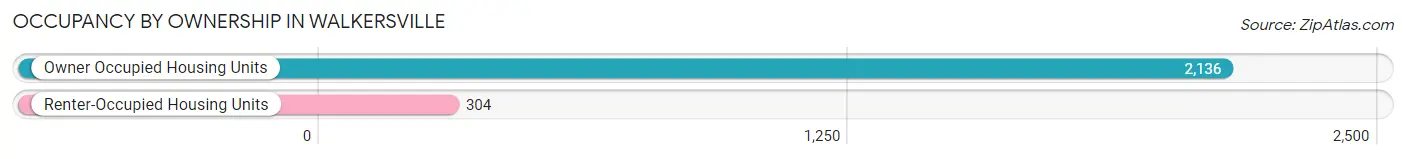
| Occupancy | # Housing Units | % Housing Units |
| Owner Occupied Housing Units | 2,136 | 87.5% |
| Renter-Occupied Housing Units | 304 | 12.5% |
| Total Occupied Housing Units | 2,440 | 100.0% |
Occupancy by Household Size in Walkersville
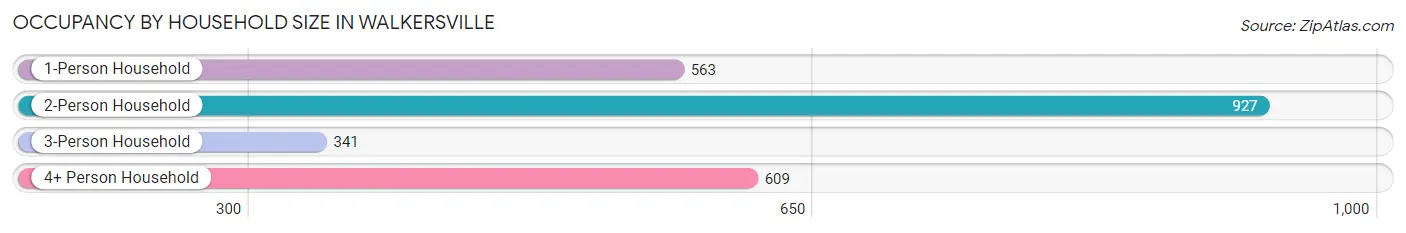
| Household Size | # Housing Units | % Housing Units |
| 1-Person Household | 563 | 23.1% |
| 2-Person Household | 927 | 38.0% |
| 3-Person Household | 341 | 14.0% |
| 4+ Person Household | 609 | 25.0% |
| Total Housing Units | 2,440 | 100.0% |
Occupancy by Ownership by Household Size in Walkersville
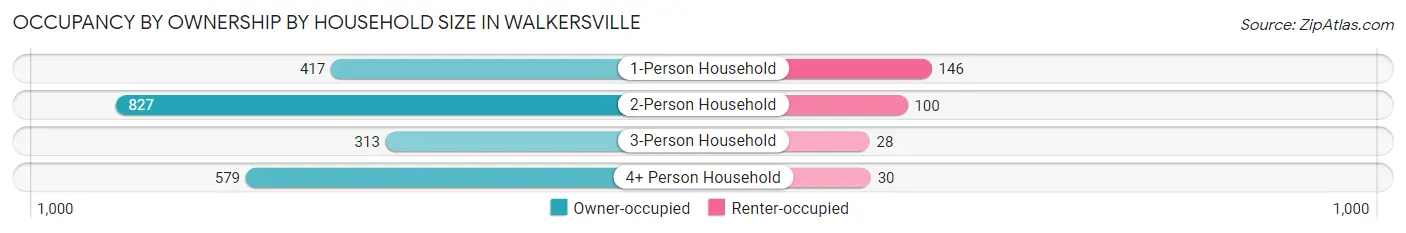
| Household Size | Owner-occupied | Renter-occupied |
| 1-Person Household | 417 (74.1%) | 146 (25.9%) |
| 2-Person Household | 827 (89.2%) | 100 (10.8%) |
| 3-Person Household | 313 (91.8%) | 28 (8.2%) |
| 4+ Person Household | 579 (95.1%) | 30 (4.9%) |
| Total Housing Units | 2,136 (87.5%) | 304 (12.5%) |
Occupancy by Educational Attainment in Walkersville
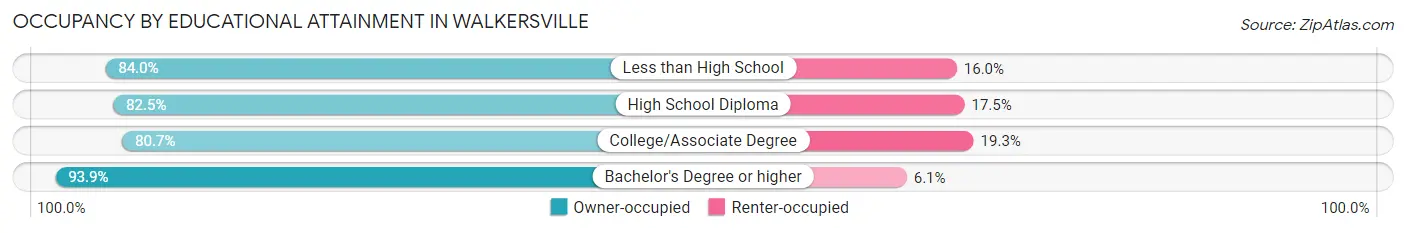
| Household Size | Owner-occupied | Renter-occupied |
| Less than High School | 42 (84.0%) | 8 (16.0%) |
| High School Diploma | 400 (82.5%) | 85 (17.5%) |
| College/Associate Degree | 580 (80.7%) | 139 (19.3%) |
| Bachelor's Degree or higher | 1,114 (93.9%) | 72 (6.1%) |
Occupancy by Age of Householder in Walkersville
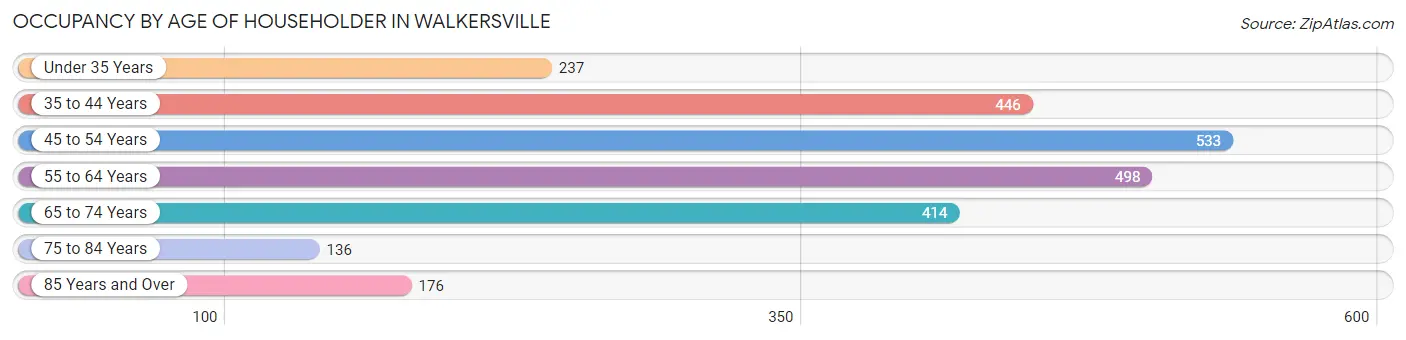
| Age Bracket | # Households | % Households |
| Under 35 Years | 237 | 9.7% |
| 35 to 44 Years | 446 | 18.3% |
| 45 to 54 Years | 533 | 21.8% |
| 55 to 64 Years | 498 | 20.4% |
| 65 to 74 Years | 414 | 17.0% |
| 75 to 84 Years | 136 | 5.6% |
| 85 Years and Over | 176 | 7.2% |
| Total | 2,440 | 100.0% |
Housing Finances in Walkersville
Median Income by Occupancy in Walkersville
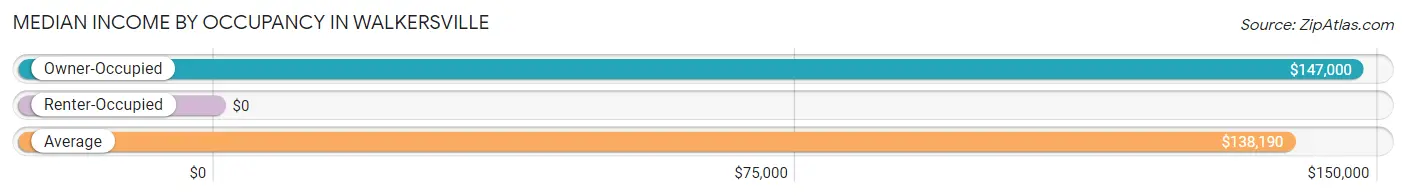
| Occupancy Type | # Households | Median Income |
| Owner-Occupied | 2,136 (87.5%) | $147,000 |
| Renter-Occupied | 304 (12.5%) | $0 |
| Average | 2,440 (100.0%) | $138,190 |
Occupancy by Householder Income Bracket in Walkersville
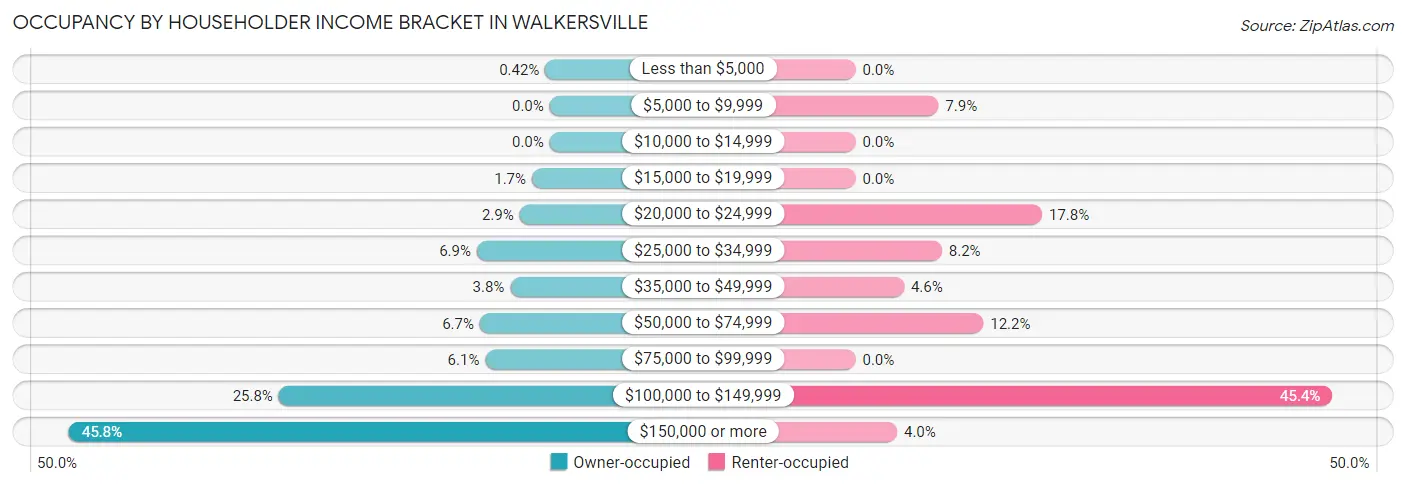
| Income Bracket | Owner-occupied | Renter-occupied |
| Less than $5,000 | 9 (0.4%) | 0 (0.0%) |
| $5,000 to $9,999 | 0 (0.0%) | 24 (7.9%) |
| $10,000 to $14,999 | 0 (0.0%) | 0 (0.0%) |
| $15,000 to $19,999 | 36 (1.7%) | 0 (0.0%) |
| $20,000 to $24,999 | 61 (2.9%) | 54 (17.8%) |
| $25,000 to $34,999 | 148 (6.9%) | 25 (8.2%) |
| $35,000 to $49,999 | 80 (3.7%) | 14 (4.6%) |
| $50,000 to $74,999 | 142 (6.7%) | 37 (12.2%) |
| $75,000 to $99,999 | 131 (6.1%) | 0 (0.0%) |
| $100,000 to $149,999 | 551 (25.8%) | 138 (45.4%) |
| $150,000 or more | 978 (45.8%) | 12 (4.0%) |
| Total | 2,136 (100.0%) | 304 (100.0%) |
Monthly Housing Cost Tiers in Walkersville
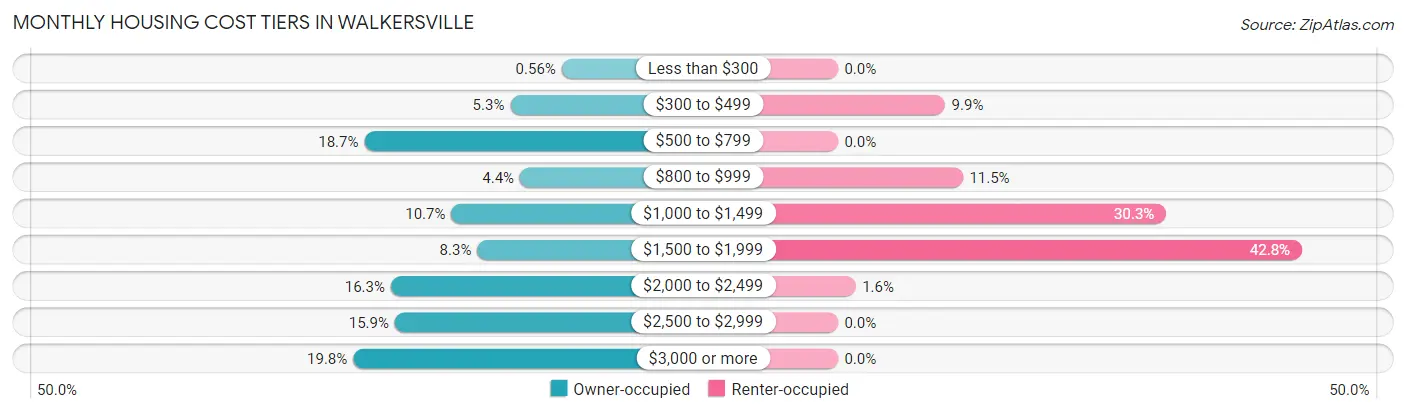
| Monthly Cost | Owner-occupied | Renter-occupied |
| Less than $300 | 12 (0.6%) | 0 (0.0%) |
| $300 to $499 | 113 (5.3%) | 30 (9.9%) |
| $500 to $799 | 400 (18.7%) | 0 (0.0%) |
| $800 to $999 | 94 (4.4%) | 35 (11.5%) |
| $1,000 to $1,499 | 229 (10.7%) | 92 (30.3%) |
| $1,500 to $1,999 | 178 (8.3%) | 130 (42.8%) |
| $2,000 to $2,499 | 348 (16.3%) | 5 (1.6%) |
| $2,500 to $2,999 | 340 (15.9%) | 0 (0.0%) |
| $3,000 or more | 422 (19.8%) | 0 (0.0%) |
| Total | 2,136 (100.0%) | 304 (100.0%) |
Physical Housing Characteristics in Walkersville
Housing Structures in Walkersville
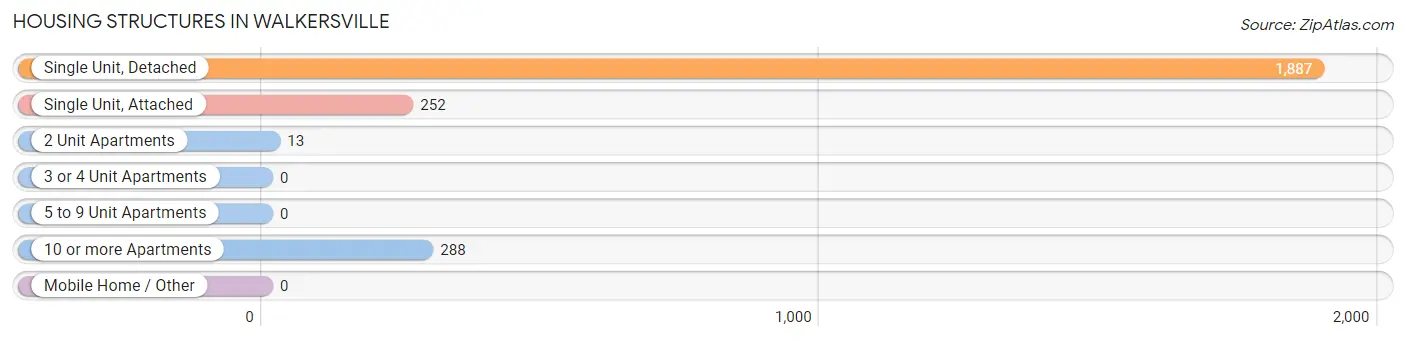
| Structure Type | # Housing Units | % Housing Units |
| Single Unit, Detached | 1,887 | 77.3% |
| Single Unit, Attached | 252 | 10.3% |
| 2 Unit Apartments | 13 | 0.5% |
| 3 or 4 Unit Apartments | 0 | 0.0% |
| 5 to 9 Unit Apartments | 0 | 0.0% |
| 10 or more Apartments | 288 | 11.8% |
| Mobile Home / Other | 0 | 0.0% |
| Total | 2,440 | 100.0% |
Housing Structures by Occupancy in Walkersville
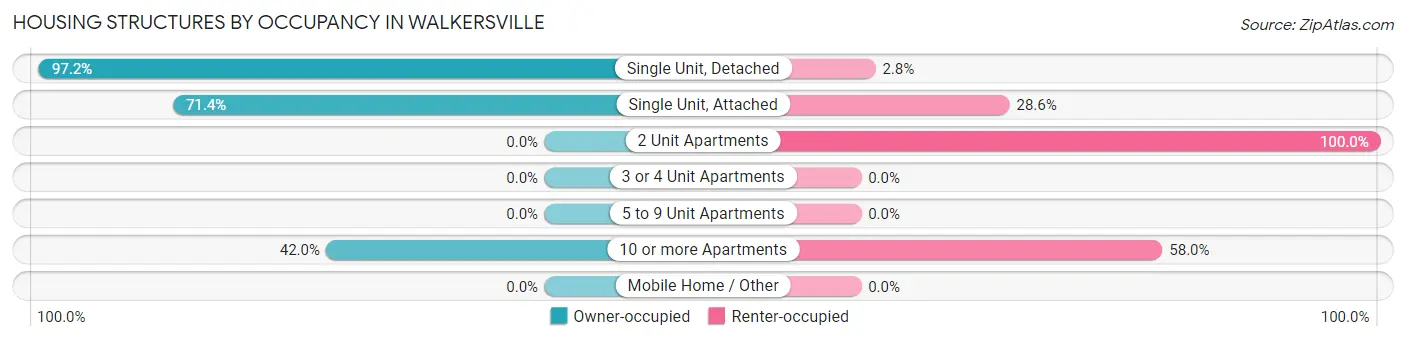
| Structure Type | Owner-occupied | Renter-occupied |
| Single Unit, Detached | 1,835 (97.2%) | 52 (2.8%) |
| Single Unit, Attached | 180 (71.4%) | 72 (28.6%) |
| 2 Unit Apartments | 0 (0.0%) | 13 (100.0%) |
| 3 or 4 Unit Apartments | 0 (0.0%) | 0 (0.0%) |
| 5 to 9 Unit Apartments | 0 (0.0%) | 0 (0.0%) |
| 10 or more Apartments | 121 (42.0%) | 167 (58.0%) |
| Mobile Home / Other | 0 (0.0%) | 0 (0.0%) |
| Total | 2,136 (87.5%) | 304 (12.5%) |
Housing Structures by Number of Rooms in Walkersville
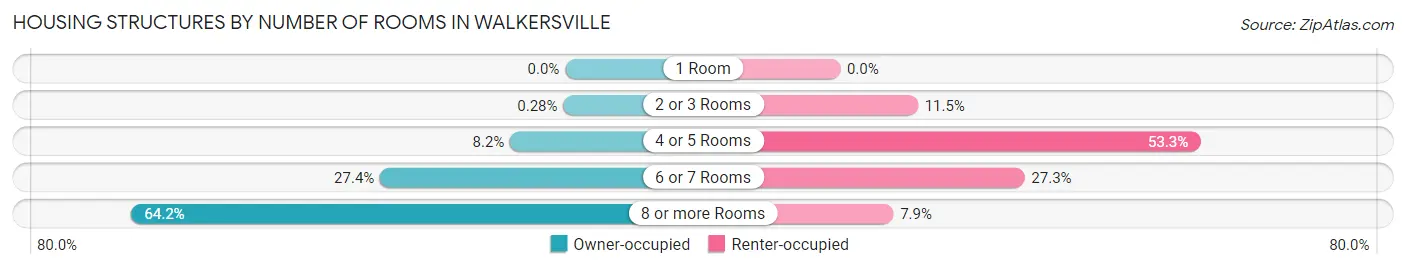
| Number of Rooms | Owner-occupied | Renter-occupied |
| 1 Room | 0 (0.0%) | 0 (0.0%) |
| 2 or 3 Rooms | 6 (0.3%) | 35 (11.5%) |
| 4 or 5 Rooms | 174 (8.2%) | 162 (53.3%) |
| 6 or 7 Rooms | 585 (27.4%) | 83 (27.3%) |
| 8 or more Rooms | 1,371 (64.2%) | 24 (7.9%) |
| Total | 2,136 (100.0%) | 304 (100.0%) |
Housing Structure by Heating Type in Walkersville
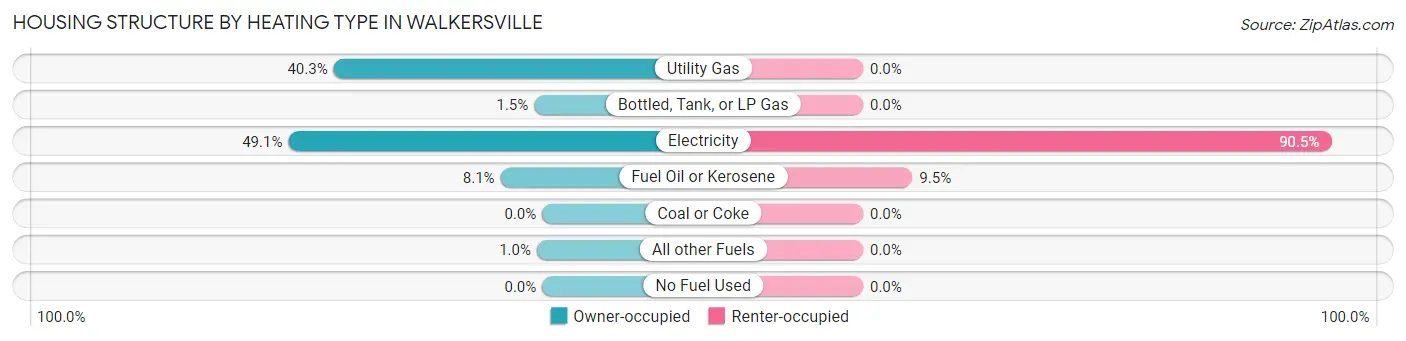
| Heating Type | Owner-occupied | Renter-occupied |
| Utility Gas | 861 (40.3%) | 0 (0.0%) |
| Bottled, Tank, or LP Gas | 33 (1.5%) | 0 (0.0%) |
| Electricity | 1,048 (49.1%) | 275 (90.5%) |
| Fuel Oil or Kerosene | 172 (8.1%) | 29 (9.5%) |
| Coal or Coke | 0 (0.0%) | 0 (0.0%) |
| All other Fuels | 22 (1.0%) | 0 (0.0%) |
| No Fuel Used | 0 (0.0%) | 0 (0.0%) |
| Total | 2,136 (100.0%) | 304 (100.0%) |
Household Vehicle Usage in Walkersville
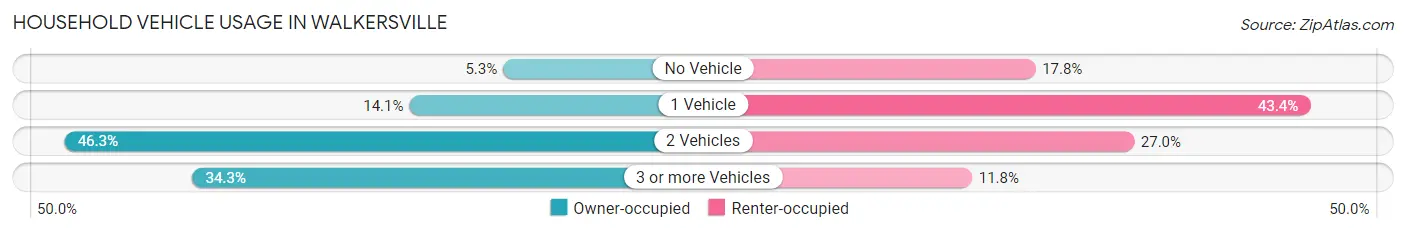
| Vehicles per Household | Owner-occupied | Renter-occupied |
| No Vehicle | 114 (5.3%) | 54 (17.8%) |
| 1 Vehicle | 301 (14.1%) | 132 (43.4%) |
| 2 Vehicles | 988 (46.3%) | 82 (27.0%) |
| 3 or more Vehicles | 733 (34.3%) | 36 (11.8%) |
| Total | 2,136 (100.0%) | 304 (100.0%) |
Real Estate & Mortgages in Walkersville
Real Estate and Mortgage Overview in Walkersville
| Characteristic | Without Mortgage | With Mortgage |
| Housing Units | 580 | 1,556 |
| Median Property Value | $323,900 | $434,400 |
| Median Household Income | $61,875 | $794 |
| Monthly Housing Costs | $592 | $422 |
| Real Estate Taxes | $3,463 | $78 |
Property Value by Mortgage Status in Walkersville
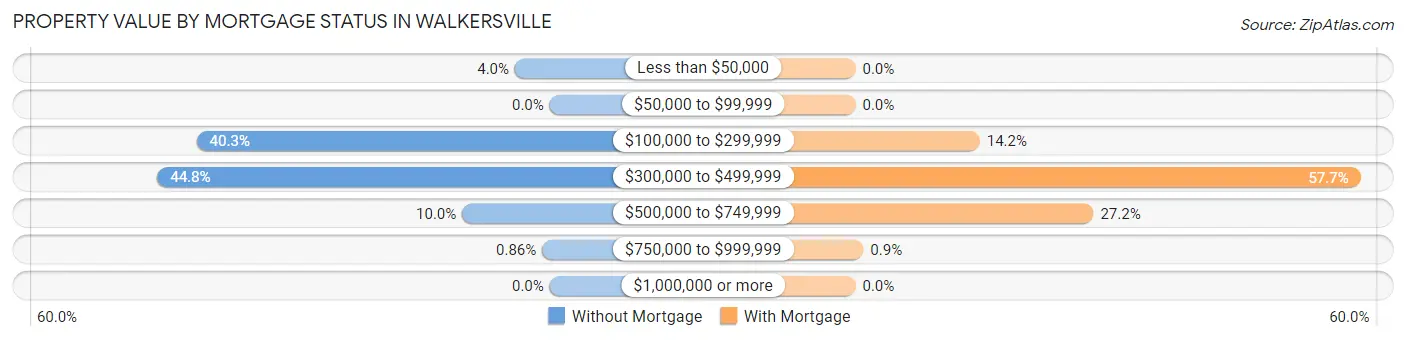
| Property Value | Without Mortgage | With Mortgage |
| Less than $50,000 | 23 (4.0%) | 0 (0.0%) |
| $50,000 to $99,999 | 0 (0.0%) | 0 (0.0%) |
| $100,000 to $299,999 | 234 (40.3%) | 221 (14.2%) |
| $300,000 to $499,999 | 260 (44.8%) | 898 (57.7%) |
| $500,000 to $749,999 | 58 (10.0%) | 423 (27.2%) |
| $750,000 to $999,999 | 5 (0.9%) | 14 (0.9%) |
| $1,000,000 or more | 0 (0.0%) | 0 (0.0%) |
| Total | 580 (100.0%) | 1,556 (100.0%) |
Household Income by Mortgage Status in Walkersville
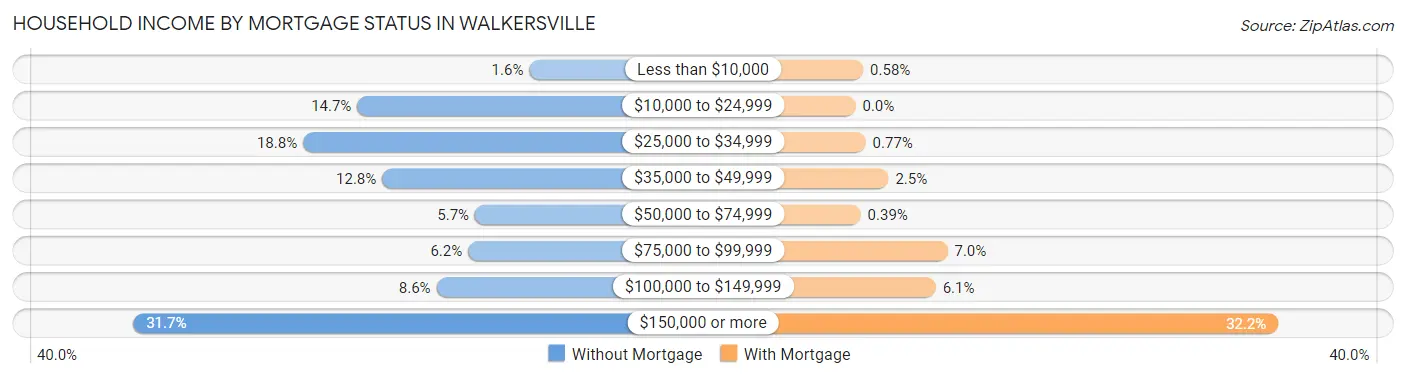
| Household Income | Without Mortgage | With Mortgage |
| Less than $10,000 | 9 (1.5%) | 9 (0.6%) |
| $10,000 to $24,999 | 85 (14.7%) | 0 (0.0%) |
| $25,000 to $34,999 | 109 (18.8%) | 12 (0.8%) |
| $35,000 to $49,999 | 74 (12.8%) | 39 (2.5%) |
| $50,000 to $74,999 | 33 (5.7%) | 6 (0.4%) |
| $75,000 to $99,999 | 36 (6.2%) | 109 (7.0%) |
| $100,000 to $149,999 | 50 (8.6%) | 95 (6.1%) |
| $150,000 or more | 184 (31.7%) | 501 (32.2%) |
| Total | 580 (100.0%) | 1,556 (100.0%) |
Property Value to Household Income Ratio in Walkersville
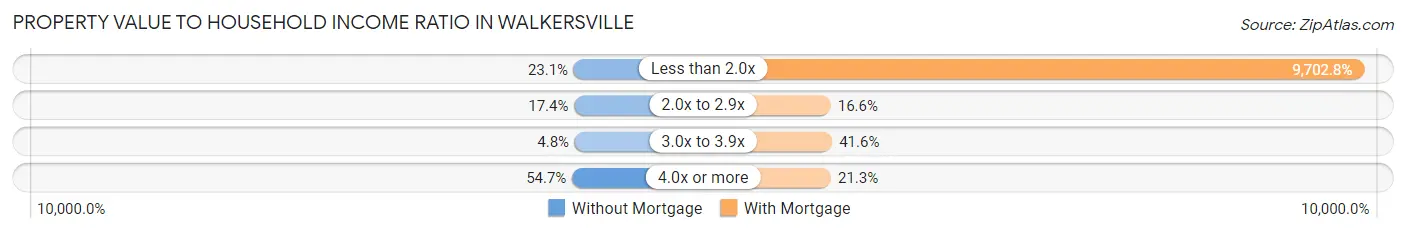
| Value-to-Income Ratio | Without Mortgage | With Mortgage |
| Less than 2.0x | 134 (23.1%) | 150,976 (9,702.8%) |
| 2.0x to 2.9x | 101 (17.4%) | 258 (16.6%) |
| 3.0x to 3.9x | 28 (4.8%) | 647 (41.6%) |
| 4.0x or more | 317 (54.7%) | 331 (21.3%) |
| Total | 580 (100.0%) | 1,556 (100.0%) |
Real Estate Taxes by Mortgage Status in Walkersville
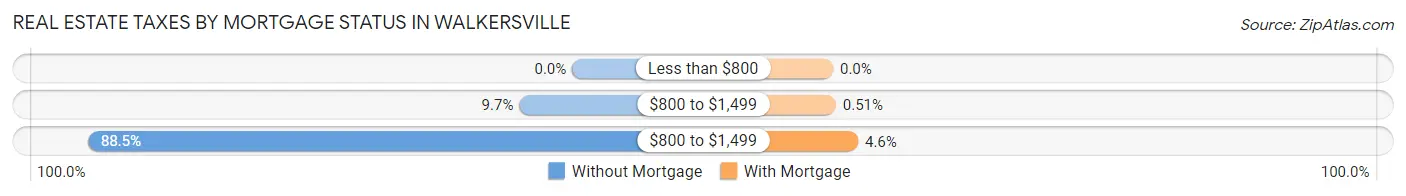
| Property Taxes | Without Mortgage | With Mortgage |
| Less than $800 | 0 (0.0%) | 0 (0.0%) |
| $800 to $1,499 | 56 (9.7%) | 8 (0.5%) |
| $800 to $1,499 | 513 (88.4%) | 71 (4.6%) |
| Total | 580 (100.0%) | 1,556 (100.0%) |
Health & Disability in Walkersville
Health Insurance Coverage by Age in Walkersville
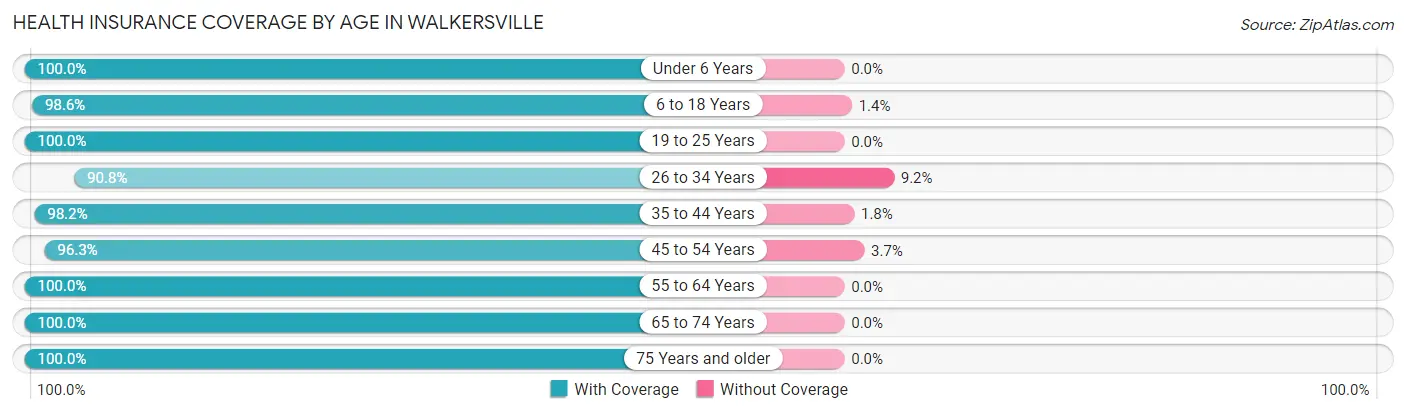
| Age Bracket | With Coverage | Without Coverage |
| Under 6 Years | 328 (100.0%) | 0 (0.0%) |
| 6 to 18 Years | 1,075 (98.6%) | 15 (1.4%) |
| 19 to 25 Years | 288 (100.0%) | 0 (0.0%) |
| 26 to 34 Years | 492 (90.8%) | 50 (9.2%) |
| 35 to 44 Years | 973 (98.2%) | 18 (1.8%) |
| 45 to 54 Years | 886 (96.3%) | 34 (3.7%) |
| 55 to 64 Years | 877 (100.0%) | 0 (0.0%) |
| 65 to 74 Years | 694 (100.0%) | 0 (0.0%) |
| 75 Years and older | 392 (100.0%) | 0 (0.0%) |
| Total | 6,005 (98.1%) | 117 (1.9%) |
Health Insurance Coverage by Citizenship Status in Walkersville
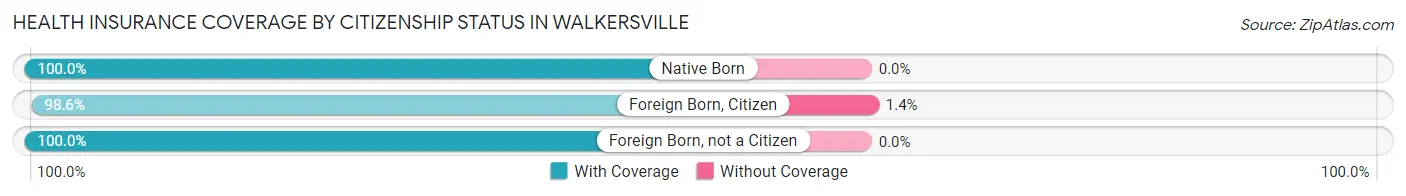
| Citizenship Status | With Coverage | Without Coverage |
| Native Born | 328 (100.0%) | 0 (0.0%) |
| Foreign Born, Citizen | 1,075 (98.6%) | 15 (1.4%) |
| Foreign Born, not a Citizen | 288 (100.0%) | 0 (0.0%) |
Health Insurance Coverage by Household Income in Walkersville
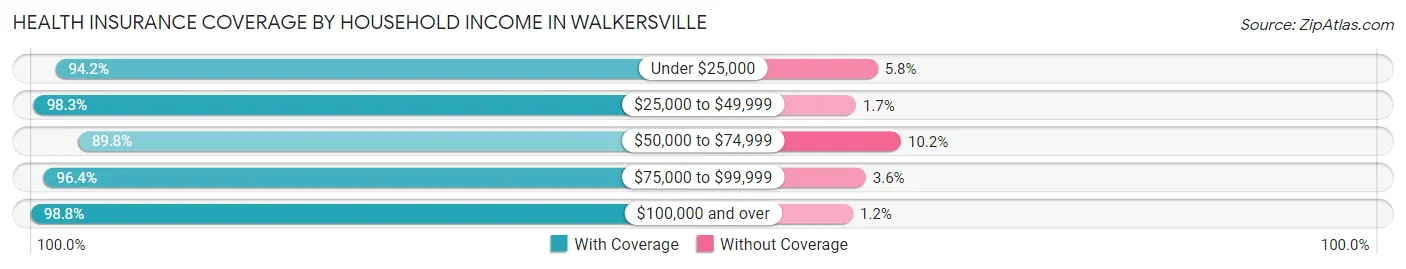
| Household Income | With Coverage | Without Coverage |
| Under $25,000 | 195 (94.2%) | 12 (5.8%) |
| $25,000 to $49,999 | 401 (98.3%) | 7 (1.7%) |
| $50,000 to $74,999 | 265 (89.8%) | 30 (10.2%) |
| $75,000 to $99,999 | 270 (96.4%) | 10 (3.6%) |
| $100,000 and over | 4,874 (98.8%) | 58 (1.2%) |
Public vs Private Health Insurance Coverage by Age in Walkersville
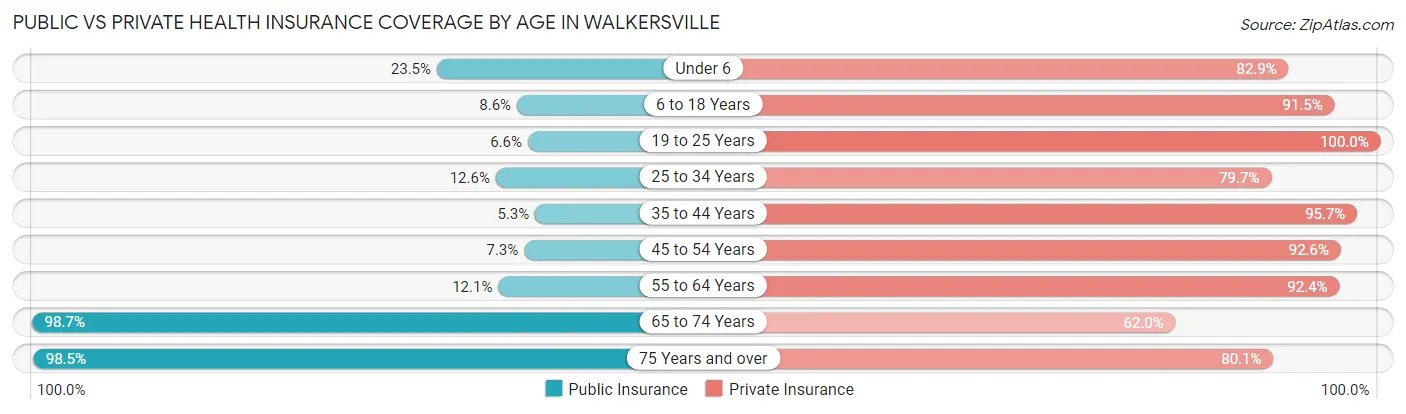
| Age Bracket | Public Insurance | Private Insurance |
| Under 6 | 77 (23.5%) | 272 (82.9%) |
| 6 to 18 Years | 94 (8.6%) | 997 (91.5%) |
| 19 to 25 Years | 19 (6.6%) | 288 (100.0%) |
| 25 to 34 Years | 68 (12.6%) | 432 (79.7%) |
| 35 to 44 Years | 52 (5.2%) | 948 (95.7%) |
| 45 to 54 Years | 67 (7.3%) | 852 (92.6%) |
| 55 to 64 Years | 106 (12.1%) | 810 (92.4%) |
| 65 to 74 Years | 685 (98.7%) | 430 (62.0%) |
| 75 Years and over | 386 (98.5%) | 314 (80.1%) |
| Total | 1,554 (25.4%) | 5,343 (87.3%) |
Disability Status by Sex by Age in Walkersville
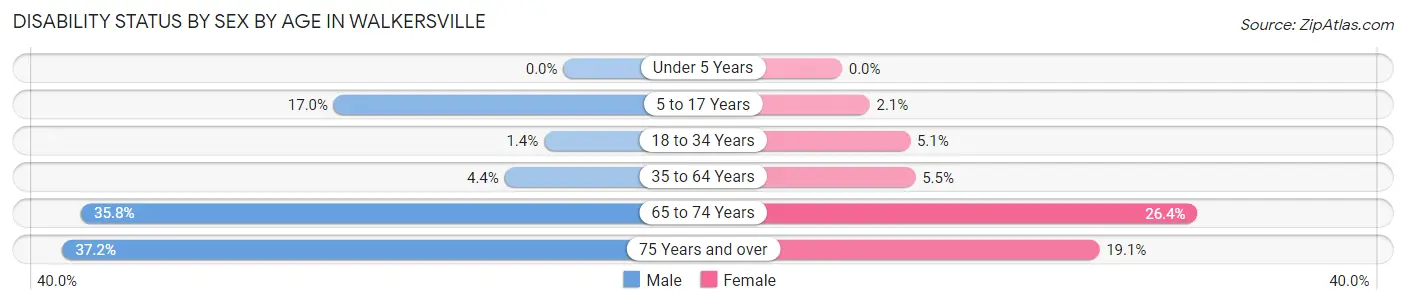
| Age Bracket | Male | Female |
| Under 5 Years | 0 (0.0%) | 0 (0.0%) |
| 5 to 17 Years | 84 (17.0%) | 11 (2.1%) |
| 18 to 34 Years | 6 (1.4%) | 27 (5.1%) |
| 35 to 64 Years | 60 (4.4%) | 77 (5.4%) |
| 65 to 74 Years | 121 (35.8%) | 94 (26.4%) |
| 75 Years and over | 29 (37.2%) | 60 (19.1%) |
Disability Class by Sex by Age in Walkersville
Disability Class: Hearing Difficulty
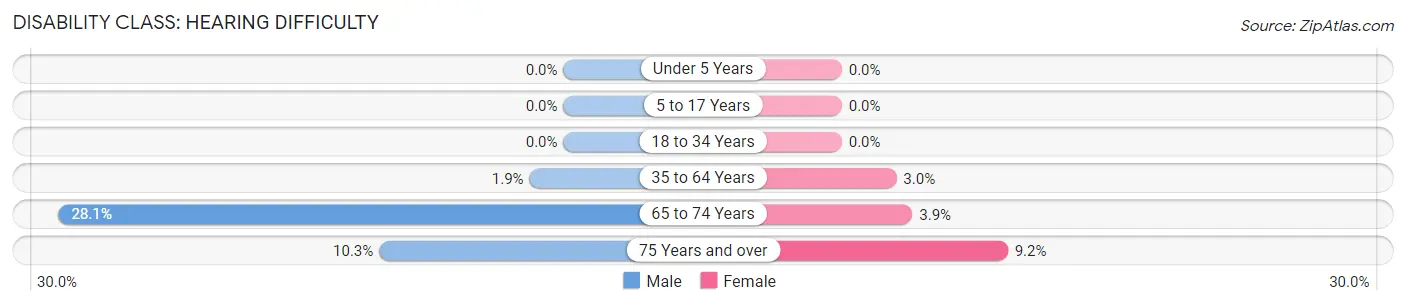
| Age Bracket | Male | Female |
| Under 5 Years | 0 (0.0%) | 0 (0.0%) |
| 5 to 17 Years | 0 (0.0%) | 0 (0.0%) |
| 18 to 34 Years | 0 (0.0%) | 0 (0.0%) |
| 35 to 64 Years | 26 (1.9%) | 43 (3.0%) |
| 65 to 74 Years | 95 (28.1%) | 14 (3.9%) |
| 75 Years and over | 8 (10.3%) | 29 (9.2%) |
Disability Class: Vision Difficulty
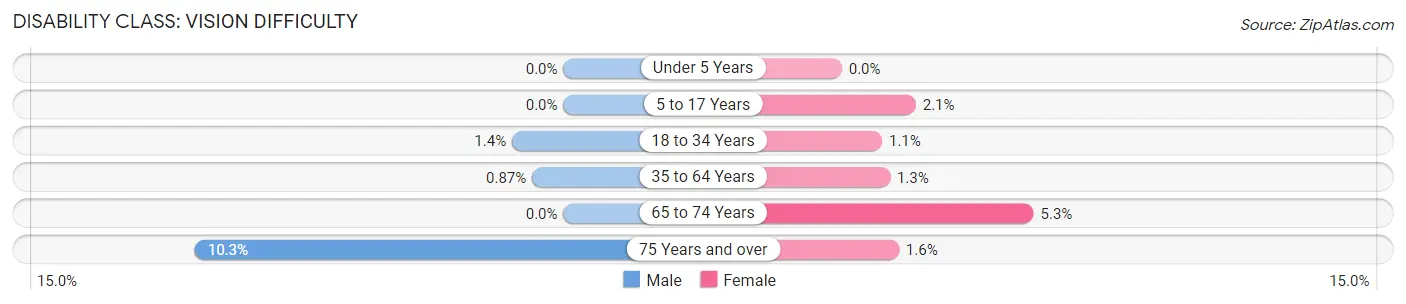
| Age Bracket | Male | Female |
| Under 5 Years | 0 (0.0%) | 0 (0.0%) |
| 5 to 17 Years | 0 (0.0%) | 11 (2.1%) |
| 18 to 34 Years | 6 (1.4%) | 6 (1.1%) |
| 35 to 64 Years | 12 (0.9%) | 19 (1.3%) |
| 65 to 74 Years | 0 (0.0%) | 19 (5.3%) |
| 75 Years and over | 8 (10.3%) | 5 (1.6%) |
Disability Class: Cognitive Difficulty
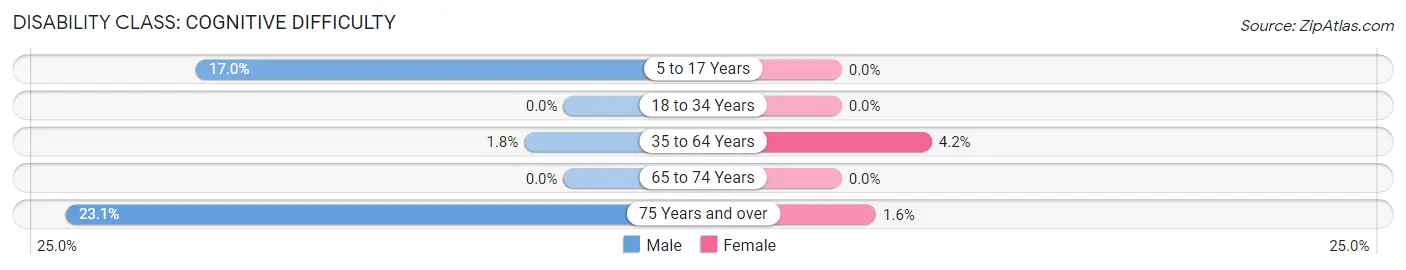
| Age Bracket | Male | Female |
| 5 to 17 Years | 84 (17.0%) | 0 (0.0%) |
| 18 to 34 Years | 0 (0.0%) | 0 (0.0%) |
| 35 to 64 Years | 25 (1.8%) | 59 (4.2%) |
| 65 to 74 Years | 0 (0.0%) | 0 (0.0%) |
| 75 Years and over | 18 (23.1%) | 5 (1.6%) |
Disability Class: Ambulatory Difficulty
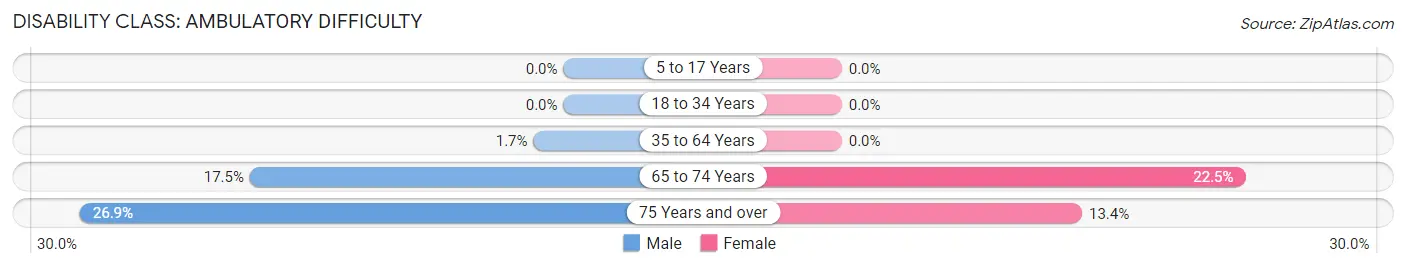
| Age Bracket | Male | Female |
| 5 to 17 Years | 0 (0.0%) | 0 (0.0%) |
| 18 to 34 Years | 0 (0.0%) | 0 (0.0%) |
| 35 to 64 Years | 23 (1.7%) | 0 (0.0%) |
| 65 to 74 Years | 59 (17.5%) | 80 (22.5%) |
| 75 Years and over | 21 (26.9%) | 42 (13.4%) |
Disability Class: Self-Care Difficulty
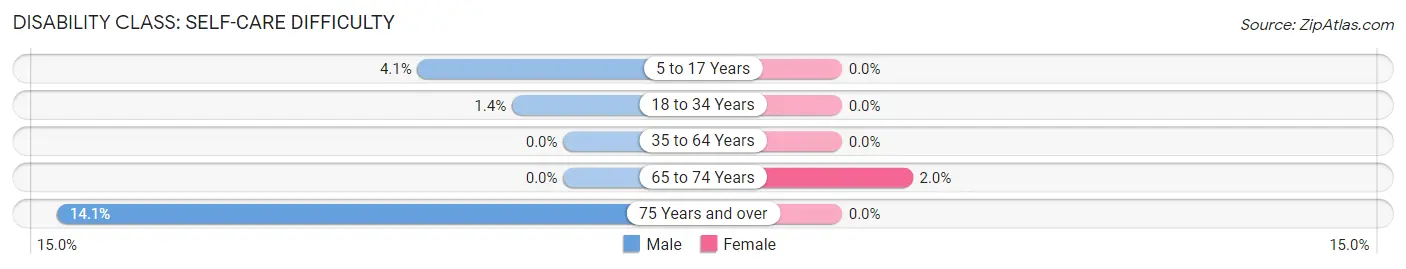
| Age Bracket | Male | Female |
| 5 to 17 Years | 20 (4.1%) | 0 (0.0%) |
| 18 to 34 Years | 6 (1.4%) | 0 (0.0%) |
| 35 to 64 Years | 0 (0.0%) | 0 (0.0%) |
| 65 to 74 Years | 0 (0.0%) | 7 (2.0%) |
| 75 Years and over | 11 (14.1%) | 0 (0.0%) |
Technology Access in Walkersville
Computing Device Access in Walkersville
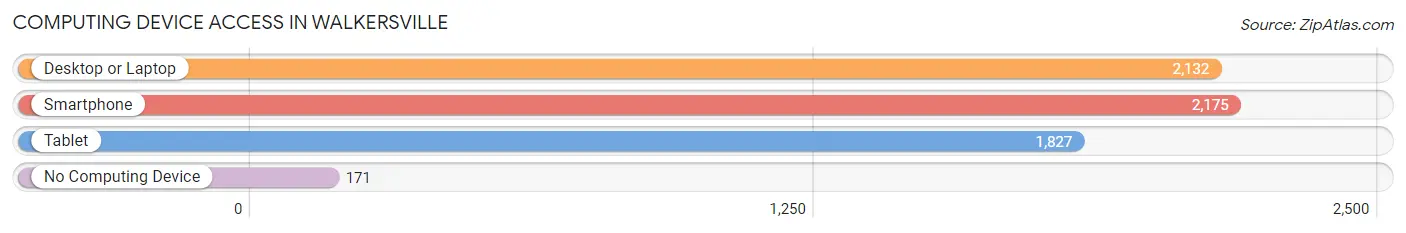
| Device Type | # Households | % Households |
| Desktop or Laptop | 2,132 | 87.4% |
| Smartphone | 2,175 | 89.1% |
| Tablet | 1,827 | 74.9% |
| No Computing Device | 171 | 7.0% |
| Total | 2,440 | 100.0% |
Internet Access in Walkersville
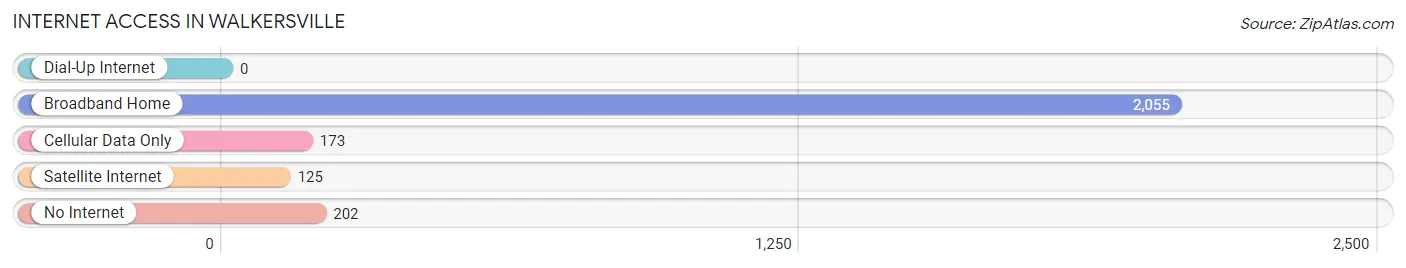
| Internet Type | # Households | % Households |
| Dial-Up Internet | 0 | 0.0% |
| Broadband Home | 2,055 | 84.2% |
| Cellular Data Only | 173 | 7.1% |
| Satellite Internet | 125 | 5.1% |
| No Internet | 202 | 8.3% |
| Total | 2,440 | 100.0% |
Walkersville Summary
Walkersville, MD is a small town located in Frederick County, Maryland. It is situated in the northern part of the state, about 25 miles northwest of Baltimore and 40 miles west of Washington, D.C. The town has a population of approximately 4,000 people and covers an area of 1.3 square miles.
History
The area that is now Walkersville was first settled in 1732 by German immigrants. The town was originally known as “Walker’s Crossroads” after the family that owned the land. In 1832, the town was officially incorporated as Walkersville.
The town was a major stop on the Baltimore and Ohio Railroad, which ran through the town from 1831 to 1971. The railroad was a major factor in the town’s growth and development.
In the late 19th century, the town was home to several industries, including a brickyard, a cannery, and a flour mill. The town also had a thriving agricultural industry, with many farms producing wheat, corn, and other crops.
Geography
Walkersville is located in the northern part of Frederick County, Maryland. It is situated in the Catoctin Valley, which is part of the Appalachian Mountains. The town is surrounded by rolling hills and farmland.
The town is located at the intersection of two major highways, Interstate 70 and U.S. Route 15. The town is also served by the Frederick Municipal Airport, which is located just outside of town.
Economy
The economy of Walkersville is largely based on agriculture and tourism. The town is home to several farms, which produce a variety of crops, including wheat, corn, and soybeans.
The town is also home to several tourist attractions, including the Walkersville Southern Railroad, a historic steam train that runs through the town. The town also has several restaurants, shops, and other businesses that cater to tourists.
Demographics
As of the 2010 census, the population of Walkersville was 4,000. The town is predominantly white, with about 90% of the population being Caucasian. The town also has a small African American population, as well as a small Hispanic population.
The median household income in Walkersville is $60,000, which is slightly higher than the national average. The town also has a low unemployment rate, with only 4.5% of the population being unemployed.
Conclusion
Walkersville, MD is a small town located in Frederick County, Maryland. It has a population of approximately 4,000 people and covers an area of 1.3 square miles. The town has a long history, dating back to the 18th century, and has a thriving economy based on agriculture and tourism. The town is predominantly white, with a small African American and Hispanic population. The median household income in Walkersville is $60,000, and the town has a low unemployment rate.
Common Questions
What is Per Capita Income in Walkersville?
Per Capita income in Walkersville is $56,711.
What is the Median Family Income in Walkersville?
Median Family Income in Walkersville is $149,487.
What is the Median Household income in Walkersville?
Median Household Income in Walkersville is $138,190.
What is Income or Wage Gap in Walkersville?
Income or Wage Gap in Walkersville is 29.4%.
Women in Walkersville earn 70.6 cents for every dollar earned by a man.
What is Inequality or Gini Index in Walkersville?
Inequality or Gini Index in Walkersville is 0.35.
What is the Total Population of Walkersville?
Total Population of Walkersville is 6,239.
What is the Total Male Population of Walkersville?
Total Male Population of Walkersville is 2,841.
What is the Total Female Population of Walkersville?
Total Female Population of Walkersville is 3,398.
What is the Ratio of Males per 100 Females in Walkersville?
There are 83.61 Males per 100 Females in Walkersville.
What is the Ratio of Females per 100 Males in Walkersville?
There are 119.61 Females per 100 Males in Walkersville.
What is the Median Population Age in Walkersville?
Median Population Age in Walkersville is 44.1 Years.
What is the Average Family Size in Walkersville
Average Family Size in Walkersville is 3.0 People.
What is the Average Household Size in Walkersville
Average Household Size in Walkersville is 2.5 People.
How Large is the Labor Force in Walkersville?
There are 3,670 People in the Labor Forcein in Walkersville.
What is the Percentage of People in the Labor Force in Walkersville?
72.1% of People are in the Labor Force in Walkersville.
What is the Unemployment Rate in Walkersville?
Unemployment Rate in Walkersville is 1.3%.