Rock Hall, MD Map & Demographics
Rock Hall Map
Rock Hall Overview
$38,739
PER CAPITA INCOME
$69,306
AVG FAMILY INCOME
$56,442
AVG HOUSEHOLD INCOME
24.5%
WAGE / INCOME GAP [ % ]
75.5¢/ $1
WAGE / INCOME GAP [ $ ]
0.46
INEQUALITY / GINI INDEX
1,456
TOTAL POPULATION
664
MALE POPULATION
792
FEMALE POPULATION
83.84
MALES / 100 FEMALES
119.28
FEMALES / 100 MALES
59.7
MEDIAN AGE
2.5
AVG FAMILY SIZE
2.0
AVG HOUSEHOLD SIZE
675
LABOR FORCE [ PEOPLE ]
53.0%
PERCENT IN LABOR FORCE
5.2%
UNEMPLOYMENT RATE
Rock Hall Zip Codes
Rock Hall Area Codes
Income in Rock Hall
Income Overview in Rock Hall
Per Capita Income in Rock Hall is $38,739, while median incomes of families and households are $69,306 and $56,442 respectively.
| Characteristic | Number | Measure |
| Per Capita Income | 1,456 | $38,739 |
| Median Family Income | 397 | $69,306 |
| Mean Family Income | 397 | $93,648 |
| Median Household Income | 709 | $56,442 |
| Mean Household Income | 709 | $78,124 |
| Income Deficit | 397 | $0 |
| Wage / Income Gap (%) | 1,456 | 24.55% |
| Wage / Income Gap ($) | 1,456 | 75.45¢ per $1 |
| Gini / Inequality Index | 1,456 | 0.46 |
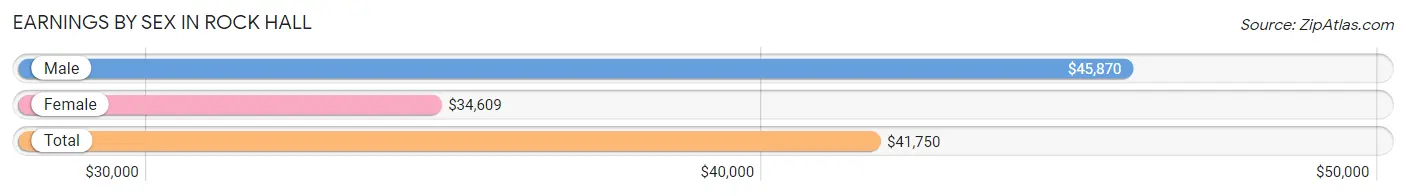
Earnings by Sex in Rock Hall
Average Earnings in Rock Hall are $41,750, $45,870 for men and $34,609 for women, a difference of 24.5%.
| Sex | Number | Average Earnings |
| Male | 366 (52.8%) | $45,870 |
| Female | 327 (47.2%) | $34,609 |
| Total | 693 (100.0%) | $41,750 |
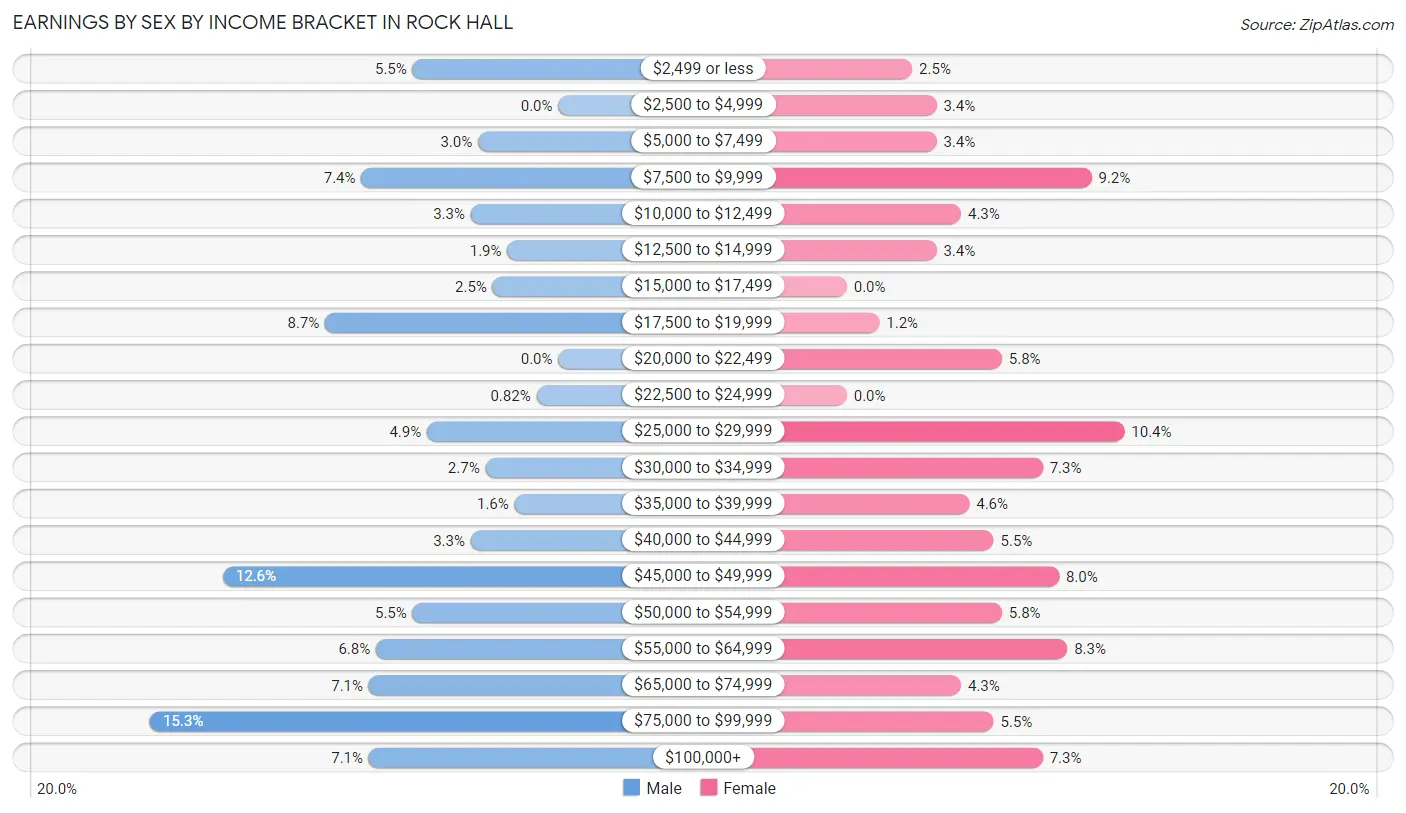
Earnings by Sex by Income Bracket in Rock Hall
The most common earnings brackets in Rock Hall are $75,000 to $99,999 for men (56 | 15.3%) and $25,000 to $29,999 for women (34 | 10.4%).
| Income | Male | Female |
| $2,499 or less | 20 (5.5%) | 8 (2.5%) |
| $2,500 to $4,999 | 0 (0.0%) | 11 (3.4%) |
| $5,000 to $7,499 | 11 (3.0%) | 11 (3.4%) |
| $7,500 to $9,999 | 27 (7.4%) | 30 (9.2%) |
| $10,000 to $12,499 | 12 (3.3%) | 14 (4.3%) |
| $12,500 to $14,999 | 7 (1.9%) | 11 (3.4%) |
| $15,000 to $17,499 | 9 (2.5%) | 0 (0.0%) |
| $17,500 to $19,999 | 32 (8.7%) | 4 (1.2%) |
| $20,000 to $22,499 | 0 (0.0%) | 19 (5.8%) |
| $22,500 to $24,999 | 3 (0.8%) | 0 (0.0%) |
| $25,000 to $29,999 | 18 (4.9%) | 34 (10.4%) |
| $30,000 to $34,999 | 10 (2.7%) | 24 (7.3%) |
| $35,000 to $39,999 | 6 (1.6%) | 15 (4.6%) |
| $40,000 to $44,999 | 12 (3.3%) | 18 (5.5%) |
| $45,000 to $49,999 | 46 (12.6%) | 26 (8.0%) |
| $50,000 to $54,999 | 20 (5.5%) | 19 (5.8%) |
| $55,000 to $64,999 | 25 (6.8%) | 27 (8.3%) |
| $65,000 to $74,999 | 26 (7.1%) | 14 (4.3%) |
| $75,000 to $99,999 | 56 (15.3%) | 18 (5.5%) |
| $100,000+ | 26 (7.1%) | 24 (7.3%) |
| Total | 366 (100.0%) | 327 (100.0%) |
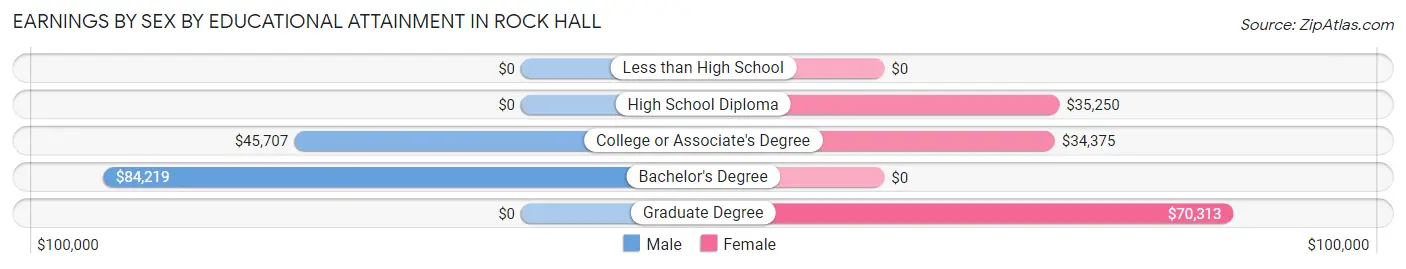
Earnings by Sex by Educational Attainment in Rock Hall
Average earnings in Rock Hall are $46,658 for men and $41,146 for women, a difference of 11.8%. Men with an educational attainment of bachelor's degree enjoy the highest average annual earnings of $84,219, while those with college or associate's degree education earn the least with $45,707. Women with an educational attainment of graduate degree earn the most with the average annual earnings of $70,313, while those with college or associate's degree education have the smallest earnings of $34,375.
| Educational Attainment | Male Income | Female Income |
| Less than High School | - | - |
| High School Diploma | - | - |
| College or Associate's Degree | $45,707 | $34,375 |
| Bachelor's Degree | $84,219 | $0 |
| Graduate Degree | - | - |
| Total | $46,658 | $41,146 |
Family Income in Rock Hall
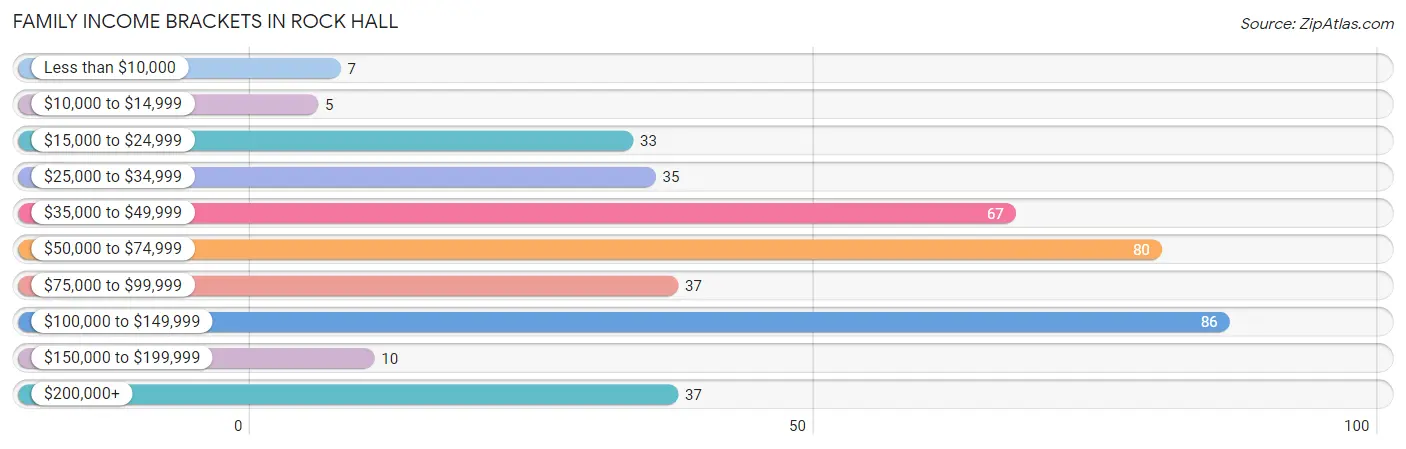
Family Income Brackets in Rock Hall
According to the Rock Hall family income data, there are 86 families falling into the $100,000 to $149,999 income range, which is the most common income bracket and makes up 21.7% of all families. Conversely, the $10,000 to $14,999 income bracket is the least frequent group with only 5 families (1.3%) belonging to this category.
| Income Bracket | # Families | % Families |
| Less than $10,000 | 7 | 1.8% |
| $10,000 to $14,999 | 5 | 1.3% |
| $15,000 to $24,999 | 33 | 8.3% |
| $25,000 to $34,999 | 35 | 8.8% |
| $35,000 to $49,999 | 67 | 16.9% |
| $50,000 to $74,999 | 80 | 20.2% |
| $75,000 to $99,999 | 37 | 9.3% |
| $100,000 to $149,999 | 86 | 21.7% |
| $150,000 to $199,999 | 10 | 2.5% |
| $200,000+ | 37 | 9.3% |
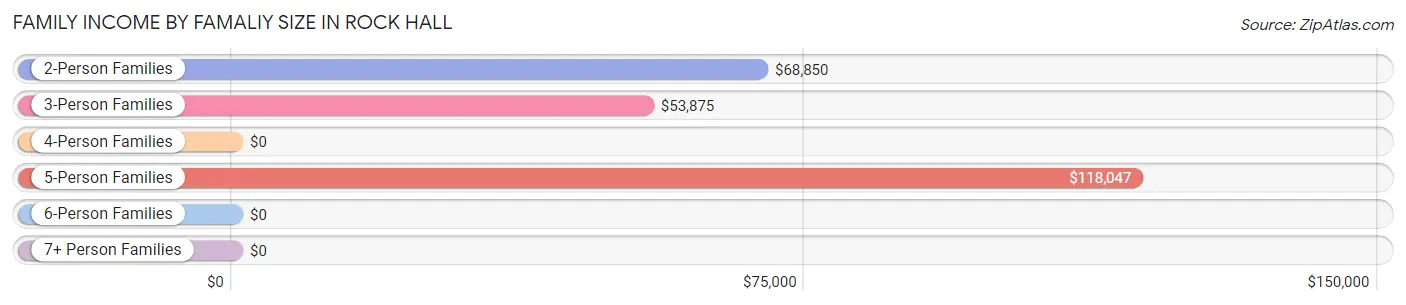
Family Income by Famaliy Size in Rock Hall
5-person families (25 | 6.3%) account for the highest median family income in Rock Hall with $118,047 per family, while 2-person families (283 | 71.3%) have the highest median income of $34,425 per family member.
| Income Bracket | # Families | Median Income |
| 2-Person Families | 283 (71.3%) | $68,850 |
| 3-Person Families | 37 (9.3%) | $53,875 |
| 4-Person Families | 39 (9.8%) | $0 |
| 5-Person Families | 25 (6.3%) | $118,047 |
| 6-Person Families | 13 (3.3%) | $0 |
| 7+ Person Families | 0 (0.0%) | $0 |
| Total | 397 (100.0%) | $69,306 |
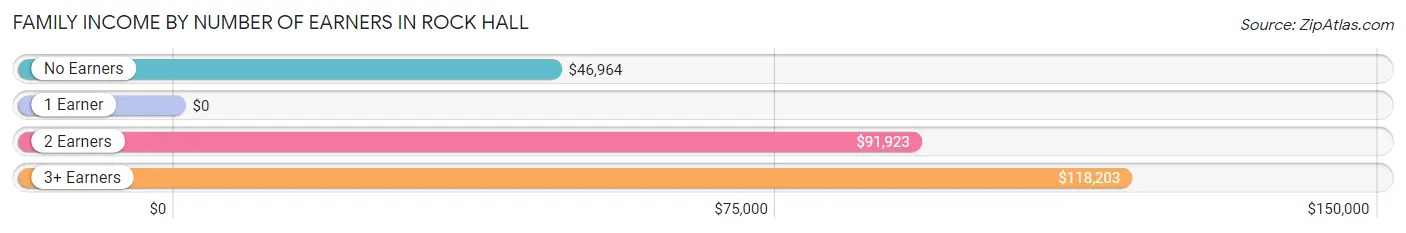
Family Income by Number of Earners in Rock Hall
| Number of Earners | # Families | Median Income |
| No Earners | 103 (25.9%) | $46,964 |
| 1 Earner | 147 (37.0%) | $0 |
| 2 Earners | 112 (28.2%) | $91,923 |
| 3+ Earners | 35 (8.8%) | $118,203 |
| Total | 397 (100.0%) | $69,306 |
Household Income in Rock Hall
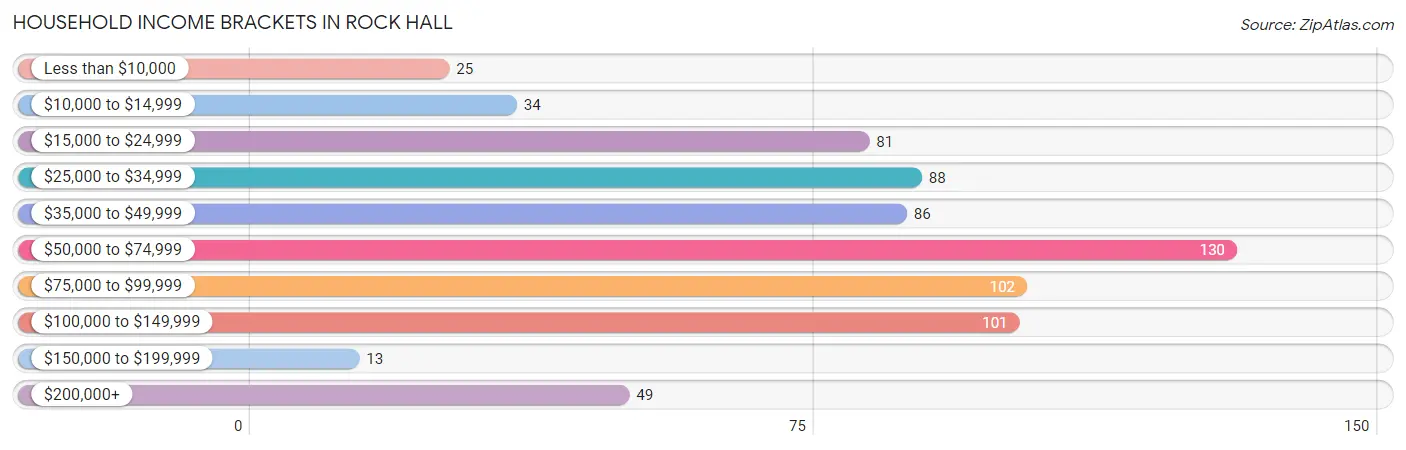
Household Income Brackets in Rock Hall
With 130 households falling in the category, the $50,000 to $74,999 income range is the most frequent in Rock Hall, accounting for 18.3% of all households. In contrast, only 13 households (1.8%) fall into the $150,000 to $199,999 income bracket, making it the least populous group.
| Income Bracket | # Households | % Households |
| Less than $10,000 | 25 | 3.5% |
| $10,000 to $14,999 | 34 | 4.8% |
| $15,000 to $24,999 | 81 | 11.4% |
| $25,000 to $34,999 | 88 | 12.4% |
| $35,000 to $49,999 | 86 | 12.1% |
| $50,000 to $74,999 | 130 | 18.3% |
| $75,000 to $99,999 | 102 | 14.4% |
| $100,000 to $149,999 | 101 | 14.2% |
| $150,000 to $199,999 | 13 | 1.8% |
| $200,000+ | 49 | 6.9% |
Household Income by Householder Age in Rock Hall
The median household income in Rock Hall is $56,442, with the highest median household income of $90,823 found in the 25 to 44 years age bracket for the primary householder. A total of 125 households (17.6%) fall into this category. Meanwhile, the 15 to 24 years age bracket for the primary householder has the lowest median household income of $0, with 20 households (2.8%) in this group.
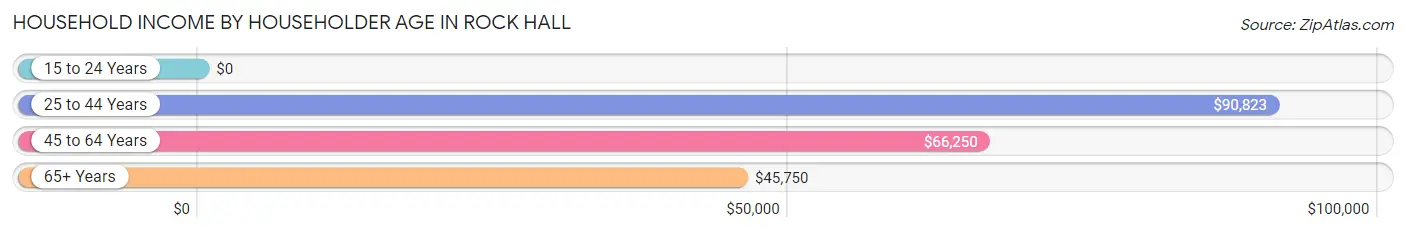
| Income Bracket | # Households | Median Income |
| 15 to 24 Years | 20 (2.8%) | $0 |
| 25 to 44 Years | 125 (17.6%) | $90,823 |
| 45 to 64 Years | 191 (26.9%) | $66,250 |
| 65+ Years | 373 (52.6%) | $45,750 |
| Total | 709 (100.0%) | $56,442 |
Poverty in Rock Hall
Income Below Poverty by Sex and Age in Rock Hall
With 9.6% poverty level for males and 15.3% for females among the residents of Rock Hall, 16 and 17 year old males and 5 year old females are the most vulnerable to poverty, with 2 males (100.0%) and 3 females (100.0%) in their respective age groups living below the poverty level.
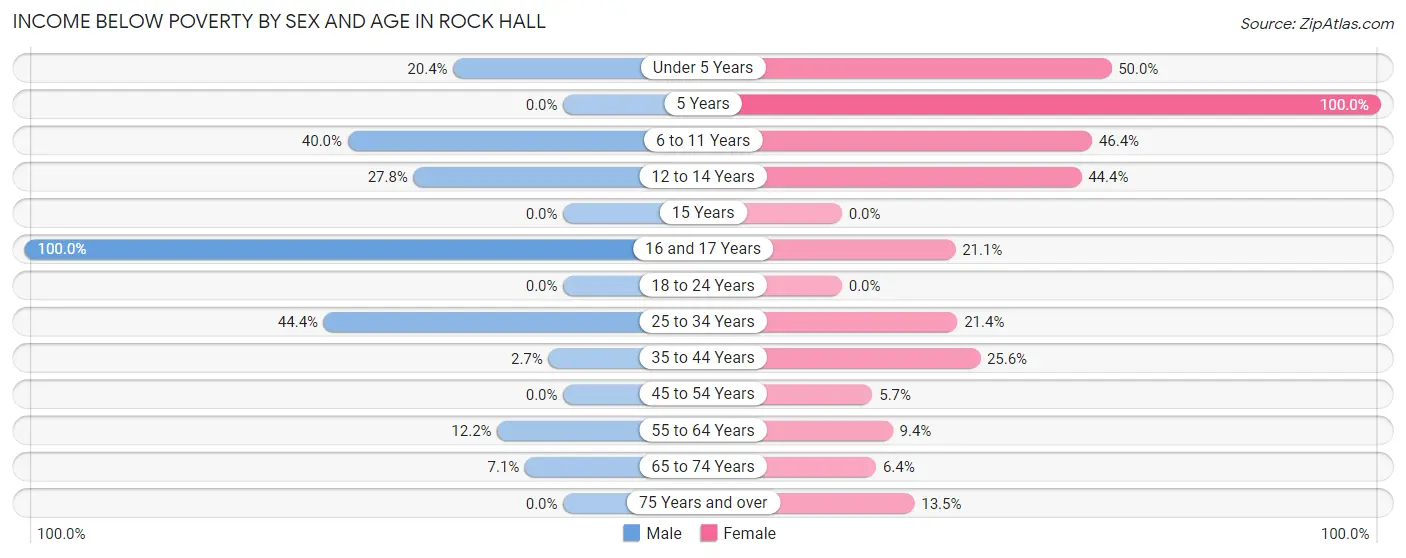
| Age Bracket | Male | Female |
| Under 5 Years | 10 (20.4%) | 7 (50.0%) |
| 5 Years | 0 (0.0%) | 3 (100.0%) |
| 6 to 11 Years | 6 (40.0%) | 13 (46.4%) |
| 12 to 14 Years | 5 (27.8%) | 16 (44.4%) |
| 15 Years | 0 (0.0%) | 0 (0.0%) |
| 16 and 17 Years | 2 (100.0%) | 4 (21.0%) |
| 18 to 24 Years | 0 (0.0%) | 0 (0.0%) |
| 25 to 34 Years | 16 (44.4%) | 12 (21.4%) |
| 35 to 44 Years | 2 (2.7%) | 20 (25.6%) |
| 45 to 54 Years | 0 (0.0%) | 3 (5.7%) |
| 55 to 64 Years | 12 (12.2%) | 10 (9.4%) |
| 65 to 74 Years | 9 (7.1%) | 12 (6.4%) |
| 75 Years and over | 0 (0.0%) | 16 (13.5%) |
| Total | 62 (9.6%) | 116 (15.3%) |
Income Above Poverty by Sex and Age in Rock Hall
According to the poverty statistics in Rock Hall, males aged 5 years and females aged 15 years are the age groups that are most secure financially, with 100.0% of males and 100.0% of females in these age groups living above the poverty line.
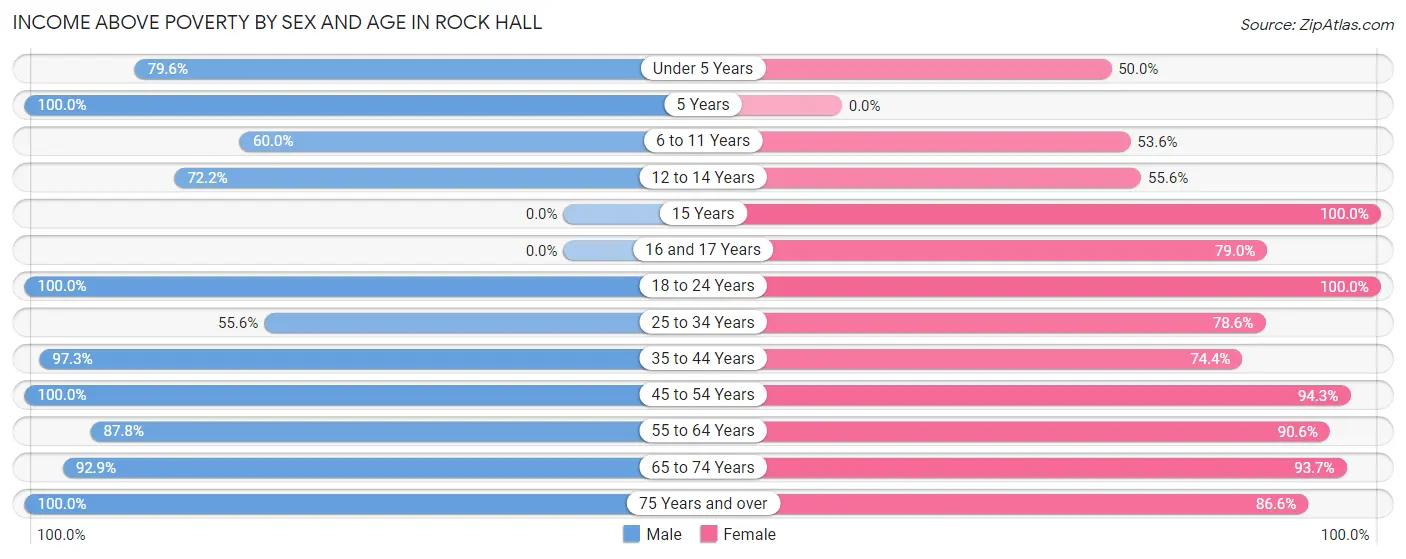
| Age Bracket | Male | Female |
| Under 5 Years | 39 (79.6%) | 7 (50.0%) |
| 5 Years | 3 (100.0%) | 0 (0.0%) |
| 6 to 11 Years | 9 (60.0%) | 15 (53.6%) |
| 12 to 14 Years | 13 (72.2%) | 20 (55.6%) |
| 15 Years | 0 (0.0%) | 13 (100.0%) |
| 16 and 17 Years | 0 (0.0%) | 15 (78.9%) |
| 18 to 24 Years | 61 (100.0%) | 46 (100.0%) |
| 25 to 34 Years | 20 (55.6%) | 44 (78.6%) |
| 35 to 44 Years | 71 (97.3%) | 58 (74.4%) |
| 45 to 54 Years | 25 (100.0%) | 50 (94.3%) |
| 55 to 64 Years | 86 (87.8%) | 96 (90.6%) |
| 65 to 74 Years | 118 (92.9%) | 177 (93.6%) |
| 75 Years and over | 141 (100.0%) | 103 (86.6%) |
| Total | 586 (90.4%) | 644 (84.7%) |
Income Below Poverty Among Married-Couple Families in Rock Hall
The poverty statistics for married-couple families in Rock Hall show that 6.0% or 18 of the total 302 families live below the poverty line. Families with 3 or 4 children have the highest poverty rate of 100.0%, comprising of 13 families. On the other hand, families with no children have the lowest poverty rate of 0.0%, which includes 0 families.
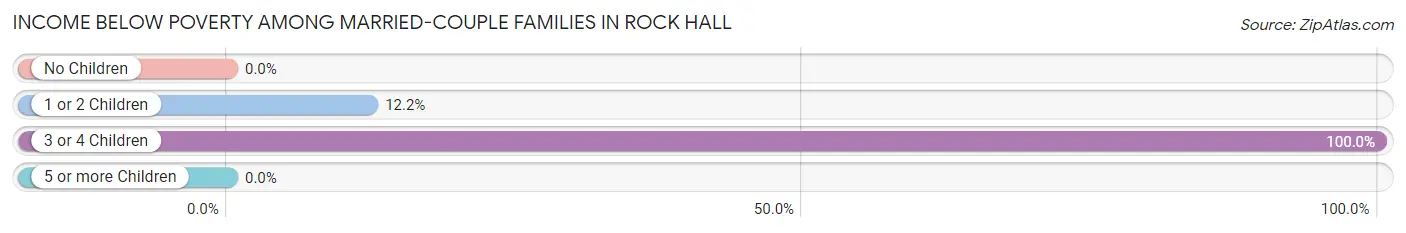
| Children | Above Poverty | Below Poverty |
| No Children | 248 (100.0%) | 0 (0.0%) |
| 1 or 2 Children | 36 (87.8%) | 5 (12.2%) |
| 3 or 4 Children | 0 (0.0%) | 13 (100.0%) |
| 5 or more Children | 0 (0.0%) | 0 (0.0%) |
| Total | 284 (94.0%) | 18 (6.0%) |
Income Below Poverty Among Single-Parent Households in Rock Hall
According to the poverty data in Rock Hall, 22.2% or 2 single-father households and 8.1% or 7 single-mother households are living below the poverty line. Among single-father households, those with 3 or 4 children have the highest poverty rate, with 2 households (100.0%) experiencing poverty. Likewise, among single-mother households, those with 1 or 2 children have the highest poverty rate, with 7 households (14.6%) falling below the poverty line.
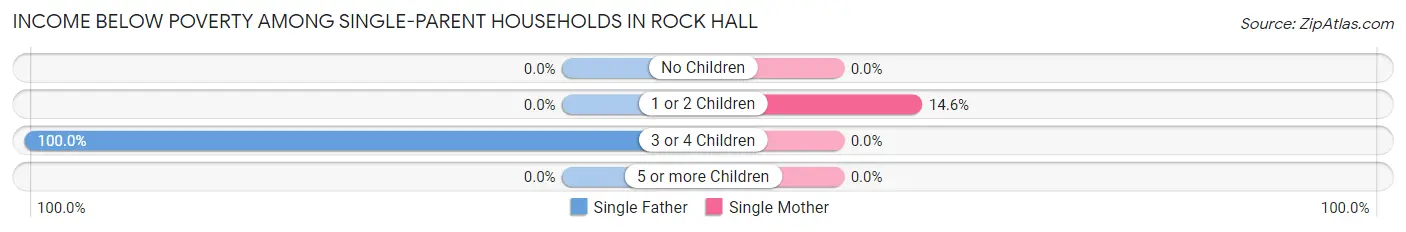
| Children | Single Father | Single Mother |
| No Children | 0 (0.0%) | 0 (0.0%) |
| 1 or 2 Children | 0 (0.0%) | 7 (14.6%) |
| 3 or 4 Children | 2 (100.0%) | 0 (0.0%) |
| 5 or more Children | 0 (0.0%) | 0 (0.0%) |
| Total | 2 (22.2%) | 7 (8.1%) |
Income Below Poverty Among Married-Couple vs Single-Parent Households in Rock Hall
The poverty data for Rock Hall shows that 18 of the married-couple family households (6.0%) and 9 of the single-parent households (9.5%) are living below the poverty level. Within the married-couple family households, those with 3 or 4 children have the highest poverty rate, with 13 households (100.0%) falling below the poverty line. Among the single-parent households, those with 3 or 4 children have the highest poverty rate, with 2 household (22.2%) living below poverty.
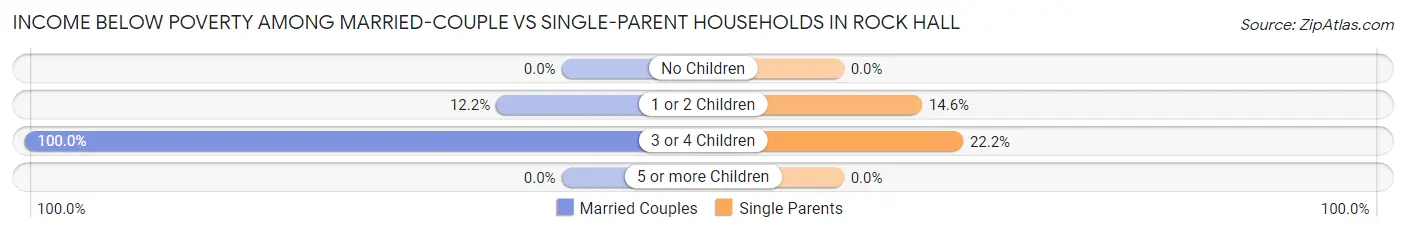
| Children | Married-Couple Families | Single-Parent Households |
| No Children | 0 (0.0%) | 0 (0.0%) |
| 1 or 2 Children | 5 (12.2%) | 7 (14.6%) |
| 3 or 4 Children | 13 (100.0%) | 2 (22.2%) |
| 5 or more Children | 0 (0.0%) | 0 (0.0%) |
| Total | 18 (6.0%) | 9 (9.5%) |
Race in Rock Hall
The most populous races in Rock Hall are White / Caucasian (1,248 | 85.7%), Black / African American (112 | 7.7%), and Some other Race (57 | 3.9%).
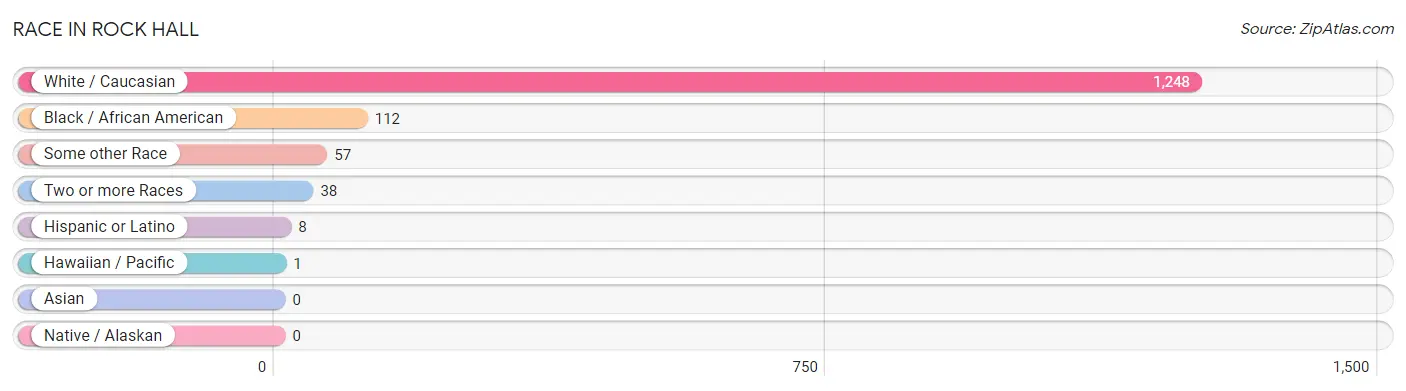
| Race | # Population | % Population |
| Asian | 0 | 0.0% |
| Black / African American | 112 | 7.7% |
| Hawaiian / Pacific | 1 | 0.1% |
| Hispanic or Latino | 8 | 0.5% |
| Native / Alaskan | 0 | 0.0% |
| White / Caucasian | 1,248 | 85.7% |
| Two or more Races | 38 | 2.6% |
| Some other Race | 57 | 3.9% |
| Total | 1,456 | 100.0% |
Ancestry in Rock Hall
The most populous ancestries reported in Rock Hall are English (300 | 20.6%), Irish (300 | 20.6%), German (203 | 13.9%), American (108 | 7.4%), and Italian (93 | 6.4%), together accounting for 69.0% of all Rock Hall residents.
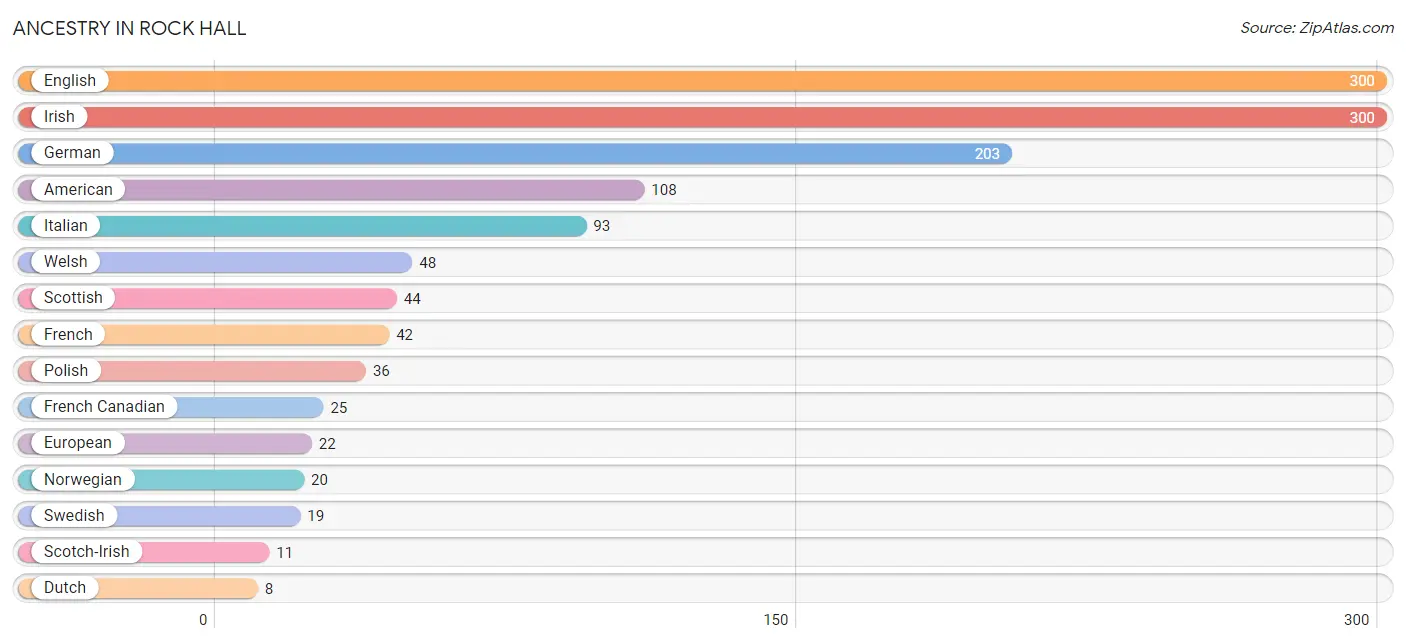
| Ancestry | # Population | % Population |
| American | 108 | 7.4% |
| British | 5 | 0.3% |
| Cherokee | 4 | 0.3% |
| Czech | 5 | 0.3% |
| Dutch | 8 | 0.5% |
| English | 300 | 20.6% |
| European | 22 | 1.5% |
| French | 42 | 2.9% |
| French Canadian | 25 | 1.7% |
| German | 203 | 13.9% |
| Irish | 300 | 20.6% |
| Italian | 93 | 6.4% |
| Native Hawaiian | 1 | 0.1% |
| Northern European | 4 | 0.3% |
| Norwegian | 20 | 1.4% |
| Polish | 36 | 2.5% |
| Puerto Rican | 8 | 0.5% |
| Scandinavian | 6 | 0.4% |
| Scotch-Irish | 11 | 0.8% |
| Scottish | 44 | 3.0% |
| Swedish | 19 | 1.3% |
| Welsh | 48 | 3.3% | View All 22 Rows |
Immigrants in Rock Hall
The most numerous immigrant groups reported in Rock Hall came from Europe (9 | 0.6%), Northern Europe (9 | 0.6%), Scotland (7 | 0.5%), and Canada (3 | 0.2%), together accounting for 1.9% of all Rock Hall residents.
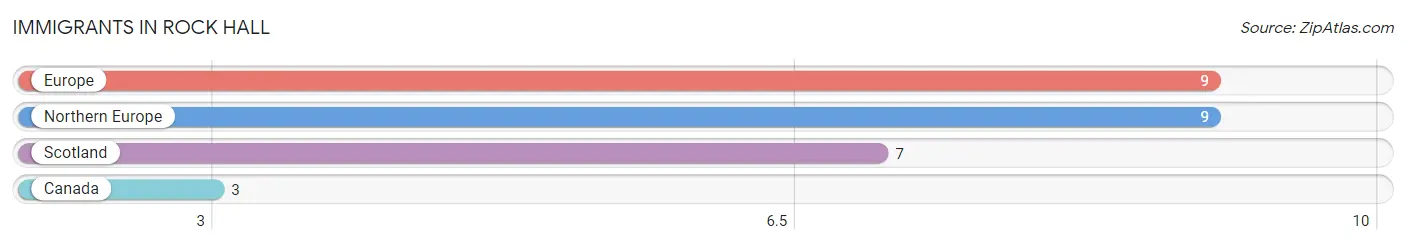
| Immigration Origin | # Population | % Population |
| Canada | 3 | 0.2% |
| Europe | 9 | 0.6% |
| Northern Europe | 9 | 0.6% |
| Scotland | 7 | 0.5% | View All 4 Rows |
Sex and Age in Rock Hall
Sex and Age in Rock Hall
The most populous age groups in Rock Hall are 75 to 79 Years (104 | 15.7%) for men and 65 to 69 Years (133 | 16.8%) for women.
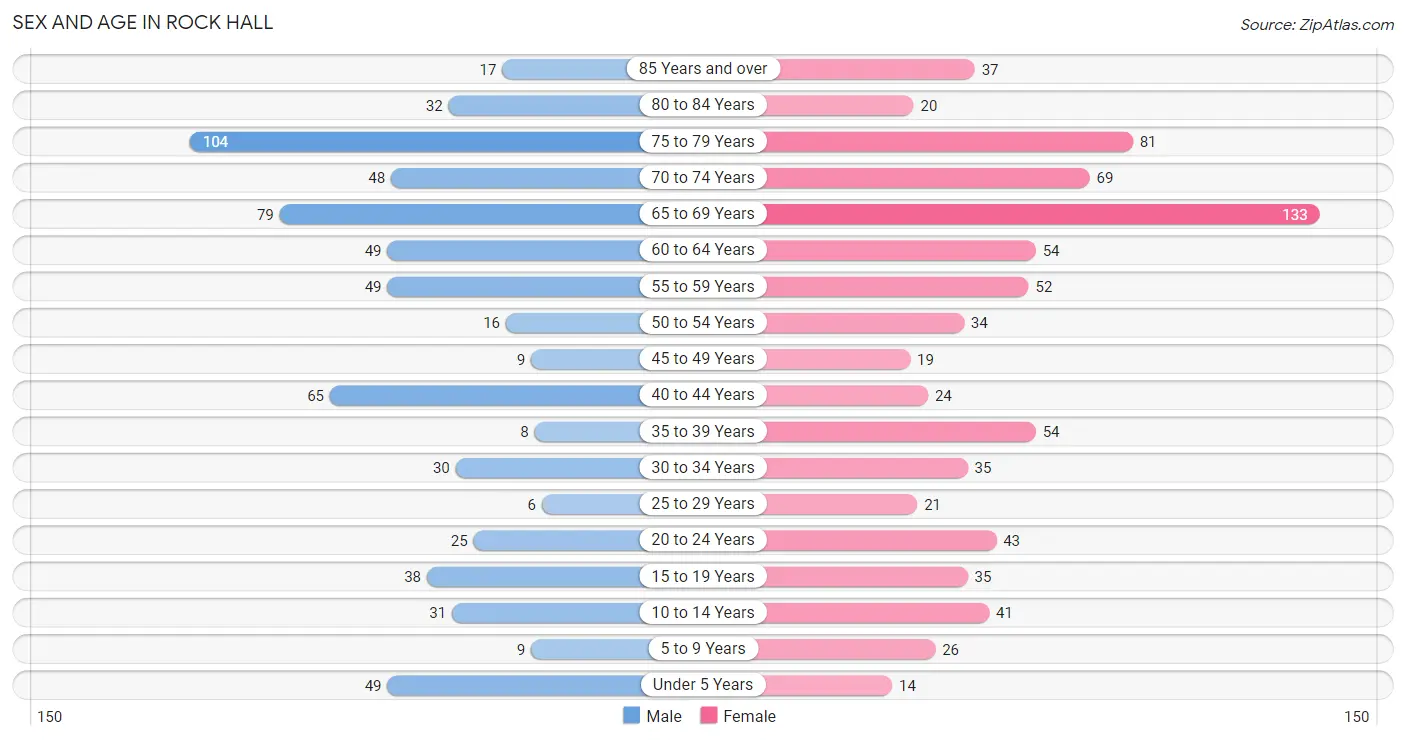
| Age Bracket | Male | Female |
| Under 5 Years | 49 (7.4%) | 14 (1.8%) |
| 5 to 9 Years | 9 (1.4%) | 26 (3.3%) |
| 10 to 14 Years | 31 (4.7%) | 41 (5.2%) |
| 15 to 19 Years | 38 (5.7%) | 35 (4.4%) |
| 20 to 24 Years | 25 (3.8%) | 43 (5.4%) |
| 25 to 29 Years | 6 (0.9%) | 21 (2.6%) |
| 30 to 34 Years | 30 (4.5%) | 35 (4.4%) |
| 35 to 39 Years | 8 (1.2%) | 54 (6.8%) |
| 40 to 44 Years | 65 (9.8%) | 24 (3.0%) |
| 45 to 49 Years | 9 (1.4%) | 19 (2.4%) |
| 50 to 54 Years | 16 (2.4%) | 34 (4.3%) |
| 55 to 59 Years | 49 (7.4%) | 52 (6.6%) |
| 60 to 64 Years | 49 (7.4%) | 54 (6.8%) |
| 65 to 69 Years | 79 (11.9%) | 133 (16.8%) |
| 70 to 74 Years | 48 (7.2%) | 69 (8.7%) |
| 75 to 79 Years | 104 (15.7%) | 81 (10.2%) |
| 80 to 84 Years | 32 (4.8%) | 20 (2.5%) |
| 85 Years and over | 17 (2.6%) | 37 (4.7%) |
| Total | 664 (100.0%) | 792 (100.0%) |
Families and Households in Rock Hall
Median Family Size in Rock Hall
The median family size in Rock Hall is 2.55 persons per family, with single female/mother families (86 | 21.7%) accounting for the largest median family size of 3.09 persons per family. On the other hand, married-couple families (302 | 76.1%) represent the smallest median family size with 2.39 persons per family.
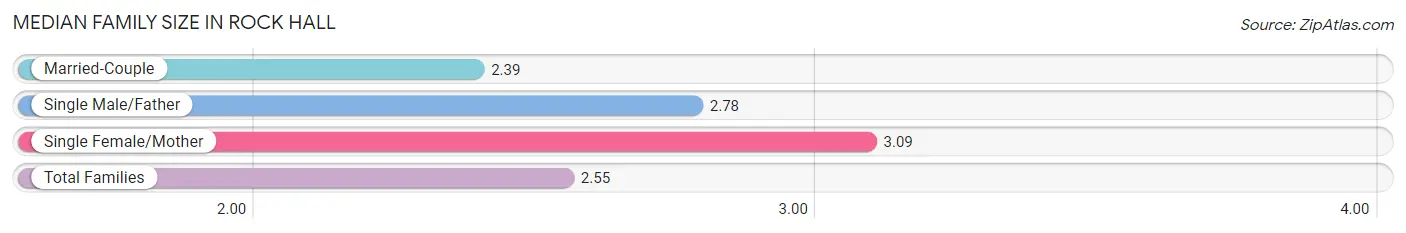
| Family Type | # Families | Family Size |
| Married-Couple | 302 (76.1%) | 2.39 |
| Single Male/Father | 9 (2.3%) | 2.78 |
| Single Female/Mother | 86 (21.7%) | 3.09 |
| Total Families | 397 (100.0%) | 2.55 |
Median Household Size in Rock Hall
The median household size in Rock Hall is 1.99 persons per household, with single male/father households (9 | 1.3%) accounting for the largest median household size of 3.33 persons per household. non-family households (312 | 44.0%) represent the smallest median household size with 1.24 persons per household.
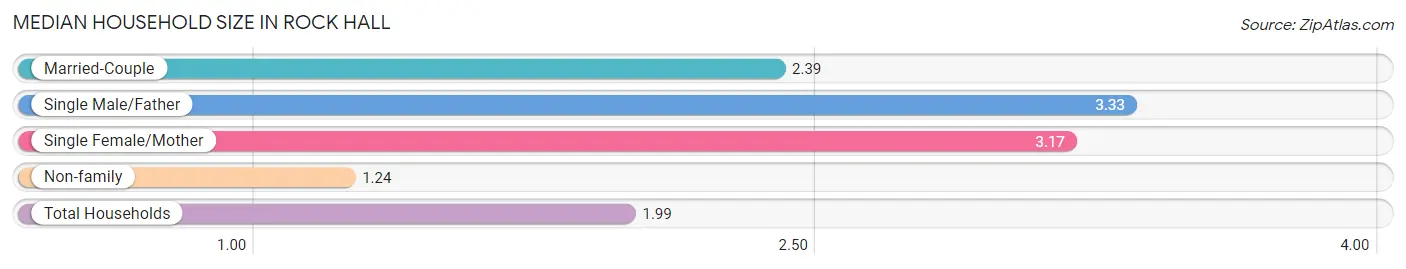
| Household Type | # Households | Household Size |
| Married-Couple | 302 (42.6%) | 2.39 |
| Single Male/Father | 9 (1.3%) | 3.33 |
| Single Female/Mother | 86 (12.1%) | 3.17 |
| Non-family | 312 (44.0%) | 1.24 |
| Total Households | 709 (100.0%) | 1.99 |
Household Size by Marriage Status in Rock Hall
Out of a total of 709 households in Rock Hall, 397 (56.0%) are family households, while 312 (44.0%) are nonfamily households. The most numerous type of family households are 2-person households, comprising 273, and the most common type of nonfamily households are 1-person households, comprising 234.
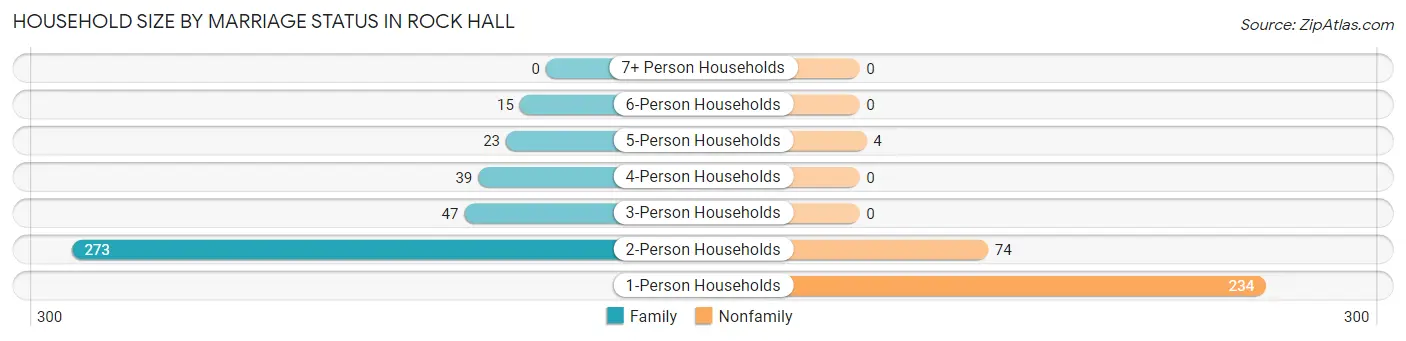
| Household Size | Family Households | Nonfamily Households |
| 1-Person Households | - | 234 (33.0%) |
| 2-Person Households | 273 (38.5%) | 74 (10.4%) |
| 3-Person Households | 47 (6.6%) | 0 (0.0%) |
| 4-Person Households | 39 (5.5%) | 0 (0.0%) |
| 5-Person Households | 23 (3.2%) | 4 (0.6%) |
| 6-Person Households | 15 (2.1%) | 0 (0.0%) |
| 7+ Person Households | 0 (0.0%) | 0 (0.0%) |
| Total | 397 (56.0%) | 312 (44.0%) |
Female Fertility in Rock Hall
Fertility by Age in Rock Hall
Average fertility rate in Rock Hall is 71.0 births per 1,000 women. Women in the age bracket of 20 to 34 years have the highest fertility rate with 182.0 births per 1,000 women. Women in the age bracket of 20 to 34 years acount for 100.0% of all women with births.
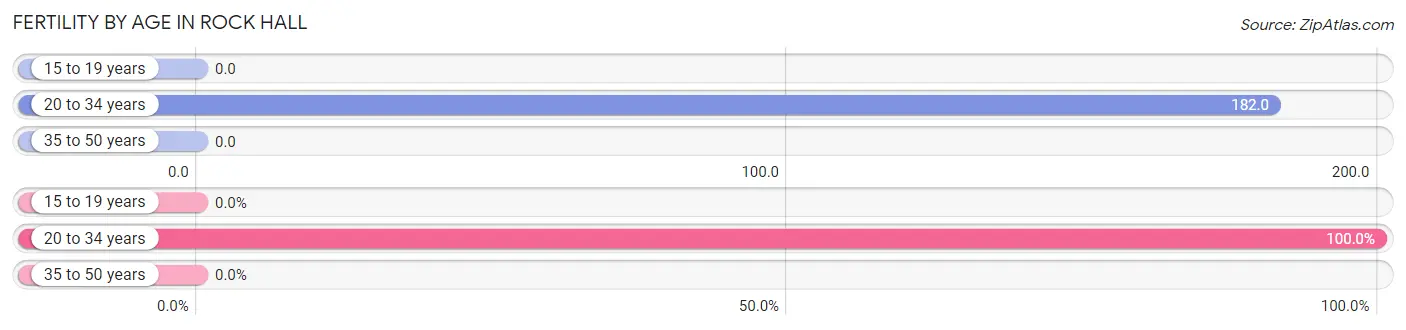
| Age Bracket | Women with Births | Births / 1,000 Women |
| 15 to 19 years | 0 (0.0%) | 0.0 |
| 20 to 34 years | 18 (100.0%) | 182.0 |
| 35 to 50 years | 0 (0.0%) | 0.0 |
| Total | 18 (100.0%) | 71.0 |
Fertility by Age by Marriage Status in Rock Hall
27.8% of women with births (18) in Rock Hall are married. The highest percentage of unmarried women with births falls into 20 to 34 years age bracket with 72.2% of them unmarried at the time of birth, while the lowest percentage of unmarried women with births belong to 20 to 34 years age bracket with 72.2% of them unmarried.
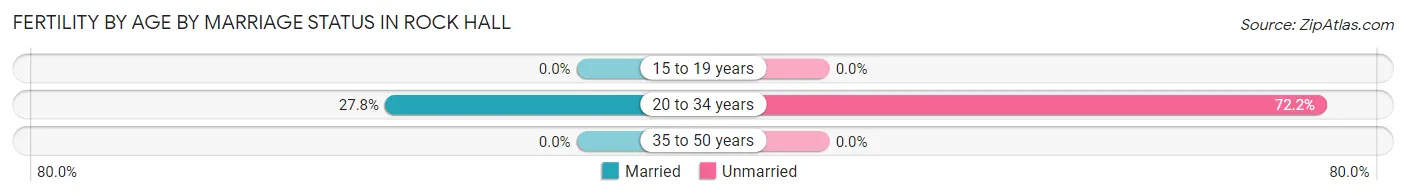
| Age Bracket | Married | Unmarried |
| 15 to 19 years | 0 (0.0%) | 0 (0.0%) |
| 20 to 34 years | 5 (27.8%) | 13 (72.2%) |
| 35 to 50 years | 0 (0.0%) | 0 (0.0%) |
| Total | 5 (27.8%) | 13 (72.2%) |
Fertility by Education in Rock Hall
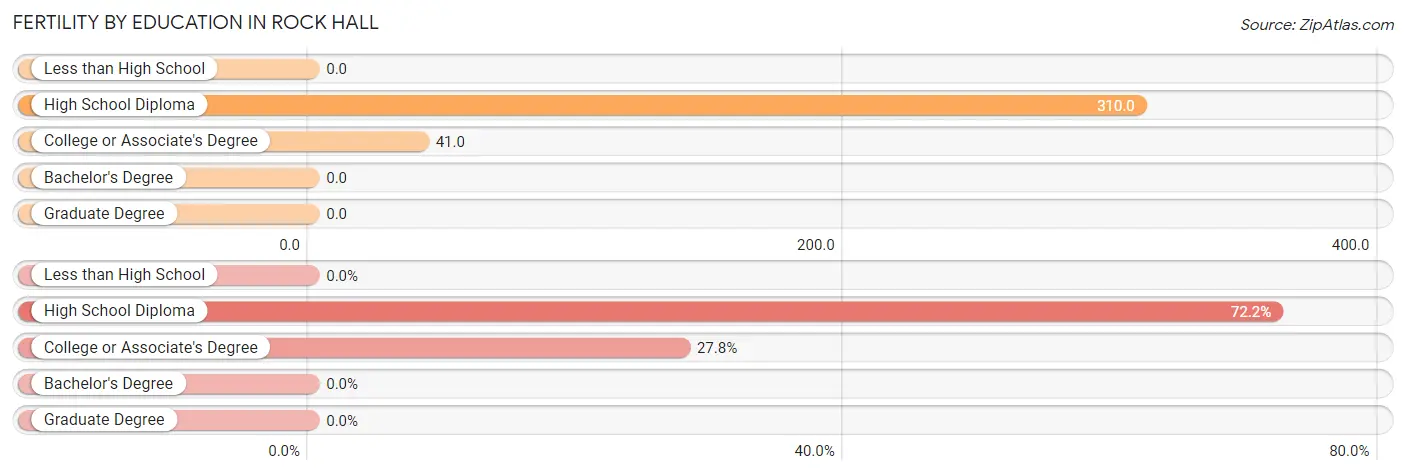
| Educational Attainment | Women with Births | Births / 1,000 Women |
| Less than High School | 0 (0.0%) | 0.0 |
| High School Diploma | 13 (72.2%) | 310.0 |
| College or Associate's Degree | 5 (27.8%) | 41.0 |
| Bachelor's Degree | 0 (0.0%) | 0.0 |
| Graduate Degree | 0 (0.0%) | 0.0 |
| Total | 18 (100.0%) | 71.0 |
Fertility by Education by Marriage Status in Rock Hall
72.2% of women with births in Rock Hall are unmarried. Women with the educational attainment of college or associate's degree are most likely to be married with 100.0% of them married at childbirth, while women with the educational attainment of high school diploma are least likely to be married with 100.0% of them unmarried at childbirth.
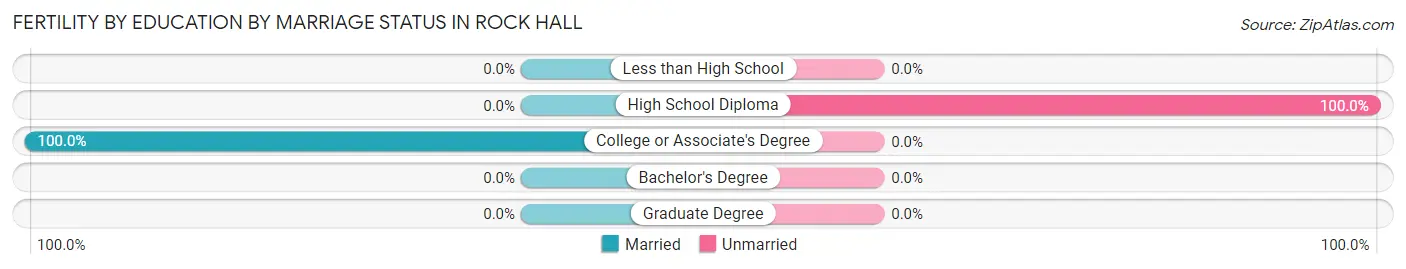
| Educational Attainment | Married | Unmarried |
| Less than High School | 0 (0.0%) | 0 (0.0%) |
| High School Diploma | 0 (0.0%) | 13 (100.0%) |
| College or Associate's Degree | 5 (100.0%) | 0 (0.0%) |
| Bachelor's Degree | 0 (0.0%) | 0 (0.0%) |
| Graduate Degree | 0 (0.0%) | 0 (0.0%) |
| Total | 5 (27.8%) | 13 (72.2%) |
Employment Characteristics in Rock Hall
Employment by Class of Employer in Rock Hall
Among the 632 employed individuals in Rock Hall, private company employees (370 | 58.5%), local government employees (78 | 12.3%), and not-for-profit organizations (60 | 9.5%) make up the most common classes of employment.
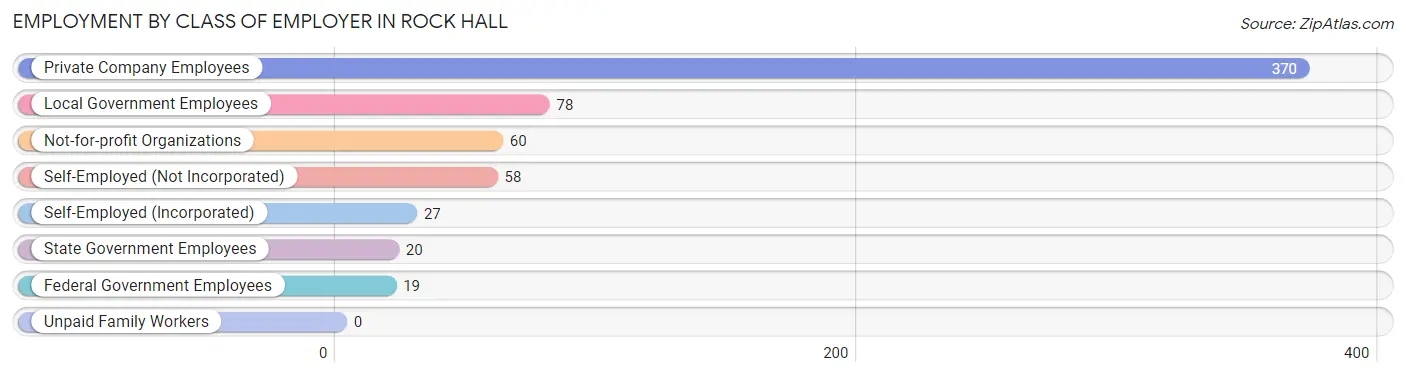
| Employer Class | # Employees | % Employees |
| Private Company Employees | 370 | 58.5% |
| Self-Employed (Incorporated) | 27 | 4.3% |
| Self-Employed (Not Incorporated) | 58 | 9.2% |
| Not-for-profit Organizations | 60 | 9.5% |
| Local Government Employees | 78 | 12.3% |
| State Government Employees | 20 | 3.2% |
| Federal Government Employees | 19 | 3.0% |
| Unpaid Family Workers | 0 | 0.0% |
| Total | 632 | 100.0% |
Employment Status by Age in Rock Hall
According to the labor force statistics for Rock Hall, out of the total population over 16 years of age (1,273), 53.0% or 675 individuals are in the labor force, with 5.2% or 35 of them unemployed. The age group with the highest labor force participation rate is 20 to 24 years, with 100.0% or 68 individuals in the labor force. Within the labor force, the 55 to 59 years age range has the highest percentage of unemployed individuals, with 21.1% or 12 of them being unemployed.
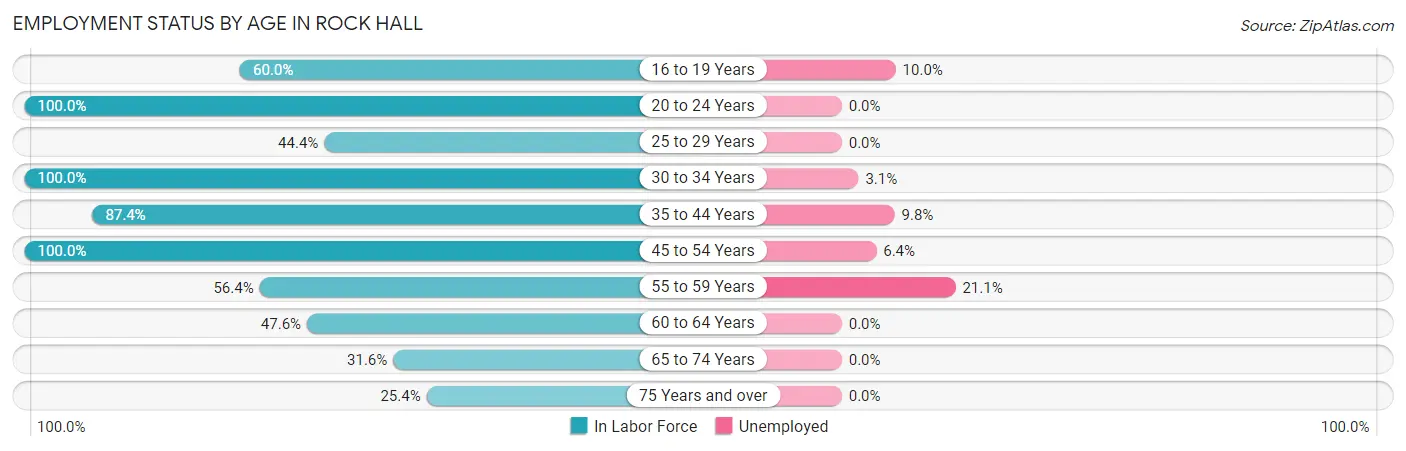
| Age Bracket | In Labor Force | Unemployed |
| 16 to 19 Years | 36 (60.0%) | 4 (10.0%) |
| 20 to 24 Years | 68 (100.0%) | 0 (0.0%) |
| 25 to 29 Years | 12 (44.4%) | 0 (0.0%) |
| 30 to 34 Years | 65 (100.0%) | 2 (3.1%) |
| 35 to 44 Years | 132 (87.4%) | 13 (9.8%) |
| 45 to 54 Years | 78 (100.0%) | 5 (6.4%) |
| 55 to 59 Years | 57 (56.4%) | 12 (21.1%) |
| 60 to 64 Years | 49 (47.6%) | 0 (0.0%) |
| 65 to 74 Years | 104 (31.6%) | 0 (0.0%) |
| 75 Years and over | 74 (25.4%) | 0 (0.0%) |
| Total | 675 (53.0%) | 35 (5.2%) |
Employment Status by Educational Attainment in Rock Hall
According to labor force statistics for Rock Hall, 74.9% of individuals (393) out of the total population between 25 and 64 years of age (525) are in the labor force, with 8.1% or 32 of them being unemployed. The group with the highest labor force participation rate are those with the educational attainment of college / associate degree, with 80.3% or 191 individuals in the labor force. Within the labor force, individuals with high school diploma education have the highest percentage of unemployment, with 27.2% or 25 of them being unemployed.
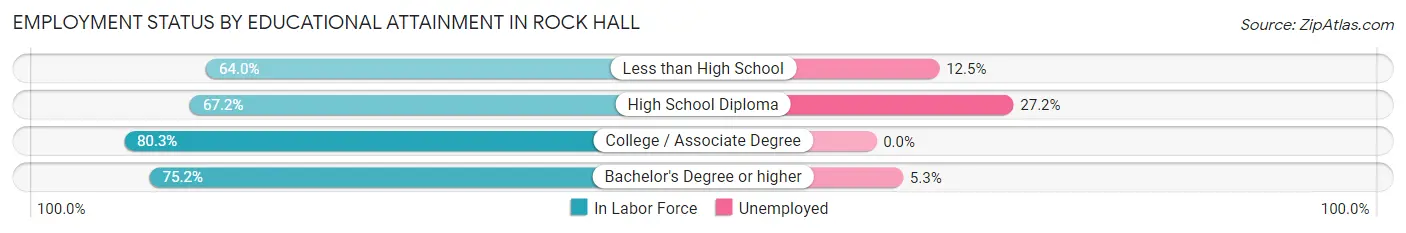
| Educational Attainment | In Labor Force | Unemployed |
| Less than High School | 16 (64.0%) | 3 (12.5%) |
| High School Diploma | 92 (67.2%) | 37 (27.2%) |
| College / Associate Degree | 191 (80.3%) | 0 (0.0%) |
| Bachelor's Degree or higher | 94 (75.2%) | 7 (5.3%) |
| Total | 393 (74.9%) | 43 (8.1%) |
Employment Occupations by Sex in Rock Hall
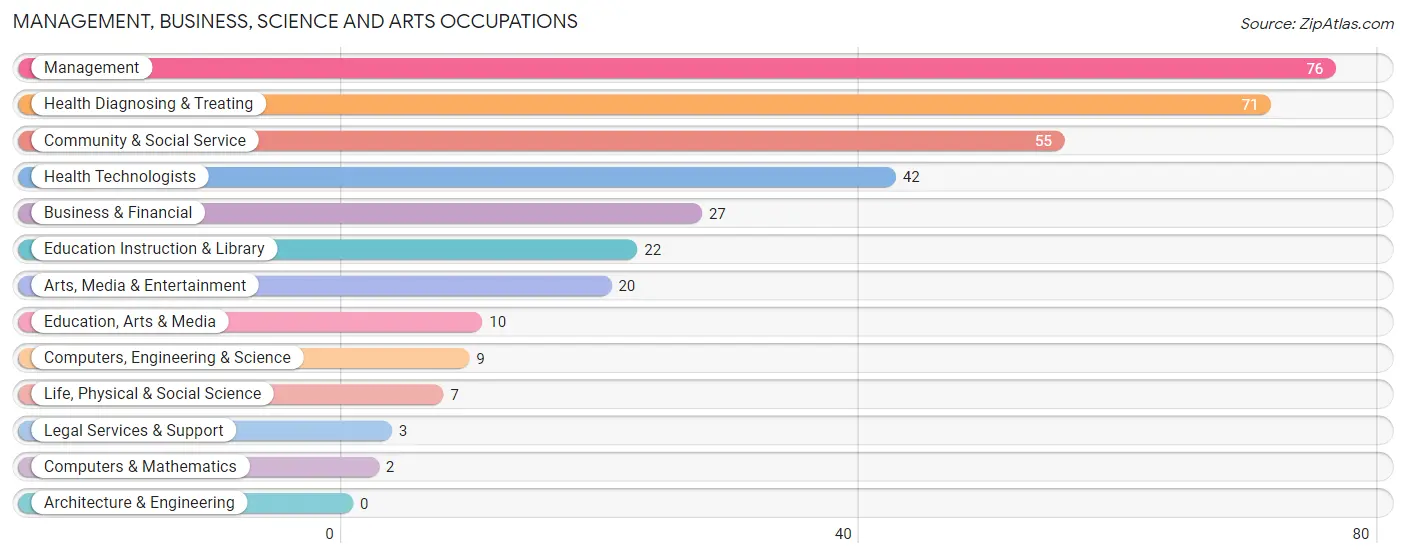
Management, Business, Science and Arts Occupations
The most common Management, Business, Science and Arts occupations in Rock Hall are Management (76 | 12.0%), Health Diagnosing & Treating (71 | 11.2%), Community & Social Service (55 | 8.7%), Health Technologists (42 | 6.6%), and Business & Financial (27 | 4.3%).
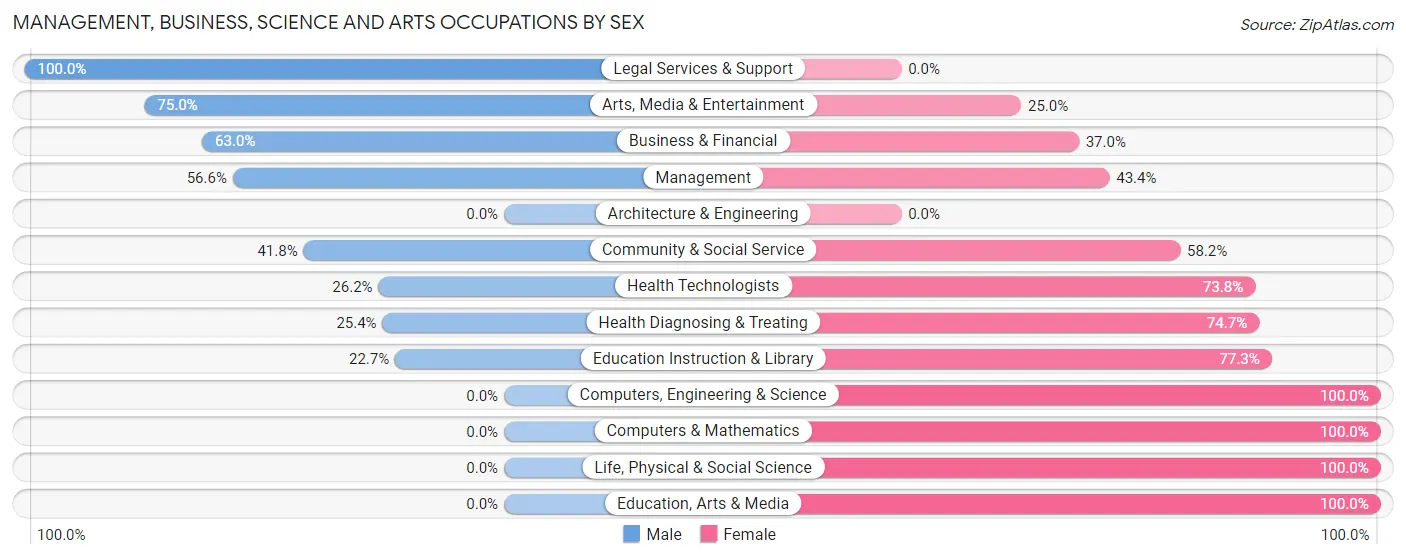
Management, Business, Science and Arts Occupations by Sex
Within the Management, Business, Science and Arts occupations in Rock Hall, the most male-oriented occupations are Legal Services & Support (100.0%), Arts, Media & Entertainment (75.0%), and Business & Financial (63.0%), while the most female-oriented occupations are Computers, Engineering & Science (100.0%), Computers & Mathematics (100.0%), and Life, Physical & Social Science (100.0%).
| Occupation | Male | Female |
| Management | 43 (56.6%) | 33 (43.4%) |
| Business & Financial | 17 (63.0%) | 10 (37.0%) |
| Computers, Engineering & Science | 0 (0.0%) | 9 (100.0%) |
| Computers & Mathematics | 0 (0.0%) | 2 (100.0%) |
| Architecture & Engineering | 0 (0.0%) | 0 (0.0%) |
| Life, Physical & Social Science | 0 (0.0%) | 7 (100.0%) |
| Community & Social Service | 23 (41.8%) | 32 (58.2%) |
| Education, Arts & Media | 0 (0.0%) | 10 (100.0%) |
| Legal Services & Support | 3 (100.0%) | 0 (0.0%) |
| Education Instruction & Library | 5 (22.7%) | 17 (77.3%) |
| Arts, Media & Entertainment | 15 (75.0%) | 5 (25.0%) |
| Health Diagnosing & Treating | 18 (25.4%) | 53 (74.7%) |
| Health Technologists | 11 (26.2%) | 31 (73.8%) |
| Total (Category) | 101 (42.4%) | 137 (57.6%) |
| Total (Overall) | 339 (53.5%) | 295 (46.5%) |
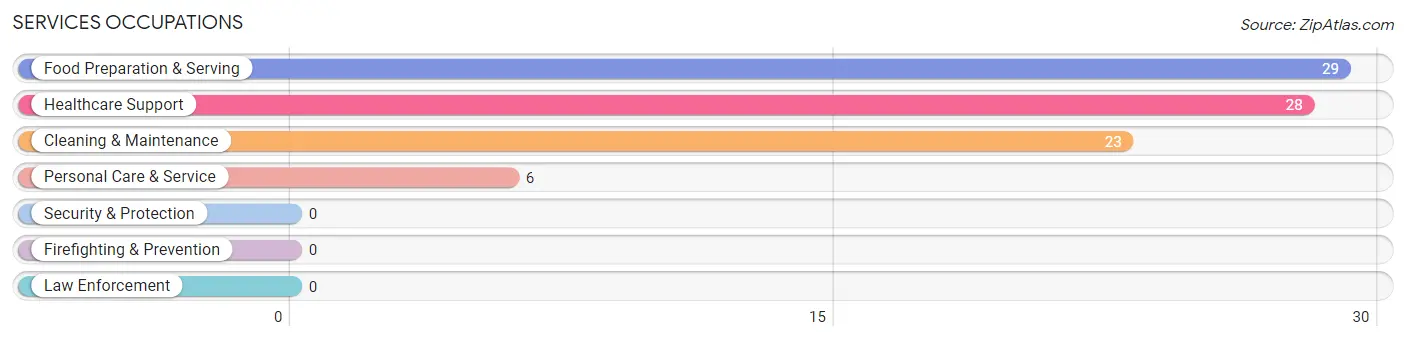
Services Occupations
The most common Services occupations in Rock Hall are Food Preparation & Serving (29 | 4.6%), Healthcare Support (28 | 4.4%), Cleaning & Maintenance (23 | 3.6%), and Personal Care & Service (6 | 0.9%).
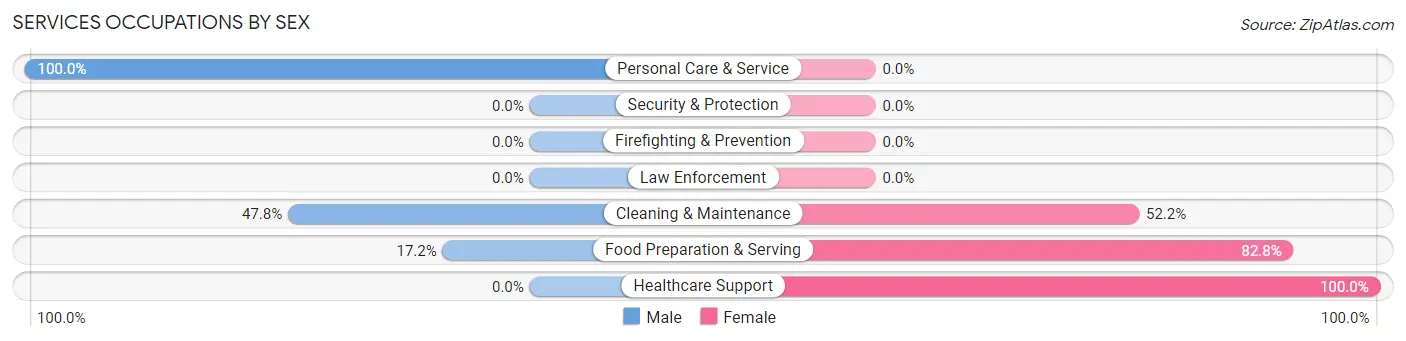
Services Occupations by Sex
Within the Services occupations in Rock Hall, the most male-oriented occupations are Personal Care & Service (100.0%), Cleaning & Maintenance (47.8%), and Food Preparation & Serving (17.2%), while the most female-oriented occupations are Healthcare Support (100.0%), Food Preparation & Serving (82.8%), and Cleaning & Maintenance (52.2%).
| Occupation | Male | Female |
| Healthcare Support | 0 (0.0%) | 28 (100.0%) |
| Security & Protection | 0 (0.0%) | 0 (0.0%) |
| Firefighting & Prevention | 0 (0.0%) | 0 (0.0%) |
| Law Enforcement | 0 (0.0%) | 0 (0.0%) |
| Food Preparation & Serving | 5 (17.2%) | 24 (82.8%) |
| Cleaning & Maintenance | 11 (47.8%) | 12 (52.2%) |
| Personal Care & Service | 6 (100.0%) | 0 (0.0%) |
| Total (Category) | 22 (25.6%) | 64 (74.4%) |
| Total (Overall) | 339 (53.5%) | 295 (46.5%) |
Sales and Office Occupations
The most common Sales and Office occupations in Rock Hall are Sales & Related (67 | 10.6%), and Office & Administration (59 | 9.3%).

Sales and Office Occupations by Sex

| Occupation | Male | Female |
| Sales & Related | 32 (47.8%) | 35 (52.2%) |
| Office & Administration | 6 (10.2%) | 53 (89.8%) |
| Total (Category) | 38 (30.2%) | 88 (69.8%) |
| Total (Overall) | 339 (53.5%) | 295 (46.5%) |
Natural Resources, Construction and Maintenance Occupations
The most common Natural Resources, Construction and Maintenance occupations in Rock Hall are Farming, Fishing & Forestry (63 | 9.9%), Construction & Extraction (18 | 2.8%), and Installation, Maintenance & Repair (5 | 0.8%).

Natural Resources, Construction and Maintenance Occupations by Sex
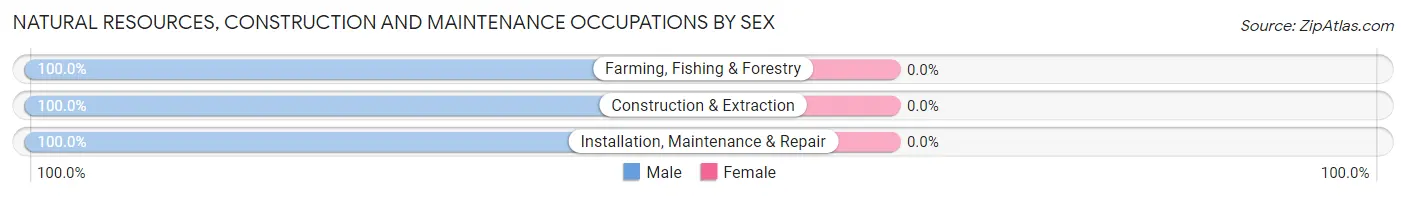
| Occupation | Male | Female |
| Farming, Fishing & Forestry | 63 (100.0%) | 0 (0.0%) |
| Construction & Extraction | 18 (100.0%) | 0 (0.0%) |
| Installation, Maintenance & Repair | 5 (100.0%) | 0 (0.0%) |
| Total (Category) | 86 (100.0%) | 0 (0.0%) |
| Total (Overall) | 339 (53.5%) | 295 (46.5%) |
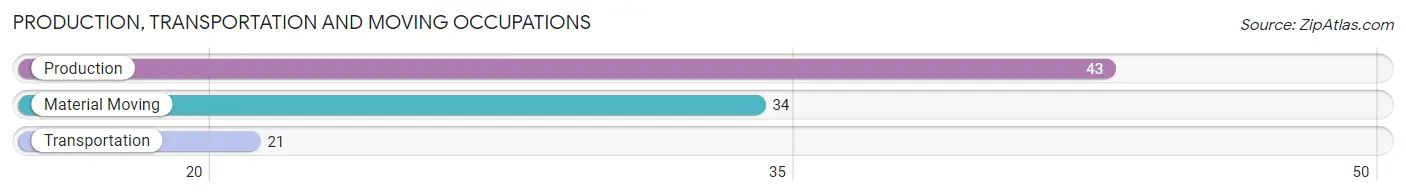
Production, Transportation and Moving Occupations
The most common Production, Transportation and Moving occupations in Rock Hall are Production (43 | 6.8%), Material Moving (34 | 5.4%), and Transportation (21 | 3.3%).
Production, Transportation and Moving Occupations by Sex
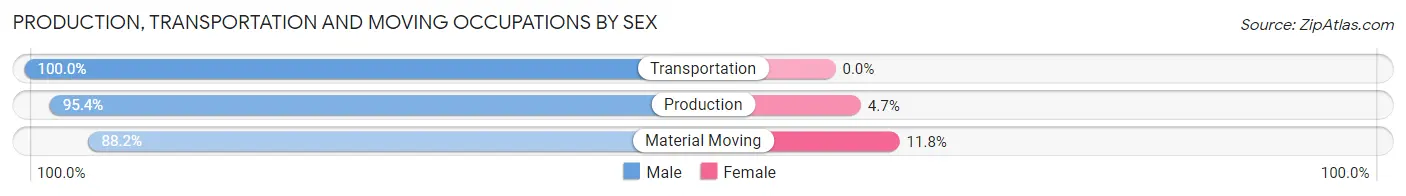
| Occupation | Male | Female |
| Production | 41 (95.4%) | 2 (4.6%) |
| Transportation | 21 (100.0%) | 0 (0.0%) |
| Material Moving | 30 (88.2%) | 4 (11.8%) |
| Total (Category) | 92 (93.9%) | 6 (6.1%) |
| Total (Overall) | 339 (53.5%) | 295 (46.5%) |
Employment Industries by Sex in Rock Hall
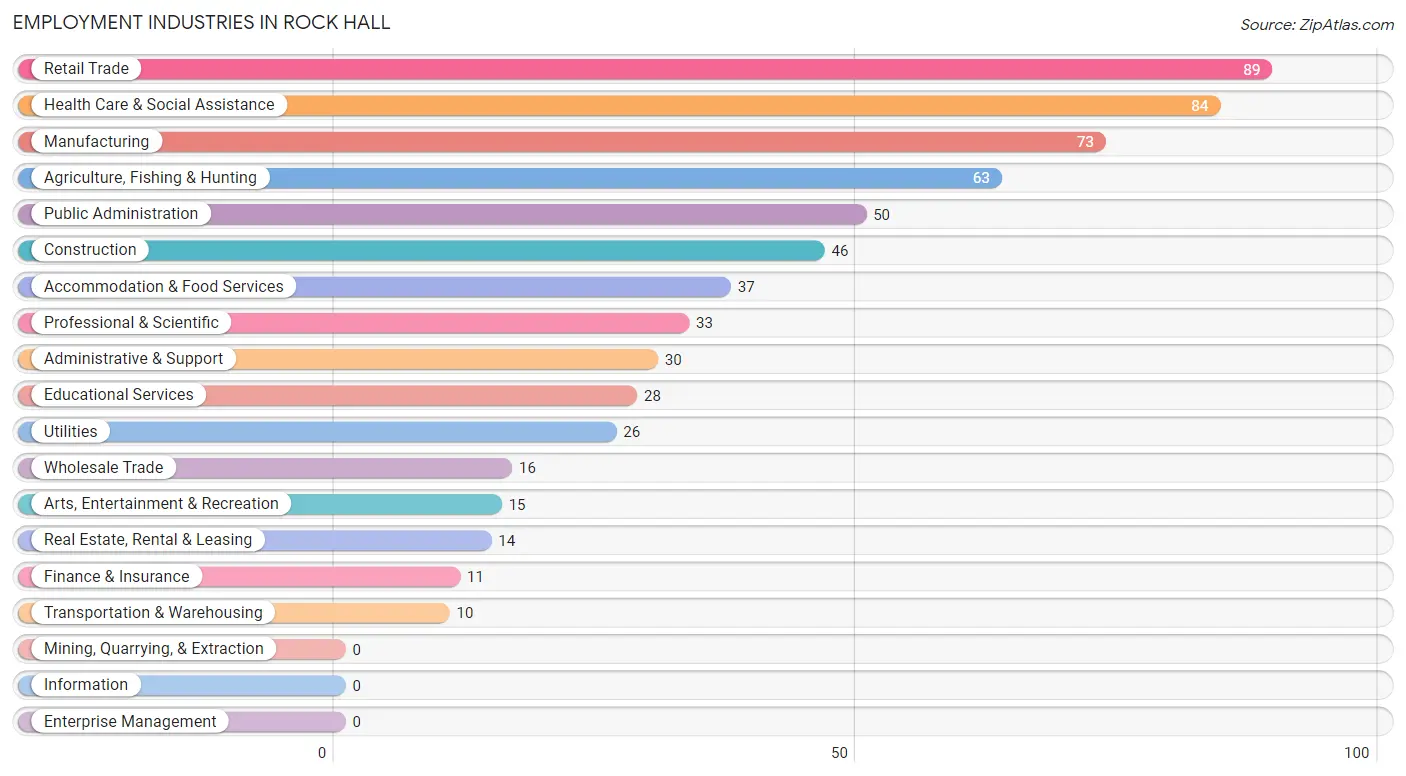
Employment Industries in Rock Hall
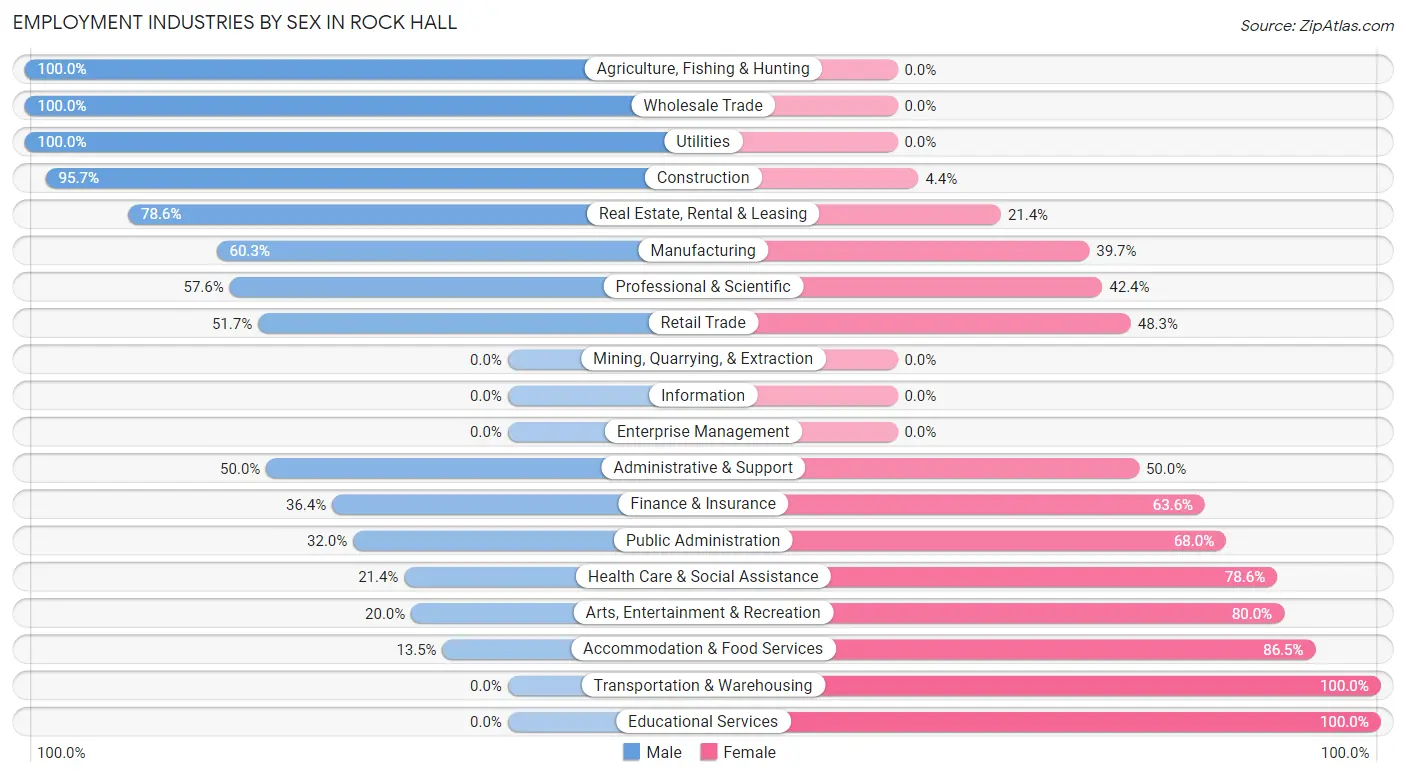
The major employment industries in Rock Hall include Retail Trade (89 | 14.0%), Health Care & Social Assistance (84 | 13.3%), Manufacturing (73 | 11.5%), Agriculture, Fishing & Hunting (63 | 9.9%), and Public Administration (50 | 7.9%).
Employment Industries by Sex in Rock Hall
The Rock Hall industries that see more men than women are Agriculture, Fishing & Hunting (100.0%), Wholesale Trade (100.0%), and Utilities (100.0%), whereas the industries that tend to have a higher number of women are Transportation & Warehousing (100.0%), Educational Services (100.0%), and Accommodation & Food Services (86.5%).
| Industry | Male | Female |
| Agriculture, Fishing & Hunting | 63 (100.0%) | 0 (0.0%) |
| Mining, Quarrying, & Extraction | 0 (0.0%) | 0 (0.0%) |
| Construction | 44 (95.7%) | 2 (4.3%) |
| Manufacturing | 44 (60.3%) | 29 (39.7%) |
| Wholesale Trade | 16 (100.0%) | 0 (0.0%) |
| Retail Trade | 46 (51.7%) | 43 (48.3%) |
| Transportation & Warehousing | 0 (0.0%) | 10 (100.0%) |
| Utilities | 26 (100.0%) | 0 (0.0%) |
| Information | 0 (0.0%) | 0 (0.0%) |
| Finance & Insurance | 4 (36.4%) | 7 (63.6%) |
| Real Estate, Rental & Leasing | 11 (78.6%) | 3 (21.4%) |
| Professional & Scientific | 19 (57.6%) | 14 (42.4%) |
| Enterprise Management | 0 (0.0%) | 0 (0.0%) |
| Administrative & Support | 15 (50.0%) | 15 (50.0%) |
| Educational Services | 0 (0.0%) | 28 (100.0%) |
| Health Care & Social Assistance | 18 (21.4%) | 66 (78.6%) |
| Arts, Entertainment & Recreation | 3 (20.0%) | 12 (80.0%) |
| Accommodation & Food Services | 5 (13.5%) | 32 (86.5%) |
| Public Administration | 16 (32.0%) | 34 (68.0%) |
| Total | 339 (53.5%) | 295 (46.5%) |
Education in Rock Hall
School Enrollment in Rock Hall
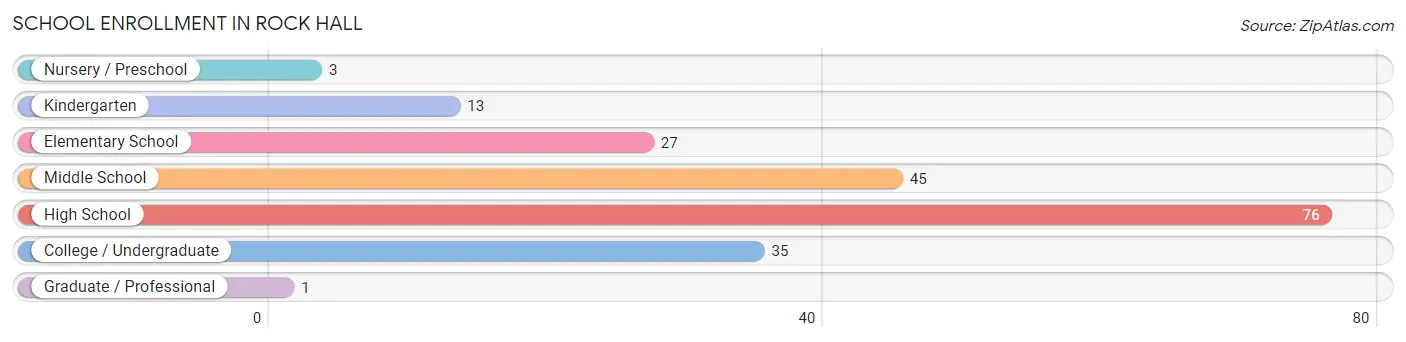
The most common levels of schooling among the 200 students in Rock Hall are high school (76 | 38.0%), middle school (45 | 22.5%), and college / undergraduate (35 | 17.5%).
| School Level | # Students | % Students |
| Nursery / Preschool | 3 | 1.5% |
| Kindergarten | 13 | 6.5% |
| Elementary School | 27 | 13.5% |
| Middle School | 45 | 22.5% |
| High School | 76 | 38.0% |
| College / Undergraduate | 35 | 17.5% |
| Graduate / Professional | 1 | 0.5% |
| Total | 200 | 100.0% |
School Enrollment by Age by Funding Source in Rock Hall
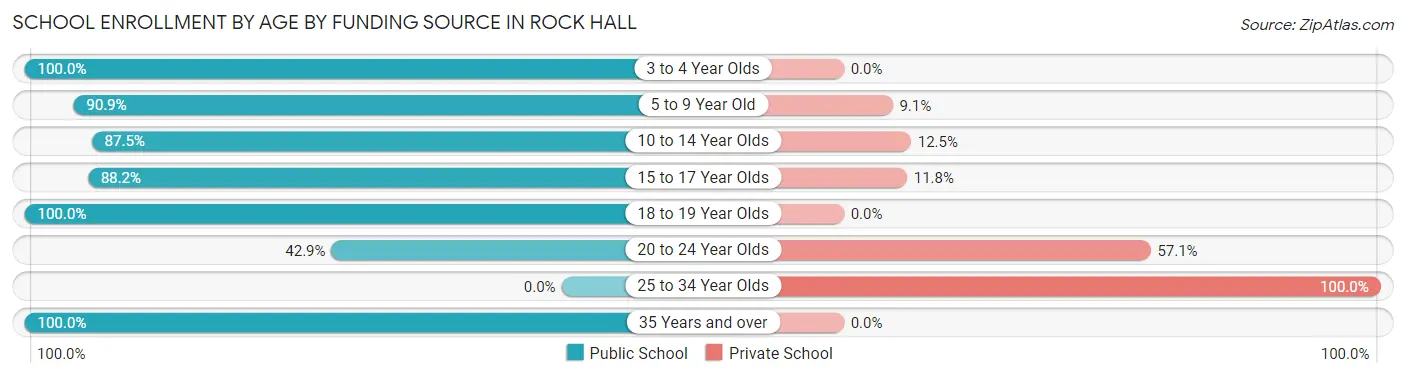
Out of a total of 200 students who are enrolled in schools in Rock Hall, 29 (14.5%) attend a private institution, while the remaining 171 (85.5%) are enrolled in public schools. The age group of 25 to 34 year olds has the highest likelihood of being enrolled in private schools, with 1 (100.0% in the age bracket) enrolled. Conversely, the age group of 3 to 4 year olds has the lowest likelihood of being enrolled in a private school, with 5 (100.0% in the age bracket) attending a public institution.
| Age Bracket | Public School | Private School |
| 3 to 4 Year Olds | 5 (100.0%) | 0 (0.0%) |
| 5 to 9 Year Old | 30 (90.9%) | 3 (9.1%) |
| 10 to 14 Year Olds | 63 (87.5%) | 9 (12.5%) |
| 15 to 17 Year Olds | 30 (88.2%) | 4 (11.8%) |
| 18 to 19 Year Olds | 20 (100.0%) | 0 (0.0%) |
| 20 to 24 Year Olds | 9 (42.9%) | 12 (57.1%) |
| 25 to 34 Year Olds | 0 (0.0%) | 1 (100.0%) |
| 35 Years and over | 14 (100.0%) | 0 (0.0%) |
| Total | 171 (85.5%) | 29 (14.5%) |
Educational Attainment by Field of Study in Rock Hall
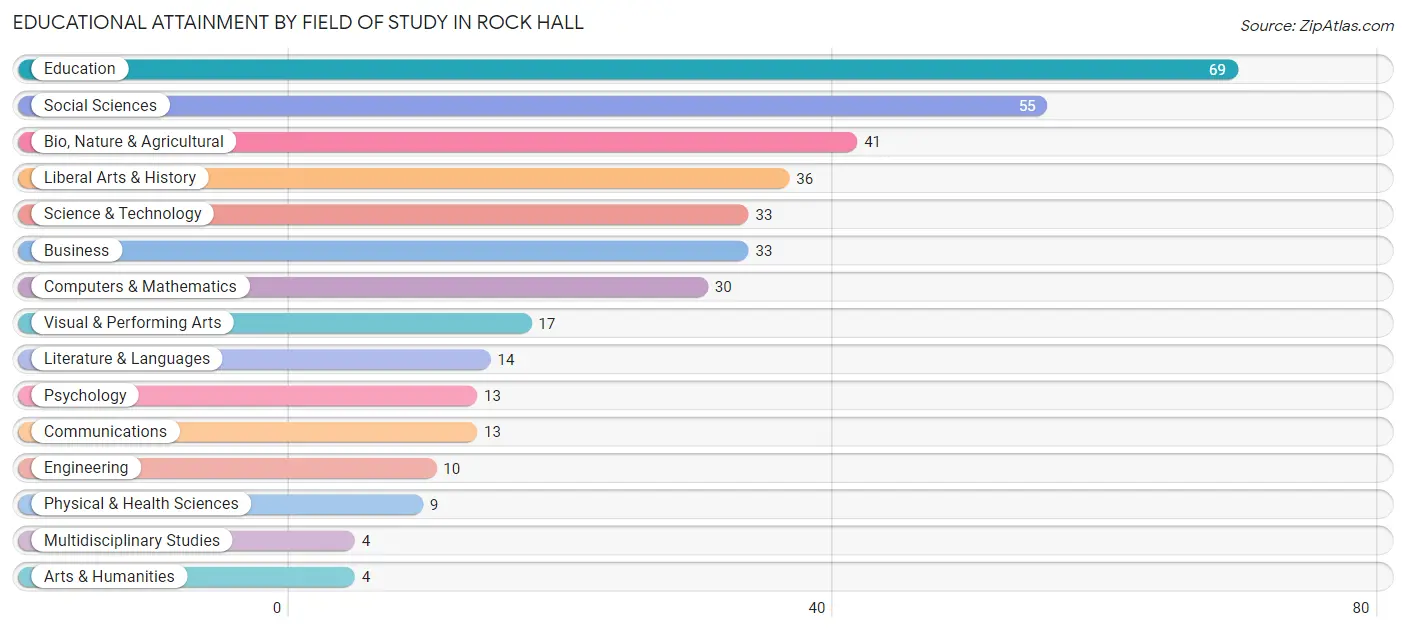
Education (69 | 18.1%), social sciences (55 | 14.4%), bio, nature & agricultural (41 | 10.8%), liberal arts & history (36 | 9.5%), and science & technology (33 | 8.7%) are the most common fields of study among 381 individuals in Rock Hall who have obtained a bachelor's degree or higher.
| Field of Study | # Graduates | % Graduates |
| Computers & Mathematics | 30 | 7.9% |
| Bio, Nature & Agricultural | 41 | 10.8% |
| Physical & Health Sciences | 9 | 2.4% |
| Psychology | 13 | 3.4% |
| Social Sciences | 55 | 14.4% |
| Engineering | 10 | 2.6% |
| Multidisciplinary Studies | 4 | 1.1% |
| Science & Technology | 33 | 8.7% |
| Business | 33 | 8.7% |
| Education | 69 | 18.1% |
| Literature & Languages | 14 | 3.7% |
| Liberal Arts & History | 36 | 9.5% |
| Visual & Performing Arts | 17 | 4.5% |
| Communications | 13 | 3.4% |
| Arts & Humanities | 4 | 1.1% |
| Total | 381 | 100.0% |
Transportation & Commute in Rock Hall
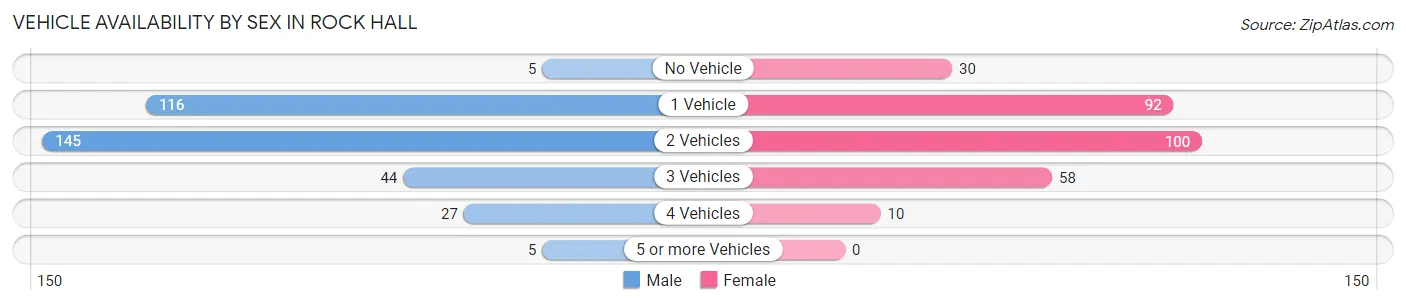
Vehicle Availability by Sex in Rock Hall
The most prevalent vehicle ownership categories in Rock Hall are males with 2 vehicles (145, accounting for 42.4%) and females with 2 vehicles (100, making up 50.0%).
| Vehicles Available | Male | Female |
| No Vehicle | 5 (1.5%) | 30 (10.3%) |
| 1 Vehicle | 116 (33.9%) | 92 (31.7%) |
| 2 Vehicles | 145 (42.4%) | 100 (34.5%) |
| 3 Vehicles | 44 (12.9%) | 58 (20.0%) |
| 4 Vehicles | 27 (7.9%) | 10 (3.5%) |
| 5 or more Vehicles | 5 (1.5%) | 0 (0.0%) |
| Total | 342 (100.0%) | 290 (100.0%) |
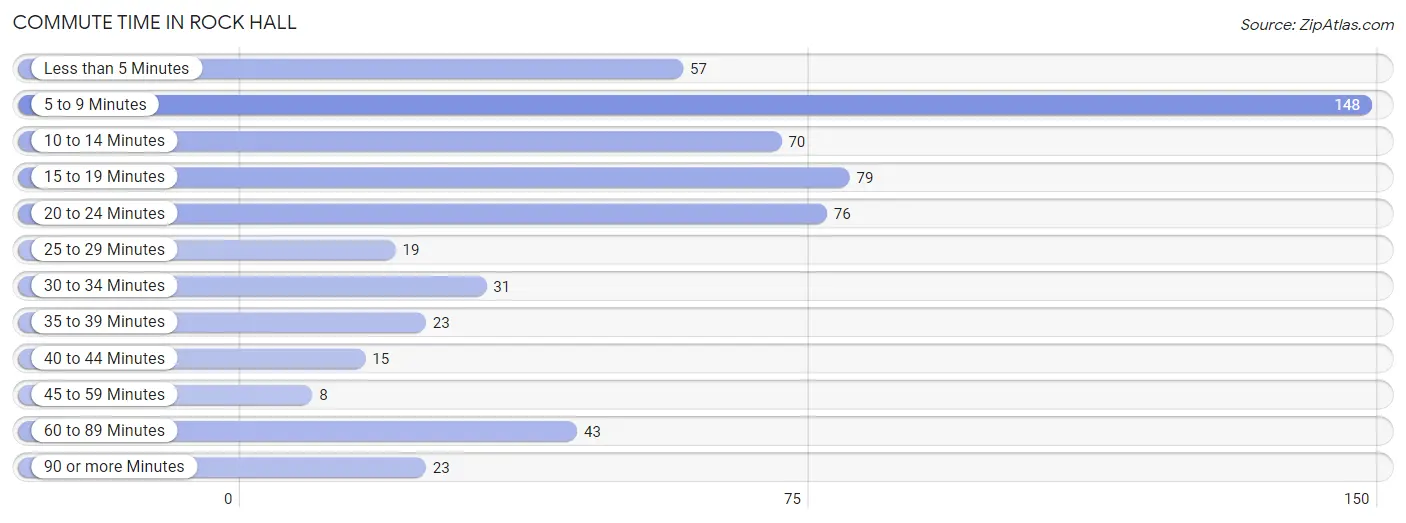
Commute Time in Rock Hall
The most frequently occuring commute durations in Rock Hall are 5 to 9 minutes (148 commuters, 25.0%), 15 to 19 minutes (79 commuters, 13.3%), and 20 to 24 minutes (76 commuters, 12.8%).
| Commute Time | # Commuters | % Commuters |
| Less than 5 Minutes | 57 | 9.6% |
| 5 to 9 Minutes | 148 | 25.0% |
| 10 to 14 Minutes | 70 | 11.8% |
| 15 to 19 Minutes | 79 | 13.3% |
| 20 to 24 Minutes | 76 | 12.8% |
| 25 to 29 Minutes | 19 | 3.2% |
| 30 to 34 Minutes | 31 | 5.2% |
| 35 to 39 Minutes | 23 | 3.9% |
| 40 to 44 Minutes | 15 | 2.5% |
| 45 to 59 Minutes | 8 | 1.3% |
| 60 to 89 Minutes | 43 | 7.3% |
| 90 or more Minutes | 23 | 3.9% |
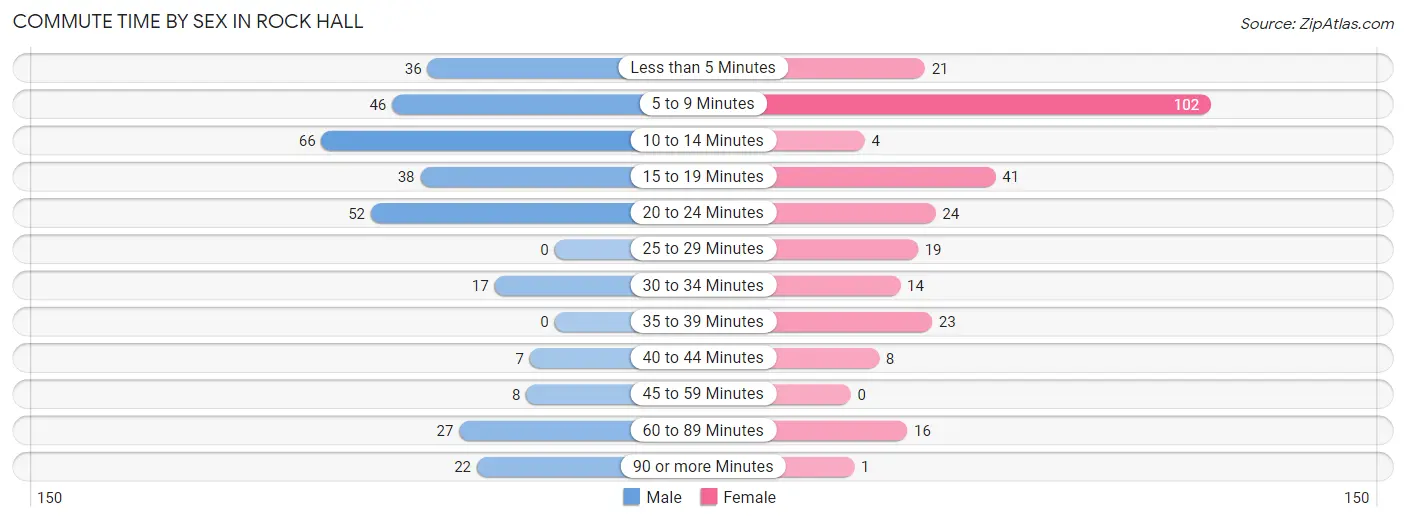
Commute Time by Sex in Rock Hall
The most common commute times in Rock Hall are 10 to 14 minutes (66 commuters, 20.7%) for males and 5 to 9 minutes (102 commuters, 37.4%) for females.
| Commute Time | Male | Female |
| Less than 5 Minutes | 36 (11.3%) | 21 (7.7%) |
| 5 to 9 Minutes | 46 (14.4%) | 102 (37.4%) |
| 10 to 14 Minutes | 66 (20.7%) | 4 (1.5%) |
| 15 to 19 Minutes | 38 (11.9%) | 41 (15.0%) |
| 20 to 24 Minutes | 52 (16.3%) | 24 (8.8%) |
| 25 to 29 Minutes | 0 (0.0%) | 19 (7.0%) |
| 30 to 34 Minutes | 17 (5.3%) | 14 (5.1%) |
| 35 to 39 Minutes | 0 (0.0%) | 23 (8.4%) |
| 40 to 44 Minutes | 7 (2.2%) | 8 (2.9%) |
| 45 to 59 Minutes | 8 (2.5%) | 0 (0.0%) |
| 60 to 89 Minutes | 27 (8.5%) | 16 (5.9%) |
| 90 or more Minutes | 22 (6.9%) | 1 (0.4%) |
Time of Departure to Work by Sex in Rock Hall
The most frequent times of departure to work in Rock Hall are 6:00 AM to 6:29 AM (69, 21.6%) for males and 7:00 AM to 7:29 AM (62, 22.7%) for females.

| Time of Departure | Male | Female |
| 12:00 AM to 4:59 AM | 22 (6.9%) | 39 (14.3%) |
| 5:00 AM to 5:29 AM | 0 (0.0%) | 0 (0.0%) |
| 5:30 AM to 5:59 AM | 20 (6.3%) | 1 (0.4%) |
| 6:00 AM to 6:29 AM | 69 (21.6%) | 1 (0.4%) |
| 6:30 AM to 6:59 AM | 22 (6.9%) | 21 (7.7%) |
| 7:00 AM to 7:29 AM | 39 (12.2%) | 62 (22.7%) |
| 7:30 AM to 7:59 AM | 17 (5.3%) | 22 (8.1%) |
| 8:00 AM to 8:29 AM | 25 (7.8%) | 33 (12.1%) |
| 8:30 AM to 8:59 AM | 18 (5.6%) | 25 (9.2%) |
| 9:00 AM to 9:59 AM | 13 (4.1%) | 27 (9.9%) |
| 10:00 AM to 10:59 AM | 27 (8.5%) | 2 (0.7%) |
| 11:00 AM to 11:59 AM | 0 (0.0%) | 0 (0.0%) |
| 12:00 PM to 3:59 PM | 40 (12.5%) | 37 (13.6%) |
| 4:00 PM to 11:59 PM | 7 (2.2%) | 3 (1.1%) |
| Total | 319 (100.0%) | 273 (100.0%) |
Housing Occupancy in Rock Hall
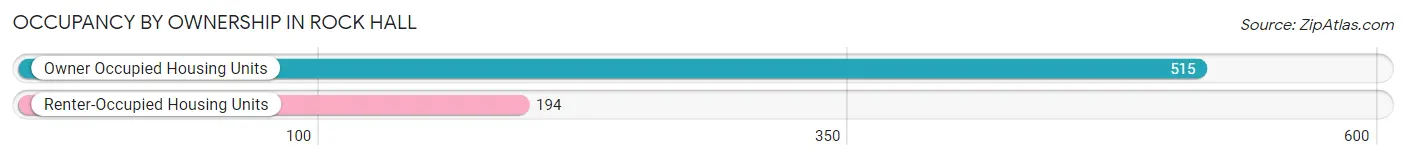
Occupancy by Ownership in Rock Hall
Of the total 709 dwellings in Rock Hall, owner-occupied units account for 515 (72.6%), while renter-occupied units make up 194 (27.4%).
| Occupancy | # Housing Units | % Housing Units |
| Owner Occupied Housing Units | 515 | 72.6% |
| Renter-Occupied Housing Units | 194 | 27.4% |
| Total Occupied Housing Units | 709 | 100.0% |
Occupancy by Household Size in Rock Hall
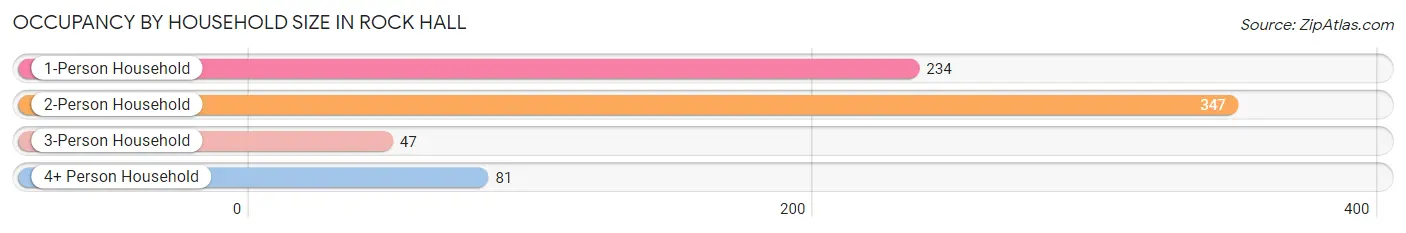
| Household Size | # Housing Units | % Housing Units |
| 1-Person Household | 234 | 33.0% |
| 2-Person Household | 347 | 48.9% |
| 3-Person Household | 47 | 6.6% |
| 4+ Person Household | 81 | 11.4% |
| Total Housing Units | 709 | 100.0% |
Occupancy by Ownership by Household Size in Rock Hall
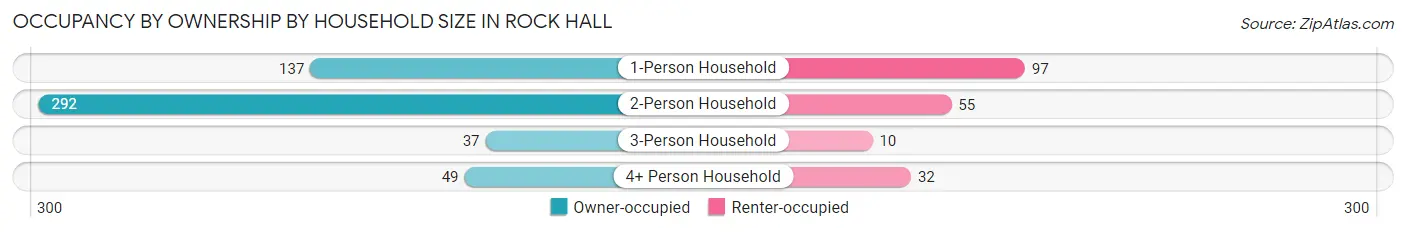
| Household Size | Owner-occupied | Renter-occupied |
| 1-Person Household | 137 (58.6%) | 97 (41.4%) |
| 2-Person Household | 292 (84.2%) | 55 (15.9%) |
| 3-Person Household | 37 (78.7%) | 10 (21.3%) |
| 4+ Person Household | 49 (60.5%) | 32 (39.5%) |
| Total Housing Units | 515 (72.6%) | 194 (27.4%) |
Occupancy by Educational Attainment in Rock Hall
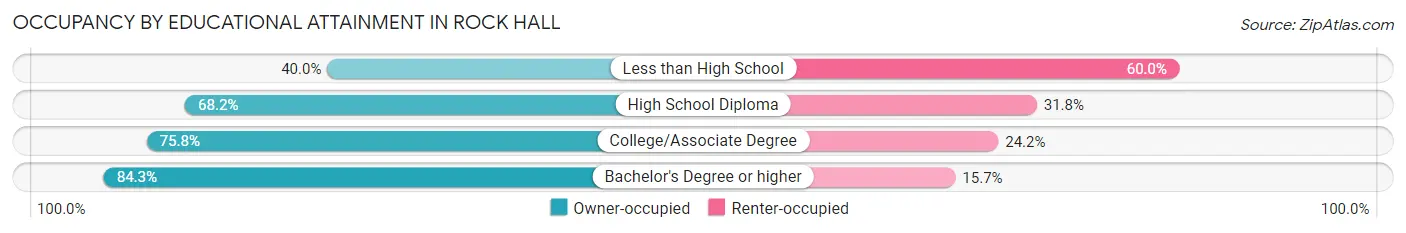
| Household Size | Owner-occupied | Renter-occupied |
| Less than High School | 26 (40.0%) | 39 (60.0%) |
| High School Diploma | 137 (68.2%) | 64 (31.8%) |
| College/Associate Degree | 191 (75.8%) | 61 (24.2%) |
| Bachelor's Degree or higher | 161 (84.3%) | 30 (15.7%) |
Occupancy by Age of Householder in Rock Hall
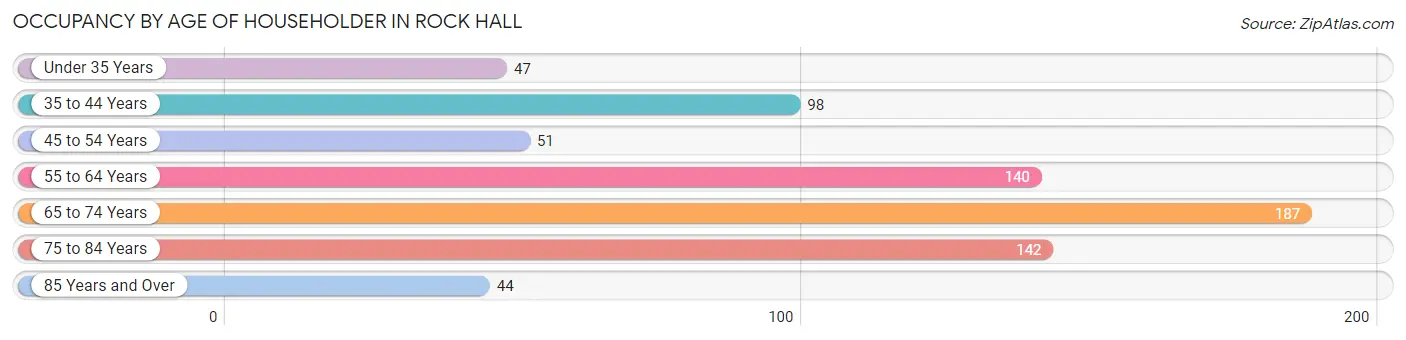
| Age Bracket | # Households | % Households |
| Under 35 Years | 47 | 6.6% |
| 35 to 44 Years | 98 | 13.8% |
| 45 to 54 Years | 51 | 7.2% |
| 55 to 64 Years | 140 | 19.8% |
| 65 to 74 Years | 187 | 26.4% |
| 75 to 84 Years | 142 | 20.0% |
| 85 Years and Over | 44 | 6.2% |
| Total | 709 | 100.0% |
Housing Finances in Rock Hall
Median Income by Occupancy in Rock Hall
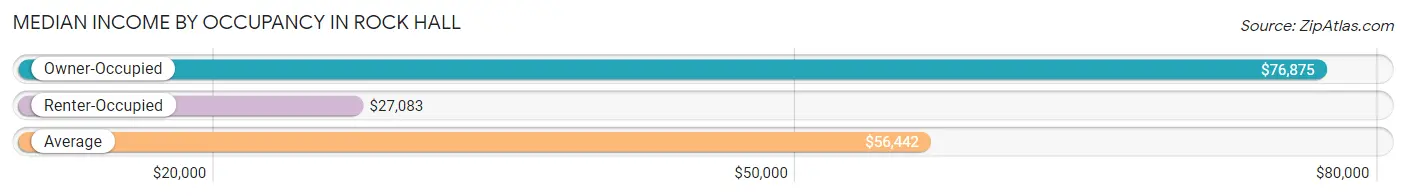
| Occupancy Type | # Households | Median Income |
| Owner-Occupied | 515 (72.6%) | $76,875 |
| Renter-Occupied | 194 (27.4%) | $27,083 |
| Average | 709 (100.0%) | $56,442 |
Occupancy by Householder Income Bracket in Rock Hall
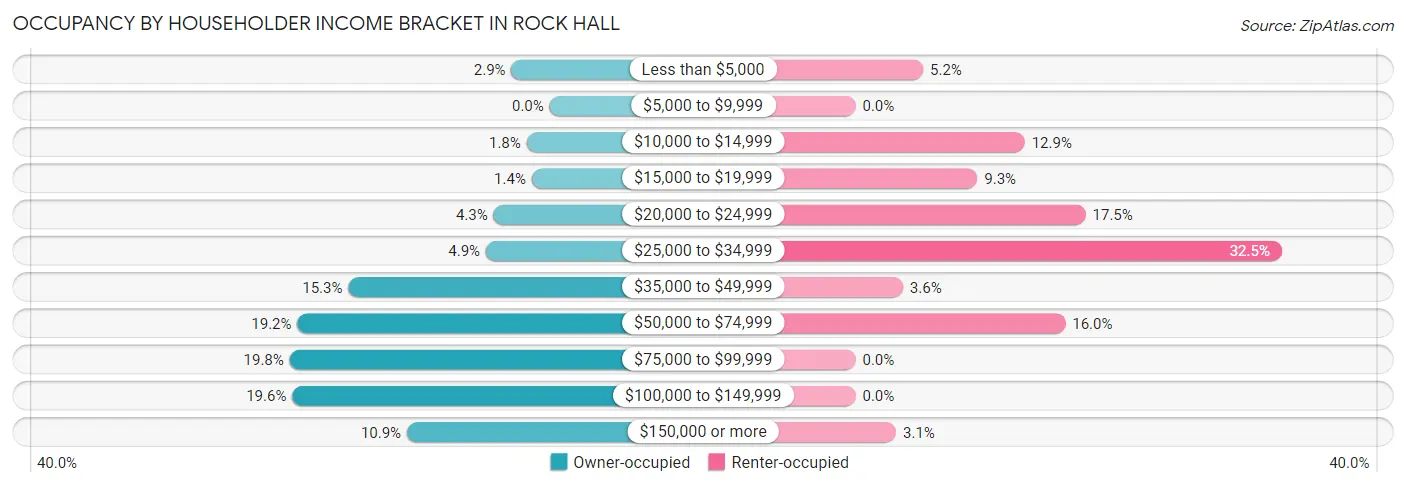
| Income Bracket | Owner-occupied | Renter-occupied |
| Less than $5,000 | 15 (2.9%) | 10 (5.1%) |
| $5,000 to $9,999 | 0 (0.0%) | 0 (0.0%) |
| $10,000 to $14,999 | 9 (1.8%) | 25 (12.9%) |
| $15,000 to $19,999 | 7 (1.4%) | 18 (9.3%) |
| $20,000 to $24,999 | 22 (4.3%) | 34 (17.5%) |
| $25,000 to $34,999 | 25 (4.9%) | 63 (32.5%) |
| $35,000 to $49,999 | 79 (15.3%) | 7 (3.6%) |
| $50,000 to $74,999 | 99 (19.2%) | 31 (16.0%) |
| $75,000 to $99,999 | 102 (19.8%) | 0 (0.0%) |
| $100,000 to $149,999 | 101 (19.6%) | 0 (0.0%) |
| $150,000 or more | 56 (10.9%) | 6 (3.1%) |
| Total | 515 (100.0%) | 194 (100.0%) |
Monthly Housing Cost Tiers in Rock Hall
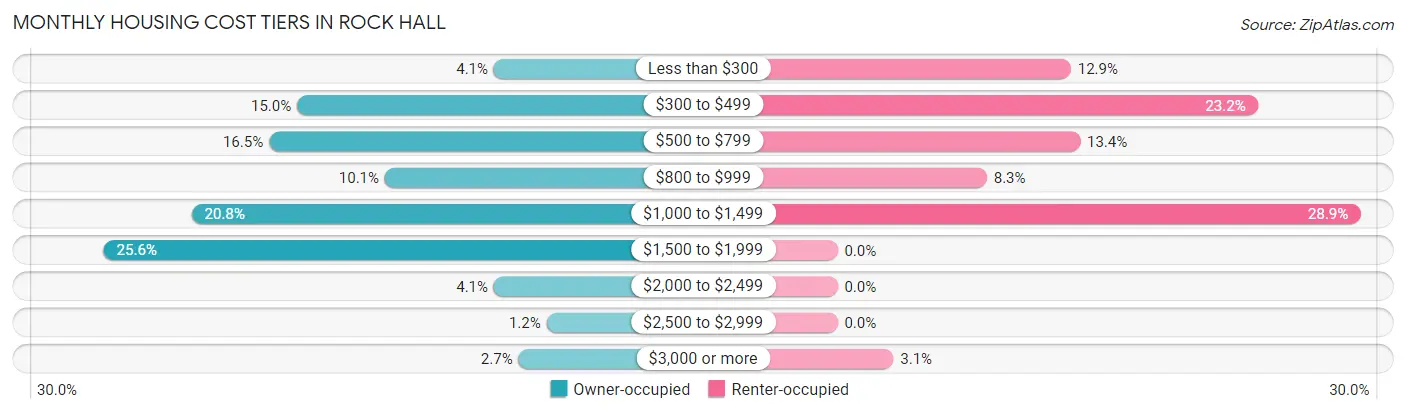
| Monthly Cost | Owner-occupied | Renter-occupied |
| Less than $300 | 21 (4.1%) | 25 (12.9%) |
| $300 to $499 | 77 (14.9%) | 45 (23.2%) |
| $500 to $799 | 85 (16.5%) | 26 (13.4%) |
| $800 to $999 | 52 (10.1%) | 16 (8.3%) |
| $1,000 to $1,499 | 107 (20.8%) | 56 (28.9%) |
| $1,500 to $1,999 | 132 (25.6%) | 0 (0.0%) |
| $2,000 to $2,499 | 21 (4.1%) | 0 (0.0%) |
| $2,500 to $2,999 | 6 (1.2%) | 0 (0.0%) |
| $3,000 or more | 14 (2.7%) | 6 (3.1%) |
| Total | 515 (100.0%) | 194 (100.0%) |
Physical Housing Characteristics in Rock Hall
Housing Structures in Rock Hall
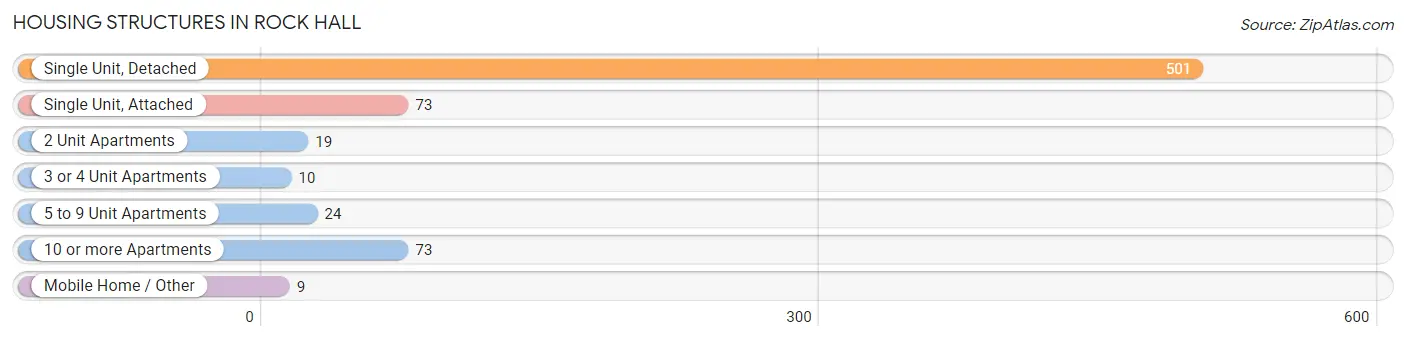
| Structure Type | # Housing Units | % Housing Units |
| Single Unit, Detached | 501 | 70.7% |
| Single Unit, Attached | 73 | 10.3% |
| 2 Unit Apartments | 19 | 2.7% |
| 3 or 4 Unit Apartments | 10 | 1.4% |
| 5 to 9 Unit Apartments | 24 | 3.4% |
| 10 or more Apartments | 73 | 10.3% |
| Mobile Home / Other | 9 | 1.3% |
| Total | 709 | 100.0% |
Housing Structures by Occupancy in Rock Hall
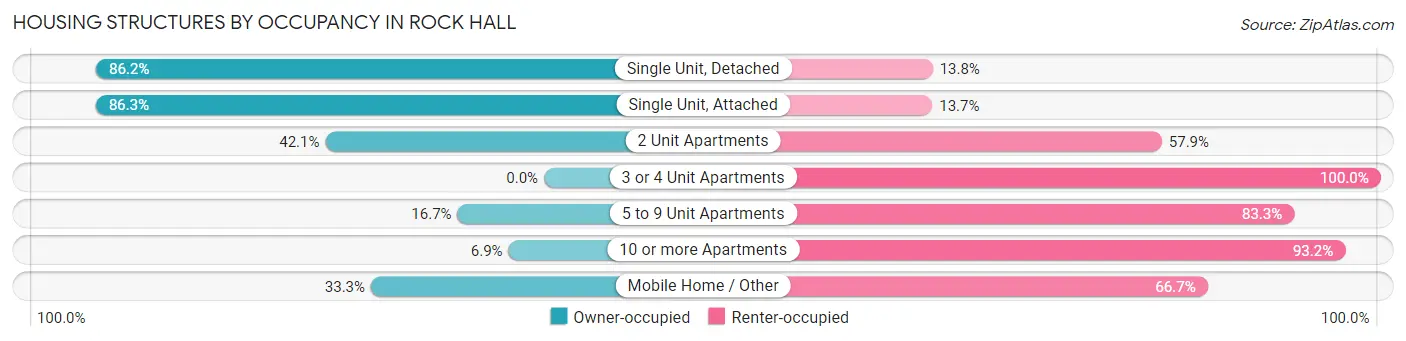
| Structure Type | Owner-occupied | Renter-occupied |
| Single Unit, Detached | 432 (86.2%) | 69 (13.8%) |
| Single Unit, Attached | 63 (86.3%) | 10 (13.7%) |
| 2 Unit Apartments | 8 (42.1%) | 11 (57.9%) |
| 3 or 4 Unit Apartments | 0 (0.0%) | 10 (100.0%) |
| 5 to 9 Unit Apartments | 4 (16.7%) | 20 (83.3%) |
| 10 or more Apartments | 5 (6.9%) | 68 (93.1%) |
| Mobile Home / Other | 3 (33.3%) | 6 (66.7%) |
| Total | 515 (72.6%) | 194 (27.4%) |
Housing Structures by Number of Rooms in Rock Hall
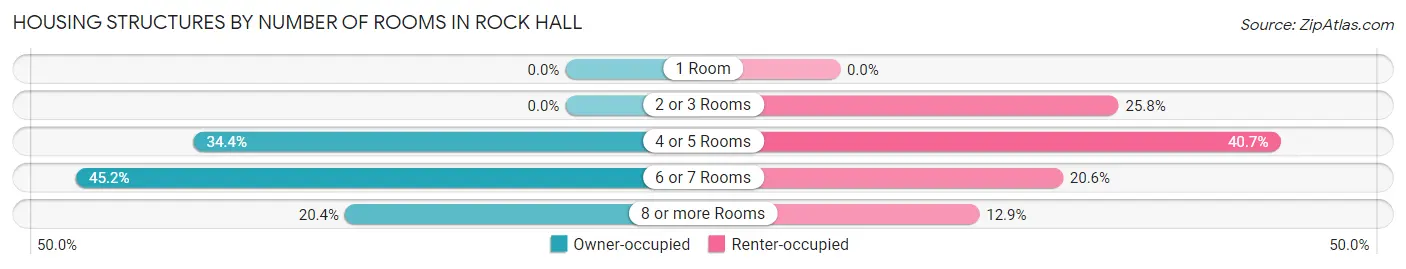
| Number of Rooms | Owner-occupied | Renter-occupied |
| 1 Room | 0 (0.0%) | 0 (0.0%) |
| 2 or 3 Rooms | 0 (0.0%) | 50 (25.8%) |
| 4 or 5 Rooms | 177 (34.4%) | 79 (40.7%) |
| 6 or 7 Rooms | 233 (45.2%) | 40 (20.6%) |
| 8 or more Rooms | 105 (20.4%) | 25 (12.9%) |
| Total | 515 (100.0%) | 194 (100.0%) |
Housing Structure by Heating Type in Rock Hall
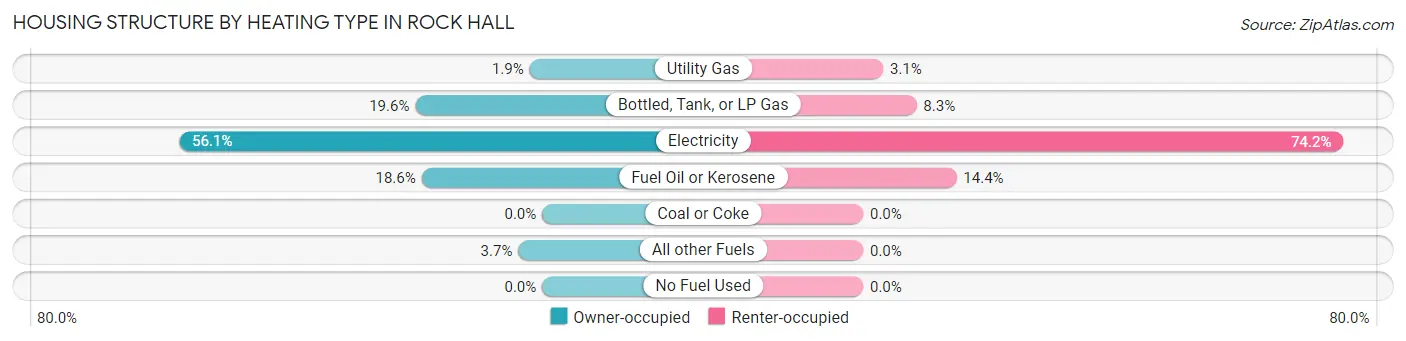
| Heating Type | Owner-occupied | Renter-occupied |
| Utility Gas | 10 (1.9%) | 6 (3.1%) |
| Bottled, Tank, or LP Gas | 101 (19.6%) | 16 (8.3%) |
| Electricity | 289 (56.1%) | 144 (74.2%) |
| Fuel Oil or Kerosene | 96 (18.6%) | 28 (14.4%) |
| Coal or Coke | 0 (0.0%) | 0 (0.0%) |
| All other Fuels | 19 (3.7%) | 0 (0.0%) |
| No Fuel Used | 0 (0.0%) | 0 (0.0%) |
| Total | 515 (100.0%) | 194 (100.0%) |
Household Vehicle Usage in Rock Hall
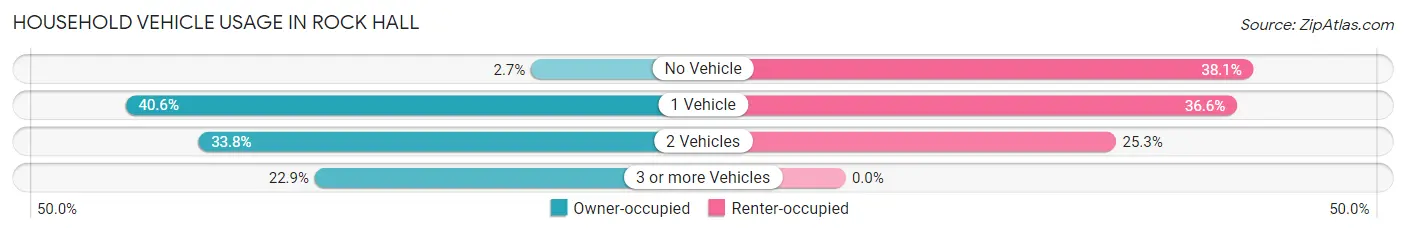
| Vehicles per Household | Owner-occupied | Renter-occupied |
| No Vehicle | 14 (2.7%) | 74 (38.1%) |
| 1 Vehicle | 209 (40.6%) | 71 (36.6%) |
| 2 Vehicles | 174 (33.8%) | 49 (25.3%) |
| 3 or more Vehicles | 118 (22.9%) | 0 (0.0%) |
| Total | 515 (100.0%) | 194 (100.0%) |
Real Estate & Mortgages in Rock Hall
Real Estate and Mortgage Overview in Rock Hall
| Characteristic | Without Mortgage | With Mortgage |
| Housing Units | 284 | 231 |
| Median Property Value | $283,300 | $197,000 |
| Median Household Income | $48,750 | $27 |
| Monthly Housing Costs | $634 | $14 |
| Real Estate Taxes | $2,835 | $7 |
Property Value by Mortgage Status in Rock Hall
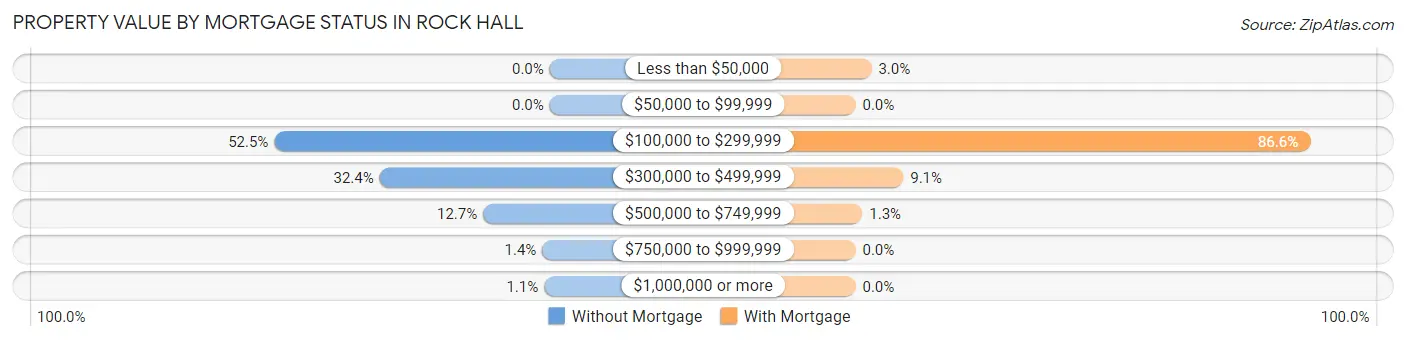
| Property Value | Without Mortgage | With Mortgage |
| Less than $50,000 | 0 (0.0%) | 7 (3.0%) |
| $50,000 to $99,999 | 0 (0.0%) | 0 (0.0%) |
| $100,000 to $299,999 | 149 (52.5%) | 200 (86.6%) |
| $300,000 to $499,999 | 92 (32.4%) | 21 (9.1%) |
| $500,000 to $749,999 | 36 (12.7%) | 3 (1.3%) |
| $750,000 to $999,999 | 4 (1.4%) | 0 (0.0%) |
| $1,000,000 or more | 3 (1.1%) | 0 (0.0%) |
| Total | 284 (100.0%) | 231 (100.0%) |
Household Income by Mortgage Status in Rock Hall
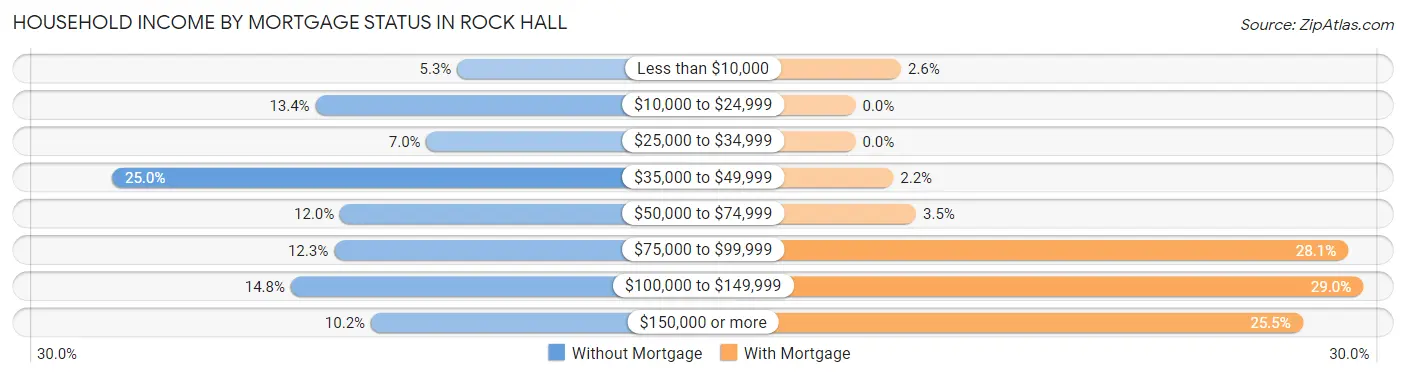
| Household Income | Without Mortgage | With Mortgage |
| Less than $10,000 | 15 (5.3%) | 6 (2.6%) |
| $10,000 to $24,999 | 38 (13.4%) | 0 (0.0%) |
| $25,000 to $34,999 | 20 (7.0%) | 0 (0.0%) |
| $35,000 to $49,999 | 71 (25.0%) | 5 (2.2%) |
| $50,000 to $74,999 | 34 (12.0%) | 8 (3.5%) |
| $75,000 to $99,999 | 35 (12.3%) | 65 (28.1%) |
| $100,000 to $149,999 | 42 (14.8%) | 67 (29.0%) |
| $150,000 or more | 29 (10.2%) | 59 (25.5%) |
| Total | 284 (100.0%) | 231 (100.0%) |
Property Value to Household Income Ratio in Rock Hall
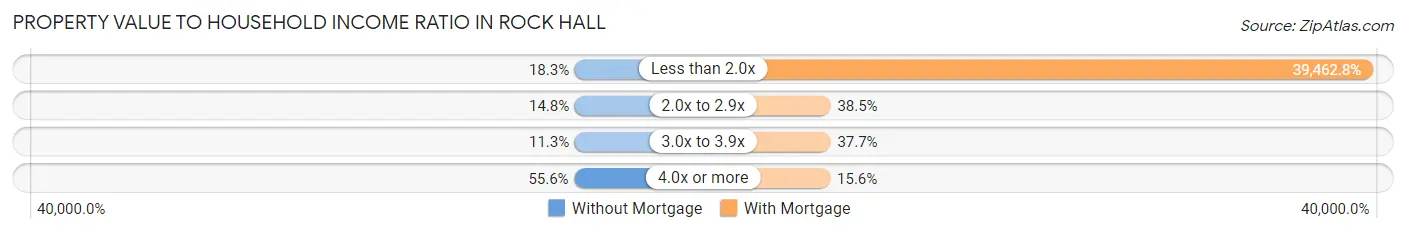
| Value-to-Income Ratio | Without Mortgage | With Mortgage |
| Less than 2.0x | 52 (18.3%) | 91,159 (39,462.8%) |
| 2.0x to 2.9x | 42 (14.8%) | 89 (38.5%) |
| 3.0x to 3.9x | 32 (11.3%) | 87 (37.7%) |
| 4.0x or more | 158 (55.6%) | 36 (15.6%) |
| Total | 284 (100.0%) | 231 (100.0%) |
Real Estate Taxes by Mortgage Status in Rock Hall
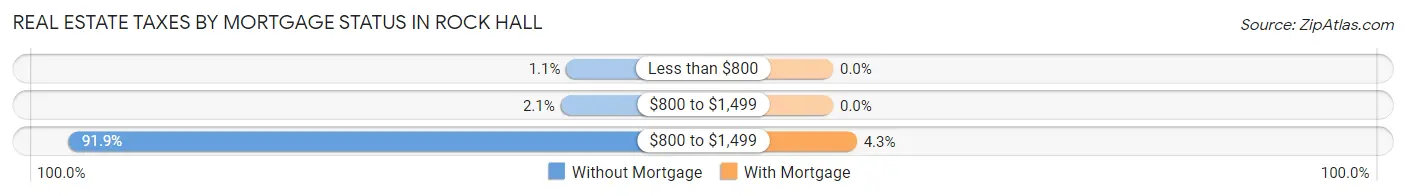
| Property Taxes | Without Mortgage | With Mortgage |
| Less than $800 | 3 (1.1%) | 0 (0.0%) |
| $800 to $1,499 | 6 (2.1%) | 0 (0.0%) |
| $800 to $1,499 | 261 (91.9%) | 10 (4.3%) |
| Total | 284 (100.0%) | 231 (100.0%) |
Health & Disability in Rock Hall
Health Insurance Coverage by Age in Rock Hall
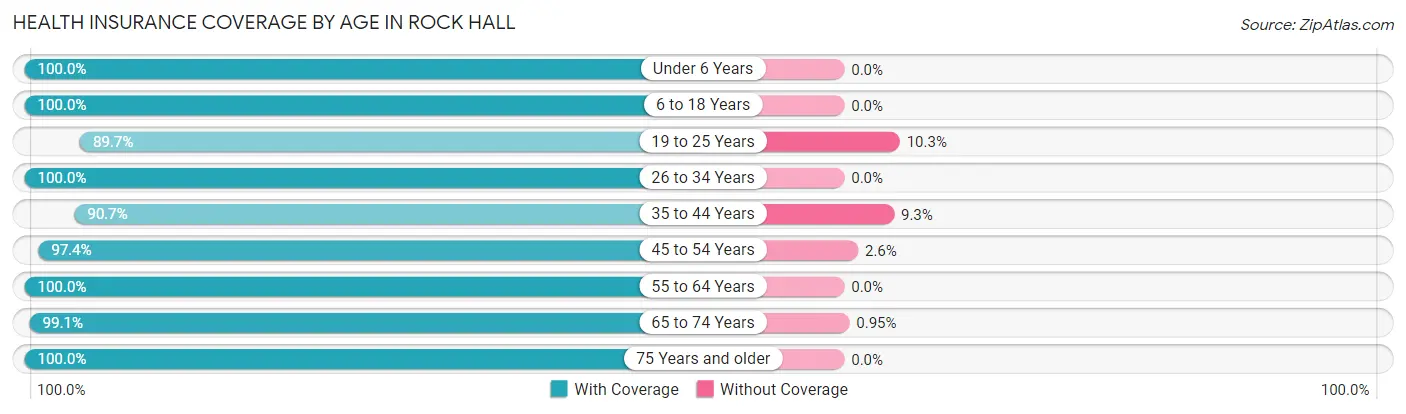
| Age Bracket | With Coverage | Without Coverage |
| Under 6 Years | 69 (100.0%) | 0 (0.0%) |
| 6 to 18 Years | 162 (100.0%) | 0 (0.0%) |
| 19 to 25 Years | 78 (89.7%) | 9 (10.3%) |
| 26 to 34 Years | 79 (100.0%) | 0 (0.0%) |
| 35 to 44 Years | 137 (90.7%) | 14 (9.3%) |
| 45 to 54 Years | 76 (97.4%) | 2 (2.6%) |
| 55 to 64 Years | 204 (100.0%) | 0 (0.0%) |
| 65 to 74 Years | 313 (99.1%) | 3 (0.9%) |
| 75 Years and older | 260 (100.0%) | 0 (0.0%) |
| Total | 1,378 (98.0%) | 28 (2.0%) |
Health Insurance Coverage by Citizenship Status in Rock Hall
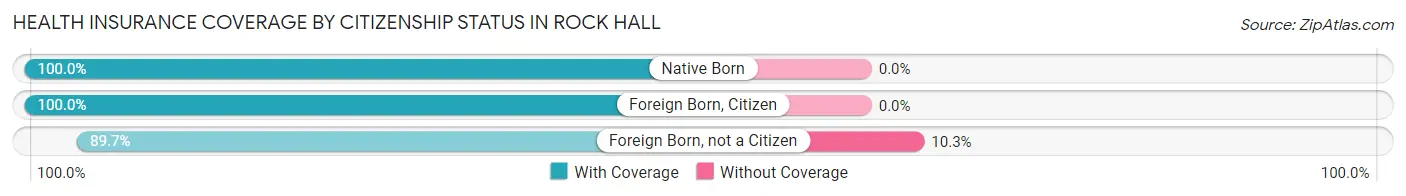
| Citizenship Status | With Coverage | Without Coverage |
| Native Born | 69 (100.0%) | 0 (0.0%) |
| Foreign Born, Citizen | 162 (100.0%) | 0 (0.0%) |
| Foreign Born, not a Citizen | 78 (89.7%) | 9 (10.3%) |
Health Insurance Coverage by Household Income in Rock Hall
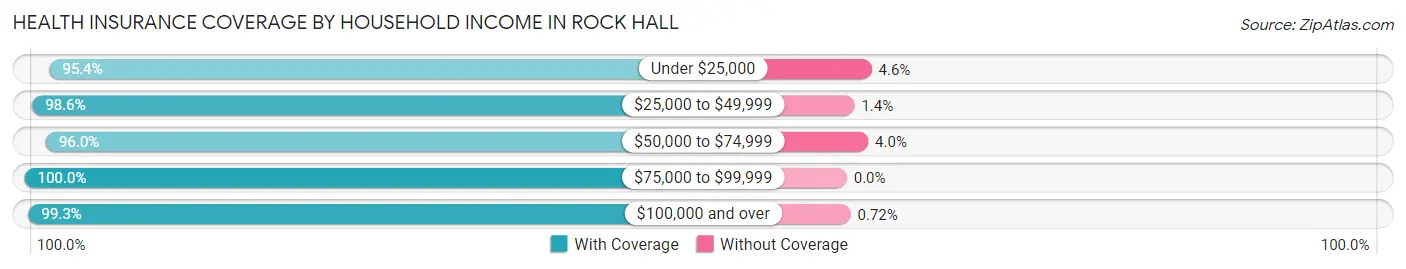
| Household Income | With Coverage | Without Coverage |
| Under $25,000 | 185 (95.4%) | 9 (4.6%) |
| $25,000 to $49,999 | 342 (98.6%) | 5 (1.4%) |
| $50,000 to $74,999 | 264 (96.0%) | 11 (4.0%) |
| $75,000 to $99,999 | 174 (100.0%) | 0 (0.0%) |
| $100,000 and over | 413 (99.3%) | 3 (0.7%) |
Public vs Private Health Insurance Coverage by Age in Rock Hall
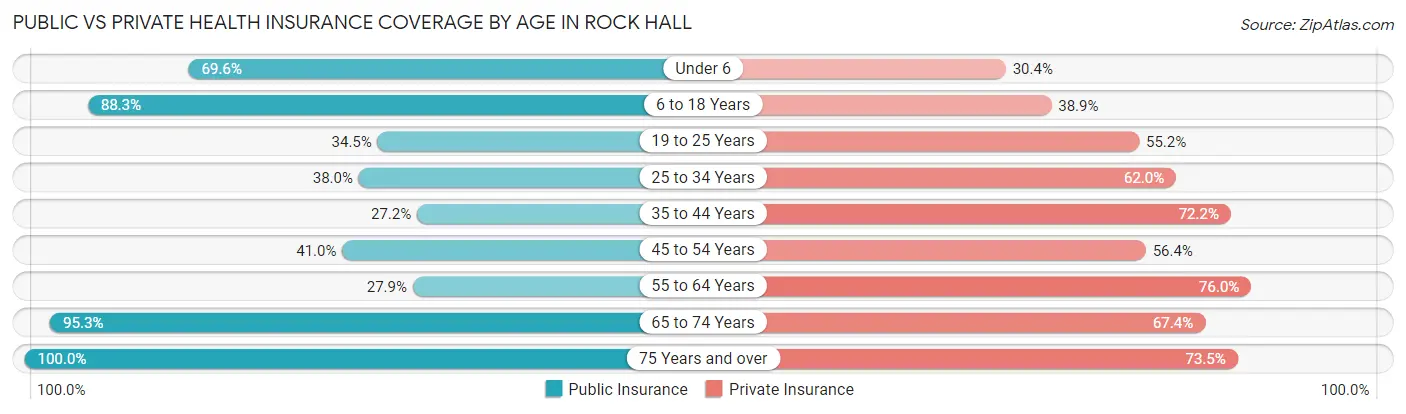
| Age Bracket | Public Insurance | Private Insurance |
| Under 6 | 48 (69.6%) | 21 (30.4%) |
| 6 to 18 Years | 143 (88.3%) | 63 (38.9%) |
| 19 to 25 Years | 30 (34.5%) | 48 (55.2%) |
| 25 to 34 Years | 30 (38.0%) | 49 (62.0%) |
| 35 to 44 Years | 41 (27.2%) | 109 (72.2%) |
| 45 to 54 Years | 32 (41.0%) | 44 (56.4%) |
| 55 to 64 Years | 57 (27.9%) | 155 (76.0%) |
| 65 to 74 Years | 301 (95.3%) | 213 (67.4%) |
| 75 Years and over | 260 (100.0%) | 191 (73.5%) |
| Total | 942 (67.0%) | 893 (63.5%) |
Disability Status by Sex by Age in Rock Hall
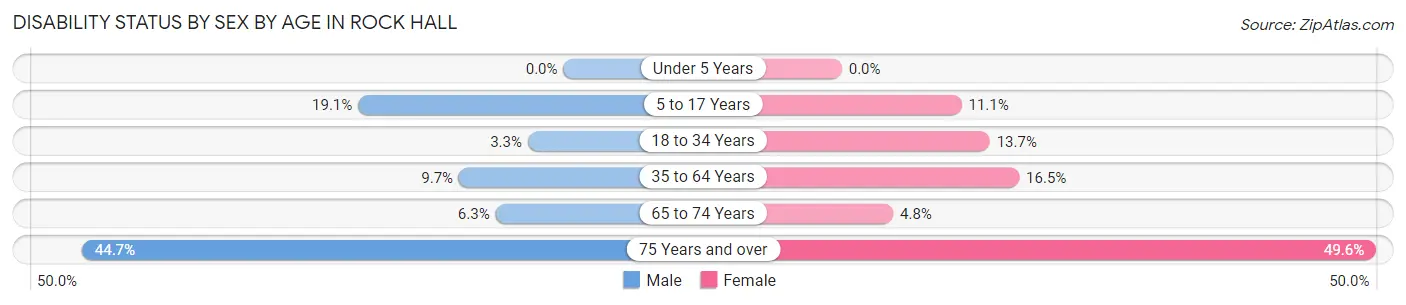
| Age Bracket | Male | Female |
| Under 5 Years | 0 (0.0%) | 0 (0.0%) |
| 5 to 17 Years | 8 (19.1%) | 11 (11.1%) |
| 18 to 34 Years | 3 (3.3%) | 14 (13.7%) |
| 35 to 64 Years | 19 (9.7%) | 39 (16.5%) |
| 65 to 74 Years | 8 (6.3%) | 9 (4.8%) |
| 75 Years and over | 63 (44.7%) | 59 (49.6%) |
Disability Class by Sex by Age in Rock Hall
Disability Class: Hearing Difficulty
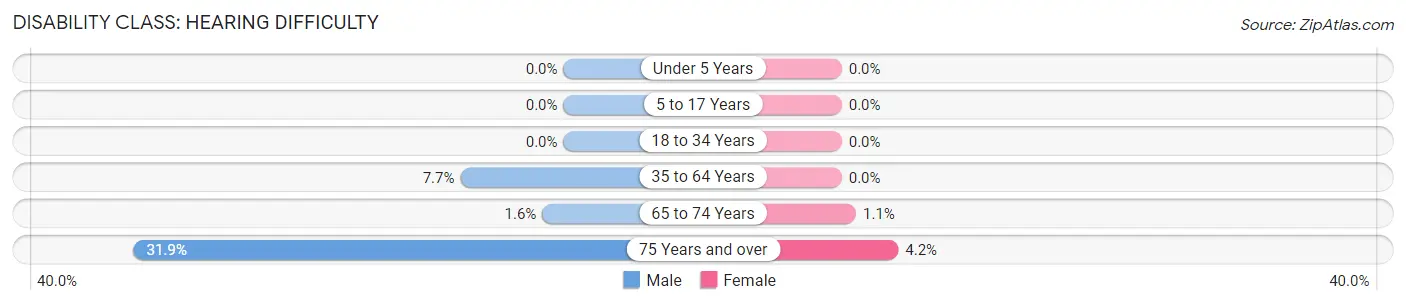
| Age Bracket | Male | Female |
| Under 5 Years | 0 (0.0%) | 0 (0.0%) |
| 5 to 17 Years | 0 (0.0%) | 0 (0.0%) |
| 18 to 34 Years | 0 (0.0%) | 0 (0.0%) |
| 35 to 64 Years | 15 (7.6%) | 0 (0.0%) |
| 65 to 74 Years | 2 (1.6%) | 2 (1.1%) |
| 75 Years and over | 45 (31.9%) | 5 (4.2%) |
Disability Class: Vision Difficulty
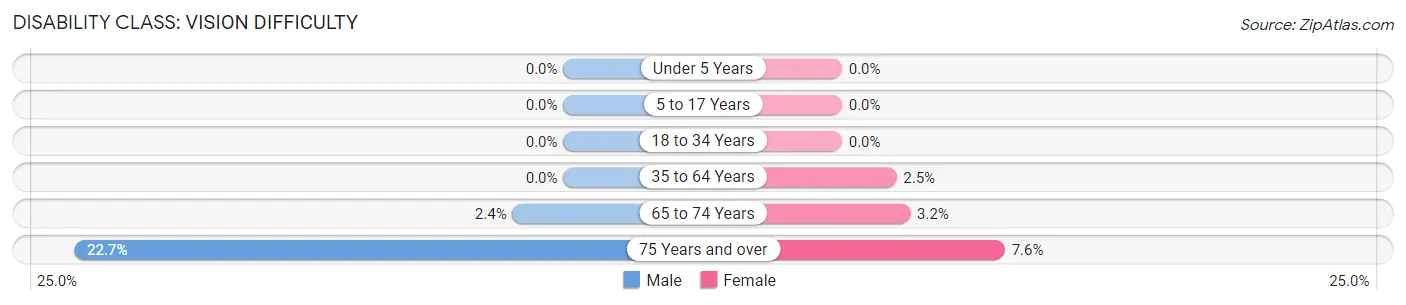
| Age Bracket | Male | Female |
| Under 5 Years | 0 (0.0%) | 0 (0.0%) |
| 5 to 17 Years | 0 (0.0%) | 0 (0.0%) |
| 18 to 34 Years | 0 (0.0%) | 0 (0.0%) |
| 35 to 64 Years | 0 (0.0%) | 6 (2.5%) |
| 65 to 74 Years | 3 (2.4%) | 6 (3.2%) |
| 75 Years and over | 32 (22.7%) | 9 (7.6%) |
Disability Class: Cognitive Difficulty
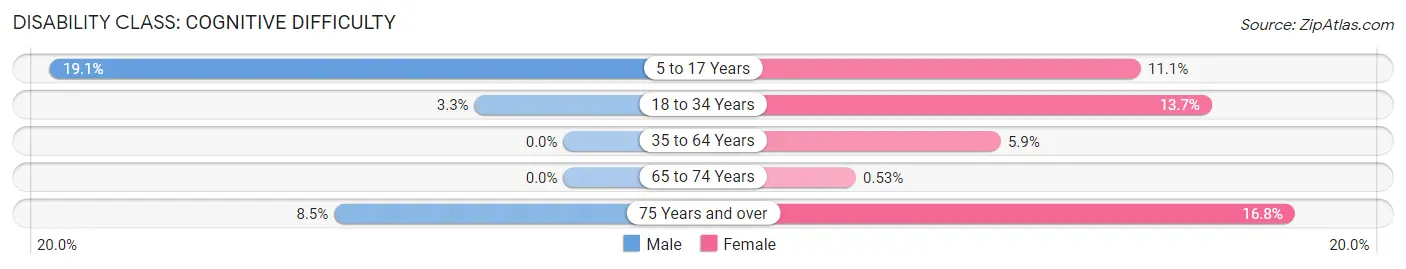
| Age Bracket | Male | Female |
| 5 to 17 Years | 8 (19.1%) | 11 (11.1%) |
| 18 to 34 Years | 3 (3.3%) | 14 (13.7%) |
| 35 to 64 Years | 0 (0.0%) | 14 (5.9%) |
| 65 to 74 Years | 0 (0.0%) | 1 (0.5%) |
| 75 Years and over | 12 (8.5%) | 20 (16.8%) |
Disability Class: Ambulatory Difficulty
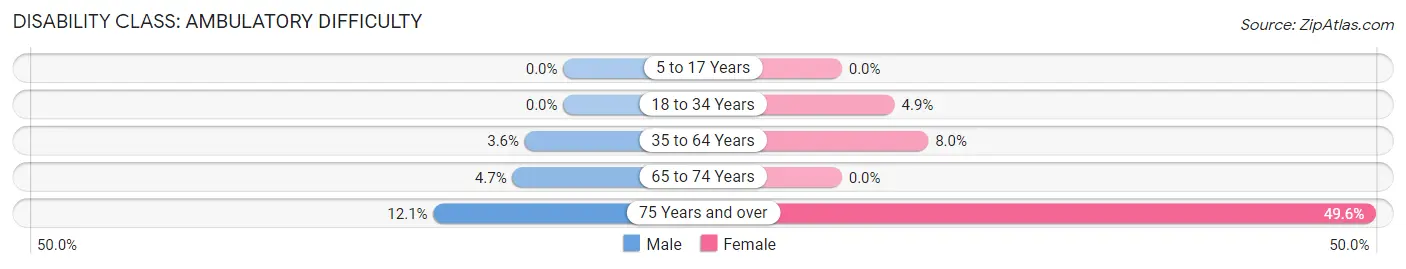
| Age Bracket | Male | Female |
| 5 to 17 Years | 0 (0.0%) | 0 (0.0%) |
| 18 to 34 Years | 0 (0.0%) | 5 (4.9%) |
| 35 to 64 Years | 7 (3.6%) | 19 (8.0%) |
| 65 to 74 Years | 6 (4.7%) | 0 (0.0%) |
| 75 Years and over | 17 (12.1%) | 59 (49.6%) |
Disability Class: Self-Care Difficulty
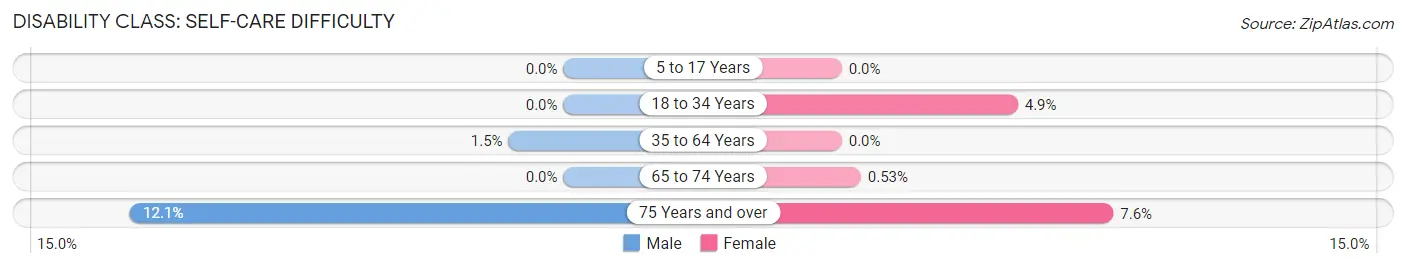
| Age Bracket | Male | Female |
| 5 to 17 Years | 0 (0.0%) | 0 (0.0%) |
| 18 to 34 Years | 0 (0.0%) | 5 (4.9%) |
| 35 to 64 Years | 3 (1.5%) | 0 (0.0%) |
| 65 to 74 Years | 0 (0.0%) | 1 (0.5%) |
| 75 Years and over | 17 (12.1%) | 9 (7.6%) |
Technology Access in Rock Hall
Computing Device Access in Rock Hall
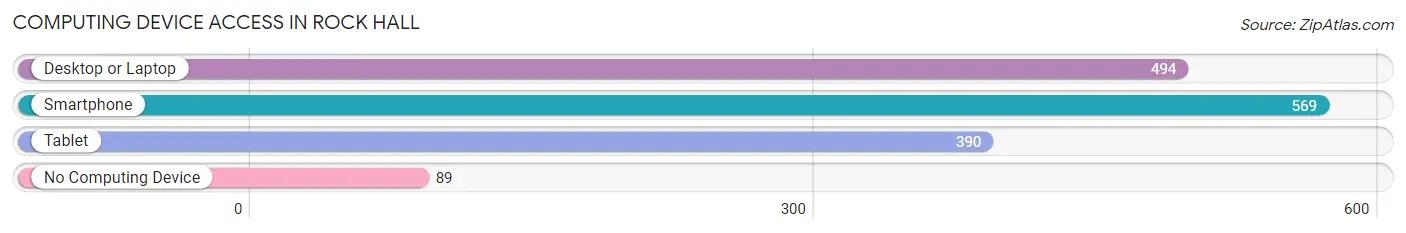
| Device Type | # Households | % Households |
| Desktop or Laptop | 494 | 69.7% |
| Smartphone | 569 | 80.2% |
| Tablet | 390 | 55.0% |
| No Computing Device | 89 | 12.6% |
| Total | 709 | 100.0% |
Internet Access in Rock Hall
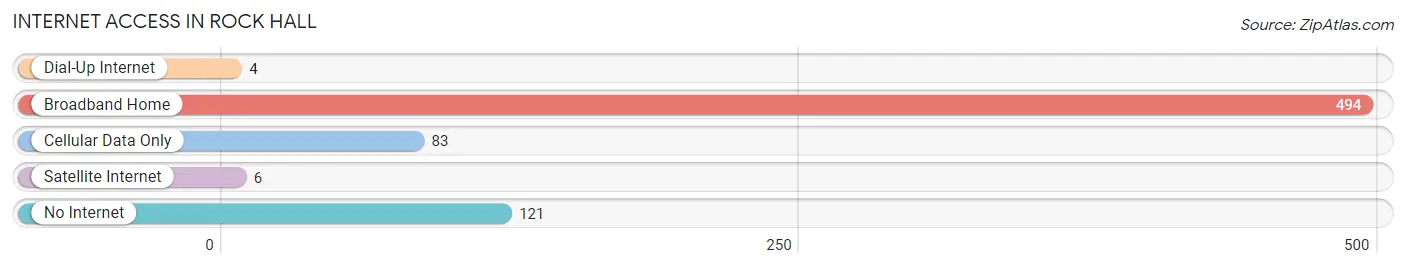
| Internet Type | # Households | % Households |
| Dial-Up Internet | 4 | 0.6% |
| Broadband Home | 494 | 69.7% |
| Cellular Data Only | 83 | 11.7% |
| Satellite Internet | 6 | 0.9% |
| No Internet | 121 | 17.1% |
| Total | 709 | 100.0% |
Rock Hall Summary
Hall Rock, Maryland is a small town located in the northern part of the state, just south of the Pennsylvania border. It is situated in the northern part of Cecil County, and is part of the Elkton-North East Metropolitan Statistical Area. The town has a population of just over 1,000 people, and is known for its rural charm and small-town atmosphere.
History
Hall Rock was first settled in the late 1700s by a group of German immigrants. The town was originally known as “Hallsburg”, and was named after the original settler, John Hall. The town was officially incorporated in 1872, and was named after the nearby Hall Rock, a large boulder that was used as a landmark by the early settlers.
Geography
Hall Rock is located in the northern part of Cecil County, Maryland. It is situated in the northern part of the Elkton-North East Metropolitan Statistical Area. The town is located on the banks of the Susquehanna River, and is surrounded by rolling hills and farmland. The town is located approximately 30 miles from Baltimore, and is accessible by both Interstate 95 and US Route 40.
Economy
Hall Rock’s economy is largely based on agriculture and tourism. The town is home to several small farms, which produce a variety of crops, including corn, soybeans, and wheat. The town is also home to several small businesses, including a few restaurants, a grocery store, and a few antique shops. Tourism is also an important part of the local economy, as the town is home to several historic sites, including the Hall Rock Historic District, which is listed on the National Register of Historic Places.
Demographics
As of the 2010 census, Hall Rock had a population of 1,072 people. The racial makeup of the town was 94.3% White, 2.2% African American, 0.3% Native American, 0.7% Asian, 0.1% Pacific Islander, and 2.4% from other races. The median household income was $45,938, and the median family income was $51,250. The per capita income was $20,945.
Hall Rock is a small town with a rich history and a unique atmosphere. It is a great place to live, work, and visit, and is a great example of rural Maryland life. The town is home to a variety of businesses, farms, and historic sites, and is a great place to explore and experience the beauty of the Chesapeake region.
Common Questions
What is Per Capita Income in Rock Hall?
Per Capita income in Rock Hall is $38,739.
What is the Median Family Income in Rock Hall?
Median Family Income in Rock Hall is $69,306.
What is the Median Household income in Rock Hall?
Median Household Income in Rock Hall is $56,442.
What is Income or Wage Gap in Rock Hall?
Income or Wage Gap in Rock Hall is 24.5%.
Women in Rock Hall earn 75.5 cents for every dollar earned by a man.
What is Inequality or Gini Index in Rock Hall?
Inequality or Gini Index in Rock Hall is 0.46.
What is the Total Population of Rock Hall?
Total Population of Rock Hall is 1,456.
What is the Total Male Population of Rock Hall?
Total Male Population of Rock Hall is 664.
What is the Total Female Population of Rock Hall?
Total Female Population of Rock Hall is 792.
What is the Ratio of Males per 100 Females in Rock Hall?
There are 83.84 Males per 100 Females in Rock Hall.
What is the Ratio of Females per 100 Males in Rock Hall?
There are 119.28 Females per 100 Males in Rock Hall.
What is the Median Population Age in Rock Hall?
Median Population Age in Rock Hall is 59.7 Years.
What is the Average Family Size in Rock Hall
Average Family Size in Rock Hall is 2.5 People.
What is the Average Household Size in Rock Hall
Average Household Size in Rock Hall is 2.0 People.
How Large is the Labor Force in Rock Hall?
There are 675 People in the Labor Forcein in Rock Hall.
What is the Percentage of People in the Labor Force in Rock Hall?
53.0% of People are in the Labor Force in Rock Hall.
What is the Unemployment Rate in Rock Hall?
Unemployment Rate in Rock Hall is 5.2%.