Stevensville, MD Map & Demographics
Stevensville Map
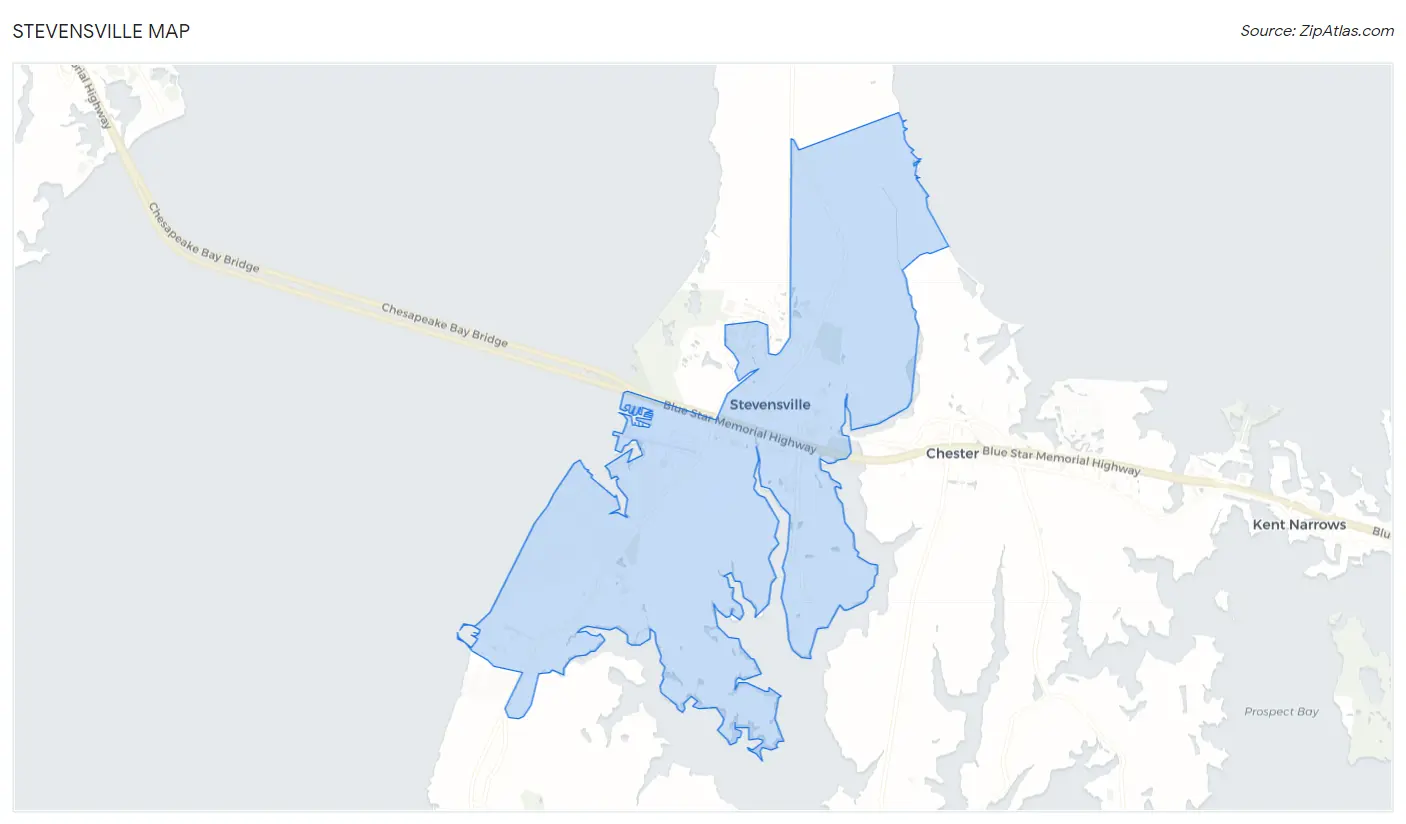
Stevensville Overview
$51,493
PER CAPITA INCOME
$143,767
AVG FAMILY INCOME
$117,591
AVG HOUSEHOLD INCOME
44.7%
WAGE / INCOME GAP [ % ]
55.3¢/ $1
WAGE / INCOME GAP [ $ ]
0.44
INEQUALITY / GINI INDEX
8,485
TOTAL POPULATION
4,289
MALE POPULATION
4,196
FEMALE POPULATION
102.22
MALES / 100 FEMALES
97.83
FEMALES / 100 MALES
39.7
MEDIAN AGE
3.1
AVG FAMILY SIZE
2.6
AVG HOUSEHOLD SIZE
4,805
LABOR FORCE [ PEOPLE ]
70.9%
PERCENT IN LABOR FORCE
4.7%
UNEMPLOYMENT RATE
Stevensville Zip Codes
Income in Stevensville
Income Overview in Stevensville
Per Capita Income in Stevensville is $51,493, while median incomes of families and households are $143,767 and $117,591 respectively.
| Characteristic | Number | Measure |
| Per Capita Income | 8,485 | $51,493 |
| Median Family Income | 2,352 | $143,767 |
| Mean Family Income | 2,352 | $156,652 |
| Median Household Income | 3,217 | $117,591 |
| Mean Household Income | 3,217 | $135,131 |
| Income Deficit | 2,352 | $0 |
| Wage / Income Gap (%) | 8,485 | 44.68% |
| Wage / Income Gap ($) | 8,485 | 55.32¢ per $1 |
| Gini / Inequality Index | 8,485 | 0.44 |
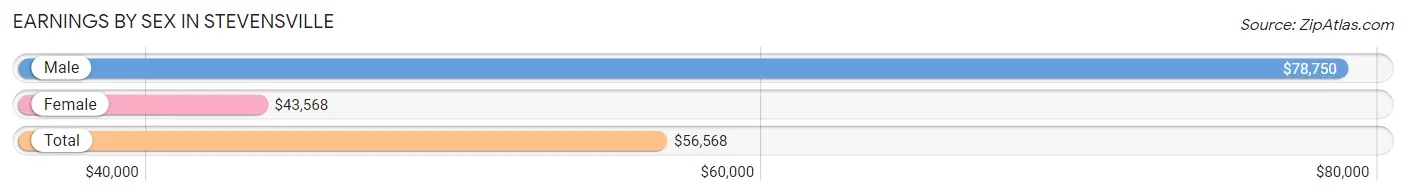
Earnings by Sex in Stevensville
Average Earnings in Stevensville are $56,568, $78,750 for men and $43,568 for women, a difference of 44.7%.
| Sex | Number | Average Earnings |
| Male | 2,574 (53.0%) | $78,750 |
| Female | 2,285 (47.0%) | $43,568 |
| Total | 4,859 (100.0%) | $56,568 |
Earnings by Sex by Income Bracket in Stevensville
The most common earnings brackets in Stevensville are $100,000+ for men (829 | 32.2%) and $100,000+ for women (279 | 12.2%).

| Income | Male | Female |
| $2,499 or less | 74 (2.9%) | 128 (5.6%) |
| $2,500 to $4,999 | 90 (3.5%) | 34 (1.5%) |
| $5,000 to $7,499 | 65 (2.5%) | 75 (3.3%) |
| $7,500 to $9,999 | 25 (1.0%) | 82 (3.6%) |
| $10,000 to $12,499 | 56 (2.2%) | 60 (2.6%) |
| $12,500 to $14,999 | 0 (0.0%) | 15 (0.7%) |
| $15,000 to $17,499 | 31 (1.2%) | 82 (3.6%) |
| $17,500 to $19,999 | 19 (0.7%) | 20 (0.9%) |
| $20,000 to $22,499 | 23 (0.9%) | 43 (1.9%) |
| $22,500 to $24,999 | 25 (1.0%) | 0 (0.0%) |
| $25,000 to $29,999 | 35 (1.4%) | 277 (12.1%) |
| $30,000 to $34,999 | 0 (0.0%) | 184 (8.1%) |
| $35,000 to $39,999 | 56 (2.2%) | 102 (4.5%) |
| $40,000 to $44,999 | 119 (4.6%) | 68 (3.0%) |
| $45,000 to $49,999 | 167 (6.5%) | 152 (6.7%) |
| $50,000 to $54,999 | 163 (6.3%) | 125 (5.5%) |
| $55,000 to $64,999 | 127 (4.9%) | 88 (3.8%) |
| $65,000 to $74,999 | 185 (7.2%) | 234 (10.2%) |
| $75,000 to $99,999 | 485 (18.8%) | 237 (10.4%) |
| $100,000+ | 829 (32.2%) | 279 (12.2%) |
| Total | 2,574 (100.0%) | 2,285 (100.0%) |
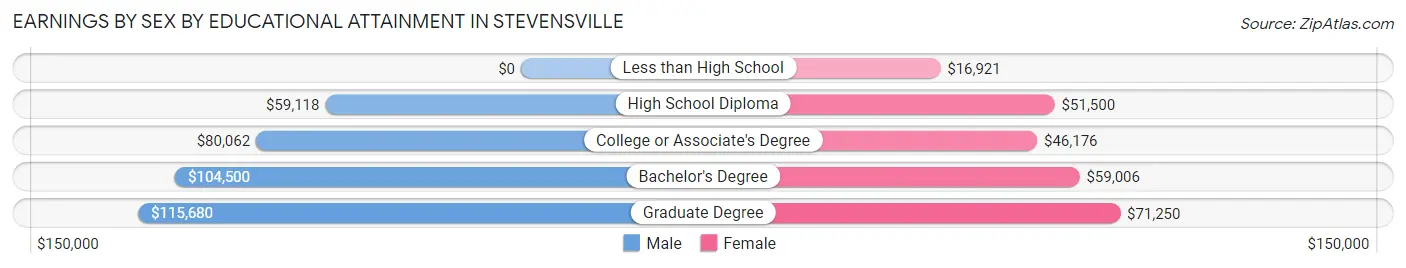
Earnings by Sex by Educational Attainment in Stevensville
Average earnings in Stevensville are $82,050 for men and $48,311 for women, a difference of 41.1%. Men with an educational attainment of graduate degree enjoy the highest average annual earnings of $115,680, while those with high school diploma education earn the least with $59,118. Women with an educational attainment of graduate degree earn the most with the average annual earnings of $71,250, while those with less than high school education have the smallest earnings of $16,921.
| Educational Attainment | Male Income | Female Income |
| Less than High School | - | - |
| High School Diploma | $59,118 | $51,500 |
| College or Associate's Degree | $80,062 | $46,176 |
| Bachelor's Degree | $104,500 | $59,006 |
| Graduate Degree | $115,680 | $71,250 |
| Total | $82,050 | $48,311 |
Family Income in Stevensville
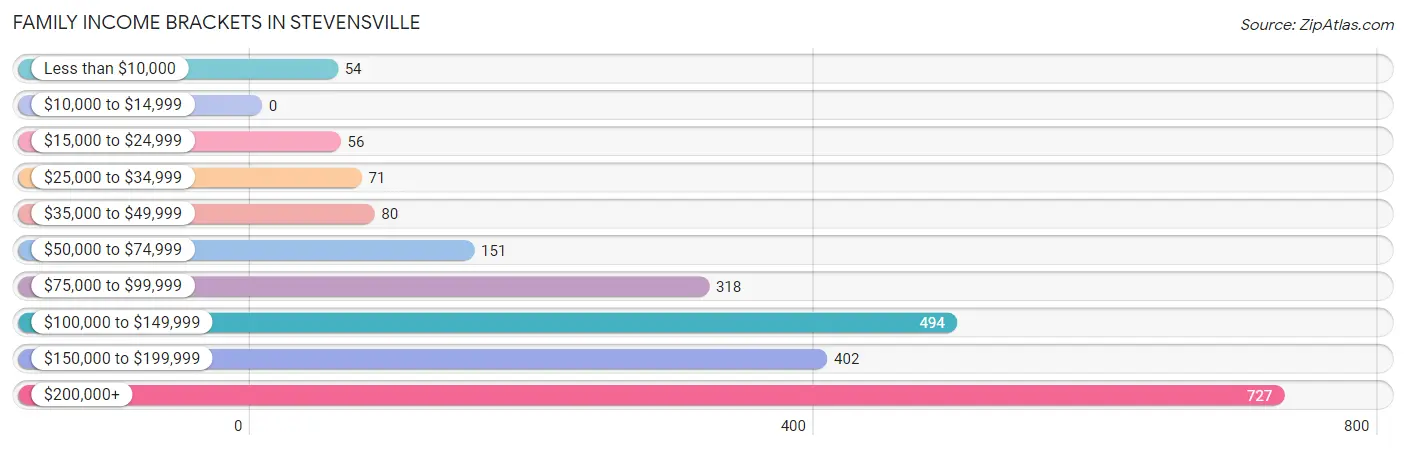
Family Income Brackets in Stevensville
According to the Stevensville family income data, there are 727 families falling into the $200,000+ income range, which is the most common income bracket and makes up 30.9% of all families.
| Income Bracket | # Families | % Families |
| Less than $10,000 | 54 | 2.3% |
| $10,000 to $14,999 | 0 | 0.0% |
| $15,000 to $24,999 | 56 | 2.4% |
| $25,000 to $34,999 | 71 | 3.0% |
| $35,000 to $49,999 | 80 | 3.4% |
| $50,000 to $74,999 | 151 | 6.4% |
| $75,000 to $99,999 | 318 | 13.5% |
| $100,000 to $149,999 | 494 | 21.0% |
| $150,000 to $199,999 | 402 | 17.1% |
| $200,000+ | 727 | 30.9% |
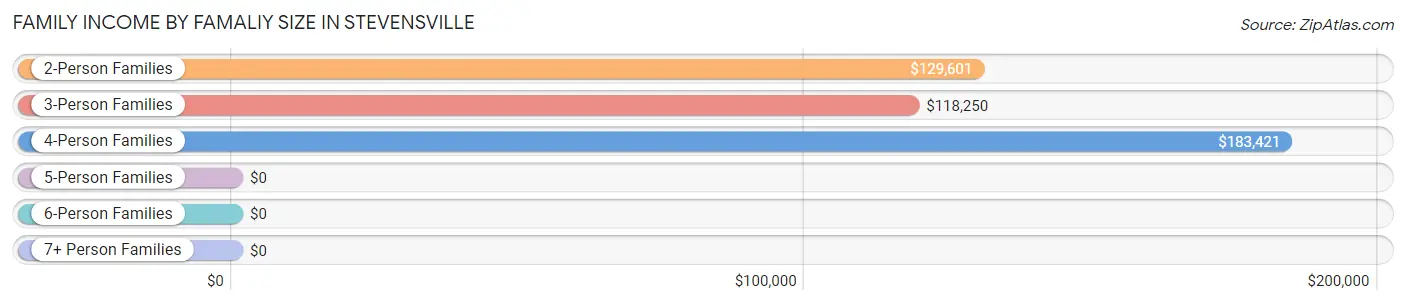
Family Income by Famaliy Size in Stevensville
4-person families (522 | 22.2%) account for the highest median family income in Stevensville with $183,421 per family, while 2-person families (933 | 39.7%) have the highest median income of $64,800 per family member.
| Income Bracket | # Families | Median Income |
| 2-Person Families | 933 (39.7%) | $129,601 |
| 3-Person Families | 715 (30.4%) | $118,250 |
| 4-Person Families | 522 (22.2%) | $183,421 |
| 5-Person Families | 134 (5.7%) | $0 |
| 6-Person Families | 35 (1.5%) | $0 |
| 7+ Person Families | 13 (0.5%) | $0 |
| Total | 2,352 (100.0%) | $143,767 |
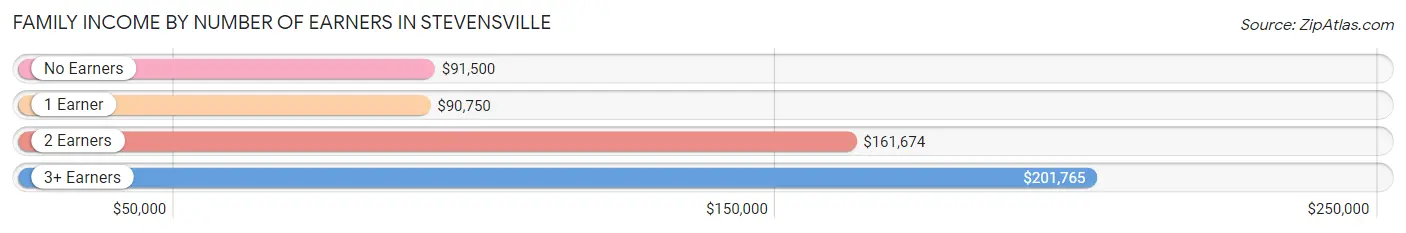
Family Income by Number of Earners in Stevensville
The median family income in Stevensville is $143,767, with families comprising 3+ earners (320) having the highest median family income of $201,765, while families with 1 earner (670) have the lowest median family income of $90,750, accounting for 13.6% and 28.5% of families, respectively.
| Number of Earners | # Families | Median Income |
| No Earners | 122 (5.2%) | $91,500 |
| 1 Earner | 670 (28.5%) | $90,750 |
| 2 Earners | 1,240 (52.7%) | $161,674 |
| 3+ Earners | 320 (13.6%) | $201,765 |
| Total | 2,352 (100.0%) | $143,767 |
Household Income in Stevensville
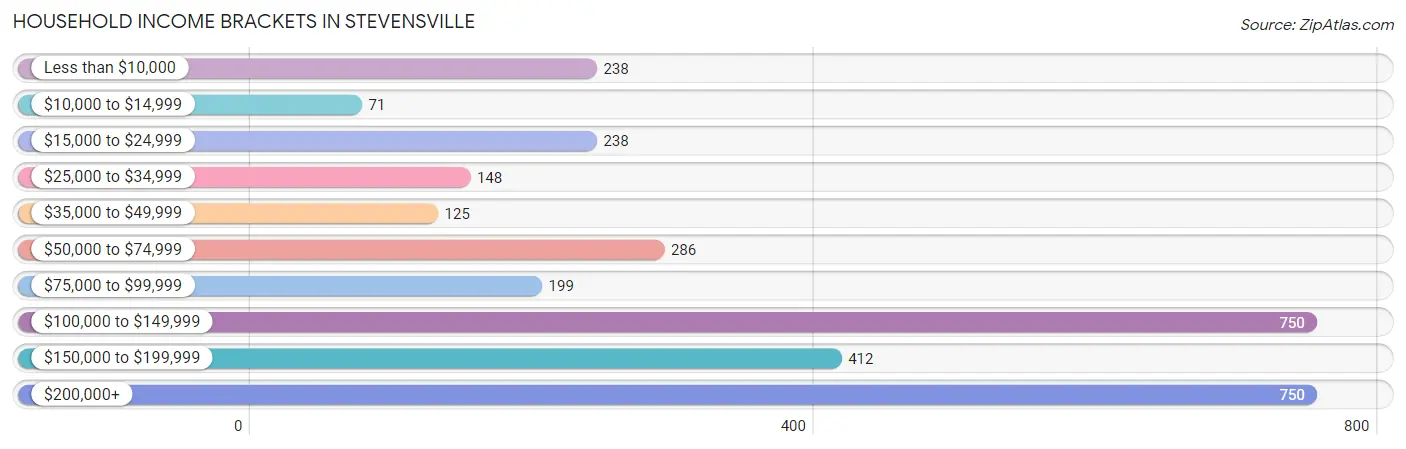
Household Income Brackets in Stevensville
With 750 households falling in the category, the $100,000 to $149,999 income range is the most frequent in Stevensville, accounting for 23.3% of all households. In contrast, only 71 households (2.2%) fall into the $10,000 to $14,999 income bracket, making it the least populous group.
| Income Bracket | # Households | % Households |
| Less than $10,000 | 238 | 7.4% |
| $10,000 to $14,999 | 71 | 2.2% |
| $15,000 to $24,999 | 238 | 7.4% |
| $25,000 to $34,999 | 148 | 4.6% |
| $35,000 to $49,999 | 125 | 3.9% |
| $50,000 to $74,999 | 286 | 8.9% |
| $75,000 to $99,999 | 199 | 6.2% |
| $100,000 to $149,999 | 750 | 23.3% |
| $150,000 to $199,999 | 412 | 12.8% |
| $200,000+ | 750 | 23.3% |
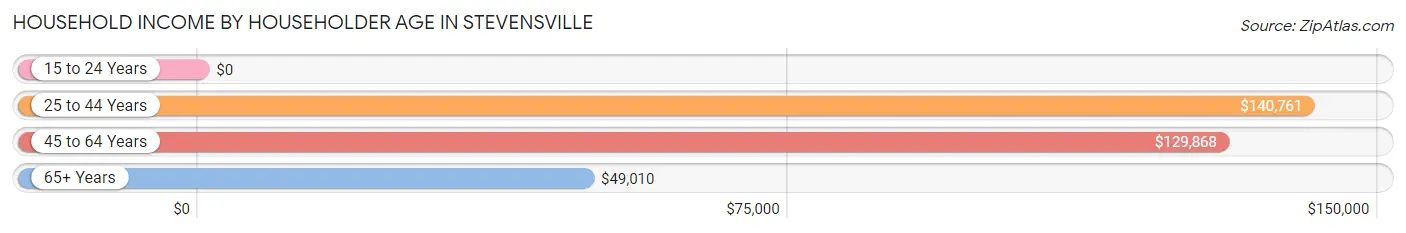
Household Income by Householder Age in Stevensville
The median household income in Stevensville is $117,591, with the highest median household income of $140,761 found in the 25 to 44 years age bracket for the primary householder. A total of 1,042 households (32.4%) fall into this category.
| Income Bracket | # Households | Median Income |
| 15 to 24 Years | 0 (0.0%) | $0 |
| 25 to 44 Years | 1,042 (32.4%) | $140,761 |
| 45 to 64 Years | 1,132 (35.2%) | $129,868 |
| 65+ Years | 1,043 (32.4%) | $49,010 |
| Total | 3,217 (100.0%) | $117,591 |
Poverty in Stevensville
Income Below Poverty by Sex and Age in Stevensville
With 4.4% poverty level for males and 10.0% for females among the residents of Stevensville, 12 to 14 year old males and 65 to 74 year old females are the most vulnerable to poverty, with 14 males (17.1%) and 197 females (41.7%) in their respective age groups living below the poverty level.
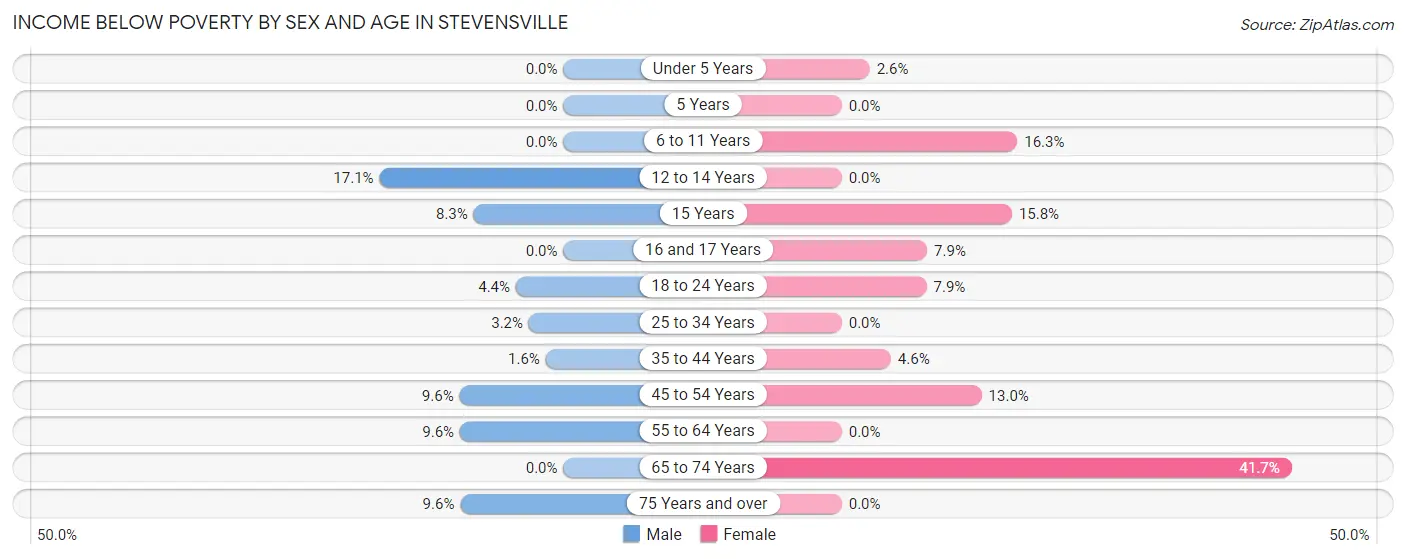
| Age Bracket | Male | Female |
| Under 5 Years | 0 (0.0%) | 8 (2.6%) |
| 5 Years | 0 (0.0%) | 0 (0.0%) |
| 6 to 11 Years | 0 (0.0%) | 57 (16.3%) |
| 12 to 14 Years | 14 (17.1%) | 0 (0.0%) |
| 15 Years | 9 (8.3%) | 12 (15.8%) |
| 16 and 17 Years | 0 (0.0%) | 8 (7.9%) |
| 18 to 24 Years | 12 (4.4%) | 27 (7.9%) |
| 25 to 34 Years | 17 (3.2%) | 0 (0.0%) |
| 35 to 44 Years | 9 (1.6%) | 23 (4.6%) |
| 45 to 54 Years | 54 (9.6%) | 88 (13.0%) |
| 55 to 64 Years | 53 (9.6%) | 0 (0.0%) |
| 65 to 74 Years | 0 (0.0%) | 197 (41.7%) |
| 75 Years and over | 22 (9.6%) | 0 (0.0%) |
| Total | 190 (4.4%) | 420 (10.0%) |
Income Above Poverty by Sex and Age in Stevensville
According to the poverty statistics in Stevensville, males aged under 5 years and females aged 5 years are the age groups that are most secure financially, with 100.0% of males and 100.0% of females in these age groups living above the poverty line.
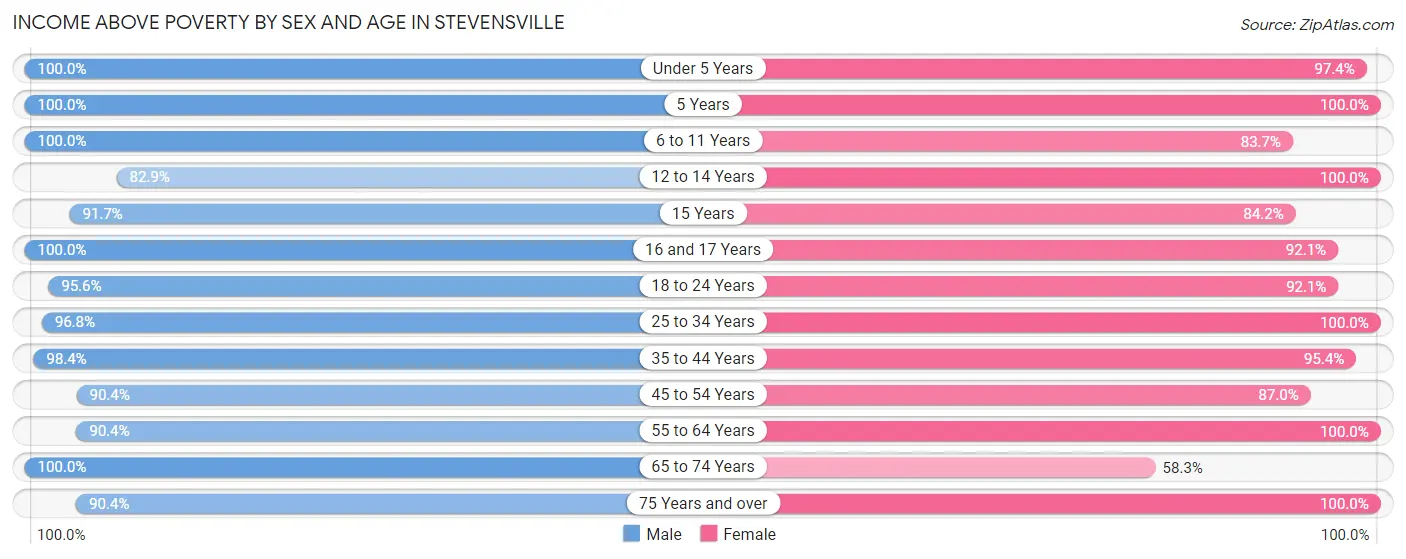
| Age Bracket | Male | Female |
| Under 5 Years | 168 (100.0%) | 301 (97.4%) |
| 5 Years | 120 (100.0%) | 19 (100.0%) |
| 6 to 11 Years | 392 (100.0%) | 293 (83.7%) |
| 12 to 14 Years | 68 (82.9%) | 78 (100.0%) |
| 15 Years | 99 (91.7%) | 64 (84.2%) |
| 16 and 17 Years | 210 (100.0%) | 93 (92.1%) |
| 18 to 24 Years | 260 (95.6%) | 316 (92.1%) |
| 25 to 34 Years | 515 (96.8%) | 496 (100.0%) |
| 35 to 44 Years | 541 (98.4%) | 481 (95.4%) |
| 45 to 54 Years | 506 (90.4%) | 590 (87.0%) |
| 55 to 64 Years | 499 (90.4%) | 387 (100.0%) |
| 65 to 74 Years | 513 (100.0%) | 275 (58.3%) |
| 75 Years and over | 208 (90.4%) | 377 (100.0%) |
| Total | 4,099 (95.6%) | 3,770 (90.0%) |
Income Below Poverty Among Married-Couple Families in Stevensville
The poverty statistics for married-couple families in Stevensville show that 2.9% or 54 of the total 1,870 families live below the poverty line. Families with 1 or 2 children have the highest poverty rate of 7.0%, comprising of 54 families. On the other hand, families with no children have the lowest poverty rate of 0.0%, which includes 0 families.
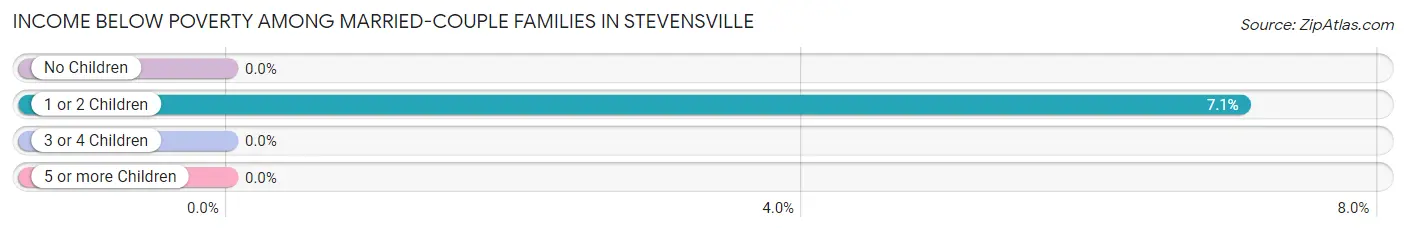
| Children | Above Poverty | Below Poverty |
| No Children | 993 (100.0%) | 0 (0.0%) |
| 1 or 2 Children | 712 (92.9%) | 54 (7.0%) |
| 3 or 4 Children | 98 (100.0%) | 0 (0.0%) |
| 5 or more Children | 13 (100.0%) | 0 (0.0%) |
| Total | 1,816 (97.1%) | 54 (2.9%) |
Income Below Poverty Among Single-Parent Households in Stevensville
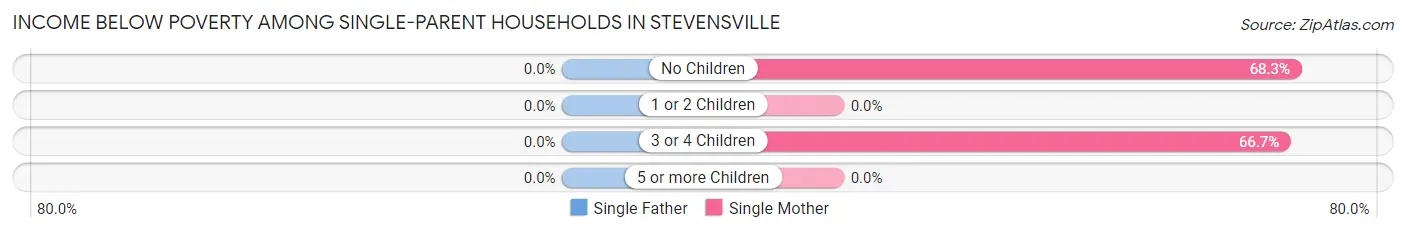
| Children | Single Father | Single Mother |
| No Children | 0 (0.0%) | 43 (68.2%) |
| 1 or 2 Children | 0 (0.0%) | 0 (0.0%) |
| 3 or 4 Children | 0 (0.0%) | 14 (66.7%) |
| 5 or more Children | 0 (0.0%) | 0 (0.0%) |
| Total | 0 (0.0%) | 57 (21.7%) |
Income Below Poverty Among Married-Couple vs Single-Parent Households in Stevensville
The poverty data for Stevensville shows that 54 of the married-couple family households (2.9%) and 57 of the single-parent households (11.8%) are living below the poverty level. Within the married-couple family households, those with 1 or 2 children have the highest poverty rate, with 54 households (7.0%) falling below the poverty line. Among the single-parent households, those with 3 or 4 children have the highest poverty rate, with 14 household (66.7%) living below poverty.
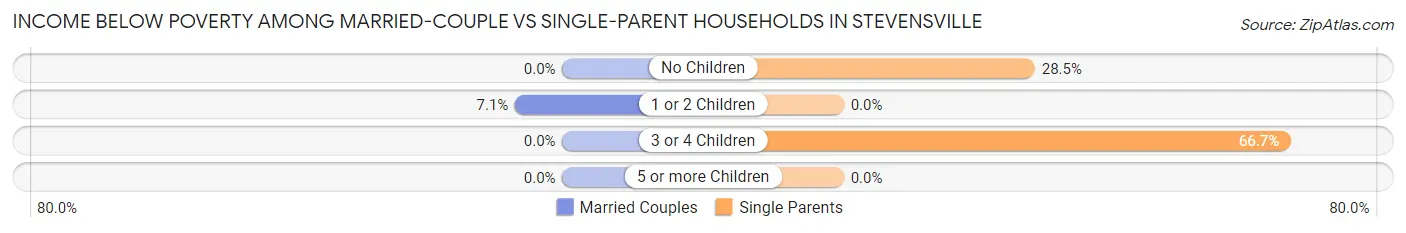
| Children | Married-Couple Families | Single-Parent Households |
| No Children | 0 (0.0%) | 43 (28.5%) |
| 1 or 2 Children | 54 (7.0%) | 0 (0.0%) |
| 3 or 4 Children | 0 (0.0%) | 14 (66.7%) |
| 5 or more Children | 0 (0.0%) | 0 (0.0%) |
| Total | 54 (2.9%) | 57 (11.8%) |
Race in Stevensville
The most populous races in Stevensville are White / Caucasian (7,187 | 84.7%), Black / African American (560 | 6.6%), and Two or more Races (560 | 6.6%).
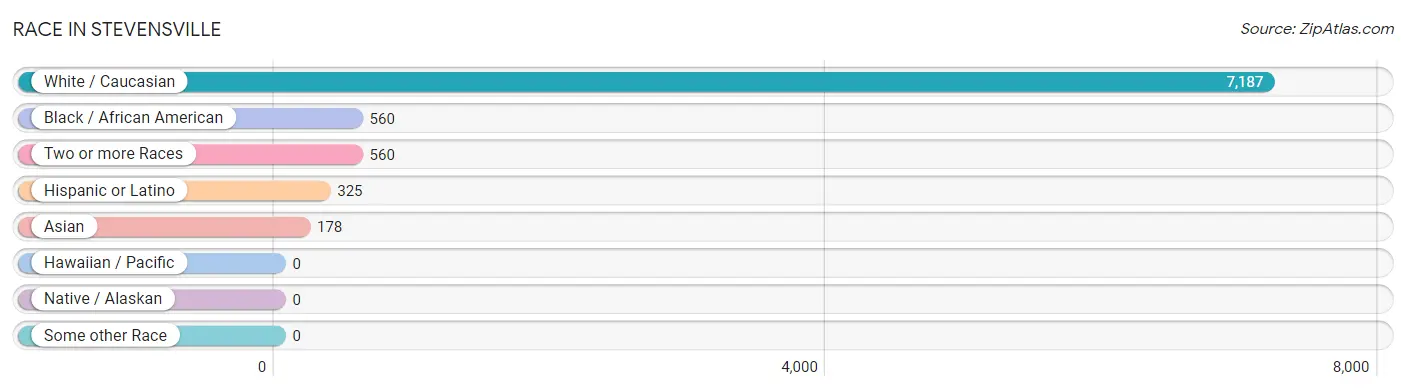
| Race | # Population | % Population |
| Asian | 178 | 2.1% |
| Black / African American | 560 | 6.6% |
| Hawaiian / Pacific | 0 | 0.0% |
| Hispanic or Latino | 325 | 3.8% |
| Native / Alaskan | 0 | 0.0% |
| White / Caucasian | 7,187 | 84.7% |
| Two or more Races | 560 | 6.6% |
| Some other Race | 0 | 0.0% |
| Total | 8,485 | 100.0% |
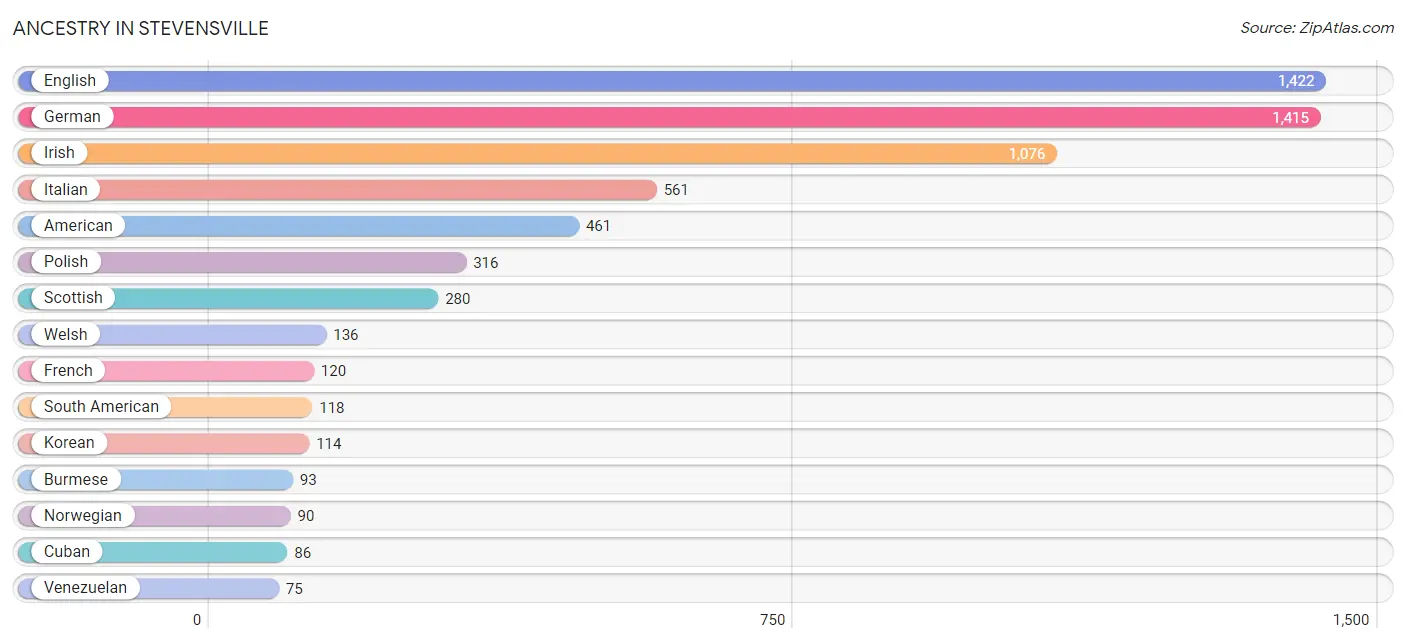
Ancestry in Stevensville
The most populous ancestries reported in Stevensville are English (1,422 | 16.8%), German (1,415 | 16.7%), Irish (1,076 | 12.7%), Italian (561 | 6.6%), and American (461 | 5.4%), together accounting for 58.2% of all Stevensville residents.
| Ancestry | # Population | % Population |
| American | 461 | 5.4% |
| Armenian | 23 | 0.3% |
| Austrian | 71 | 0.8% |
| Bhutanese | 8 | 0.1% |
| British | 62 | 0.7% |
| Burmese | 93 | 1.1% |
| Cherokee | 9 | 0.1% |
| Cuban | 86 | 1.0% |
| Czech | 11 | 0.1% |
| Czechoslovakian | 15 | 0.2% |
| Danish | 17 | 0.2% |
| Dutch | 57 | 0.7% |
| Eastern European | 13 | 0.2% |
| English | 1,422 | 16.8% |
| European | 74 | 0.9% |
| French | 120 | 1.4% |
| German | 1,415 | 16.7% |
| Greek | 32 | 0.4% |
| Hungarian | 52 | 0.6% |
| Indian (Asian) | 74 | 0.9% |
| Irish | 1,076 | 12.7% |
| Italian | 561 | 6.6% |
| Jamaican | 25 | 0.3% |
| Korean | 114 | 1.3% |
| Lithuanian | 26 | 0.3% |
| Mexican | 15 | 0.2% |
| Northern European | 19 | 0.2% |
| Norwegian | 90 | 1.1% |
| Pennsylvania German | 50 | 0.6% |
| Peruvian | 43 | 0.5% |
| Polish | 316 | 3.7% |
| Puerto Rican | 22 | 0.3% |
| Russian | 38 | 0.4% |
| Scandinavian | 36 | 0.4% |
| Scotch-Irish | 21 | 0.3% |
| Scottish | 280 | 3.3% |
| Slovak | 10 | 0.1% |
| South American | 118 | 1.4% |
| Swedish | 67 | 0.8% |
| Ukrainian | 30 | 0.4% |
| Venezuelan | 75 | 0.9% |
| Welsh | 136 | 1.6% | View All 42 Rows |
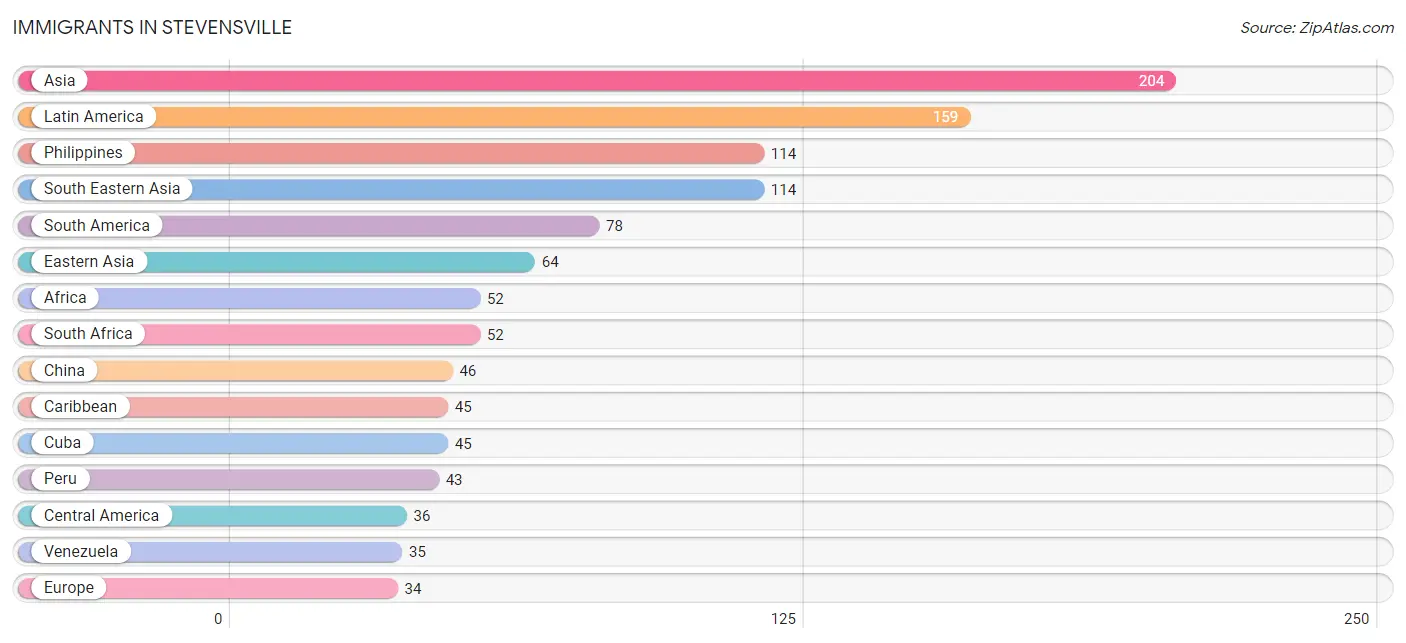
Immigrants in Stevensville
The most numerous immigrant groups reported in Stevensville came from Asia (204 | 2.4%), Latin America (159 | 1.9%), Philippines (114 | 1.3%), South Eastern Asia (114 | 1.3%), and South America (78 | 0.9%), together accounting for 7.9% of all Stevensville residents.
| Immigration Origin | # Population | % Population |
| Africa | 52 | 0.6% |
| Asia | 204 | 2.4% |
| Canada | 3 | 0.0% |
| Caribbean | 45 | 0.5% |
| Central America | 36 | 0.4% |
| China | 46 | 0.5% |
| Cuba | 45 | 0.5% |
| Eastern Asia | 64 | 0.7% |
| Eastern Europe | 16 | 0.2% |
| Europe | 34 | 0.4% |
| Germany | 18 | 0.2% |
| Korea | 18 | 0.2% |
| Latin America | 159 | 1.9% |
| Mexico | 15 | 0.2% |
| Nicaragua | 21 | 0.3% |
| Peru | 43 | 0.5% |
| Philippines | 114 | 1.3% |
| Poland | 16 | 0.2% |
| South Africa | 52 | 0.6% |
| South America | 78 | 0.9% |
| South Eastern Asia | 114 | 1.3% |
| Venezuela | 35 | 0.4% |
| Western Asia | 26 | 0.3% |
| Western Europe | 18 | 0.2% | View All 24 Rows |
Sex and Age in Stevensville
Sex and Age in Stevensville
The most populous age groups in Stevensville are 15 to 19 Years (491 | 11.5%) for men and 45 to 49 Years (413 | 9.8%) for women.
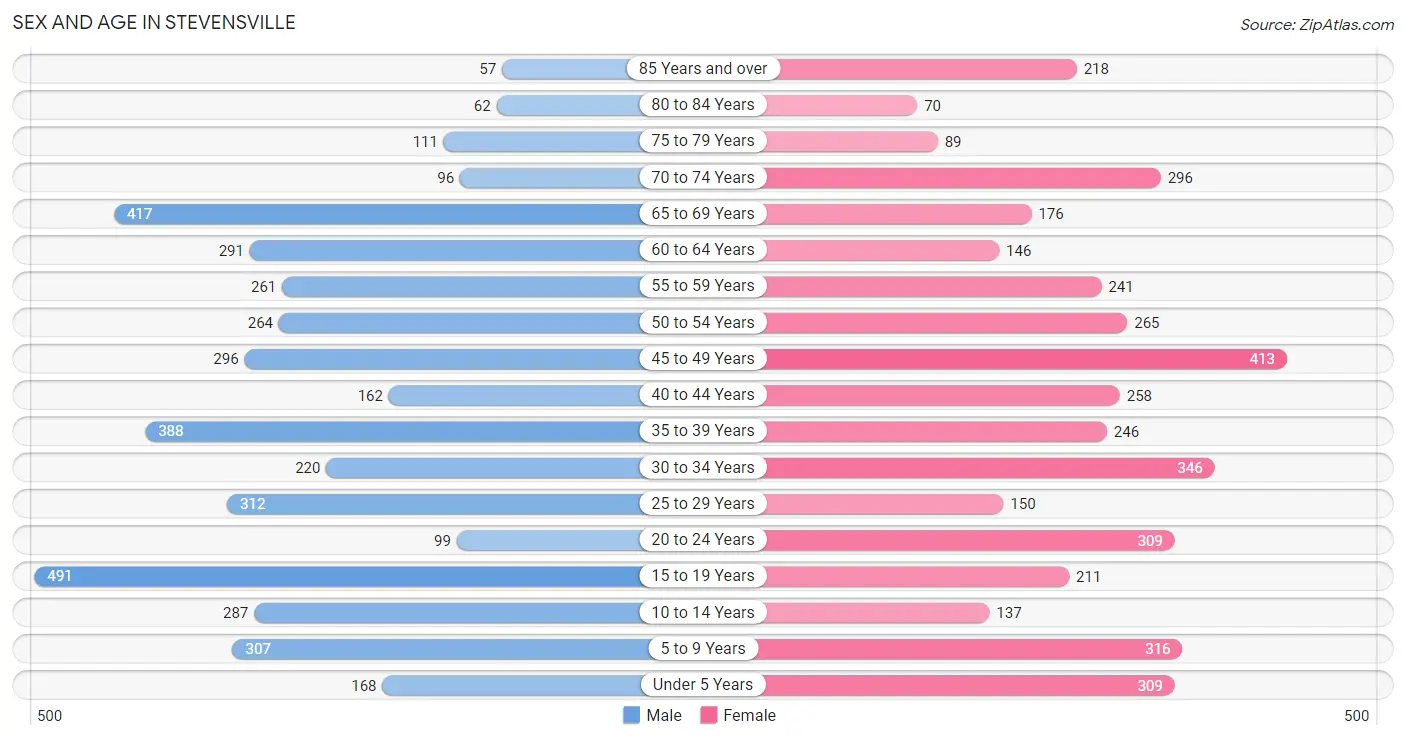
| Age Bracket | Male | Female |
| Under 5 Years | 168 (3.9%) | 309 (7.4%) |
| 5 to 9 Years | 307 (7.2%) | 316 (7.5%) |
| 10 to 14 Years | 287 (6.7%) | 137 (3.3%) |
| 15 to 19 Years | 491 (11.5%) | 211 (5.0%) |
| 20 to 24 Years | 99 (2.3%) | 309 (7.4%) |
| 25 to 29 Years | 312 (7.3%) | 150 (3.6%) |
| 30 to 34 Years | 220 (5.1%) | 346 (8.3%) |
| 35 to 39 Years | 388 (9.0%) | 246 (5.9%) |
| 40 to 44 Years | 162 (3.8%) | 258 (6.1%) |
| 45 to 49 Years | 296 (6.9%) | 413 (9.8%) |
| 50 to 54 Years | 264 (6.2%) | 265 (6.3%) |
| 55 to 59 Years | 261 (6.1%) | 241 (5.7%) |
| 60 to 64 Years | 291 (6.8%) | 146 (3.5%) |
| 65 to 69 Years | 417 (9.7%) | 176 (4.2%) |
| 70 to 74 Years | 96 (2.2%) | 296 (7.0%) |
| 75 to 79 Years | 111 (2.6%) | 89 (2.1%) |
| 80 to 84 Years | 62 (1.5%) | 70 (1.7%) |
| 85 Years and over | 57 (1.3%) | 218 (5.2%) |
| Total | 4,289 (100.0%) | 4,196 (100.0%) |
Families and Households in Stevensville
Median Family Size in Stevensville
The median family size in Stevensville is 3.11 persons per family, with married-couple families (1,870 | 79.5%) accounting for the largest median family size of 3.23 persons per family. On the other hand, single male/father families (219 | 9.3%) represent the smallest median family size with 2.48 persons per family.
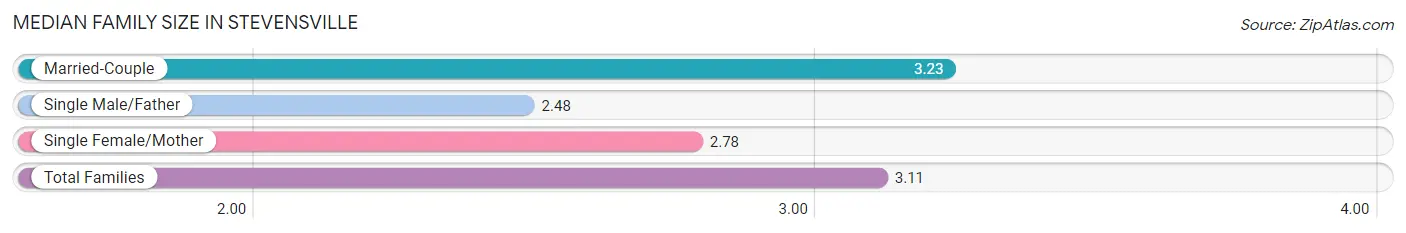
| Family Type | # Families | Family Size |
| Married-Couple | 1,870 (79.5%) | 3.23 |
| Single Male/Father | 219 (9.3%) | 2.48 |
| Single Female/Mother | 263 (11.2%) | 2.78 |
| Total Families | 2,352 (100.0%) | 3.11 |
Median Household Size in Stevensville
The median household size in Stevensville is 2.64 persons per household, with married-couple households (1,870 | 58.1%) accounting for the largest median household size of 3.24 persons per household. non-family households (865 | 26.9%) represent the smallest median household size with 1.16 persons per household.
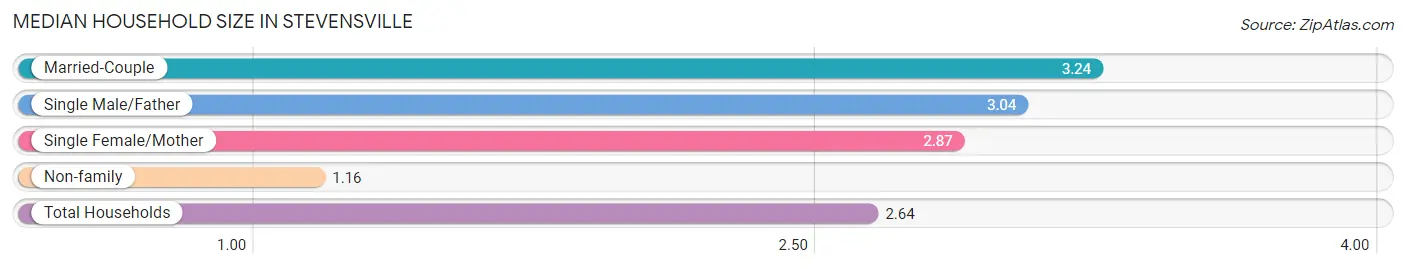
| Household Type | # Households | Household Size |
| Married-Couple | 1,870 (58.1%) | 3.24 |
| Single Male/Father | 219 (6.8%) | 3.04 |
| Single Female/Mother | 263 (8.2%) | 2.87 |
| Non-family | 865 (26.9%) | 1.16 |
| Total Households | 3,217 (100.0%) | 2.64 |
Household Size by Marriage Status in Stevensville
Out of a total of 3,217 households in Stevensville, 2,352 (73.1%) are family households, while 865 (26.9%) are nonfamily households. The most numerous type of family households are 2-person households, comprising 894, and the most common type of nonfamily households are 1-person households, comprising 753.
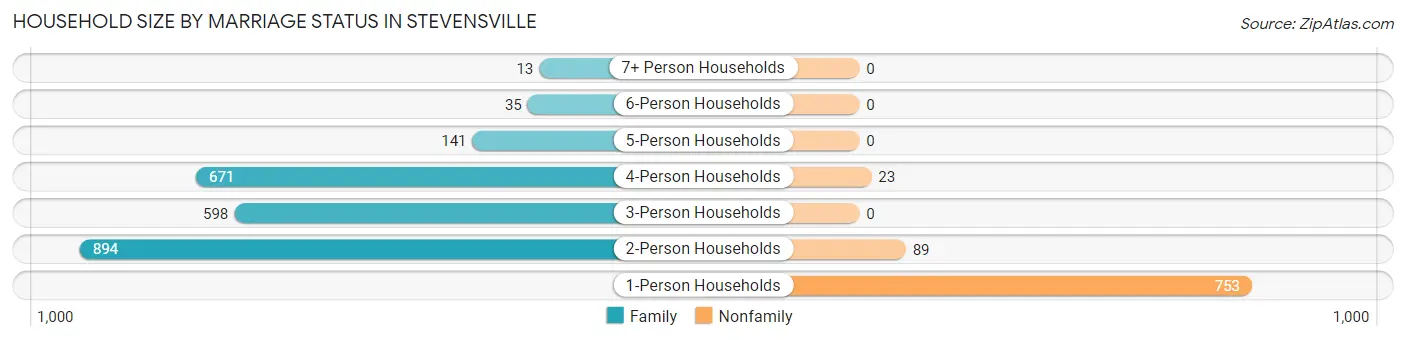
| Household Size | Family Households | Nonfamily Households |
| 1-Person Households | - | 753 (23.4%) |
| 2-Person Households | 894 (27.8%) | 89 (2.8%) |
| 3-Person Households | 598 (18.6%) | 0 (0.0%) |
| 4-Person Households | 671 (20.9%) | 23 (0.7%) |
| 5-Person Households | 141 (4.4%) | 0 (0.0%) |
| 6-Person Households | 35 (1.1%) | 0 (0.0%) |
| 7+ Person Households | 13 (0.4%) | 0 (0.0%) |
| Total | 2,352 (73.1%) | 865 (26.9%) |
Female Fertility in Stevensville
Fertility by Age in Stevensville
Average fertility rate in Stevensville is 50.0 births per 1,000 women. Women in the age bracket of 20 to 34 years have the highest fertility rate with 123.0 births per 1,000 women. Women in the age bracket of 20 to 34 years acount for 100.0% of all women with births.
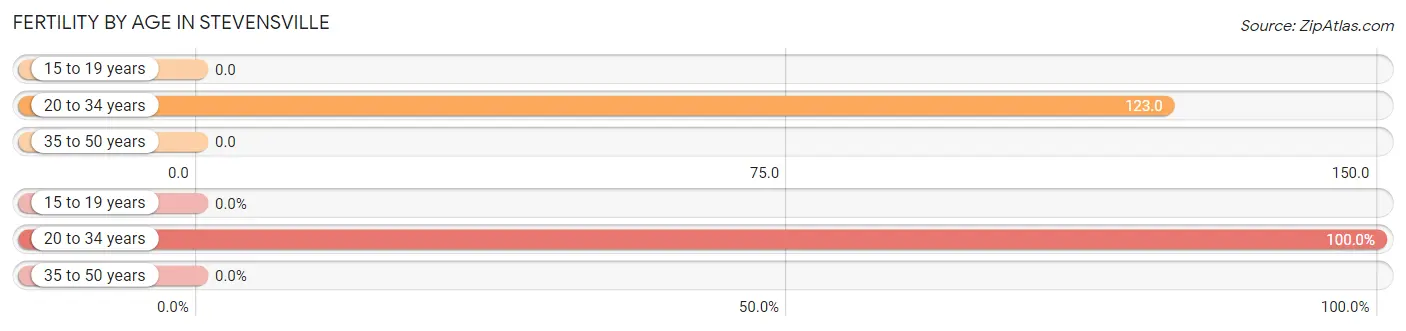
| Age Bracket | Women with Births | Births / 1,000 Women |
| 15 to 19 years | 0 (0.0%) | 0.0 |
| 20 to 34 years | 99 (100.0%) | 123.0 |
| 35 to 50 years | 0 (0.0%) | 0.0 |
| Total | 99 (100.0%) | 50.0 |
Fertility by Age by Marriage Status in Stevensville
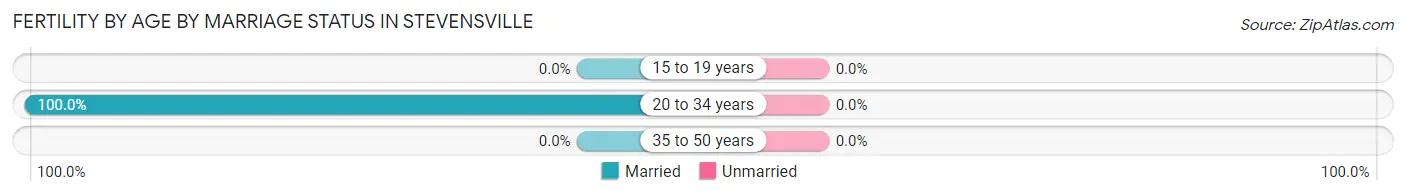
| Age Bracket | Married | Unmarried |
| 15 to 19 years | 0 (0.0%) | 0 (0.0%) |
| 20 to 34 years | 99 (100.0%) | 0 (0.0%) |
| 35 to 50 years | 0 (0.0%) | 0 (0.0%) |
| Total | 99 (100.0%) | 0 (0.0%) |
Fertility by Education in Stevensville
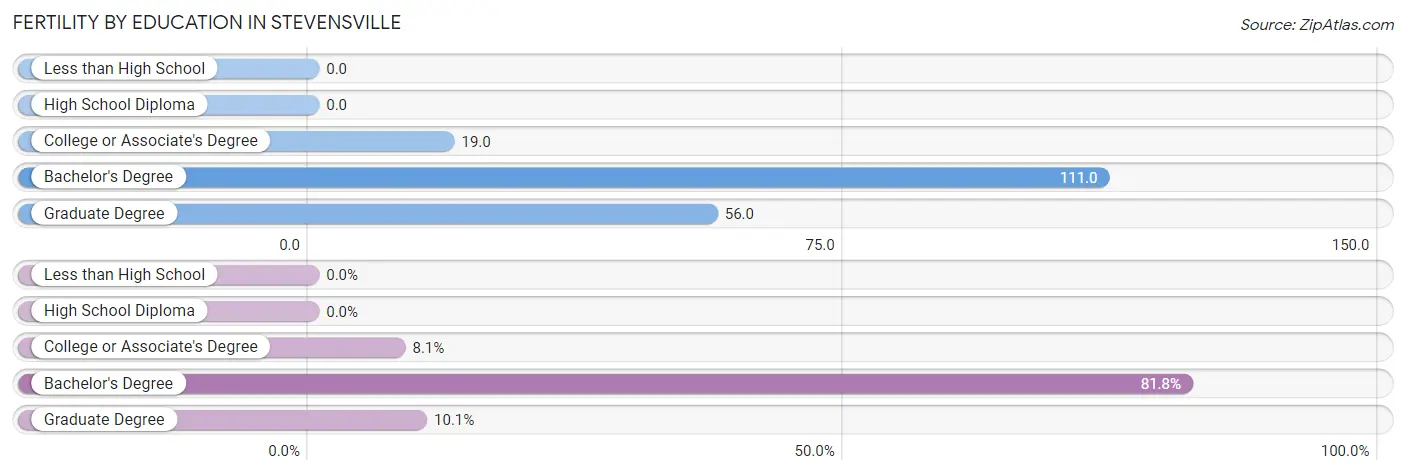
| Educational Attainment | Women with Births | Births / 1,000 Women |
| Less than High School | 0 (0.0%) | 0.0 |
| High School Diploma | 0 (0.0%) | 0.0 |
| College or Associate's Degree | 8 (8.1%) | 19.0 |
| Bachelor's Degree | 81 (81.8%) | 111.0 |
| Graduate Degree | 10 (10.1%) | 56.0 |
| Total | 99 (100.0%) | 50.0 |
Fertility by Education by Marriage Status in Stevensville
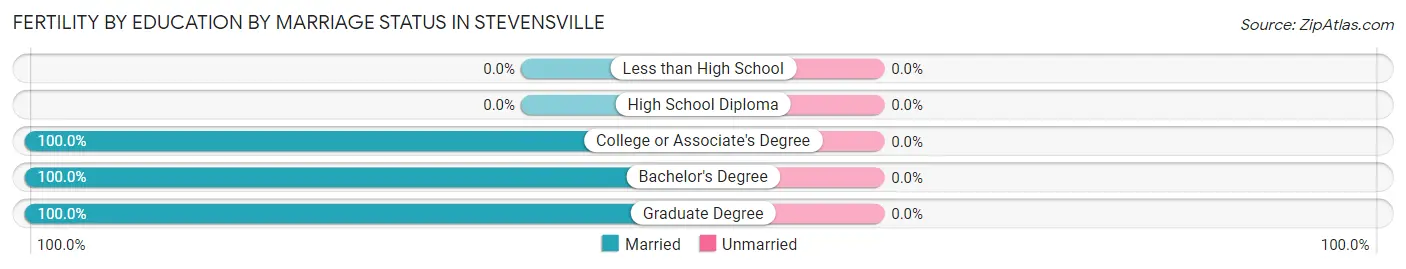
| Educational Attainment | Married | Unmarried |
| Less than High School | 0 (0.0%) | 0 (0.0%) |
| High School Diploma | 0 (0.0%) | 0 (0.0%) |
| College or Associate's Degree | 8 (100.0%) | 0 (0.0%) |
| Bachelor's Degree | 81 (100.0%) | 0 (0.0%) |
| Graduate Degree | 10 (100.0%) | 0 (0.0%) |
| Total | 99 (100.0%) | 0 (0.0%) |
Employment Characteristics in Stevensville
Employment by Class of Employer in Stevensville
Among the 4,390 employed individuals in Stevensville, private company employees (3,073 | 70.0%), not-for-profit organizations (276 | 6.3%), and local government employees (233 | 5.3%) make up the most common classes of employment.
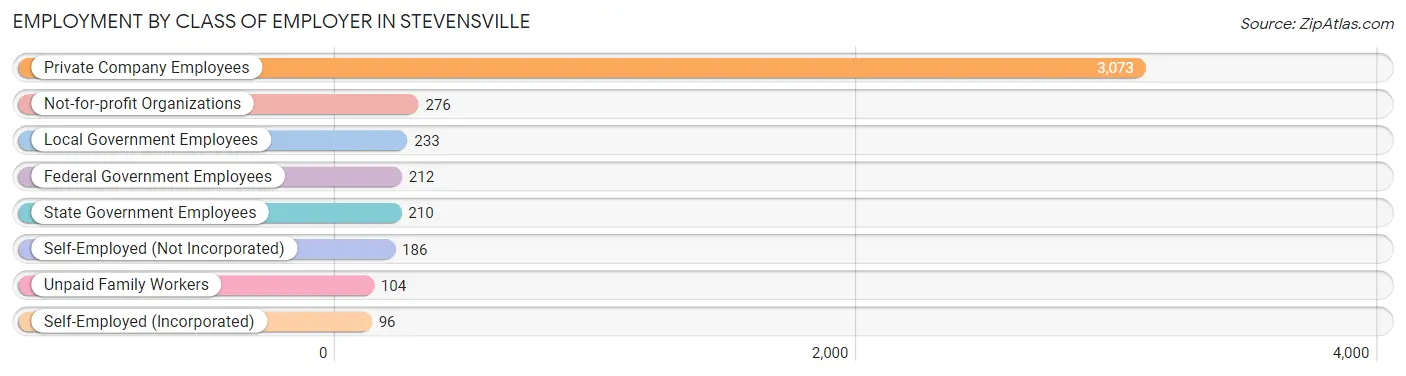
| Employer Class | # Employees | % Employees |
| Private Company Employees | 3,073 | 70.0% |
| Self-Employed (Incorporated) | 96 | 2.2% |
| Self-Employed (Not Incorporated) | 186 | 4.2% |
| Not-for-profit Organizations | 276 | 6.3% |
| Local Government Employees | 233 | 5.3% |
| State Government Employees | 210 | 4.8% |
| Federal Government Employees | 212 | 4.8% |
| Unpaid Family Workers | 104 | 2.4% |
| Total | 4,390 | 100.0% |
Employment Status by Age in Stevensville
According to the labor force statistics for Stevensville, out of the total population over 16 years of age (6,777), 70.9% or 4,805 individuals are in the labor force, with 4.7% or 226 of them unemployed. The age group with the highest labor force participation rate is 20 to 24 years, with 100.0% or 408 individuals in the labor force. Within the labor force, the 65 to 74 years age range has the highest percentage of unemployed individuals, with 18.2% or 52 of them being unemployed.
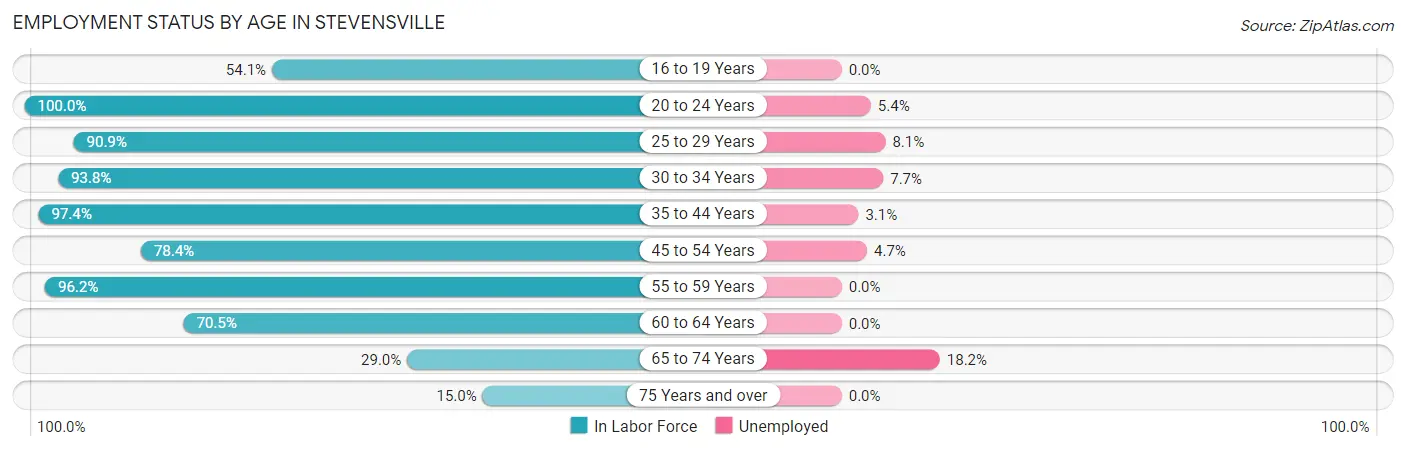
| Age Bracket | In Labor Force | Unemployed |
| 16 to 19 Years | 280 (54.1%) | 0 (0.0%) |
| 20 to 24 Years | 408 (100.0%) | 22 (5.4%) |
| 25 to 29 Years | 420 (90.9%) | 34 (8.1%) |
| 30 to 34 Years | 531 (93.8%) | 41 (7.7%) |
| 35 to 44 Years | 1,027 (97.4%) | 32 (3.1%) |
| 45 to 54 Years | 971 (78.4%) | 46 (4.7%) |
| 55 to 59 Years | 483 (96.2%) | 0 (0.0%) |
| 60 to 64 Years | 308 (70.5%) | 0 (0.0%) |
| 65 to 74 Years | 286 (29.0%) | 52 (18.2%) |
| 75 Years and over | 91 (15.0%) | 0 (0.0%) |
| Total | 4,805 (70.9%) | 226 (4.7%) |
Employment Status by Educational Attainment in Stevensville
According to labor force statistics for Stevensville, 87.8% of individuals (3,739) out of the total population between 25 and 64 years of age (4,259) are in the labor force, with 4.1% or 153 of them being unemployed. The group with the highest labor force participation rate are those with the educational attainment of college / associate degree, with 97.9% or 1,342 individuals in the labor force. Within the labor force, individuals with less than high school education have the highest percentage of unemployment, with 46.4% or 85 of them being unemployed.
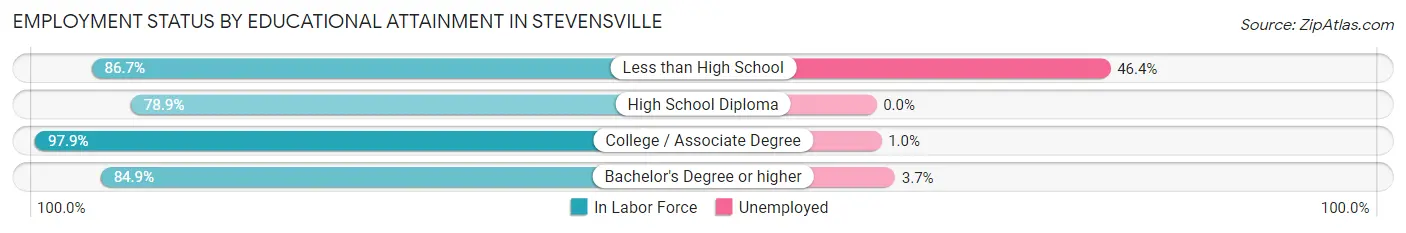
| Educational Attainment | In Labor Force | Unemployed |
| Less than High School | 183 (86.7%) | 98 (46.4%) |
| High School Diploma | 760 (78.9%) | 0 (0.0%) |
| College / Associate Degree | 1,342 (97.9%) | 14 (1.0%) |
| Bachelor's Degree or higher | 1,455 (84.9%) | 63 (3.7%) |
| Total | 3,739 (87.8%) | 175 (4.1%) |
Employment Occupations by Sex in Stevensville
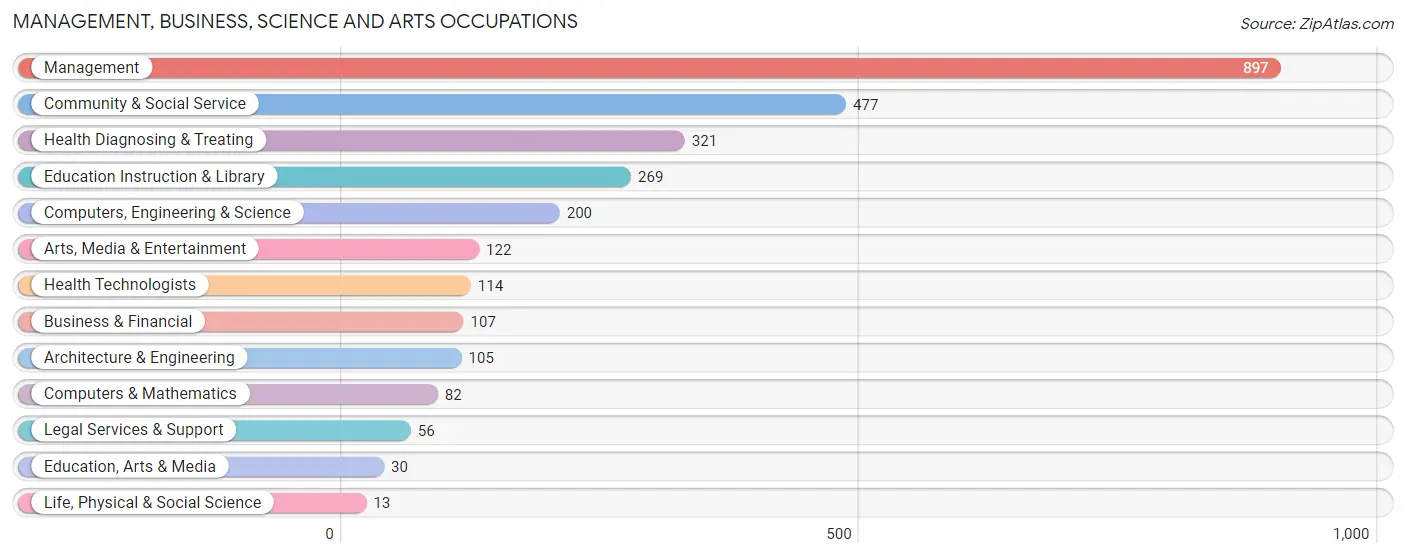
Management, Business, Science and Arts Occupations
The most common Management, Business, Science and Arts occupations in Stevensville are Management (897 | 19.7%), Community & Social Service (477 | 10.5%), Health Diagnosing & Treating (321 | 7.1%), Education Instruction & Library (269 | 5.9%), and Computers, Engineering & Science (200 | 4.4%).
Management, Business, Science and Arts Occupations by Sex
Within the Management, Business, Science and Arts occupations in Stevensville, the most male-oriented occupations are Computers & Mathematics (80.5%), Management (62.0%), and Computers, Engineering & Science (57.0%), while the most female-oriented occupations are Life, Physical & Social Science (100.0%), Education, Arts & Media (100.0%), and Health Diagnosing & Treating (96.6%).
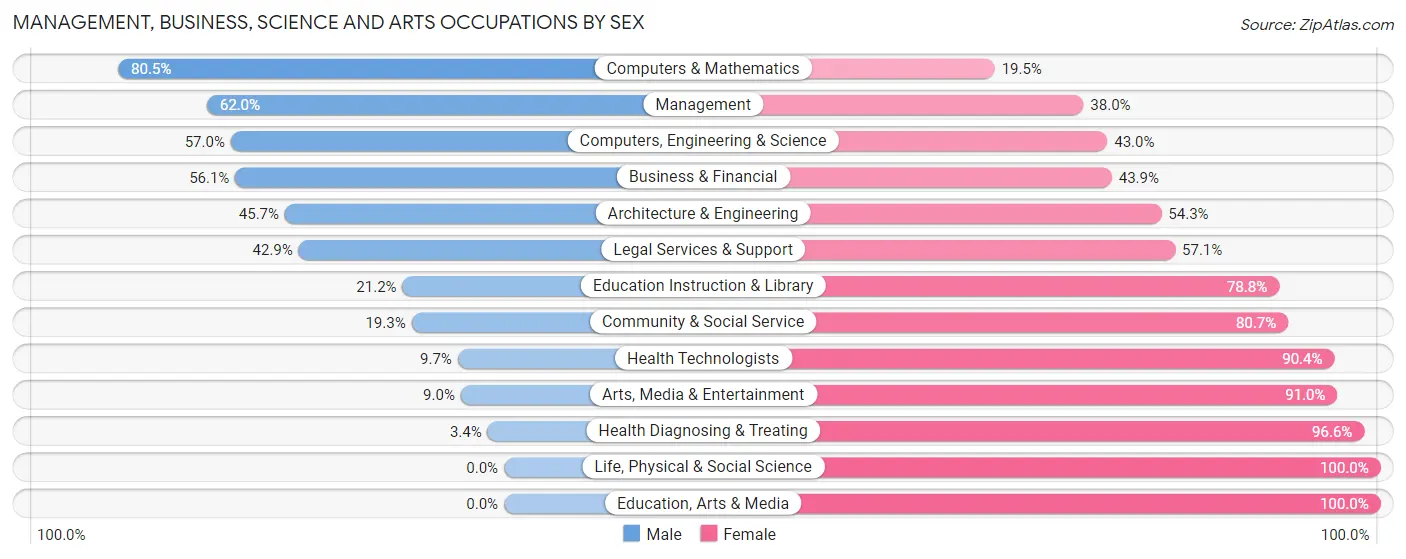
| Occupation | Male | Female |
| Management | 556 (62.0%) | 341 (38.0%) |
| Business & Financial | 60 (56.1%) | 47 (43.9%) |
| Computers, Engineering & Science | 114 (57.0%) | 86 (43.0%) |
| Computers & Mathematics | 66 (80.5%) | 16 (19.5%) |
| Architecture & Engineering | 48 (45.7%) | 57 (54.3%) |
| Life, Physical & Social Science | 0 (0.0%) | 13 (100.0%) |
| Community & Social Service | 92 (19.3%) | 385 (80.7%) |
| Education, Arts & Media | 0 (0.0%) | 30 (100.0%) |
| Legal Services & Support | 24 (42.9%) | 32 (57.1%) |
| Education Instruction & Library | 57 (21.2%) | 212 (78.8%) |
| Arts, Media & Entertainment | 11 (9.0%) | 111 (91.0%) |
| Health Diagnosing & Treating | 11 (3.4%) | 310 (96.6%) |
| Health Technologists | 11 (9.7%) | 103 (90.3%) |
| Total (Category) | 833 (41.6%) | 1,169 (58.4%) |
| Total (Overall) | 2,446 (53.8%) | 2,100 (46.2%) |
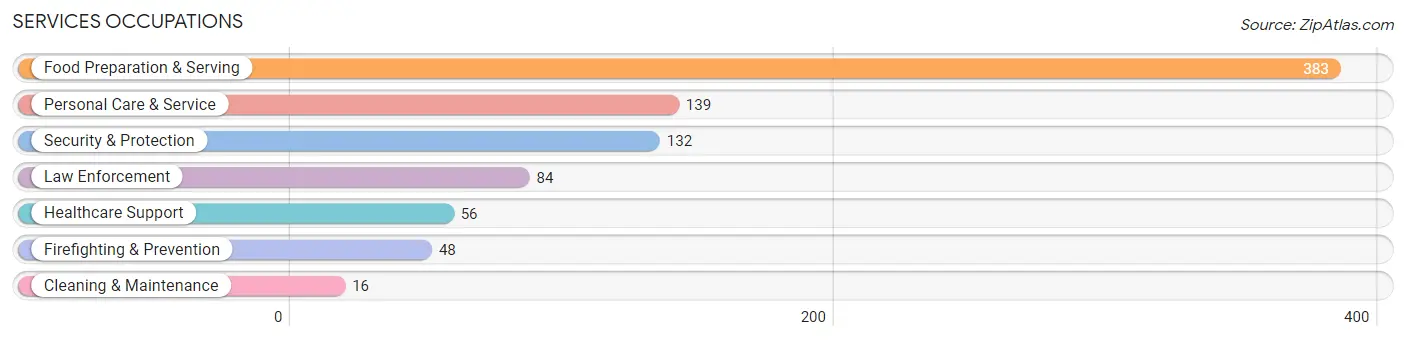
Services Occupations
The most common Services occupations in Stevensville are Food Preparation & Serving (383 | 8.4%), Personal Care & Service (139 | 3.1%), Security & Protection (132 | 2.9%), Law Enforcement (84 | 1.8%), and Healthcare Support (56 | 1.2%).
Services Occupations by Sex
Within the Services occupations in Stevensville, the most male-oriented occupations are Firefighting & Prevention (100.0%), Cleaning & Maintenance (100.0%), and Security & Protection (79.5%), while the most female-oriented occupations are Healthcare Support (100.0%), Personal Care & Service (83.5%), and Food Preparation & Serving (35.8%).
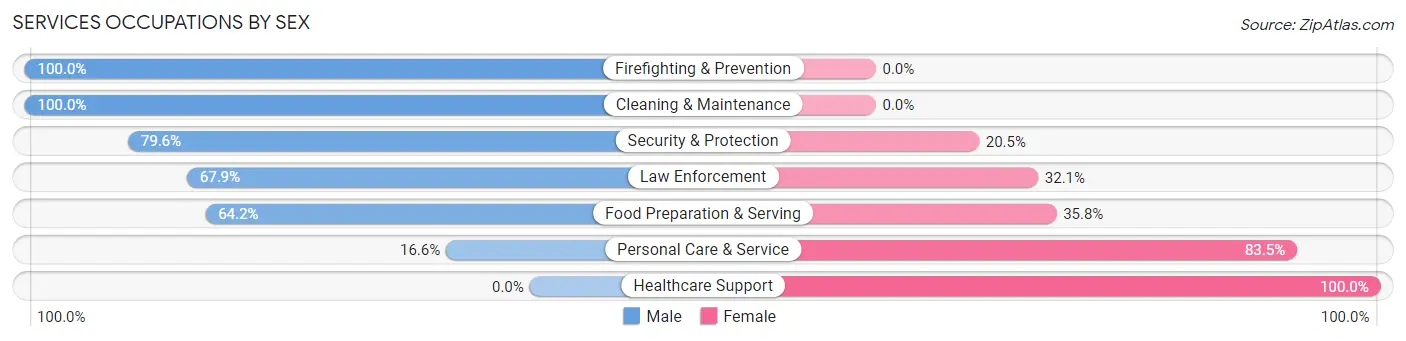
| Occupation | Male | Female |
| Healthcare Support | 0 (0.0%) | 56 (100.0%) |
| Security & Protection | 105 (79.5%) | 27 (20.4%) |
| Firefighting & Prevention | 48 (100.0%) | 0 (0.0%) |
| Law Enforcement | 57 (67.9%) | 27 (32.1%) |
| Food Preparation & Serving | 246 (64.2%) | 137 (35.8%) |
| Cleaning & Maintenance | 16 (100.0%) | 0 (0.0%) |
| Personal Care & Service | 23 (16.6%) | 116 (83.5%) |
| Total (Category) | 390 (53.7%) | 336 (46.3%) |
| Total (Overall) | 2,446 (53.8%) | 2,100 (46.2%) |
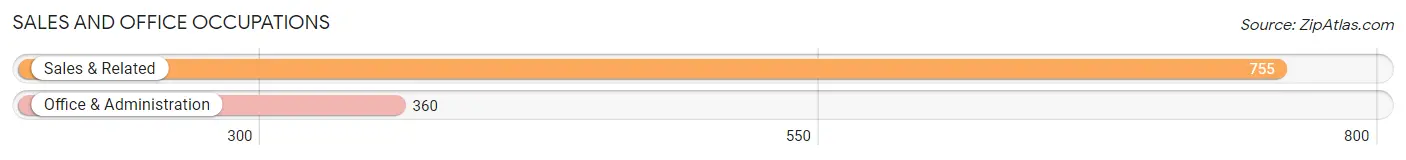
Sales and Office Occupations
The most common Sales and Office occupations in Stevensville are Sales & Related (755 | 16.6%), and Office & Administration (360 | 7.9%).
Sales and Office Occupations by Sex
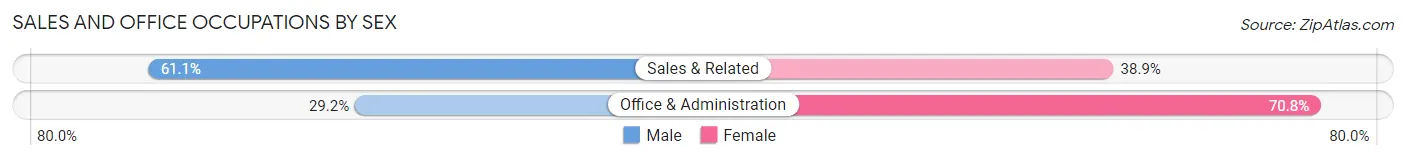
| Occupation | Male | Female |
| Sales & Related | 461 (61.1%) | 294 (38.9%) |
| Office & Administration | 105 (29.2%) | 255 (70.8%) |
| Total (Category) | 566 (50.8%) | 549 (49.2%) |
| Total (Overall) | 2,446 (53.8%) | 2,100 (46.2%) |
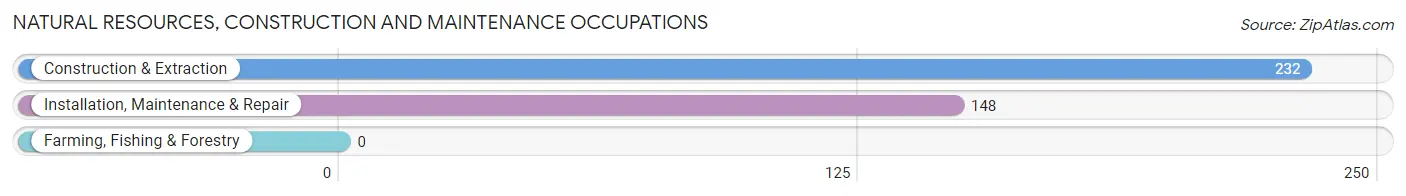
Natural Resources, Construction and Maintenance Occupations
The most common Natural Resources, Construction and Maintenance occupations in Stevensville are Construction & Extraction (232 | 5.1%), and Installation, Maintenance & Repair (148 | 3.3%).
Natural Resources, Construction and Maintenance Occupations by Sex
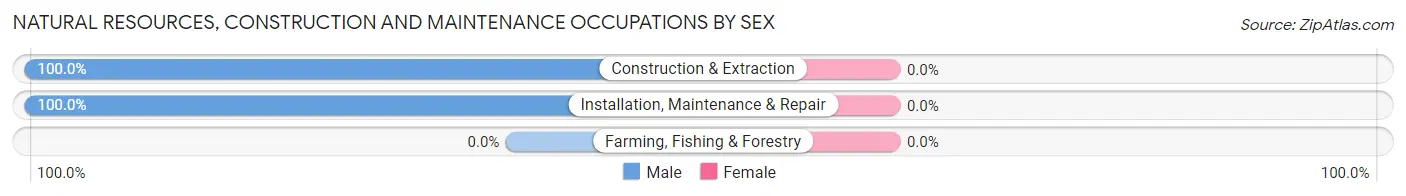
| Occupation | Male | Female |
| Farming, Fishing & Forestry | 0 (0.0%) | 0 (0.0%) |
| Construction & Extraction | 232 (100.0%) | 0 (0.0%) |
| Installation, Maintenance & Repair | 148 (100.0%) | 0 (0.0%) |
| Total (Category) | 380 (100.0%) | 0 (0.0%) |
| Total (Overall) | 2,446 (53.8%) | 2,100 (46.2%) |
Production, Transportation and Moving Occupations
The most common Production, Transportation and Moving occupations in Stevensville are Production (142 | 3.1%), Material Moving (94 | 2.1%), and Transportation (87 | 1.9%).
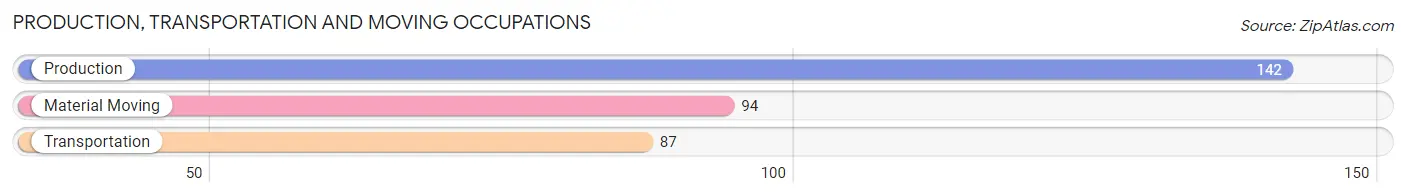
Production, Transportation and Moving Occupations by Sex
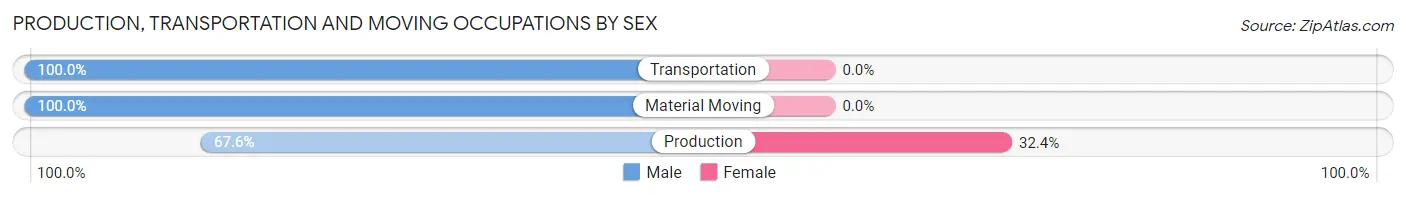
| Occupation | Male | Female |
| Production | 96 (67.6%) | 46 (32.4%) |
| Transportation | 87 (100.0%) | 0 (0.0%) |
| Material Moving | 94 (100.0%) | 0 (0.0%) |
| Total (Category) | 277 (85.8%) | 46 (14.2%) |
| Total (Overall) | 2,446 (53.8%) | 2,100 (46.2%) |
Employment Industries by Sex in Stevensville
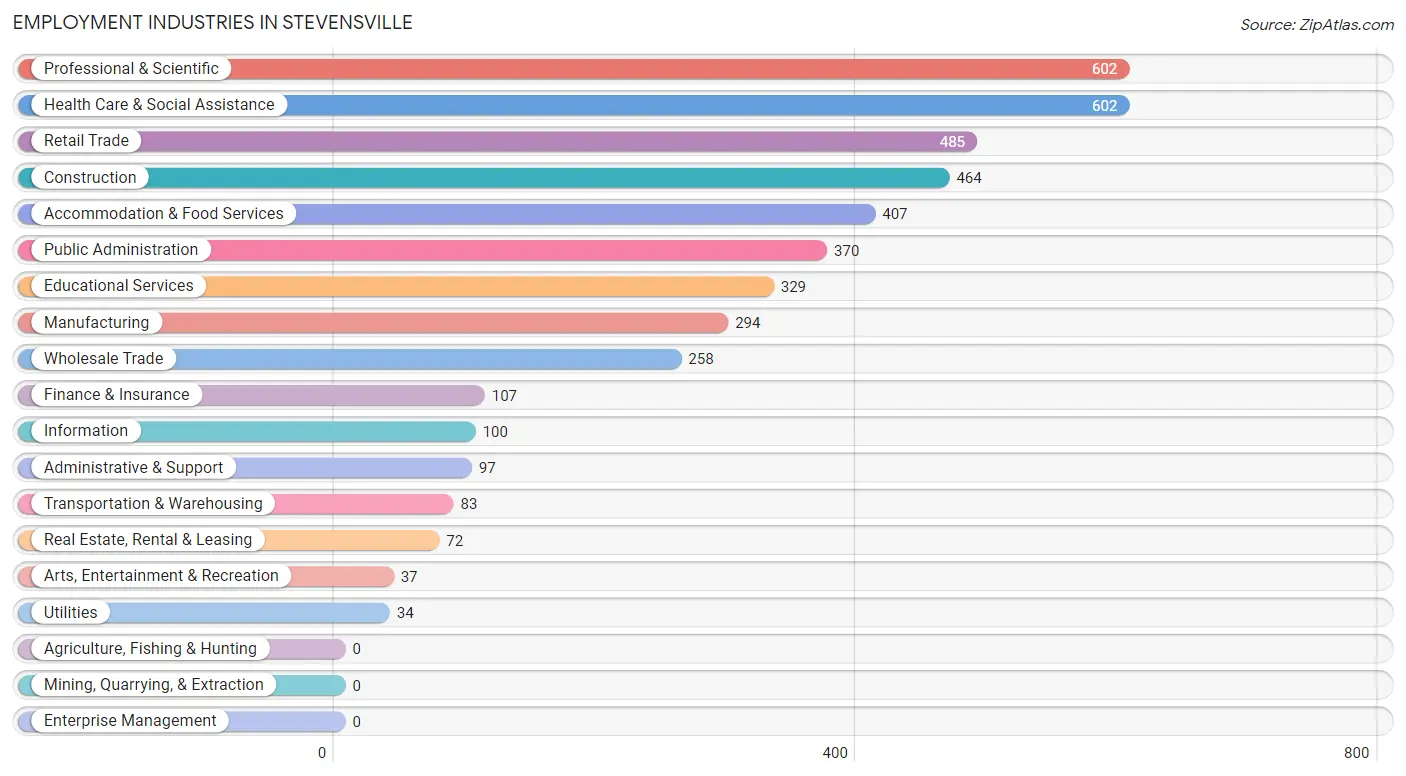
Employment Industries in Stevensville
The major employment industries in Stevensville include Professional & Scientific (602 | 13.2%), Health Care & Social Assistance (602 | 13.2%), Retail Trade (485 | 10.7%), Construction (464 | 10.2%), and Accommodation & Food Services (407 | 8.9%).
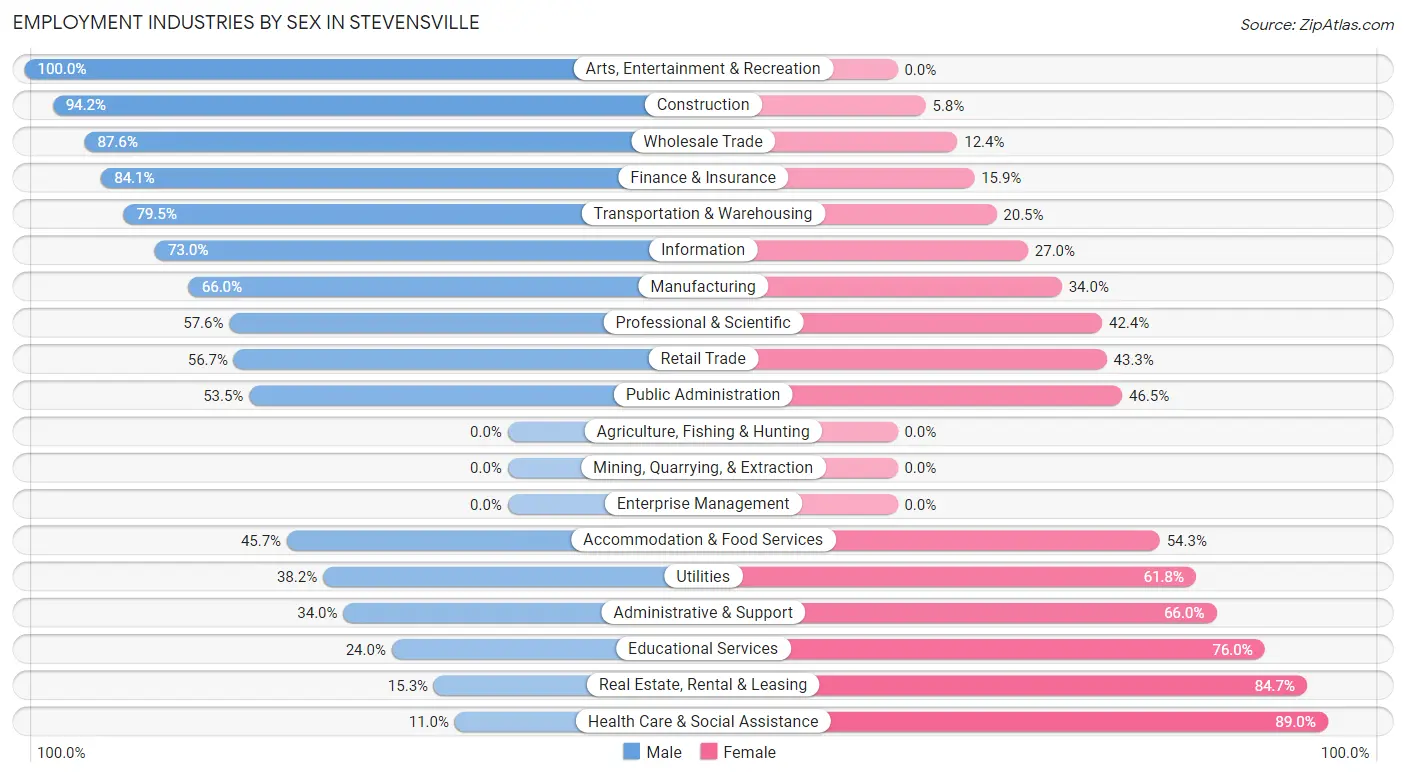
Employment Industries by Sex in Stevensville
The Stevensville industries that see more men than women are Arts, Entertainment & Recreation (100.0%), Construction (94.2%), and Wholesale Trade (87.6%), whereas the industries that tend to have a higher number of women are Health Care & Social Assistance (89.0%), Real Estate, Rental & Leasing (84.7%), and Educational Services (76.0%).
| Industry | Male | Female |
| Agriculture, Fishing & Hunting | 0 (0.0%) | 0 (0.0%) |
| Mining, Quarrying, & Extraction | 0 (0.0%) | 0 (0.0%) |
| Construction | 437 (94.2%) | 27 (5.8%) |
| Manufacturing | 194 (66.0%) | 100 (34.0%) |
| Wholesale Trade | 226 (87.6%) | 32 (12.4%) |
| Retail Trade | 275 (56.7%) | 210 (43.3%) |
| Transportation & Warehousing | 66 (79.5%) | 17 (20.5%) |
| Utilities | 13 (38.2%) | 21 (61.8%) |
| Information | 73 (73.0%) | 27 (27.0%) |
| Finance & Insurance | 90 (84.1%) | 17 (15.9%) |
| Real Estate, Rental & Leasing | 11 (15.3%) | 61 (84.7%) |
| Professional & Scientific | 347 (57.6%) | 255 (42.4%) |
| Enterprise Management | 0 (0.0%) | 0 (0.0%) |
| Administrative & Support | 33 (34.0%) | 64 (66.0%) |
| Educational Services | 79 (24.0%) | 250 (76.0%) |
| Health Care & Social Assistance | 66 (11.0%) | 536 (89.0%) |
| Arts, Entertainment & Recreation | 37 (100.0%) | 0 (0.0%) |
| Accommodation & Food Services | 186 (45.7%) | 221 (54.3%) |
| Public Administration | 198 (53.5%) | 172 (46.5%) |
| Total | 2,446 (53.8%) | 2,100 (46.2%) |
Education in Stevensville
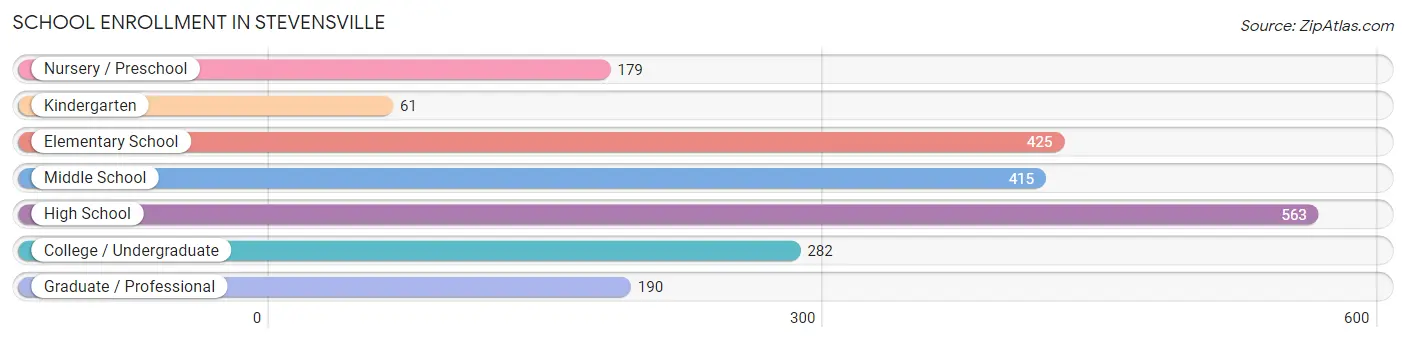
School Enrollment in Stevensville
The most common levels of schooling among the 2,115 students in Stevensville are high school (563 | 26.6%), elementary school (425 | 20.1%), and middle school (415 | 19.6%).
| School Level | # Students | % Students |
| Nursery / Preschool | 179 | 8.5% |
| Kindergarten | 61 | 2.9% |
| Elementary School | 425 | 20.1% |
| Middle School | 415 | 19.6% |
| High School | 563 | 26.6% |
| College / Undergraduate | 282 | 13.3% |
| Graduate / Professional | 190 | 9.0% |
| Total | 2,115 | 100.0% |
School Enrollment by Age by Funding Source in Stevensville
Out of a total of 2,115 students who are enrolled in schools in Stevensville, 235 (11.1%) attend a private institution, while the remaining 1,880 (88.9%) are enrolled in public schools. The age group of 20 to 24 year olds has the highest likelihood of being enrolled in private schools, with 68 (50.0% in the age bracket) enrolled. Conversely, the age group of 18 to 19 year olds has the lowest likelihood of being enrolled in a private school, with 120 (100.0% in the age bracket) attending a public institution.
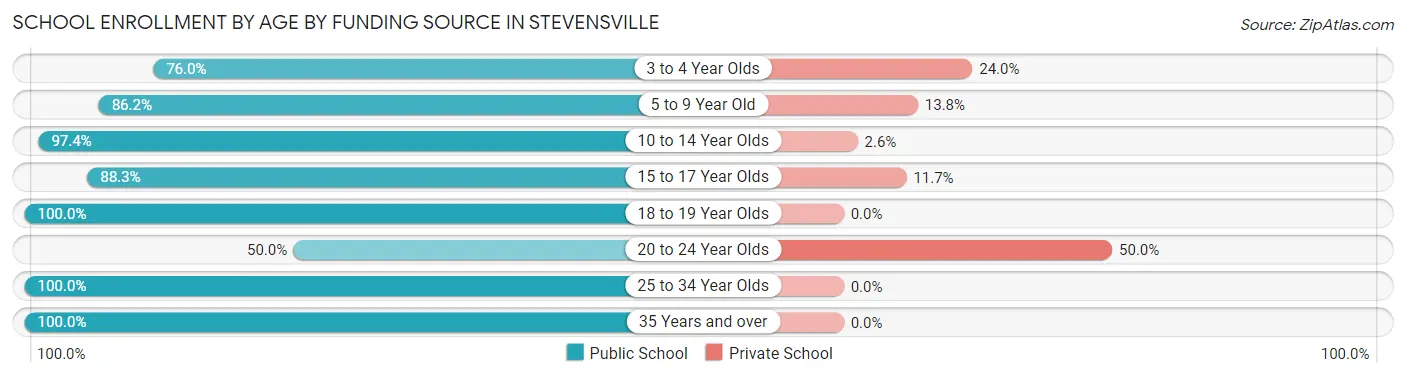
| Age Bracket | Public School | Private School |
| 3 to 4 Year Olds | 73 (76.0%) | 23 (24.0%) |
| 5 to 9 Year Old | 474 (86.2%) | 76 (13.8%) |
| 10 to 14 Year Olds | 413 (97.4%) | 11 (2.6%) |
| 15 to 17 Year Olds | 423 (88.3%) | 56 (11.7%) |
| 18 to 19 Year Olds | 120 (100.0%) | 0 (0.0%) |
| 20 to 24 Year Olds | 68 (50.0%) | 68 (50.0%) |
| 25 to 34 Year Olds | 136 (100.0%) | 0 (0.0%) |
| 35 Years and over | 174 (100.0%) | 0 (0.0%) |
| Total | 1,880 (88.9%) | 235 (11.1%) |
Educational Attainment by Field of Study in Stevensville
Business (670 | 26.9%), social sciences (306 | 12.3%), education (223 | 9.0%), science & technology (210 | 8.4%), and bio, nature & agricultural (193 | 7.8%) are the most common fields of study among 2,487 individuals in Stevensville who have obtained a bachelor's degree or higher.
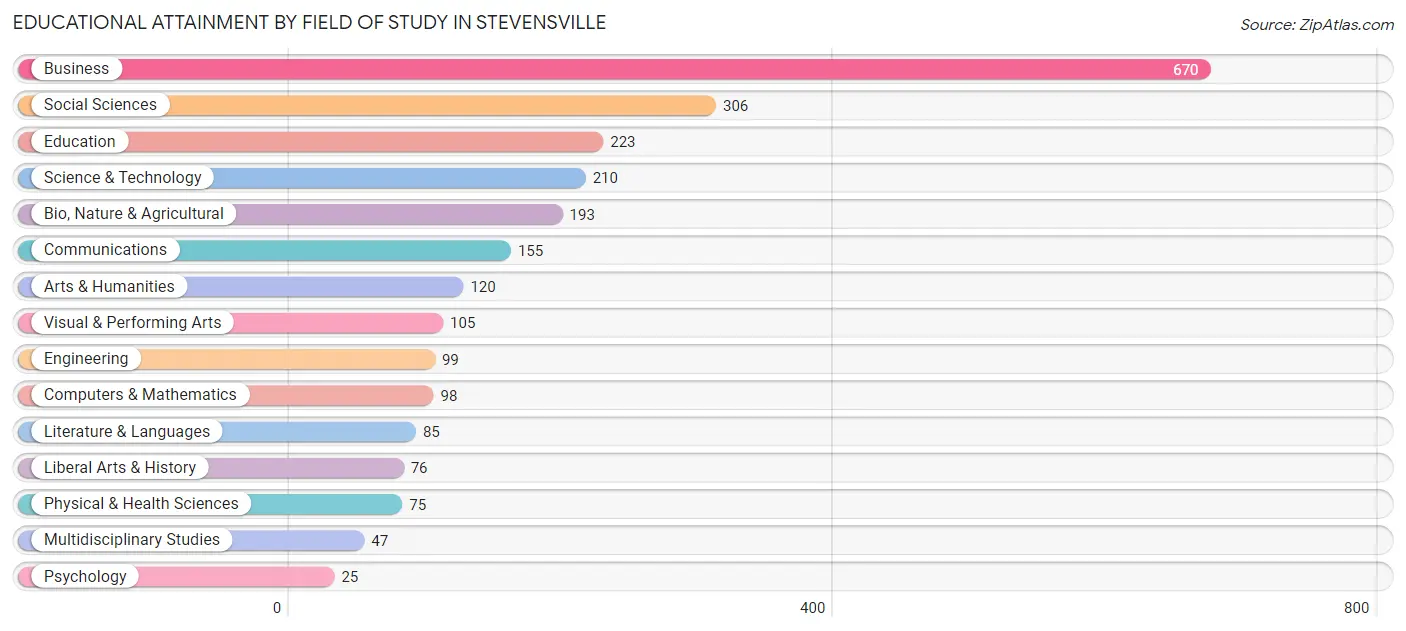
| Field of Study | # Graduates | % Graduates |
| Computers & Mathematics | 98 | 3.9% |
| Bio, Nature & Agricultural | 193 | 7.8% |
| Physical & Health Sciences | 75 | 3.0% |
| Psychology | 25 | 1.0% |
| Social Sciences | 306 | 12.3% |
| Engineering | 99 | 4.0% |
| Multidisciplinary Studies | 47 | 1.9% |
| Science & Technology | 210 | 8.4% |
| Business | 670 | 26.9% |
| Education | 223 | 9.0% |
| Literature & Languages | 85 | 3.4% |
| Liberal Arts & History | 76 | 3.1% |
| Visual & Performing Arts | 105 | 4.2% |
| Communications | 155 | 6.2% |
| Arts & Humanities | 120 | 4.8% |
| Total | 2,487 | 100.0% |
Transportation & Commute in Stevensville
Vehicle Availability by Sex in Stevensville
The most prevalent vehicle ownership categories in Stevensville are males with 3 vehicles (893, accounting for 37.4%) and females with 3 vehicles (728, making up 44.7%).
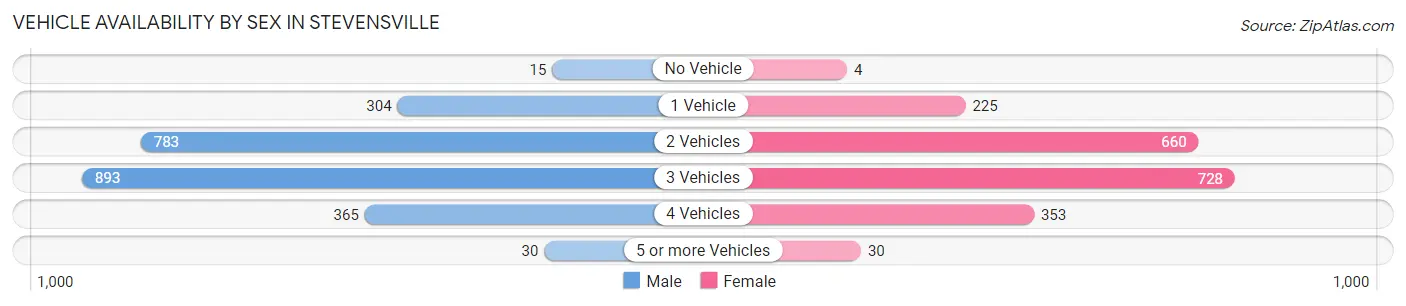
| Vehicles Available | Male | Female |
| No Vehicle | 15 (0.6%) | 4 (0.2%) |
| 1 Vehicle | 304 (12.7%) | 225 (11.3%) |
| 2 Vehicles | 783 (32.8%) | 660 (33.0%) |
| 3 Vehicles | 893 (37.4%) | 728 (36.4%) |
| 4 Vehicles | 365 (15.3%) | 353 (17.6%) |
| 5 or more Vehicles | 30 (1.3%) | 30 (1.5%) |
| Total | 2,390 (100.0%) | 2,000 (100.0%) |
Commute Time in Stevensville
The most frequently occuring commute durations in Stevensville are 5 to 9 minutes (682 commuters, 17.4%), 45 to 59 minutes (587 commuters, 15.0%), and 10 to 14 minutes (426 commuters, 10.9%).
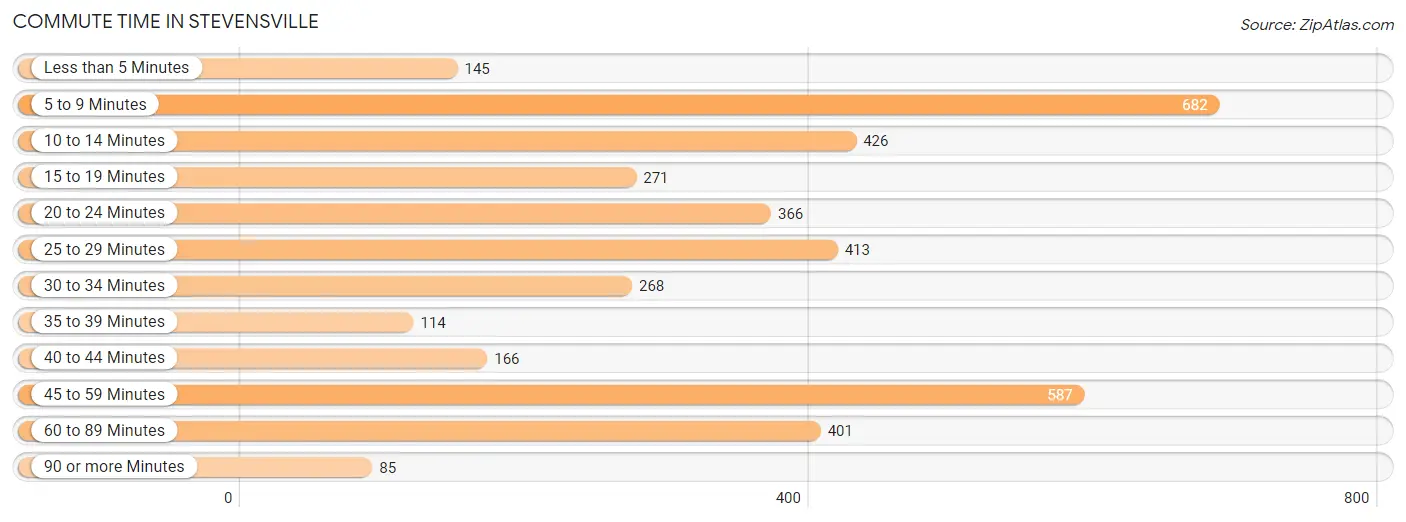
| Commute Time | # Commuters | % Commuters |
| Less than 5 Minutes | 145 | 3.7% |
| 5 to 9 Minutes | 682 | 17.4% |
| 10 to 14 Minutes | 426 | 10.9% |
| 15 to 19 Minutes | 271 | 6.9% |
| 20 to 24 Minutes | 366 | 9.3% |
| 25 to 29 Minutes | 413 | 10.5% |
| 30 to 34 Minutes | 268 | 6.8% |
| 35 to 39 Minutes | 114 | 2.9% |
| 40 to 44 Minutes | 166 | 4.2% |
| 45 to 59 Minutes | 587 | 15.0% |
| 60 to 89 Minutes | 401 | 10.2% |
| 90 or more Minutes | 85 | 2.2% |
Commute Time by Sex in Stevensville
The most common commute times in Stevensville are 45 to 59 minutes (405 commuters, 19.0%) for males and 5 to 9 minutes (383 commuters, 21.4%) for females.
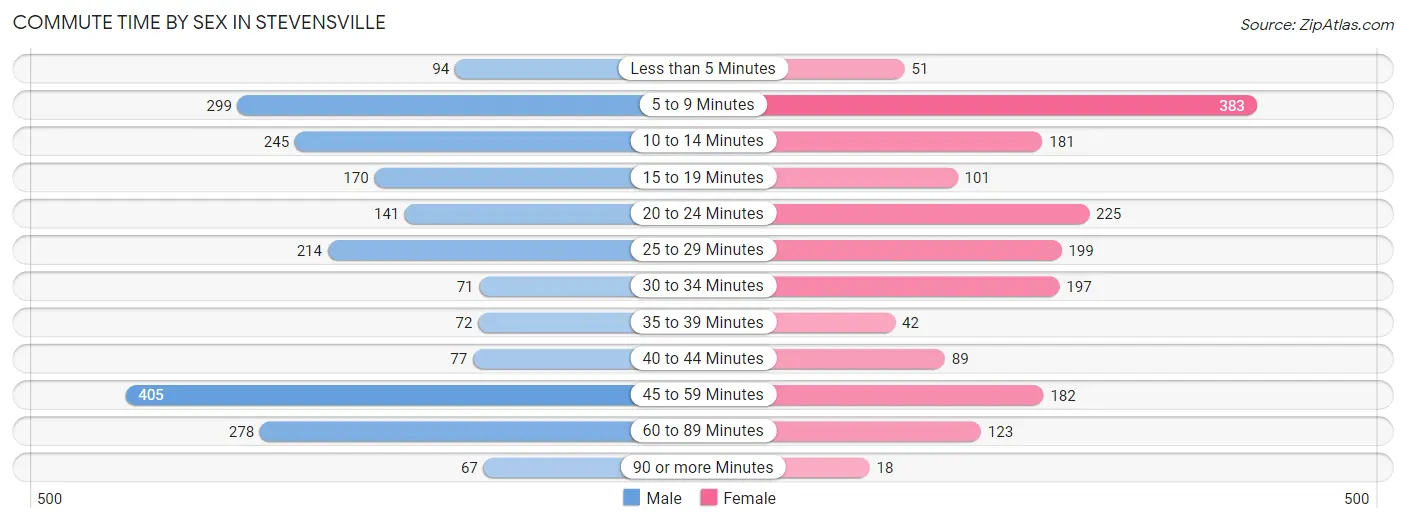
| Commute Time | Male | Female |
| Less than 5 Minutes | 94 (4.4%) | 51 (2.9%) |
| 5 to 9 Minutes | 299 (14.0%) | 383 (21.4%) |
| 10 to 14 Minutes | 245 (11.5%) | 181 (10.1%) |
| 15 to 19 Minutes | 170 (8.0%) | 101 (5.6%) |
| 20 to 24 Minutes | 141 (6.6%) | 225 (12.6%) |
| 25 to 29 Minutes | 214 (10.0%) | 199 (11.1%) |
| 30 to 34 Minutes | 71 (3.3%) | 197 (11.0%) |
| 35 to 39 Minutes | 72 (3.4%) | 42 (2.4%) |
| 40 to 44 Minutes | 77 (3.6%) | 89 (5.0%) |
| 45 to 59 Minutes | 405 (19.0%) | 182 (10.2%) |
| 60 to 89 Minutes | 278 (13.0%) | 123 (6.9%) |
| 90 or more Minutes | 67 (3.1%) | 18 (1.0%) |
Time of Departure to Work by Sex in Stevensville
The most frequent times of departure to work in Stevensville are 5:30 AM to 5:59 AM (250, 11.7%) for males and 6:30 AM to 6:59 AM (271, 15.1%) for females.
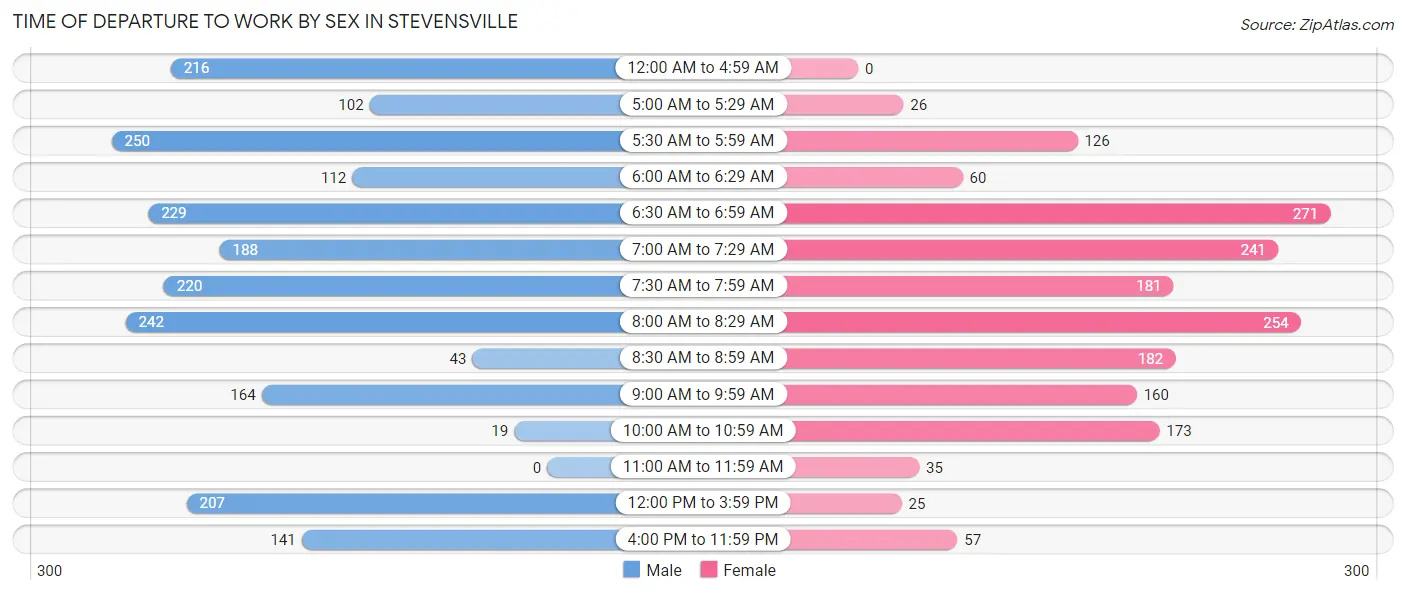
| Time of Departure | Male | Female |
| 12:00 AM to 4:59 AM | 216 (10.1%) | 0 (0.0%) |
| 5:00 AM to 5:29 AM | 102 (4.8%) | 26 (1.5%) |
| 5:30 AM to 5:59 AM | 250 (11.7%) | 126 (7.0%) |
| 6:00 AM to 6:29 AM | 112 (5.2%) | 60 (3.4%) |
| 6:30 AM to 6:59 AM | 229 (10.7%) | 271 (15.1%) |
| 7:00 AM to 7:29 AM | 188 (8.8%) | 241 (13.5%) |
| 7:30 AM to 7:59 AM | 220 (10.3%) | 181 (10.1%) |
| 8:00 AM to 8:29 AM | 242 (11.4%) | 254 (14.2%) |
| 8:30 AM to 8:59 AM | 43 (2.0%) | 182 (10.2%) |
| 9:00 AM to 9:59 AM | 164 (7.7%) | 160 (8.9%) |
| 10:00 AM to 10:59 AM | 19 (0.9%) | 173 (9.7%) |
| 11:00 AM to 11:59 AM | 0 (0.0%) | 35 (1.9%) |
| 12:00 PM to 3:59 PM | 207 (9.7%) | 25 (1.4%) |
| 4:00 PM to 11:59 PM | 141 (6.6%) | 57 (3.2%) |
| Total | 2,133 (100.0%) | 1,791 (100.0%) |
Housing Occupancy in Stevensville
Occupancy by Ownership in Stevensville
Of the total 3,217 dwellings in Stevensville, owner-occupied units account for 2,284 (71.0%), while renter-occupied units make up 933 (29.0%).
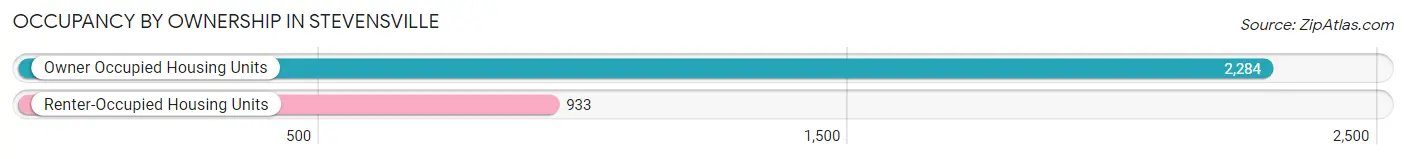
| Occupancy | # Housing Units | % Housing Units |
| Owner Occupied Housing Units | 2,284 | 71.0% |
| Renter-Occupied Housing Units | 933 | 29.0% |
| Total Occupied Housing Units | 3,217 | 100.0% |
Occupancy by Household Size in Stevensville
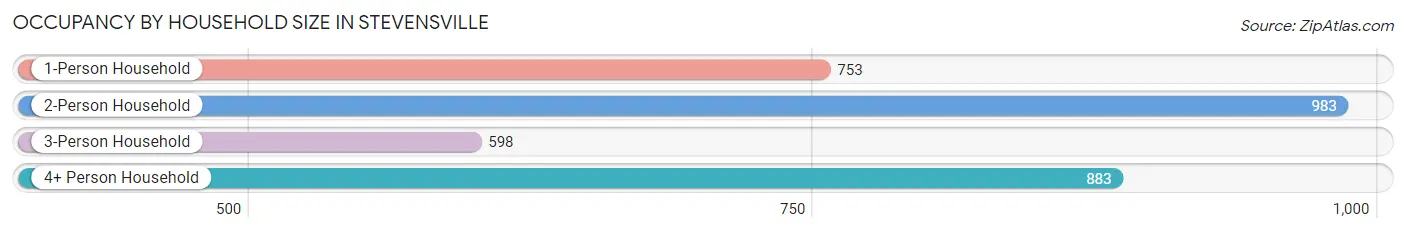
| Household Size | # Housing Units | % Housing Units |
| 1-Person Household | 753 | 23.4% |
| 2-Person Household | 983 | 30.6% |
| 3-Person Household | 598 | 18.6% |
| 4+ Person Household | 883 | 27.5% |
| Total Housing Units | 3,217 | 100.0% |
Occupancy by Ownership by Household Size in Stevensville
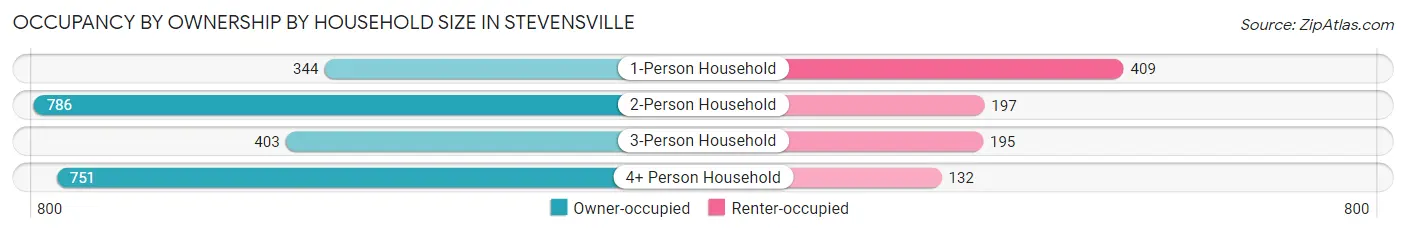
| Household Size | Owner-occupied | Renter-occupied |
| 1-Person Household | 344 (45.7%) | 409 (54.3%) |
| 2-Person Household | 786 (80.0%) | 197 (20.0%) |
| 3-Person Household | 403 (67.4%) | 195 (32.6%) |
| 4+ Person Household | 751 (85.1%) | 132 (14.9%) |
| Total Housing Units | 2,284 (71.0%) | 933 (29.0%) |
Occupancy by Educational Attainment in Stevensville
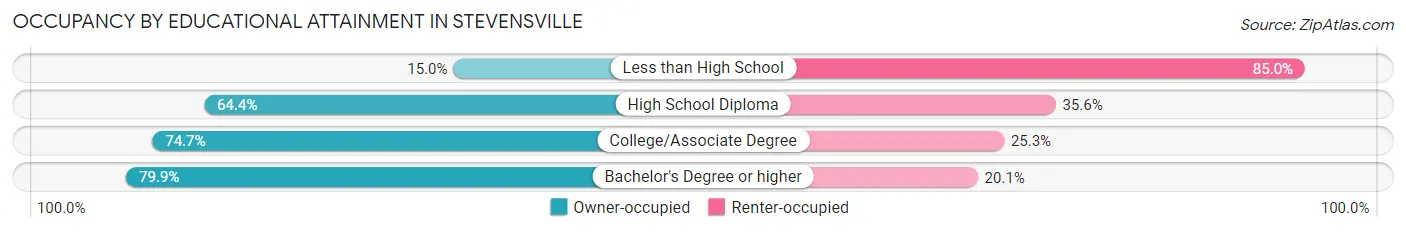
| Household Size | Owner-occupied | Renter-occupied |
| Less than High School | 27 (15.0%) | 153 (85.0%) |
| High School Diploma | 489 (64.4%) | 270 (35.6%) |
| College/Associate Degree | 740 (74.7%) | 251 (25.3%) |
| Bachelor's Degree or higher | 1,028 (79.9%) | 259 (20.1%) |
Occupancy by Age of Householder in Stevensville
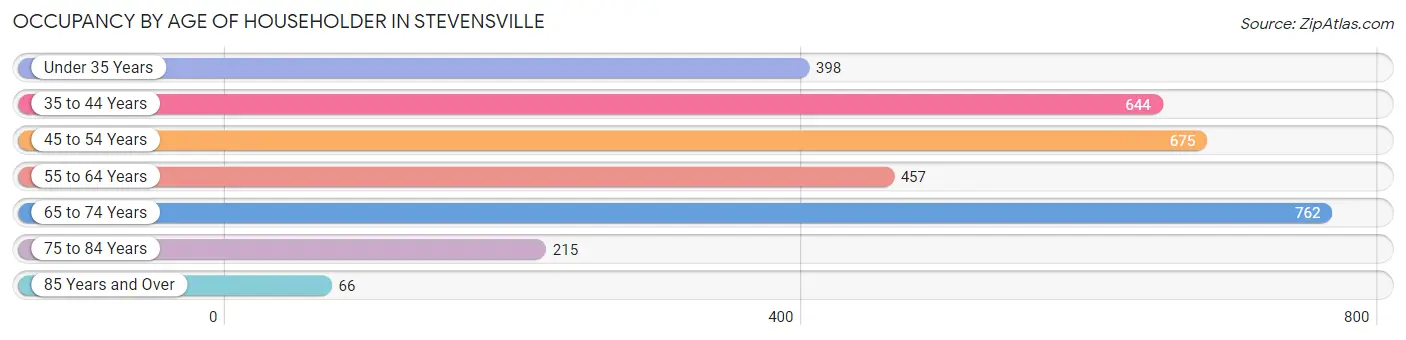
| Age Bracket | # Households | % Households |
| Under 35 Years | 398 | 12.4% |
| 35 to 44 Years | 644 | 20.0% |
| 45 to 54 Years | 675 | 21.0% |
| 55 to 64 Years | 457 | 14.2% |
| 65 to 74 Years | 762 | 23.7% |
| 75 to 84 Years | 215 | 6.7% |
| 85 Years and Over | 66 | 2.1% |
| Total | 3,217 | 100.0% |
Housing Finances in Stevensville
Median Income by Occupancy in Stevensville
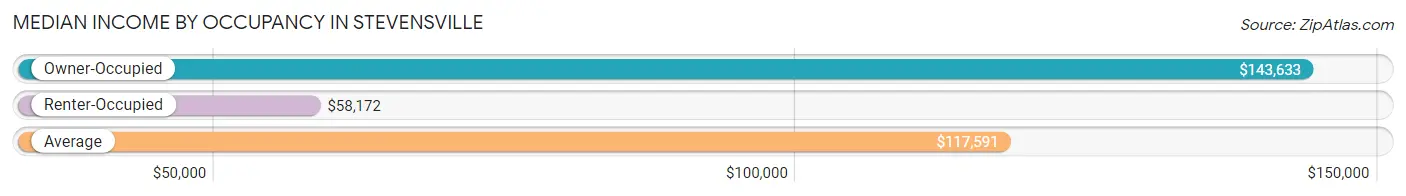
| Occupancy Type | # Households | Median Income |
| Owner-Occupied | 2,284 (71.0%) | $143,633 |
| Renter-Occupied | 933 (29.0%) | $58,172 |
| Average | 3,217 (100.0%) | $117,591 |
Occupancy by Householder Income Bracket in Stevensville
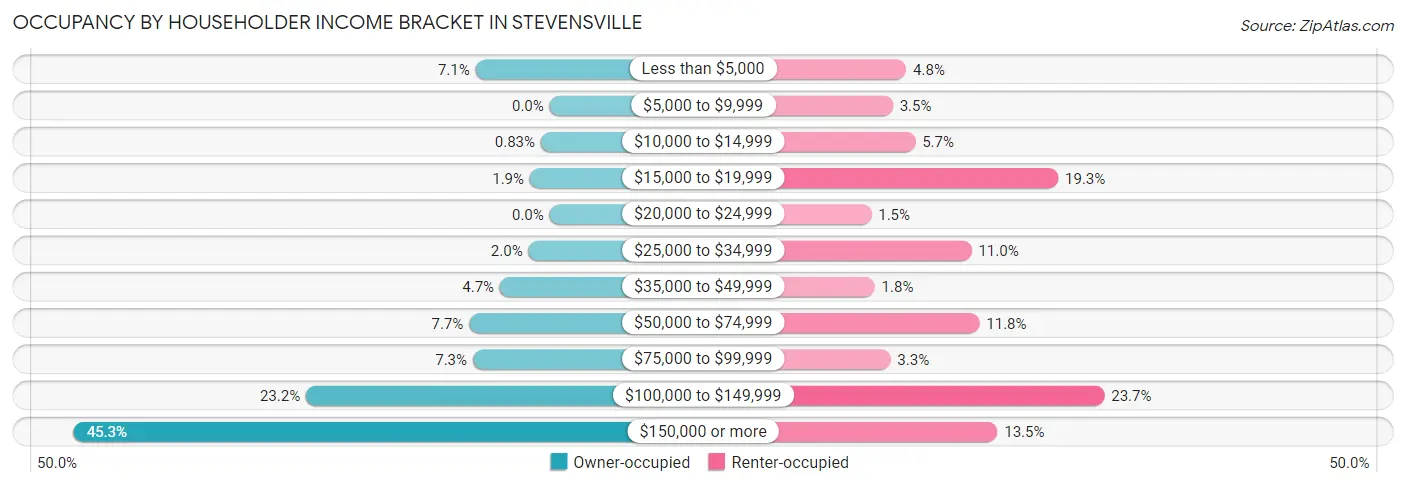
| Income Bracket | Owner-occupied | Renter-occupied |
| Less than $5,000 | 161 (7.0%) | 45 (4.8%) |
| $5,000 to $9,999 | 0 (0.0%) | 33 (3.5%) |
| $10,000 to $14,999 | 19 (0.8%) | 53 (5.7%) |
| $15,000 to $19,999 | 43 (1.9%) | 180 (19.3%) |
| $20,000 to $24,999 | 0 (0.0%) | 14 (1.5%) |
| $25,000 to $34,999 | 46 (2.0%) | 103 (11.0%) |
| $35,000 to $49,999 | 108 (4.7%) | 17 (1.8%) |
| $50,000 to $74,999 | 175 (7.7%) | 110 (11.8%) |
| $75,000 to $99,999 | 167 (7.3%) | 31 (3.3%) |
| $100,000 to $149,999 | 530 (23.2%) | 221 (23.7%) |
| $150,000 or more | 1,035 (45.3%) | 126 (13.5%) |
| Total | 2,284 (100.0%) | 933 (100.0%) |
Monthly Housing Cost Tiers in Stevensville
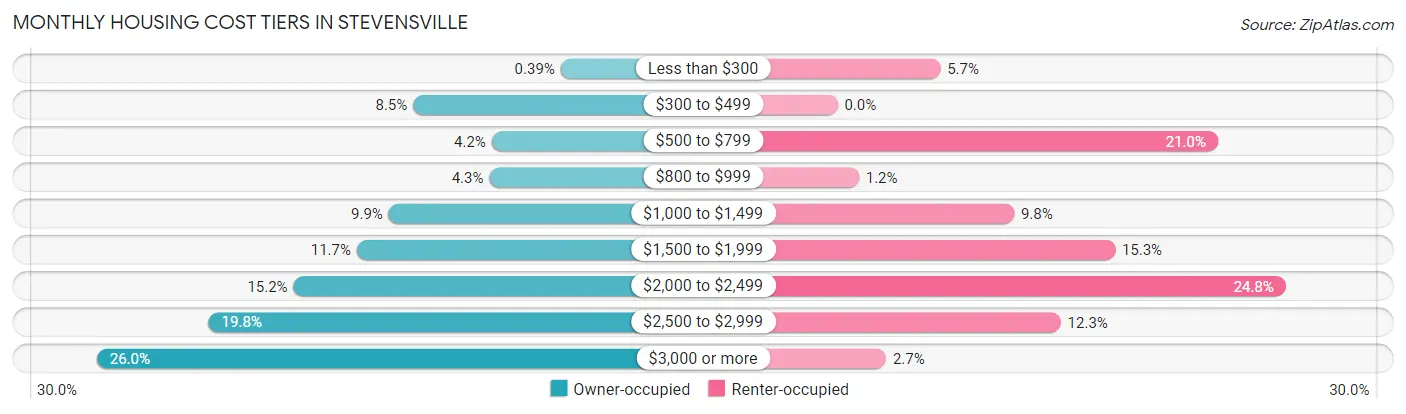
| Monthly Cost | Owner-occupied | Renter-occupied |
| Less than $300 | 9 (0.4%) | 53 (5.7%) |
| $300 to $499 | 195 (8.5%) | 0 (0.0%) |
| $500 to $799 | 96 (4.2%) | 196 (21.0%) |
| $800 to $999 | 99 (4.3%) | 11 (1.2%) |
| $1,000 to $1,499 | 226 (9.9%) | 91 (9.8%) |
| $1,500 to $1,999 | 266 (11.7%) | 143 (15.3%) |
| $2,000 to $2,499 | 346 (15.1%) | 231 (24.8%) |
| $2,500 to $2,999 | 453 (19.8%) | 115 (12.3%) |
| $3,000 or more | 594 (26.0%) | 25 (2.7%) |
| Total | 2,284 (100.0%) | 933 (100.0%) |
Physical Housing Characteristics in Stevensville
Housing Structures in Stevensville
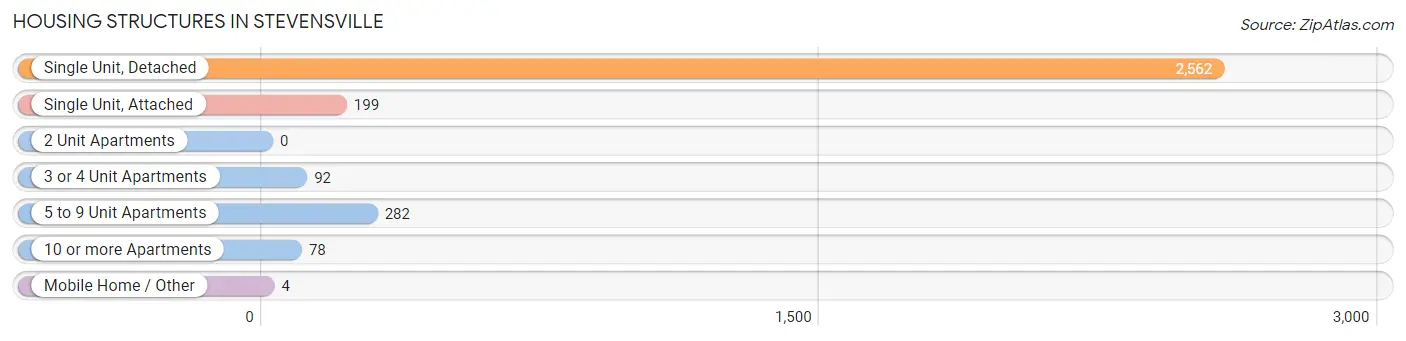
| Structure Type | # Housing Units | % Housing Units |
| Single Unit, Detached | 2,562 | 79.6% |
| Single Unit, Attached | 199 | 6.2% |
| 2 Unit Apartments | 0 | 0.0% |
| 3 or 4 Unit Apartments | 92 | 2.9% |
| 5 to 9 Unit Apartments | 282 | 8.8% |
| 10 or more Apartments | 78 | 2.4% |
| Mobile Home / Other | 4 | 0.1% |
| Total | 3,217 | 100.0% |
Housing Structures by Occupancy in Stevensville
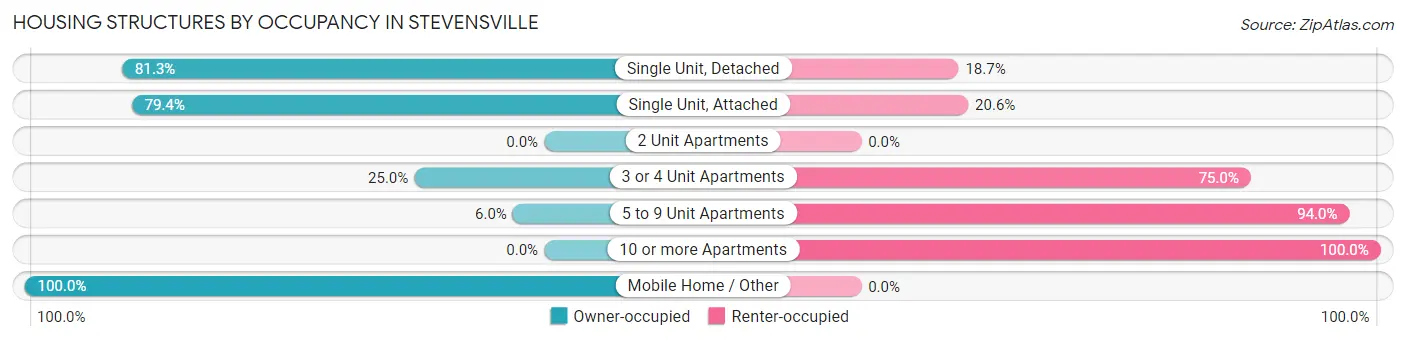
| Structure Type | Owner-occupied | Renter-occupied |
| Single Unit, Detached | 2,082 (81.3%) | 480 (18.7%) |
| Single Unit, Attached | 158 (79.4%) | 41 (20.6%) |
| 2 Unit Apartments | 0 (0.0%) | 0 (0.0%) |
| 3 or 4 Unit Apartments | 23 (25.0%) | 69 (75.0%) |
| 5 to 9 Unit Apartments | 17 (6.0%) | 265 (94.0%) |
| 10 or more Apartments | 0 (0.0%) | 78 (100.0%) |
| Mobile Home / Other | 4 (100.0%) | 0 (0.0%) |
| Total | 2,284 (71.0%) | 933 (29.0%) |
Housing Structures by Number of Rooms in Stevensville
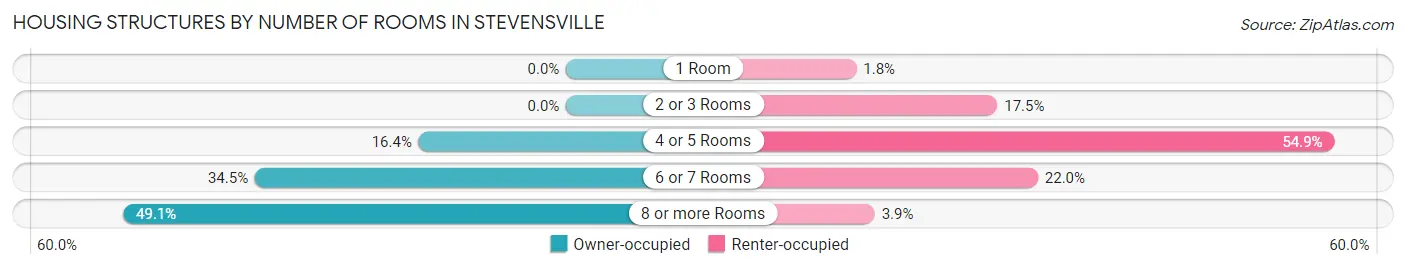
| Number of Rooms | Owner-occupied | Renter-occupied |
| 1 Room | 0 (0.0%) | 17 (1.8%) |
| 2 or 3 Rooms | 0 (0.0%) | 163 (17.5%) |
| 4 or 5 Rooms | 374 (16.4%) | 512 (54.9%) |
| 6 or 7 Rooms | 789 (34.5%) | 205 (22.0%) |
| 8 or more Rooms | 1,121 (49.1%) | 36 (3.9%) |
| Total | 2,284 (100.0%) | 933 (100.0%) |
Housing Structure by Heating Type in Stevensville
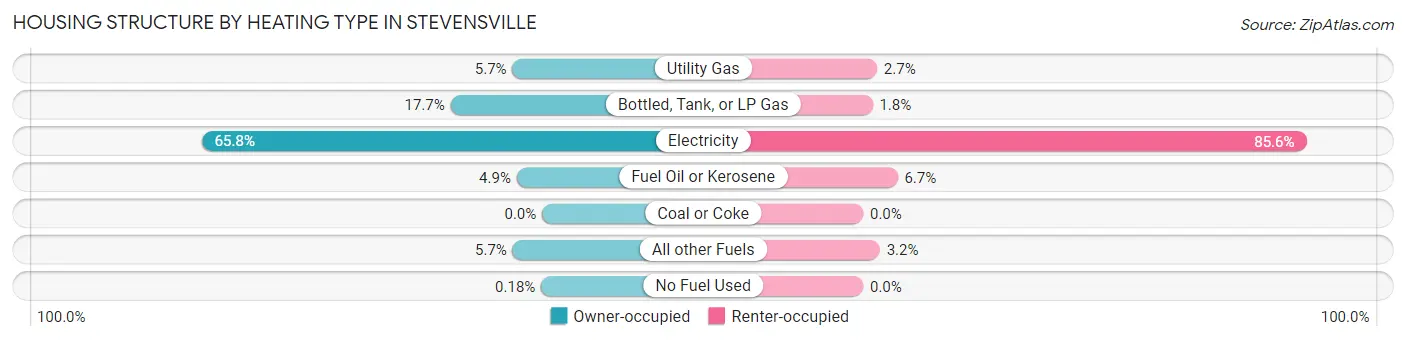
| Heating Type | Owner-occupied | Renter-occupied |
| Utility Gas | 131 (5.7%) | 25 (2.7%) |
| Bottled, Tank, or LP Gas | 404 (17.7%) | 17 (1.8%) |
| Electricity | 1,503 (65.8%) | 799 (85.6%) |
| Fuel Oil or Kerosene | 112 (4.9%) | 62 (6.7%) |
| Coal or Coke | 0 (0.0%) | 0 (0.0%) |
| All other Fuels | 130 (5.7%) | 30 (3.2%) |
| No Fuel Used | 4 (0.2%) | 0 (0.0%) |
| Total | 2,284 (100.0%) | 933 (100.0%) |
Household Vehicle Usage in Stevensville
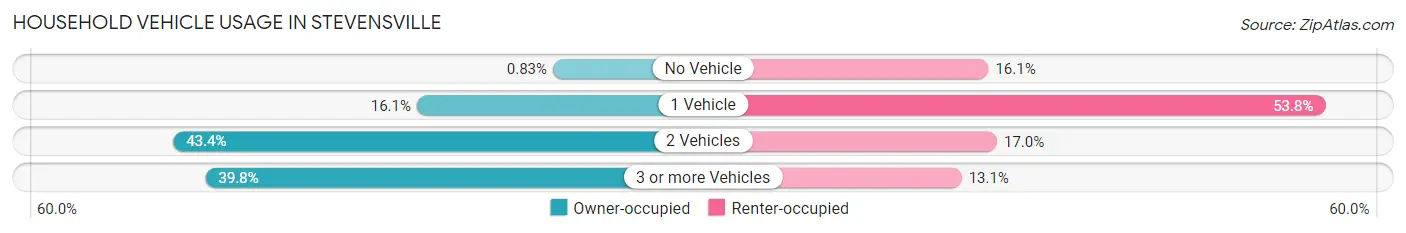
| Vehicles per Household | Owner-occupied | Renter-occupied |
| No Vehicle | 19 (0.8%) | 150 (16.1%) |
| 1 Vehicle | 367 (16.1%) | 502 (53.8%) |
| 2 Vehicles | 990 (43.3%) | 159 (17.0%) |
| 3 or more Vehicles | 908 (39.8%) | 122 (13.1%) |
| Total | 2,284 (100.0%) | 933 (100.0%) |
Real Estate & Mortgages in Stevensville
Real Estate and Mortgage Overview in Stevensville
| Characteristic | Without Mortgage | With Mortgage |
| Housing Units | 506 | 1,778 |
| Median Property Value | $454,700 | $442,200 |
| Median Household Income | - | - |
| Monthly Housing Costs | $694 | $594 |
| Real Estate Taxes | $3,514 | $49 |
Property Value by Mortgage Status in Stevensville
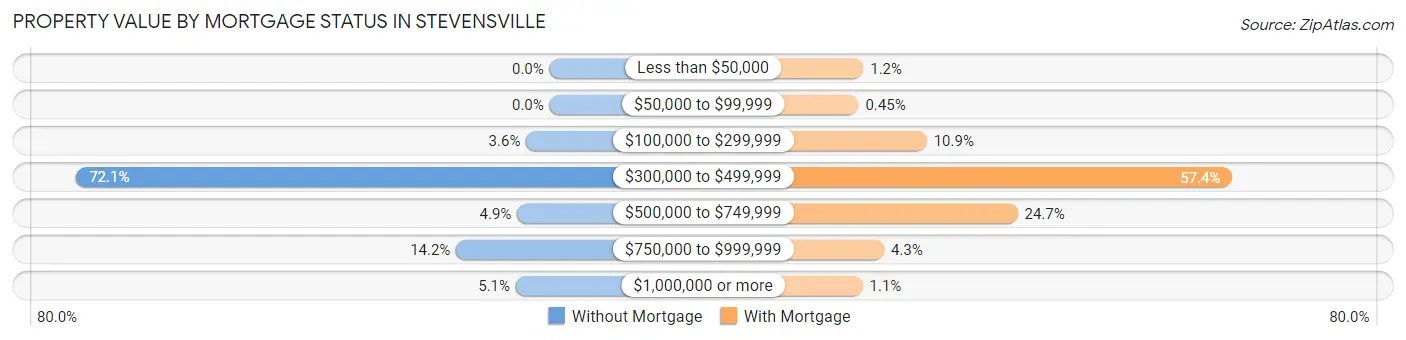
| Property Value | Without Mortgage | With Mortgage |
| Less than $50,000 | 0 (0.0%) | 21 (1.2%) |
| $50,000 to $99,999 | 0 (0.0%) | 8 (0.4%) |
| $100,000 to $299,999 | 18 (3.6%) | 193 (10.8%) |
| $300,000 to $499,999 | 365 (72.1%) | 1,021 (57.4%) |
| $500,000 to $749,999 | 25 (4.9%) | 439 (24.7%) |
| $750,000 to $999,999 | 72 (14.2%) | 77 (4.3%) |
| $1,000,000 or more | 26 (5.1%) | 19 (1.1%) |
| Total | 506 (100.0%) | 1,778 (100.0%) |
Household Income by Mortgage Status in Stevensville
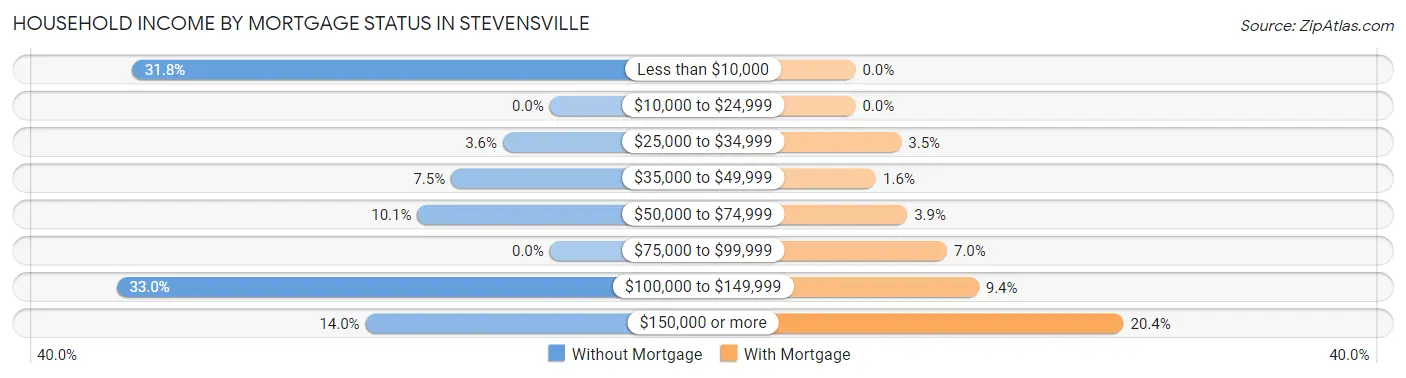
| Household Income | Without Mortgage | With Mortgage |
| Less than $10,000 | 161 (31.8%) | 0 (0.0%) |
| $10,000 to $24,999 | 0 (0.0%) | 0 (0.0%) |
| $25,000 to $34,999 | 18 (3.6%) | 62 (3.5%) |
| $35,000 to $49,999 | 38 (7.5%) | 28 (1.6%) |
| $50,000 to $74,999 | 51 (10.1%) | 70 (3.9%) |
| $75,000 to $99,999 | 0 (0.0%) | 124 (7.0%) |
| $100,000 to $149,999 | 167 (33.0%) | 167 (9.4%) |
| $150,000 or more | 71 (14.0%) | 363 (20.4%) |
| Total | 506 (100.0%) | 1,778 (100.0%) |
Property Value to Household Income Ratio in Stevensville
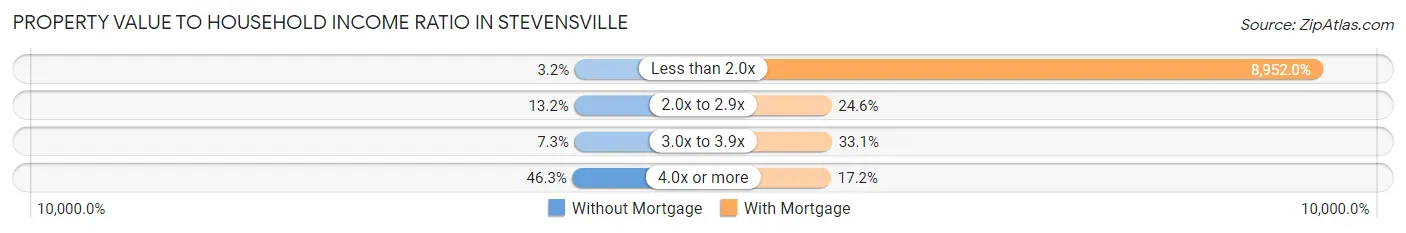
| Value-to-Income Ratio | Without Mortgage | With Mortgage |
| Less than 2.0x | 16 (3.2%) | 159,167 (8,952.0%) |
| 2.0x to 2.9x | 67 (13.2%) | 438 (24.6%) |
| 3.0x to 3.9x | 37 (7.3%) | 588 (33.1%) |
| 4.0x or more | 234 (46.3%) | 306 (17.2%) |
| Total | 506 (100.0%) | 1,778 (100.0%) |
Real Estate Taxes by Mortgage Status in Stevensville
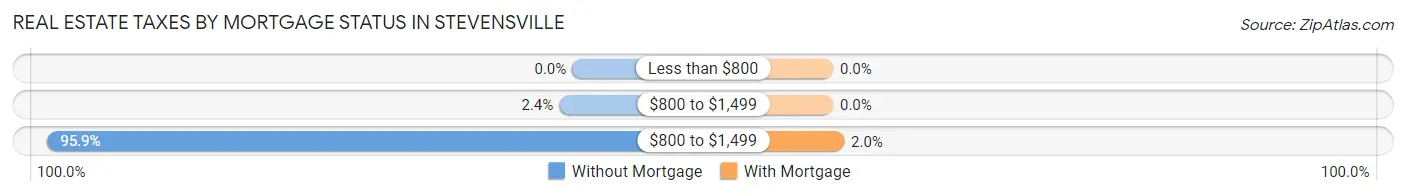
| Property Taxes | Without Mortgage | With Mortgage |
| Less than $800 | 0 (0.0%) | 0 (0.0%) |
| $800 to $1,499 | 12 (2.4%) | 0 (0.0%) |
| $800 to $1,499 | 485 (95.9%) | 36 (2.0%) |
| Total | 506 (100.0%) | 1,778 (100.0%) |
Health & Disability in Stevensville
Health Insurance Coverage by Age in Stevensville
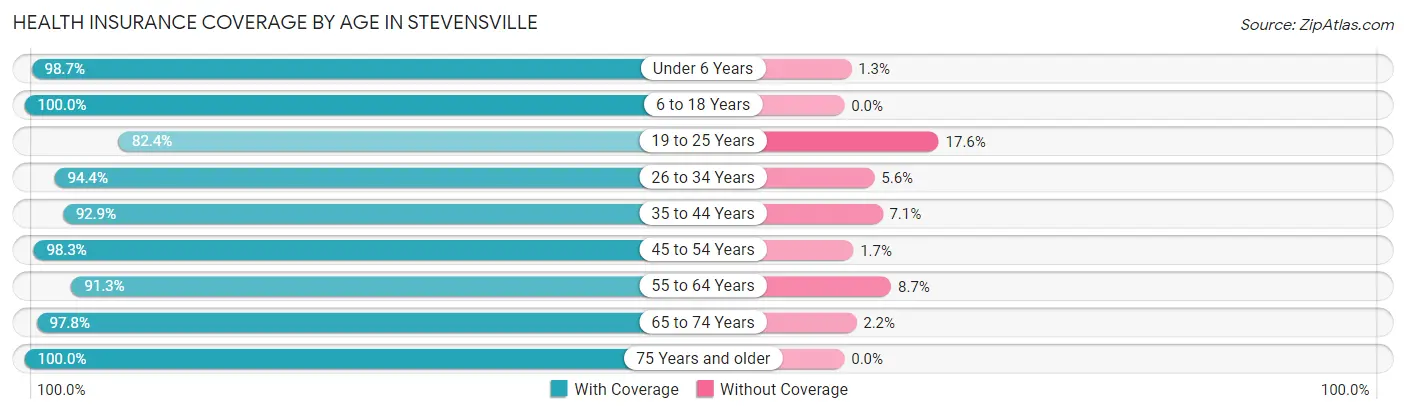
| Age Bracket | With Coverage | Without Coverage |
| Under 6 Years | 608 (98.7%) | 8 (1.3%) |
| 6 to 18 Years | 1,543 (100.0%) | 0 (0.0%) |
| 19 to 25 Years | 459 (82.4%) | 98 (17.6%) |
| 26 to 34 Years | 893 (94.4%) | 53 (5.6%) |
| 35 to 44 Years | 979 (92.9%) | 75 (7.1%) |
| 45 to 54 Years | 1,184 (98.3%) | 20 (1.7%) |
| 55 to 64 Years | 857 (91.3%) | 82 (8.7%) |
| 65 to 74 Years | 963 (97.8%) | 22 (2.2%) |
| 75 Years and older | 607 (100.0%) | 0 (0.0%) |
| Total | 8,093 (95.8%) | 358 (4.2%) |
Health Insurance Coverage by Citizenship Status in Stevensville
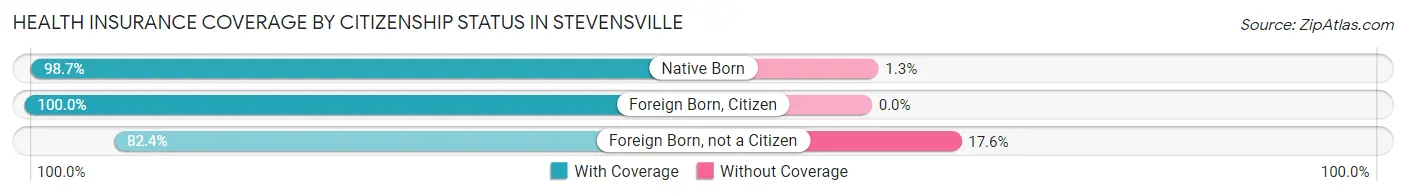
| Citizenship Status | With Coverage | Without Coverage |
| Native Born | 608 (98.7%) | 8 (1.3%) |
| Foreign Born, Citizen | 1,543 (100.0%) | 0 (0.0%) |
| Foreign Born, not a Citizen | 459 (82.4%) | 98 (17.6%) |
Health Insurance Coverage by Household Income in Stevensville
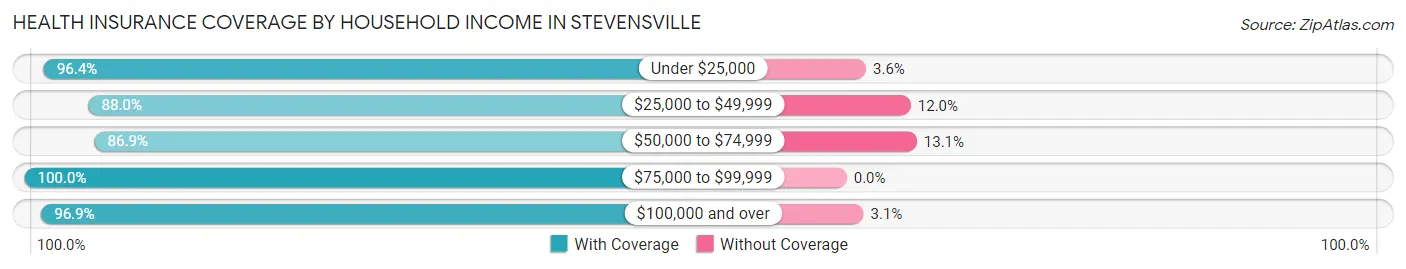
| Household Income | With Coverage | Without Coverage |
| Under $25,000 | 693 (96.4%) | 26 (3.6%) |
| $25,000 to $49,999 | 462 (88.0%) | 63 (12.0%) |
| $50,000 to $74,999 | 536 (86.9%) | 81 (13.1%) |
| $75,000 to $99,999 | 599 (100.0%) | 0 (0.0%) |
| $100,000 and over | 5,799 (96.9%) | 188 (3.1%) |
Public vs Private Health Insurance Coverage by Age in Stevensville
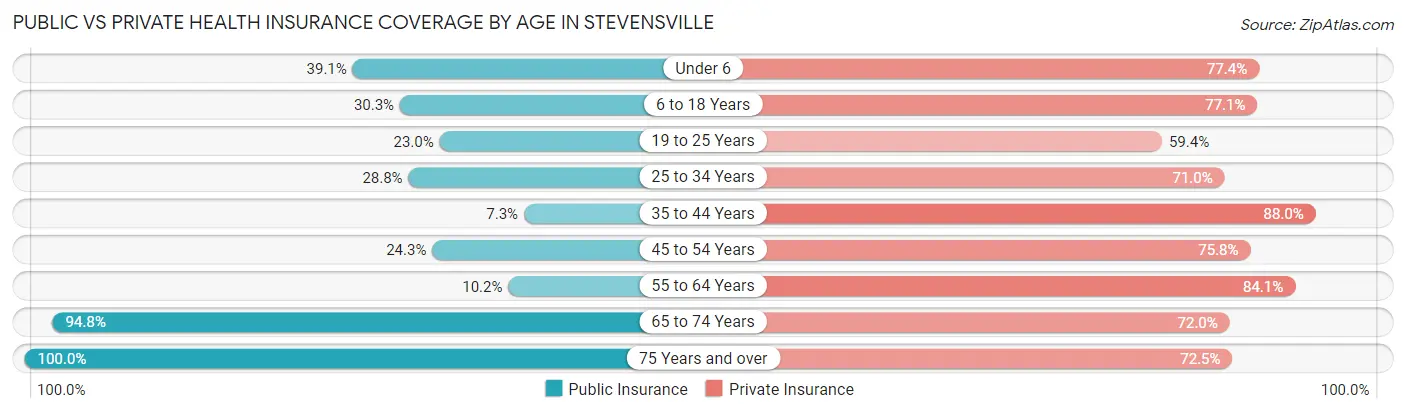
| Age Bracket | Public Insurance | Private Insurance |
| Under 6 | 241 (39.1%) | 477 (77.4%) |
| 6 to 18 Years | 468 (30.3%) | 1,190 (77.1%) |
| 19 to 25 Years | 128 (23.0%) | 331 (59.4%) |
| 25 to 34 Years | 272 (28.7%) | 672 (71.0%) |
| 35 to 44 Years | 77 (7.3%) | 927 (87.9%) |
| 45 to 54 Years | 293 (24.3%) | 913 (75.8%) |
| 55 to 64 Years | 96 (10.2%) | 790 (84.1%) |
| 65 to 74 Years | 934 (94.8%) | 709 (72.0%) |
| 75 Years and over | 607 (100.0%) | 440 (72.5%) |
| Total | 3,116 (36.9%) | 6,449 (76.3%) |
Disability Status by Sex by Age in Stevensville
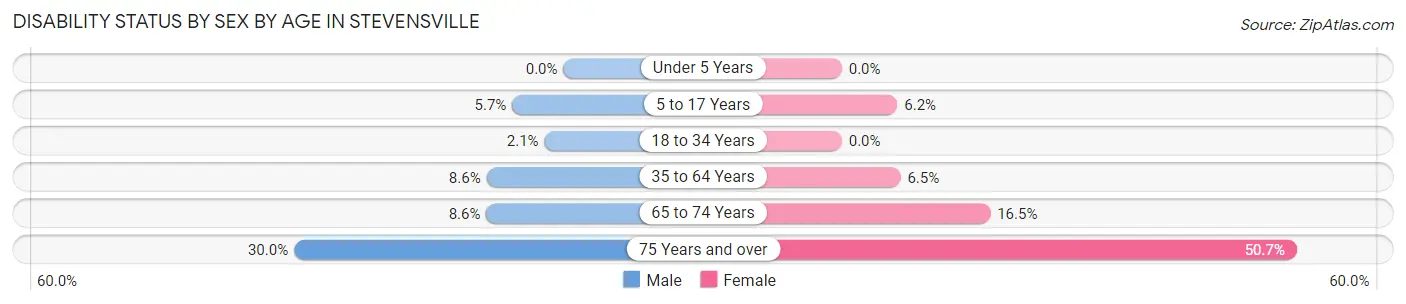
| Age Bracket | Male | Female |
| Under 5 Years | 0 (0.0%) | 0 (0.0%) |
| 5 to 17 Years | 52 (5.7%) | 39 (6.2%) |
| 18 to 34 Years | 17 (2.1%) | 0 (0.0%) |
| 35 to 64 Years | 140 (8.6%) | 102 (6.5%) |
| 65 to 74 Years | 44 (8.6%) | 78 (16.5%) |
| 75 Years and over | 69 (30.0%) | 191 (50.7%) |
Disability Class by Sex by Age in Stevensville
Disability Class: Hearing Difficulty
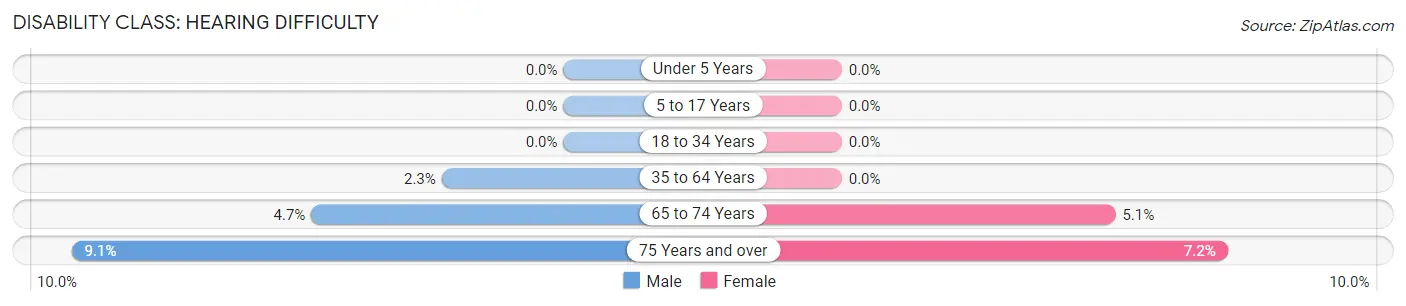
| Age Bracket | Male | Female |
| Under 5 Years | 0 (0.0%) | 0 (0.0%) |
| 5 to 17 Years | 0 (0.0%) | 0 (0.0%) |
| 18 to 34 Years | 0 (0.0%) | 0 (0.0%) |
| 35 to 64 Years | 37 (2.3%) | 0 (0.0%) |
| 65 to 74 Years | 24 (4.7%) | 24 (5.1%) |
| 75 Years and over | 21 (9.1%) | 27 (7.2%) |
Disability Class: Vision Difficulty
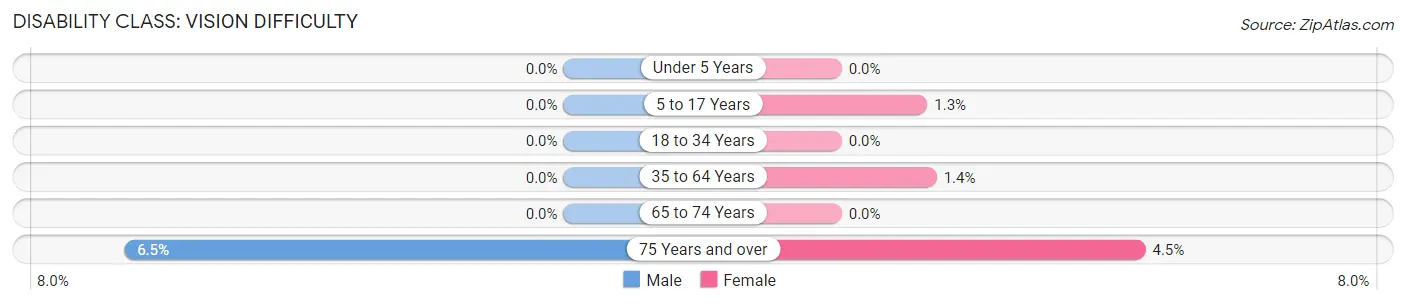
| Age Bracket | Male | Female |
| Under 5 Years | 0 (0.0%) | 0 (0.0%) |
| 5 to 17 Years | 0 (0.0%) | 8 (1.3%) |
| 18 to 34 Years | 0 (0.0%) | 0 (0.0%) |
| 35 to 64 Years | 0 (0.0%) | 22 (1.4%) |
| 65 to 74 Years | 0 (0.0%) | 0 (0.0%) |
| 75 Years and over | 15 (6.5%) | 17 (4.5%) |
Disability Class: Cognitive Difficulty
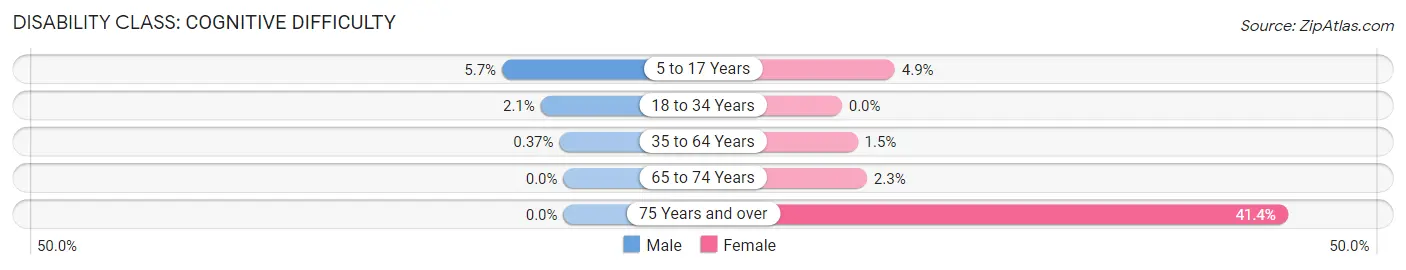
| Age Bracket | Male | Female |
| 5 to 17 Years | 52 (5.7%) | 31 (4.9%) |
| 18 to 34 Years | 17 (2.1%) | 0 (0.0%) |
| 35 to 64 Years | 6 (0.4%) | 23 (1.5%) |
| 65 to 74 Years | 0 (0.0%) | 11 (2.3%) |
| 75 Years and over | 0 (0.0%) | 156 (41.4%) |
Disability Class: Ambulatory Difficulty
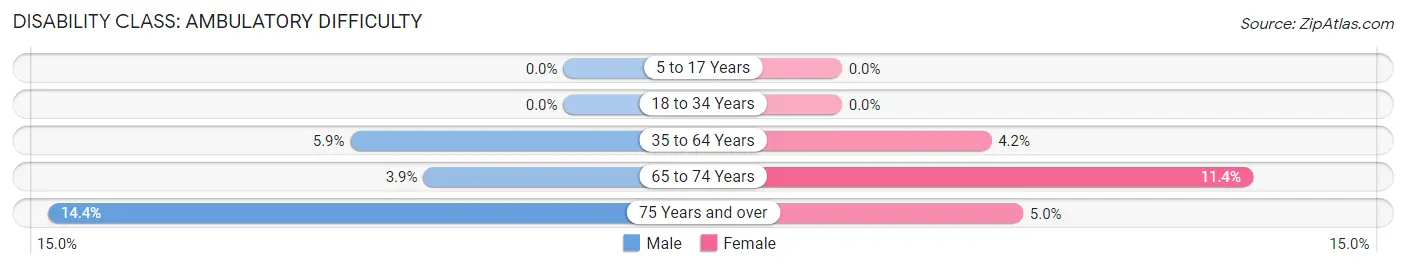
| Age Bracket | Male | Female |
| 5 to 17 Years | 0 (0.0%) | 0 (0.0%) |
| 18 to 34 Years | 0 (0.0%) | 0 (0.0%) |
| 35 to 64 Years | 97 (5.9%) | 65 (4.2%) |
| 65 to 74 Years | 20 (3.9%) | 54 (11.4%) |
| 75 Years and over | 33 (14.3%) | 19 (5.0%) |
Disability Class: Self-Care Difficulty
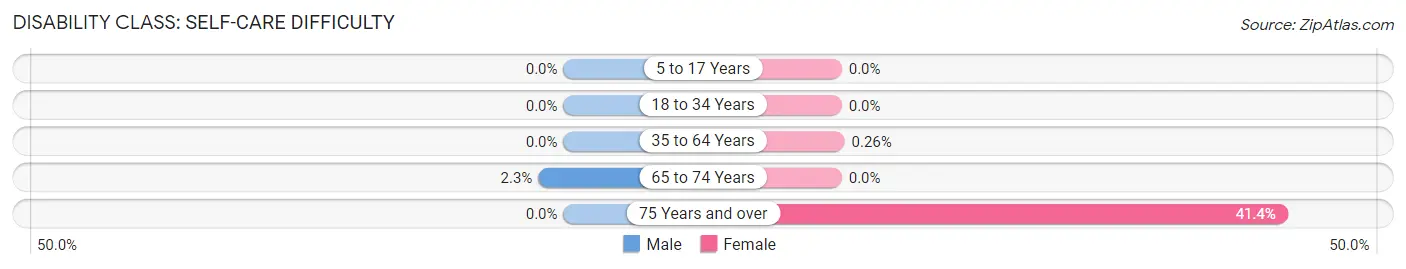
| Age Bracket | Male | Female |
| 5 to 17 Years | 0 (0.0%) | 0 (0.0%) |
| 18 to 34 Years | 0 (0.0%) | 0 (0.0%) |
| 35 to 64 Years | 0 (0.0%) | 4 (0.3%) |
| 65 to 74 Years | 12 (2.3%) | 0 (0.0%) |
| 75 Years and over | 0 (0.0%) | 156 (41.4%) |
Technology Access in Stevensville
Computing Device Access in Stevensville
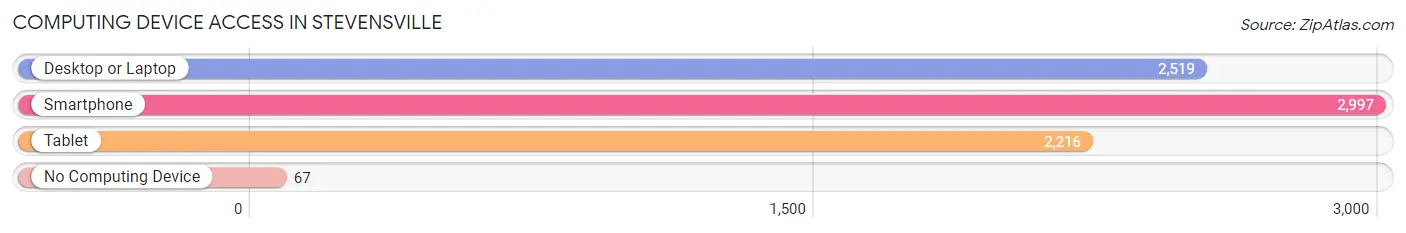
| Device Type | # Households | % Households |
| Desktop or Laptop | 2,519 | 78.3% |
| Smartphone | 2,997 | 93.2% |
| Tablet | 2,216 | 68.9% |
| No Computing Device | 67 | 2.1% |
| Total | 3,217 | 100.0% |
Internet Access in Stevensville
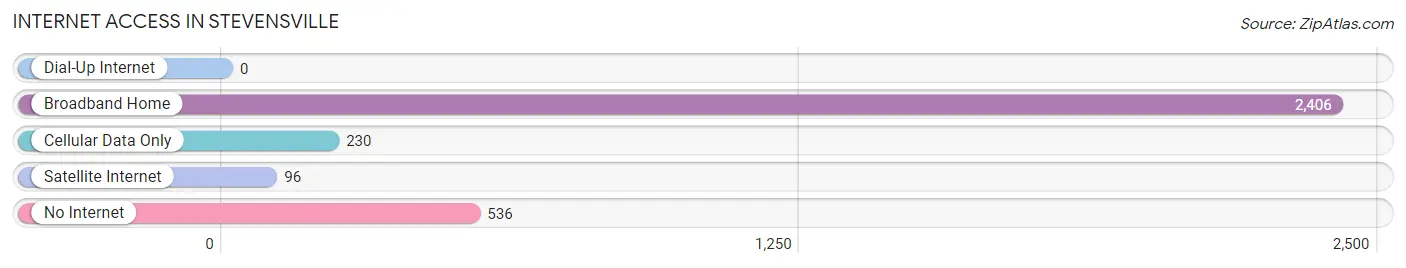
| Internet Type | # Households | % Households |
| Dial-Up Internet | 0 | 0.0% |
| Broadband Home | 2,406 | 74.8% |
| Cellular Data Only | 230 | 7.1% |
| Satellite Internet | 96 | 3.0% |
| No Internet | 536 | 16.7% |
| Total | 3,217 | 100.0% |
Stevensville Summary
Stevensville is a small town located in Queen Anne’s County, Maryland. It is situated on the Eastern Shore of the Chesapeake Bay, approximately 25 miles south of Annapolis and 40 miles east of Washington, D.C. The town has a population of approximately 2,400 people and covers an area of 1.2 square miles.
History
The area that is now Stevensville was first settled in the early 1700s by English colonists. The town was originally known as Broad Creek Landing, and was a major port of entry for goods and passengers traveling between the Eastern Shore and Baltimore. In 1810, the town was renamed Stevensville in honor of Colonel John Stevens, a prominent local landowner.
In the mid-1800s, the town became a popular summer resort destination for wealthy Baltimoreans. The town was home to several large hotels, including the Stevensville Hotel, which was built in 1845 and was the largest hotel on the Eastern Shore.
In the early 1900s, the town began to decline in popularity as a resort destination. However, the town remained a popular destination for fishing and crabbing. In the 1950s, the town began to experience a resurgence in popularity as a residential community.
Geography
Stevensville is located on the Eastern Shore of the Chesapeake Bay, approximately 25 miles south of Annapolis and 40 miles east of Washington, D.C. The town is situated on a peninsula, with the Chesapeake Bay to the west and the Chester River to the east. The town is bordered by the towns of Grasonville to the north, Chester to the east, and Kent Island to the south.
The town is located in a temperate climate, with mild winters and hot, humid summers. The average annual temperature is around 60 degrees Fahrenheit, with an average annual precipitation of around 45 inches.
Economy
The economy of Stevensville is largely based on tourism and retail. The town is home to several marinas, which attract visitors from all over the region. The town is also home to several restaurants, shops, and other businesses.
The town is also home to several large employers, including the Chesapeake Bay Maritime Museum, the Chesapeake Bay Environmental Center, and the Queen Anne’s County Public Schools.
Demographics
As of the 2010 census, the population of Stevensville was 2,403. The racial makeup of the town was 94.3% White, 2.2% African American, 0.7% Asian, 0.3% Native American, and 2.5% from other races. The median household income was $63,750, and the median family income was $76,250.
The town is home to a large number of retirees, with nearly 25% of the population over the age of 65. The town is also home to a large number of families, with nearly 40% of the population under the age of 18.
Common Questions
What is Per Capita Income in Stevensville?
Per Capita income in Stevensville is $51,493.
What is the Median Family Income in Stevensville?
Median Family Income in Stevensville is $143,767.
What is the Median Household income in Stevensville?
Median Household Income in Stevensville is $117,591.
What is Income or Wage Gap in Stevensville?
Income or Wage Gap in Stevensville is 44.7%.
Women in Stevensville earn 55.3 cents for every dollar earned by a man.
What is Inequality or Gini Index in Stevensville?
Inequality or Gini Index in Stevensville is 0.44.
What is the Total Population of Stevensville?
Total Population of Stevensville is 8,485.
What is the Total Male Population of Stevensville?
Total Male Population of Stevensville is 4,289.
What is the Total Female Population of Stevensville?
Total Female Population of Stevensville is 4,196.
What is the Ratio of Males per 100 Females in Stevensville?
There are 102.22 Males per 100 Females in Stevensville.
What is the Ratio of Females per 100 Males in Stevensville?
There are 97.83 Females per 100 Males in Stevensville.
What is the Median Population Age in Stevensville?
Median Population Age in Stevensville is 39.7 Years.
What is the Average Family Size in Stevensville
Average Family Size in Stevensville is 3.1 People.
What is the Average Household Size in Stevensville
Average Household Size in Stevensville is 2.6 People.
How Large is the Labor Force in Stevensville?
There are 4,805 People in the Labor Forcein in Stevensville.
What is the Percentage of People in the Labor Force in Stevensville?
70.9% of People are in the Labor Force in Stevensville.
What is the Unemployment Rate in Stevensville?
Unemployment Rate in Stevensville is 4.7%.