California, MD Map & Demographics
California Map
California Overview
$59,170
PER CAPITA INCOME
$142,143
AVG FAMILY INCOME
$112,385
AVG HOUSEHOLD INCOME
39.3%
WAGE / INCOME GAP [ % ]
60.7¢/ $1
WAGE / INCOME GAP [ $ ]
0.44
INEQUALITY / GINI INDEX
13,635
TOTAL POPULATION
7,069
MALE POPULATION
6,566
FEMALE POPULATION
107.66
MALES / 100 FEMALES
92.88
FEMALES / 100 MALES
35.7
MEDIAN AGE
3.3
AVG FAMILY SIZE
2.6
AVG HOUSEHOLD SIZE
8,301
LABOR FORCE [ PEOPLE ]
76.1%
PERCENT IN LABOR FORCE
1.2%
UNEMPLOYMENT RATE
California Zip Codes
California Area Codes
Income in California
Income Overview in California
Per Capita Income in California is $59,170, while median incomes of families and households are $142,143 and $112,385 respectively.
| Characteristic | Number | Measure |
| Per Capita Income | 13,635 | $59,170 |
| Median Family Income | 3,318 | $142,143 |
| Mean Family Income | 3,318 | $163,497 |
| Median Household Income | 5,131 | $112,385 |
| Mean Household Income | 5,131 | $151,952 |
| Income Deficit | 3,318 | $0 |
| Wage / Income Gap (%) | 13,635 | 39.26% |
| Wage / Income Gap ($) | 13,635 | 60.74¢ per $1 |
| Gini / Inequality Index | 13,635 | 0.44 |
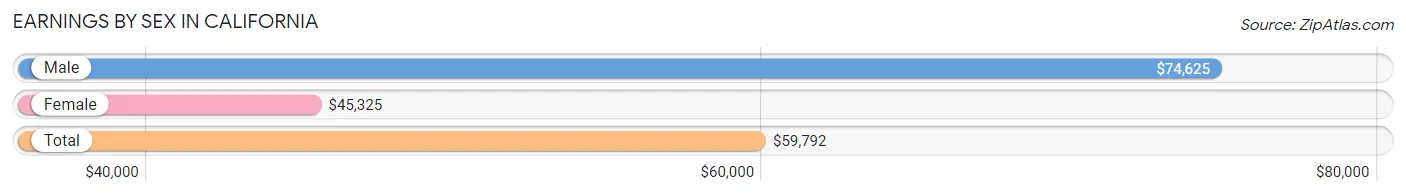
Earnings by Sex in California
Average Earnings in California are $59,792, $74,625 for men and $45,325 for women, a difference of 39.3%.
| Sex | Number | Average Earnings |
| Male | 4,938 (57.5%) | $74,625 |
| Female | 3,645 (42.5%) | $45,325 |
| Total | 8,583 (100.0%) | $59,792 |
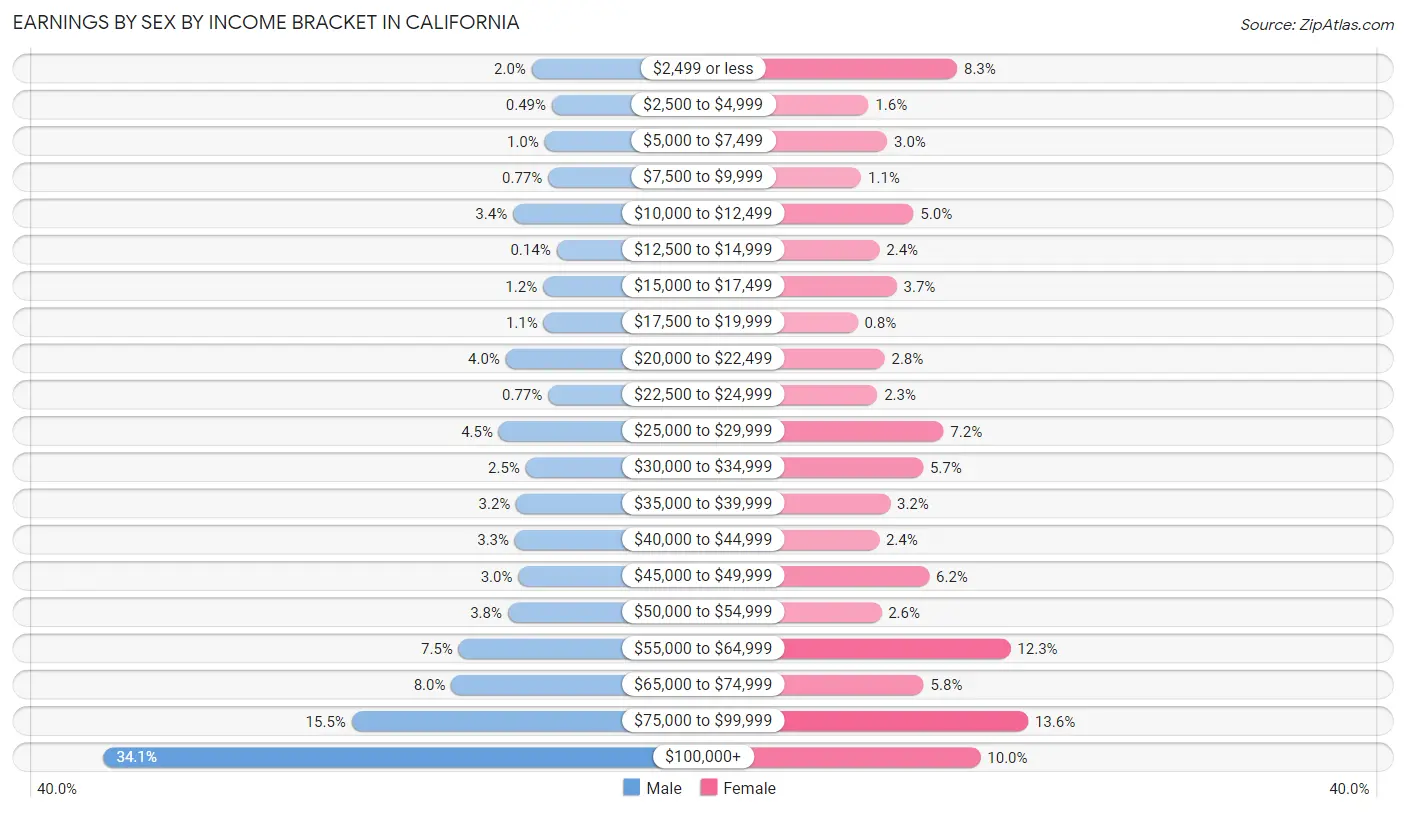
Earnings by Sex by Income Bracket in California
The most common earnings brackets in California are $100,000+ for men (1,683 | 34.1%) and $75,000 to $99,999 for women (495 | 13.6%).
| Income | Male | Female |
| $2,499 or less | 99 (2.0%) | 301 (8.3%) |
| $2,500 to $4,999 | 24 (0.5%) | 59 (1.6%) |
| $5,000 to $7,499 | 51 (1.0%) | 110 (3.0%) |
| $7,500 to $9,999 | 38 (0.8%) | 39 (1.1%) |
| $10,000 to $12,499 | 168 (3.4%) | 182 (5.0%) |
| $12,500 to $14,999 | 7 (0.1%) | 89 (2.4%) |
| $15,000 to $17,499 | 57 (1.1%) | 136 (3.7%) |
| $17,500 to $19,999 | 55 (1.1%) | 29 (0.8%) |
| $20,000 to $22,499 | 195 (4.0%) | 103 (2.8%) |
| $22,500 to $24,999 | 38 (0.8%) | 83 (2.3%) |
| $25,000 to $29,999 | 220 (4.5%) | 264 (7.2%) |
| $30,000 to $34,999 | 121 (2.5%) | 208 (5.7%) |
| $35,000 to $39,999 | 156 (3.2%) | 118 (3.2%) |
| $40,000 to $44,999 | 161 (3.3%) | 88 (2.4%) |
| $45,000 to $49,999 | 148 (3.0%) | 225 (6.2%) |
| $50,000 to $54,999 | 187 (3.8%) | 94 (2.6%) |
| $55,000 to $64,999 | 369 (7.5%) | 447 (12.3%) |
| $65,000 to $74,999 | 396 (8.0%) | 210 (5.8%) |
| $75,000 to $99,999 | 765 (15.5%) | 495 (13.6%) |
| $100,000+ | 1,683 (34.1%) | 365 (10.0%) |
| Total | 4,938 (100.0%) | 3,645 (100.0%) |
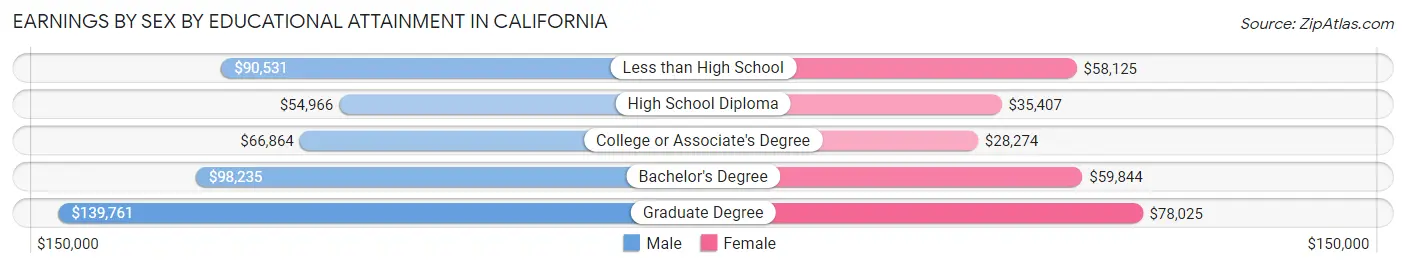
Earnings by Sex by Educational Attainment in California
Average earnings in California are $83,686 for men and $49,174 for women, a difference of 41.2%. Men with an educational attainment of graduate degree enjoy the highest average annual earnings of $139,761, while those with high school diploma education earn the least with $54,966. Women with an educational attainment of graduate degree earn the most with the average annual earnings of $78,025, while those with college or associate's degree education have the smallest earnings of $28,274.
| Educational Attainment | Male Income | Female Income |
| Less than High School | $90,531 | $58,125 |
| High School Diploma | $54,966 | $35,407 |
| College or Associate's Degree | $66,864 | $28,274 |
| Bachelor's Degree | $98,235 | $59,844 |
| Graduate Degree | $139,761 | $78,025 |
| Total | $83,686 | $49,174 |
Family Income in California
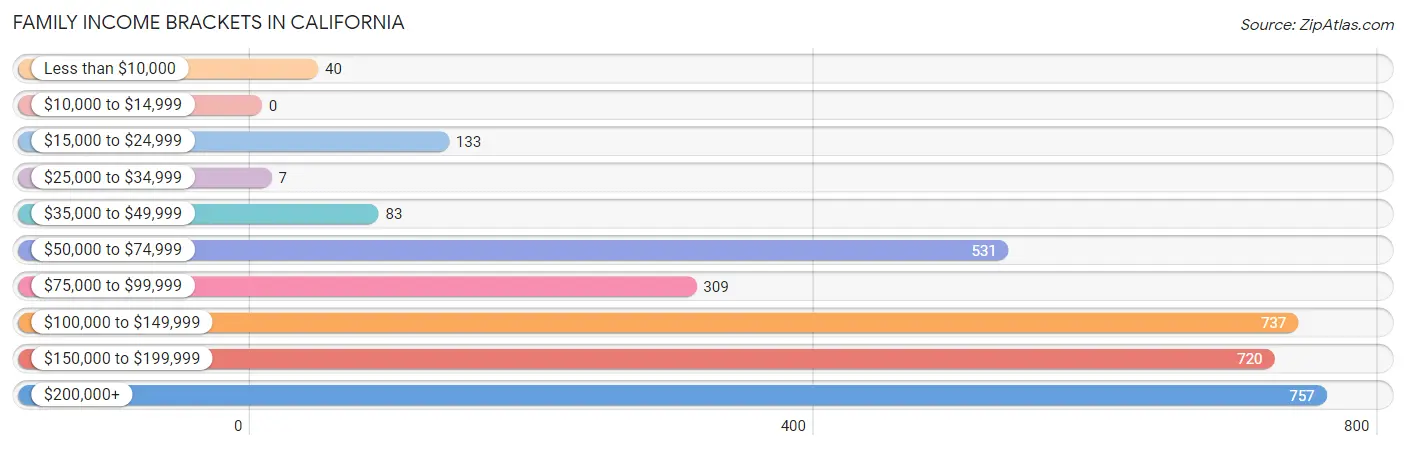
Family Income Brackets in California
According to the California family income data, there are 757 families falling into the $200,000+ income range, which is the most common income bracket and makes up 22.8% of all families.
| Income Bracket | # Families | % Families |
| Less than $10,000 | 40 | 1.2% |
| $10,000 to $14,999 | 0 | 0.0% |
| $15,000 to $24,999 | 133 | 4.0% |
| $25,000 to $34,999 | 7 | 0.2% |
| $35,000 to $49,999 | 83 | 2.5% |
| $50,000 to $74,999 | 531 | 16.0% |
| $75,000 to $99,999 | 309 | 9.3% |
| $100,000 to $149,999 | 737 | 22.2% |
| $150,000 to $199,999 | 720 | 21.7% |
| $200,000+ | 757 | 22.8% |
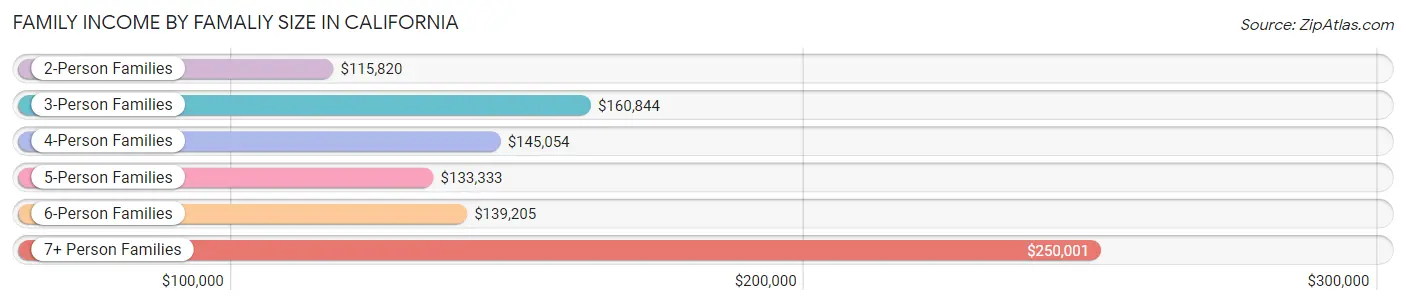
Family Income by Famaliy Size in California
7+ person families (81 | 2.4%) account for the highest median family income in California with $250,001 per family, while 2-person families (1,470 | 44.3%) have the highest median income of $57,910 per family member.
| Income Bracket | # Families | Median Income |
| 2-Person Families | 1,470 (44.3%) | $115,820 |
| 3-Person Families | 701 (21.1%) | $160,844 |
| 4-Person Families | 577 (17.4%) | $145,054 |
| 5-Person Families | 396 (11.9%) | $133,333 |
| 6-Person Families | 93 (2.8%) | $139,205 |
| 7+ Person Families | 81 (2.4%) | $250,001 |
| Total | 3,318 (100.0%) | $142,143 |
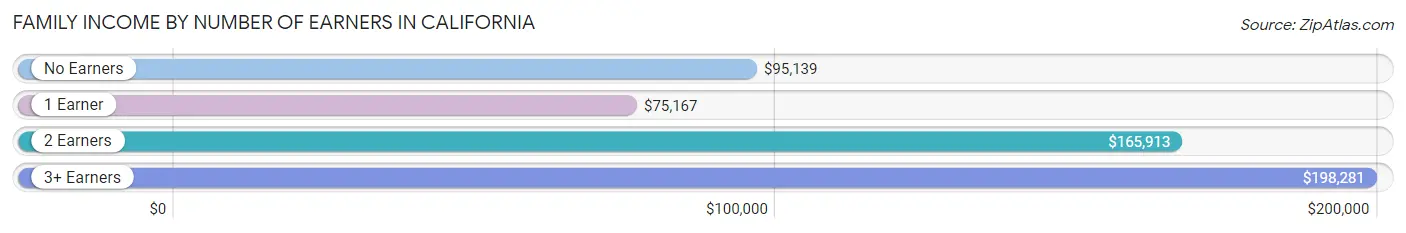
Family Income by Number of Earners in California
The median family income in California is $142,143, with families comprising 3+ earners (633) having the highest median family income of $198,281, while families with 1 earner (1,066) have the lowest median family income of $75,167, accounting for 19.1% and 32.1% of families, respectively.
| Number of Earners | # Families | Median Income |
| No Earners | 158 (4.8%) | $95,139 |
| 1 Earner | 1,066 (32.1%) | $75,167 |
| 2 Earners | 1,461 (44.0%) | $165,913 |
| 3+ Earners | 633 (19.1%) | $198,281 |
| Total | 3,318 (100.0%) | $142,143 |
Household Income in California
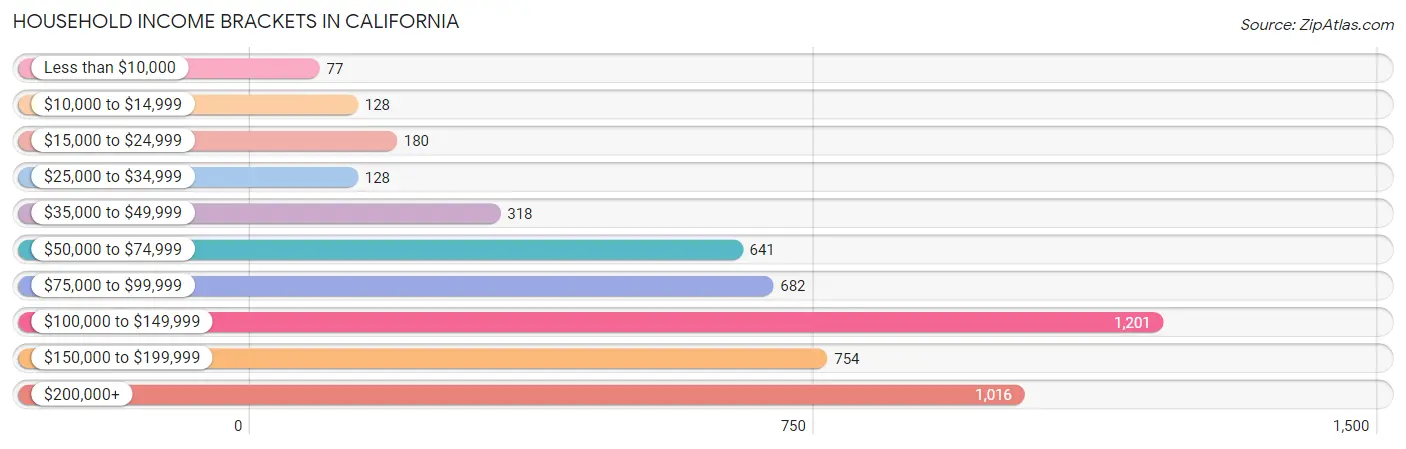
Household Income Brackets in California
With 1,201 households falling in the category, the $100,000 to $149,999 income range is the most frequent in California, accounting for 23.4% of all households. In contrast, only 77 households (1.5%) fall into the less than $10,000 income bracket, making it the least populous group.
| Income Bracket | # Households | % Households |
| Less than $10,000 | 77 | 1.5% |
| $10,000 to $14,999 | 128 | 2.5% |
| $15,000 to $24,999 | 180 | 3.5% |
| $25,000 to $34,999 | 128 | 2.5% |
| $35,000 to $49,999 | 318 | 6.2% |
| $50,000 to $74,999 | 641 | 12.5% |
| $75,000 to $99,999 | 682 | 13.3% |
| $100,000 to $149,999 | 1,201 | 23.4% |
| $150,000 to $199,999 | 754 | 14.7% |
| $200,000+ | 1,016 | 19.8% |
Household Income by Householder Age in California
The median household income in California is $112,385, with the highest median household income of $131,635 found in the 45 to 64 years age bracket for the primary householder. A total of 2,079 households (40.5%) fall into this category. Meanwhile, the 15 to 24 years age bracket for the primary householder has the lowest median household income of $0, with 46 households (0.9%) in this group.
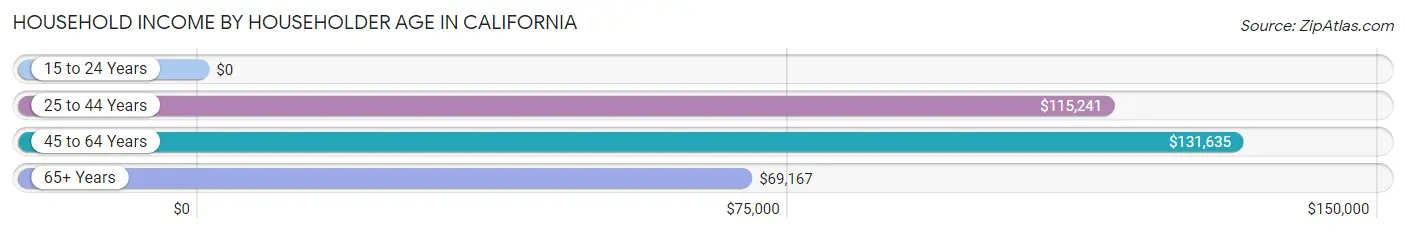
| Income Bracket | # Households | Median Income |
| 15 to 24 Years | 46 (0.9%) | $0 |
| 25 to 44 Years | 2,132 (41.5%) | $115,241 |
| 45 to 64 Years | 2,079 (40.5%) | $131,635 |
| 65+ Years | 874 (17.0%) | $69,167 |
| Total | 5,131 (100.0%) | $112,385 |
Poverty in California
Income Below Poverty by Sex and Age in California
With 4.2% poverty level for males and 8.1% for females among the residents of California, 5 year old males and 25 to 34 year old females are the most vulnerable to poverty, with 86 males (48.0%) and 195 females (18.8%) in their respective age groups living below the poverty level.
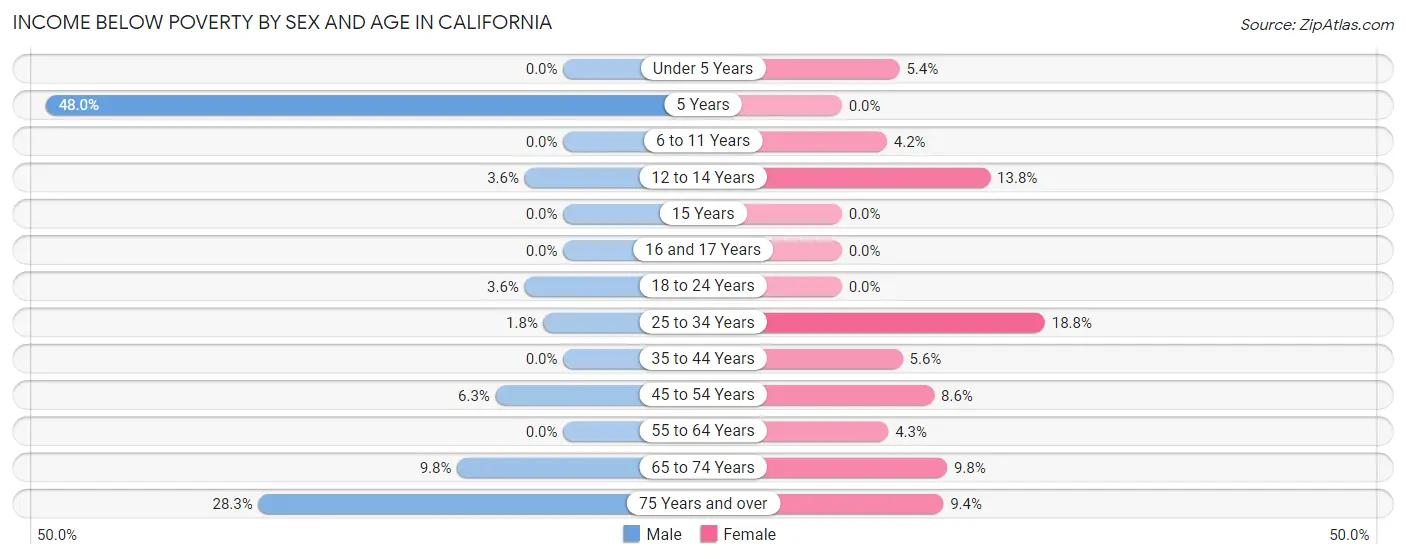
| Age Bracket | Male | Female |
| Under 5 Years | 0 (0.0%) | 20 (5.3%) |
| 5 Years | 86 (48.0%) | 0 (0.0%) |
| 6 to 11 Years | 0 (0.0%) | 20 (4.2%) |
| 12 to 14 Years | 10 (3.6%) | 50 (13.8%) |
| 15 Years | 0 (0.0%) | 0 (0.0%) |
| 16 and 17 Years | 0 (0.0%) | 0 (0.0%) |
| 18 to 24 Years | 25 (3.6%) | 0 (0.0%) |
| 25 to 34 Years | 25 (1.8%) | 195 (18.8%) |
| 35 to 44 Years | 0 (0.0%) | 46 (5.6%) |
| 45 to 54 Years | 61 (6.3%) | 80 (8.6%) |
| 55 to 64 Years | 0 (0.0%) | 41 (4.3%) |
| 65 to 74 Years | 43 (9.8%) | 52 (9.8%) |
| 75 Years and over | 43 (28.3%) | 24 (9.4%) |
| Total | 293 (4.2%) | 528 (8.1%) |
Income Above Poverty by Sex and Age in California
According to the poverty statistics in California, males aged under 5 years and females aged 5 years are the age groups that are most secure financially, with 100.0% of males and 100.0% of females in these age groups living above the poverty line.
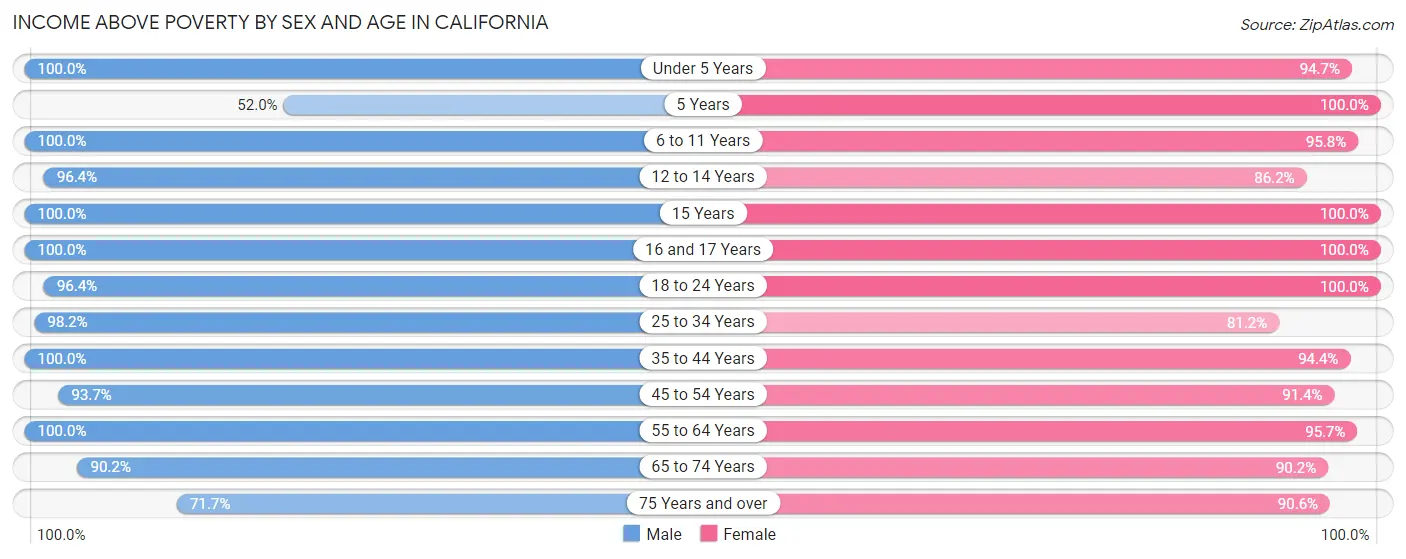
| Age Bracket | Male | Female |
| Under 5 Years | 261 (100.0%) | 354 (94.7%) |
| 5 Years | 93 (52.0%) | 81 (100.0%) |
| 6 to 11 Years | 554 (100.0%) | 459 (95.8%) |
| 12 to 14 Years | 269 (96.4%) | 313 (86.2%) |
| 15 Years | 51 (100.0%) | 86 (100.0%) |
| 16 and 17 Years | 213 (100.0%) | 230 (100.0%) |
| 18 to 24 Years | 672 (96.4%) | 419 (100.0%) |
| 25 to 34 Years | 1,346 (98.2%) | 840 (81.2%) |
| 35 to 44 Years | 980 (100.0%) | 769 (94.4%) |
| 45 to 54 Years | 910 (93.7%) | 854 (91.4%) |
| 55 to 64 Years | 914 (100.0%) | 911 (95.7%) |
| 65 to 74 Years | 394 (90.2%) | 481 (90.2%) |
| 75 Years and over | 109 (71.7%) | 231 (90.6%) |
| Total | 6,766 (95.9%) | 6,028 (91.9%) |
Income Below Poverty Among Married-Couple Families in California
The poverty statistics for married-couple families in California show that 1.7% or 44 of the total 2,599 families live below the poverty line. Families with 1 or 2 children have the highest poverty rate of 2.1%, comprising of 20 families. On the other hand, families with 3 or 4 children have the lowest poverty rate of 0.0%, which includes 0 families.
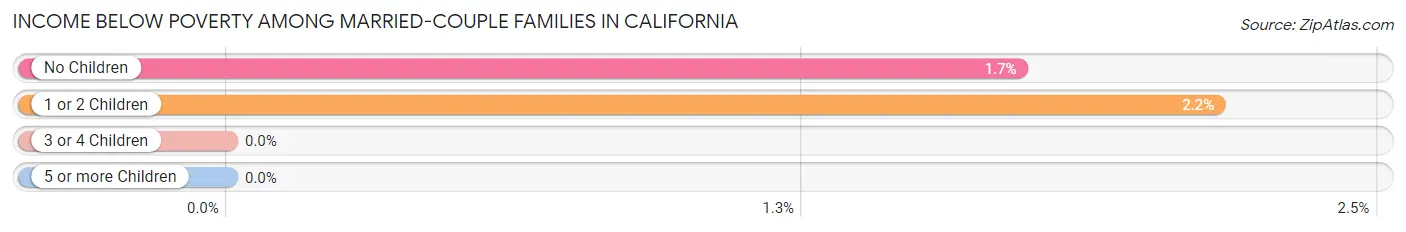
| Children | Above Poverty | Below Poverty |
| No Children | 1,375 (98.3%) | 24 (1.7%) |
| 1 or 2 Children | 911 (97.9%) | 20 (2.1%) |
| 3 or 4 Children | 263 (100.0%) | 0 (0.0%) |
| 5 or more Children | 6 (100.0%) | 0 (0.0%) |
| Total | 2,555 (98.3%) | 44 (1.7%) |
Income Below Poverty Among Single-Parent Households in California
According to the poverty data in California, 15.3% or 51 single-father households and 18.6% or 72 single-mother households are living below the poverty line. Among single-father households, those with 1 or 2 children have the highest poverty rate, with 51 households (32.7%) experiencing poverty. Likewise, among single-mother households, those with 3 or 4 children have the highest poverty rate, with 12 households (21.4%) falling below the poverty line.
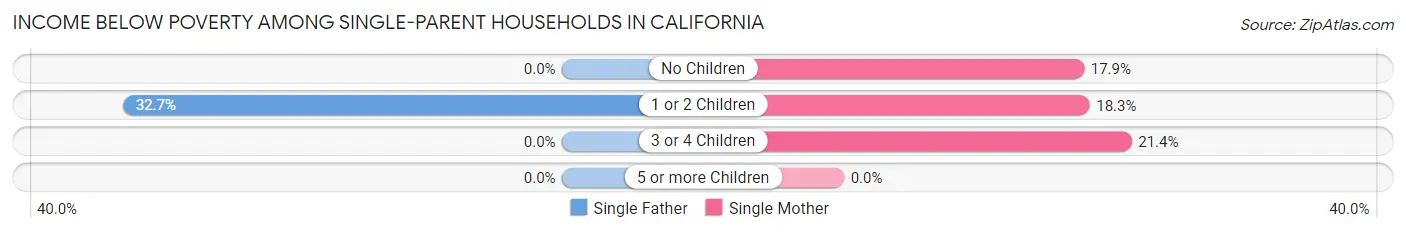
| Children | Single Father | Single Mother |
| No Children | 0 (0.0%) | 17 (17.9%) |
| 1 or 2 Children | 51 (32.7%) | 43 (18.3%) |
| 3 or 4 Children | 0 (0.0%) | 12 (21.4%) |
| 5 or more Children | 0 (0.0%) | 0 (0.0%) |
| Total | 51 (15.3%) | 72 (18.6%) |
Income Below Poverty Among Married-Couple vs Single-Parent Households in California
The poverty data for California shows that 44 of the married-couple family households (1.7%) and 123 of the single-parent households (17.1%) are living below the poverty level. Within the married-couple family households, those with 1 or 2 children have the highest poverty rate, with 20 households (2.1%) falling below the poverty line. Among the single-parent households, those with 1 or 2 children have the highest poverty rate, with 94 household (24.0%) living below poverty.
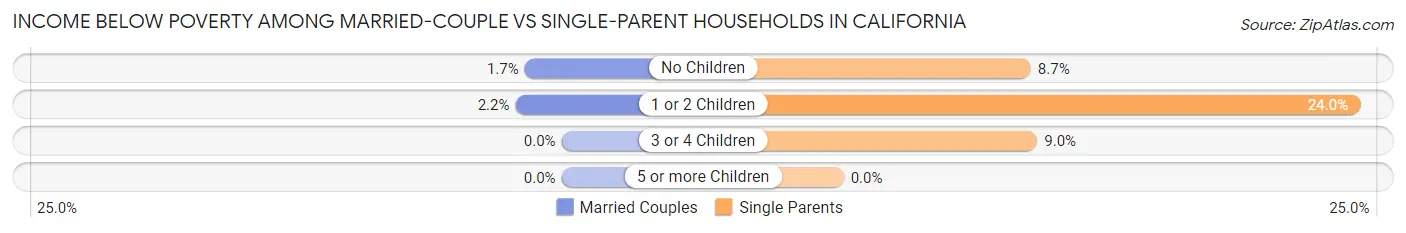
| Children | Married-Couple Families | Single-Parent Households |
| No Children | 24 (1.7%) | 17 (8.7%) |
| 1 or 2 Children | 20 (2.1%) | 94 (24.0%) |
| 3 or 4 Children | 0 (0.0%) | 12 (9.0%) |
| 5 or more Children | 0 (0.0%) | 0 (0.0%) |
| Total | 44 (1.7%) | 123 (17.1%) |
Race in California
The most populous races in California are White / Caucasian (8,291 | 60.8%), Black / African American (3,467 | 25.4%), and Hispanic or Latino (1,131 | 8.3%).
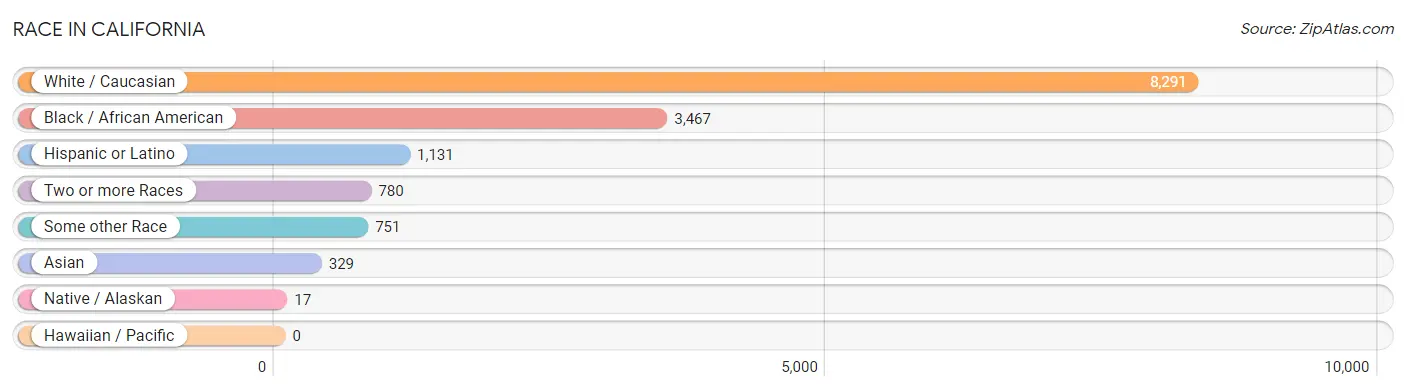
| Race | # Population | % Population |
| Asian | 329 | 2.4% |
| Black / African American | 3,467 | 25.4% |
| Hawaiian / Pacific | 0 | 0.0% |
| Hispanic or Latino | 1,131 | 8.3% |
| Native / Alaskan | 17 | 0.1% |
| White / Caucasian | 8,291 | 60.8% |
| Two or more Races | 780 | 5.7% |
| Some other Race | 751 | 5.5% |
| Total | 13,635 | 100.0% |
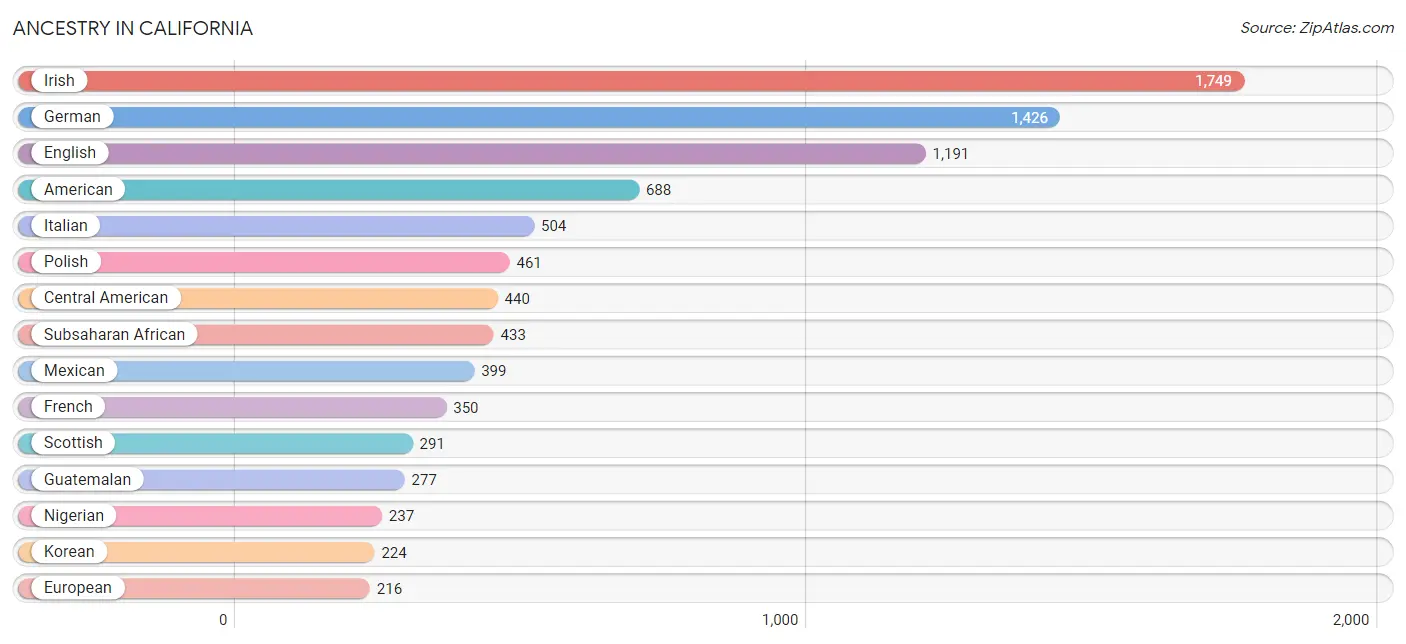
Ancestry in California
The most populous ancestries reported in California are Irish (1,749 | 12.8%), German (1,426 | 10.5%), English (1,191 | 8.7%), American (688 | 5.1%), and Italian (504 | 3.7%), together accounting for 40.8% of all California residents.
| Ancestry | # Population | % Population |
| African | 196 | 1.4% |
| American | 688 | 5.1% |
| Arab | 6 | 0.0% |
| Armenian | 7 | 0.1% |
| Australian | 8 | 0.1% |
| Austrian | 19 | 0.1% |
| Belgian | 39 | 0.3% |
| Bhutanese | 100 | 0.7% |
| Blackfeet | 72 | 0.5% |
| British | 81 | 0.6% |
| Burmese | 116 | 0.9% |
| Central American | 440 | 3.2% |
| Cherokee | 11 | 0.1% |
| Colombian | 34 | 0.3% |
| Czech | 34 | 0.3% |
| Czechoslovakian | 56 | 0.4% |
| Danish | 45 | 0.3% |
| Dominican | 1 | 0.0% |
| Dutch | 37 | 0.3% |
| Eastern European | 57 | 0.4% |
| Ecuadorian | 7 | 0.1% |
| English | 1,191 | 8.7% |
| Estonian | 8 | 0.1% |
| European | 216 | 1.6% |
| French | 350 | 2.6% |
| French American Indian | 5 | 0.0% |
| French Canadian | 70 | 0.5% |
| German | 1,426 | 10.5% |
| Greek | 156 | 1.1% |
| Guatemalan | 277 | 2.0% |
| Haitian | 11 | 0.1% |
| Hungarian | 105 | 0.8% |
| Inupiat | 8 | 0.1% |
| Iranian | 169 | 1.2% |
| Irish | 1,749 | 12.8% |
| Iroquois | 72 | 0.5% |
| Italian | 504 | 3.7% |
| Korean | 224 | 1.6% |
| Lebanese | 6 | 0.0% |
| Lithuanian | 12 | 0.1% |
| Mexican | 399 | 2.9% |
| Nicaraguan | 15 | 0.1% |
| Nigerian | 237 | 1.7% |
| Northern European | 6 | 0.0% |
| Norwegian | 136 | 1.0% |
| Pakistani | 37 | 0.3% |
| Panamanian | 43 | 0.3% |
| Peruvian | 119 | 0.9% |
| Polish | 461 | 3.4% |
| Portuguese | 14 | 0.1% |
| Puerto Rican | 109 | 0.8% |
| Russian | 112 | 0.8% |
| Salvadoran | 105 | 0.8% |
| Scandinavian | 120 | 0.9% |
| Scotch-Irish | 85 | 0.6% |
| Scottish | 291 | 2.1% |
| Sioux | 9 | 0.1% |
| Slavic | 16 | 0.1% |
| Slovak | 32 | 0.2% |
| South American | 160 | 1.2% |
| Spanish | 22 | 0.2% |
| Sri Lankan | 64 | 0.5% |
| Subsaharan African | 433 | 3.2% |
| Swedish | 103 | 0.8% |
| Thai | 134 | 1.0% |
| Ukrainian | 17 | 0.1% |
| Welsh | 181 | 1.3% |
| West Indian | 12 | 0.1% | View All 68 Rows |
Immigrants in California
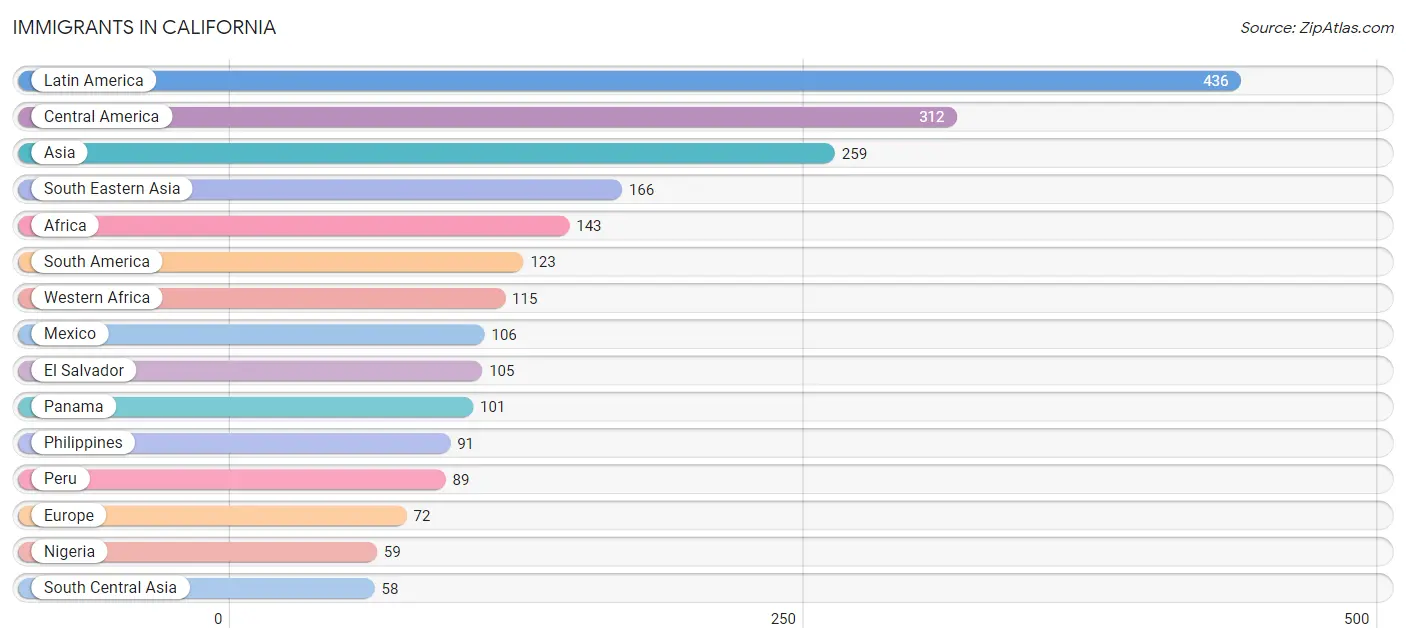
The most numerous immigrant groups reported in California came from Latin America (436 | 3.2%), Central America (312 | 2.3%), Asia (259 | 1.9%), South Eastern Asia (166 | 1.2%), and Africa (143 | 1.1%), together accounting for 9.7% of all California residents.
| Immigration Origin | # Population | % Population |
| Africa | 143 | 1.1% |
| Asia | 259 | 1.9% |
| Australia | 8 | 0.1% |
| Canada | 5 | 0.0% |
| Caribbean | 1 | 0.0% |
| Central America | 312 | 2.3% |
| Colombia | 34 | 0.3% |
| Cuba | 1 | 0.0% |
| Eastern Asia | 35 | 0.3% |
| Egypt | 28 | 0.2% |
| El Salvador | 105 | 0.8% |
| Europe | 72 | 0.5% |
| Germany | 35 | 0.3% |
| Ghana | 34 | 0.3% |
| India | 49 | 0.4% |
| Korea | 35 | 0.3% |
| Latin America | 436 | 3.2% |
| Mexico | 106 | 0.8% |
| Nigeria | 59 | 0.4% |
| Northern Africa | 28 | 0.2% |
| Northern Europe | 23 | 0.2% |
| Oceania | 8 | 0.1% |
| Pakistan | 9 | 0.1% |
| Panama | 101 | 0.7% |
| Peru | 89 | 0.6% |
| Philippines | 91 | 0.7% |
| Portugal | 14 | 0.1% |
| South America | 123 | 0.9% |
| South Central Asia | 58 | 0.4% |
| South Eastern Asia | 166 | 1.2% |
| Southern Europe | 14 | 0.1% |
| Thailand | 37 | 0.3% |
| Vietnam | 38 | 0.3% |
| Western Africa | 115 | 0.8% |
| Western Europe | 35 | 0.3% | View All 35 Rows |
Sex and Age in California
Sex and Age in California
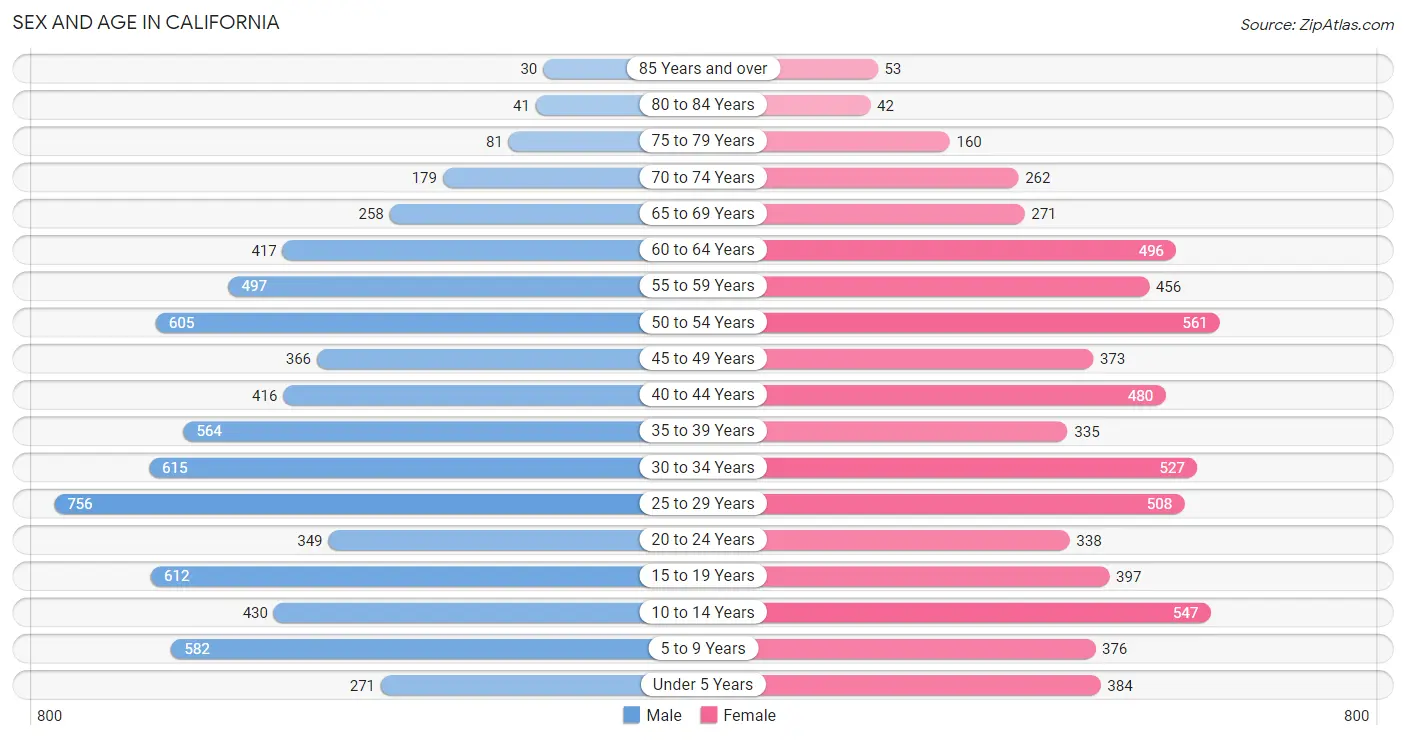
The most populous age groups in California are 25 to 29 Years (756 | 10.7%) for men and 50 to 54 Years (561 | 8.5%) for women.
| Age Bracket | Male | Female |
| Under 5 Years | 271 (3.8%) | 384 (5.9%) |
| 5 to 9 Years | 582 (8.2%) | 376 (5.7%) |
| 10 to 14 Years | 430 (6.1%) | 547 (8.3%) |
| 15 to 19 Years | 612 (8.7%) | 397 (6.0%) |
| 20 to 24 Years | 349 (4.9%) | 338 (5.1%) |
| 25 to 29 Years | 756 (10.7%) | 508 (7.7%) |
| 30 to 34 Years | 615 (8.7%) | 527 (8.0%) |
| 35 to 39 Years | 564 (8.0%) | 335 (5.1%) |
| 40 to 44 Years | 416 (5.9%) | 480 (7.3%) |
| 45 to 49 Years | 366 (5.2%) | 373 (5.7%) |
| 50 to 54 Years | 605 (8.6%) | 561 (8.5%) |
| 55 to 59 Years | 497 (7.0%) | 456 (6.9%) |
| 60 to 64 Years | 417 (5.9%) | 496 (7.5%) |
| 65 to 69 Years | 258 (3.6%) | 271 (4.1%) |
| 70 to 74 Years | 179 (2.5%) | 262 (4.0%) |
| 75 to 79 Years | 81 (1.1%) | 160 (2.4%) |
| 80 to 84 Years | 41 (0.6%) | 42 (0.6%) |
| 85 Years and over | 30 (0.4%) | 53 (0.8%) |
| Total | 7,069 (100.0%) | 6,566 (100.0%) |
Families and Households in California
Median Family Size in California
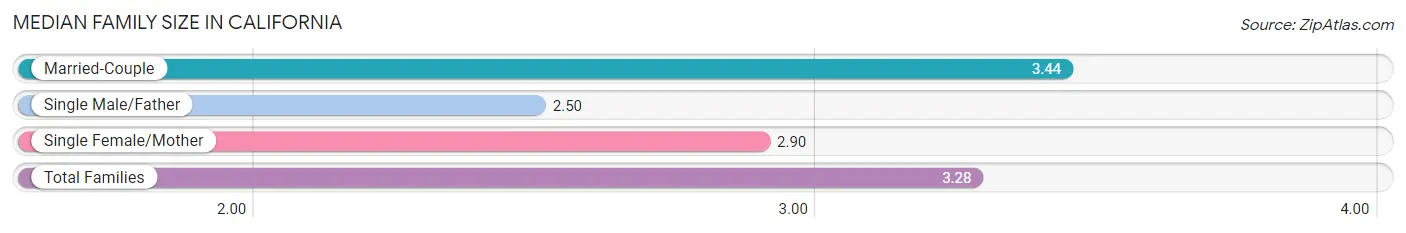
The median family size in California is 3.28 persons per family, with married-couple families (2,599 | 78.3%) accounting for the largest median family size of 3.44 persons per family. On the other hand, single male/father families (333 | 10.0%) represent the smallest median family size with 2.50 persons per family.
| Family Type | # Families | Family Size |
| Married-Couple | 2,599 (78.3%) | 3.44 |
| Single Male/Father | 333 (10.0%) | 2.50 |
| Single Female/Mother | 386 (11.6%) | 2.90 |
| Total Families | 3,318 (100.0%) | 3.28 |
Median Household Size in California
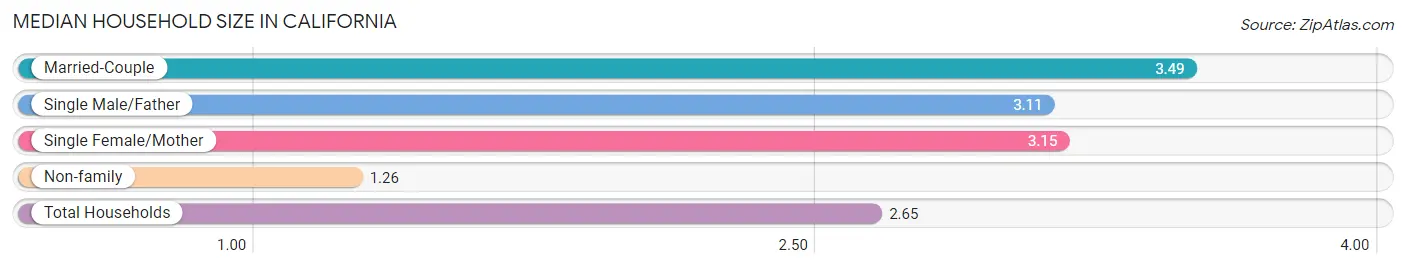
The median household size in California is 2.65 persons per household, with married-couple households (2,599 | 50.6%) accounting for the largest median household size of 3.49 persons per household. non-family households (1,813 | 35.3%) represent the smallest median household size with 1.26 persons per household.
| Household Type | # Households | Household Size |
| Married-Couple | 2,599 (50.6%) | 3.49 |
| Single Male/Father | 333 (6.5%) | 3.11 |
| Single Female/Mother | 386 (7.5%) | 3.15 |
| Non-family | 1,813 (35.3%) | 1.26 |
| Total Households | 5,131 (100.0%) | 2.65 |
Household Size by Marriage Status in California
Out of a total of 5,131 households in California, 3,318 (64.7%) are family households, while 1,813 (35.3%) are nonfamily households. The most numerous type of family households are 2-person households, comprising 1,257, and the most common type of nonfamily households are 1-person households, comprising 1,417.
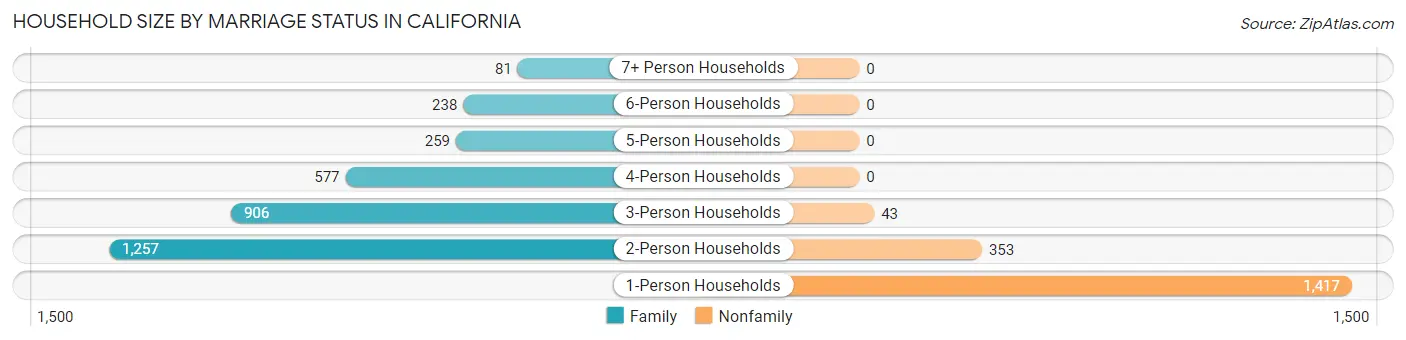
| Household Size | Family Households | Nonfamily Households |
| 1-Person Households | - | 1,417 (27.6%) |
| 2-Person Households | 1,257 (24.5%) | 353 (6.9%) |
| 3-Person Households | 906 (17.7%) | 43 (0.8%) |
| 4-Person Households | 577 (11.3%) | 0 (0.0%) |
| 5-Person Households | 259 (5.1%) | 0 (0.0%) |
| 6-Person Households | 238 (4.6%) | 0 (0.0%) |
| 7+ Person Households | 81 (1.6%) | 0 (0.0%) |
| Total | 3,318 (64.7%) | 1,813 (35.3%) |
Female Fertility in California
Fertility by Age in California
Average fertility rate in California is 21.0 births per 1,000 women. Women in the age bracket of 20 to 34 years have the highest fertility rate with 28.0 births per 1,000 women. Women in the age bracket of 20 to 34 years acount for 59.1% of all women with births.
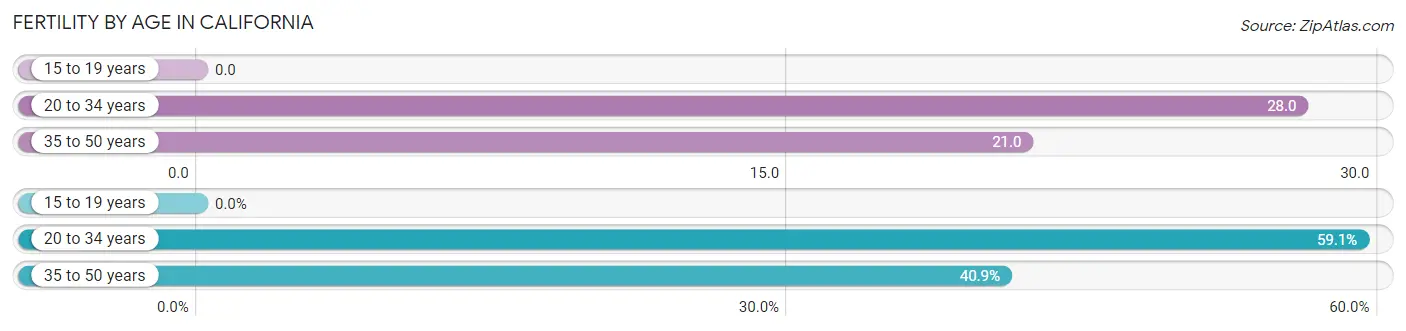
| Age Bracket | Women with Births | Births / 1,000 Women |
| 15 to 19 years | 0 (0.0%) | 0.0 |
| 20 to 34 years | 39 (59.1%) | 28.0 |
| 35 to 50 years | 27 (40.9%) | 21.0 |
| Total | 66 (100.0%) | 21.0 |
Fertility by Age by Marriage Status in California
89.4% of women with births (66) in California are married. The highest percentage of unmarried women with births falls into 20 to 34 years age bracket with 17.9% of them unmarried at the time of birth, while the lowest percentage of unmarried women with births belong to 35 to 50 years age bracket with 0.0% of them unmarried.
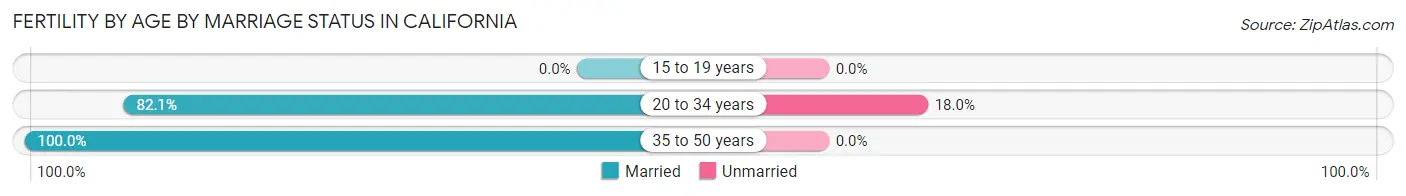
| Age Bracket | Married | Unmarried |
| 15 to 19 years | 0 (0.0%) | 0 (0.0%) |
| 20 to 34 years | 32 (82.1%) | 7 (17.9%) |
| 35 to 50 years | 27 (100.0%) | 0 (0.0%) |
| Total | 59 (89.4%) | 7 (10.6%) |
Fertility by Education in California
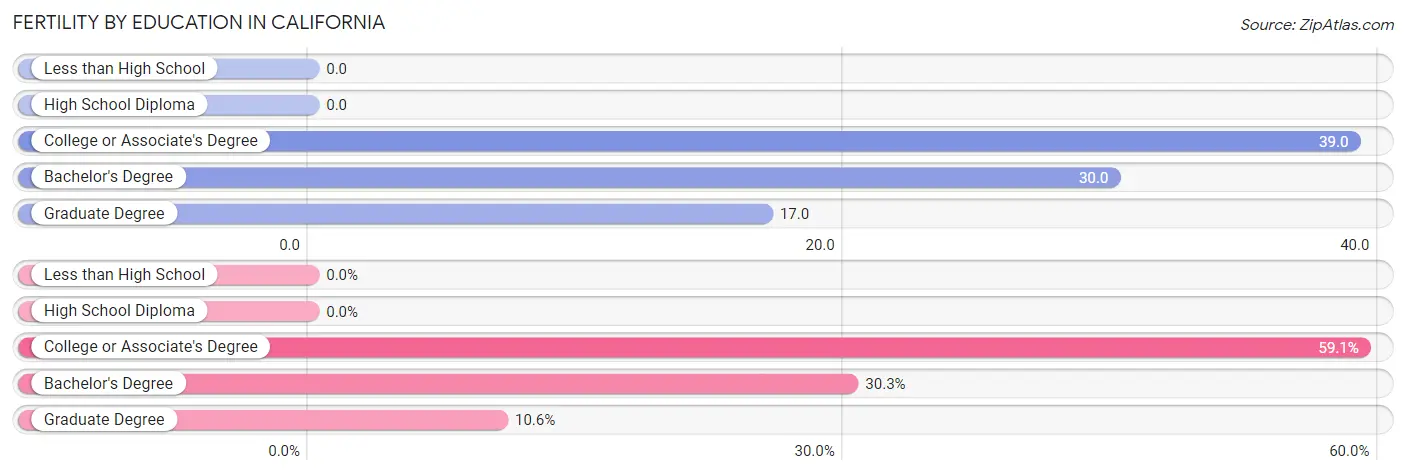
| Educational Attainment | Women with Births | Births / 1,000 Women |
| Less than High School | 0 (0.0%) | 0.0 |
| High School Diploma | 0 (0.0%) | 0.0 |
| College or Associate's Degree | 39 (59.1%) | 39.0 |
| Bachelor's Degree | 20 (30.3%) | 30.0 |
| Graduate Degree | 7 (10.6%) | 17.0 |
| Total | 66 (100.0%) | 21.0 |
Fertility by Education by Marriage Status in California
10.6% of women with births in California are unmarried. Women with the educational attainment of college or associate's degree are most likely to be married with 100.0% of them married at childbirth, while women with the educational attainment of graduate degree are least likely to be married with 100.0% of them unmarried at childbirth.
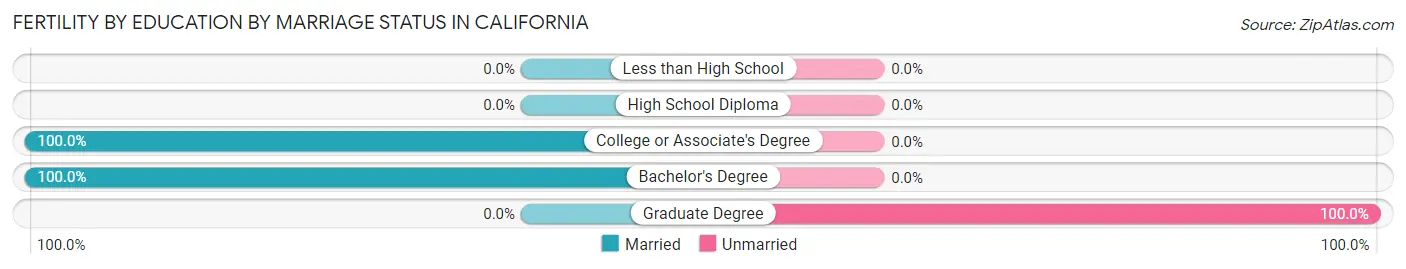
| Educational Attainment | Married | Unmarried |
| Less than High School | 0 (0.0%) | 0 (0.0%) |
| High School Diploma | 0 (0.0%) | 0 (0.0%) |
| College or Associate's Degree | 39 (100.0%) | 0 (0.0%) |
| Bachelor's Degree | 20 (100.0%) | 0 (0.0%) |
| Graduate Degree | 0 (0.0%) | 7 (100.0%) |
| Total | 59 (89.4%) | 7 (10.6%) |
Employment Characteristics in California
Employment by Class of Employer in California
Among the 8,020 employed individuals in California, private company employees (4,478 | 55.8%), federal government employees (1,777 | 22.2%), and local government employees (593 | 7.4%) make up the most common classes of employment.
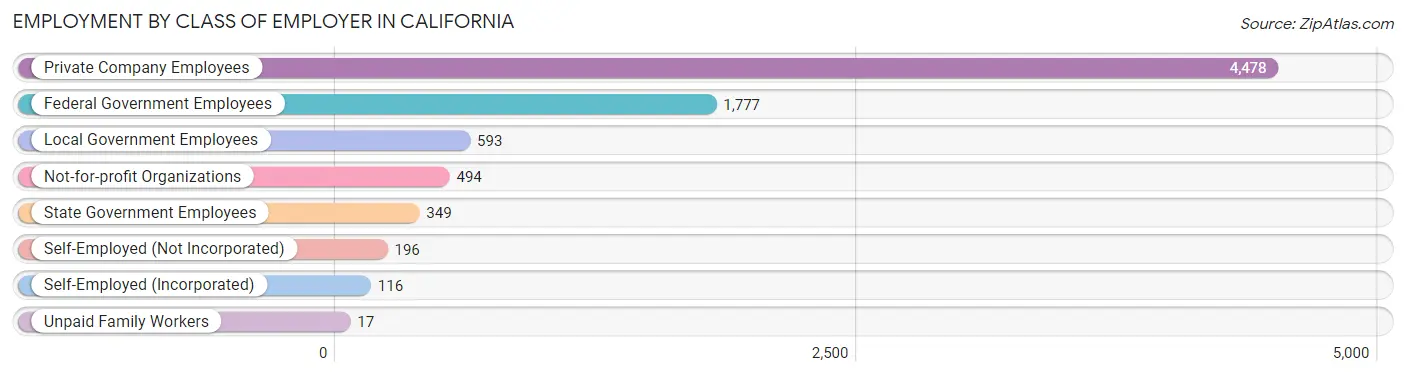
| Employer Class | # Employees | % Employees |
| Private Company Employees | 4,478 | 55.8% |
| Self-Employed (Incorporated) | 116 | 1.5% |
| Self-Employed (Not Incorporated) | 196 | 2.4% |
| Not-for-profit Organizations | 494 | 6.2% |
| Local Government Employees | 593 | 7.4% |
| State Government Employees | 349 | 4.3% |
| Federal Government Employees | 1,777 | 22.2% |
| Unpaid Family Workers | 17 | 0.2% |
| Total | 8,020 | 100.0% |
Employment Status by Age in California
According to the labor force statistics for California, out of the total population over 16 years of age (10,908), 76.1% or 8,301 individuals are in the labor force, with 1.2% or 100 of them unemployed. The age group with the highest labor force participation rate is 25 to 29 years, with 95.5% or 1,207 individuals in the labor force. Within the labor force, the 65 to 74 years age range has the highest percentage of unemployed individuals, with 9.4% or 36 of them being unemployed.
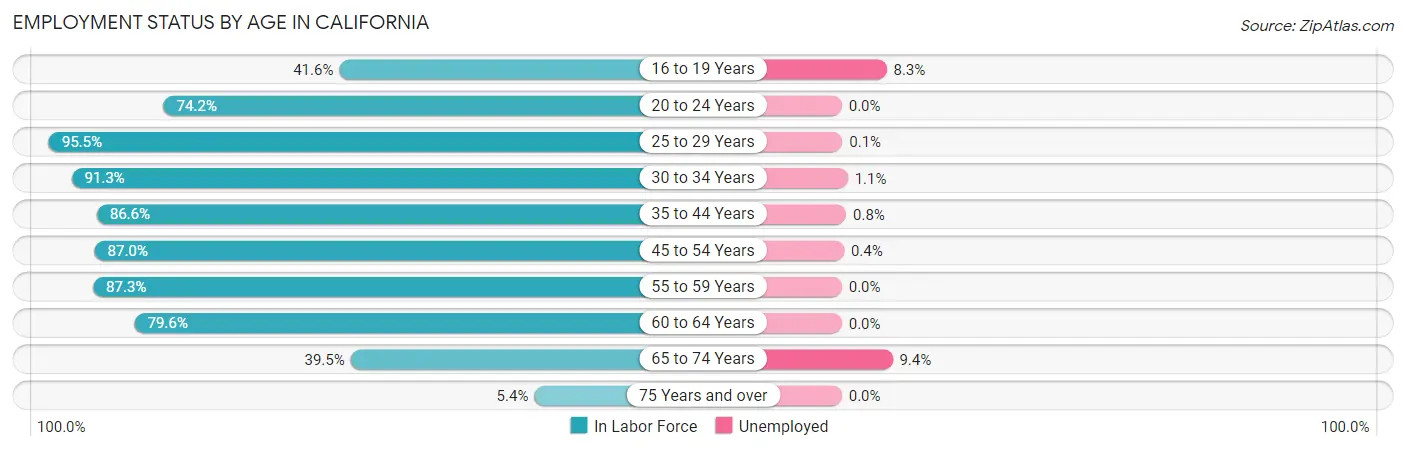
| Age Bracket | In Labor Force | Unemployed |
| 16 to 19 Years | 363 (41.6%) | 30 (8.3%) |
| 20 to 24 Years | 510 (74.2%) | 0 (0.0%) |
| 25 to 29 Years | 1,207 (95.5%) | 1 (0.1%) |
| 30 to 34 Years | 1,043 (91.3%) | 11 (1.1%) |
| 35 to 44 Years | 1,554 (86.6%) | 12 (0.8%) |
| 45 to 54 Years | 1,657 (87.0%) | 7 (0.4%) |
| 55 to 59 Years | 832 (87.3%) | 0 (0.0%) |
| 60 to 64 Years | 727 (79.6%) | 0 (0.0%) |
| 65 to 74 Years | 383 (39.5%) | 36 (9.4%) |
| 75 Years and over | 22 (5.4%) | 0 (0.0%) |
| Total | 8,301 (76.1%) | 100 (1.2%) |
Employment Status by Educational Attainment in California
According to labor force statistics for California, 88.1% of individuals (7,023) out of the total population between 25 and 64 years of age (7,972) are in the labor force, with 0.4% or 28 of them being unemployed. The group with the highest labor force participation rate are those with the educational attainment of high school diploma, with 89.8% or 2,004 individuals in the labor force. Within the labor force, individuals with high school diploma education have the highest percentage of unemployment, with 0.5% or 10 of them being unemployed.
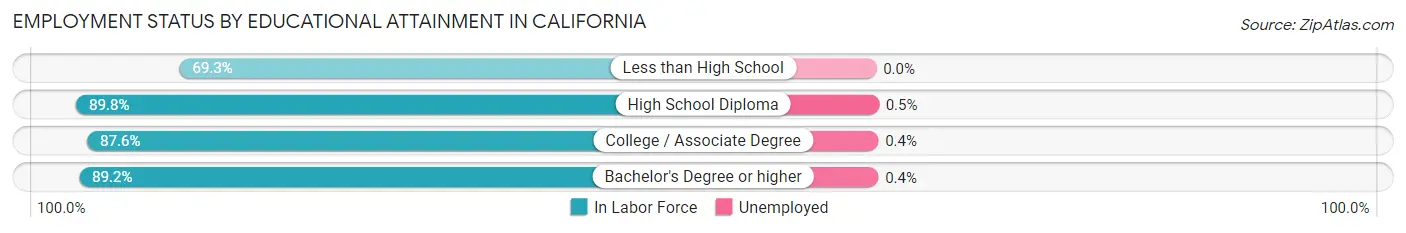
| Educational Attainment | In Labor Force | Unemployed |
| Less than High School | 241 (69.3%) | 0 (0.0%) |
| High School Diploma | 2,004 (89.8%) | 11 (0.5%) |
| College / Associate Degree | 1,871 (87.6%) | 9 (0.4%) |
| Bachelor's Degree or higher | 2,904 (89.2%) | 13 (0.4%) |
| Total | 7,023 (88.1%) | 32 (0.4%) |
Employment Occupations by Sex in California
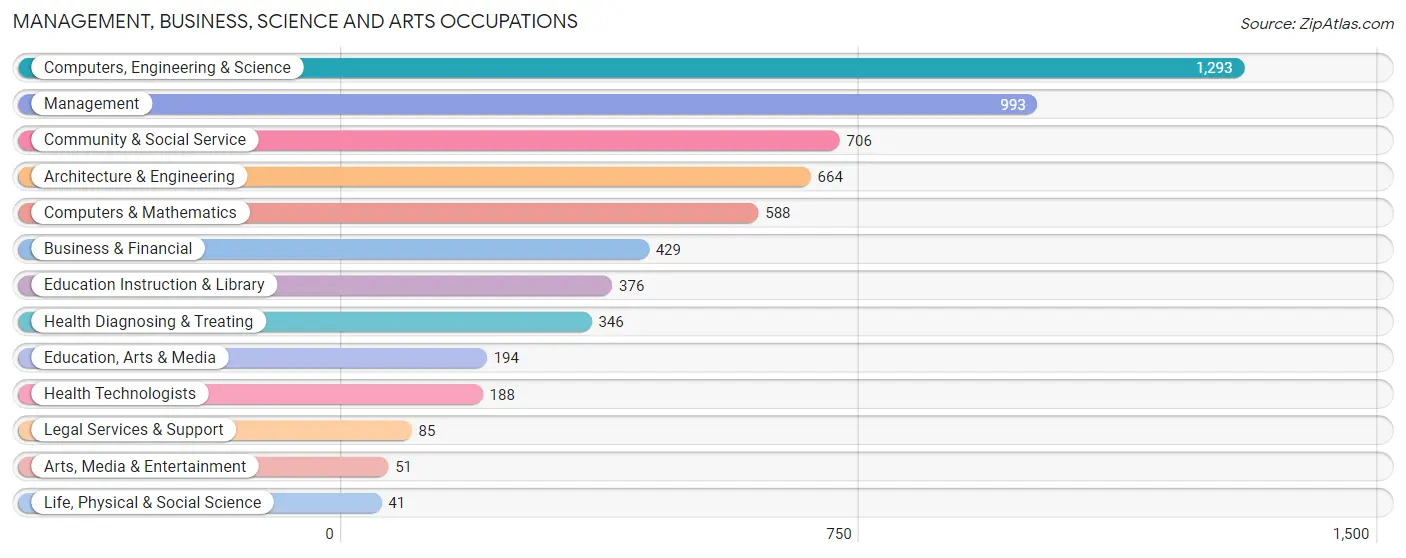
Management, Business, Science and Arts Occupations
The most common Management, Business, Science and Arts occupations in California are Computers, Engineering & Science (1,293 | 16.1%), Management (993 | 12.4%), Community & Social Service (706 | 8.8%), Architecture & Engineering (664 | 8.3%), and Computers & Mathematics (588 | 7.3%).
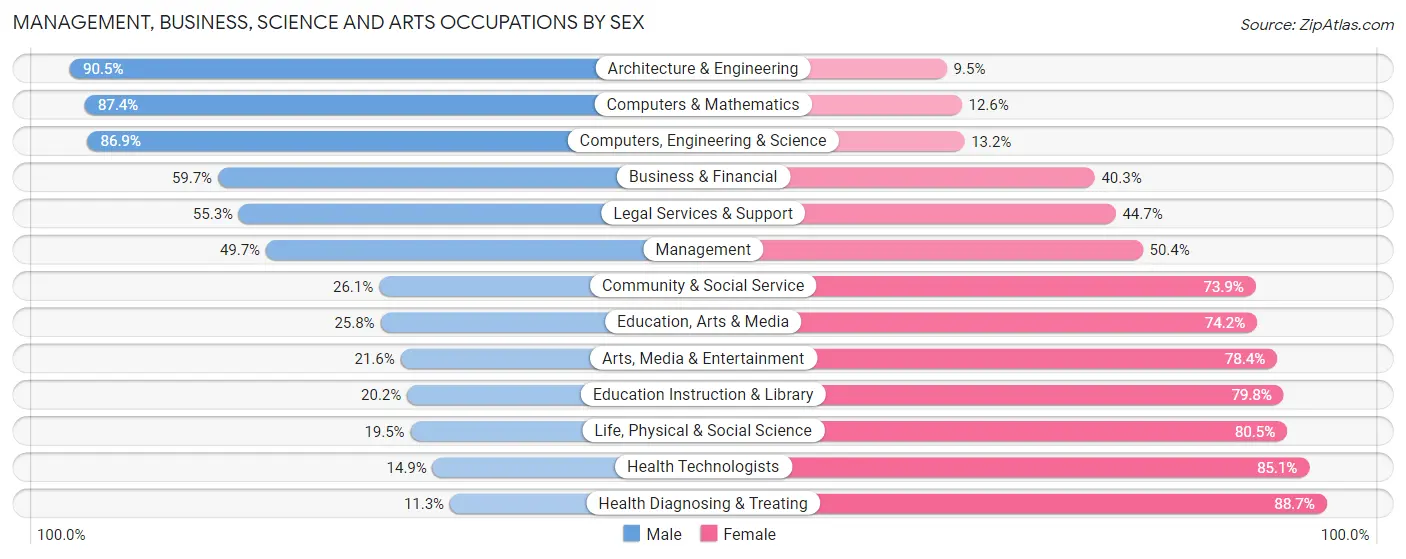
Management, Business, Science and Arts Occupations by Sex
Within the Management, Business, Science and Arts occupations in California, the most male-oriented occupations are Architecture & Engineering (90.5%), Computers & Mathematics (87.4%), and Computers, Engineering & Science (86.9%), while the most female-oriented occupations are Health Diagnosing & Treating (88.7%), Health Technologists (85.1%), and Life, Physical & Social Science (80.5%).
| Occupation | Male | Female |
| Management | 493 (49.6%) | 500 (50.3%) |
| Business & Financial | 256 (59.7%) | 173 (40.3%) |
| Computers, Engineering & Science | 1,123 (86.9%) | 170 (13.2%) |
| Computers & Mathematics | 514 (87.4%) | 74 (12.6%) |
| Architecture & Engineering | 601 (90.5%) | 63 (9.5%) |
| Life, Physical & Social Science | 8 (19.5%) | 33 (80.5%) |
| Community & Social Service | 184 (26.1%) | 522 (73.9%) |
| Education, Arts & Media | 50 (25.8%) | 144 (74.2%) |
| Legal Services & Support | 47 (55.3%) | 38 (44.7%) |
| Education Instruction & Library | 76 (20.2%) | 300 (79.8%) |
| Arts, Media & Entertainment | 11 (21.6%) | 40 (78.4%) |
| Health Diagnosing & Treating | 39 (11.3%) | 307 (88.7%) |
| Health Technologists | 28 (14.9%) | 160 (85.1%) |
| Total (Category) | 2,095 (55.6%) | 1,672 (44.4%) |
| Total (Overall) | 4,717 (58.7%) | 3,320 (41.3%) |
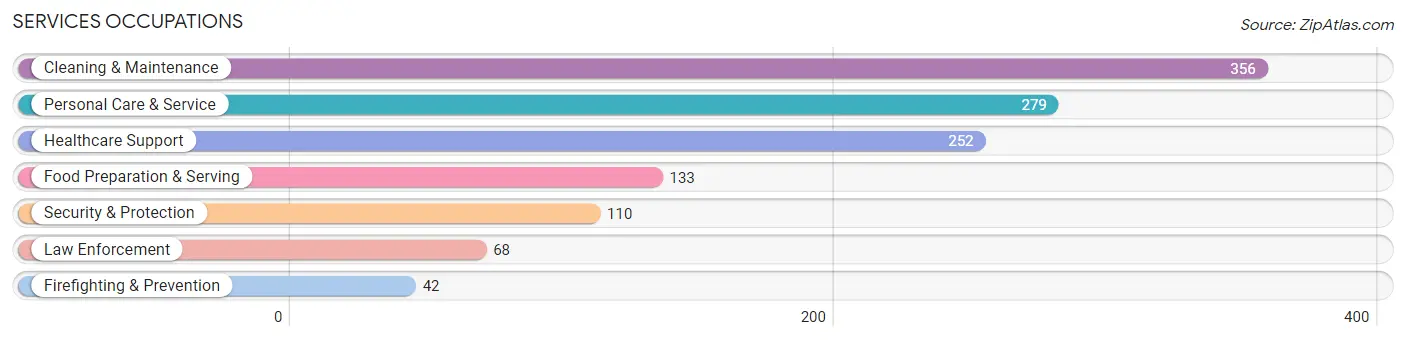
Services Occupations
The most common Services occupations in California are Cleaning & Maintenance (356 | 4.4%), Personal Care & Service (279 | 3.5%), Healthcare Support (252 | 3.1%), Food Preparation & Serving (133 | 1.7%), and Security & Protection (110 | 1.4%).
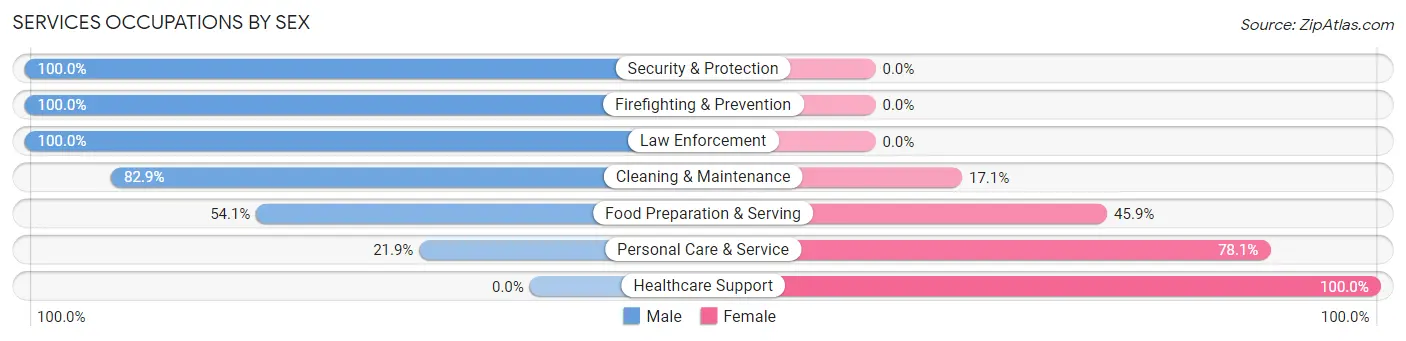
Services Occupations by Sex
Within the Services occupations in California, the most male-oriented occupations are Security & Protection (100.0%), Firefighting & Prevention (100.0%), and Law Enforcement (100.0%), while the most female-oriented occupations are Healthcare Support (100.0%), Personal Care & Service (78.1%), and Food Preparation & Serving (45.9%).
| Occupation | Male | Female |
| Healthcare Support | 0 (0.0%) | 252 (100.0%) |
| Security & Protection | 110 (100.0%) | 0 (0.0%) |
| Firefighting & Prevention | 42 (100.0%) | 0 (0.0%) |
| Law Enforcement | 68 (100.0%) | 0 (0.0%) |
| Food Preparation & Serving | 72 (54.1%) | 61 (45.9%) |
| Cleaning & Maintenance | 295 (82.9%) | 61 (17.1%) |
| Personal Care & Service | 61 (21.9%) | 218 (78.1%) |
| Total (Category) | 538 (47.6%) | 592 (52.4%) |
| Total (Overall) | 4,717 (58.7%) | 3,320 (41.3%) |
Sales and Office Occupations
The most common Sales and Office occupations in California are Office & Administration (742 | 9.2%), and Sales & Related (507 | 6.3%).
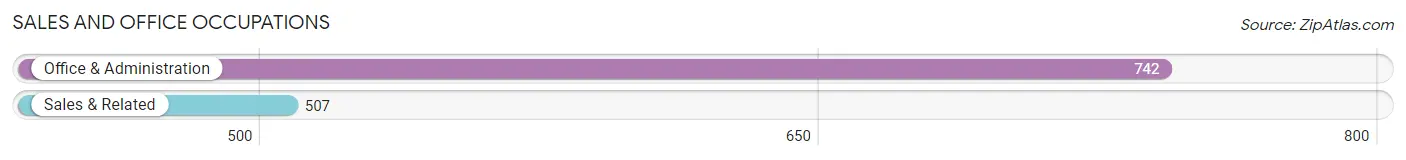
Sales and Office Occupations by Sex
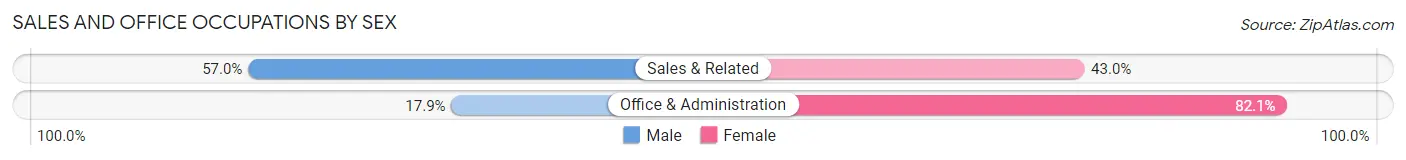
| Occupation | Male | Female |
| Sales & Related | 289 (57.0%) | 218 (43.0%) |
| Office & Administration | 133 (17.9%) | 609 (82.1%) |
| Total (Category) | 422 (33.8%) | 827 (66.2%) |
| Total (Overall) | 4,717 (58.7%) | 3,320 (41.3%) |
Natural Resources, Construction and Maintenance Occupations
The most common Natural Resources, Construction and Maintenance occupations in California are Installation, Maintenance & Repair (551 | 6.9%), and Construction & Extraction (341 | 4.2%).
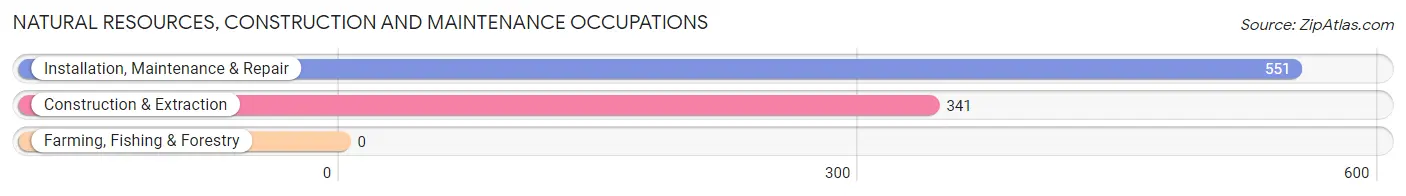
Natural Resources, Construction and Maintenance Occupations by Sex
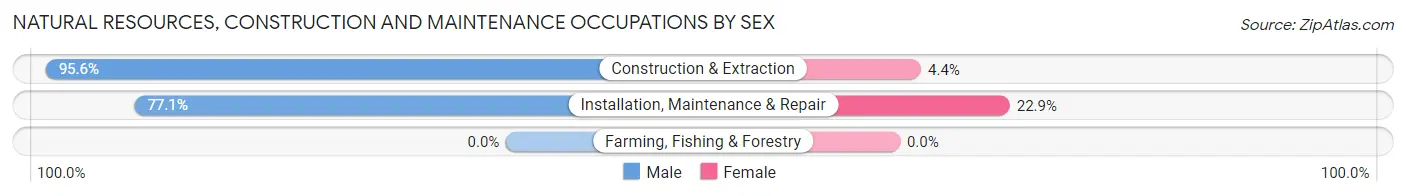
| Occupation | Male | Female |
| Farming, Fishing & Forestry | 0 (0.0%) | 0 (0.0%) |
| Construction & Extraction | 326 (95.6%) | 15 (4.4%) |
| Installation, Maintenance & Repair | 425 (77.1%) | 126 (22.9%) |
| Total (Category) | 751 (84.2%) | 141 (15.8%) |
| Total (Overall) | 4,717 (58.7%) | 3,320 (41.3%) |
Production, Transportation and Moving Occupations
The most common Production, Transportation and Moving occupations in California are Transportation (359 | 4.5%), Material Moving (351 | 4.4%), and Production (289 | 3.6%).
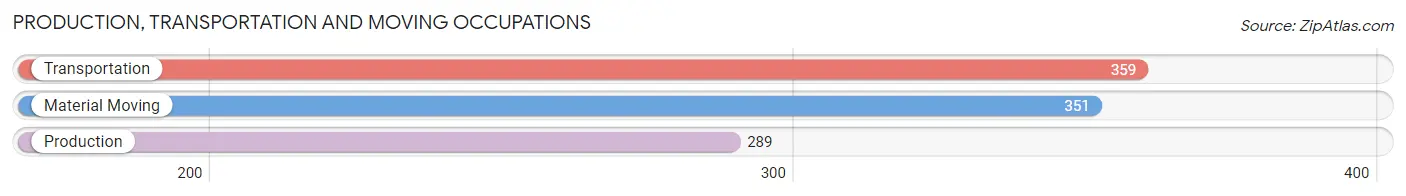
Production, Transportation and Moving Occupations by Sex
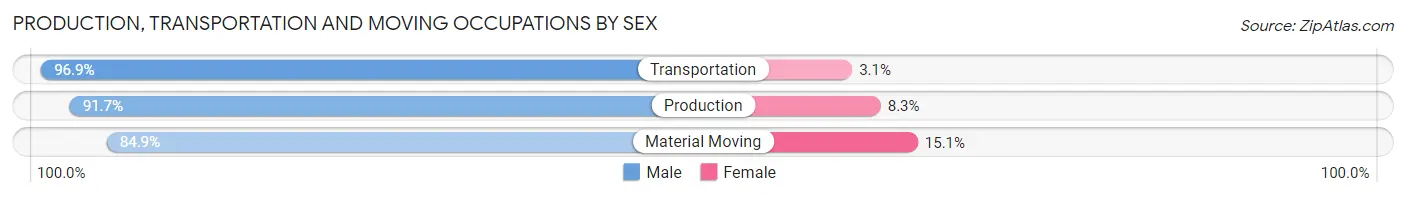
| Occupation | Male | Female |
| Production | 265 (91.7%) | 24 (8.3%) |
| Transportation | 348 (96.9%) | 11 (3.1%) |
| Material Moving | 298 (84.9%) | 53 (15.1%) |
| Total (Category) | 911 (91.2%) | 88 (8.8%) |
| Total (Overall) | 4,717 (58.7%) | 3,320 (41.3%) |
Employment Industries by Sex in California
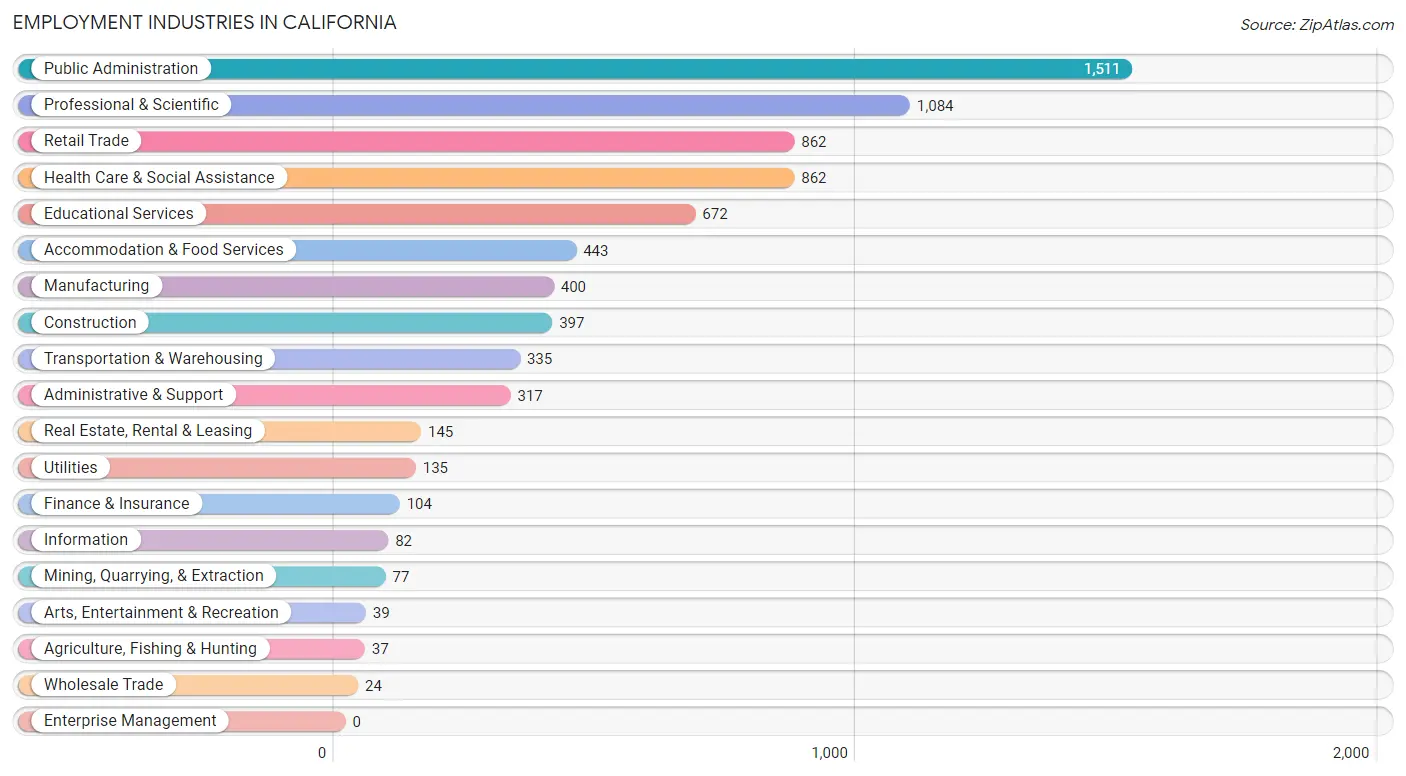
Employment Industries in California
The major employment industries in California include Public Administration (1,511 | 18.8%), Professional & Scientific (1,084 | 13.5%), Retail Trade (862 | 10.7%), Health Care & Social Assistance (862 | 10.7%), and Educational Services (672 | 8.4%).
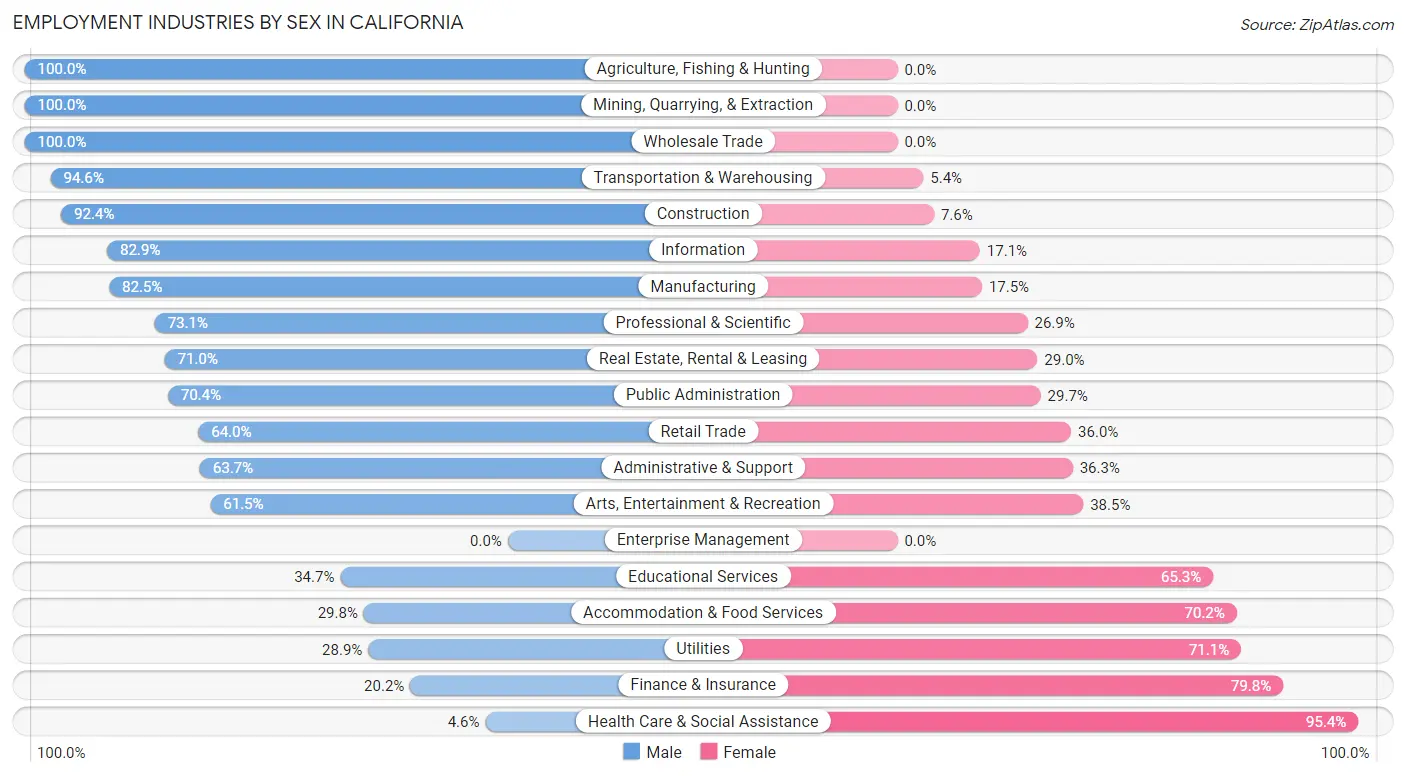
Employment Industries by Sex in California
The California industries that see more men than women are Agriculture, Fishing & Hunting (100.0%), Mining, Quarrying, & Extraction (100.0%), and Wholesale Trade (100.0%), whereas the industries that tend to have a higher number of women are Health Care & Social Assistance (95.4%), Finance & Insurance (79.8%), and Utilities (71.1%).
| Industry | Male | Female |
| Agriculture, Fishing & Hunting | 37 (100.0%) | 0 (0.0%) |
| Mining, Quarrying, & Extraction | 77 (100.0%) | 0 (0.0%) |
| Construction | 367 (92.4%) | 30 (7.6%) |
| Manufacturing | 330 (82.5%) | 70 (17.5%) |
| Wholesale Trade | 24 (100.0%) | 0 (0.0%) |
| Retail Trade | 552 (64.0%) | 310 (36.0%) |
| Transportation & Warehousing | 317 (94.6%) | 18 (5.4%) |
| Utilities | 39 (28.9%) | 96 (71.1%) |
| Information | 68 (82.9%) | 14 (17.1%) |
| Finance & Insurance | 21 (20.2%) | 83 (79.8%) |
| Real Estate, Rental & Leasing | 103 (71.0%) | 42 (29.0%) |
| Professional & Scientific | 792 (73.1%) | 292 (26.9%) |
| Enterprise Management | 0 (0.0%) | 0 (0.0%) |
| Administrative & Support | 202 (63.7%) | 115 (36.3%) |
| Educational Services | 233 (34.7%) | 439 (65.3%) |
| Health Care & Social Assistance | 40 (4.6%) | 822 (95.4%) |
| Arts, Entertainment & Recreation | 24 (61.5%) | 15 (38.5%) |
| Accommodation & Food Services | 132 (29.8%) | 311 (70.2%) |
| Public Administration | 1,063 (70.4%) | 448 (29.6%) |
| Total | 4,717 (58.7%) | 3,320 (41.3%) |
Education in California
School Enrollment in California
The most common levels of schooling among the 3,724 students in California are middle school (790 | 21.2%), college / undergraduate (730 | 19.6%), and high school (727 | 19.5%).
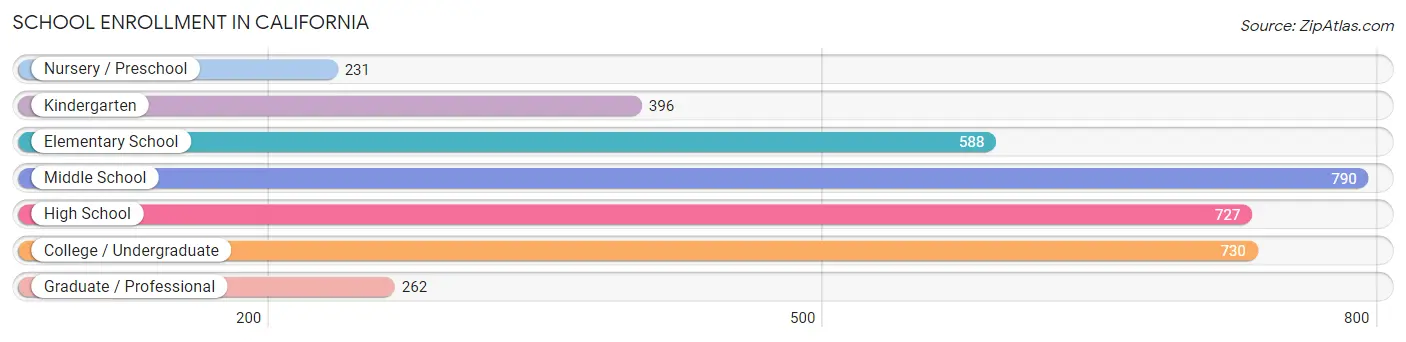
| School Level | # Students | % Students |
| Nursery / Preschool | 231 | 6.2% |
| Kindergarten | 396 | 10.6% |
| Elementary School | 588 | 15.8% |
| Middle School | 790 | 21.2% |
| High School | 727 | 19.5% |
| College / Undergraduate | 730 | 19.6% |
| Graduate / Professional | 262 | 7.0% |
| Total | 3,724 | 100.0% |
School Enrollment by Age by Funding Source in California
Out of a total of 3,724 students who are enrolled in schools in California, 756 (20.3%) attend a private institution, while the remaining 2,968 (79.7%) are enrolled in public schools. The age group of 35 years and over has the highest likelihood of being enrolled in private schools, with 163 (67.1% in the age bracket) enrolled. Conversely, the age group of 5 to 9 year old has the lowest likelihood of being enrolled in a private school, with 832 (90.3% in the age bracket) attending a public institution.
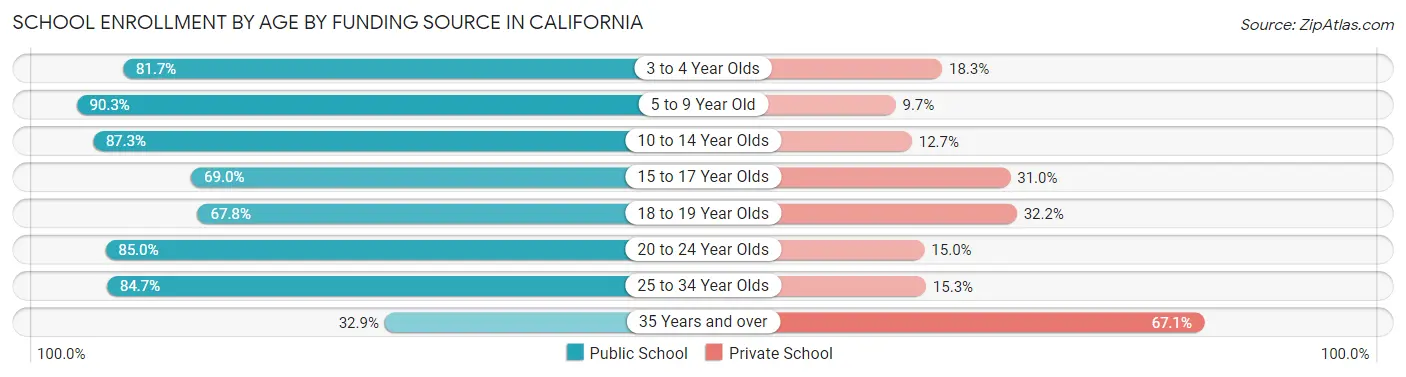
| Age Bracket | Public School | Private School |
| 3 to 4 Year Olds | 165 (81.7%) | 37 (18.3%) |
| 5 to 9 Year Old | 832 (90.3%) | 89 (9.7%) |
| 10 to 14 Year Olds | 853 (87.3%) | 124 (12.7%) |
| 15 to 17 Year Olds | 400 (69.0%) | 180 (31.0%) |
| 18 to 19 Year Olds | 164 (67.8%) | 78 (32.2%) |
| 20 to 24 Year Olds | 192 (85.0%) | 34 (15.0%) |
| 25 to 34 Year Olds | 282 (84.7%) | 51 (15.3%) |
| 35 Years and over | 80 (32.9%) | 163 (67.1%) |
| Total | 2,968 (79.7%) | 756 (20.3%) |
Educational Attainment by Field of Study in California
Engineering (703 | 17.8%), business (644 | 16.3%), arts & humanities (390 | 9.9%), social sciences (310 | 7.8%), and science & technology (290 | 7.3%) are the most common fields of study among 3,957 individuals in California who have obtained a bachelor's degree or higher.
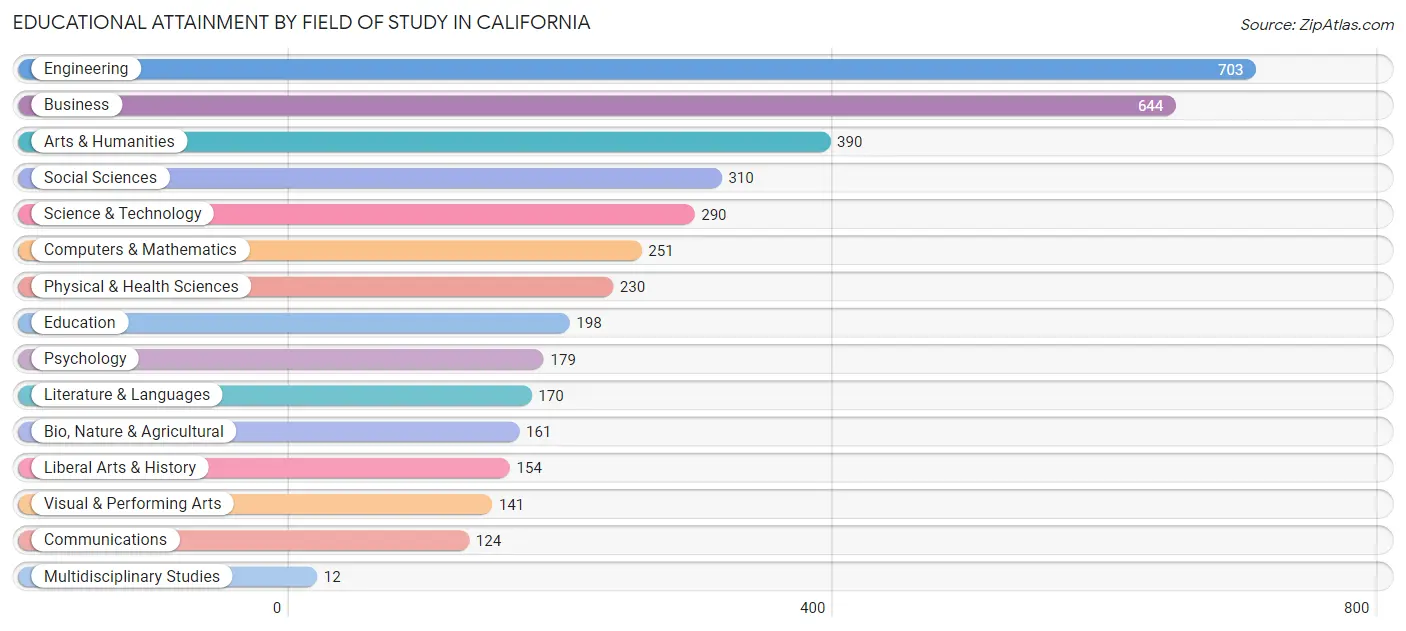
| Field of Study | # Graduates | % Graduates |
| Computers & Mathematics | 251 | 6.3% |
| Bio, Nature & Agricultural | 161 | 4.1% |
| Physical & Health Sciences | 230 | 5.8% |
| Psychology | 179 | 4.5% |
| Social Sciences | 310 | 7.8% |
| Engineering | 703 | 17.8% |
| Multidisciplinary Studies | 12 | 0.3% |
| Science & Technology | 290 | 7.3% |
| Business | 644 | 16.3% |
| Education | 198 | 5.0% |
| Literature & Languages | 170 | 4.3% |
| Liberal Arts & History | 154 | 3.9% |
| Visual & Performing Arts | 141 | 3.6% |
| Communications | 124 | 3.1% |
| Arts & Humanities | 390 | 9.9% |
| Total | 3,957 | 100.0% |
Transportation & Commute in California
Vehicle Availability by Sex in California
The most prevalent vehicle ownership categories in California are males with 2 vehicles (1,857, accounting for 38.4%) and females with 2 vehicles (1,246, making up 58.4%).
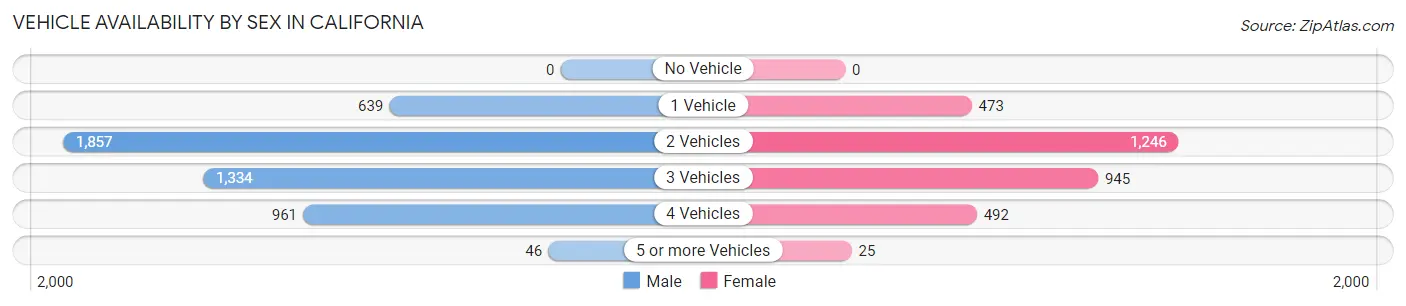
| Vehicles Available | Male | Female |
| No Vehicle | 0 (0.0%) | 0 (0.0%) |
| 1 Vehicle | 639 (13.2%) | 473 (14.9%) |
| 2 Vehicles | 1,857 (38.4%) | 1,246 (39.2%) |
| 3 Vehicles | 1,334 (27.6%) | 945 (29.7%) |
| 4 Vehicles | 961 (19.9%) | 492 (15.5%) |
| 5 or more Vehicles | 46 (0.9%) | 25 (0.8%) |
| Total | 4,837 (100.0%) | 3,181 (100.0%) |
Commute Time in California
The most frequently occuring commute durations in California are 15 to 19 minutes (1,703 commuters, 23.3%), 20 to 24 minutes (1,253 commuters, 17.1%), and 10 to 14 minutes (1,243 commuters, 17.0%).
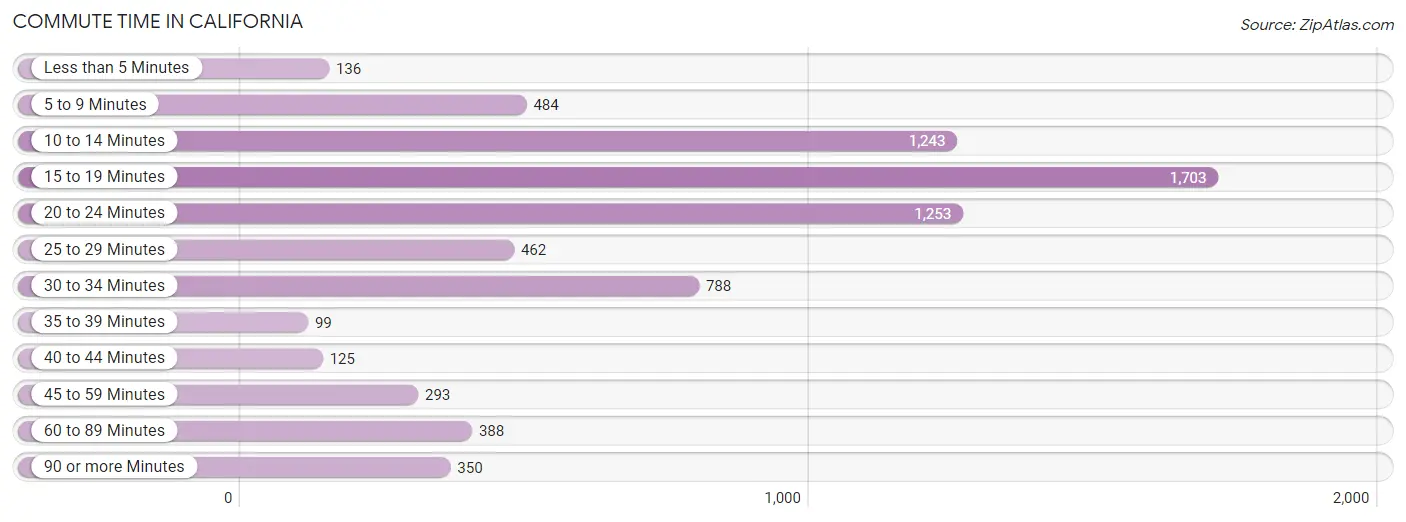
| Commute Time | # Commuters | % Commuters |
| Less than 5 Minutes | 136 | 1.9% |
| 5 to 9 Minutes | 484 | 6.6% |
| 10 to 14 Minutes | 1,243 | 17.0% |
| 15 to 19 Minutes | 1,703 | 23.3% |
| 20 to 24 Minutes | 1,253 | 17.1% |
| 25 to 29 Minutes | 462 | 6.3% |
| 30 to 34 Minutes | 788 | 10.8% |
| 35 to 39 Minutes | 99 | 1.3% |
| 40 to 44 Minutes | 125 | 1.7% |
| 45 to 59 Minutes | 293 | 4.0% |
| 60 to 89 Minutes | 388 | 5.3% |
| 90 or more Minutes | 350 | 4.8% |
Commute Time by Sex in California
The most common commute times in California are 15 to 19 minutes (1,042 commuters, 22.9%) for males and 15 to 19 minutes (661 commuters, 23.8%) for females.
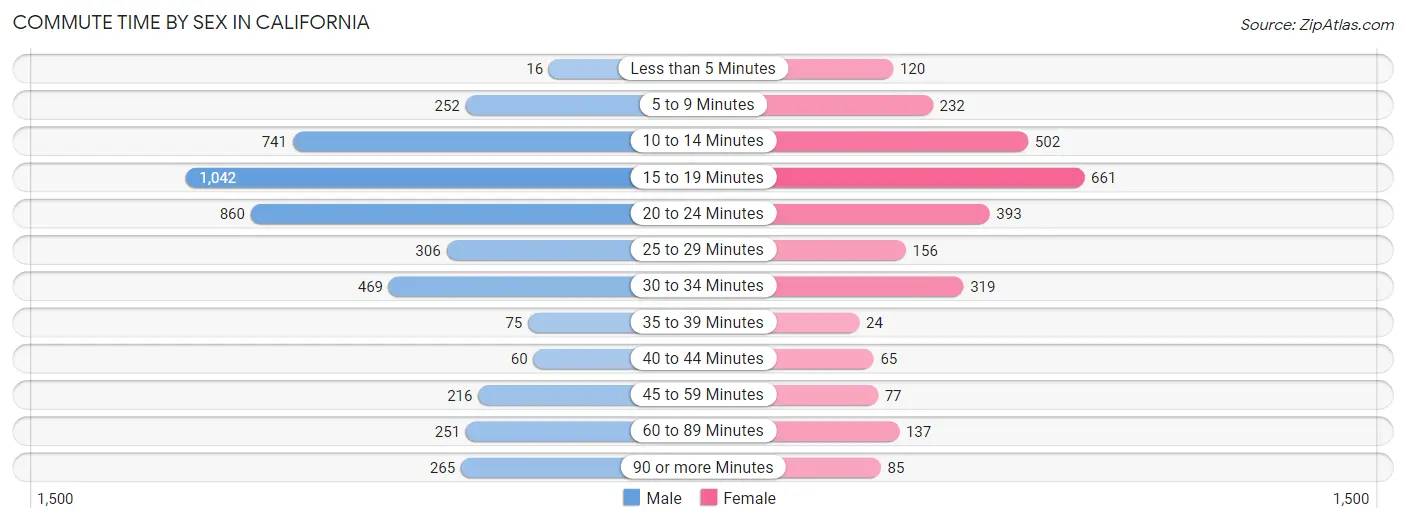
| Commute Time | Male | Female |
| Less than 5 Minutes | 16 (0.4%) | 120 (4.3%) |
| 5 to 9 Minutes | 252 (5.5%) | 232 (8.4%) |
| 10 to 14 Minutes | 741 (16.3%) | 502 (18.1%) |
| 15 to 19 Minutes | 1,042 (22.9%) | 661 (23.8%) |
| 20 to 24 Minutes | 860 (18.9%) | 393 (14.2%) |
| 25 to 29 Minutes | 306 (6.7%) | 156 (5.6%) |
| 30 to 34 Minutes | 469 (10.3%) | 319 (11.5%) |
| 35 to 39 Minutes | 75 (1.7%) | 24 (0.9%) |
| 40 to 44 Minutes | 60 (1.3%) | 65 (2.4%) |
| 45 to 59 Minutes | 216 (4.7%) | 77 (2.8%) |
| 60 to 89 Minutes | 251 (5.5%) | 137 (4.9%) |
| 90 or more Minutes | 265 (5.8%) | 85 (3.1%) |
Time of Departure to Work by Sex in California
The most frequent times of departure to work in California are 7:00 AM to 7:29 AM (661, 14.5%) for males and 7:30 AM to 7:59 AM (435, 15.7%) for females.
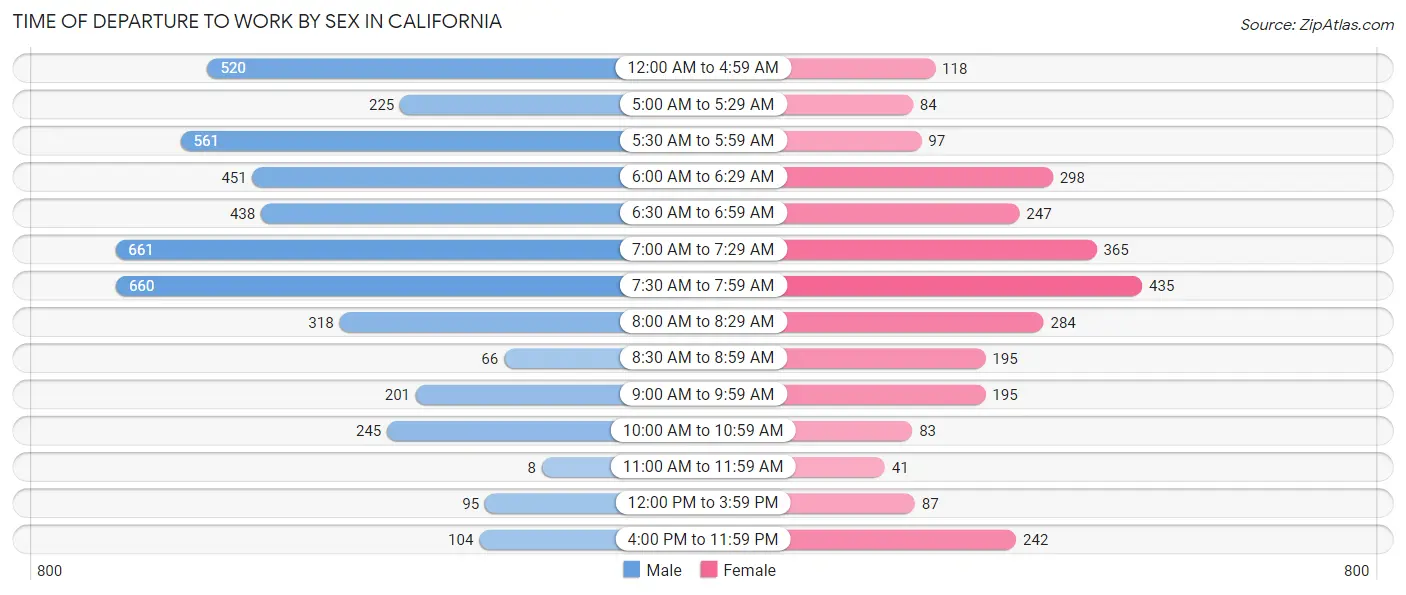
| Time of Departure | Male | Female |
| 12:00 AM to 4:59 AM | 520 (11.4%) | 118 (4.3%) |
| 5:00 AM to 5:29 AM | 225 (4.9%) | 84 (3.0%) |
| 5:30 AM to 5:59 AM | 561 (12.3%) | 97 (3.5%) |
| 6:00 AM to 6:29 AM | 451 (9.9%) | 298 (10.7%) |
| 6:30 AM to 6:59 AM | 438 (9.6%) | 247 (8.9%) |
| 7:00 AM to 7:29 AM | 661 (14.5%) | 365 (13.2%) |
| 7:30 AM to 7:59 AM | 660 (14.5%) | 435 (15.7%) |
| 8:00 AM to 8:29 AM | 318 (7.0%) | 284 (10.2%) |
| 8:30 AM to 8:59 AM | 66 (1.5%) | 195 (7.0%) |
| 9:00 AM to 9:59 AM | 201 (4.4%) | 195 (7.0%) |
| 10:00 AM to 10:59 AM | 245 (5.4%) | 83 (3.0%) |
| 11:00 AM to 11:59 AM | 8 (0.2%) | 41 (1.5%) |
| 12:00 PM to 3:59 PM | 95 (2.1%) | 87 (3.1%) |
| 4:00 PM to 11:59 PM | 104 (2.3%) | 242 (8.7%) |
| Total | 4,553 (100.0%) | 2,771 (100.0%) |
Housing Occupancy in California
Occupancy by Ownership in California
Of the total 5,131 dwellings in California, owner-occupied units account for 3,287 (64.1%), while renter-occupied units make up 1,844 (35.9%).
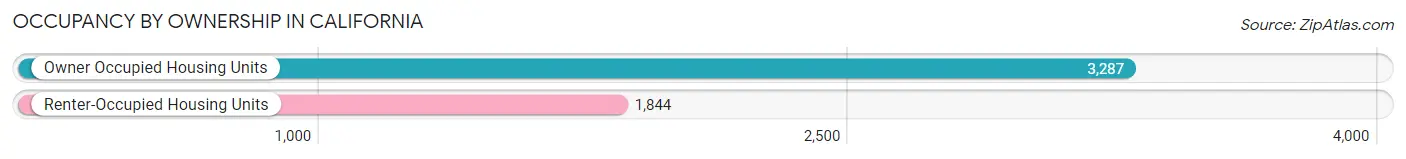
| Occupancy | # Housing Units | % Housing Units |
| Owner Occupied Housing Units | 3,287 | 64.1% |
| Renter-Occupied Housing Units | 1,844 | 35.9% |
| Total Occupied Housing Units | 5,131 | 100.0% |
Occupancy by Household Size in California
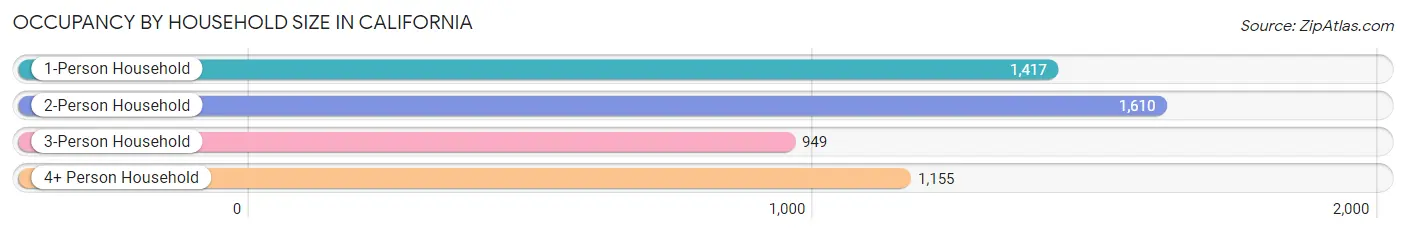
| Household Size | # Housing Units | % Housing Units |
| 1-Person Household | 1,417 | 27.6% |
| 2-Person Household | 1,610 | 31.4% |
| 3-Person Household | 949 | 18.5% |
| 4+ Person Household | 1,155 | 22.5% |
| Total Housing Units | 5,131 | 100.0% |
Occupancy by Ownership by Household Size in California
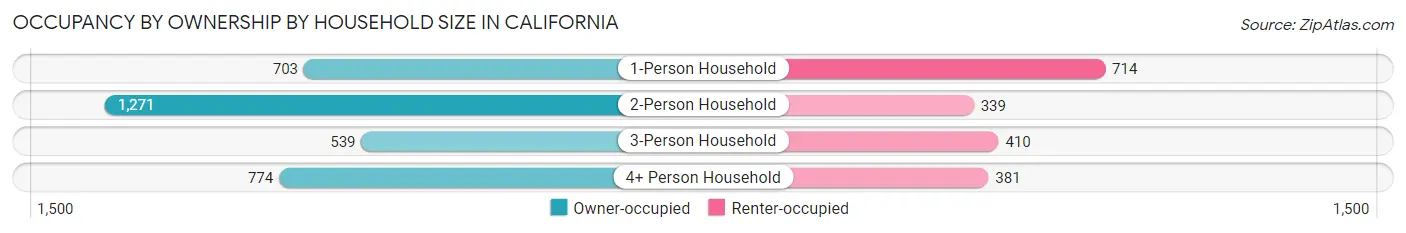
| Household Size | Owner-occupied | Renter-occupied |
| 1-Person Household | 703 (49.6%) | 714 (50.4%) |
| 2-Person Household | 1,271 (78.9%) | 339 (21.1%) |
| 3-Person Household | 539 (56.8%) | 410 (43.2%) |
| 4+ Person Household | 774 (67.0%) | 381 (33.0%) |
| Total Housing Units | 3,287 (64.1%) | 1,844 (35.9%) |
Occupancy by Educational Attainment in California
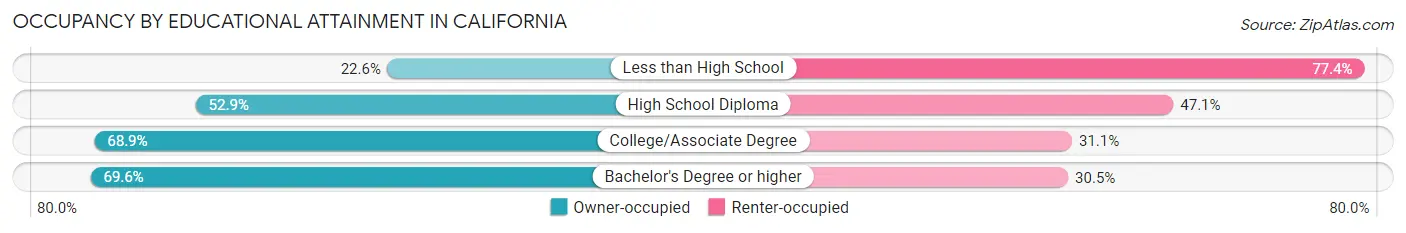
| Household Size | Owner-occupied | Renter-occupied |
| Less than High School | 30 (22.6%) | 103 (77.4%) |
| High School Diploma | 665 (52.9%) | 593 (47.1%) |
| College/Associate Degree | 1,034 (68.9%) | 466 (31.1%) |
| Bachelor's Degree or higher | 1,558 (69.6%) | 682 (30.4%) |
Occupancy by Age of Householder in California
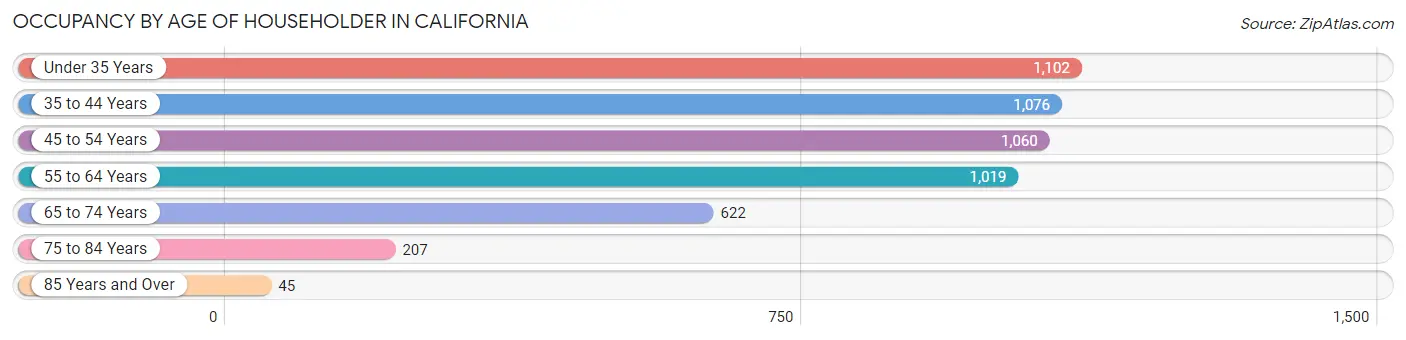
| Age Bracket | # Households | % Households |
| Under 35 Years | 1,102 | 21.5% |
| 35 to 44 Years | 1,076 | 21.0% |
| 45 to 54 Years | 1,060 | 20.7% |
| 55 to 64 Years | 1,019 | 19.9% |
| 65 to 74 Years | 622 | 12.1% |
| 75 to 84 Years | 207 | 4.0% |
| 85 Years and Over | 45 | 0.9% |
| Total | 5,131 | 100.0% |
Housing Finances in California
Median Income by Occupancy in California
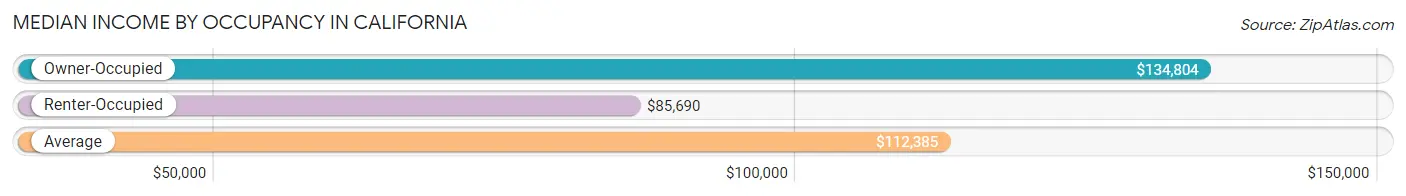
| Occupancy Type | # Households | Median Income |
| Owner-Occupied | 3,287 (64.1%) | $134,804 |
| Renter-Occupied | 1,844 (35.9%) | $85,690 |
| Average | 5,131 (100.0%) | $112,385 |
Occupancy by Householder Income Bracket in California
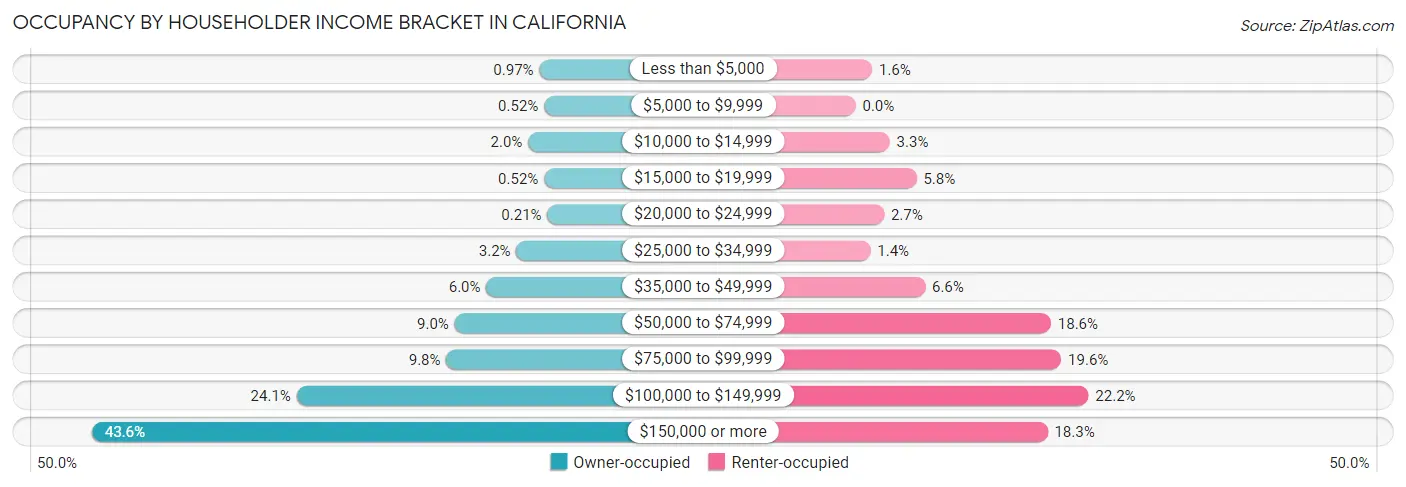
| Income Bracket | Owner-occupied | Renter-occupied |
| Less than $5,000 | 32 (1.0%) | 29 (1.6%) |
| $5,000 to $9,999 | 17 (0.5%) | 0 (0.0%) |
| $10,000 to $14,999 | 67 (2.0%) | 60 (3.3%) |
| $15,000 to $19,999 | 17 (0.5%) | 107 (5.8%) |
| $20,000 to $24,999 | 7 (0.2%) | 50 (2.7%) |
| $25,000 to $34,999 | 104 (3.2%) | 26 (1.4%) |
| $35,000 to $49,999 | 198 (6.0%) | 122 (6.6%) |
| $50,000 to $74,999 | 297 (9.0%) | 343 (18.6%) |
| $75,000 to $99,999 | 323 (9.8%) | 361 (19.6%) |
| $100,000 to $149,999 | 792 (24.1%) | 409 (22.2%) |
| $150,000 or more | 1,433 (43.6%) | 337 (18.3%) |
| Total | 3,287 (100.0%) | 1,844 (100.0%) |
Monthly Housing Cost Tiers in California
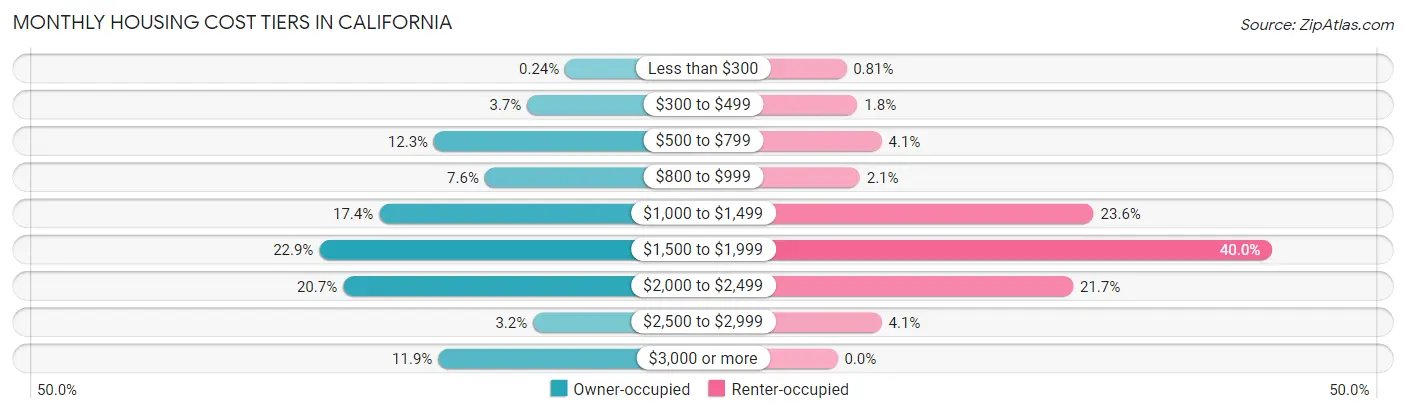
| Monthly Cost | Owner-occupied | Renter-occupied |
| Less than $300 | 8 (0.2%) | 15 (0.8%) |
| $300 to $499 | 123 (3.7%) | 34 (1.8%) |
| $500 to $799 | 405 (12.3%) | 75 (4.1%) |
| $800 to $999 | 251 (7.6%) | 38 (2.1%) |
| $1,000 to $1,499 | 571 (17.4%) | 435 (23.6%) |
| $1,500 to $1,999 | 752 (22.9%) | 738 (40.0%) |
| $2,000 to $2,499 | 680 (20.7%) | 400 (21.7%) |
| $2,500 to $2,999 | 105 (3.2%) | 75 (4.1%) |
| $3,000 or more | 392 (11.9%) | 0 (0.0%) |
| Total | 3,287 (100.0%) | 1,844 (100.0%) |
Physical Housing Characteristics in California
Housing Structures in California
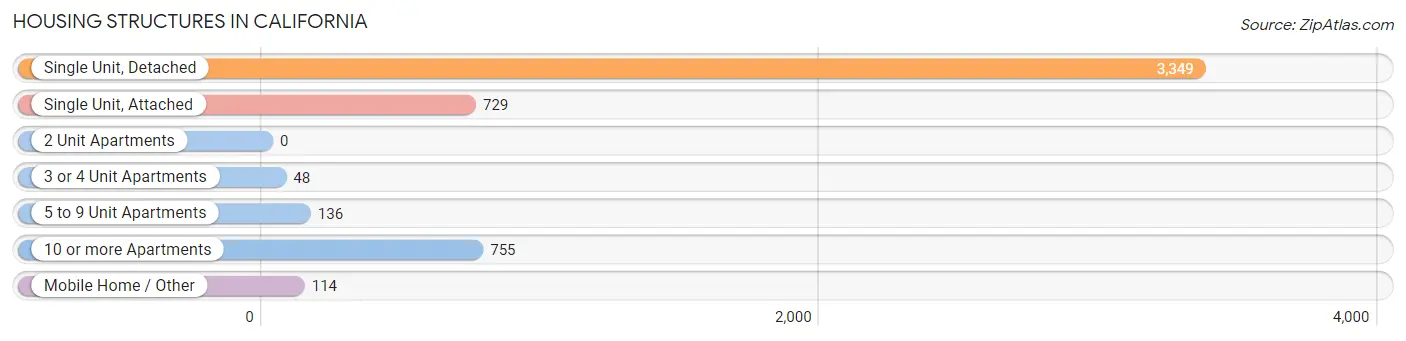
| Structure Type | # Housing Units | % Housing Units |
| Single Unit, Detached | 3,349 | 65.3% |
| Single Unit, Attached | 729 | 14.2% |
| 2 Unit Apartments | 0 | 0.0% |
| 3 or 4 Unit Apartments | 48 | 0.9% |
| 5 to 9 Unit Apartments | 136 | 2.6% |
| 10 or more Apartments | 755 | 14.7% |
| Mobile Home / Other | 114 | 2.2% |
| Total | 5,131 | 100.0% |
Housing Structures by Occupancy in California
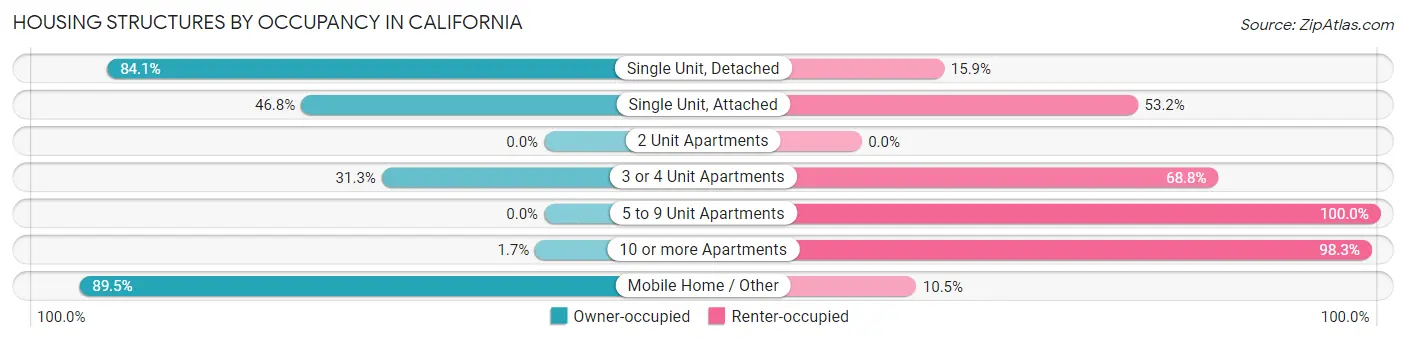
| Structure Type | Owner-occupied | Renter-occupied |
| Single Unit, Detached | 2,816 (84.1%) | 533 (15.9%) |
| Single Unit, Attached | 341 (46.8%) | 388 (53.2%) |
| 2 Unit Apartments | 0 (0.0%) | 0 (0.0%) |
| 3 or 4 Unit Apartments | 15 (31.2%) | 33 (68.8%) |
| 5 to 9 Unit Apartments | 0 (0.0%) | 136 (100.0%) |
| 10 or more Apartments | 13 (1.7%) | 742 (98.3%) |
| Mobile Home / Other | 102 (89.5%) | 12 (10.5%) |
| Total | 3,287 (64.1%) | 1,844 (35.9%) |
Housing Structures by Number of Rooms in California
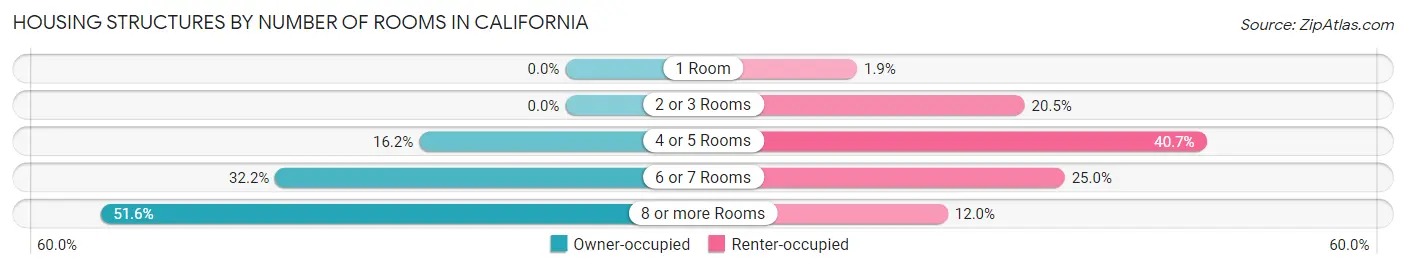
| Number of Rooms | Owner-occupied | Renter-occupied |
| 1 Room | 0 (0.0%) | 35 (1.9%) |
| 2 or 3 Rooms | 0 (0.0%) | 378 (20.5%) |
| 4 or 5 Rooms | 533 (16.2%) | 750 (40.7%) |
| 6 or 7 Rooms | 1,058 (32.2%) | 460 (24.9%) |
| 8 or more Rooms | 1,696 (51.6%) | 221 (12.0%) |
| Total | 3,287 (100.0%) | 1,844 (100.0%) |
Housing Structure by Heating Type in California
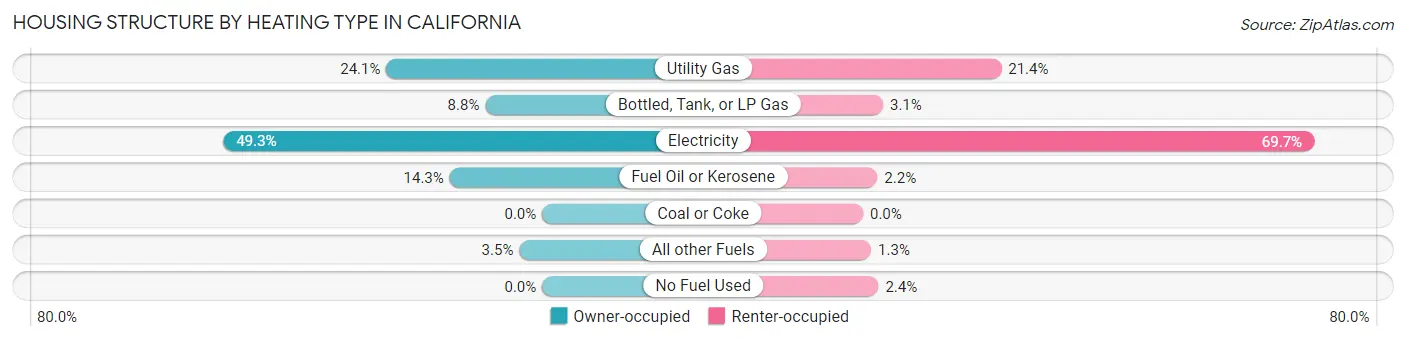
| Heating Type | Owner-occupied | Renter-occupied |
| Utility Gas | 792 (24.1%) | 394 (21.4%) |
| Bottled, Tank, or LP Gas | 289 (8.8%) | 57 (3.1%) |
| Electricity | 1,620 (49.3%) | 1,285 (69.7%) |
| Fuel Oil or Kerosene | 470 (14.3%) | 41 (2.2%) |
| Coal or Coke | 0 (0.0%) | 0 (0.0%) |
| All other Fuels | 116 (3.5%) | 23 (1.3%) |
| No Fuel Used | 0 (0.0%) | 44 (2.4%) |
| Total | 3,287 (100.0%) | 1,844 (100.0%) |
Household Vehicle Usage in California
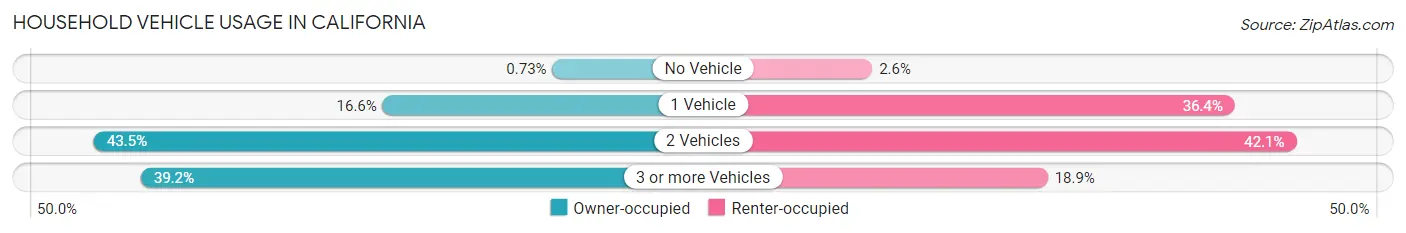
| Vehicles per Household | Owner-occupied | Renter-occupied |
| No Vehicle | 24 (0.7%) | 47 (2.5%) |
| 1 Vehicle | 545 (16.6%) | 671 (36.4%) |
| 2 Vehicles | 1,431 (43.5%) | 777 (42.1%) |
| 3 or more Vehicles | 1,287 (39.2%) | 349 (18.9%) |
| Total | 3,287 (100.0%) | 1,844 (100.0%) |
Real Estate & Mortgages in California
Real Estate and Mortgage Overview in California
| Characteristic | Without Mortgage | With Mortgage |
| Housing Units | 726 | 2,561 |
| Median Property Value | $352,800 | $306,800 |
| Median Household Income | $137,065 | $1,074 |
| Monthly Housing Costs | $707 | $392 |
| Real Estate Taxes | $3,242 | $23 |
Property Value by Mortgage Status in California
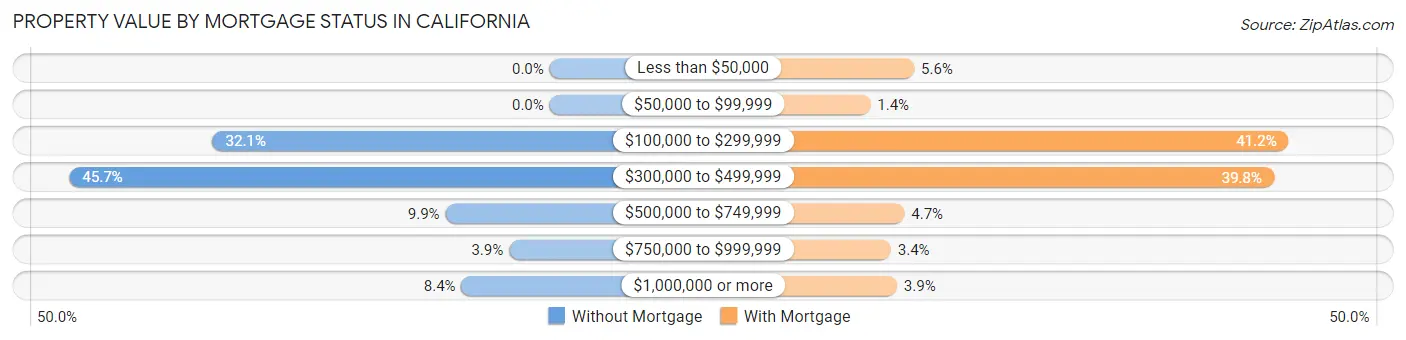
| Property Value | Without Mortgage | With Mortgage |
| Less than $50,000 | 0 (0.0%) | 143 (5.6%) |
| $50,000 to $99,999 | 0 (0.0%) | 36 (1.4%) |
| $100,000 to $299,999 | 233 (32.1%) | 1,056 (41.2%) |
| $300,000 to $499,999 | 332 (45.7%) | 1,020 (39.8%) |
| $500,000 to $749,999 | 72 (9.9%) | 119 (4.6%) |
| $750,000 to $999,999 | 28 (3.9%) | 86 (3.4%) |
| $1,000,000 or more | 61 (8.4%) | 101 (3.9%) |
| Total | 726 (100.0%) | 2,561 (100.0%) |
Household Income by Mortgage Status in California
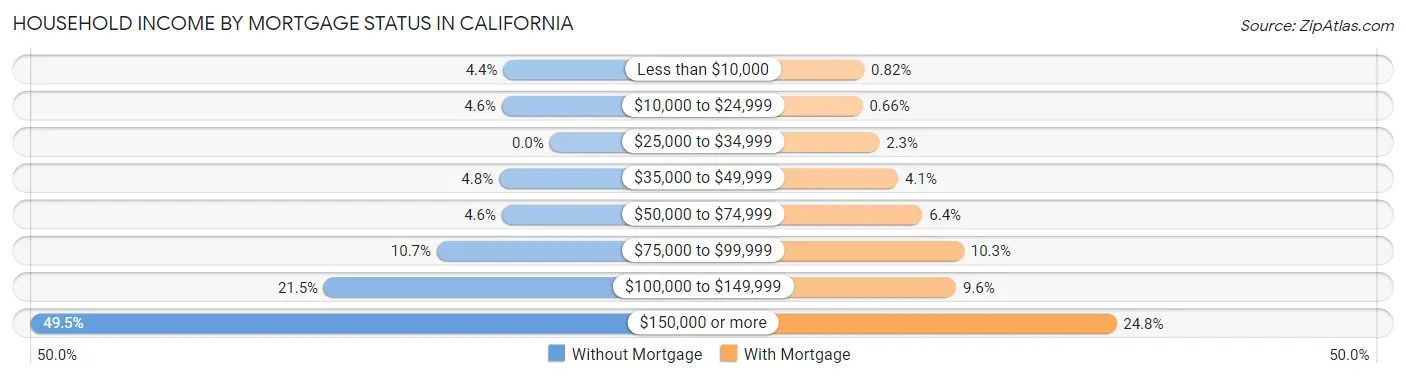
| Household Income | Without Mortgage | With Mortgage |
| Less than $10,000 | 32 (4.4%) | 21 (0.8%) |
| $10,000 to $24,999 | 33 (4.5%) | 17 (0.7%) |
| $25,000 to $34,999 | 0 (0.0%) | 58 (2.3%) |
| $35,000 to $49,999 | 35 (4.8%) | 104 (4.1%) |
| $50,000 to $74,999 | 33 (4.5%) | 163 (6.4%) |
| $75,000 to $99,999 | 78 (10.7%) | 264 (10.3%) |
| $100,000 to $149,999 | 156 (21.5%) | 245 (9.6%) |
| $150,000 or more | 359 (49.4%) | 636 (24.8%) |
| Total | 726 (100.0%) | 2,561 (100.0%) |
Property Value to Household Income Ratio in California
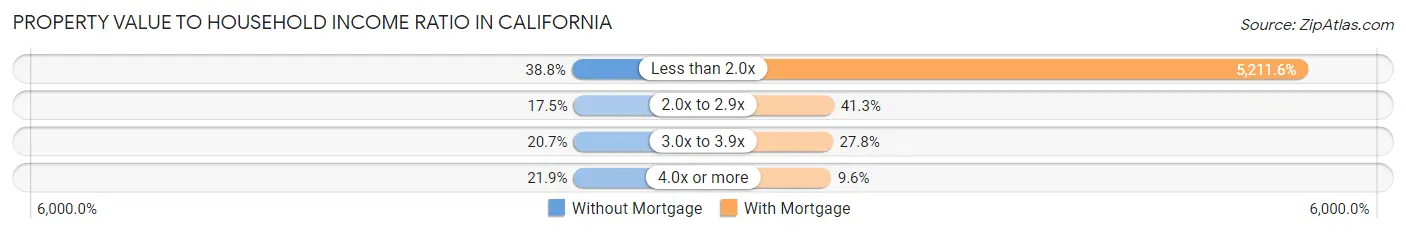
| Value-to-Income Ratio | Without Mortgage | With Mortgage |
| Less than 2.0x | 282 (38.8%) | 133,469 (5,211.6%) |
| 2.0x to 2.9x | 127 (17.5%) | 1,058 (41.3%) |
| 3.0x to 3.9x | 150 (20.7%) | 712 (27.8%) |
| 4.0x or more | 159 (21.9%) | 246 (9.6%) |
| Total | 726 (100.0%) | 2,561 (100.0%) |
Real Estate Taxes by Mortgage Status in California
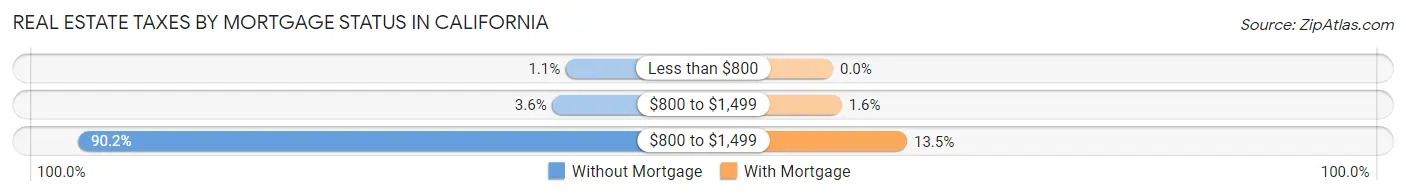
| Property Taxes | Without Mortgage | With Mortgage |
| Less than $800 | 8 (1.1%) | 0 (0.0%) |
| $800 to $1,499 | 26 (3.6%) | 41 (1.6%) |
| $800 to $1,499 | 655 (90.2%) | 346 (13.5%) |
| Total | 726 (100.0%) | 2,561 (100.0%) |
Health & Disability in California
Health Insurance Coverage by Age in California
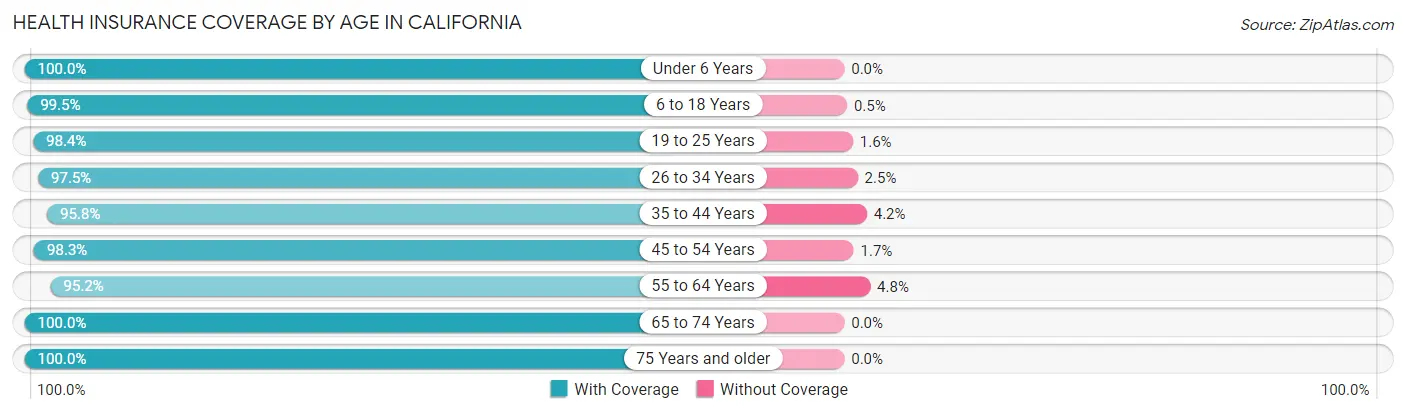
| Age Bracket | With Coverage | Without Coverage |
| Under 6 Years | 915 (100.0%) | 0 (0.0%) |
| 6 to 18 Years | 2,595 (99.5%) | 13 (0.5%) |
| 19 to 25 Years | 1,051 (98.4%) | 17 (1.6%) |
| 26 to 34 Years | 1,995 (97.5%) | 51 (2.5%) |
| 35 to 44 Years | 1,622 (95.8%) | 71 (4.2%) |
| 45 to 54 Years | 1,863 (98.3%) | 33 (1.7%) |
| 55 to 64 Years | 1,776 (95.2%) | 90 (4.8%) |
| 65 to 74 Years | 970 (100.0%) | 0 (0.0%) |
| 75 Years and older | 407 (100.0%) | 0 (0.0%) |
| Total | 13,194 (98.0%) | 275 (2.0%) |
Health Insurance Coverage by Citizenship Status in California
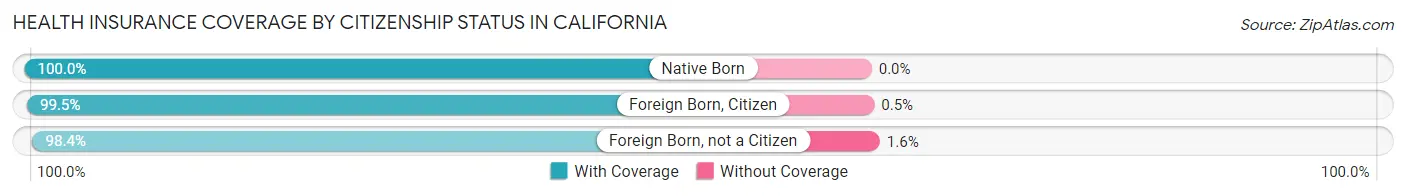
| Citizenship Status | With Coverage | Without Coverage |
| Native Born | 915 (100.0%) | 0 (0.0%) |
| Foreign Born, Citizen | 2,595 (99.5%) | 13 (0.5%) |
| Foreign Born, not a Citizen | 1,051 (98.4%) | 17 (1.6%) |
Health Insurance Coverage by Household Income in California
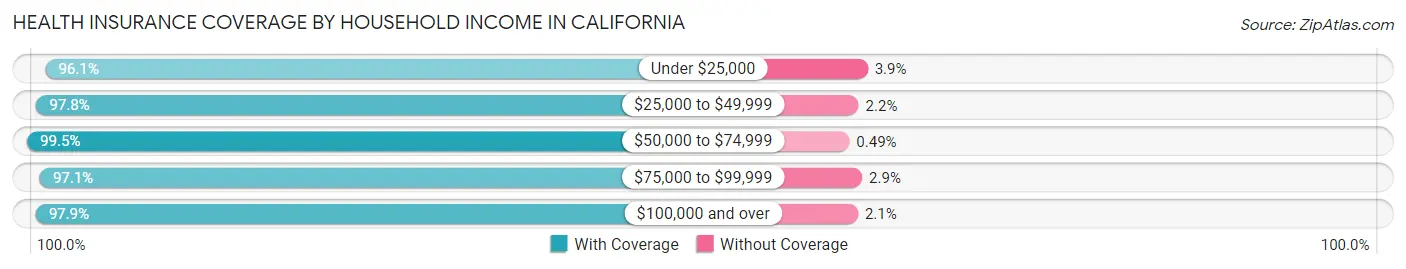
| Household Income | With Coverage | Without Coverage |
| Under $25,000 | 589 (96.1%) | 24 (3.9%) |
| $25,000 to $49,999 | 618 (97.8%) | 14 (2.2%) |
| $50,000 to $74,999 | 1,842 (99.5%) | 9 (0.5%) |
| $75,000 to $99,999 | 1,417 (97.1%) | 42 (2.9%) |
| $100,000 and over | 8,696 (97.9%) | 186 (2.1%) |
Public vs Private Health Insurance Coverage by Age in California
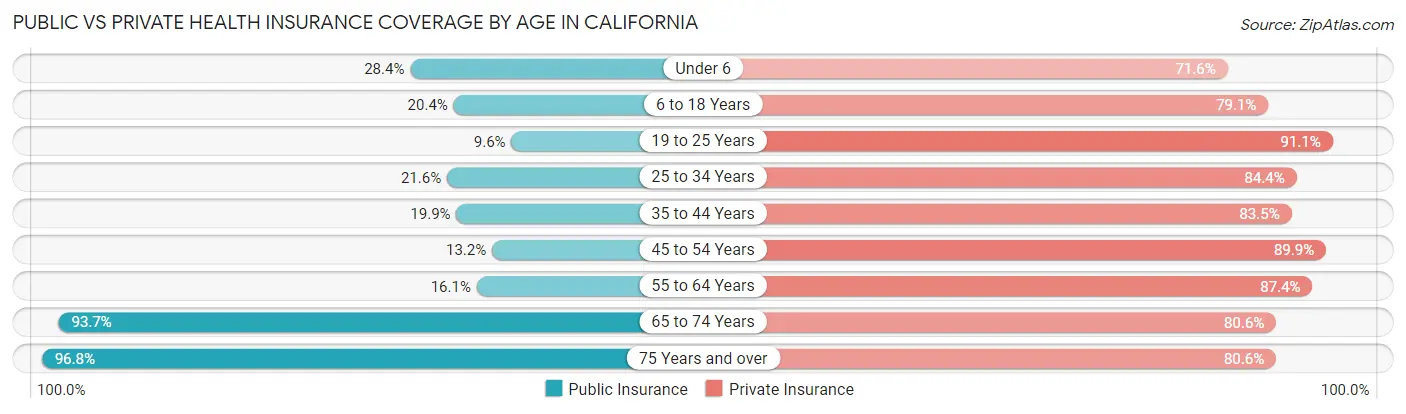
| Age Bracket | Public Insurance | Private Insurance |
| Under 6 | 260 (28.4%) | 655 (71.6%) |
| 6 to 18 Years | 531 (20.4%) | 2,064 (79.1%) |
| 19 to 25 Years | 103 (9.6%) | 973 (91.1%) |
| 25 to 34 Years | 442 (21.6%) | 1,727 (84.4%) |
| 35 to 44 Years | 336 (19.9%) | 1,413 (83.5%) |
| 45 to 54 Years | 251 (13.2%) | 1,704 (89.9%) |
| 55 to 64 Years | 300 (16.1%) | 1,630 (87.4%) |
| 65 to 74 Years | 909 (93.7%) | 782 (80.6%) |
| 75 Years and over | 394 (96.8%) | 328 (80.6%) |
| Total | 3,526 (26.2%) | 11,276 (83.7%) |
Disability Status by Sex by Age in California
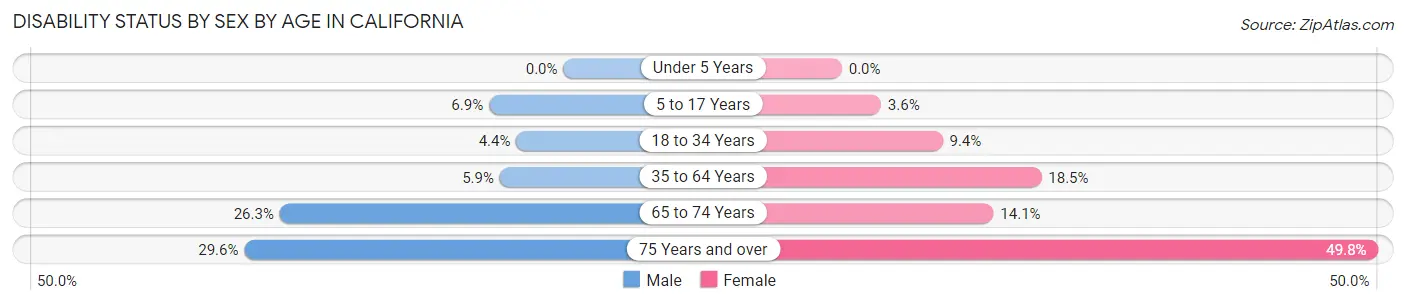
| Age Bracket | Male | Female |
| Under 5 Years | 0 (0.0%) | 0 (0.0%) |
| 5 to 17 Years | 88 (6.9%) | 45 (3.6%) |
| 18 to 34 Years | 88 (4.4%) | 136 (9.3%) |
| 35 to 64 Years | 163 (5.9%) | 499 (18.5%) |
| 65 to 74 Years | 115 (26.3%) | 75 (14.1%) |
| 75 Years and over | 45 (29.6%) | 127 (49.8%) |
Disability Class by Sex by Age in California
Disability Class: Hearing Difficulty
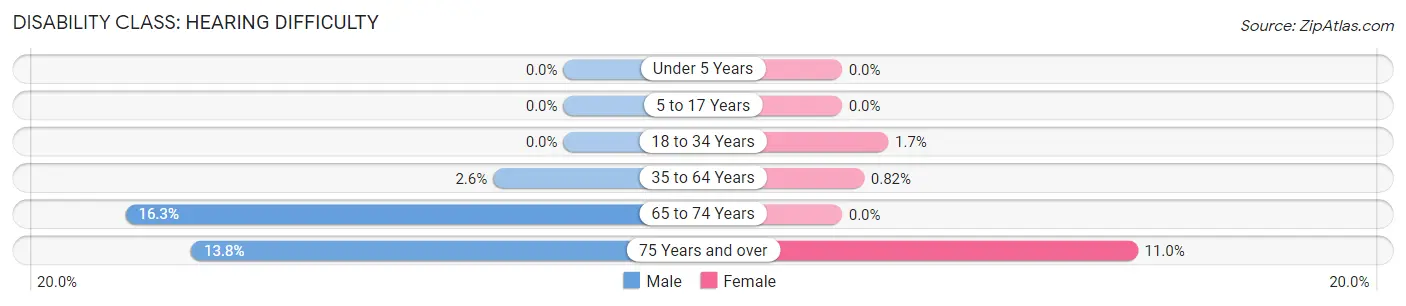
| Age Bracket | Male | Female |
| Under 5 Years | 0 (0.0%) | 0 (0.0%) |
| 5 to 17 Years | 0 (0.0%) | 0 (0.0%) |
| 18 to 34 Years | 0 (0.0%) | 25 (1.7%) |
| 35 to 64 Years | 72 (2.6%) | 22 (0.8%) |
| 65 to 74 Years | 71 (16.3%) | 0 (0.0%) |
| 75 Years and over | 21 (13.8%) | 28 (11.0%) |
Disability Class: Vision Difficulty
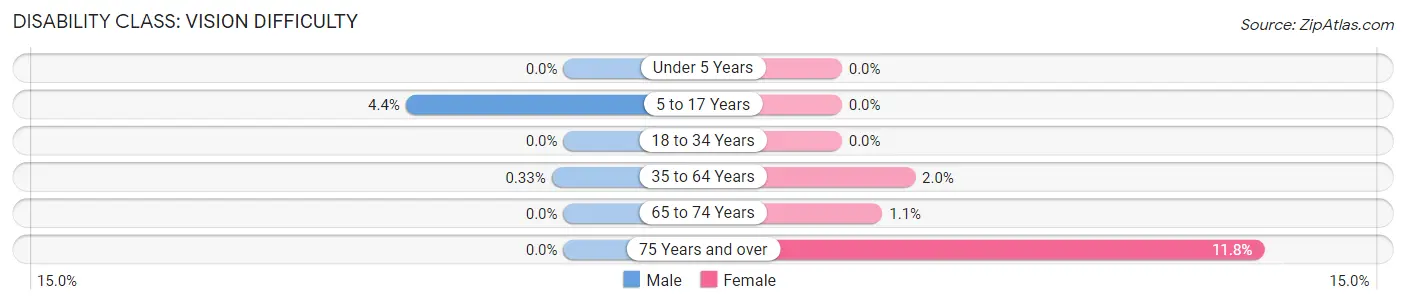
| Age Bracket | Male | Female |
| Under 5 Years | 0 (0.0%) | 0 (0.0%) |
| 5 to 17 Years | 56 (4.4%) | 0 (0.0%) |
| 18 to 34 Years | 0 (0.0%) | 0 (0.0%) |
| 35 to 64 Years | 9 (0.3%) | 55 (2.0%) |
| 65 to 74 Years | 0 (0.0%) | 6 (1.1%) |
| 75 Years and over | 0 (0.0%) | 30 (11.8%) |
Disability Class: Cognitive Difficulty
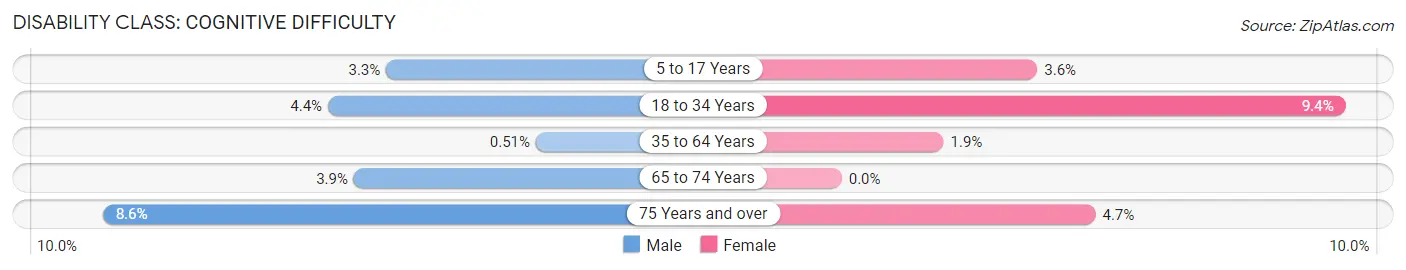
| Age Bracket | Male | Female |
| 5 to 17 Years | 42 (3.3%) | 45 (3.6%) |
| 18 to 34 Years | 88 (4.4%) | 136 (9.3%) |
| 35 to 64 Years | 14 (0.5%) | 51 (1.9%) |
| 65 to 74 Years | 17 (3.9%) | 0 (0.0%) |
| 75 Years and over | 13 (8.6%) | 12 (4.7%) |
Disability Class: Ambulatory Difficulty
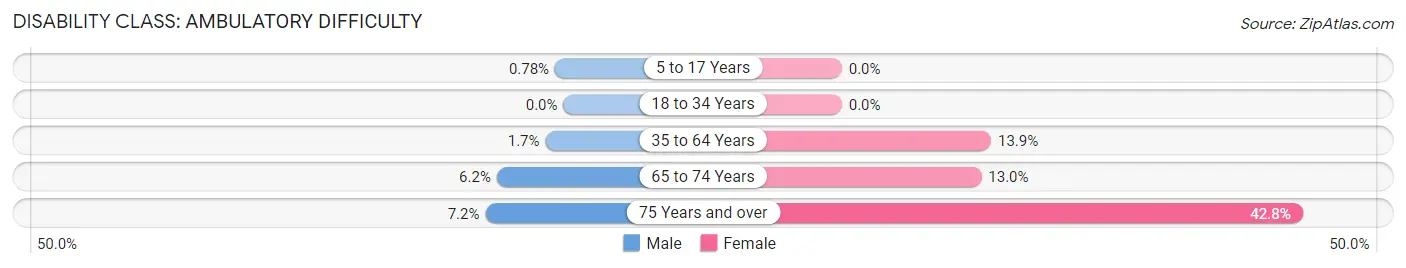
| Age Bracket | Male | Female |
| 5 to 17 Years | 10 (0.8%) | 0 (0.0%) |
| 18 to 34 Years | 0 (0.0%) | 0 (0.0%) |
| 35 to 64 Years | 46 (1.7%) | 373 (13.9%) |
| 65 to 74 Years | 27 (6.2%) | 69 (13.0%) |
| 75 Years and over | 11 (7.2%) | 109 (42.7%) |
Disability Class: Self-Care Difficulty
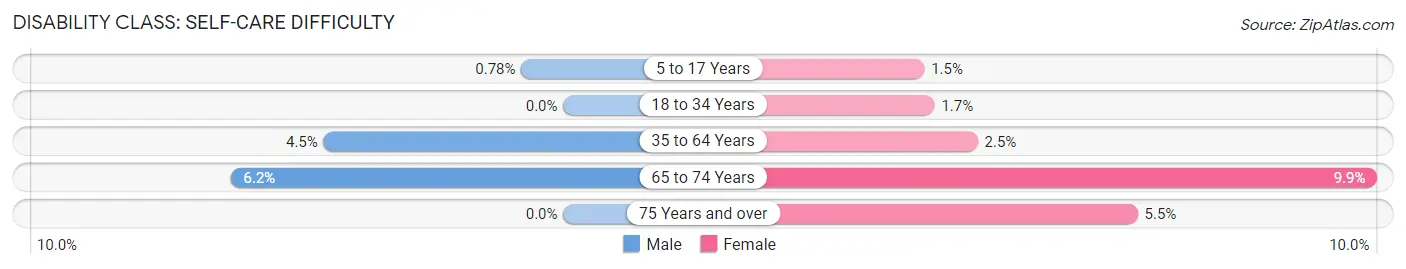
| Age Bracket | Male | Female |
| 5 to 17 Years | 10 (0.8%) | 19 (1.5%) |
| 18 to 34 Years | 0 (0.0%) | 25 (1.7%) |
| 35 to 64 Years | 123 (4.4%) | 68 (2.5%) |
| 65 to 74 Years | 27 (6.2%) | 53 (9.9%) |
| 75 Years and over | 0 (0.0%) | 14 (5.5%) |
Technology Access in California
Computing Device Access in California
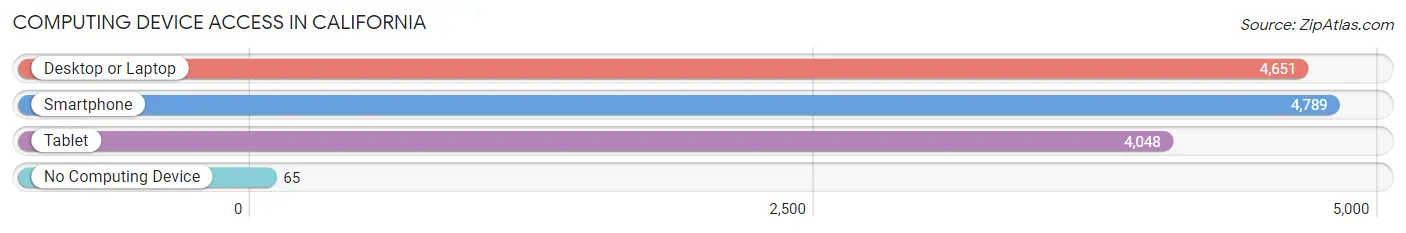
| Device Type | # Households | % Households |
| Desktop or Laptop | 4,651 | 90.6% |
| Smartphone | 4,789 | 93.3% |
| Tablet | 4,048 | 78.9% |
| No Computing Device | 65 | 1.3% |
| Total | 5,131 | 100.0% |
Internet Access in California
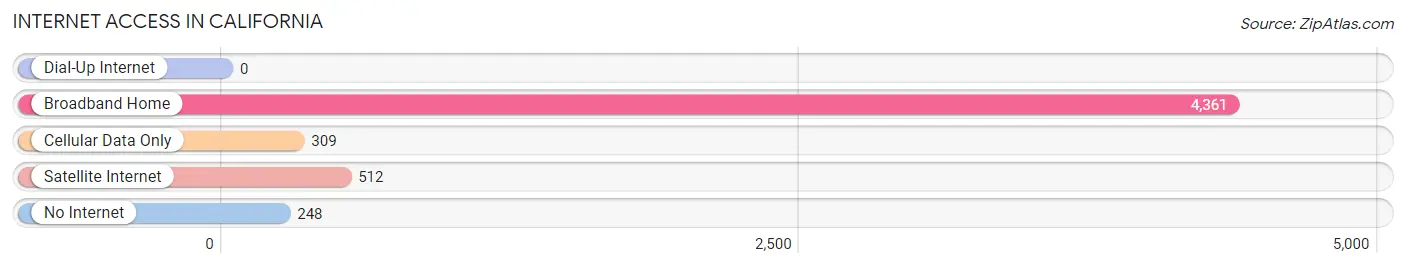
| Internet Type | # Households | % Households |
| Dial-Up Internet | 0 | 0.0% |
| Broadband Home | 4,361 | 85.0% |
| Cellular Data Only | 309 | 6.0% |
| Satellite Internet | 512 | 10.0% |
| No Internet | 248 | 4.8% |
| Total | 5,131 | 100.0% |
California Summary
California, Maryland is a small town located in St. Mary’s County, Maryland, United States. It is situated on the western shore of the Chesapeake Bay, approximately 50 miles south of Washington, D.C. The town was incorporated in 1882 and is home to a population of approximately 9,000 people.
History
The area that is now California, Maryland was first settled in the early 1700s by English colonists. The town was originally known as “Hollywood” and was part of a larger tract of land known as “Hollywood Hundred”. The town was renamed “California” in 1882, after the California Gold Rush of 1849.
The town was a popular destination for tourists in the late 19th and early 20th centuries. It was home to several resorts, including the Hollywood Hotel, which was built in 1887 and was one of the first hotels in the area. The hotel was destroyed by a fire in the early 1900s and was never rebuilt.
The town was also home to a number of other businesses, including a cannery, a shipyard, and a brickyard. The town was also home to a number of churches, including the Hollywood Methodist Church, which was built in 1887 and is still in use today.
Geography
California, Maryland is located on the western shore of the Chesapeake Bay, approximately 50 miles south of Washington, D.C. The town is situated on a peninsula, with the Patuxent River to the north and the St. Mary’s River to the south. The town is bordered by the towns of Hollywood, Leonardtown, and Lexington Park.
The town is home to a number of parks and recreational areas, including the Hollywood Park, which is a popular spot for swimming, fishing, and boating. The town is also home to a number of historic sites, including the Hollywood Cemetery, which was established in 1887 and is the final resting place for many of the town’s early settlers.
Economy
The economy of California, Maryland is largely based on tourism and the service industry. The town is home to a number of restaurants, hotels, and other businesses that cater to tourists. The town is also home to a number of government offices, including the St. Mary’s County Courthouse and the St. Mary’s County Sheriff’s Office.
The town is also home to a number of manufacturing and industrial businesses, including a number of boat builders and a number of seafood processing plants. The town is also home to a number of retail stores, including a number of antique shops and a number of specialty stores.
Demographics
As of the 2010 census, the population of California, Maryland was 8,895. The town has a population that is largely white (86.3%), with a small percentage of African Americans (7.2%) and Hispanics (3.2%). The median household income in the town is $60,945, and the median home value is $269,400. The town has a high rate of homeownership (83.3%) and a low rate of poverty (7.2%).
Common Questions
What is Per Capita Income in California?
Per Capita income in California is $59,170.
What is the Median Family Income in California?
Median Family Income in California is $142,143.
What is the Median Household income in California?
Median Household Income in California is $112,385.
What is Income or Wage Gap in California?
Income or Wage Gap in California is 39.3%.
Women in California earn 60.7 cents for every dollar earned by a man.
What is Inequality or Gini Index in California?
Inequality or Gini Index in California is 0.44.
What is the Total Population of California?
Total Population of California is 13,635.
What is the Total Male Population of California?
Total Male Population of California is 7,069.
What is the Total Female Population of California?
Total Female Population of California is 6,566.
What is the Ratio of Males per 100 Females in California?
There are 107.66 Males per 100 Females in California.
What is the Ratio of Females per 100 Males in California?
There are 92.88 Females per 100 Males in California.
What is the Median Population Age in California?
Median Population Age in California is 35.7 Years.
What is the Average Family Size in California
Average Family Size in California is 3.3 People.
What is the Average Household Size in California
Average Household Size in California is 2.6 People.
How Large is the Labor Force in California?
There are 8,301 People in the Labor Forcein in California.
What is the Percentage of People in the Labor Force in California?
76.1% of People are in the Labor Force in California.
What is the Unemployment Rate in California?
Unemployment Rate in California is 1.2%.