Chesapeake Ranch Estates, MD Map & Demographics
Chesapeake Ranch Estates Map
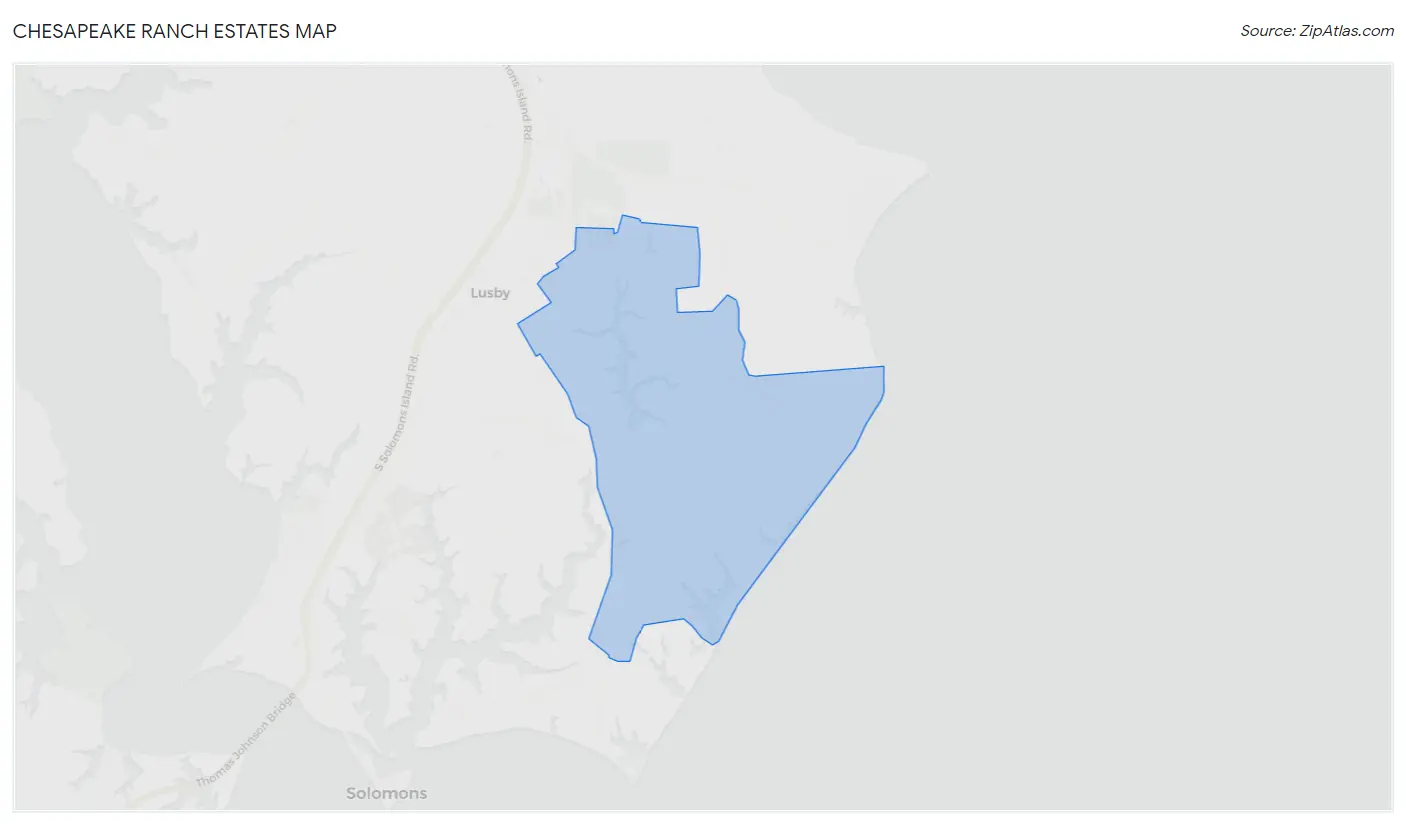
Chesapeake Ranch Estates Overview
$46,399
PER CAPITA INCOME
$104,125
AVG FAMILY INCOME
$93,571
AVG HOUSEHOLD INCOME
35.1%
WAGE / INCOME GAP [ % ]
64.9¢/ $1
WAGE / INCOME GAP [ $ ]
$14,929
FAMILY INCOME DEFICIT
0.40
INEQUALITY / GINI INDEX
10,015
TOTAL POPULATION
4,985
MALE POPULATION
5,030
FEMALE POPULATION
99.11
MALES / 100 FEMALES
100.90
FEMALES / 100 MALES
35.6
MEDIAN AGE
3.1
AVG FAMILY SIZE
2.9
AVG HOUSEHOLD SIZE
5,646
LABOR FORCE [ PEOPLE ]
71.3%
PERCENT IN LABOR FORCE
2.7%
UNEMPLOYMENT RATE
Income in Chesapeake Ranch Estates
Income Overview in Chesapeake Ranch Estates
Per Capita Income in Chesapeake Ranch Estates is $46,399, while median incomes of families and households are $104,125 and $93,571 respectively.
| Characteristic | Number | Measure |
| Per Capita Income | 10,015 | $46,399 |
| Median Family Income | 2,759 | $104,125 |
| Mean Family Income | 2,759 | $140,502 |
| Median Household Income | 3,464 | $93,571 |
| Mean Household Income | 3,464 | $132,164 |
| Income Deficit | 2,759 | $14,929 |
| Wage / Income Gap (%) | 10,015 | 35.11% |
| Wage / Income Gap ($) | 10,015 | 64.89¢ per $1 |
| Gini / Inequality Index | 10,015 | 0.40 |
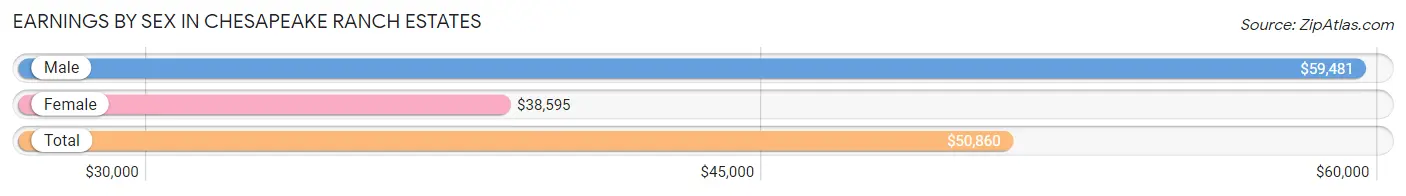
Earnings by Sex in Chesapeake Ranch Estates
Average Earnings in Chesapeake Ranch Estates are $50,860, $59,481 for men and $38,595 for women, a difference of 35.1%.
| Sex | Number | Average Earnings |
| Male | 3,290 (54.8%) | $59,481 |
| Female | 2,715 (45.2%) | $38,595 |
| Total | 6,005 (100.0%) | $50,860 |
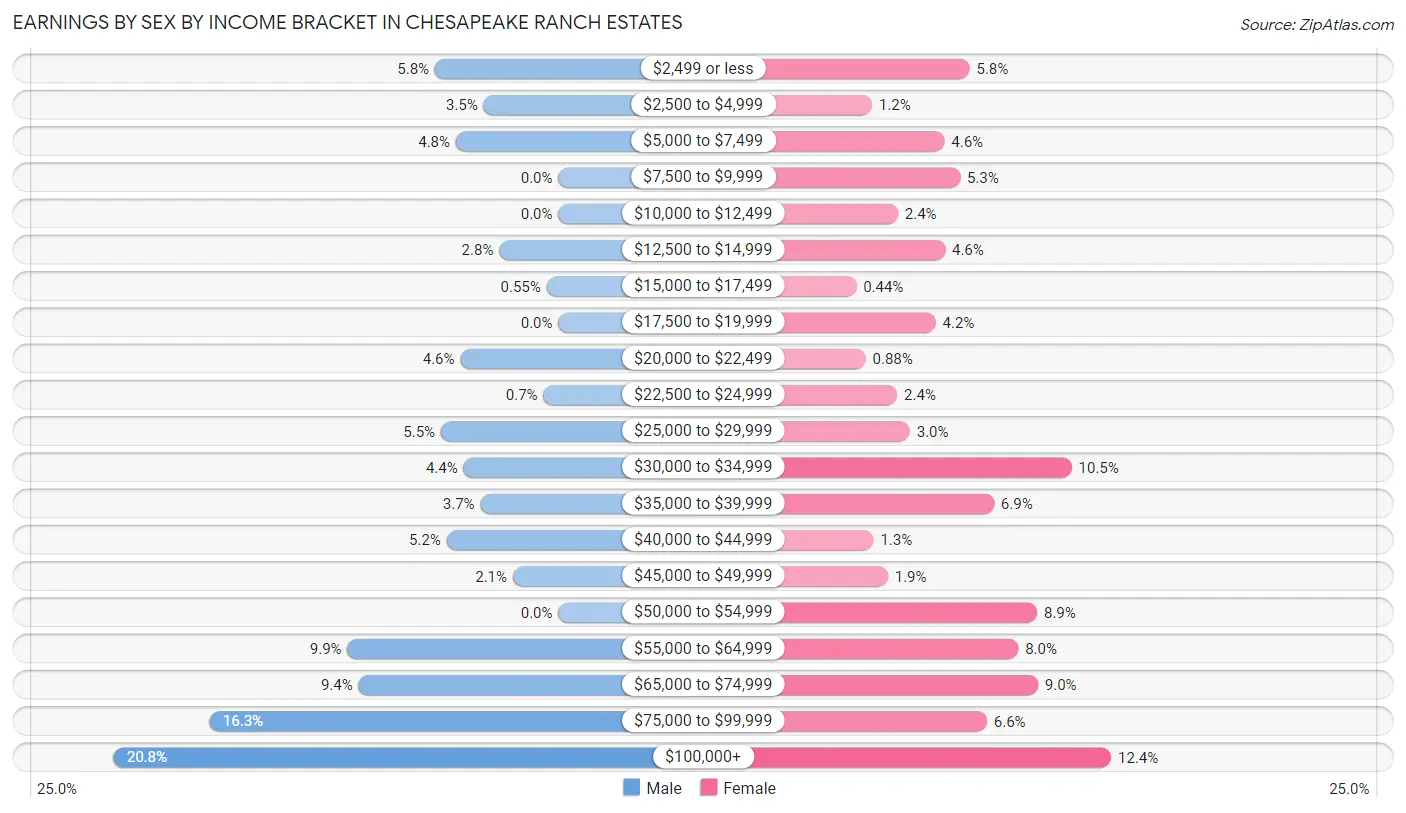
Earnings by Sex by Income Bracket in Chesapeake Ranch Estates
The most common earnings brackets in Chesapeake Ranch Estates are $100,000+ for men (685 | 20.8%) and $100,000+ for women (336 | 12.4%).
| Income | Male | Female |
| $2,499 or less | 190 (5.8%) | 156 (5.8%) |
| $2,500 to $4,999 | 115 (3.5%) | 32 (1.2%) |
| $5,000 to $7,499 | 158 (4.8%) | 124 (4.6%) |
| $7,500 to $9,999 | 0 (0.0%) | 144 (5.3%) |
| $10,000 to $12,499 | 0 (0.0%) | 65 (2.4%) |
| $12,500 to $14,999 | 91 (2.8%) | 125 (4.6%) |
| $15,000 to $17,499 | 18 (0.5%) | 12 (0.4%) |
| $17,500 to $19,999 | 0 (0.0%) | 113 (4.2%) |
| $20,000 to $22,499 | 151 (4.6%) | 24 (0.9%) |
| $22,500 to $24,999 | 23 (0.7%) | 64 (2.4%) |
| $25,000 to $29,999 | 181 (5.5%) | 80 (2.9%) |
| $30,000 to $34,999 | 146 (4.4%) | 286 (10.5%) |
| $35,000 to $39,999 | 120 (3.6%) | 187 (6.9%) |
| $40,000 to $44,999 | 172 (5.2%) | 34 (1.3%) |
| $45,000 to $49,999 | 70 (2.1%) | 52 (1.9%) |
| $50,000 to $54,999 | 0 (0.0%) | 242 (8.9%) |
| $55,000 to $64,999 | 325 (9.9%) | 218 (8.0%) |
| $65,000 to $74,999 | 308 (9.4%) | 243 (8.9%) |
| $75,000 to $99,999 | 537 (16.3%) | 178 (6.6%) |
| $100,000+ | 685 (20.8%) | 336 (12.4%) |
| Total | 3,290 (100.0%) | 2,715 (100.0%) |
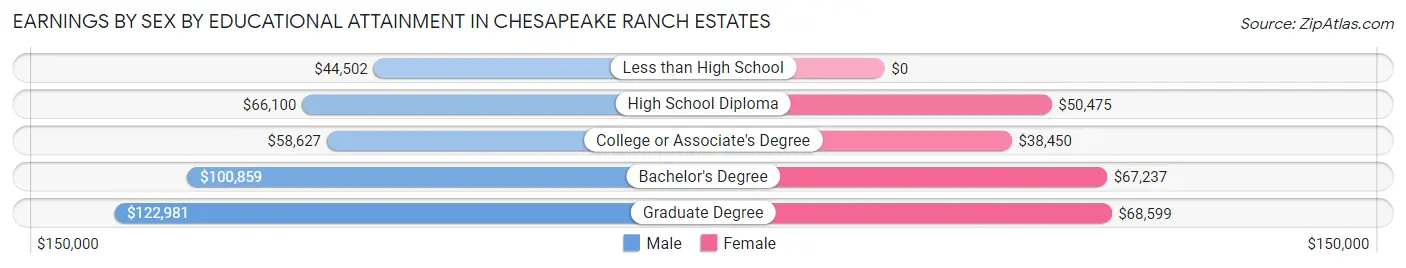
Earnings by Sex by Educational Attainment in Chesapeake Ranch Estates
Average earnings in Chesapeake Ranch Estates are $68,538 for men and $50,724 for women, a difference of 26.0%. Men with an educational attainment of graduate degree enjoy the highest average annual earnings of $122,981, while those with less than high school education earn the least with $44,502. Women with an educational attainment of graduate degree earn the most with the average annual earnings of $68,599, while those with college or associate's degree education have the smallest earnings of $38,450.
| Educational Attainment | Male Income | Female Income |
| Less than High School | $44,502 | $0 |
| High School Diploma | $66,100 | $50,475 |
| College or Associate's Degree | $58,627 | $38,450 |
| Bachelor's Degree | $100,859 | $67,237 |
| Graduate Degree | $122,981 | $68,599 |
| Total | $68,538 | $50,724 |
Family Income in Chesapeake Ranch Estates
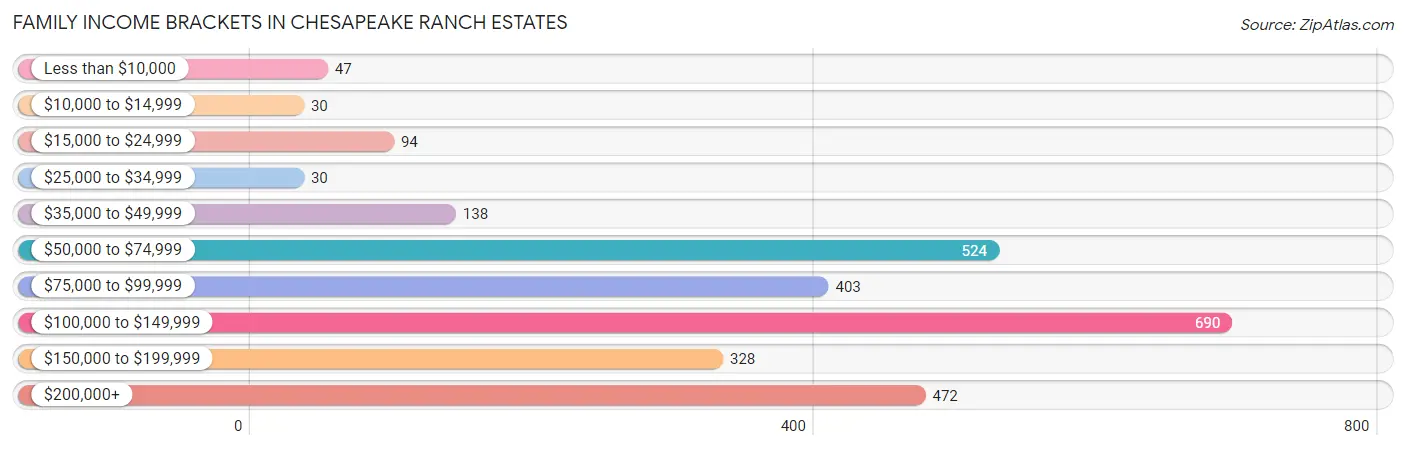
Family Income Brackets in Chesapeake Ranch Estates
According to the Chesapeake Ranch Estates family income data, there are 690 families falling into the $100,000 to $149,999 income range, which is the most common income bracket and makes up 25.0% of all families. Conversely, the $10,000 to $14,999 income bracket is the least frequent group with only 30 families (1.1%) belonging to this category.
| Income Bracket | # Families | % Families |
| Less than $10,000 | 47 | 1.7% |
| $10,000 to $14,999 | 30 | 1.1% |
| $15,000 to $24,999 | 94 | 3.4% |
| $25,000 to $34,999 | 30 | 1.1% |
| $35,000 to $49,999 | 138 | 5.0% |
| $50,000 to $74,999 | 524 | 19.0% |
| $75,000 to $99,999 | 403 | 14.6% |
| $100,000 to $149,999 | 690 | 25.0% |
| $150,000 to $199,999 | 328 | 11.9% |
| $200,000+ | 472 | 17.1% |
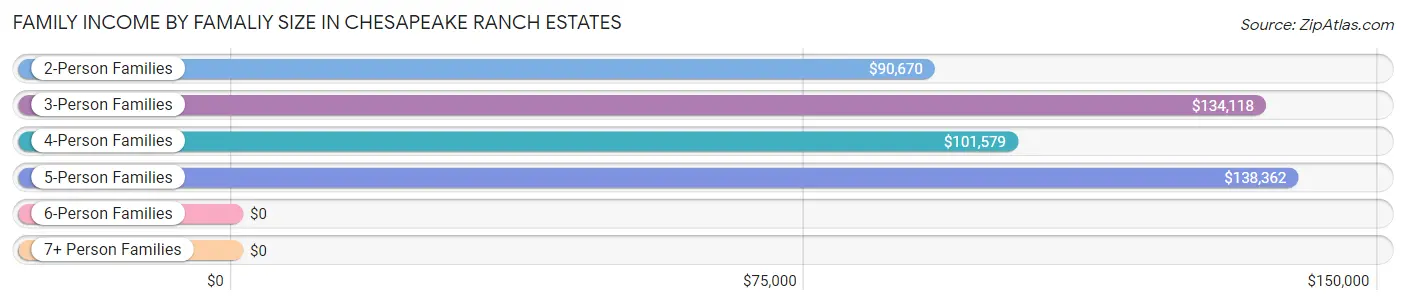
Family Income by Famaliy Size in Chesapeake Ranch Estates
5-person families (266 | 9.6%) account for the highest median family income in Chesapeake Ranch Estates with $138,362 per family, while 2-person families (1,291 | 46.8%) have the highest median income of $45,335 per family member.
| Income Bracket | # Families | Median Income |
| 2-Person Families | 1,291 (46.8%) | $90,670 |
| 3-Person Families | 578 (20.9%) | $134,118 |
| 4-Person Families | 522 (18.9%) | $101,579 |
| 5-Person Families | 266 (9.6%) | $138,362 |
| 6-Person Families | 90 (3.3%) | $0 |
| 7+ Person Families | 12 (0.4%) | $0 |
| Total | 2,759 (100.0%) | $104,125 |
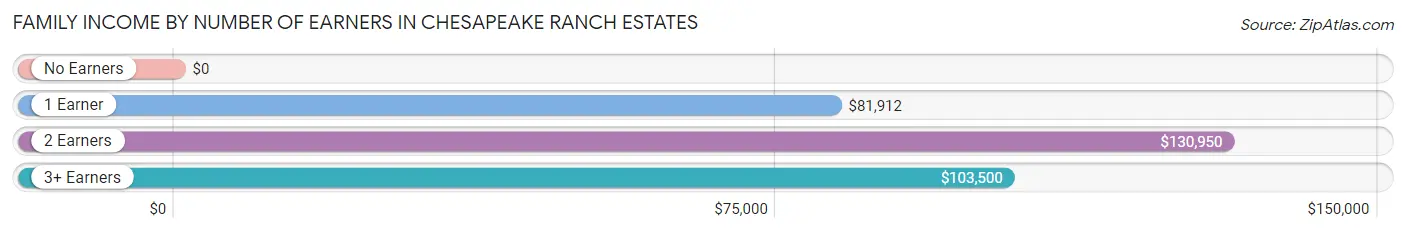
Family Income by Number of Earners in Chesapeake Ranch Estates
| Number of Earners | # Families | Median Income |
| No Earners | 268 (9.7%) | $0 |
| 1 Earner | 686 (24.9%) | $81,912 |
| 2 Earners | 1,461 (52.9%) | $130,950 |
| 3+ Earners | 344 (12.5%) | $103,500 |
| Total | 2,759 (100.0%) | $104,125 |
Household Income in Chesapeake Ranch Estates
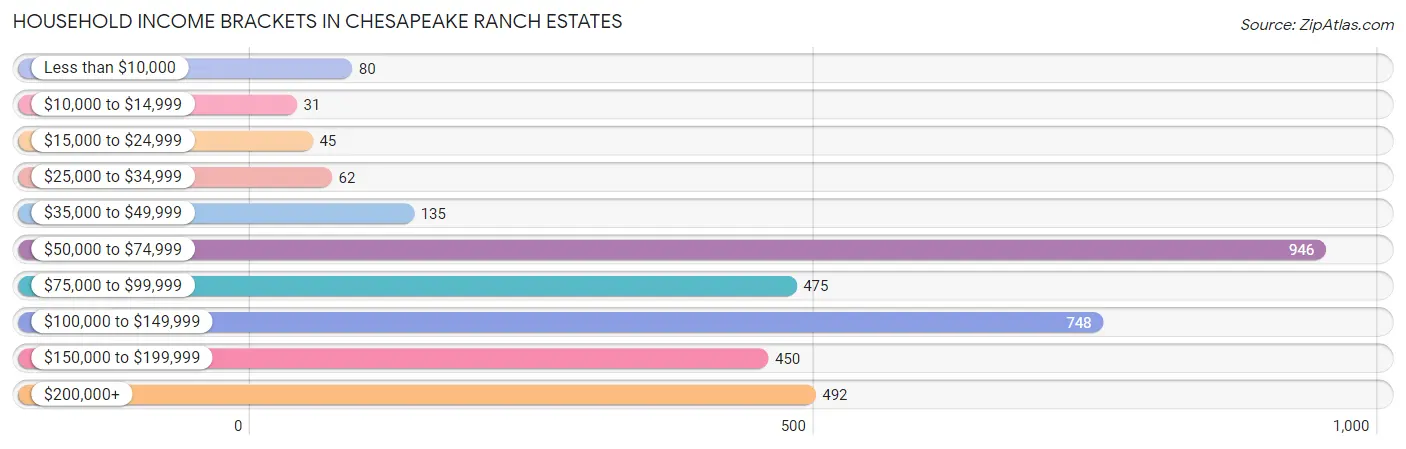
Household Income Brackets in Chesapeake Ranch Estates
With 946 households falling in the category, the $50,000 to $74,999 income range is the most frequent in Chesapeake Ranch Estates, accounting for 27.3% of all households. In contrast, only 31 households (0.9%) fall into the $10,000 to $14,999 income bracket, making it the least populous group.
| Income Bracket | # Households | % Households |
| Less than $10,000 | 80 | 2.3% |
| $10,000 to $14,999 | 31 | 0.9% |
| $15,000 to $24,999 | 45 | 1.3% |
| $25,000 to $34,999 | 62 | 1.8% |
| $35,000 to $49,999 | 135 | 3.9% |
| $50,000 to $74,999 | 946 | 27.3% |
| $75,000 to $99,999 | 475 | 13.7% |
| $100,000 to $149,999 | 748 | 21.6% |
| $150,000 to $199,999 | 450 | 13.0% |
| $200,000+ | 492 | 14.2% |
Household Income by Householder Age in Chesapeake Ranch Estates
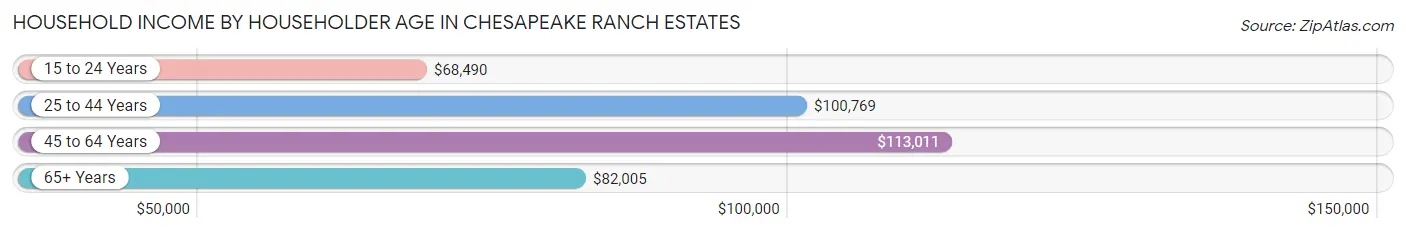
The median household income in Chesapeake Ranch Estates is $93,571, with the highest median household income of $113,011 found in the 45 to 64 years age bracket for the primary householder. A total of 1,539 households (44.4%) fall into this category. Meanwhile, the 15 to 24 years age bracket for the primary householder has the lowest median household income of $68,490, with 104 households (3.0%) in this group.
| Income Bracket | # Households | Median Income |
| 15 to 24 Years | 104 (3.0%) | $68,490 |
| 25 to 44 Years | 1,378 (39.8%) | $100,769 |
| 45 to 64 Years | 1,539 (44.4%) | $113,011 |
| 65+ Years | 443 (12.8%) | $82,005 |
| Total | 3,464 (100.0%) | $93,571 |
Poverty in Chesapeake Ranch Estates
Income Below Poverty by Sex and Age in Chesapeake Ranch Estates
With 5.8% poverty level for males and 6.6% for females among the residents of Chesapeake Ranch Estates, 6 to 11 year old males and 15 year old females are the most vulnerable to poverty, with 66 males (14.6%) and 12 females (100.0%) in their respective age groups living below the poverty level.
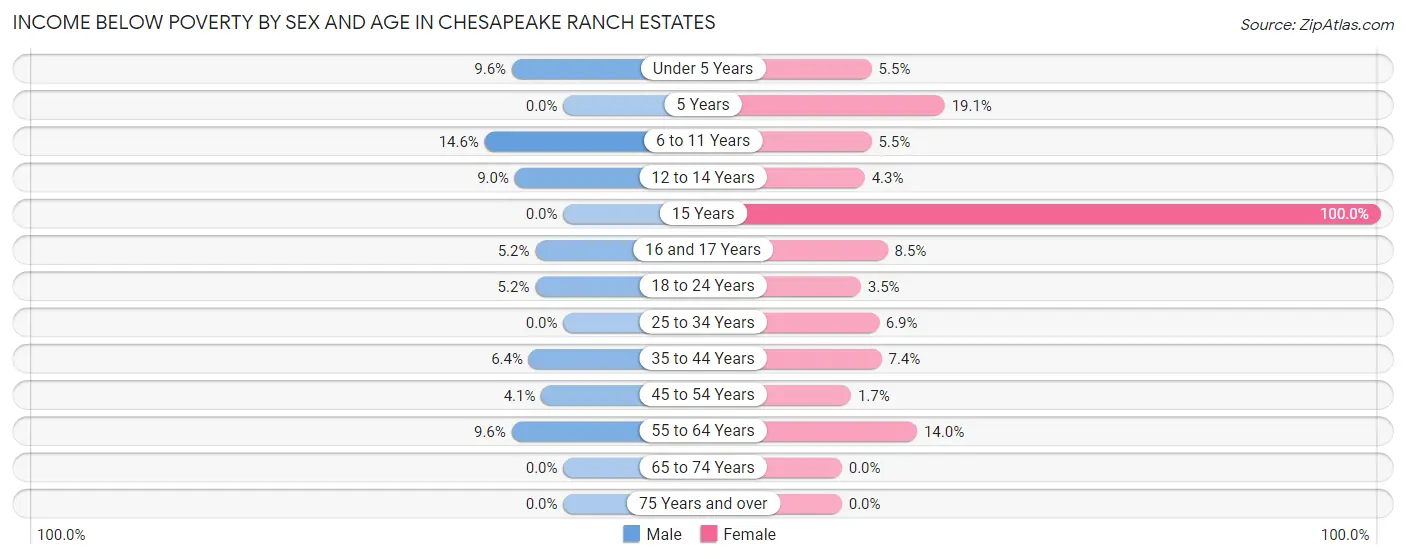
| Age Bracket | Male | Female |
| Under 5 Years | 32 (9.6%) | 22 (5.5%) |
| 5 Years | 0 (0.0%) | 17 (19.1%) |
| 6 to 11 Years | 66 (14.6%) | 17 (5.5%) |
| 12 to 14 Years | 10 (9.0%) | 14 (4.3%) |
| 15 Years | 0 (0.0%) | 12 (100.0%) |
| 16 and 17 Years | 11 (5.2%) | 13 (8.5%) |
| 18 to 24 Years | 18 (5.2%) | 18 (3.5%) |
| 25 to 34 Years | 0 (0.0%) | 43 (6.9%) |
| 35 to 44 Years | 45 (6.4%) | 54 (7.4%) |
| 45 to 54 Years | 23 (4.1%) | 11 (1.7%) |
| 55 to 64 Years | 84 (9.6%) | 110 (14.0%) |
| 65 to 74 Years | 0 (0.0%) | 0 (0.0%) |
| 75 Years and over | 0 (0.0%) | 0 (0.0%) |
| Total | 289 (5.8%) | 331 (6.6%) |
Income Above Poverty by Sex and Age in Chesapeake Ranch Estates
According to the poverty statistics in Chesapeake Ranch Estates, males aged 5 years and females aged 65 to 74 years are the age groups that are most secure financially, with 100.0% of males and 100.0% of females in these age groups living above the poverty line.
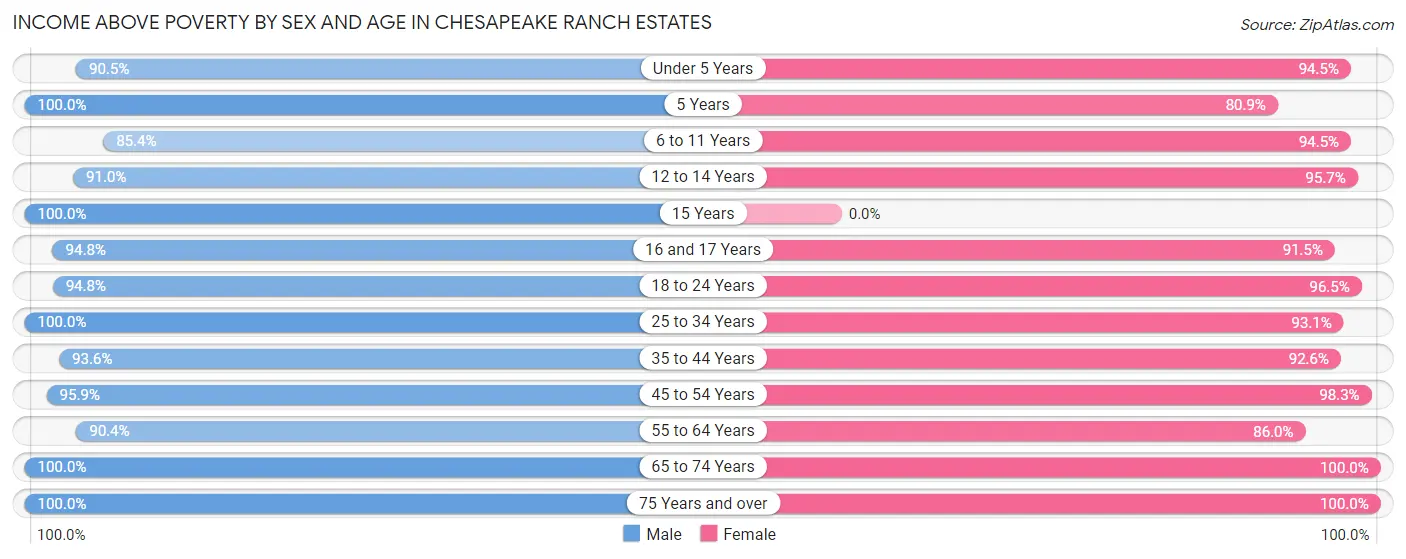
| Age Bracket | Male | Female |
| Under 5 Years | 303 (90.4%) | 375 (94.5%) |
| 5 Years | 50 (100.0%) | 72 (80.9%) |
| 6 to 11 Years | 386 (85.4%) | 292 (94.5%) |
| 12 to 14 Years | 101 (91.0%) | 315 (95.7%) |
| 15 Years | 13 (100.0%) | 0 (0.0%) |
| 16 and 17 Years | 200 (94.8%) | 140 (91.5%) |
| 18 to 24 Years | 327 (94.8%) | 491 (96.5%) |
| 25 to 34 Years | 905 (100.0%) | 584 (93.1%) |
| 35 to 44 Years | 657 (93.6%) | 678 (92.6%) |
| 45 to 54 Years | 539 (95.9%) | 637 (98.3%) |
| 55 to 64 Years | 791 (90.4%) | 678 (86.0%) |
| 65 to 74 Years | 358 (100.0%) | 296 (100.0%) |
| 75 Years and over | 66 (100.0%) | 141 (100.0%) |
| Total | 4,696 (94.2%) | 4,699 (93.4%) |
Income Below Poverty Among Married-Couple Families in Chesapeake Ranch Estates
The poverty statistics for married-couple families in Chesapeake Ranch Estates show that 3.5% or 67 of the total 1,942 families live below the poverty line. Families with 3 or 4 children have the highest poverty rate of 14.3%, comprising of 37 families. On the other hand, families with 1 or 2 children have the lowest poverty rate of 0.0%, which includes 0 families.
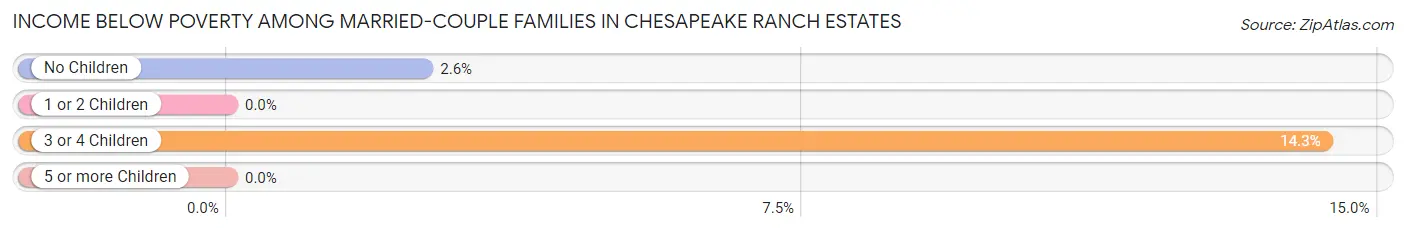
| Children | Above Poverty | Below Poverty |
| No Children | 1,146 (97.5%) | 30 (2.5%) |
| 1 or 2 Children | 507 (100.0%) | 0 (0.0%) |
| 3 or 4 Children | 222 (85.7%) | 37 (14.3%) |
| 5 or more Children | 0 (0.0%) | 0 (0.0%) |
| Total | 1,875 (96.6%) | 67 (3.5%) |
Income Below Poverty Among Single-Parent Households in Chesapeake Ranch Estates
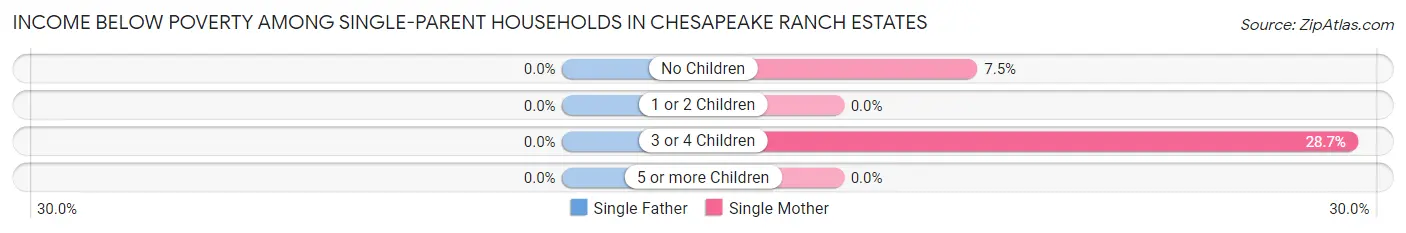
| Children | Single Father | Single Mother |
| No Children | 0 (0.0%) | 18 (7.5%) |
| 1 or 2 Children | 0 (0.0%) | 0 (0.0%) |
| 3 or 4 Children | 0 (0.0%) | 27 (28.7%) |
| 5 or more Children | 0 (0.0%) | 0 (0.0%) |
| Total | 0 (0.0%) | 45 (9.8%) |
Income Below Poverty Among Married-Couple vs Single-Parent Households in Chesapeake Ranch Estates
The poverty data for Chesapeake Ranch Estates shows that 67 of the married-couple family households (3.5%) and 45 of the single-parent households (5.5%) are living below the poverty level. Within the married-couple family households, those with 3 or 4 children have the highest poverty rate, with 37 households (14.3%) falling below the poverty line. Among the single-parent households, those with 3 or 4 children have the highest poverty rate, with 27 household (15.9%) living below poverty.
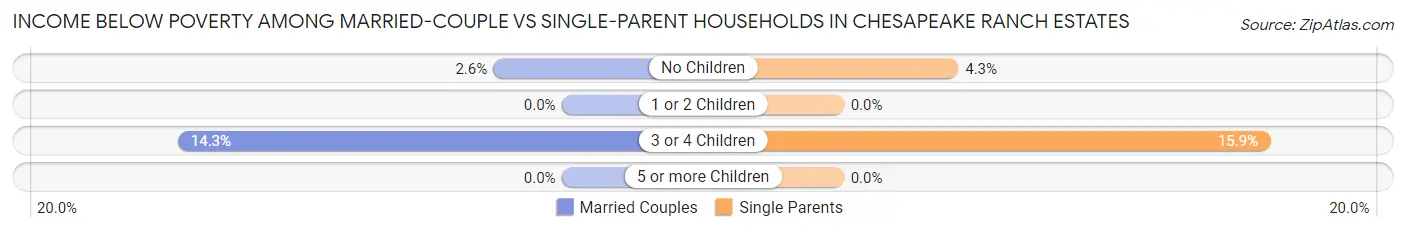
| Children | Married-Couple Families | Single-Parent Households |
| No Children | 30 (2.5%) | 18 (4.3%) |
| 1 or 2 Children | 0 (0.0%) | 0 (0.0%) |
| 3 or 4 Children | 37 (14.3%) | 27 (15.9%) |
| 5 or more Children | 0 (0.0%) | 0 (0.0%) |
| Total | 67 (3.5%) | 45 (5.5%) |
Race in Chesapeake Ranch Estates
The most populous races in Chesapeake Ranch Estates are White / Caucasian (7,338 | 73.3%), Black / African American (1,565 | 15.6%), and Two or more Races (831 | 8.3%).
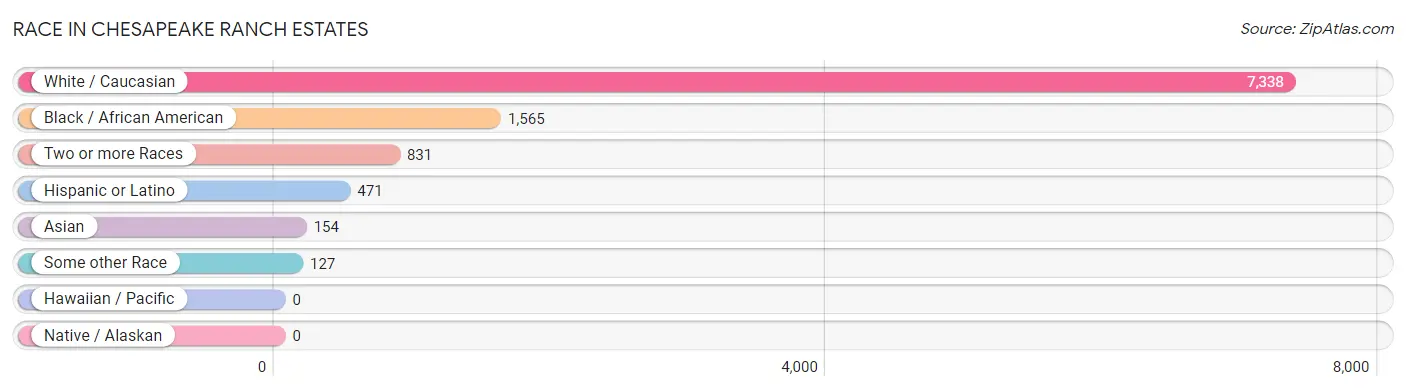
| Race | # Population | % Population |
| Asian | 154 | 1.5% |
| Black / African American | 1,565 | 15.6% |
| Hawaiian / Pacific | 0 | 0.0% |
| Hispanic or Latino | 471 | 4.7% |
| Native / Alaskan | 0 | 0.0% |
| White / Caucasian | 7,338 | 73.3% |
| Two or more Races | 831 | 8.3% |
| Some other Race | 127 | 1.3% |
| Total | 10,015 | 100.0% |
Ancestry in Chesapeake Ranch Estates
The most populous ancestries reported in Chesapeake Ranch Estates are American (1,280 | 12.8%), German (1,190 | 11.9%), English (939 | 9.4%), Irish (916 | 9.1%), and Italian (747 | 7.5%), together accounting for 50.6% of all Chesapeake Ranch Estates residents.
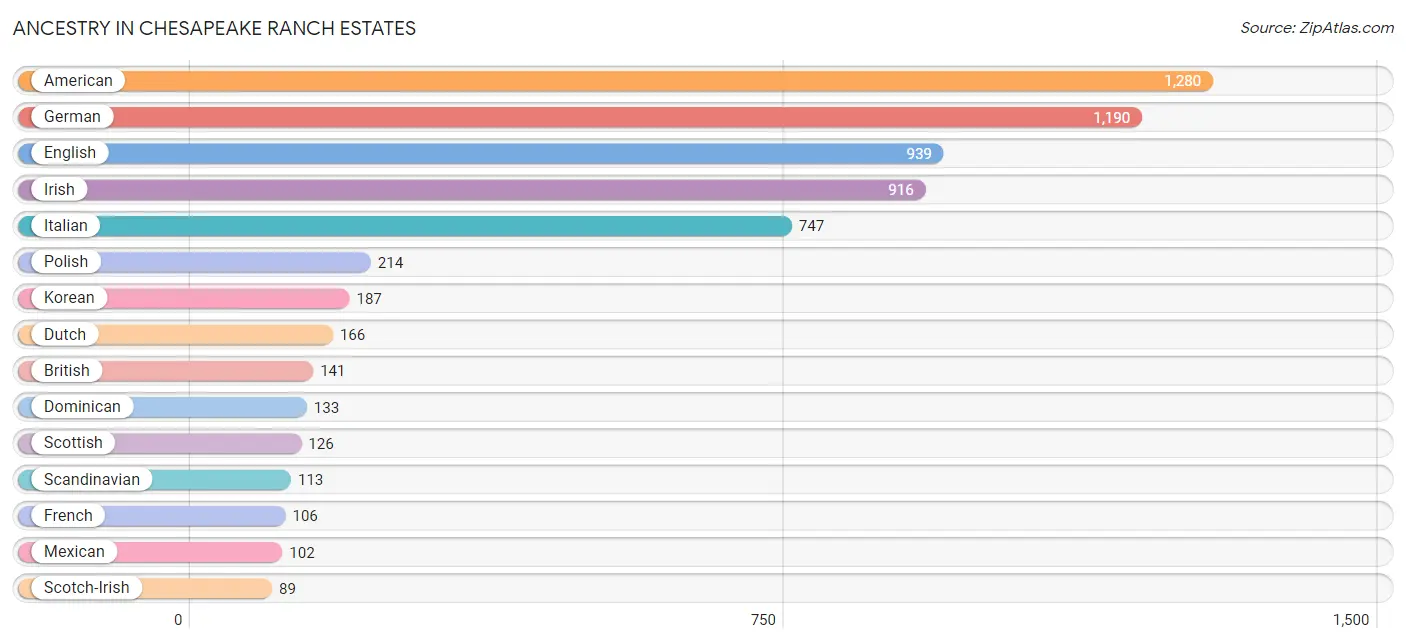
| Ancestry | # Population | % Population |
| American | 1,280 | 12.8% |
| Bhutanese | 18 | 0.2% |
| British | 141 | 1.4% |
| Canadian | 21 | 0.2% |
| Celtic | 18 | 0.2% |
| Central American | 66 | 0.7% |
| Colombian | 31 | 0.3% |
| Cuban | 42 | 0.4% |
| Czech | 31 | 0.3% |
| Dominican | 133 | 1.3% |
| Dutch | 166 | 1.7% |
| Eastern European | 33 | 0.3% |
| English | 939 | 9.4% |
| European | 34 | 0.3% |
| French | 106 | 1.1% |
| French Canadian | 81 | 0.8% |
| German | 1,190 | 11.9% |
| Greek | 24 | 0.2% |
| Hungarian | 42 | 0.4% |
| Iranian | 31 | 0.3% |
| Irish | 916 | 9.1% |
| Italian | 747 | 7.5% |
| Korean | 187 | 1.9% |
| Mexican | 102 | 1.0% |
| Native Hawaiian | 25 | 0.3% |
| Norwegian | 39 | 0.4% |
| Polish | 214 | 2.1% |
| Portuguese | 17 | 0.2% |
| Puerto Rican | 74 | 0.7% |
| Russian | 39 | 0.4% |
| Salvadoran | 66 | 0.7% |
| Scandinavian | 113 | 1.1% |
| Scotch-Irish | 89 | 0.9% |
| Scottish | 126 | 1.3% |
| Slovak | 33 | 0.3% |
| South American | 31 | 0.3% |
| Spaniard | 23 | 0.2% |
| Swedish | 56 | 0.6% |
| Thai | 30 | 0.3% |
| Trinidadian and Tobagonian | 9 | 0.1% |
| Ukrainian | 19 | 0.2% | View All 41 Rows |
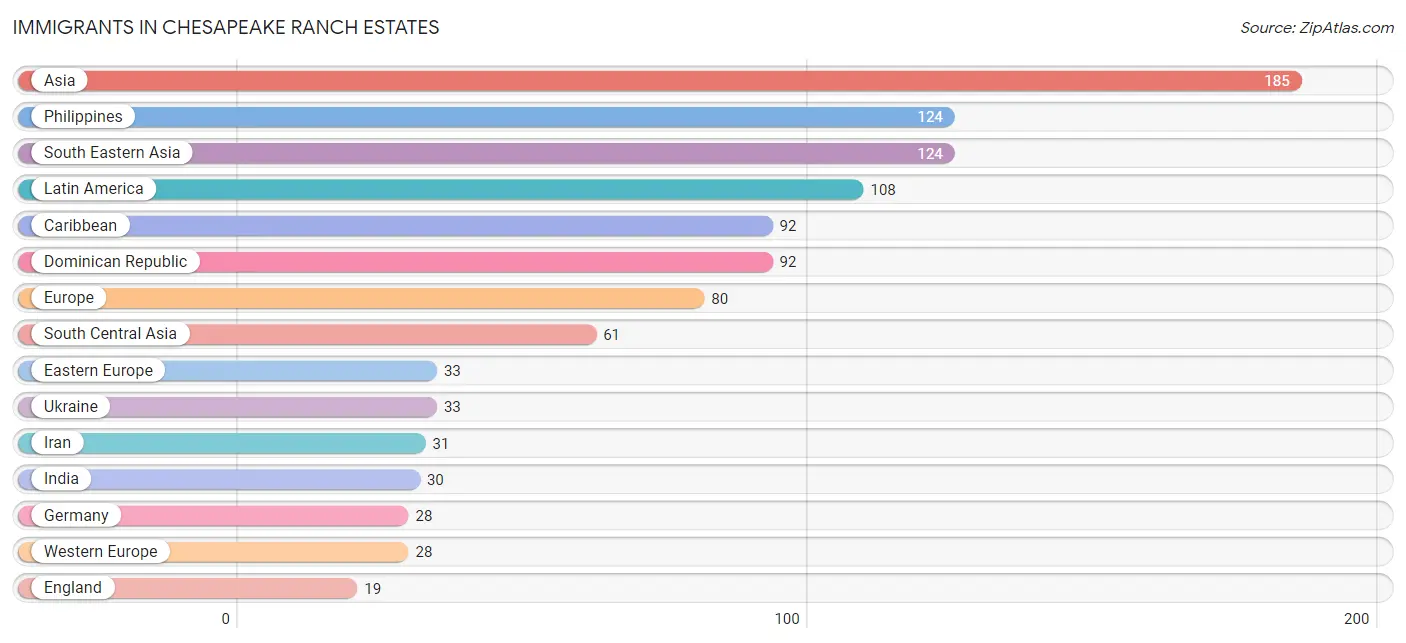
Immigrants in Chesapeake Ranch Estates
The most numerous immigrant groups reported in Chesapeake Ranch Estates came from Asia (185 | 1.8%), Philippines (124 | 1.2%), South Eastern Asia (124 | 1.2%), Latin America (108 | 1.1%), and Caribbean (92 | 0.9%), together accounting for 6.3% of all Chesapeake Ranch Estates residents.
| Immigration Origin | # Population | % Population |
| Asia | 185 | 1.8% |
| Caribbean | 92 | 0.9% |
| Central America | 16 | 0.2% |
| Dominican Republic | 92 | 0.9% |
| Eastern Europe | 33 | 0.3% |
| El Salvador | 16 | 0.2% |
| England | 19 | 0.2% |
| Europe | 80 | 0.8% |
| Germany | 28 | 0.3% |
| India | 30 | 0.3% |
| Iran | 31 | 0.3% |
| Latin America | 108 | 1.1% |
| Northern Europe | 19 | 0.2% |
| Philippines | 124 | 1.2% |
| South Central Asia | 61 | 0.6% |
| South Eastern Asia | 124 | 1.2% |
| Ukraine | 33 | 0.3% |
| Western Europe | 28 | 0.3% | View All 18 Rows |
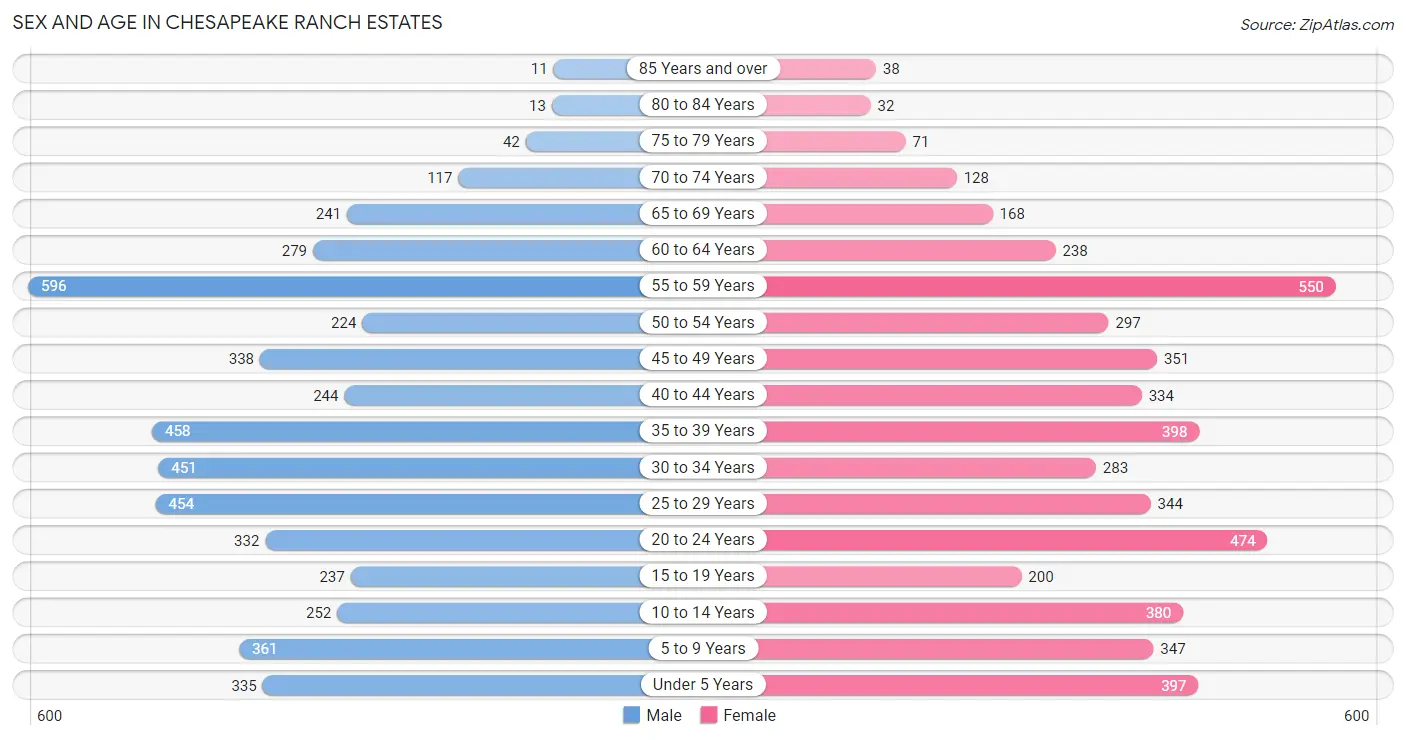
Sex and Age in Chesapeake Ranch Estates
Sex and Age in Chesapeake Ranch Estates
The most populous age groups in Chesapeake Ranch Estates are 55 to 59 Years (596 | 12.0%) for men and 55 to 59 Years (550 | 10.9%) for women.
| Age Bracket | Male | Female |
| Under 5 Years | 335 (6.7%) | 397 (7.9%) |
| 5 to 9 Years | 361 (7.2%) | 347 (6.9%) |
| 10 to 14 Years | 252 (5.1%) | 380 (7.5%) |
| 15 to 19 Years | 237 (4.8%) | 200 (4.0%) |
| 20 to 24 Years | 332 (6.7%) | 474 (9.4%) |
| 25 to 29 Years | 454 (9.1%) | 344 (6.8%) |
| 30 to 34 Years | 451 (9.0%) | 283 (5.6%) |
| 35 to 39 Years | 458 (9.2%) | 398 (7.9%) |
| 40 to 44 Years | 244 (4.9%) | 334 (6.6%) |
| 45 to 49 Years | 338 (6.8%) | 351 (7.0%) |
| 50 to 54 Years | 224 (4.5%) | 297 (5.9%) |
| 55 to 59 Years | 596 (12.0%) | 550 (10.9%) |
| 60 to 64 Years | 279 (5.6%) | 238 (4.7%) |
| 65 to 69 Years | 241 (4.8%) | 168 (3.3%) |
| 70 to 74 Years | 117 (2.4%) | 128 (2.5%) |
| 75 to 79 Years | 42 (0.8%) | 71 (1.4%) |
| 80 to 84 Years | 13 (0.3%) | 32 (0.6%) |
| 85 Years and over | 11 (0.2%) | 38 (0.8%) |
| Total | 4,985 (100.0%) | 5,030 (100.0%) |
Families and Households in Chesapeake Ranch Estates
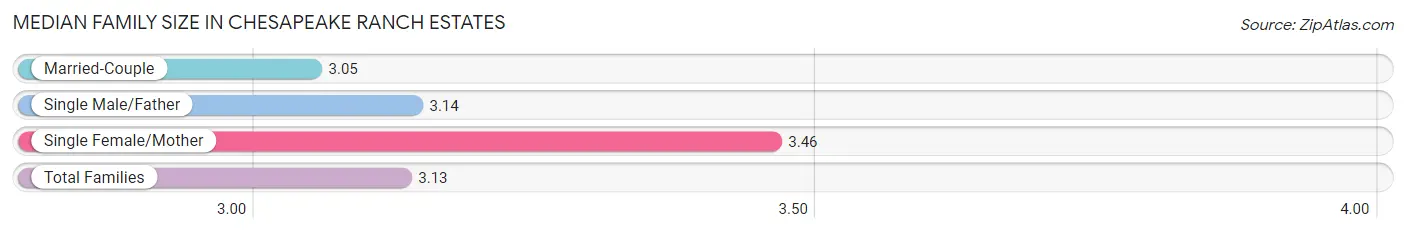
Median Family Size in Chesapeake Ranch Estates
The median family size in Chesapeake Ranch Estates is 3.13 persons per family, with single female/mother families (461 | 16.7%) accounting for the largest median family size of 3.46 persons per family. On the other hand, married-couple families (1,942 | 70.4%) represent the smallest median family size with 3.05 persons per family.
| Family Type | # Families | Family Size |
| Married-Couple | 1,942 (70.4%) | 3.05 |
| Single Male/Father | 356 (12.9%) | 3.14 |
| Single Female/Mother | 461 (16.7%) | 3.46 |
| Total Families | 2,759 (100.0%) | 3.13 |
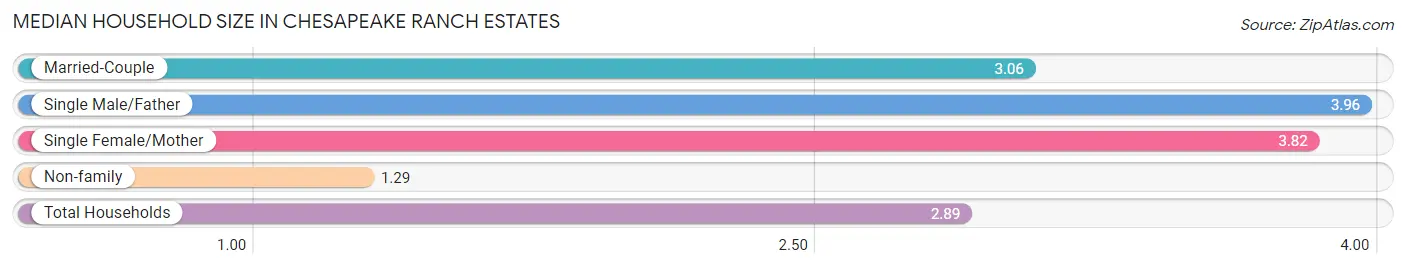
Median Household Size in Chesapeake Ranch Estates
The median household size in Chesapeake Ranch Estates is 2.89 persons per household, with single male/father households (356 | 10.3%) accounting for the largest median household size of 3.96 persons per household. non-family households (705 | 20.3%) represent the smallest median household size with 1.29 persons per household.
| Household Type | # Households | Household Size |
| Married-Couple | 1,942 (56.1%) | 3.06 |
| Single Male/Father | 356 (10.3%) | 3.96 |
| Single Female/Mother | 461 (13.3%) | 3.82 |
| Non-family | 705 (20.3%) | 1.29 |
| Total Households | 3,464 (100.0%) | 2.89 |
Household Size by Marriage Status in Chesapeake Ranch Estates
Out of a total of 3,464 households in Chesapeake Ranch Estates, 2,759 (79.6%) are family households, while 705 (20.3%) are nonfamily households. The most numerous type of family households are 2-person households, comprising 1,189, and the most common type of nonfamily households are 1-person households, comprising 502.
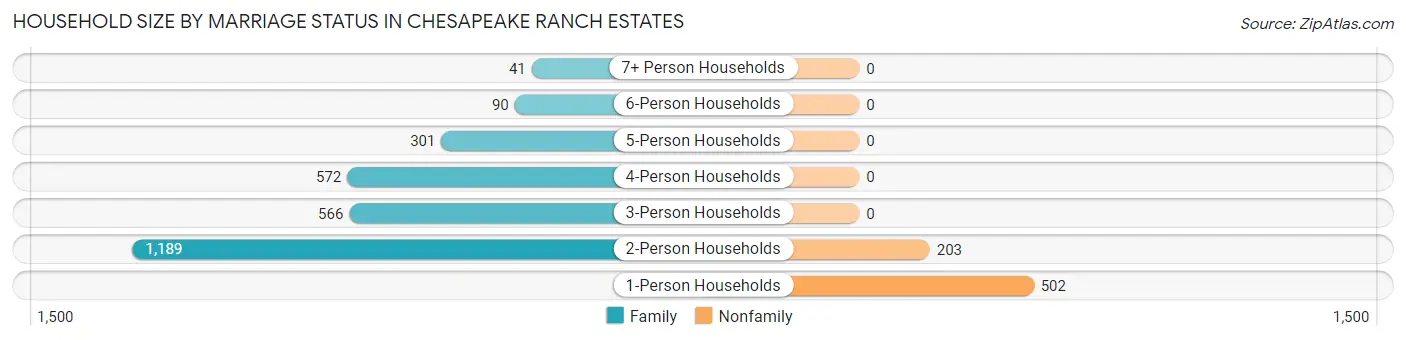
| Household Size | Family Households | Nonfamily Households |
| 1-Person Households | - | 502 (14.5%) |
| 2-Person Households | 1,189 (34.3%) | 203 (5.9%) |
| 3-Person Households | 566 (16.3%) | 0 (0.0%) |
| 4-Person Households | 572 (16.5%) | 0 (0.0%) |
| 5-Person Households | 301 (8.7%) | 0 (0.0%) |
| 6-Person Households | 90 (2.6%) | 0 (0.0%) |
| 7+ Person Households | 41 (1.2%) | 0 (0.0%) |
| Total | 2,759 (79.6%) | 705 (20.3%) |
Female Fertility in Chesapeake Ranch Estates
Fertility by Age in Chesapeake Ranch Estates
Average fertility rate in Chesapeake Ranch Estates is 41.0 births per 1,000 women. Women in the age bracket of 20 to 34 years have the highest fertility rate with 61.0 births per 1,000 women. Women in the age bracket of 20 to 34 years acount for 67.0% of all women with births.
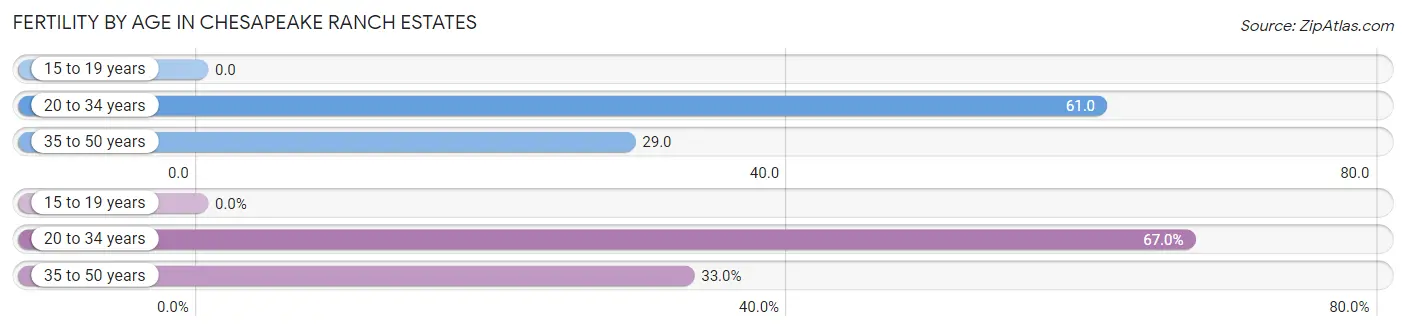
| Age Bracket | Women with Births | Births / 1,000 Women |
| 15 to 19 years | 0 (0.0%) | 0.0 |
| 20 to 34 years | 67 (67.0%) | 61.0 |
| 35 to 50 years | 33 (33.0%) | 29.0 |
| Total | 100 (100.0%) | 41.0 |
Fertility by Age by Marriage Status in Chesapeake Ranch Estates
73.0% of women with births (100) in Chesapeake Ranch Estates are married. The highest percentage of unmarried women with births falls into 20 to 34 years age bracket with 40.3% of them unmarried at the time of birth, while the lowest percentage of unmarried women with births belong to 35 to 50 years age bracket with 0.0% of them unmarried.
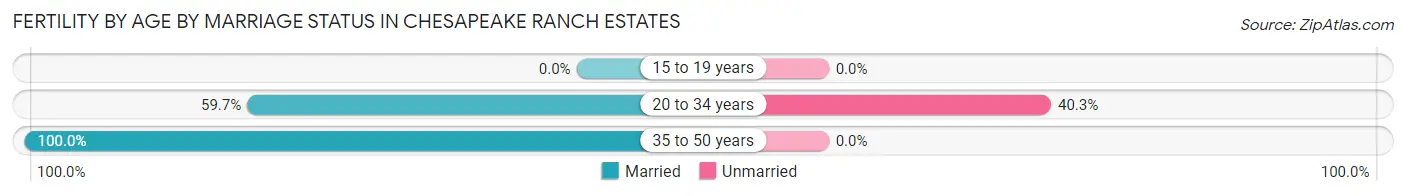
| Age Bracket | Married | Unmarried |
| 15 to 19 years | 0 (0.0%) | 0 (0.0%) |
| 20 to 34 years | 40 (59.7%) | 27 (40.3%) |
| 35 to 50 years | 33 (100.0%) | 0 (0.0%) |
| Total | 73 (73.0%) | 27 (27.0%) |
Fertility by Education in Chesapeake Ranch Estates
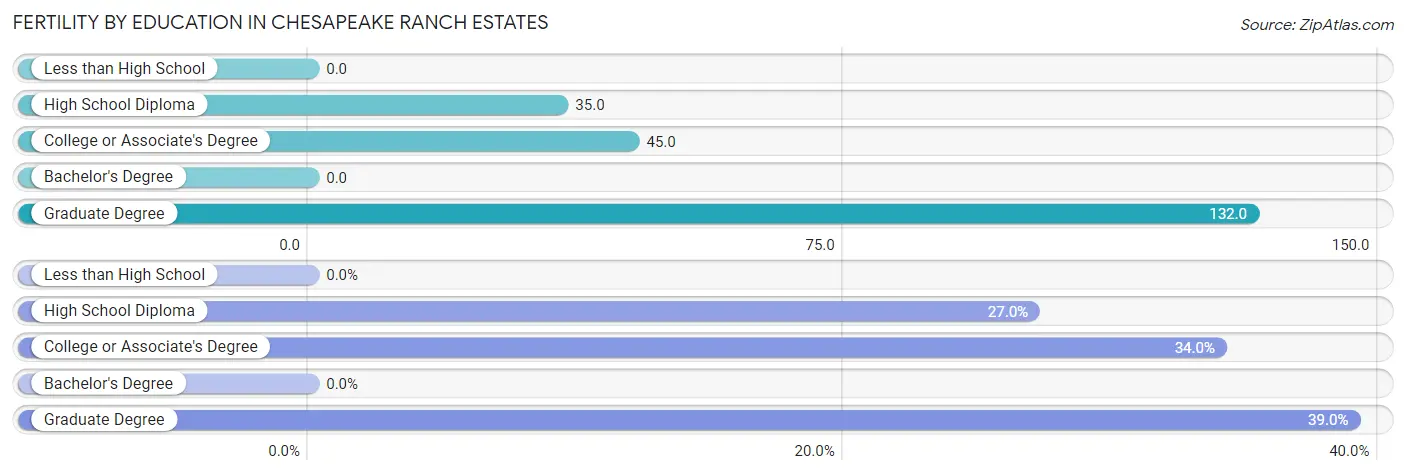
| Educational Attainment | Women with Births | Births / 1,000 Women |
| Less than High School | 0 (0.0%) | 0.0 |
| High School Diploma | 27 (27.0%) | 35.0 |
| College or Associate's Degree | 34 (34.0%) | 45.0 |
| Bachelor's Degree | 0 (0.0%) | 0.0 |
| Graduate Degree | 39 (39.0%) | 132.0 |
| Total | 100 (100.0%) | 41.0 |
Fertility by Education by Marriage Status in Chesapeake Ranch Estates
27.0% of women with births in Chesapeake Ranch Estates are unmarried. Women with the educational attainment of college or associate's degree are most likely to be married with 100.0% of them married at childbirth, while women with the educational attainment of high school diploma are least likely to be married with 100.0% of them unmarried at childbirth.
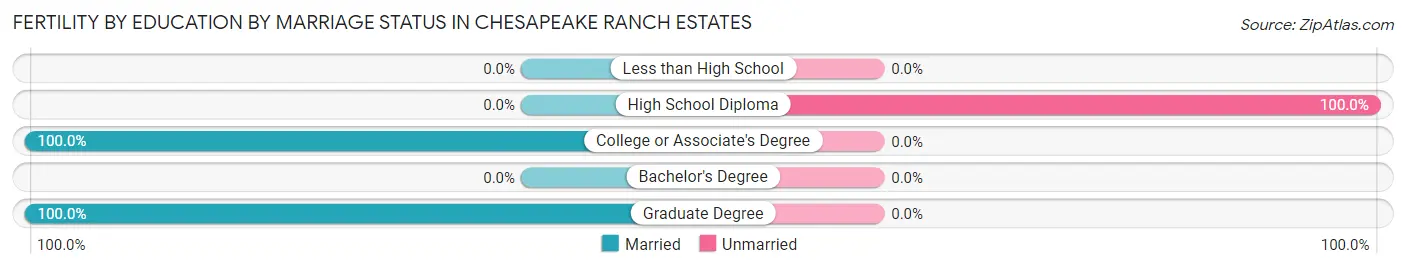
| Educational Attainment | Married | Unmarried |
| Less than High School | 0 (0.0%) | 0 (0.0%) |
| High School Diploma | 0 (0.0%) | 27 (100.0%) |
| College or Associate's Degree | 34 (100.0%) | 0 (0.0%) |
| Bachelor's Degree | 0 (0.0%) | 0 (0.0%) |
| Graduate Degree | 39 (100.0%) | 0 (0.0%) |
| Total | 73 (73.0%) | 27 (27.0%) |
Employment Characteristics in Chesapeake Ranch Estates
Employment by Class of Employer in Chesapeake Ranch Estates
Among the 5,447 employed individuals in Chesapeake Ranch Estates, private company employees (3,132 | 57.5%), federal government employees (1,048 | 19.2%), and local government employees (413 | 7.6%) make up the most common classes of employment.
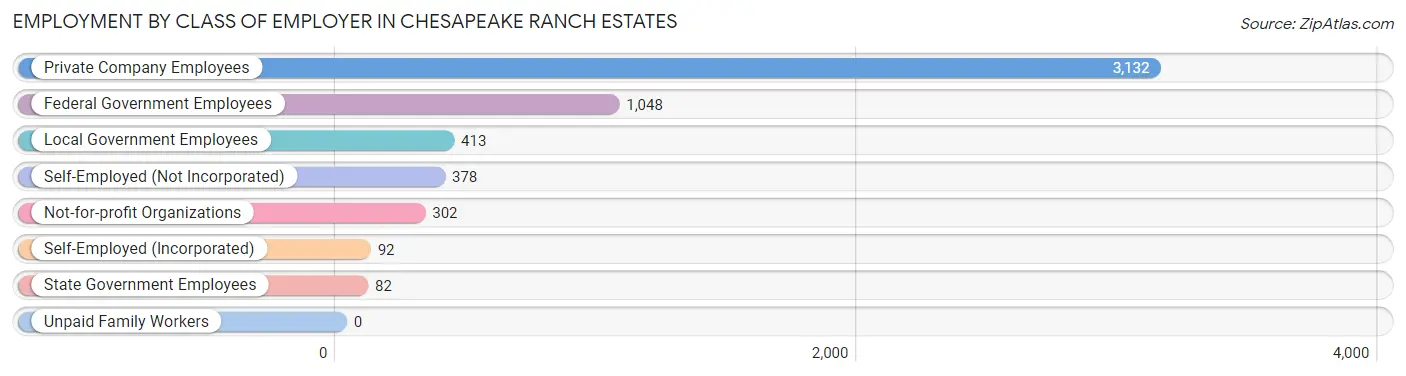
| Employer Class | # Employees | % Employees |
| Private Company Employees | 3,132 | 57.5% |
| Self-Employed (Incorporated) | 92 | 1.7% |
| Self-Employed (Not Incorporated) | 378 | 6.9% |
| Not-for-profit Organizations | 302 | 5.5% |
| Local Government Employees | 413 | 7.6% |
| State Government Employees | 82 | 1.5% |
| Federal Government Employees | 1,048 | 19.2% |
| Unpaid Family Workers | 0 | 0.0% |
| Total | 5,447 | 100.0% |
Employment Status by Age in Chesapeake Ranch Estates
According to the labor force statistics for Chesapeake Ranch Estates, out of the total population over 16 years of age (7,918), 71.3% or 5,646 individuals are in the labor force, with 2.7% or 152 of them unemployed. The age group with the highest labor force participation rate is 25 to 29 years, with 89.6% or 715 individuals in the labor force. Within the labor force, the 16 to 19 years age range has the highest percentage of unemployed individuals, with 10.3% or 18 of them being unemployed.
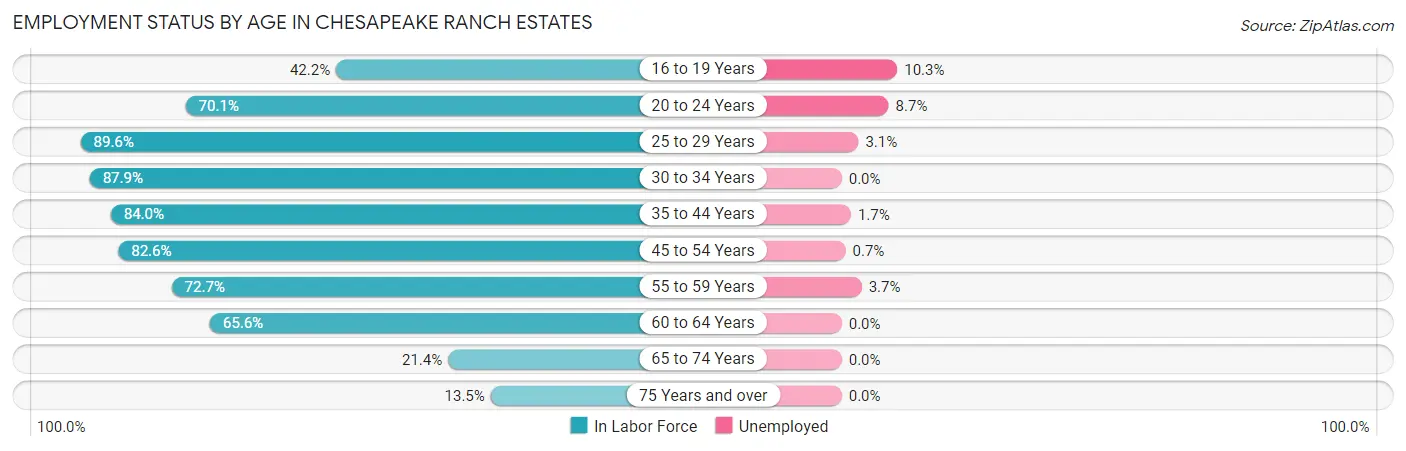
| Age Bracket | In Labor Force | Unemployed |
| 16 to 19 Years | 174 (42.2%) | 18 (10.3%) |
| 20 to 24 Years | 565 (70.1%) | 49 (8.7%) |
| 25 to 29 Years | 715 (89.6%) | 22 (3.1%) |
| 30 to 34 Years | 645 (87.9%) | 0 (0.0%) |
| 35 to 44 Years | 1,205 (84.0%) | 20 (1.7%) |
| 45 to 54 Years | 999 (82.6%) | 7 (0.7%) |
| 55 to 59 Years | 833 (72.7%) | 31 (3.7%) |
| 60 to 64 Years | 339 (65.6%) | 0 (0.0%) |
| 65 to 74 Years | 140 (21.4%) | 0 (0.0%) |
| 75 Years and over | 28 (13.5%) | 0 (0.0%) |
| Total | 5,646 (71.3%) | 152 (2.7%) |
Employment Status by Educational Attainment in Chesapeake Ranch Estates
According to labor force statistics for Chesapeake Ranch Estates, 81.1% of individuals (4,735) out of the total population between 25 and 64 years of age (5,839) are in the labor force, with 1.7% or 80 of them being unemployed. The group with the highest labor force participation rate are those with the educational attainment of bachelor's degree or higher, with 89.1% or 1,432 individuals in the labor force. Within the labor force, individuals with less than high school education have the highest percentage of unemployment, with 6.8% or 18 of them being unemployed.
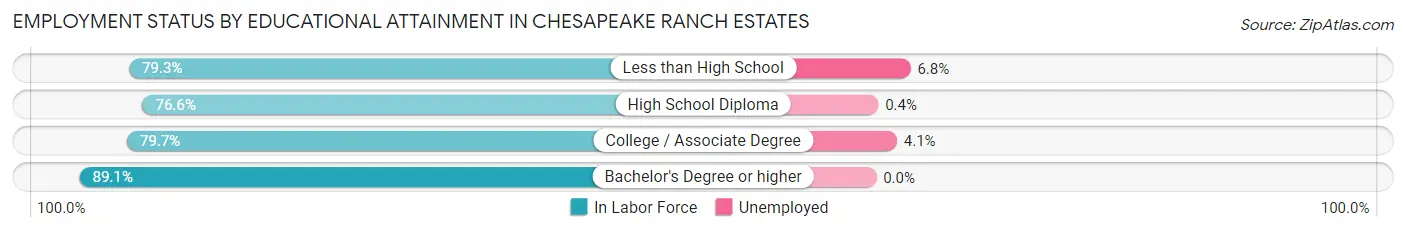
| Educational Attainment | In Labor Force | Unemployed |
| Less than High School | 264 (79.3%) | 23 (6.8%) |
| High School Diploma | 1,614 (76.6%) | 8 (0.4%) |
| College / Associate Degree | 1,428 (79.7%) | 73 (4.1%) |
| Bachelor's Degree or higher | 1,432 (89.1%) | 0 (0.0%) |
| Total | 4,735 (81.1%) | 99 (1.7%) |
Employment Occupations by Sex in Chesapeake Ranch Estates
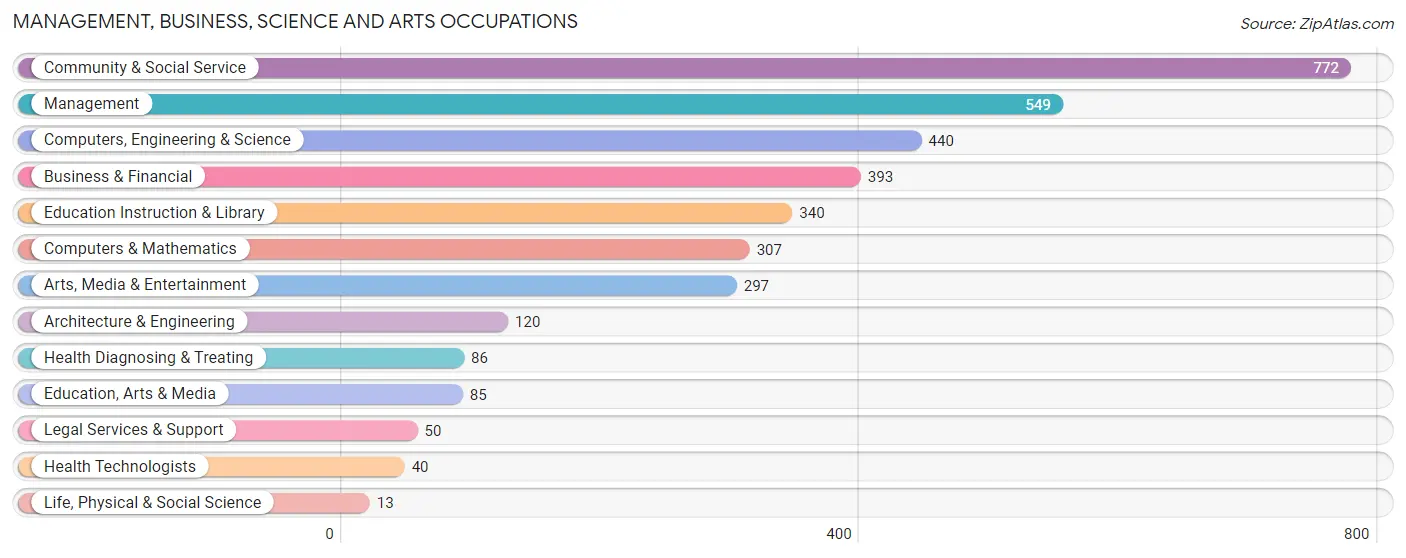
Management, Business, Science and Arts Occupations
The most common Management, Business, Science and Arts occupations in Chesapeake Ranch Estates are Community & Social Service (772 | 14.5%), Management (549 | 10.3%), Computers, Engineering & Science (440 | 8.3%), Business & Financial (393 | 7.4%), and Education Instruction & Library (340 | 6.4%).
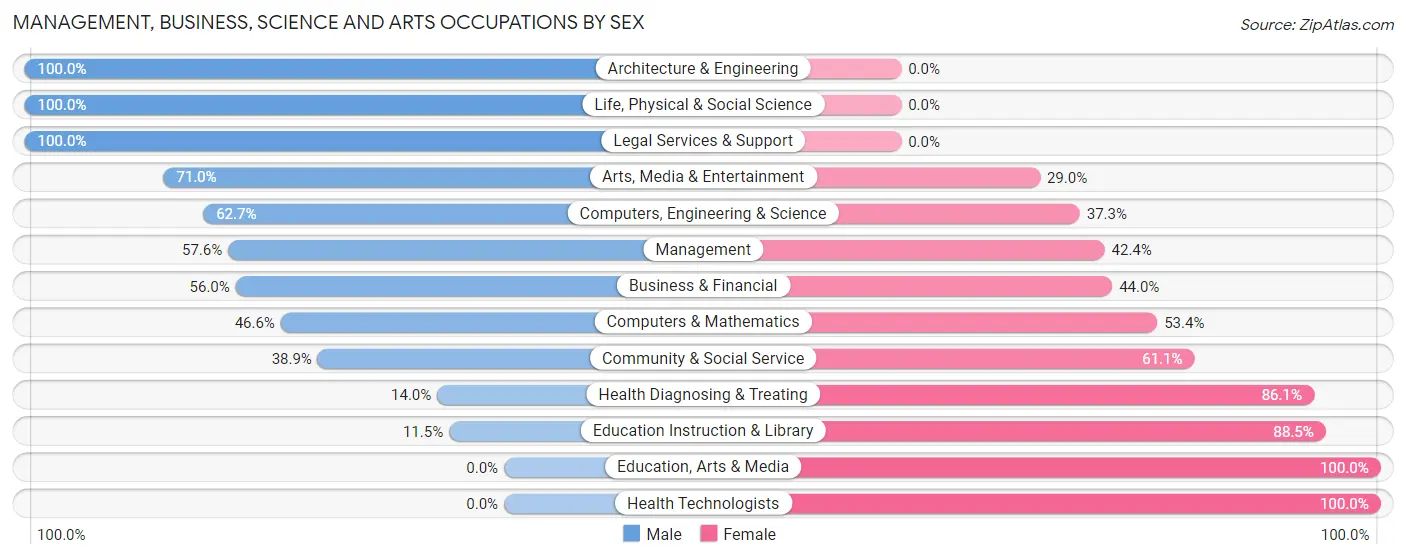
Management, Business, Science and Arts Occupations by Sex
Within the Management, Business, Science and Arts occupations in Chesapeake Ranch Estates, the most male-oriented occupations are Architecture & Engineering (100.0%), Life, Physical & Social Science (100.0%), and Legal Services & Support (100.0%), while the most female-oriented occupations are Education, Arts & Media (100.0%), Health Technologists (100.0%), and Education Instruction & Library (88.5%).
| Occupation | Male | Female |
| Management | 316 (57.6%) | 233 (42.4%) |
| Business & Financial | 220 (56.0%) | 173 (44.0%) |
| Computers, Engineering & Science | 276 (62.7%) | 164 (37.3%) |
| Computers & Mathematics | 143 (46.6%) | 164 (53.4%) |
| Architecture & Engineering | 120 (100.0%) | 0 (0.0%) |
| Life, Physical & Social Science | 13 (100.0%) | 0 (0.0%) |
| Community & Social Service | 300 (38.9%) | 472 (61.1%) |
| Education, Arts & Media | 0 (0.0%) | 85 (100.0%) |
| Legal Services & Support | 50 (100.0%) | 0 (0.0%) |
| Education Instruction & Library | 39 (11.5%) | 301 (88.5%) |
| Arts, Media & Entertainment | 211 (71.0%) | 86 (29.0%) |
| Health Diagnosing & Treating | 12 (14.0%) | 74 (86.1%) |
| Health Technologists | 0 (0.0%) | 40 (100.0%) |
| Total (Category) | 1,124 (50.2%) | 1,116 (49.8%) |
| Total (Overall) | 3,061 (57.6%) | 2,252 (42.4%) |
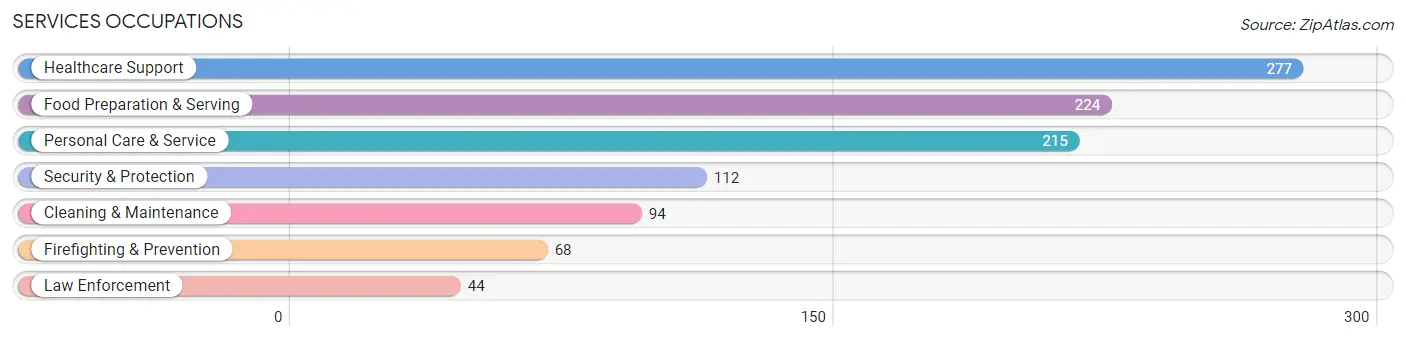
Services Occupations
The most common Services occupations in Chesapeake Ranch Estates are Healthcare Support (277 | 5.2%), Food Preparation & Serving (224 | 4.2%), Personal Care & Service (215 | 4.1%), Security & Protection (112 | 2.1%), and Cleaning & Maintenance (94 | 1.8%).
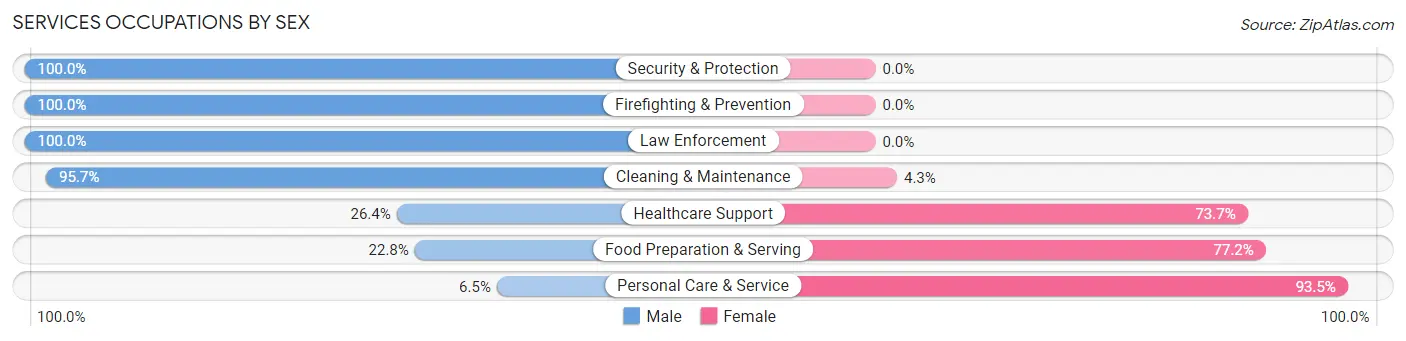
Services Occupations by Sex
Within the Services occupations in Chesapeake Ranch Estates, the most male-oriented occupations are Security & Protection (100.0%), Firefighting & Prevention (100.0%), and Law Enforcement (100.0%), while the most female-oriented occupations are Personal Care & Service (93.5%), Food Preparation & Serving (77.2%), and Healthcare Support (73.7%).
| Occupation | Male | Female |
| Healthcare Support | 73 (26.4%) | 204 (73.7%) |
| Security & Protection | 112 (100.0%) | 0 (0.0%) |
| Firefighting & Prevention | 68 (100.0%) | 0 (0.0%) |
| Law Enforcement | 44 (100.0%) | 0 (0.0%) |
| Food Preparation & Serving | 51 (22.8%) | 173 (77.2%) |
| Cleaning & Maintenance | 90 (95.7%) | 4 (4.3%) |
| Personal Care & Service | 14 (6.5%) | 201 (93.5%) |
| Total (Category) | 340 (36.9%) | 582 (63.1%) |
| Total (Overall) | 3,061 (57.6%) | 2,252 (42.4%) |
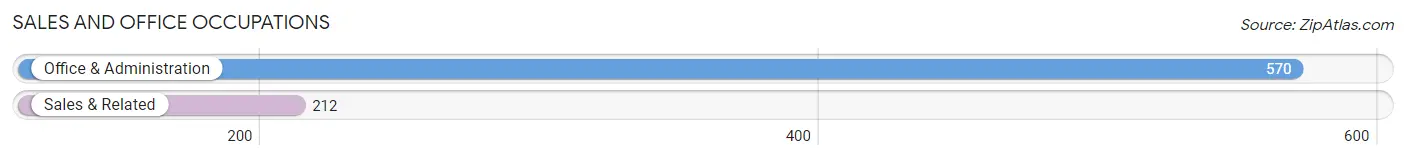
Sales and Office Occupations
The most common Sales and Office occupations in Chesapeake Ranch Estates are Office & Administration (570 | 10.7%), and Sales & Related (212 | 4.0%).
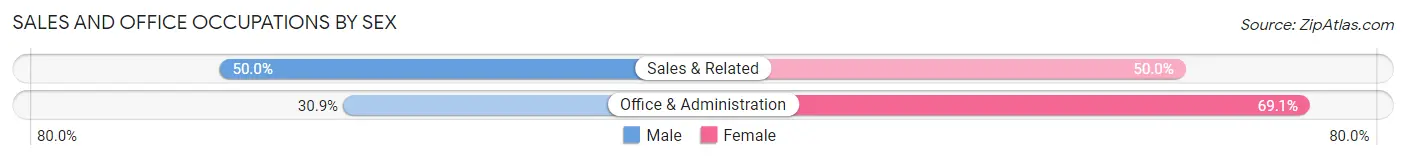
Sales and Office Occupations by Sex
| Occupation | Male | Female |
| Sales & Related | 106 (50.0%) | 106 (50.0%) |
| Office & Administration | 176 (30.9%) | 394 (69.1%) |
| Total (Category) | 282 (36.1%) | 500 (63.9%) |
| Total (Overall) | 3,061 (57.6%) | 2,252 (42.4%) |
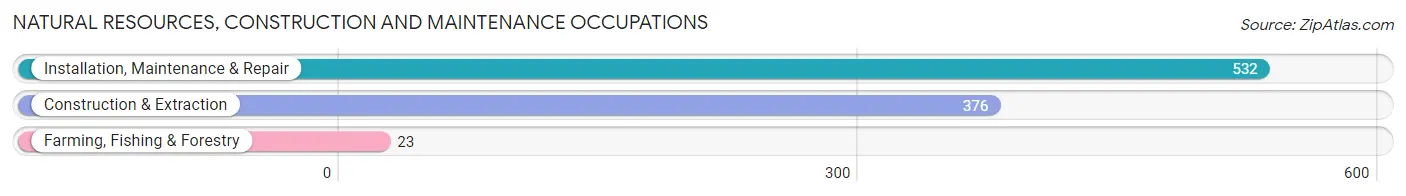
Natural Resources, Construction and Maintenance Occupations
The most common Natural Resources, Construction and Maintenance occupations in Chesapeake Ranch Estates are Installation, Maintenance & Repair (532 | 10.0%), Construction & Extraction (376 | 7.1%), and Farming, Fishing & Forestry (23 | 0.4%).
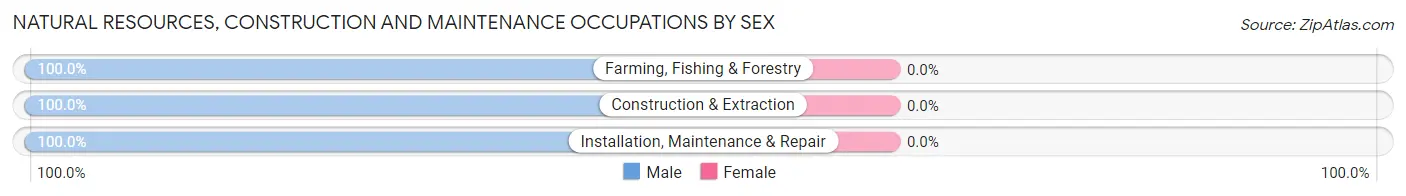
Natural Resources, Construction and Maintenance Occupations by Sex
| Occupation | Male | Female |
| Farming, Fishing & Forestry | 23 (100.0%) | 0 (0.0%) |
| Construction & Extraction | 376 (100.0%) | 0 (0.0%) |
| Installation, Maintenance & Repair | 532 (100.0%) | 0 (0.0%) |
| Total (Category) | 931 (100.0%) | 0 (0.0%) |
| Total (Overall) | 3,061 (57.6%) | 2,252 (42.4%) |
Production, Transportation and Moving Occupations
The most common Production, Transportation and Moving occupations in Chesapeake Ranch Estates are Production (277 | 5.2%), Transportation (127 | 2.4%), and Material Moving (34 | 0.6%).
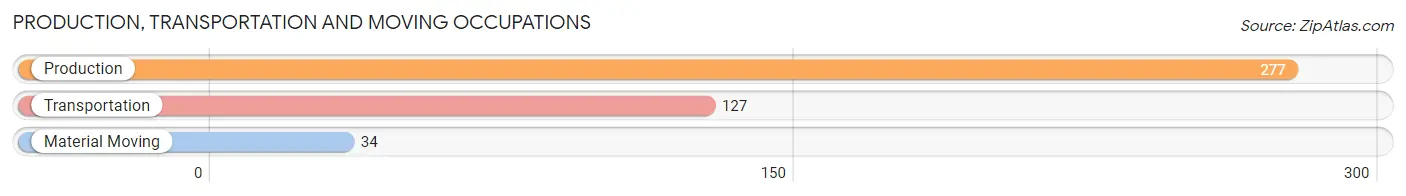
Production, Transportation and Moving Occupations by Sex
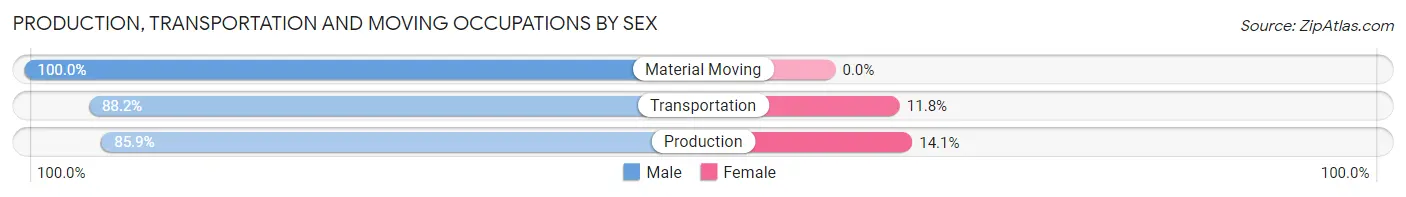
| Occupation | Male | Female |
| Production | 238 (85.9%) | 39 (14.1%) |
| Transportation | 112 (88.2%) | 15 (11.8%) |
| Material Moving | 34 (100.0%) | 0 (0.0%) |
| Total (Category) | 384 (87.7%) | 54 (12.3%) |
| Total (Overall) | 3,061 (57.6%) | 2,252 (42.4%) |
Employment Industries by Sex in Chesapeake Ranch Estates
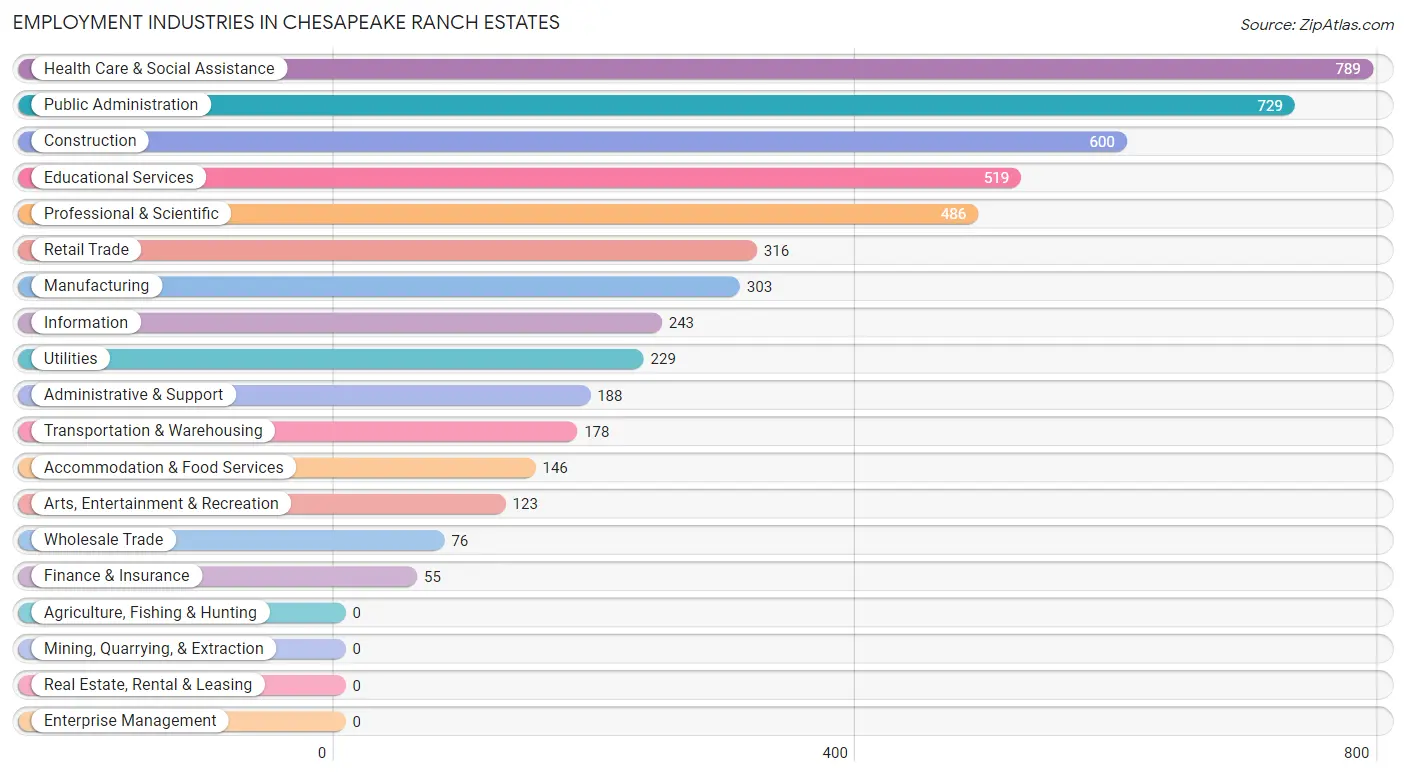
Employment Industries in Chesapeake Ranch Estates
The major employment industries in Chesapeake Ranch Estates include Health Care & Social Assistance (789 | 14.8%), Public Administration (729 | 13.7%), Construction (600 | 11.3%), Educational Services (519 | 9.8%), and Professional & Scientific (486 | 9.1%).
Employment Industries by Sex in Chesapeake Ranch Estates
The Chesapeake Ranch Estates industries that see more men than women are Arts, Entertainment & Recreation (89.4%), Administrative & Support (89.4%), and Construction (87.2%), whereas the industries that tend to have a higher number of women are Accommodation & Food Services (91.1%), Health Care & Social Assistance (83.9%), and Educational Services (69.9%).
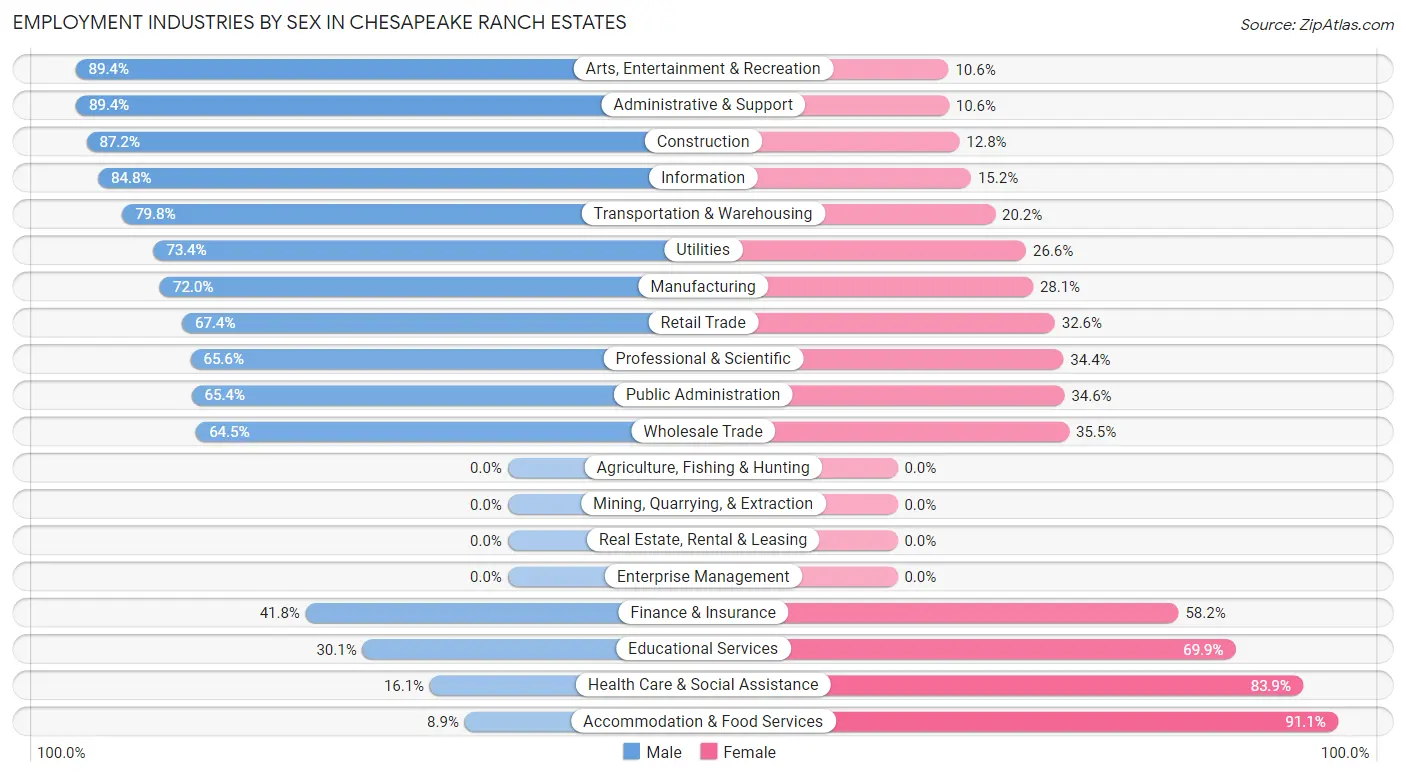
| Industry | Male | Female |
| Agriculture, Fishing & Hunting | 0 (0.0%) | 0 (0.0%) |
| Mining, Quarrying, & Extraction | 0 (0.0%) | 0 (0.0%) |
| Construction | 523 (87.2%) | 77 (12.8%) |
| Manufacturing | 218 (72.0%) | 85 (28.1%) |
| Wholesale Trade | 49 (64.5%) | 27 (35.5%) |
| Retail Trade | 213 (67.4%) | 103 (32.6%) |
| Transportation & Warehousing | 142 (79.8%) | 36 (20.2%) |
| Utilities | 168 (73.4%) | 61 (26.6%) |
| Information | 206 (84.8%) | 37 (15.2%) |
| Finance & Insurance | 23 (41.8%) | 32 (58.2%) |
| Real Estate, Rental & Leasing | 0 (0.0%) | 0 (0.0%) |
| Professional & Scientific | 319 (65.6%) | 167 (34.4%) |
| Enterprise Management | 0 (0.0%) | 0 (0.0%) |
| Administrative & Support | 168 (89.4%) | 20 (10.6%) |
| Educational Services | 156 (30.1%) | 363 (69.9%) |
| Health Care & Social Assistance | 127 (16.1%) | 662 (83.9%) |
| Arts, Entertainment & Recreation | 110 (89.4%) | 13 (10.6%) |
| Accommodation & Food Services | 13 (8.9%) | 133 (91.1%) |
| Public Administration | 477 (65.4%) | 252 (34.6%) |
| Total | 3,061 (57.6%) | 2,252 (42.4%) |
Education in Chesapeake Ranch Estates
School Enrollment in Chesapeake Ranch Estates
The most common levels of schooling among the 2,234 students in Chesapeake Ranch Estates are elementary school (536 | 24.0%), middle school (529 | 23.7%), and high school (498 | 22.3%).
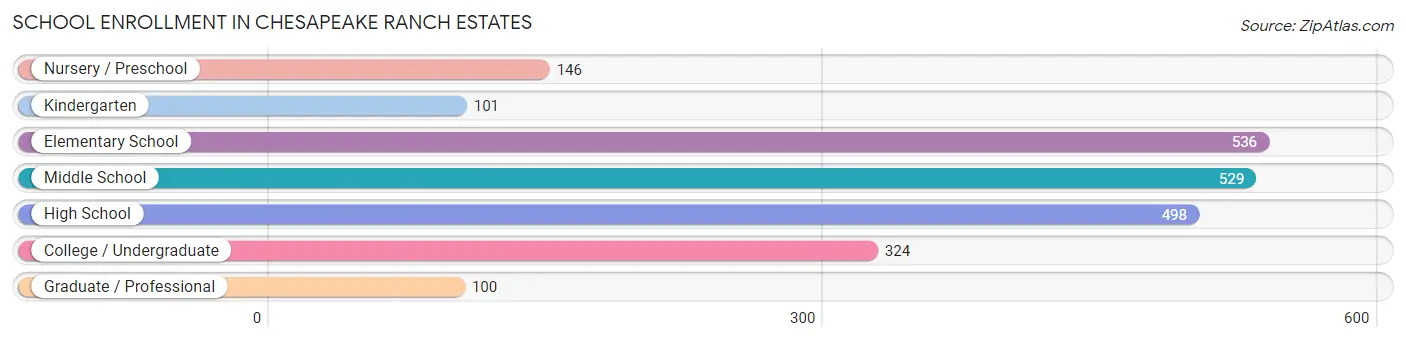
| School Level | # Students | % Students |
| Nursery / Preschool | 146 | 6.5% |
| Kindergarten | 101 | 4.5% |
| Elementary School | 536 | 24.0% |
| Middle School | 529 | 23.7% |
| High School | 498 | 22.3% |
| College / Undergraduate | 324 | 14.5% |
| Graduate / Professional | 100 | 4.5% |
| Total | 2,234 | 100.0% |
School Enrollment by Age by Funding Source in Chesapeake Ranch Estates
Out of a total of 2,234 students who are enrolled in schools in Chesapeake Ranch Estates, 360 (16.1%) attend a private institution, while the remaining 1,874 (83.9%) are enrolled in public schools. The age group of 35 years and over has the highest likelihood of being enrolled in private schools, with 71 (44.1% in the age bracket) enrolled. Conversely, the age group of 20 to 24 year olds has the lowest likelihood of being enrolled in a private school, with 125 (100.0% in the age bracket) attending a public institution.
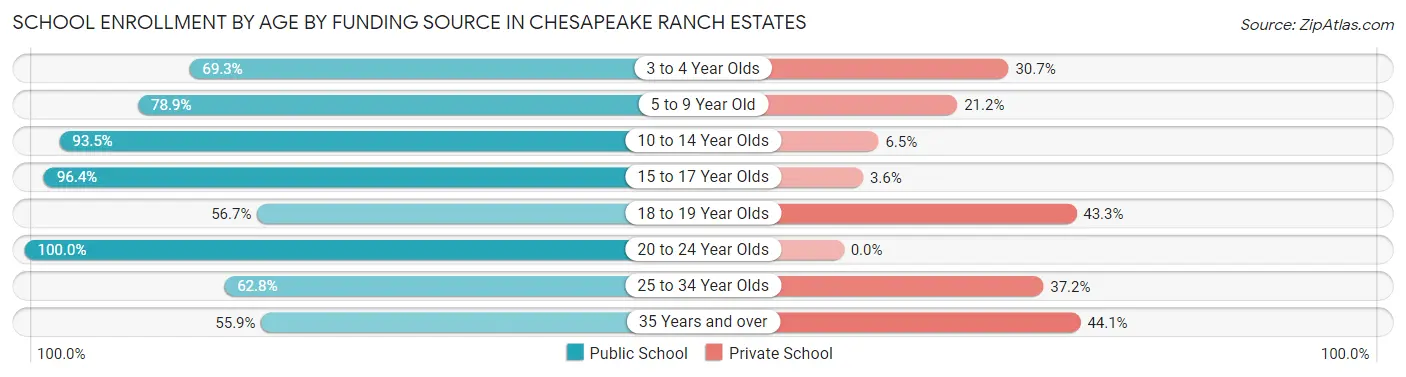
| Age Bracket | Public School | Private School |
| 3 to 4 Year Olds | 79 (69.3%) | 35 (30.7%) |
| 5 to 9 Year Old | 522 (78.8%) | 140 (21.1%) |
| 10 to 14 Year Olds | 591 (93.5%) | 41 (6.5%) |
| 15 to 17 Year Olds | 375 (96.4%) | 14 (3.6%) |
| 18 to 19 Year Olds | 17 (56.7%) | 13 (43.3%) |
| 20 to 24 Year Olds | 125 (100.0%) | 0 (0.0%) |
| 25 to 34 Year Olds | 76 (62.8%) | 45 (37.2%) |
| 35 Years and over | 90 (55.9%) | 71 (44.1%) |
| Total | 1,874 (83.9%) | 360 (16.1%) |
Educational Attainment by Field of Study in Chesapeake Ranch Estates
Business (333 | 16.6%), computers & mathematics (321 | 16.0%), science & technology (196 | 9.8%), social sciences (182 | 9.1%), and engineering (145 | 7.2%) are the most common fields of study among 2,006 individuals in Chesapeake Ranch Estates who have obtained a bachelor's degree or higher.
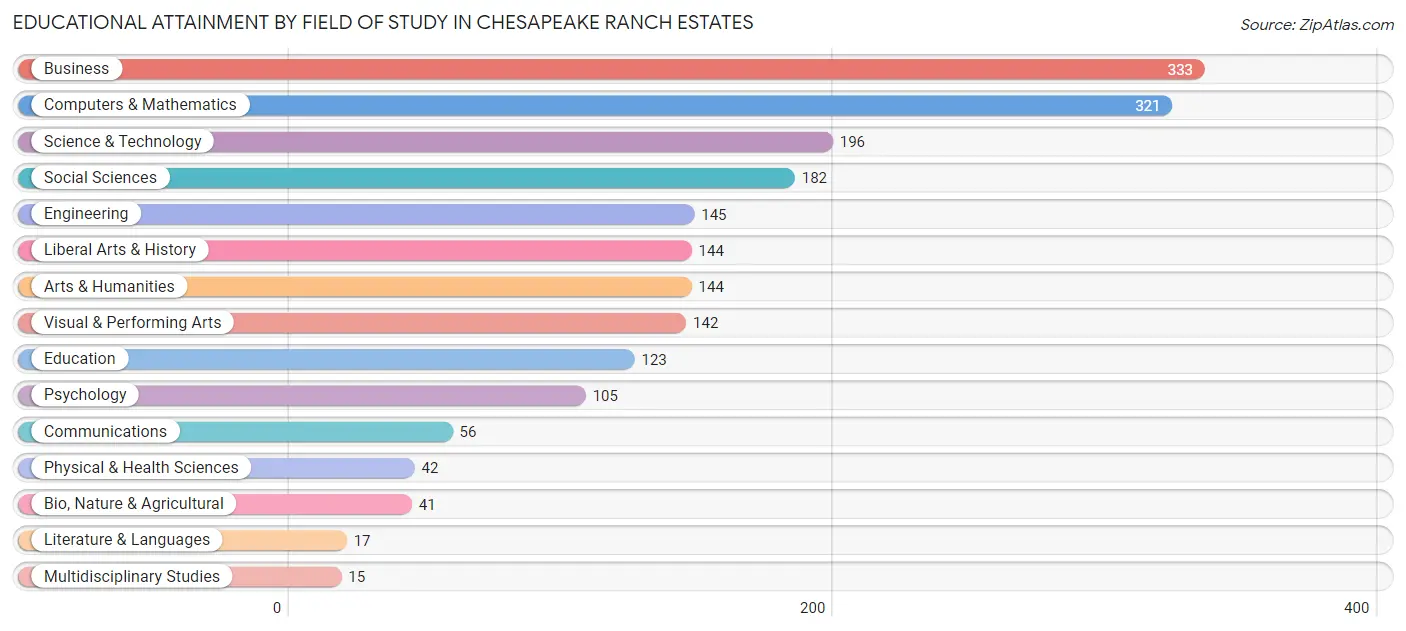
| Field of Study | # Graduates | % Graduates |
| Computers & Mathematics | 321 | 16.0% |
| Bio, Nature & Agricultural | 41 | 2.0% |
| Physical & Health Sciences | 42 | 2.1% |
| Psychology | 105 | 5.2% |
| Social Sciences | 182 | 9.1% |
| Engineering | 145 | 7.2% |
| Multidisciplinary Studies | 15 | 0.7% |
| Science & Technology | 196 | 9.8% |
| Business | 333 | 16.6% |
| Education | 123 | 6.1% |
| Literature & Languages | 17 | 0.9% |
| Liberal Arts & History | 144 | 7.2% |
| Visual & Performing Arts | 142 | 7.1% |
| Communications | 56 | 2.8% |
| Arts & Humanities | 144 | 7.2% |
| Total | 2,006 | 100.0% |
Transportation & Commute in Chesapeake Ranch Estates
Vehicle Availability by Sex in Chesapeake Ranch Estates
The most prevalent vehicle ownership categories in Chesapeake Ranch Estates are males with 2 vehicles (1,431, accounting for 46.2%) and females with 2 vehicles (1,168, making up 61.0%).
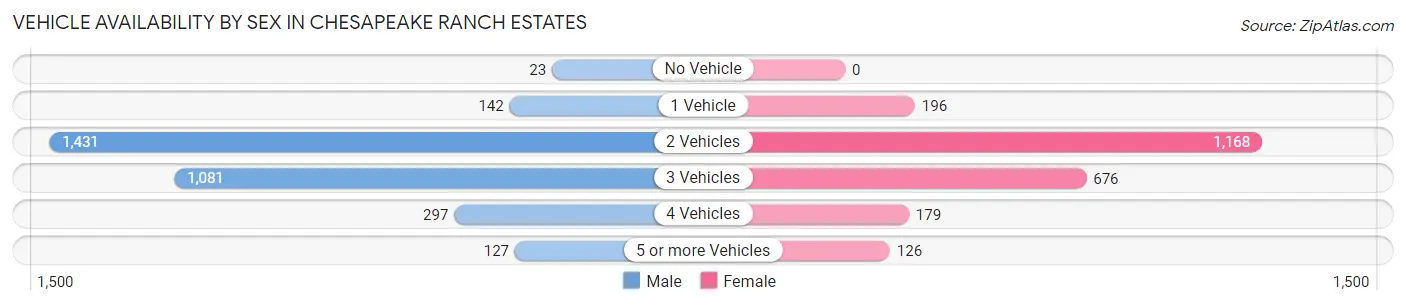
| Vehicles Available | Male | Female |
| No Vehicle | 23 (0.7%) | 0 (0.0%) |
| 1 Vehicle | 142 (4.6%) | 196 (8.4%) |
| 2 Vehicles | 1,431 (46.2%) | 1,168 (49.8%) |
| 3 Vehicles | 1,081 (34.9%) | 676 (28.8%) |
| 4 Vehicles | 297 (9.6%) | 179 (7.6%) |
| 5 or more Vehicles | 127 (4.1%) | 126 (5.4%) |
| Total | 3,101 (100.0%) | 2,345 (100.0%) |
Commute Time in Chesapeake Ranch Estates
The most frequently occuring commute durations in Chesapeake Ranch Estates are 30 to 34 minutes (1,069 commuters, 22.2%), 60 to 89 minutes (680 commuters, 14.1%), and 90 or more minutes (599 commuters, 12.4%).
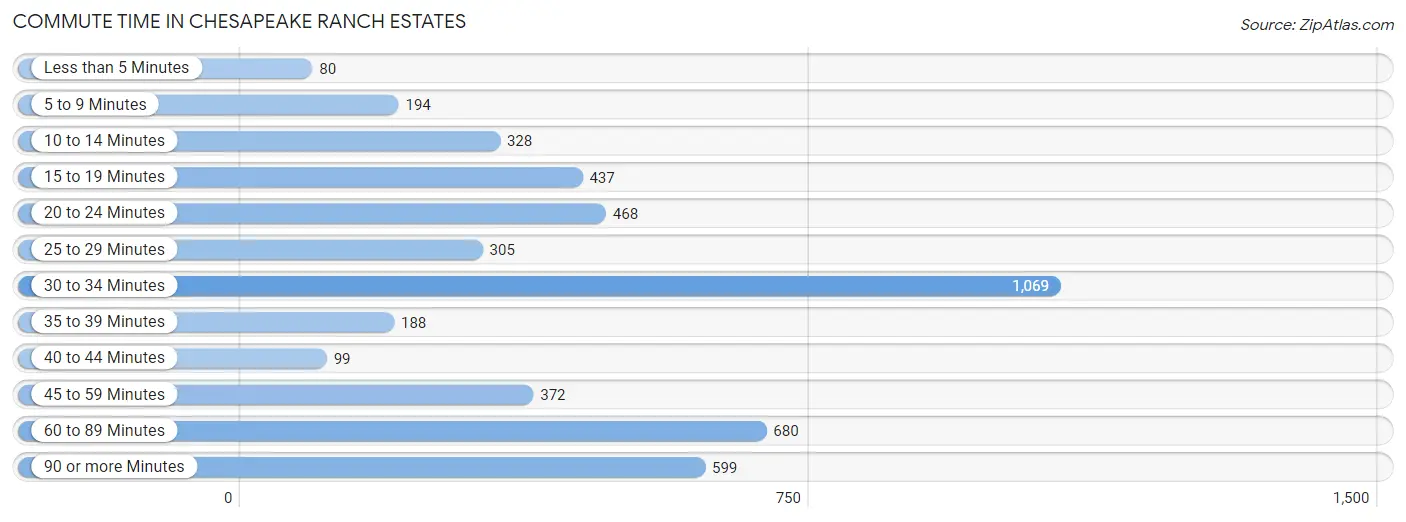
| Commute Time | # Commuters | % Commuters |
| Less than 5 Minutes | 80 | 1.7% |
| 5 to 9 Minutes | 194 | 4.0% |
| 10 to 14 Minutes | 328 | 6.8% |
| 15 to 19 Minutes | 437 | 9.1% |
| 20 to 24 Minutes | 468 | 9.7% |
| 25 to 29 Minutes | 305 | 6.3% |
| 30 to 34 Minutes | 1,069 | 22.2% |
| 35 to 39 Minutes | 188 | 3.9% |
| 40 to 44 Minutes | 99 | 2.1% |
| 45 to 59 Minutes | 372 | 7.7% |
| 60 to 89 Minutes | 680 | 14.1% |
| 90 or more Minutes | 599 | 12.4% |
Commute Time by Sex in Chesapeake Ranch Estates
The most common commute times in Chesapeake Ranch Estates are 60 to 89 minutes (434 commuters, 15.8%) for males and 30 to 34 minutes (742 commuters, 35.8%) for females.
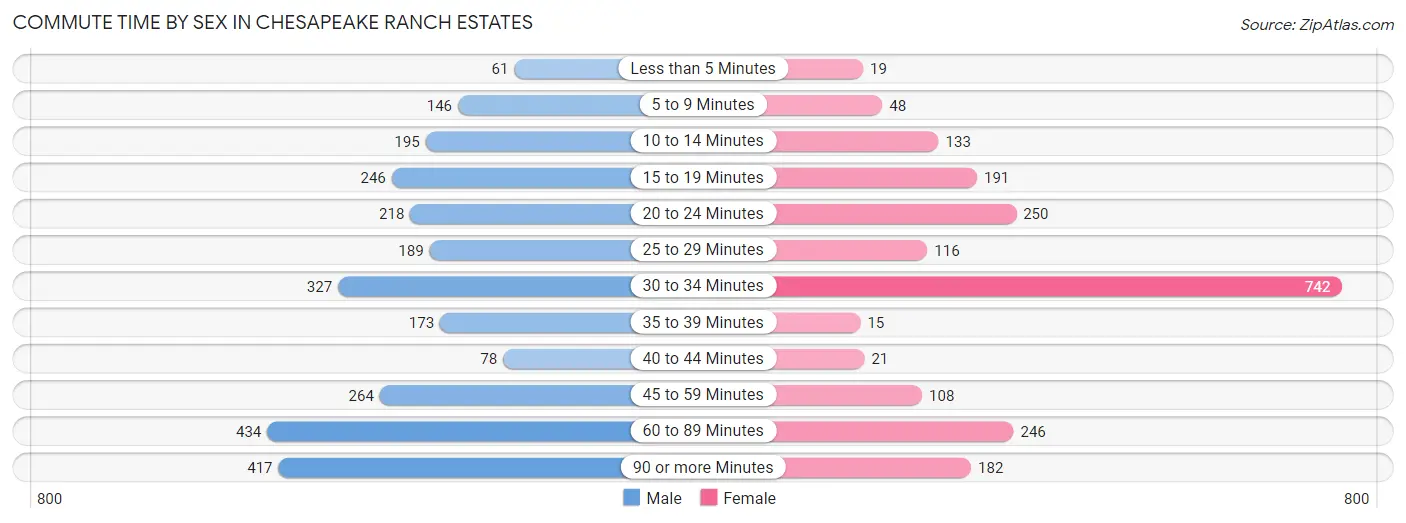
| Commute Time | Male | Female |
| Less than 5 Minutes | 61 (2.2%) | 19 (0.9%) |
| 5 to 9 Minutes | 146 (5.3%) | 48 (2.3%) |
| 10 to 14 Minutes | 195 (7.1%) | 133 (6.4%) |
| 15 to 19 Minutes | 246 (8.9%) | 191 (9.2%) |
| 20 to 24 Minutes | 218 (7.9%) | 250 (12.1%) |
| 25 to 29 Minutes | 189 (6.9%) | 116 (5.6%) |
| 30 to 34 Minutes | 327 (11.9%) | 742 (35.8%) |
| 35 to 39 Minutes | 173 (6.3%) | 15 (0.7%) |
| 40 to 44 Minutes | 78 (2.8%) | 21 (1.0%) |
| 45 to 59 Minutes | 264 (9.6%) | 108 (5.2%) |
| 60 to 89 Minutes | 434 (15.8%) | 246 (11.9%) |
| 90 or more Minutes | 417 (15.2%) | 182 (8.8%) |
Time of Departure to Work by Sex in Chesapeake Ranch Estates
The most frequent times of departure to work in Chesapeake Ranch Estates are 12:00 AM to 4:59 AM (568, 20.7%) for males and 6:00 AM to 6:29 AM (266, 12.8%) for females.
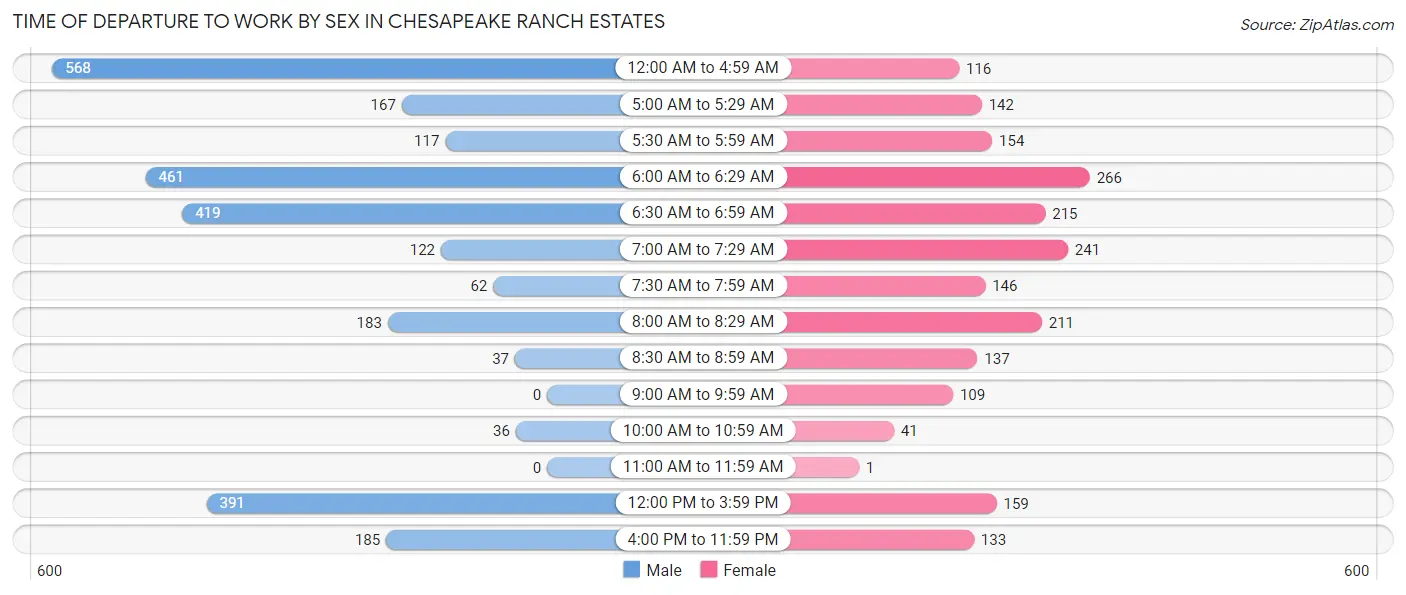
| Time of Departure | Male | Female |
| 12:00 AM to 4:59 AM | 568 (20.7%) | 116 (5.6%) |
| 5:00 AM to 5:29 AM | 167 (6.1%) | 142 (6.9%) |
| 5:30 AM to 5:59 AM | 117 (4.3%) | 154 (7.4%) |
| 6:00 AM to 6:29 AM | 461 (16.8%) | 266 (12.8%) |
| 6:30 AM to 6:59 AM | 419 (15.2%) | 215 (10.4%) |
| 7:00 AM to 7:29 AM | 122 (4.4%) | 241 (11.6%) |
| 7:30 AM to 7:59 AM | 62 (2.3%) | 146 (7.0%) |
| 8:00 AM to 8:29 AM | 183 (6.7%) | 211 (10.2%) |
| 8:30 AM to 8:59 AM | 37 (1.3%) | 137 (6.6%) |
| 9:00 AM to 9:59 AM | 0 (0.0%) | 109 (5.3%) |
| 10:00 AM to 10:59 AM | 36 (1.3%) | 41 (2.0%) |
| 11:00 AM to 11:59 AM | 0 (0.0%) | 1 (0.1%) |
| 12:00 PM to 3:59 PM | 391 (14.2%) | 159 (7.7%) |
| 4:00 PM to 11:59 PM | 185 (6.7%) | 133 (6.4%) |
| Total | 2,748 (100.0%) | 2,071 (100.0%) |
Housing Occupancy in Chesapeake Ranch Estates
Occupancy by Ownership in Chesapeake Ranch Estates
Of the total 3,464 dwellings in Chesapeake Ranch Estates, owner-occupied units account for 3,068 (88.6%), while renter-occupied units make up 396 (11.4%).
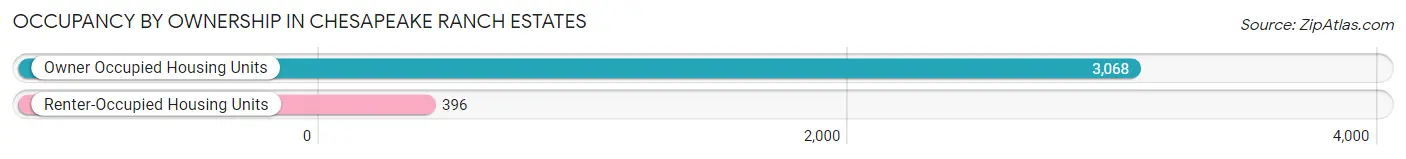
| Occupancy | # Housing Units | % Housing Units |
| Owner Occupied Housing Units | 3,068 | 88.6% |
| Renter-Occupied Housing Units | 396 | 11.4% |
| Total Occupied Housing Units | 3,464 | 100.0% |
Occupancy by Household Size in Chesapeake Ranch Estates
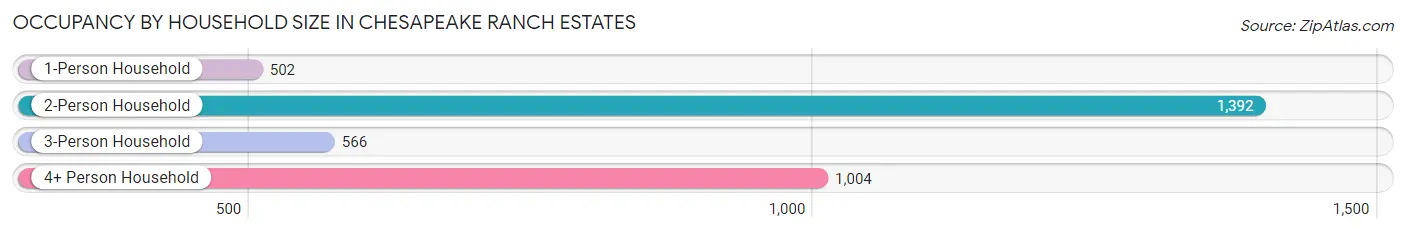
| Household Size | # Housing Units | % Housing Units |
| 1-Person Household | 502 | 14.5% |
| 2-Person Household | 1,392 | 40.2% |
| 3-Person Household | 566 | 16.3% |
| 4+ Person Household | 1,004 | 29.0% |
| Total Housing Units | 3,464 | 100.0% |
Occupancy by Ownership by Household Size in Chesapeake Ranch Estates
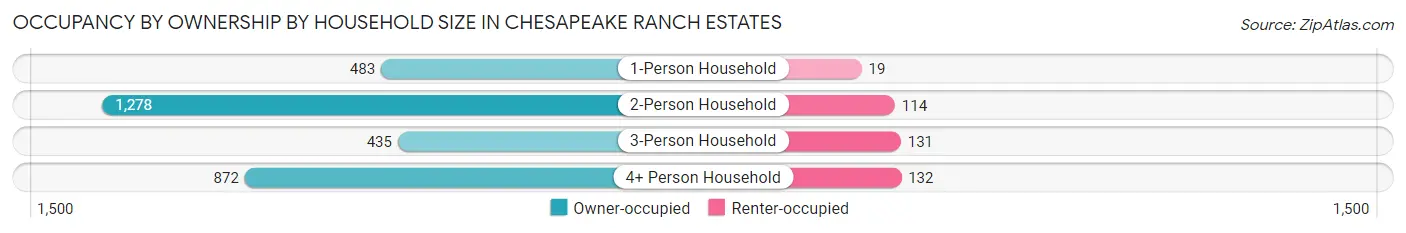
| Household Size | Owner-occupied | Renter-occupied |
| 1-Person Household | 483 (96.2%) | 19 (3.8%) |
| 2-Person Household | 1,278 (91.8%) | 114 (8.2%) |
| 3-Person Household | 435 (76.9%) | 131 (23.1%) |
| 4+ Person Household | 872 (86.9%) | 132 (13.2%) |
| Total Housing Units | 3,068 (88.6%) | 396 (11.4%) |
Occupancy by Educational Attainment in Chesapeake Ranch Estates
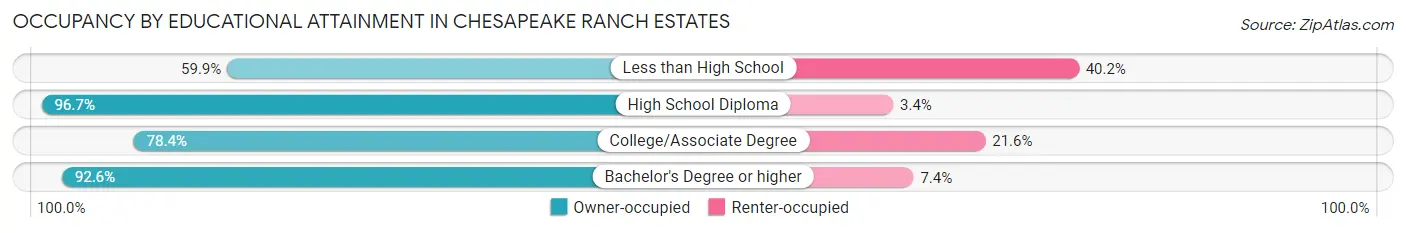
| Household Size | Owner-occupied | Renter-occupied |
| Less than High School | 82 (59.9%) | 55 (40.2%) |
| High School Diploma | 1,067 (96.7%) | 37 (3.4%) |
| College/Associate Degree | 768 (78.4%) | 212 (21.6%) |
| Bachelor's Degree or higher | 1,151 (92.6%) | 92 (7.4%) |
Occupancy by Age of Householder in Chesapeake Ranch Estates
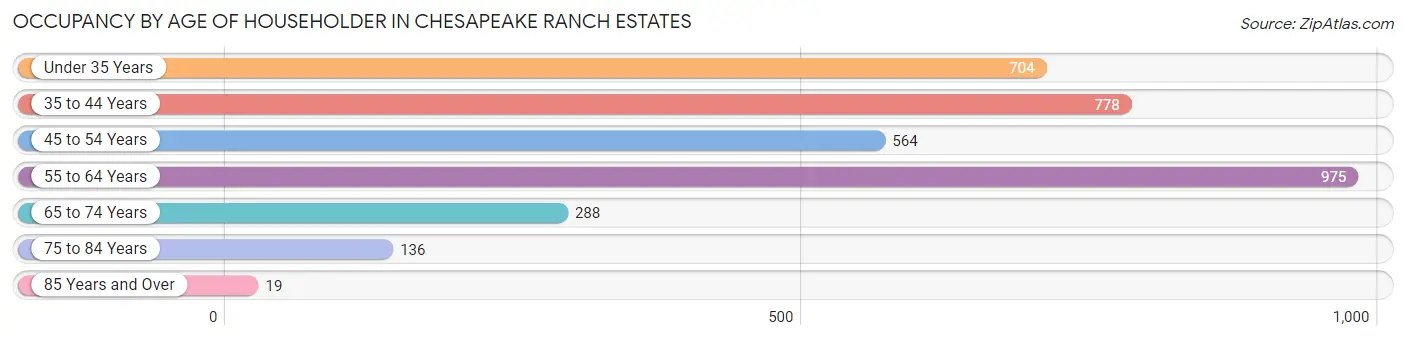
| Age Bracket | # Households | % Households |
| Under 35 Years | 704 | 20.3% |
| 35 to 44 Years | 778 | 22.5% |
| 45 to 54 Years | 564 | 16.3% |
| 55 to 64 Years | 975 | 28.1% |
| 65 to 74 Years | 288 | 8.3% |
| 75 to 84 Years | 136 | 3.9% |
| 85 Years and Over | 19 | 0.5% |
| Total | 3,464 | 100.0% |
Housing Finances in Chesapeake Ranch Estates
Median Income by Occupancy in Chesapeake Ranch Estates
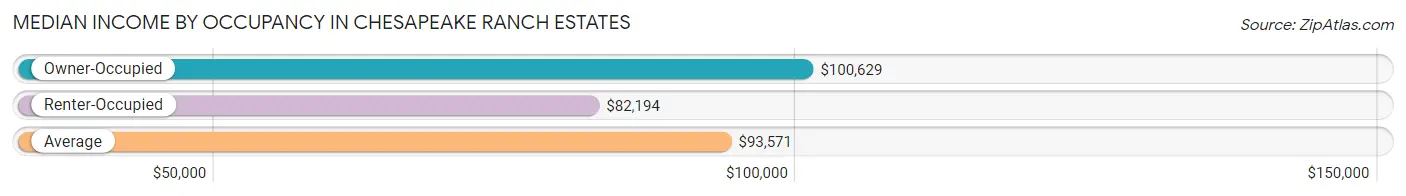
| Occupancy Type | # Households | Median Income |
| Owner-Occupied | 3,068 (88.6%) | $100,629 |
| Renter-Occupied | 396 (11.4%) | $82,194 |
| Average | 3,464 (100.0%) | $93,571 |
Occupancy by Householder Income Bracket in Chesapeake Ranch Estates
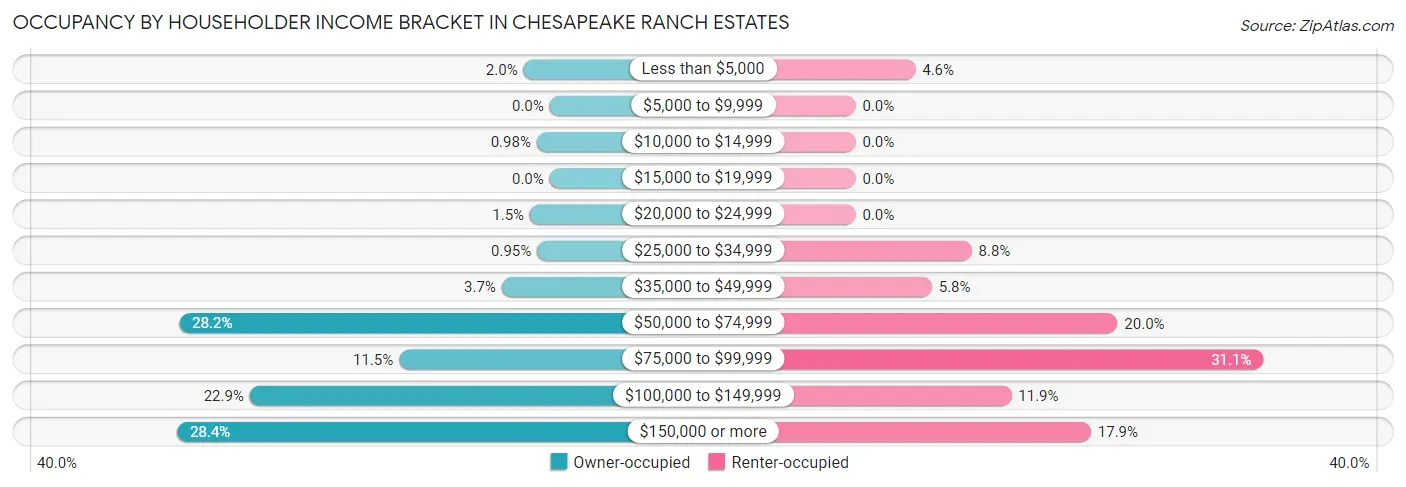
| Income Bracket | Owner-occupied | Renter-occupied |
| Less than $5,000 | 61 (2.0%) | 18 (4.5%) |
| $5,000 to $9,999 | 0 (0.0%) | 0 (0.0%) |
| $10,000 to $14,999 | 30 (1.0%) | 0 (0.0%) |
| $15,000 to $19,999 | 0 (0.0%) | 0 (0.0%) |
| $20,000 to $24,999 | 46 (1.5%) | 0 (0.0%) |
| $25,000 to $34,999 | 29 (0.9%) | 35 (8.8%) |
| $35,000 to $49,999 | 112 (3.6%) | 23 (5.8%) |
| $50,000 to $74,999 | 866 (28.2%) | 79 (20.0%) |
| $75,000 to $99,999 | 352 (11.5%) | 123 (31.1%) |
| $100,000 to $149,999 | 701 (22.9%) | 47 (11.9%) |
| $150,000 or more | 871 (28.4%) | 71 (17.9%) |
| Total | 3,068 (100.0%) | 396 (100.0%) |
Monthly Housing Cost Tiers in Chesapeake Ranch Estates
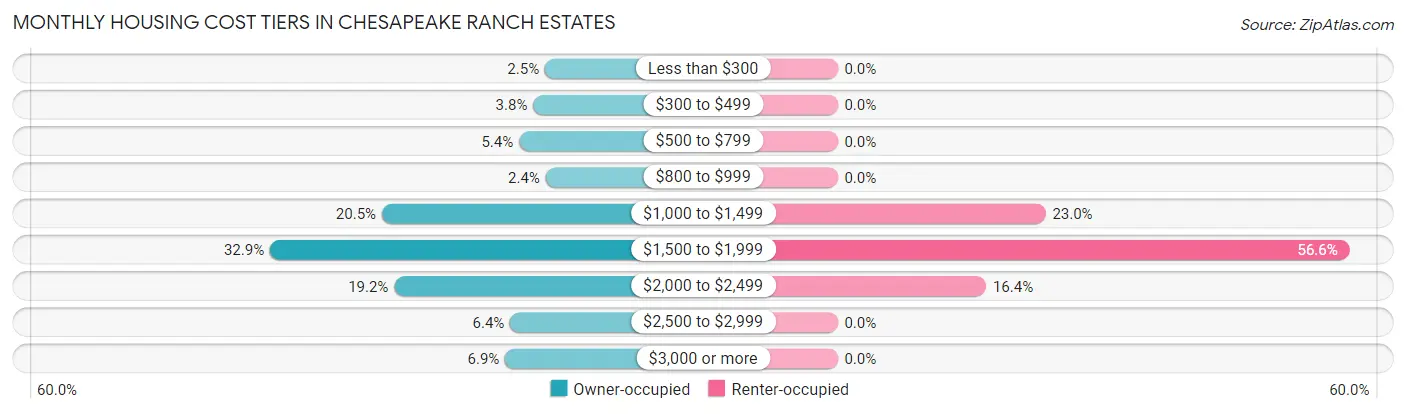
| Monthly Cost | Owner-occupied | Renter-occupied |
| Less than $300 | 77 (2.5%) | 0 (0.0%) |
| $300 to $499 | 117 (3.8%) | 0 (0.0%) |
| $500 to $799 | 165 (5.4%) | 0 (0.0%) |
| $800 to $999 | 75 (2.4%) | 0 (0.0%) |
| $1,000 to $1,499 | 630 (20.5%) | 91 (23.0%) |
| $1,500 to $1,999 | 1,009 (32.9%) | 224 (56.6%) |
| $2,000 to $2,499 | 588 (19.2%) | 65 (16.4%) |
| $2,500 to $2,999 | 195 (6.4%) | 0 (0.0%) |
| $3,000 or more | 212 (6.9%) | 0 (0.0%) |
| Total | 3,068 (100.0%) | 396 (100.0%) |
Physical Housing Characteristics in Chesapeake Ranch Estates
Housing Structures in Chesapeake Ranch Estates
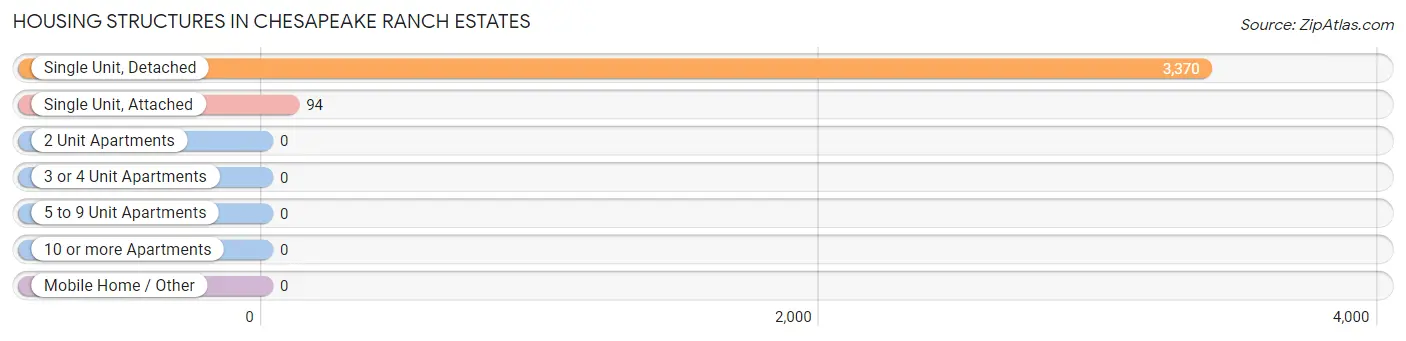
| Structure Type | # Housing Units | % Housing Units |
| Single Unit, Detached | 3,370 | 97.3% |
| Single Unit, Attached | 94 | 2.7% |
| 2 Unit Apartments | 0 | 0.0% |
| 3 or 4 Unit Apartments | 0 | 0.0% |
| 5 to 9 Unit Apartments | 0 | 0.0% |
| 10 or more Apartments | 0 | 0.0% |
| Mobile Home / Other | 0 | 0.0% |
| Total | 3,464 | 100.0% |
Housing Structures by Occupancy in Chesapeake Ranch Estates
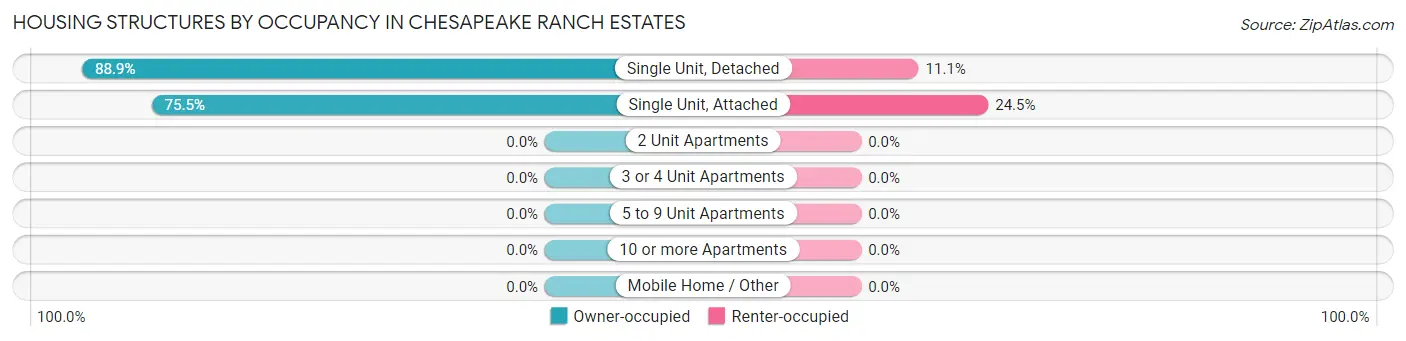
| Structure Type | Owner-occupied | Renter-occupied |
| Single Unit, Detached | 2,997 (88.9%) | 373 (11.1%) |
| Single Unit, Attached | 71 (75.5%) | 23 (24.5%) |
| 2 Unit Apartments | 0 (0.0%) | 0 (0.0%) |
| 3 or 4 Unit Apartments | 0 (0.0%) | 0 (0.0%) |
| 5 to 9 Unit Apartments | 0 (0.0%) | 0 (0.0%) |
| 10 or more Apartments | 0 (0.0%) | 0 (0.0%) |
| Mobile Home / Other | 0 (0.0%) | 0 (0.0%) |
| Total | 3,068 (88.6%) | 396 (11.4%) |
Housing Structures by Number of Rooms in Chesapeake Ranch Estates
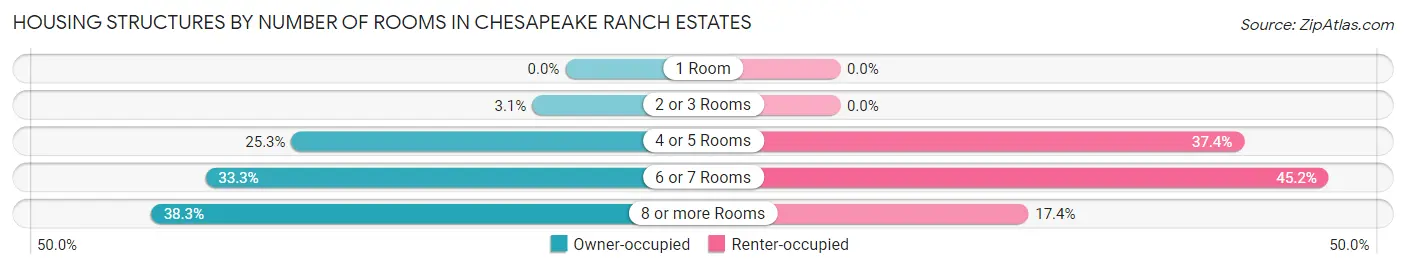
| Number of Rooms | Owner-occupied | Renter-occupied |
| 1 Room | 0 (0.0%) | 0 (0.0%) |
| 2 or 3 Rooms | 94 (3.1%) | 0 (0.0%) |
| 4 or 5 Rooms | 777 (25.3%) | 148 (37.4%) |
| 6 or 7 Rooms | 1,021 (33.3%) | 179 (45.2%) |
| 8 or more Rooms | 1,176 (38.3%) | 69 (17.4%) |
| Total | 3,068 (100.0%) | 396 (100.0%) |
Housing Structure by Heating Type in Chesapeake Ranch Estates
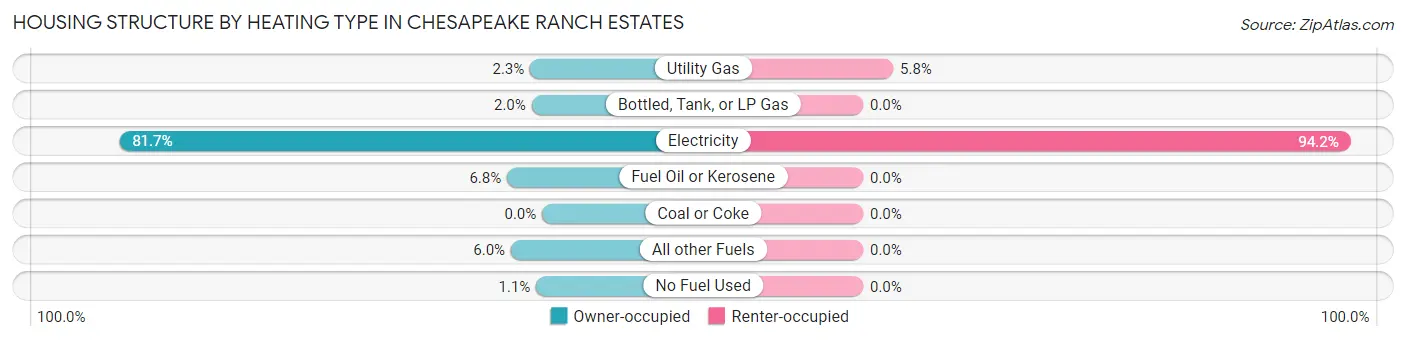
| Heating Type | Owner-occupied | Renter-occupied |
| Utility Gas | 71 (2.3%) | 23 (5.8%) |
| Bottled, Tank, or LP Gas | 62 (2.0%) | 0 (0.0%) |
| Electricity | 2,507 (81.7%) | 373 (94.2%) |
| Fuel Oil or Kerosene | 208 (6.8%) | 0 (0.0%) |
| Coal or Coke | 0 (0.0%) | 0 (0.0%) |
| All other Fuels | 185 (6.0%) | 0 (0.0%) |
| No Fuel Used | 35 (1.1%) | 0 (0.0%) |
| Total | 3,068 (100.0%) | 396 (100.0%) |
Household Vehicle Usage in Chesapeake Ranch Estates
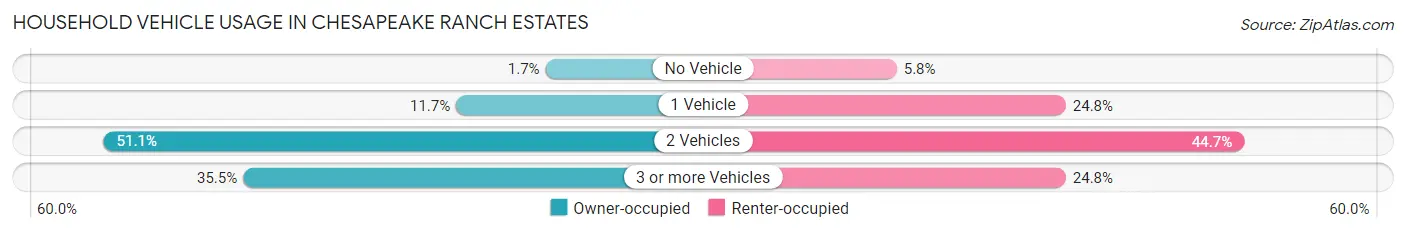
| Vehicles per Household | Owner-occupied | Renter-occupied |
| No Vehicle | 51 (1.7%) | 23 (5.8%) |
| 1 Vehicle | 358 (11.7%) | 98 (24.7%) |
| 2 Vehicles | 1,569 (51.1%) | 177 (44.7%) |
| 3 or more Vehicles | 1,090 (35.5%) | 98 (24.7%) |
| Total | 3,068 (100.0%) | 396 (100.0%) |
Real Estate & Mortgages in Chesapeake Ranch Estates
Real Estate and Mortgage Overview in Chesapeake Ranch Estates
| Characteristic | Without Mortgage | With Mortgage |
| Housing Units | 364 | 2,704 |
| Median Property Value | $285,400 | $277,200 |
| Median Household Income | $81,500 | $836 |
| Monthly Housing Costs | $485 | $212 |
| Real Estate Taxes | $2,241 | $54 |
Property Value by Mortgage Status in Chesapeake Ranch Estates
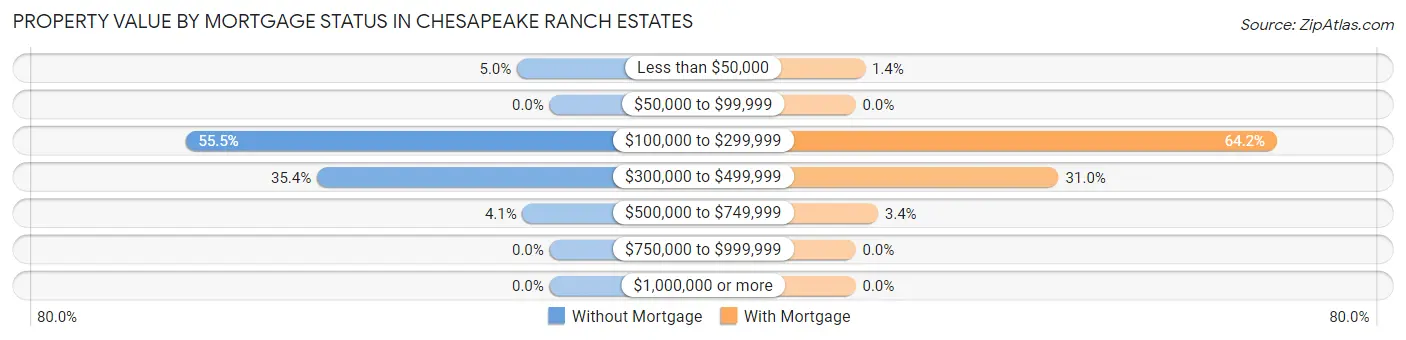
| Property Value | Without Mortgage | With Mortgage |
| Less than $50,000 | 18 (5.0%) | 39 (1.4%) |
| $50,000 to $99,999 | 0 (0.0%) | 0 (0.0%) |
| $100,000 to $299,999 | 202 (55.5%) | 1,736 (64.2%) |
| $300,000 to $499,999 | 129 (35.4%) | 837 (30.9%) |
| $500,000 to $749,999 | 15 (4.1%) | 92 (3.4%) |
| $750,000 to $999,999 | 0 (0.0%) | 0 (0.0%) |
| $1,000,000 or more | 0 (0.0%) | 0 (0.0%) |
| Total | 364 (100.0%) | 2,704 (100.0%) |
Household Income by Mortgage Status in Chesapeake Ranch Estates
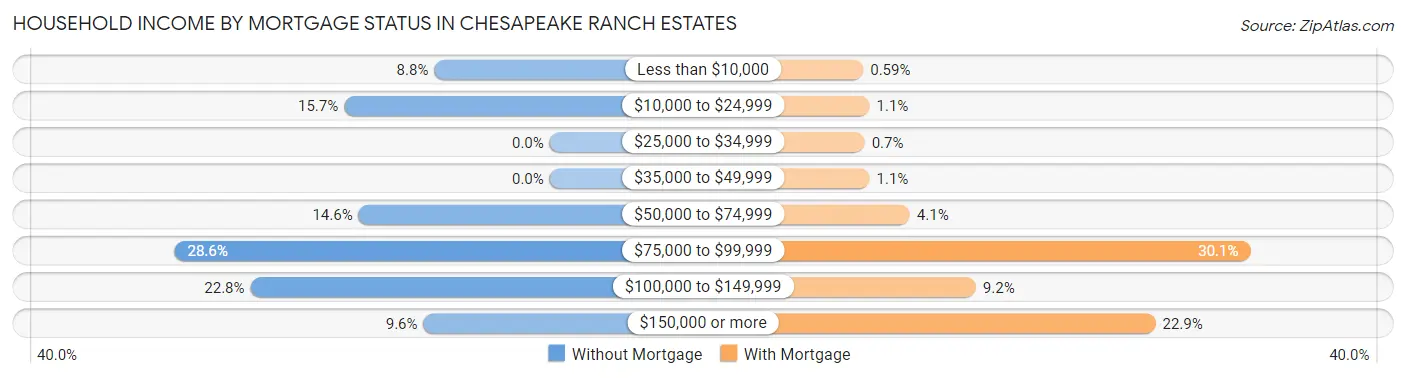
| Household Income | Without Mortgage | With Mortgage |
| Less than $10,000 | 32 (8.8%) | 16 (0.6%) |
| $10,000 to $24,999 | 57 (15.7%) | 29 (1.1%) |
| $25,000 to $34,999 | 0 (0.0%) | 19 (0.7%) |
| $35,000 to $49,999 | 0 (0.0%) | 29 (1.1%) |
| $50,000 to $74,999 | 53 (14.6%) | 112 (4.1%) |
| $75,000 to $99,999 | 104 (28.6%) | 813 (30.1%) |
| $100,000 to $149,999 | 83 (22.8%) | 248 (9.2%) |
| $150,000 or more | 35 (9.6%) | 618 (22.9%) |
| Total | 364 (100.0%) | 2,704 (100.0%) |
Property Value to Household Income Ratio in Chesapeake Ranch Estates
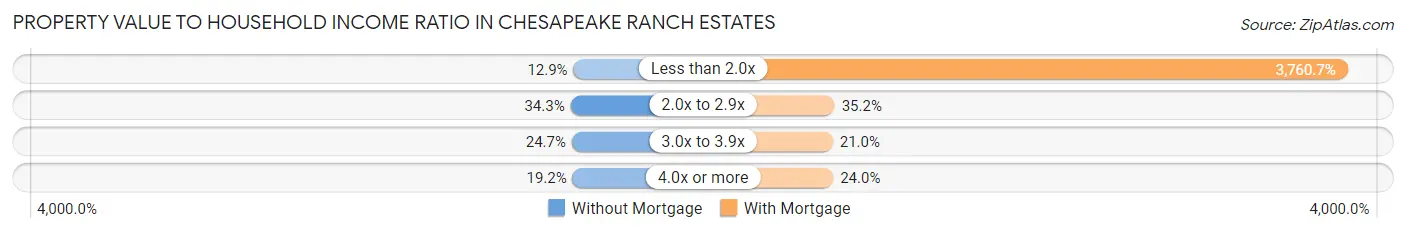
| Value-to-Income Ratio | Without Mortgage | With Mortgage |
| Less than 2.0x | 47 (12.9%) | 101,689 (3,760.7%) |
| 2.0x to 2.9x | 125 (34.3%) | 951 (35.2%) |
| 3.0x to 3.9x | 90 (24.7%) | 567 (21.0%) |
| 4.0x or more | 70 (19.2%) | 650 (24.0%) |
| Total | 364 (100.0%) | 2,704 (100.0%) |
Real Estate Taxes by Mortgage Status in Chesapeake Ranch Estates
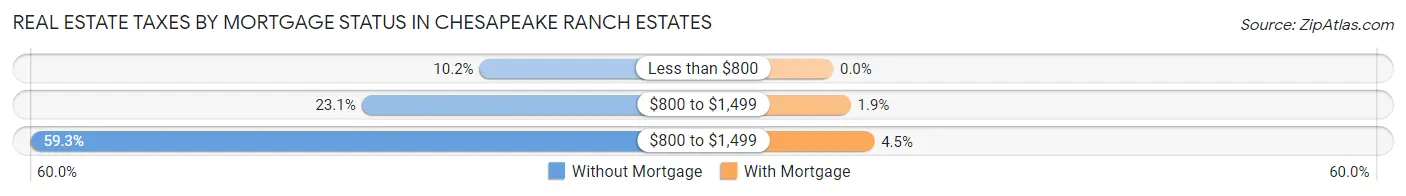
| Property Taxes | Without Mortgage | With Mortgage |
| Less than $800 | 37 (10.2%) | 0 (0.0%) |
| $800 to $1,499 | 84 (23.1%) | 52 (1.9%) |
| $800 to $1,499 | 216 (59.3%) | 122 (4.5%) |
| Total | 364 (100.0%) | 2,704 (100.0%) |
Health & Disability in Chesapeake Ranch Estates
Health Insurance Coverage by Age in Chesapeake Ranch Estates
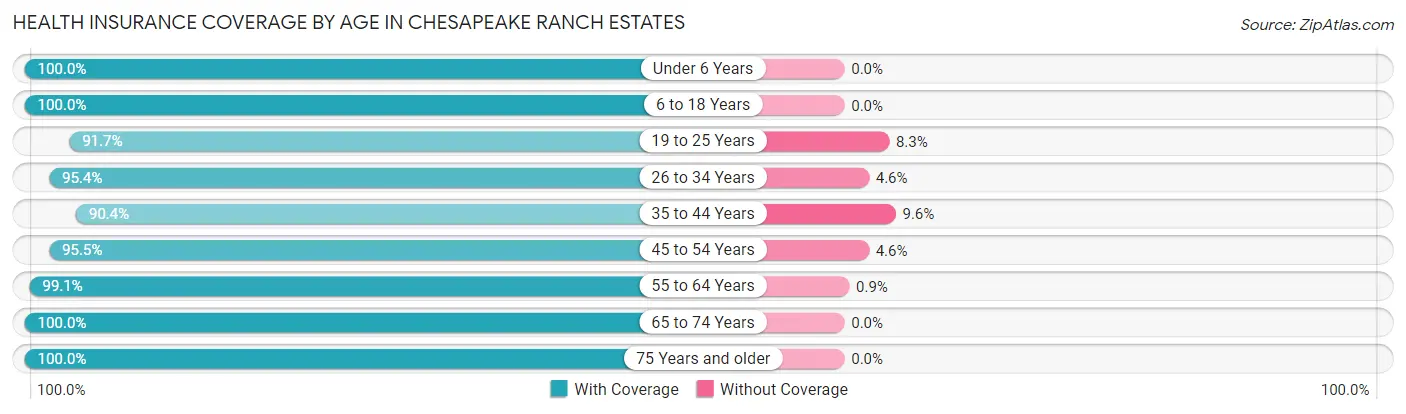
| Age Bracket | With Coverage | Without Coverage |
| Under 6 Years | 871 (100.0%) | 0 (0.0%) |
| 6 to 18 Years | 1,603 (100.0%) | 0 (0.0%) |
| 19 to 25 Years | 968 (91.7%) | 88 (8.3%) |
| 26 to 34 Years | 1,210 (95.4%) | 58 (4.6%) |
| 35 to 44 Years | 1,173 (90.4%) | 124 (9.6%) |
| 45 to 54 Years | 1,155 (95.5%) | 55 (4.5%) |
| 55 to 64 Years | 1,648 (99.1%) | 15 (0.9%) |
| 65 to 74 Years | 654 (100.0%) | 0 (0.0%) |
| 75 Years and older | 207 (100.0%) | 0 (0.0%) |
| Total | 9,489 (96.5%) | 340 (3.5%) |
Health Insurance Coverage by Citizenship Status in Chesapeake Ranch Estates
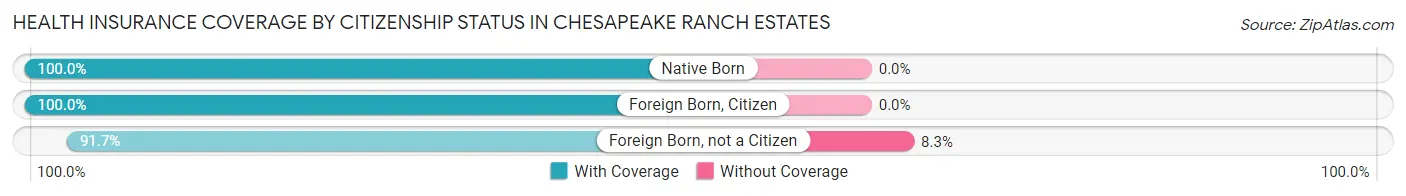
| Citizenship Status | With Coverage | Without Coverage |
| Native Born | 871 (100.0%) | 0 (0.0%) |
| Foreign Born, Citizen | 1,603 (100.0%) | 0 (0.0%) |
| Foreign Born, not a Citizen | 968 (91.7%) | 88 (8.3%) |
Health Insurance Coverage by Household Income in Chesapeake Ranch Estates
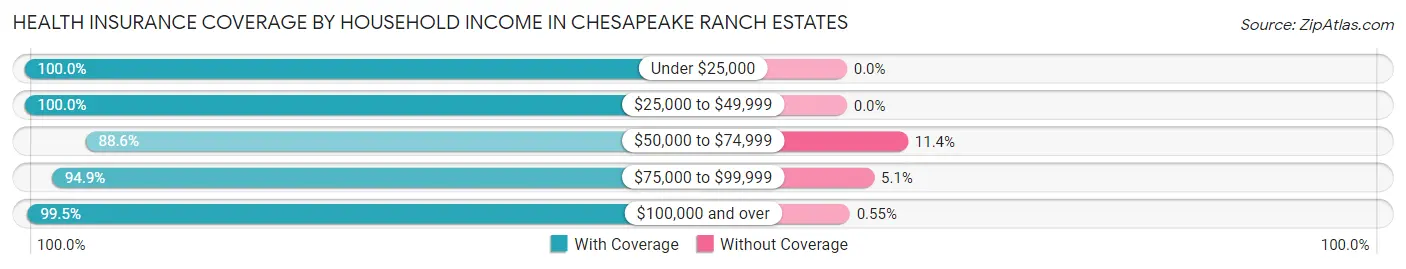
| Household Income | With Coverage | Without Coverage |
| Under $25,000 | 493 (100.0%) | 0 (0.0%) |
| $25,000 to $49,999 | 449 (100.0%) | 0 (0.0%) |
| $50,000 to $74,999 | 1,967 (88.6%) | 254 (11.4%) |
| $75,000 to $99,999 | 1,020 (94.9%) | 55 (5.1%) |
| $100,000 and over | 5,559 (99.5%) | 31 (0.5%) |
Public vs Private Health Insurance Coverage by Age in Chesapeake Ranch Estates
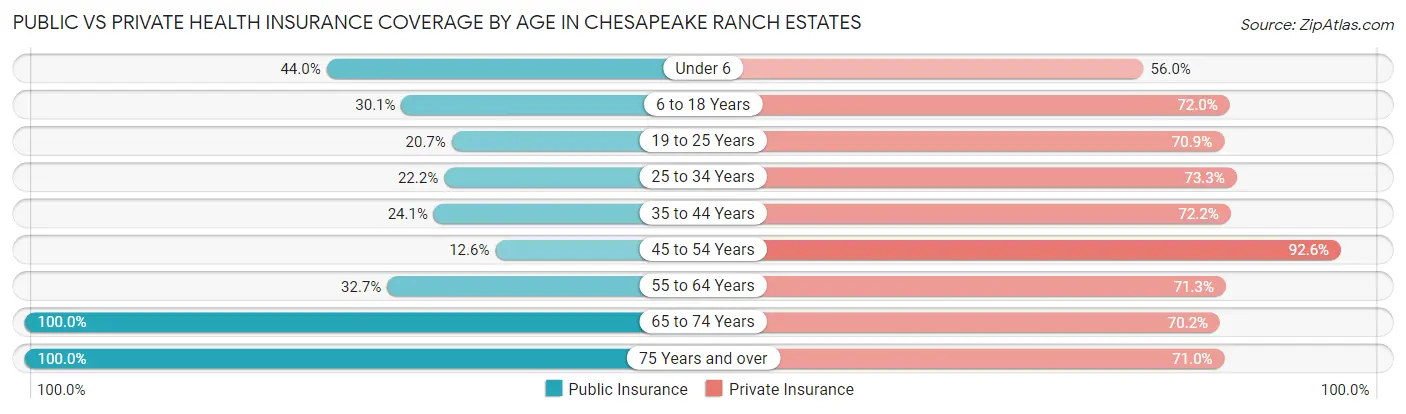
| Age Bracket | Public Insurance | Private Insurance |
| Under 6 | 383 (44.0%) | 488 (56.0%) |
| 6 to 18 Years | 482 (30.1%) | 1,154 (72.0%) |
| 19 to 25 Years | 219 (20.7%) | 749 (70.9%) |
| 25 to 34 Years | 281 (22.2%) | 929 (73.3%) |
| 35 to 44 Years | 312 (24.1%) | 936 (72.2%) |
| 45 to 54 Years | 153 (12.6%) | 1,121 (92.6%) |
| 55 to 64 Years | 544 (32.7%) | 1,185 (71.3%) |
| 65 to 74 Years | 654 (100.0%) | 459 (70.2%) |
| 75 Years and over | 207 (100.0%) | 147 (71.0%) |
| Total | 3,235 (32.9%) | 7,168 (72.9%) |
Disability Status by Sex by Age in Chesapeake Ranch Estates
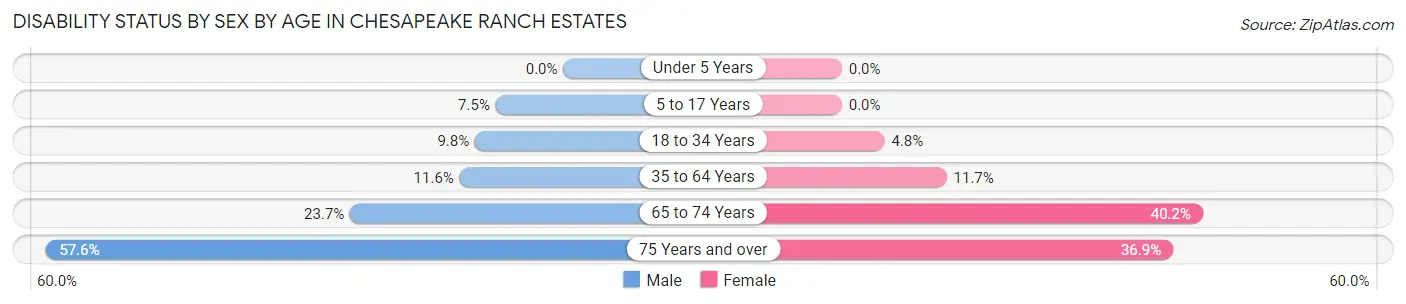
| Age Bracket | Male | Female |
| Under 5 Years | 0 (0.0%) | 0 (0.0%) |
| 5 to 17 Years | 63 (7.5%) | 0 (0.0%) |
| 18 to 34 Years | 118 (9.8%) | 54 (4.8%) |
| 35 to 64 Years | 242 (11.6%) | 242 (11.7%) |
| 65 to 74 Years | 85 (23.7%) | 119 (40.2%) |
| 75 Years and over | 38 (57.6%) | 52 (36.9%) |
Disability Class by Sex by Age in Chesapeake Ranch Estates
Disability Class: Hearing Difficulty
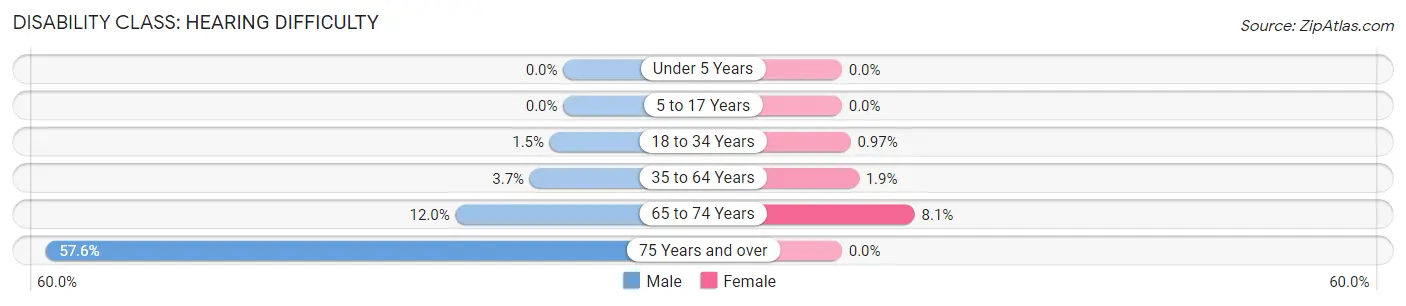
| Age Bracket | Male | Female |
| Under 5 Years | 0 (0.0%) | 0 (0.0%) |
| 5 to 17 Years | 0 (0.0%) | 0 (0.0%) |
| 18 to 34 Years | 18 (1.5%) | 11 (1.0%) |
| 35 to 64 Years | 78 (3.7%) | 39 (1.9%) |
| 65 to 74 Years | 43 (12.0%) | 24 (8.1%) |
| 75 Years and over | 38 (57.6%) | 0 (0.0%) |
Disability Class: Vision Difficulty
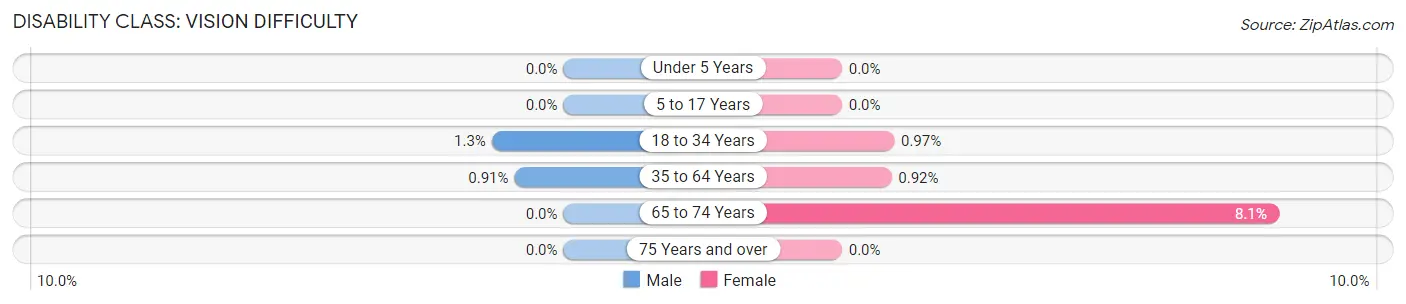
| Age Bracket | Male | Female |
| Under 5 Years | 0 (0.0%) | 0 (0.0%) |
| 5 to 17 Years | 0 (0.0%) | 0 (0.0%) |
| 18 to 34 Years | 16 (1.3%) | 11 (1.0%) |
| 35 to 64 Years | 19 (0.9%) | 19 (0.9%) |
| 65 to 74 Years | 0 (0.0%) | 24 (8.1%) |
| 75 Years and over | 0 (0.0%) | 0 (0.0%) |
Disability Class: Cognitive Difficulty
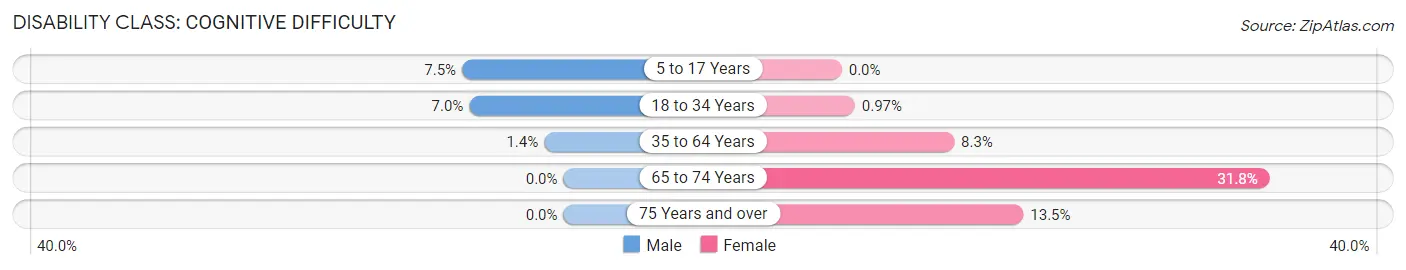
| Age Bracket | Male | Female |
| 5 to 17 Years | 63 (7.5%) | 0 (0.0%) |
| 18 to 34 Years | 84 (7.0%) | 11 (1.0%) |
| 35 to 64 Years | 30 (1.4%) | 173 (8.3%) |
| 65 to 74 Years | 0 (0.0%) | 94 (31.8%) |
| 75 Years and over | 0 (0.0%) | 19 (13.5%) |
Disability Class: Ambulatory Difficulty
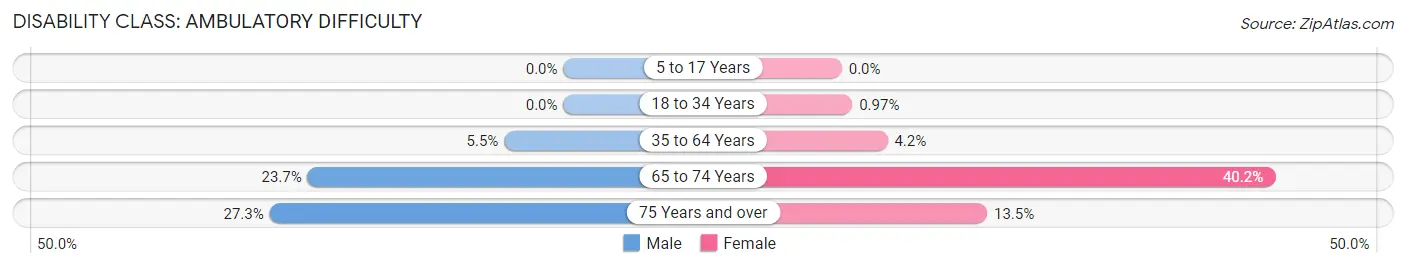
| Age Bracket | Male | Female |
| 5 to 17 Years | 0 (0.0%) | 0 (0.0%) |
| 18 to 34 Years | 0 (0.0%) | 11 (1.0%) |
| 35 to 64 Years | 115 (5.5%) | 88 (4.2%) |
| 65 to 74 Years | 85 (23.7%) | 119 (40.2%) |
| 75 Years and over | 18 (27.3%) | 19 (13.5%) |
Disability Class: Self-Care Difficulty
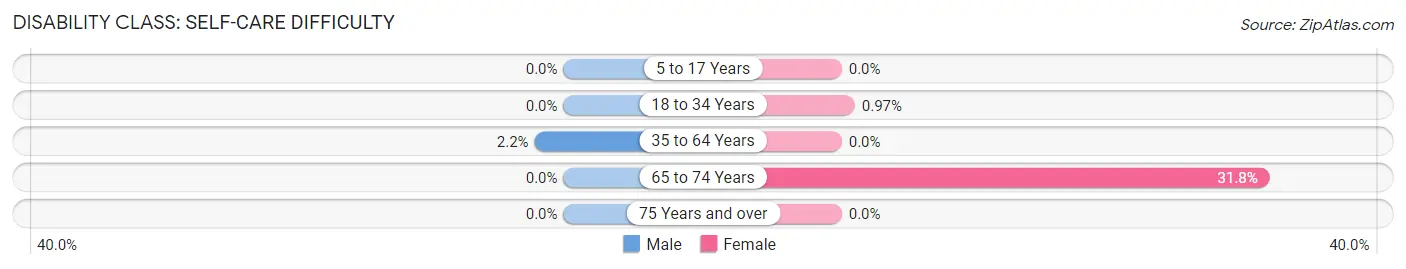
| Age Bracket | Male | Female |
| 5 to 17 Years | 0 (0.0%) | 0 (0.0%) |
| 18 to 34 Years | 0 (0.0%) | 11 (1.0%) |
| 35 to 64 Years | 45 (2.1%) | 0 (0.0%) |
| 65 to 74 Years | 0 (0.0%) | 94 (31.8%) |
| 75 Years and over | 0 (0.0%) | 0 (0.0%) |
Technology Access in Chesapeake Ranch Estates
Computing Device Access in Chesapeake Ranch Estates
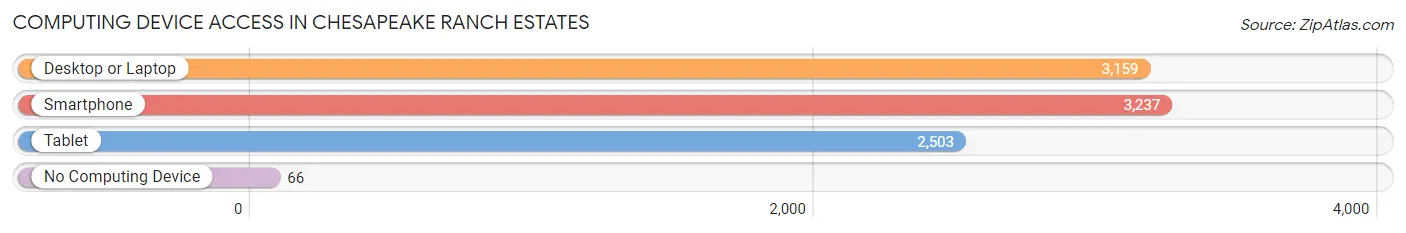
| Device Type | # Households | % Households |
| Desktop or Laptop | 3,159 | 91.2% |
| Smartphone | 3,237 | 93.4% |
| Tablet | 2,503 | 72.3% |
| No Computing Device | 66 | 1.9% |
| Total | 3,464 | 100.0% |
Internet Access in Chesapeake Ranch Estates
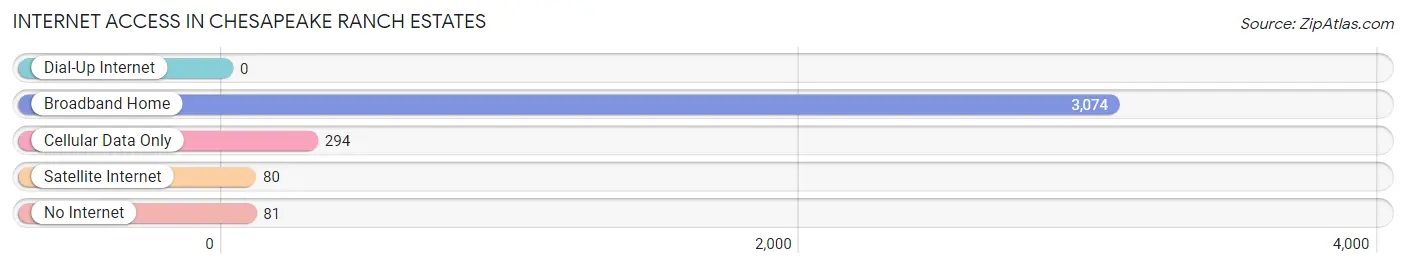
| Internet Type | # Households | % Households |
| Dial-Up Internet | 0 | 0.0% |
| Broadband Home | 3,074 | 88.7% |
| Cellular Data Only | 294 | 8.5% |
| Satellite Internet | 80 | 2.3% |
| No Internet | 81 | 2.3% |
| Total | 3,464 | 100.0% |
Chesapeake Ranch Estates Summary
Chesapeake Ranch Estates (CRE) is a census-designated place (CDP) located in Calvert County, Maryland. It is situated on the western shore of the Chesapeake Bay, approximately 40 miles south of Baltimore and 40 miles east of Washington, D.C. The CDP has a total area of 8.3 square miles, all of which is land. As of the 2010 census, the population of CRE was 2,737.
History
The area that is now Chesapeake Ranch Estates was originally inhabited by the Piscataway Indians. The first European settlers arrived in the area in the early 1700s. The area was known as “The Neck” and was part of the Calvert County land grant. In the late 1800s, the area was developed as a resort community. The Chesapeake Beach Railway was built in the early 1900s to connect the area to Washington, D.C. and Baltimore.
In the 1950s, the area was developed as a planned community. The Chesapeake Ranch Estates Corporation was formed in 1954 and purchased the land from the Calvert County land grant. The corporation developed the area into a residential community with a variety of amenities, including a golf course, a beach, a marina, and a shopping center.
Geography
Chesapeake Ranch Estates is located on the western shore of the Chesapeake Bay. The CDP is bordered to the north by the Patuxent River, to the east by the Chesapeake Bay, to the south by the Patuxent River, and to the west by the Patuxent River. The CDP has a total area of 8.3 square miles, all of which is land.
The terrain of the CDP is mostly flat, with some rolling hills. The area is mostly wooded, with some open fields. The climate of the area is humid subtropical, with hot, humid summers and mild winters.
Economy
The economy of Chesapeake Ranch Estates is largely based on tourism and recreation. The area is home to a variety of recreational activities, including fishing, boating, golfing, and swimming. The area is also home to a variety of restaurants, shops, and other businesses.
Demographics
As of the 2010 census, the population of Chesapeake Ranch Estates was 2,737. The racial makeup of the CDP was 94.3% White, 2.2% African American, 0.7% Asian, 0.3% Native American, 0.1% Pacific Islander, and 2.4% from other races. Hispanic or Latino of any race were 3.2% of the population.
The median income for a household in the CDP was $76,250, and the median income for a family was $86,250. The per capita income for the CDP was $35,945. About 4.3% of families and 5.7% of the population were below the poverty line, including 8.3% of those under age 18 and 4.2% of those age 65 or over.
Common Questions
What is Per Capita Income in Chesapeake Ranch Estates?
Per Capita income in Chesapeake Ranch Estates is $46,399.
What is the Median Family Income in Chesapeake Ranch Estates?
Median Family Income in Chesapeake Ranch Estates is $104,125.
What is the Median Household income in Chesapeake Ranch Estates?
Median Household Income in Chesapeake Ranch Estates is $93,571.
What is Income or Wage Gap in Chesapeake Ranch Estates?
Income or Wage Gap in Chesapeake Ranch Estates is 35.1%.
Women in Chesapeake Ranch Estates earn 64.9 cents for every dollar earned by a man.
What is Family Income Deficit in Chesapeake Ranch Estates?
Family Income Deficit in Chesapeake Ranch Estates is $14,929.
Families that are below poverty line in Chesapeake Ranch Estates earn $14,929 less on average than the poverty threshold level.
What is Inequality or Gini Index in Chesapeake Ranch Estates?
Inequality or Gini Index in Chesapeake Ranch Estates is 0.40.
What is the Total Population of Chesapeake Ranch Estates?
Total Population of Chesapeake Ranch Estates is 10,015.
What is the Total Male Population of Chesapeake Ranch Estates?
Total Male Population of Chesapeake Ranch Estates is 4,985.
What is the Total Female Population of Chesapeake Ranch Estates?
Total Female Population of Chesapeake Ranch Estates is 5,030.
What is the Ratio of Males per 100 Females in Chesapeake Ranch Estates?
There are 99.11 Males per 100 Females in Chesapeake Ranch Estates.
What is the Ratio of Females per 100 Males in Chesapeake Ranch Estates?
There are 100.90 Females per 100 Males in Chesapeake Ranch Estates.
What is the Median Population Age in Chesapeake Ranch Estates?
Median Population Age in Chesapeake Ranch Estates is 35.6 Years.
What is the Average Family Size in Chesapeake Ranch Estates
Average Family Size in Chesapeake Ranch Estates is 3.1 People.
What is the Average Household Size in Chesapeake Ranch Estates
Average Household Size in Chesapeake Ranch Estates is 2.9 People.
How Large is the Labor Force in Chesapeake Ranch Estates?
There are 5,646 People in the Labor Forcein in Chesapeake Ranch Estates.
What is the Percentage of People in the Labor Force in Chesapeake Ranch Estates?
71.3% of People are in the Labor Force in Chesapeake Ranch Estates.
What is the Unemployment Rate in Chesapeake Ranch Estates?
Unemployment Rate in Chesapeake Ranch Estates is 2.7%.