Freeport, IL Map & Demographics
Freeport Map
Freeport Overview
$28,348
PER CAPITA INCOME
$53,873
AVG FAMILY INCOME
$44,658
AVG HOUSEHOLD INCOME
17.1%
WAGE / INCOME GAP [ % ]
82.9¢/ $1
WAGE / INCOME GAP [ $ ]
$7,178
FAMILY INCOME DEFICIT
0.46
INEQUALITY / GINI INDEX
23,884
TOTAL POPULATION
11,283
MALE POPULATION
12,601
FEMALE POPULATION
89.54
MALES / 100 FEMALES
111.68
FEMALES / 100 MALES
43.4
MEDIAN AGE
2.8
AVG FAMILY SIZE
2.1
AVG HOUSEHOLD SIZE
11,034
LABOR FORCE [ PEOPLE ]
57.6%
PERCENT IN LABOR FORCE
6.5%
UNEMPLOYMENT RATE
Freeport Zip Codes
Freeport Area Codes
Income in Freeport
Income Overview in Freeport
Per Capita Income in Freeport is $28,348, while median incomes of families and households are $53,873 and $44,658 respectively.
| Characteristic | Number | Measure |
| Per Capita Income | 23,884 | $28,348 |
| Median Family Income | 5,934 | $53,873 |
| Mean Family Income | 5,934 | $72,903 |
| Median Household Income | 10,905 | $44,658 |
| Mean Household Income | 10,905 | $61,264 |
| Income Deficit | 5,934 | $7,178 |
| Wage / Income Gap (%) | 23,884 | 17.07% |
| Wage / Income Gap ($) | 23,884 | 82.93¢ per $1 |
| Gini / Inequality Index | 23,884 | 0.46 |
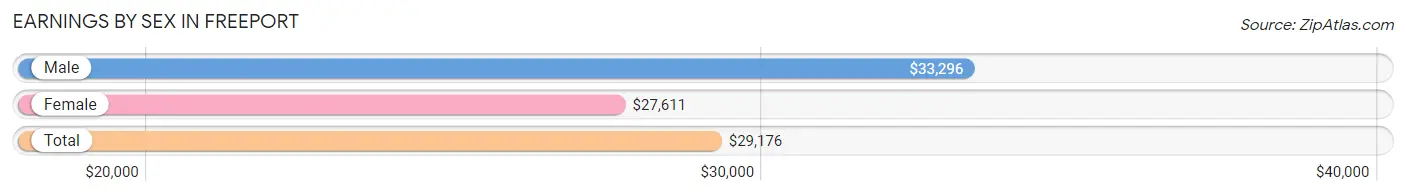
Earnings by Sex in Freeport
Average Earnings in Freeport are $29,176, $33,296 for men and $27,611 for women, a difference of 17.1%.
| Sex | Number | Average Earnings |
| Male | 5,629 (47.8%) | $33,296 |
| Female | 6,142 (52.2%) | $27,611 |
| Total | 11,771 (100.0%) | $29,176 |
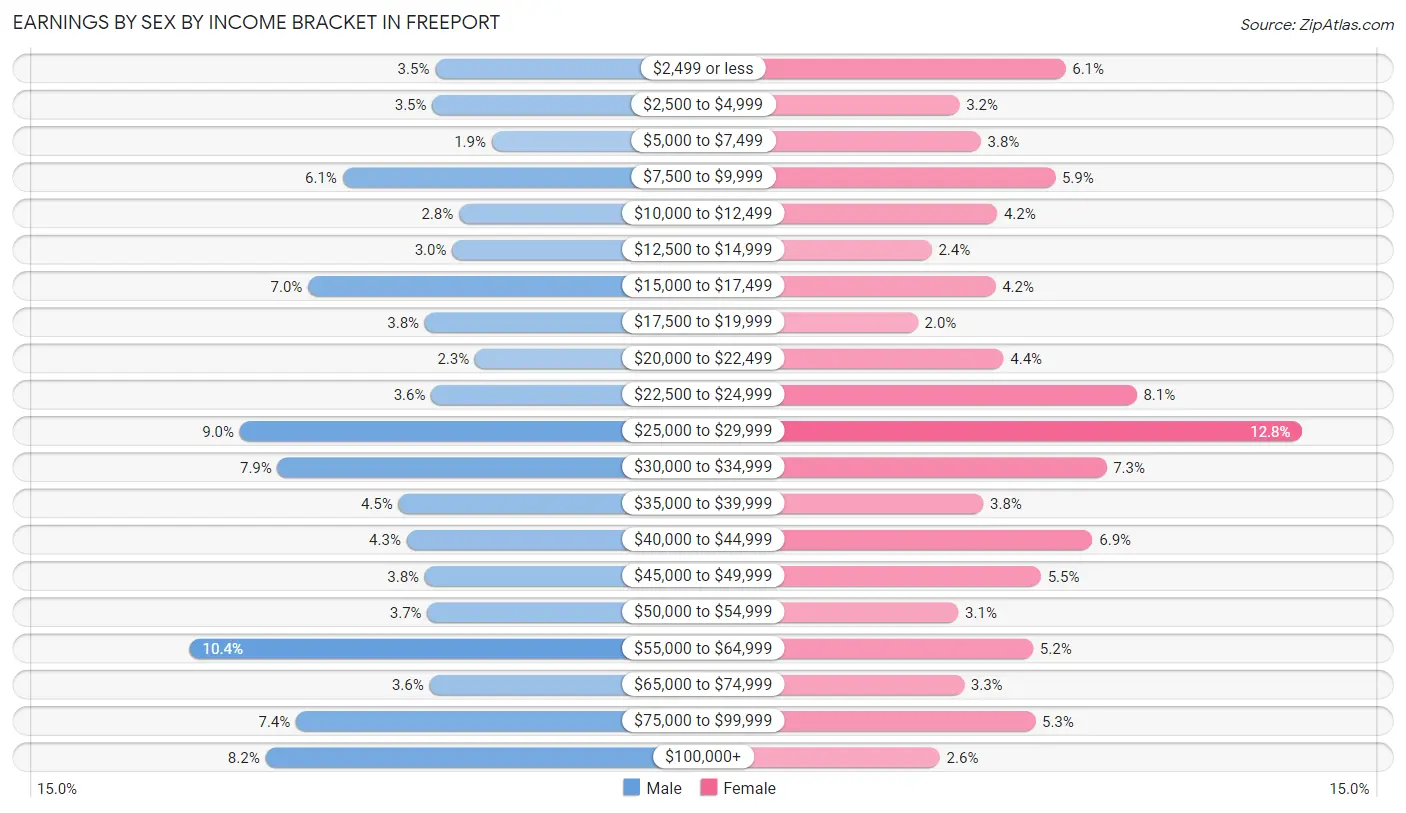
Earnings by Sex by Income Bracket in Freeport
The most common earnings brackets in Freeport are $55,000 to $64,999 for men (583 | 10.4%) and $25,000 to $29,999 for women (786 | 12.8%).
| Income | Male | Female |
| $2,499 or less | 195 (3.5%) | 377 (6.1%) |
| $2,500 to $4,999 | 199 (3.5%) | 194 (3.2%) |
| $5,000 to $7,499 | 105 (1.9%) | 231 (3.8%) |
| $7,500 to $9,999 | 341 (6.1%) | 359 (5.9%) |
| $10,000 to $12,499 | 157 (2.8%) | 259 (4.2%) |
| $12,500 to $14,999 | 168 (3.0%) | 146 (2.4%) |
| $15,000 to $17,499 | 396 (7.0%) | 256 (4.2%) |
| $17,500 to $19,999 | 211 (3.7%) | 122 (2.0%) |
| $20,000 to $22,499 | 132 (2.3%) | 270 (4.4%) |
| $22,500 to $24,999 | 201 (3.6%) | 500 (8.1%) |
| $25,000 to $29,999 | 504 (8.9%) | 786 (12.8%) |
| $30,000 to $34,999 | 444 (7.9%) | 448 (7.3%) |
| $35,000 to $39,999 | 253 (4.5%) | 235 (3.8%) |
| $40,000 to $44,999 | 240 (4.3%) | 424 (6.9%) |
| $45,000 to $49,999 | 211 (3.7%) | 335 (5.4%) |
| $50,000 to $54,999 | 207 (3.7%) | 192 (3.1%) |
| $55,000 to $64,999 | 583 (10.4%) | 321 (5.2%) |
| $65,000 to $74,999 | 204 (3.6%) | 202 (3.3%) |
| $75,000 to $99,999 | 415 (7.4%) | 325 (5.3%) |
| $100,000+ | 463 (8.2%) | 160 (2.6%) |
| Total | 5,629 (100.0%) | 6,142 (100.0%) |
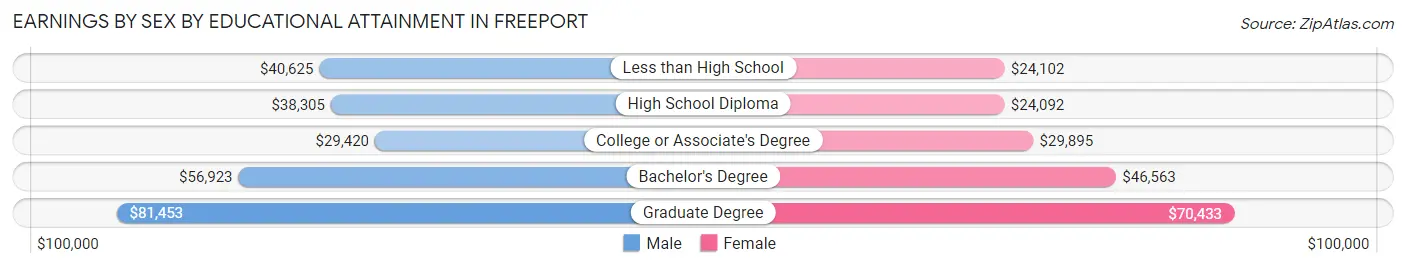
Earnings by Sex by Educational Attainment in Freeport
Average earnings in Freeport are $40,050 for men and $29,940 for women, a difference of 25.2%. Men with an educational attainment of graduate degree enjoy the highest average annual earnings of $81,453, while those with college or associate's degree education earn the least with $29,420. Women with an educational attainment of graduate degree earn the most with the average annual earnings of $70,433, while those with high school diploma education have the smallest earnings of $24,092.
| Educational Attainment | Male Income | Female Income |
| Less than High School | $40,625 | $24,102 |
| High School Diploma | $38,305 | $24,092 |
| College or Associate's Degree | $29,420 | $29,895 |
| Bachelor's Degree | $56,923 | $46,563 |
| Graduate Degree | $81,453 | $70,433 |
| Total | $40,050 | $29,940 |
Family Income in Freeport
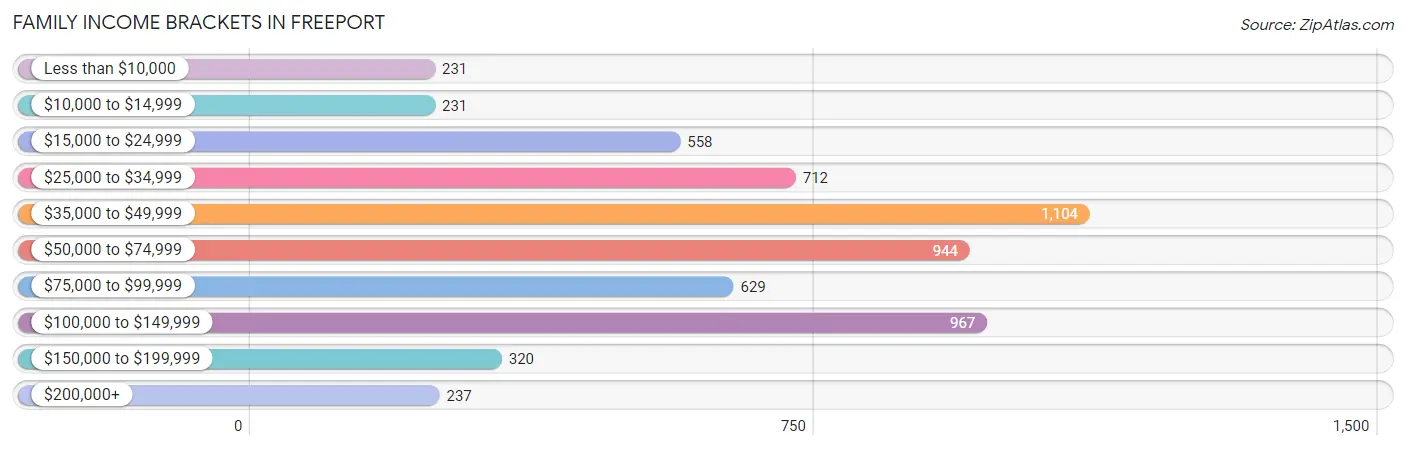
Family Income Brackets in Freeport
According to the Freeport family income data, there are 1,104 families falling into the $35,000 to $49,999 income range, which is the most common income bracket and makes up 18.6% of all families. Conversely, the less than $10,000 income bracket is the least frequent group with only 231 families (3.9%) belonging to this category.
| Income Bracket | # Families | % Families |
| Less than $10,000 | 231 | 3.9% |
| $10,000 to $14,999 | 231 | 3.9% |
| $15,000 to $24,999 | 558 | 9.4% |
| $25,000 to $34,999 | 712 | 12.0% |
| $35,000 to $49,999 | 1,104 | 18.6% |
| $50,000 to $74,999 | 944 | 15.9% |
| $75,000 to $99,999 | 629 | 10.6% |
| $100,000 to $149,999 | 967 | 16.3% |
| $150,000 to $199,999 | 320 | 5.4% |
| $200,000+ | 237 | 4.0% |
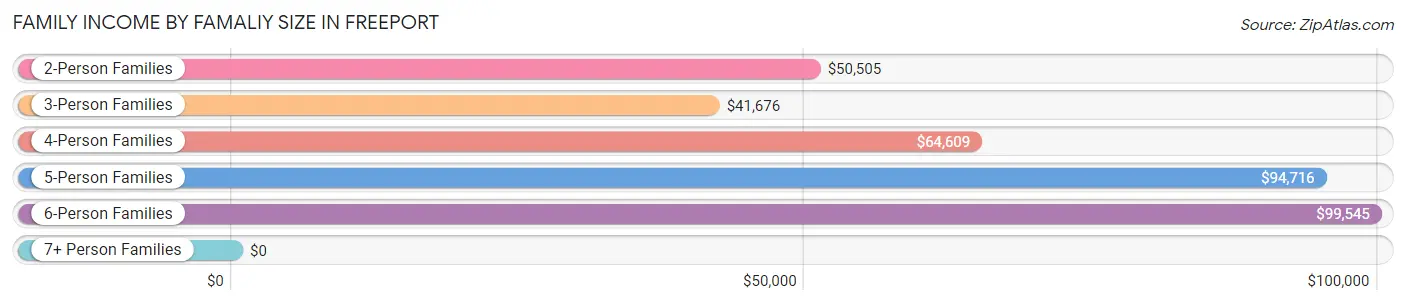
Family Income by Famaliy Size in Freeport
6-person families (154 | 2.6%) account for the highest median family income in Freeport with $99,545 per family, while 2-person families (3,293 | 55.5%) have the highest median income of $25,252 per family member.
| Income Bracket | # Families | Median Income |
| 2-Person Families | 3,293 (55.5%) | $50,505 |
| 3-Person Families | 1,299 (21.9%) | $41,676 |
| 4-Person Families | 868 (14.6%) | $64,609 |
| 5-Person Families | 311 (5.2%) | $94,716 |
| 6-Person Families | 154 (2.6%) | $99,545 |
| 7+ Person Families | 9 (0.2%) | $0 |
| Total | 5,934 (100.0%) | $53,873 |
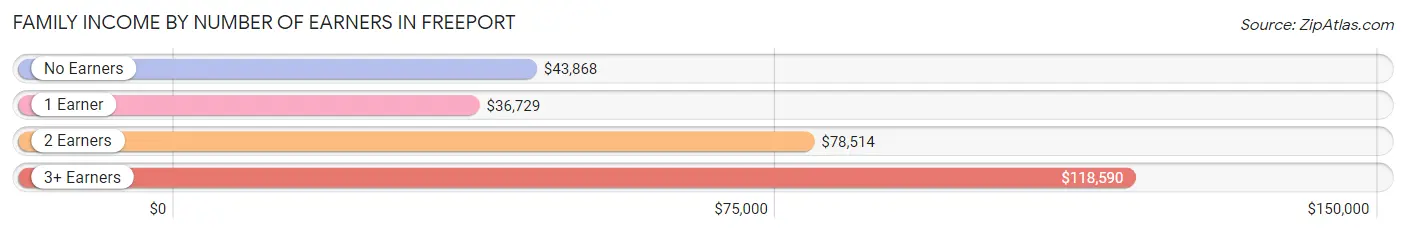
Family Income by Number of Earners in Freeport
The median family income in Freeport is $53,873, with families comprising 3+ earners (428) having the highest median family income of $118,590, while families with 1 earner (2,127) have the lowest median family income of $36,729, accounting for 7.2% and 35.8% of families, respectively.
| Number of Earners | # Families | Median Income |
| No Earners | 1,231 (20.7%) | $43,868 |
| 1 Earner | 2,127 (35.8%) | $36,729 |
| 2 Earners | 2,148 (36.2%) | $78,514 |
| 3+ Earners | 428 (7.2%) | $118,590 |
| Total | 5,934 (100.0%) | $53,873 |
Household Income in Freeport
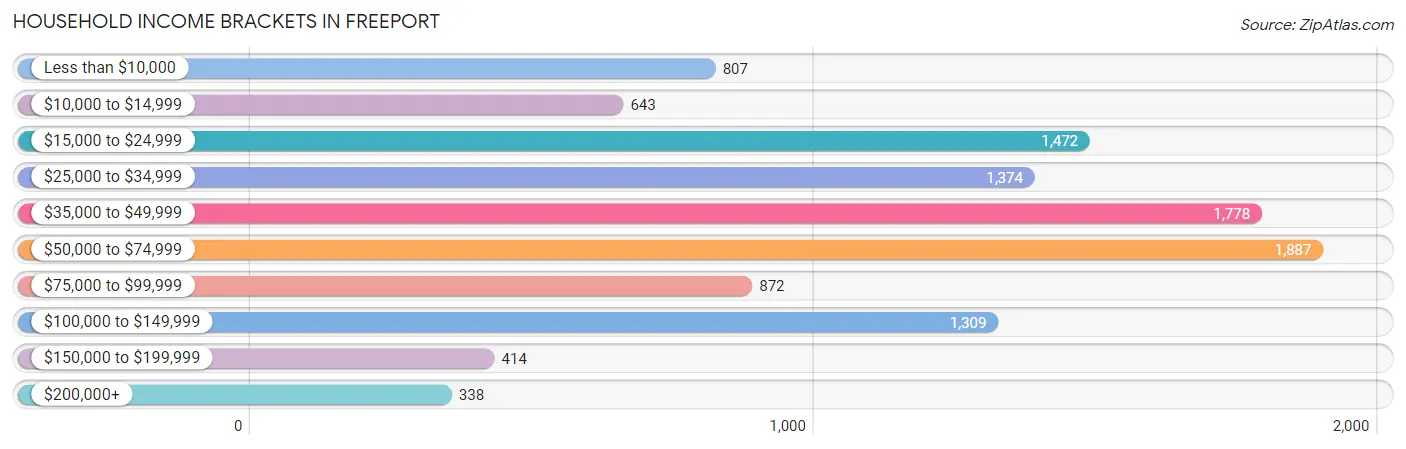
Household Income Brackets in Freeport
With 1,887 households falling in the category, the $50,000 to $74,999 income range is the most frequent in Freeport, accounting for 17.3% of all households. In contrast, only 338 households (3.1%) fall into the $200,000+ income bracket, making it the least populous group.
| Income Bracket | # Households | % Households |
| Less than $10,000 | 807 | 7.4% |
| $10,000 to $14,999 | 643 | 5.9% |
| $15,000 to $24,999 | 1,472 | 13.5% |
| $25,000 to $34,999 | 1,374 | 12.6% |
| $35,000 to $49,999 | 1,778 | 16.3% |
| $50,000 to $74,999 | 1,887 | 17.3% |
| $75,000 to $99,999 | 872 | 8.0% |
| $100,000 to $149,999 | 1,309 | 12.0% |
| $150,000 to $199,999 | 414 | 3.8% |
| $200,000+ | 338 | 3.1% |
Household Income by Householder Age in Freeport
The median household income in Freeport is $44,658, with the highest median household income of $61,042 found in the 25 to 44 years age bracket for the primary householder. A total of 2,744 households (25.2%) fall into this category. Meanwhile, the 15 to 24 years age bracket for the primary householder has the lowest median household income of $28,713, with 949 households (8.7%) in this group.
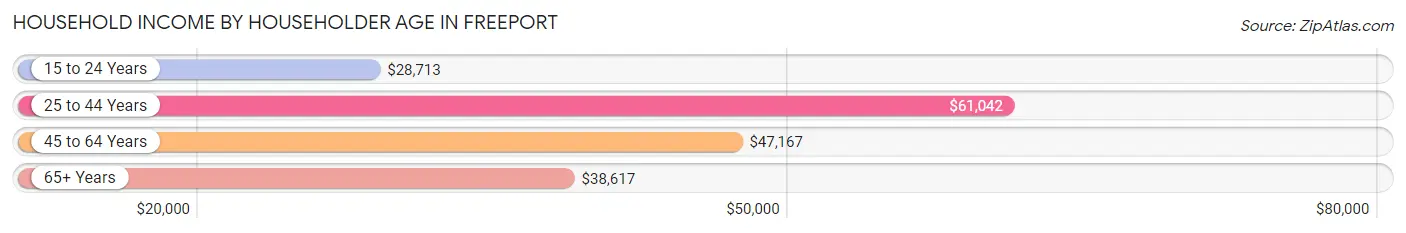
| Income Bracket | # Households | Median Income |
| 15 to 24 Years | 949 (8.7%) | $28,713 |
| 25 to 44 Years | 2,744 (25.2%) | $61,042 |
| 45 to 64 Years | 3,704 (34.0%) | $47,167 |
| 65+ Years | 3,508 (32.2%) | $38,617 |
| Total | 10,905 (100.0%) | $44,658 |
Poverty in Freeport
Income Below Poverty by Sex and Age in Freeport
With 18.1% poverty level for males and 18.9% for females among the residents of Freeport, under 5 year old males and 15 year old females are the most vulnerable to poverty, with 382 males (55.0%) and 37 females (39.8%) in their respective age groups living below the poverty level.
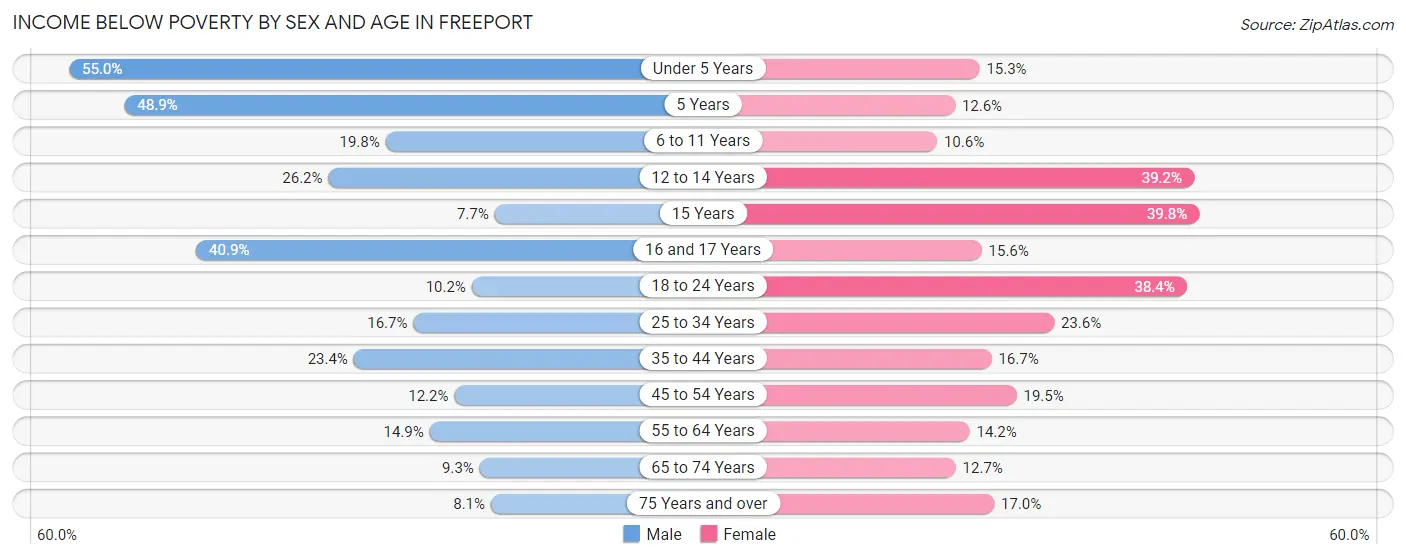
| Age Bracket | Male | Female |
| Under 5 Years | 382 (55.0%) | 126 (15.3%) |
| 5 Years | 87 (48.9%) | 16 (12.6%) |
| 6 to 11 Years | 177 (19.8%) | 104 (10.6%) |
| 12 to 14 Years | 78 (26.2%) | 118 (39.2%) |
| 15 Years | 16 (7.7%) | 37 (39.8%) |
| 16 and 17 Years | 83 (40.9%) | 19 (15.6%) |
| 18 to 24 Years | 124 (10.2%) | 387 (38.4%) |
| 25 to 34 Years | 206 (16.7%) | 345 (23.6%) |
| 35 to 44 Years | 269 (23.4%) | 203 (16.7%) |
| 45 to 54 Years | 153 (12.1%) | 298 (19.5%) |
| 55 to 64 Years | 236 (14.9%) | 220 (14.2%) |
| 65 to 74 Years | 114 (9.3%) | 207 (12.7%) |
| 75 Years and over | 68 (8.1%) | 233 (17.0%) |
| Total | 1,993 (18.1%) | 2,313 (18.9%) |
Income Above Poverty by Sex and Age in Freeport
According to the poverty statistics in Freeport, males aged 15 years and females aged 6 to 11 years are the age groups that are most secure financially, with 92.3% of males and 89.4% of females in these age groups living above the poverty line.
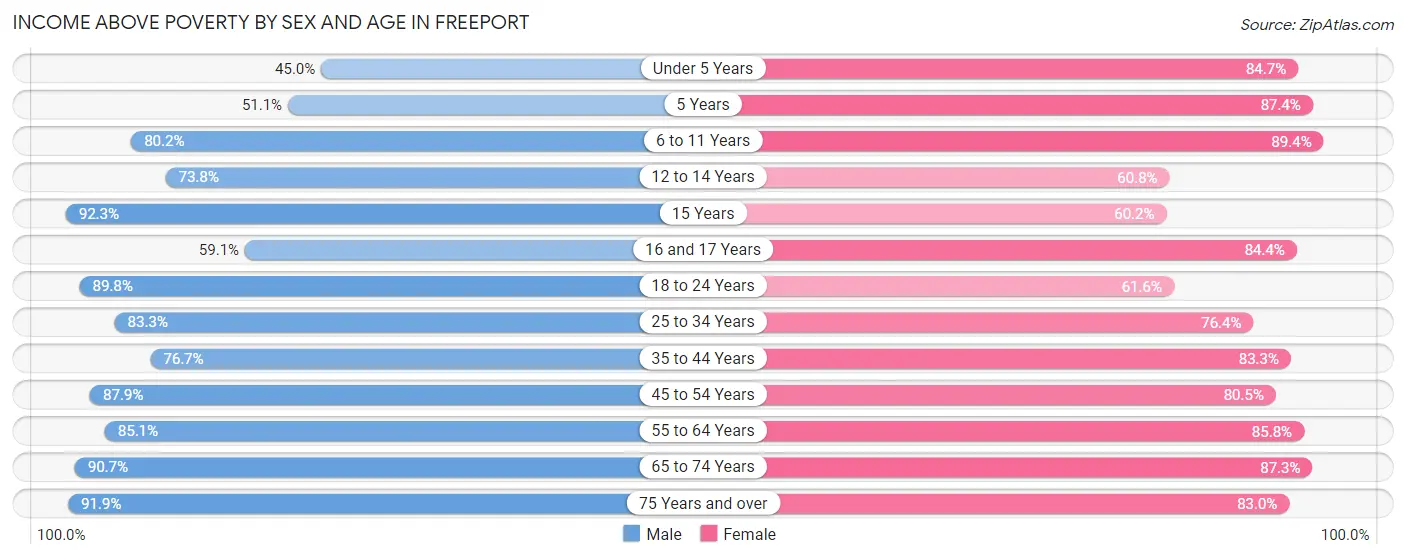
| Age Bracket | Male | Female |
| Under 5 Years | 312 (45.0%) | 696 (84.7%) |
| 5 Years | 91 (51.1%) | 111 (87.4%) |
| 6 to 11 Years | 717 (80.2%) | 877 (89.4%) |
| 12 to 14 Years | 220 (73.8%) | 183 (60.8%) |
| 15 Years | 193 (92.3%) | 56 (60.2%) |
| 16 and 17 Years | 120 (59.1%) | 103 (84.4%) |
| 18 to 24 Years | 1,091 (89.8%) | 621 (61.6%) |
| 25 to 34 Years | 1,027 (83.3%) | 1,115 (76.4%) |
| 35 to 44 Years | 883 (76.6%) | 1,015 (83.3%) |
| 45 to 54 Years | 1,106 (87.8%) | 1,233 (80.5%) |
| 55 to 64 Years | 1,348 (85.1%) | 1,326 (85.8%) |
| 65 to 74 Years | 1,109 (90.7%) | 1,426 (87.3%) |
| 75 Years and over | 775 (91.9%) | 1,141 (83.0%) |
| Total | 8,992 (81.9%) | 9,903 (81.1%) |
Income Below Poverty Among Married-Couple Families in Freeport
The poverty statistics for married-couple families in Freeport show that 7.9% or 306 of the total 3,893 families live below the poverty line. Families with 1 or 2 children have the highest poverty rate of 15.0%, comprising of 196 families. On the other hand, families with no children have the lowest poverty rate of 3.7%, which includes 91 families.
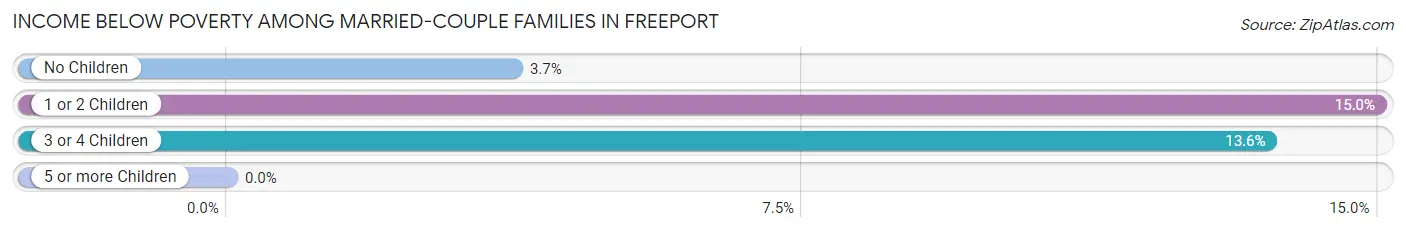
| Children | Above Poverty | Below Poverty |
| No Children | 2,355 (96.3%) | 91 (3.7%) |
| 1 or 2 Children | 1,111 (85.0%) | 196 (15.0%) |
| 3 or 4 Children | 121 (86.4%) | 19 (13.6%) |
| 5 or more Children | 0 (0.0%) | 0 (0.0%) |
| Total | 3,587 (92.1%) | 306 (7.9%) |
Income Below Poverty Among Single-Parent Households in Freeport
According to the poverty data in Freeport, 18.1% or 105 single-father households and 35.3% or 515 single-mother households are living below the poverty line. Among single-father households, those with 3 or 4 children have the highest poverty rate, with 4 households (100.0%) experiencing poverty. Likewise, among single-mother households, those with 3 or 4 children have the highest poverty rate, with 88 households (59.9%) falling below the poverty line.
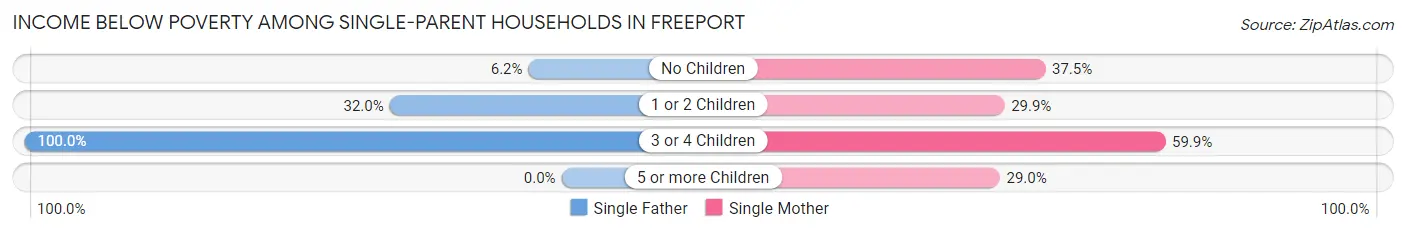
| Children | Single Father | Single Mother |
| No Children | 20 (6.2%) | 171 (37.5%) |
| 1 or 2 Children | 81 (32.0%) | 247 (29.9%) |
| 3 or 4 Children | 4 (100.0%) | 88 (59.9%) |
| 5 or more Children | 0 (0.0%) | 9 (29.0%) |
| Total | 105 (18.1%) | 515 (35.3%) |
Income Below Poverty Among Married-Couple vs Single-Parent Households in Freeport
The poverty data for Freeport shows that 306 of the married-couple family households (7.9%) and 620 of the single-parent households (30.4%) are living below the poverty level. Within the married-couple family households, those with 1 or 2 children have the highest poverty rate, with 196 households (15.0%) falling below the poverty line. Among the single-parent households, those with 3 or 4 children have the highest poverty rate, with 92 household (60.9%) living below poverty.
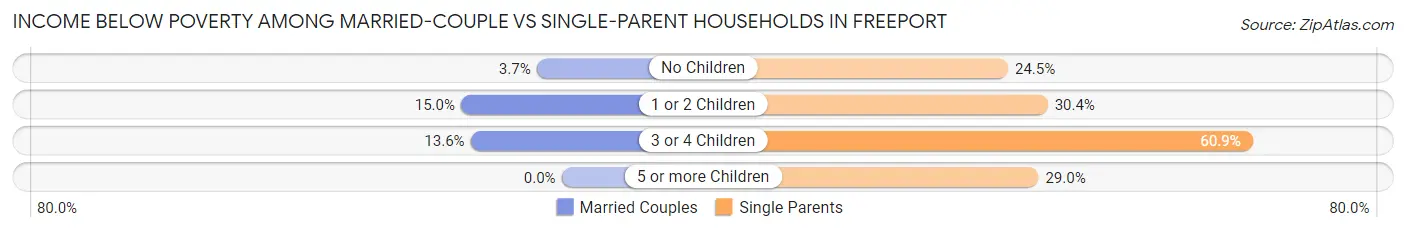
| Children | Married-Couple Families | Single-Parent Households |
| No Children | 91 (3.7%) | 191 (24.5%) |
| 1 or 2 Children | 196 (15.0%) | 328 (30.4%) |
| 3 or 4 Children | 19 (13.6%) | 92 (60.9%) |
| 5 or more Children | 0 (0.0%) | 9 (29.0%) |
| Total | 306 (7.9%) | 620 (30.4%) |
Race in Freeport
The most populous races in Freeport are White / Caucasian (17,554 | 73.5%), Black / African American (3,348 | 14.0%), and Two or more Races (2,320 | 9.7%).
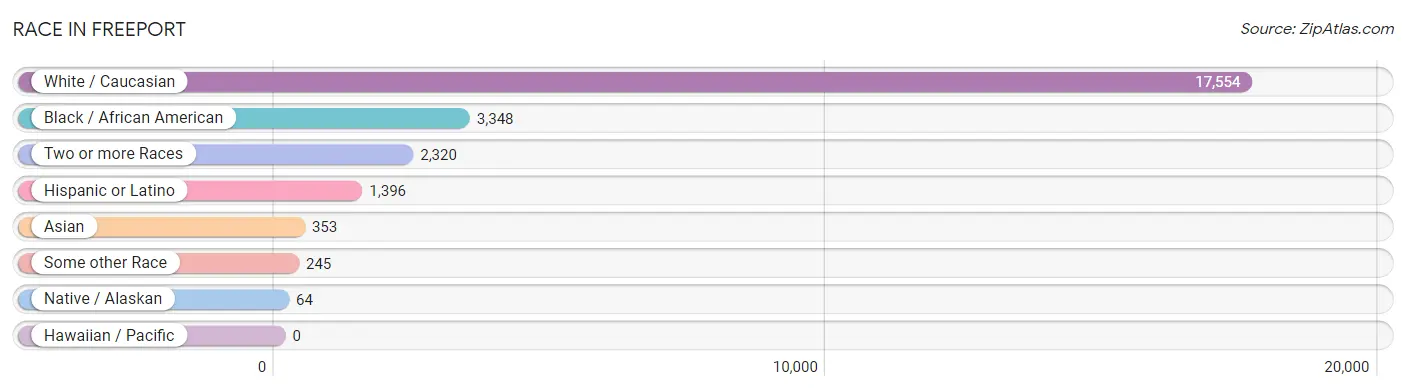
| Race | # Population | % Population |
| Asian | 353 | 1.5% |
| Black / African American | 3,348 | 14.0% |
| Hawaiian / Pacific | 0 | 0.0% |
| Hispanic or Latino | 1,396 | 5.8% |
| Native / Alaskan | 64 | 0.3% |
| White / Caucasian | 17,554 | 73.5% |
| Two or more Races | 2,320 | 9.7% |
| Some other Race | 245 | 1.0% |
| Total | 23,884 | 100.0% |
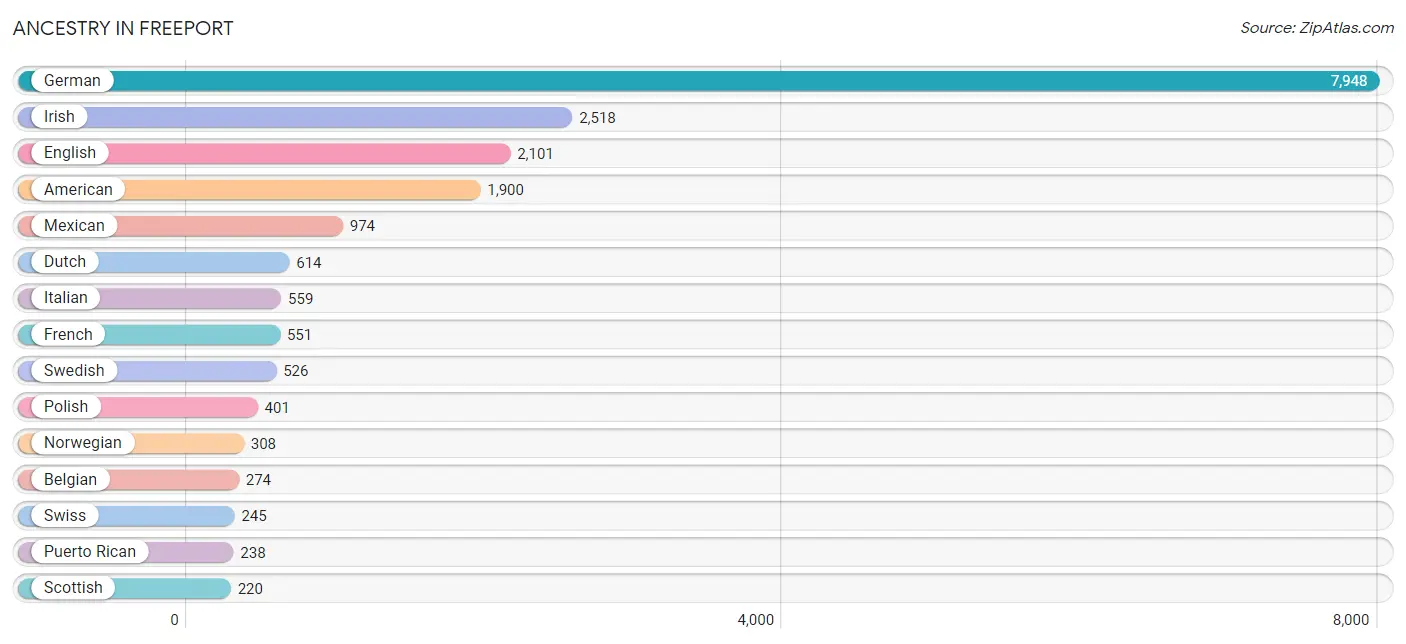
Ancestry in Freeport
The most populous ancestries reported in Freeport are German (7,948 | 33.3%), Irish (2,518 | 10.5%), English (2,101 | 8.8%), American (1,900 | 8.0%), and Mexican (974 | 4.1%), together accounting for 64.7% of all Freeport residents.
| Ancestry | # Population | % Population |
| African | 211 | 0.9% |
| American | 1,900 | 8.0% |
| Arab | 48 | 0.2% |
| Austrian | 9 | 0.0% |
| Belgian | 274 | 1.1% |
| Bhutanese | 32 | 0.1% |
| British | 140 | 0.6% |
| Canadian | 12 | 0.1% |
| Central American Indian | 4 | 0.0% |
| Cherokee | 20 | 0.1% |
| Colombian | 37 | 0.2% |
| Croatian | 15 | 0.1% |
| Cuban | 21 | 0.1% |
| Czech | 141 | 0.6% |
| Czechoslovakian | 10 | 0.0% |
| Danish | 109 | 0.5% |
| Dutch | 614 | 2.6% |
| Eastern European | 8 | 0.0% |
| Ecuadorian | 21 | 0.1% |
| English | 2,101 | 8.8% |
| Ethiopian | 8 | 0.0% |
| European | 87 | 0.4% |
| Finnish | 29 | 0.1% |
| French | 551 | 2.3% |
| French Canadian | 86 | 0.4% |
| German | 7,948 | 33.3% |
| Greek | 39 | 0.2% |
| Haitian | 1 | 0.0% |
| Hungarian | 31 | 0.1% |
| Indian (Asian) | 163 | 0.7% |
| Iraqi | 4 | 0.0% |
| Irish | 2,518 | 10.5% |
| Italian | 559 | 2.3% |
| Korean | 105 | 0.4% |
| Lithuanian | 98 | 0.4% |
| Mexican | 974 | 4.1% |
| Mexican American Indian | 50 | 0.2% |
| Norwegian | 308 | 1.3% |
| Pennsylvania German | 84 | 0.4% |
| Peruvian | 89 | 0.4% |
| Polish | 401 | 1.7% |
| Puerto Rican | 238 | 1.0% |
| Romanian | 11 | 0.1% |
| Russian | 30 | 0.1% |
| Scandinavian | 35 | 0.2% |
| Scotch-Irish | 114 | 0.5% |
| Scottish | 220 | 0.9% |
| Sioux | 14 | 0.1% |
| South American | 147 | 0.6% |
| Spaniard | 16 | 0.1% |
| Sri Lankan | 12 | 0.1% |
| Subsaharan African | 219 | 0.9% |
| Swedish | 526 | 2.2% |
| Swiss | 245 | 1.0% |
| Thai | 91 | 0.4% |
| Welsh | 163 | 0.7% | View All 56 Rows |
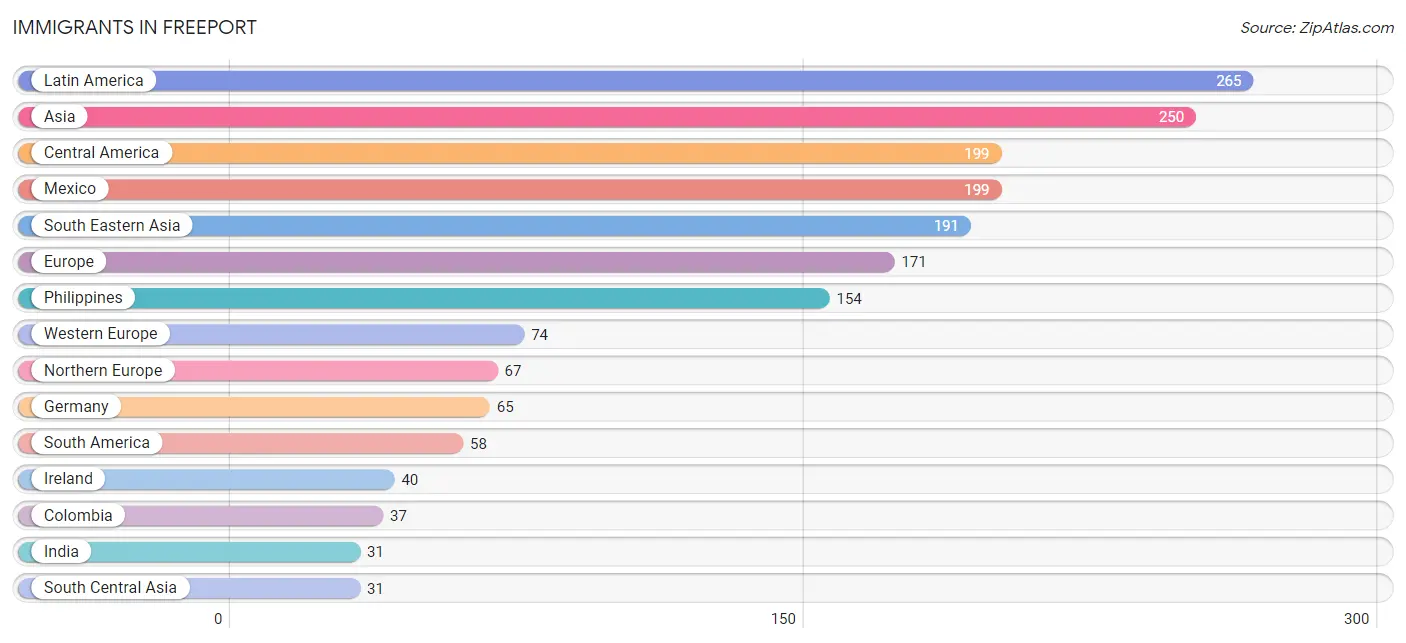
Immigrants in Freeport
The most numerous immigrant groups reported in Freeport came from Latin America (265 | 1.1%), Asia (250 | 1.1%), Central America (199 | 0.8%), Mexico (199 | 0.8%), and South Eastern Asia (191 | 0.8%), together accounting for 4.6% of all Freeport residents.
| Immigration Origin | # Population | % Population |
| Africa | 25 | 0.1% |
| Asia | 250 | 1.1% |
| Canada | 25 | 0.1% |
| Caribbean | 8 | 0.0% |
| Central America | 199 | 0.8% |
| Colombia | 37 | 0.2% |
| Cuba | 8 | 0.0% |
| Eastern Africa | 25 | 0.1% |
| Eastern Asia | 24 | 0.1% |
| Eastern Europe | 17 | 0.1% |
| Ecuador | 21 | 0.1% |
| England | 17 | 0.1% |
| Ethiopia | 8 | 0.0% |
| Europe | 171 | 0.7% |
| France | 9 | 0.0% |
| Germany | 65 | 0.3% |
| Greece | 13 | 0.1% |
| India | 31 | 0.1% |
| Iraq | 4 | 0.0% |
| Ireland | 40 | 0.2% |
| Japan | 24 | 0.1% |
| Kenya | 17 | 0.1% |
| Laos | 25 | 0.1% |
| Latin America | 265 | 1.1% |
| Mexico | 199 | 0.8% |
| Northern Europe | 67 | 0.3% |
| Philippines | 154 | 0.6% |
| Poland | 17 | 0.1% |
| South America | 58 | 0.2% |
| South Central Asia | 31 | 0.1% |
| South Eastern Asia | 191 | 0.8% |
| Southern Europe | 13 | 0.1% |
| Vietnam | 12 | 0.1% |
| Western Asia | 4 | 0.0% |
| Western Europe | 74 | 0.3% | View All 35 Rows |
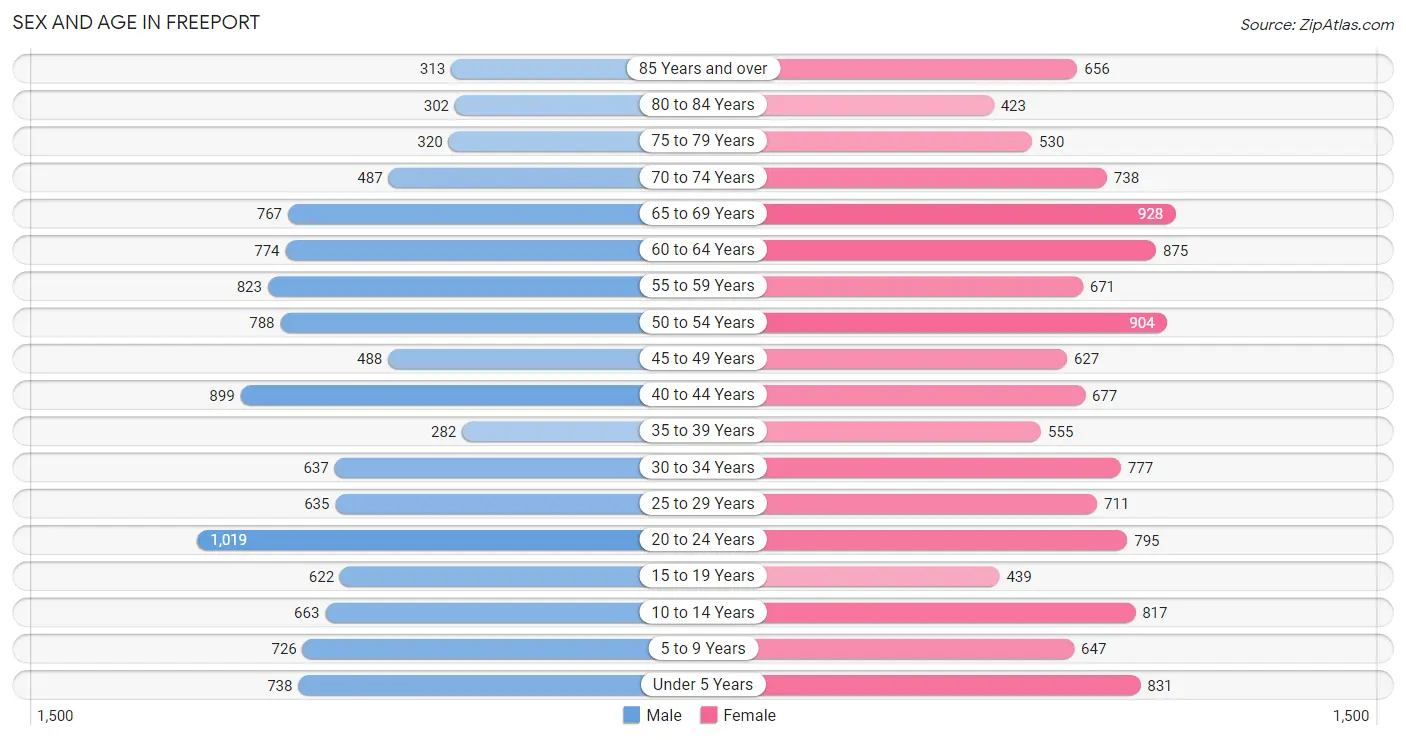
Sex and Age in Freeport
Sex and Age in Freeport
The most populous age groups in Freeport are 20 to 24 Years (1,019 | 9.0%) for men and 65 to 69 Years (928 | 7.4%) for women.
| Age Bracket | Male | Female |
| Under 5 Years | 738 (6.5%) | 831 (6.6%) |
| 5 to 9 Years | 726 (6.4%) | 647 (5.1%) |
| 10 to 14 Years | 663 (5.9%) | 817 (6.5%) |
| 15 to 19 Years | 622 (5.5%) | 439 (3.5%) |
| 20 to 24 Years | 1,019 (9.0%) | 795 (6.3%) |
| 25 to 29 Years | 635 (5.6%) | 711 (5.6%) |
| 30 to 34 Years | 637 (5.7%) | 777 (6.2%) |
| 35 to 39 Years | 282 (2.5%) | 555 (4.4%) |
| 40 to 44 Years | 899 (8.0%) | 677 (5.4%) |
| 45 to 49 Years | 488 (4.3%) | 627 (5.0%) |
| 50 to 54 Years | 788 (7.0%) | 904 (7.2%) |
| 55 to 59 Years | 823 (7.3%) | 671 (5.3%) |
| 60 to 64 Years | 774 (6.9%) | 875 (6.9%) |
| 65 to 69 Years | 767 (6.8%) | 928 (7.4%) |
| 70 to 74 Years | 487 (4.3%) | 738 (5.9%) |
| 75 to 79 Years | 320 (2.8%) | 530 (4.2%) |
| 80 to 84 Years | 302 (2.7%) | 423 (3.4%) |
| 85 Years and over | 313 (2.8%) | 656 (5.2%) |
| Total | 11,283 (100.0%) | 12,601 (100.0%) |
Families and Households in Freeport
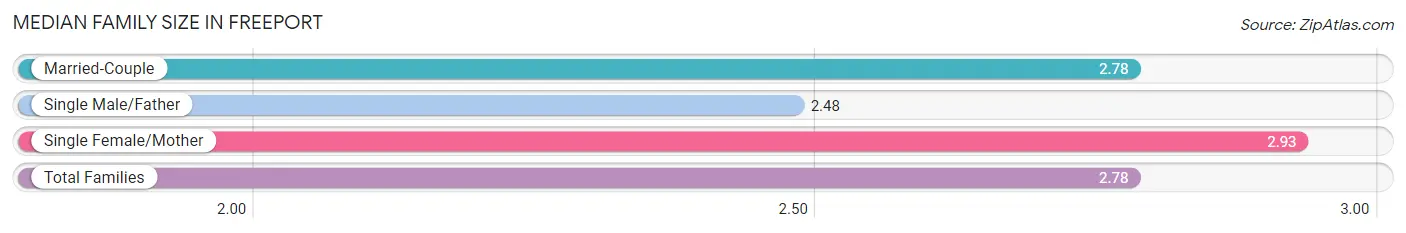
Median Family Size in Freeport
The median family size in Freeport is 2.78 persons per family, with single female/mother families (1,460 | 24.6%) accounting for the largest median family size of 2.93 persons per family. On the other hand, single male/father families (581 | 9.8%) represent the smallest median family size with 2.48 persons per family.
| Family Type | # Families | Family Size |
| Married-Couple | 3,893 (65.6%) | 2.78 |
| Single Male/Father | 581 (9.8%) | 2.48 |
| Single Female/Mother | 1,460 (24.6%) | 2.93 |
| Total Families | 5,934 (100.0%) | 2.78 |
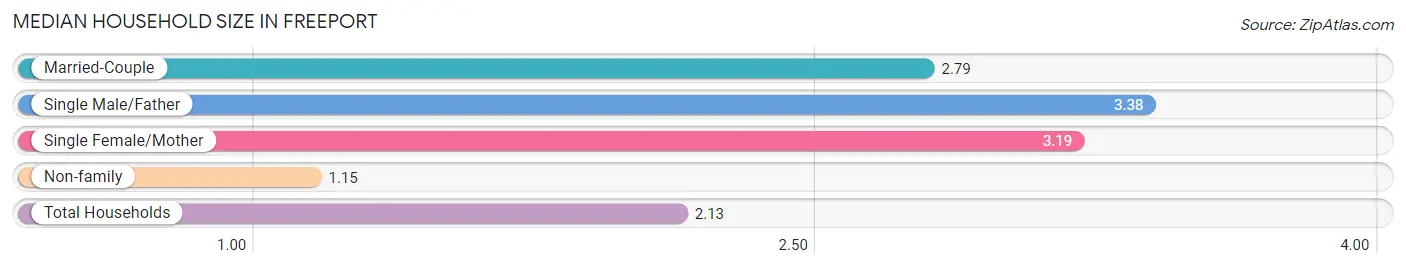
Median Household Size in Freeport
The median household size in Freeport is 2.13 persons per household, with single male/father households (581 | 5.3%) accounting for the largest median household size of 3.38 persons per household. non-family households (4,971 | 45.6%) represent the smallest median household size with 1.15 persons per household.
| Household Type | # Households | Household Size |
| Married-Couple | 3,893 (35.7%) | 2.79 |
| Single Male/Father | 581 (5.3%) | 3.38 |
| Single Female/Mother | 1,460 (13.4%) | 3.19 |
| Non-family | 4,971 (45.6%) | 1.15 |
| Total Households | 10,905 (100.0%) | 2.13 |
Household Size by Marriage Status in Freeport
Out of a total of 10,905 households in Freeport, 5,934 (54.4%) are family households, while 4,971 (45.6%) are nonfamily households. The most numerous type of family households are 2-person households, comprising 2,890, and the most common type of nonfamily households are 1-person households, comprising 4,235.
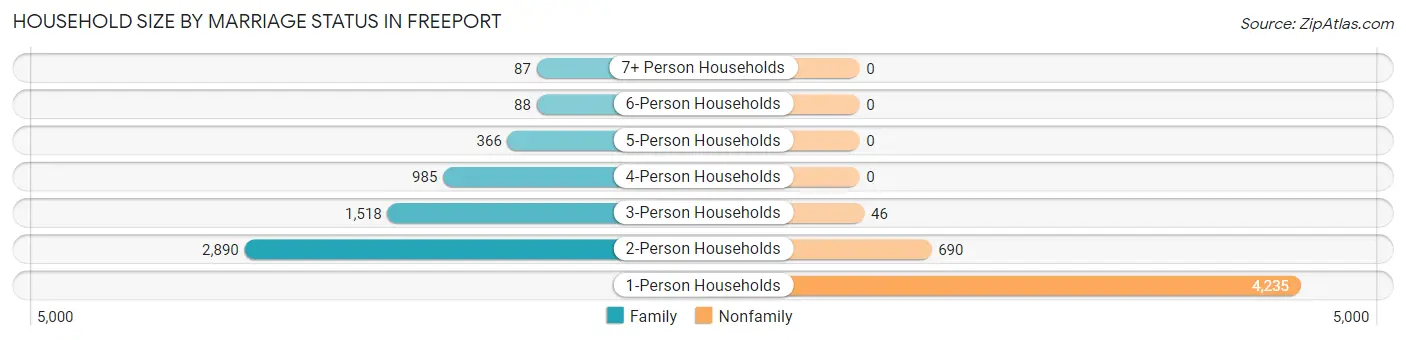
| Household Size | Family Households | Nonfamily Households |
| 1-Person Households | - | 4,235 (38.8%) |
| 2-Person Households | 2,890 (26.5%) | 690 (6.3%) |
| 3-Person Households | 1,518 (13.9%) | 46 (0.4%) |
| 4-Person Households | 985 (9.0%) | 0 (0.0%) |
| 5-Person Households | 366 (3.4%) | 0 (0.0%) |
| 6-Person Households | 88 (0.8%) | 0 (0.0%) |
| 7+ Person Households | 87 (0.8%) | 0 (0.0%) |
| Total | 5,934 (54.4%) | 4,971 (45.6%) |
Female Fertility in Freeport
Fertility by Age in Freeport
Average fertility rate in Freeport is 92.0 births per 1,000 women. Women in the age bracket of 20 to 34 years have the highest fertility rate with 150.0 births per 1,000 women. Women in the age bracket of 20 to 34 years acount for 79.4% of all women with births.
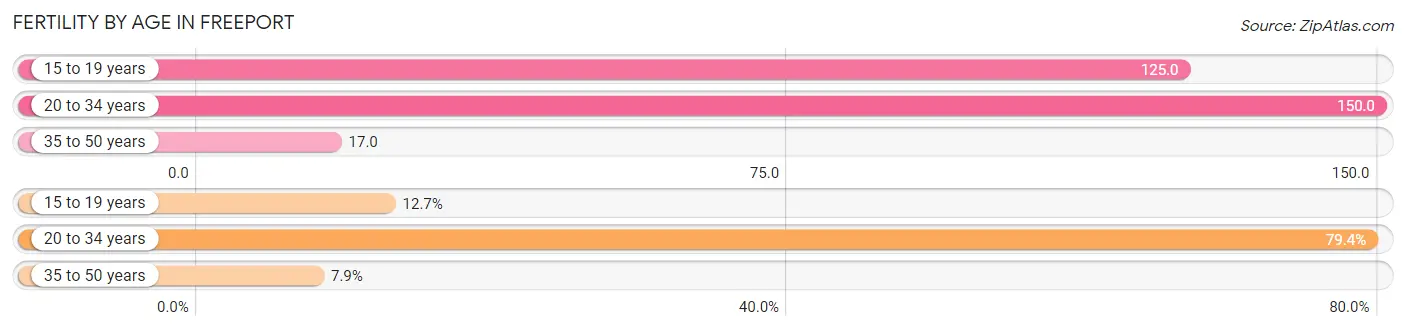
| Age Bracket | Women with Births | Births / 1,000 Women |
| 15 to 19 years | 55 (12.7%) | 125.0 |
| 20 to 34 years | 343 (79.4%) | 150.0 |
| 35 to 50 years | 34 (7.9%) | 17.0 |
| Total | 432 (100.0%) | 92.0 |
Fertility by Age by Marriage Status in Freeport
56.0% of women with births (432) in Freeport are married. The highest percentage of unmarried women with births falls into 15 to 19 years age bracket with 100.0% of them unmarried at the time of birth, while the lowest percentage of unmarried women with births belong to 35 to 50 years age bracket with 0.0% of them unmarried.
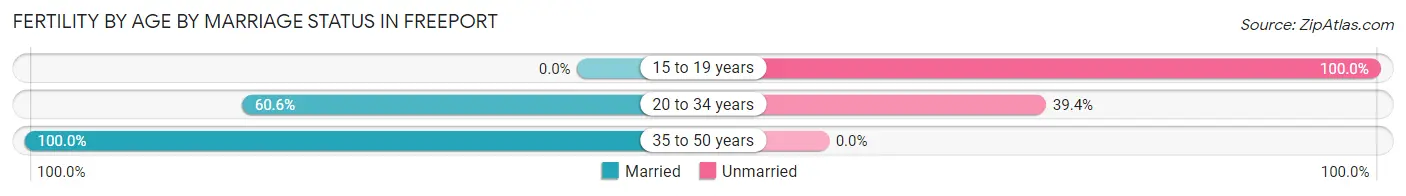
| Age Bracket | Married | Unmarried |
| 15 to 19 years | 0 (0.0%) | 55 (100.0%) |
| 20 to 34 years | 208 (60.6%) | 135 (39.4%) |
| 35 to 50 years | 34 (100.0%) | 0 (0.0%) |
| Total | 242 (56.0%) | 190 (44.0%) |
Fertility by Education in Freeport
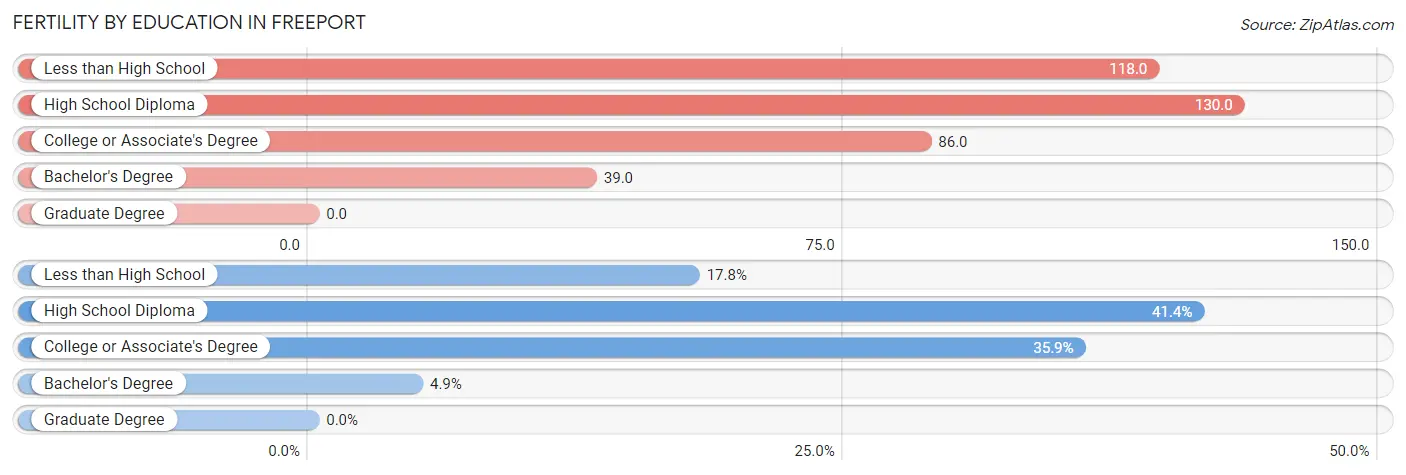
| Educational Attainment | Women with Births | Births / 1,000 Women |
| Less than High School | 77 (17.8%) | 118.0 |
| High School Diploma | 179 (41.4%) | 130.0 |
| College or Associate's Degree | 155 (35.9%) | 86.0 |
| Bachelor's Degree | 21 (4.9%) | 39.0 |
| Graduate Degree | 0 (0.0%) | 0.0 |
| Total | 432 (100.0%) | 92.0 |
Fertility by Education by Marriage Status in Freeport
44.0% of women with births in Freeport are unmarried. Women with the educational attainment of college or associate's degree are most likely to be married with 92.9% of them married at childbirth, while women with the educational attainment of bachelor's degree are least likely to be married with 100.0% of them unmarried at childbirth.
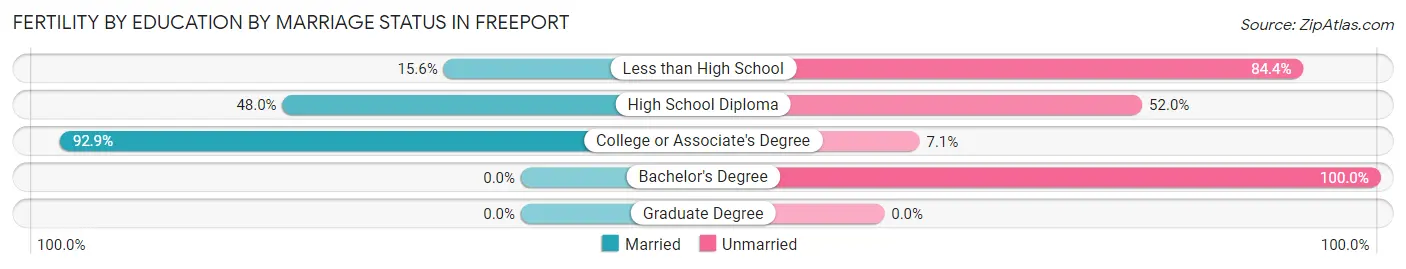
| Educational Attainment | Married | Unmarried |
| Less than High School | 12 (15.6%) | 65 (84.4%) |
| High School Diploma | 86 (48.0%) | 93 (52.0%) |
| College or Associate's Degree | 144 (92.9%) | 11 (7.1%) |
| Bachelor's Degree | 0 (0.0%) | 21 (100.0%) |
| Graduate Degree | 0 (0.0%) | 0 (0.0%) |
| Total | 242 (56.0%) | 190 (44.0%) |
Employment Characteristics in Freeport
Employment by Class of Employer in Freeport
Among the 10,151 employed individuals in Freeport, private company employees (7,042 | 69.4%), not-for-profit organizations (1,157 | 11.4%), and local government employees (814 | 8.0%) make up the most common classes of employment.
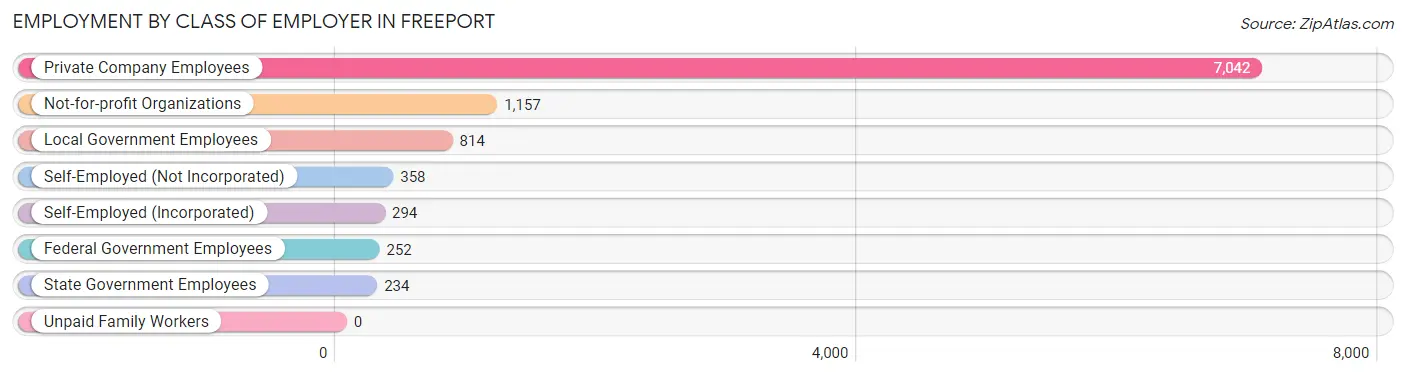
| Employer Class | # Employees | % Employees |
| Private Company Employees | 7,042 | 69.4% |
| Self-Employed (Incorporated) | 294 | 2.9% |
| Self-Employed (Not Incorporated) | 358 | 3.5% |
| Not-for-profit Organizations | 1,157 | 11.4% |
| Local Government Employees | 814 | 8.0% |
| State Government Employees | 234 | 2.3% |
| Federal Government Employees | 252 | 2.5% |
| Unpaid Family Workers | 0 | 0.0% |
| Total | 10,151 | 100.0% |
Employment Status by Age in Freeport
According to the labor force statistics for Freeport, out of the total population over 16 years of age (19,157), 57.6% or 11,034 individuals are in the labor force, with 6.5% or 717 of them unemployed. The age group with the highest labor force participation rate is 20 to 24 years, with 91.1% or 1,653 individuals in the labor force. Within the labor force, the 20 to 24 years age range has the highest percentage of unemployed individuals, with 18.3% or 302 of them being unemployed.
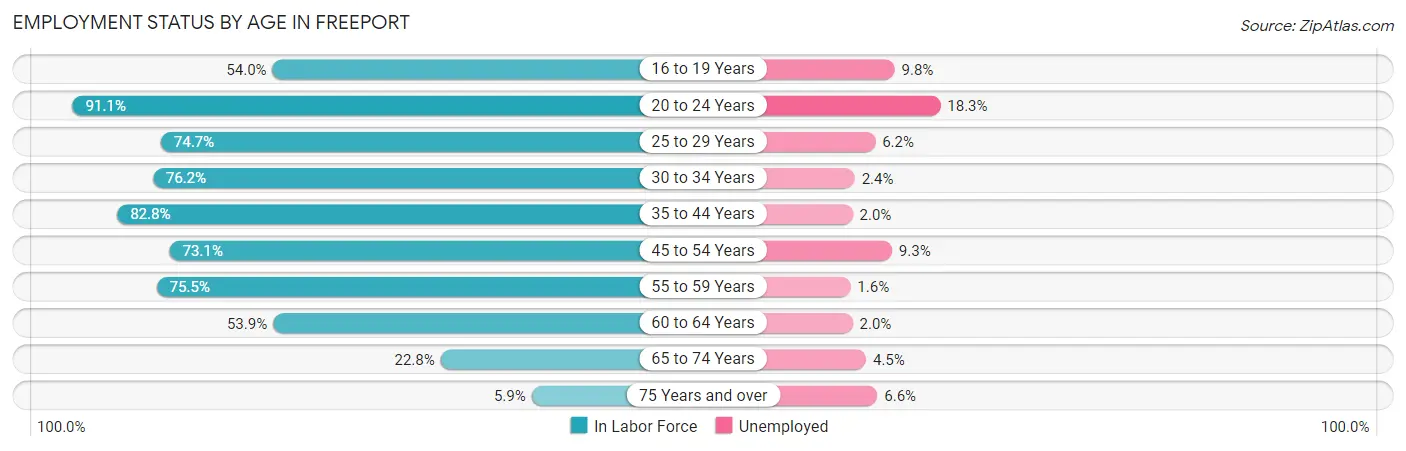
| Age Bracket | In Labor Force | Unemployed |
| 16 to 19 Years | 408 (54.0%) | 40 (9.8%) |
| 20 to 24 Years | 1,653 (91.1%) | 302 (18.3%) |
| 25 to 29 Years | 1,005 (74.7%) | 62 (6.2%) |
| 30 to 34 Years | 1,077 (76.2%) | 26 (2.4%) |
| 35 to 44 Years | 1,998 (82.8%) | 40 (2.0%) |
| 45 to 54 Years | 2,052 (73.1%) | 191 (9.3%) |
| 55 to 59 Years | 1,128 (75.5%) | 18 (1.6%) |
| 60 to 64 Years | 889 (53.9%) | 18 (2.0%) |
| 65 to 74 Years | 666 (22.8%) | 30 (4.5%) |
| 75 Years and over | 150 (5.9%) | 10 (6.6%) |
| Total | 11,034 (57.6%) | 717 (6.5%) |
Employment Status by Educational Attainment in Freeport
According to labor force statistics for Freeport, 73.3% of individuals (8,153) out of the total population between 25 and 64 years of age (11,123) are in the labor force, with 4.3% or 351 of them being unemployed. The group with the highest labor force participation rate are those with the educational attainment of bachelor's degree or higher, with 86.3% or 1,849 individuals in the labor force. Within the labor force, individuals with less than high school education have the highest percentage of unemployment, with 21.9% or 103 of them being unemployed.
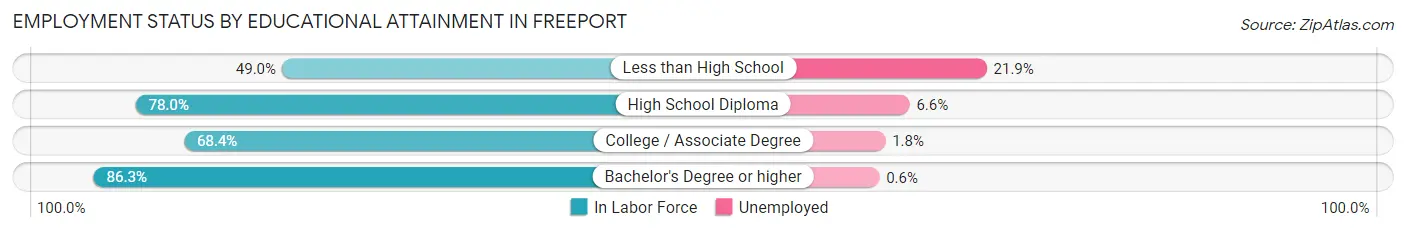
| Educational Attainment | In Labor Force | Unemployed |
| Less than High School | 470 (49.0%) | 210 (21.9%) |
| High School Diploma | 2,810 (78.0%) | 238 (6.6%) |
| College / Associate Degree | 3,022 (68.4%) | 80 (1.8%) |
| Bachelor's Degree or higher | 1,849 (86.3%) | 13 (0.6%) |
| Total | 8,153 (73.3%) | 478 (4.3%) |
Employment Occupations by Sex in Freeport
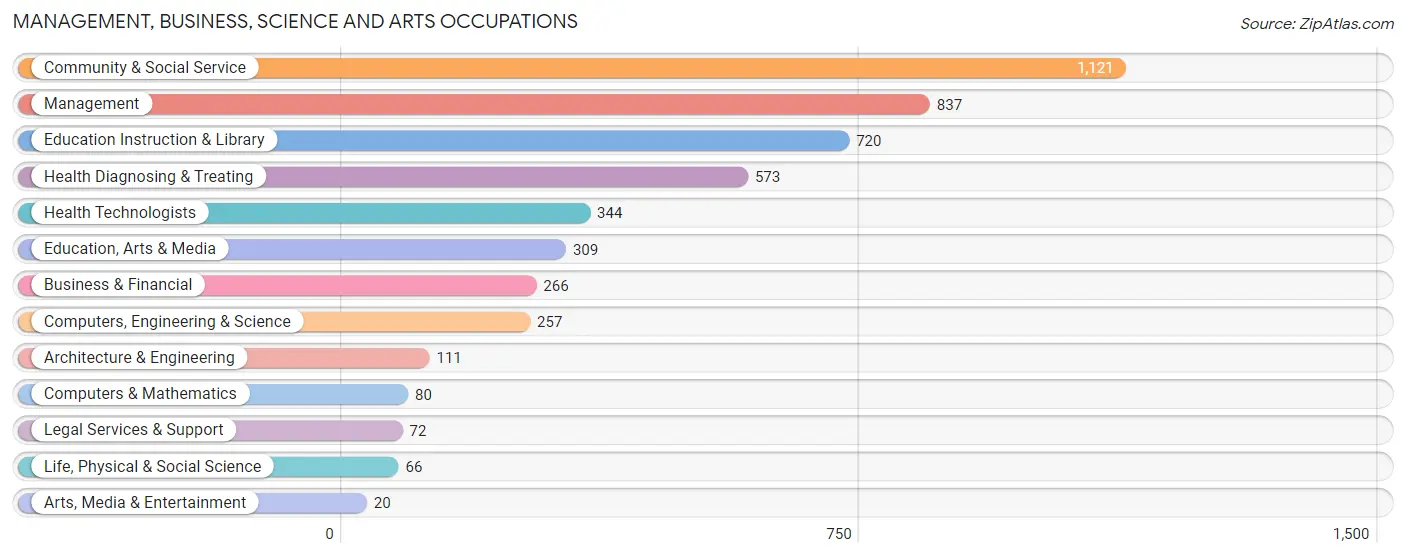
Management, Business, Science and Arts Occupations
The most common Management, Business, Science and Arts occupations in Freeport are Community & Social Service (1,121 | 11.0%), Management (837 | 8.2%), Education Instruction & Library (720 | 7.1%), Health Diagnosing & Treating (573 | 5.6%), and Health Technologists (344 | 3.4%).
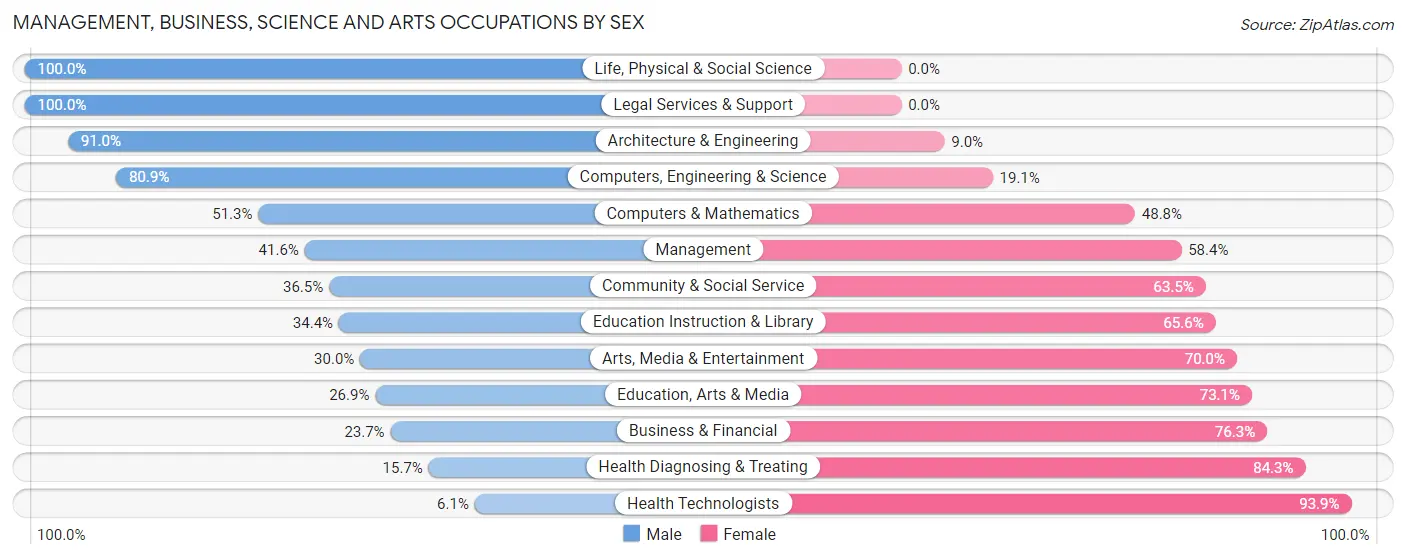
Management, Business, Science and Arts Occupations by Sex
Within the Management, Business, Science and Arts occupations in Freeport, the most male-oriented occupations are Life, Physical & Social Science (100.0%), Legal Services & Support (100.0%), and Architecture & Engineering (91.0%), while the most female-oriented occupations are Health Technologists (93.9%), Health Diagnosing & Treating (84.3%), and Business & Financial (76.3%).
| Occupation | Male | Female |
| Management | 348 (41.6%) | 489 (58.4%) |
| Business & Financial | 63 (23.7%) | 203 (76.3%) |
| Computers, Engineering & Science | 208 (80.9%) | 49 (19.1%) |
| Computers & Mathematics | 41 (51.2%) | 39 (48.7%) |
| Architecture & Engineering | 101 (91.0%) | 10 (9.0%) |
| Life, Physical & Social Science | 66 (100.0%) | 0 (0.0%) |
| Community & Social Service | 409 (36.5%) | 712 (63.5%) |
| Education, Arts & Media | 83 (26.9%) | 226 (73.1%) |
| Legal Services & Support | 72 (100.0%) | 0 (0.0%) |
| Education Instruction & Library | 248 (34.4%) | 472 (65.6%) |
| Arts, Media & Entertainment | 6 (30.0%) | 14 (70.0%) |
| Health Diagnosing & Treating | 90 (15.7%) | 483 (84.3%) |
| Health Technologists | 21 (6.1%) | 323 (93.9%) |
| Total (Category) | 1,118 (36.6%) | 1,936 (63.4%) |
| Total (Overall) | 4,817 (47.4%) | 5,337 (52.6%) |
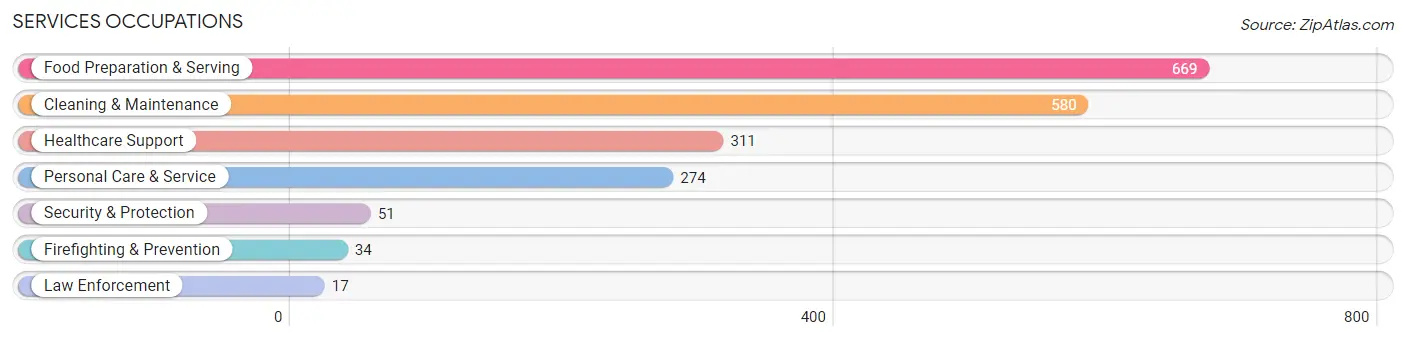
Services Occupations
The most common Services occupations in Freeport are Food Preparation & Serving (669 | 6.6%), Cleaning & Maintenance (580 | 5.7%), Healthcare Support (311 | 3.1%), Personal Care & Service (274 | 2.7%), and Security & Protection (51 | 0.5%).
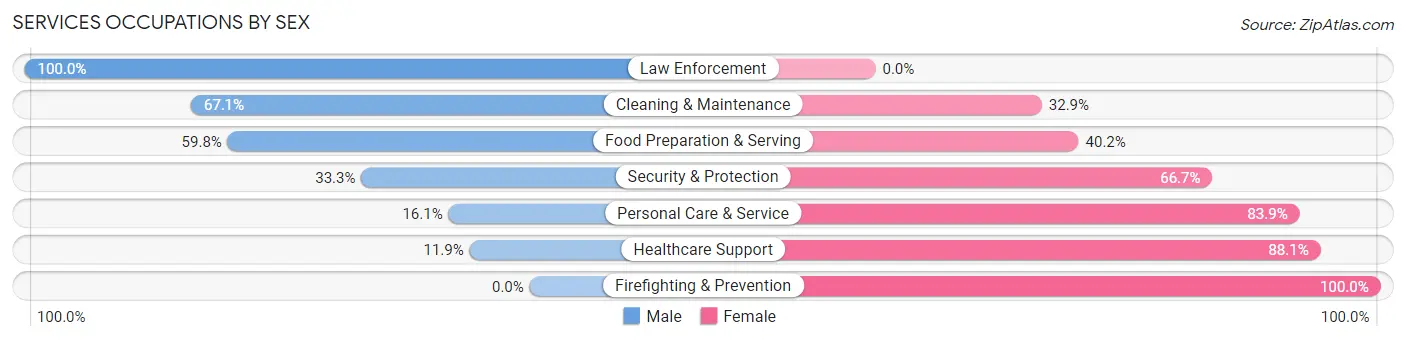
Services Occupations by Sex
Within the Services occupations in Freeport, the most male-oriented occupations are Law Enforcement (100.0%), Cleaning & Maintenance (67.1%), and Food Preparation & Serving (59.8%), while the most female-oriented occupations are Firefighting & Prevention (100.0%), Healthcare Support (88.1%), and Personal Care & Service (83.9%).
| Occupation | Male | Female |
| Healthcare Support | 37 (11.9%) | 274 (88.1%) |
| Security & Protection | 17 (33.3%) | 34 (66.7%) |
| Firefighting & Prevention | 0 (0.0%) | 34 (100.0%) |
| Law Enforcement | 17 (100.0%) | 0 (0.0%) |
| Food Preparation & Serving | 400 (59.8%) | 269 (40.2%) |
| Cleaning & Maintenance | 389 (67.1%) | 191 (32.9%) |
| Personal Care & Service | 44 (16.1%) | 230 (83.9%) |
| Total (Category) | 887 (47.1%) | 998 (52.9%) |
| Total (Overall) | 4,817 (47.4%) | 5,337 (52.6%) |
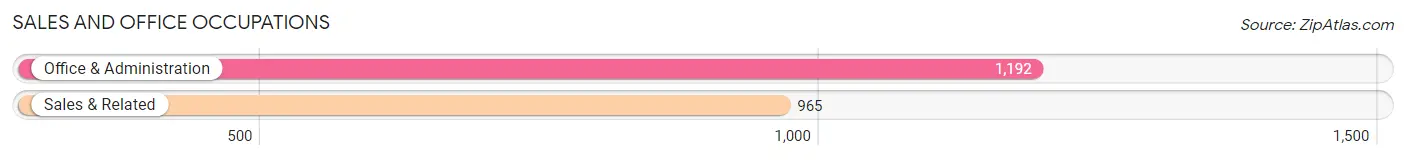
Sales and Office Occupations
The most common Sales and Office occupations in Freeport are Office & Administration (1,192 | 11.7%), and Sales & Related (965 | 9.5%).
Sales and Office Occupations by Sex
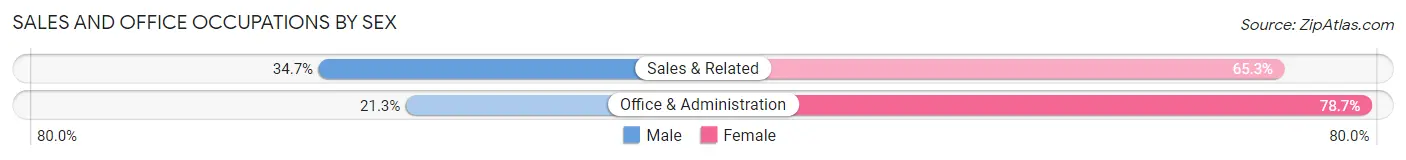
| Occupation | Male | Female |
| Sales & Related | 335 (34.7%) | 630 (65.3%) |
| Office & Administration | 254 (21.3%) | 938 (78.7%) |
| Total (Category) | 589 (27.3%) | 1,568 (72.7%) |
| Total (Overall) | 4,817 (47.4%) | 5,337 (52.6%) |
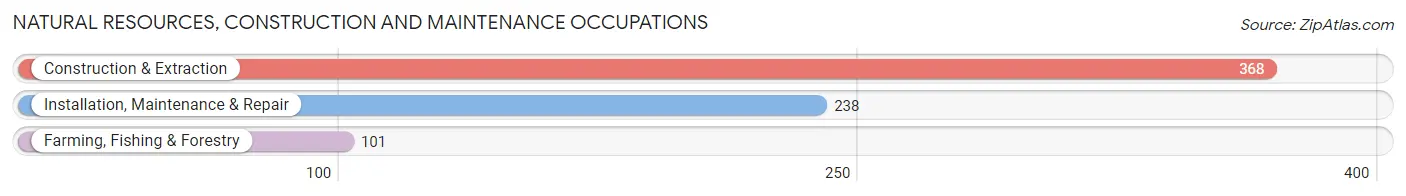
Natural Resources, Construction and Maintenance Occupations
The most common Natural Resources, Construction and Maintenance occupations in Freeport are Construction & Extraction (368 | 3.6%), Installation, Maintenance & Repair (238 | 2.3%), and Farming, Fishing & Forestry (101 | 1.0%).
Natural Resources, Construction and Maintenance Occupations by Sex
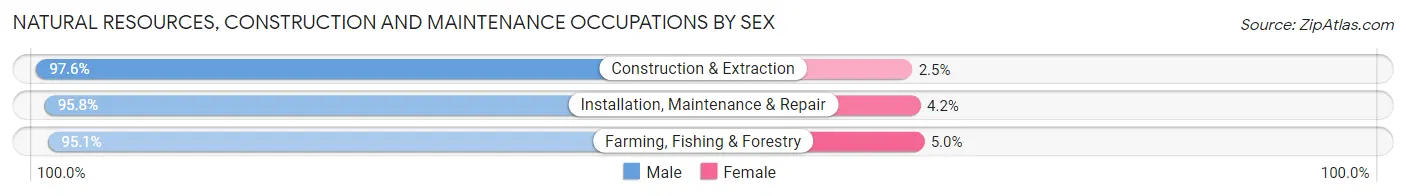
| Occupation | Male | Female |
| Farming, Fishing & Forestry | 96 (95.1%) | 5 (5.0%) |
| Construction & Extraction | 359 (97.6%) | 9 (2.5%) |
| Installation, Maintenance & Repair | 228 (95.8%) | 10 (4.2%) |
| Total (Category) | 683 (96.6%) | 24 (3.4%) |
| Total (Overall) | 4,817 (47.4%) | 5,337 (52.6%) |
Production, Transportation and Moving Occupations
The most common Production, Transportation and Moving occupations in Freeport are Production (1,664 | 16.4%), Material Moving (394 | 3.9%), and Transportation (293 | 2.9%).
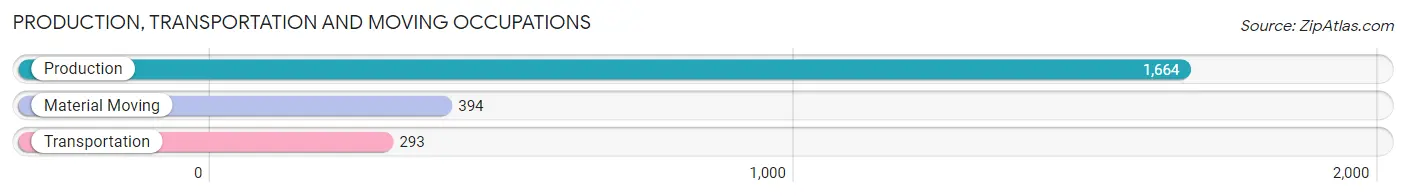
Production, Transportation and Moving Occupations by Sex
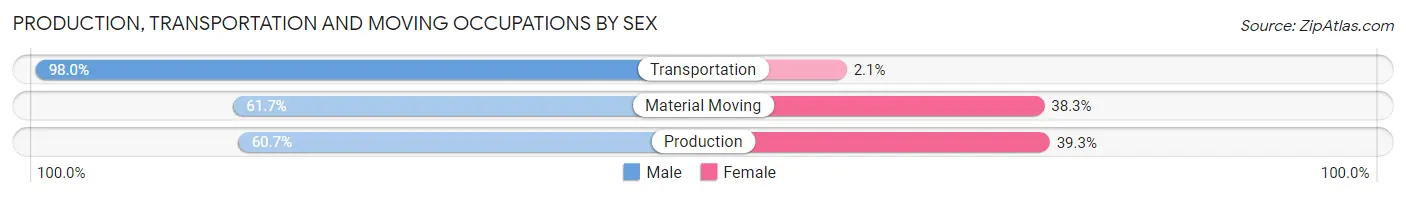
| Occupation | Male | Female |
| Production | 1,010 (60.7%) | 654 (39.3%) |
| Transportation | 287 (98.0%) | 6 (2.1%) |
| Material Moving | 243 (61.7%) | 151 (38.3%) |
| Total (Category) | 1,540 (65.5%) | 811 (34.5%) |
| Total (Overall) | 4,817 (47.4%) | 5,337 (52.6%) |
Employment Industries by Sex in Freeport
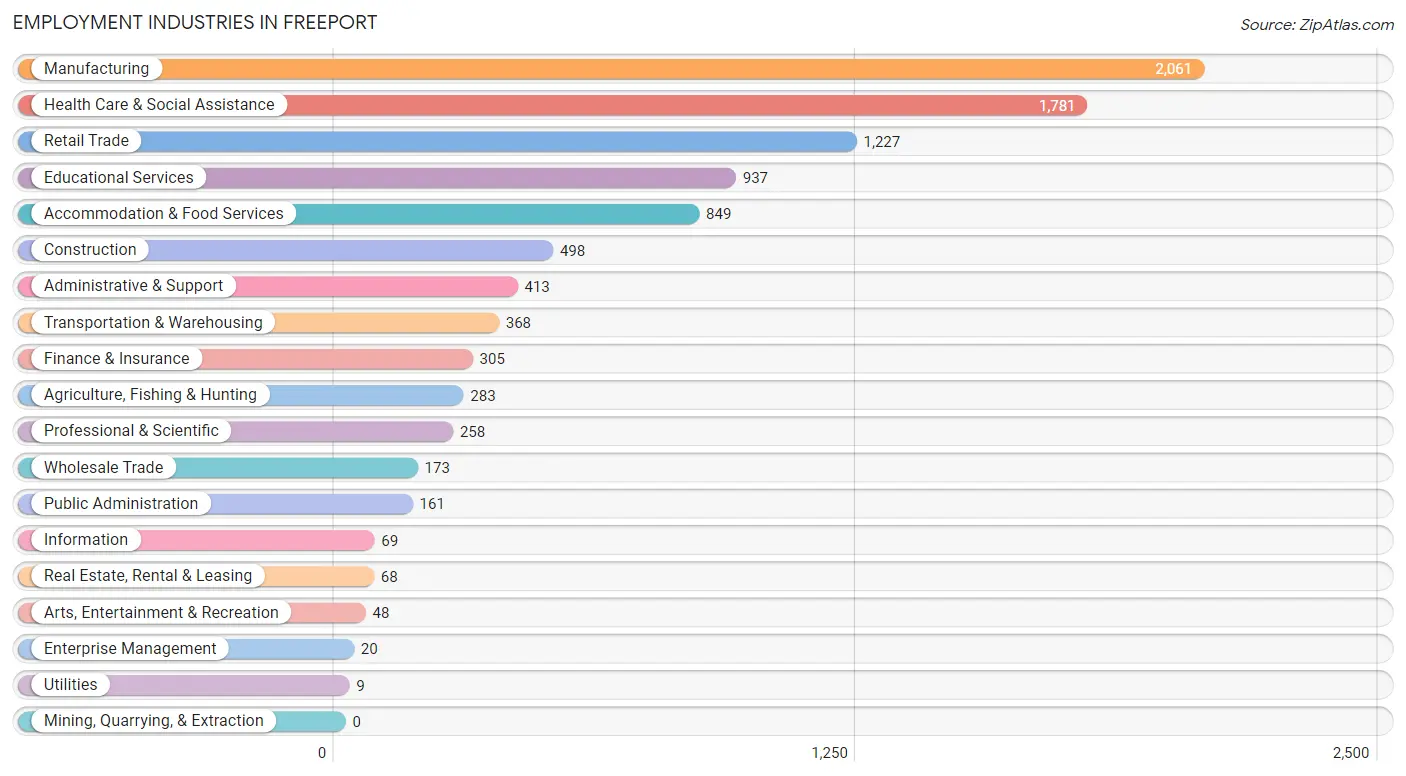
Employment Industries in Freeport
The major employment industries in Freeport include Manufacturing (2,061 | 20.3%), Health Care & Social Assistance (1,781 | 17.5%), Retail Trade (1,227 | 12.1%), Educational Services (937 | 9.2%), and Accommodation & Food Services (849 | 8.4%).
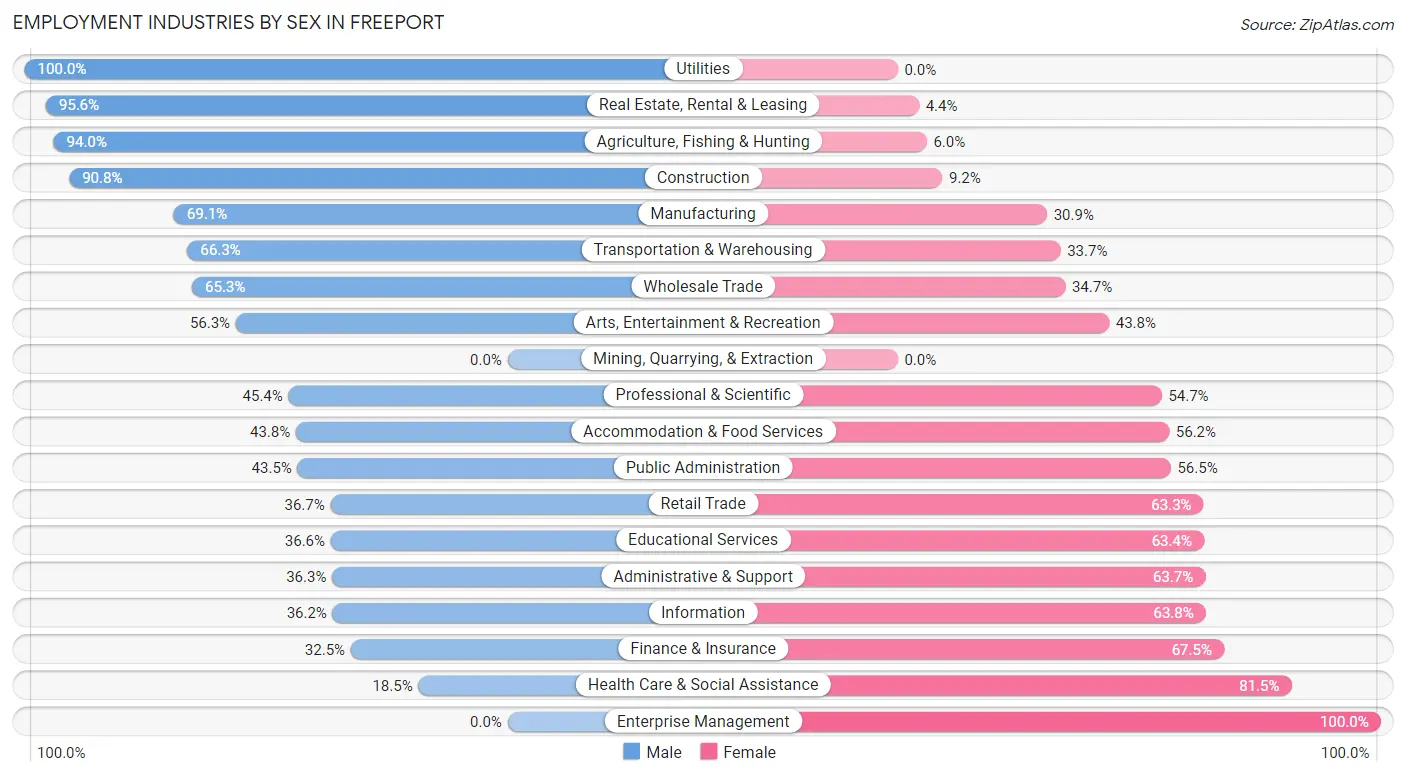
Employment Industries by Sex in Freeport
The Freeport industries that see more men than women are Utilities (100.0%), Real Estate, Rental & Leasing (95.6%), and Agriculture, Fishing & Hunting (94.0%), whereas the industries that tend to have a higher number of women are Enterprise Management (100.0%), Health Care & Social Assistance (81.5%), and Finance & Insurance (67.5%).
| Industry | Male | Female |
| Agriculture, Fishing & Hunting | 266 (94.0%) | 17 (6.0%) |
| Mining, Quarrying, & Extraction | 0 (0.0%) | 0 (0.0%) |
| Construction | 452 (90.8%) | 46 (9.2%) |
| Manufacturing | 1,424 (69.1%) | 637 (30.9%) |
| Wholesale Trade | 113 (65.3%) | 60 (34.7%) |
| Retail Trade | 450 (36.7%) | 777 (63.3%) |
| Transportation & Warehousing | 244 (66.3%) | 124 (33.7%) |
| Utilities | 9 (100.0%) | 0 (0.0%) |
| Information | 25 (36.2%) | 44 (63.8%) |
| Finance & Insurance | 99 (32.5%) | 206 (67.5%) |
| Real Estate, Rental & Leasing | 65 (95.6%) | 3 (4.4%) |
| Professional & Scientific | 117 (45.4%) | 141 (54.6%) |
| Enterprise Management | 0 (0.0%) | 20 (100.0%) |
| Administrative & Support | 150 (36.3%) | 263 (63.7%) |
| Educational Services | 343 (36.6%) | 594 (63.4%) |
| Health Care & Social Assistance | 329 (18.5%) | 1,452 (81.5%) |
| Arts, Entertainment & Recreation | 27 (56.2%) | 21 (43.8%) |
| Accommodation & Food Services | 372 (43.8%) | 477 (56.2%) |
| Public Administration | 70 (43.5%) | 91 (56.5%) |
| Total | 4,817 (47.4%) | 5,337 (52.6%) |
Education in Freeport
School Enrollment in Freeport
The most common levels of schooling among the 4,518 students in Freeport are elementary school (1,162 | 25.7%), middle school (1,057 | 23.4%), and college / undergraduate (777 | 17.2%).
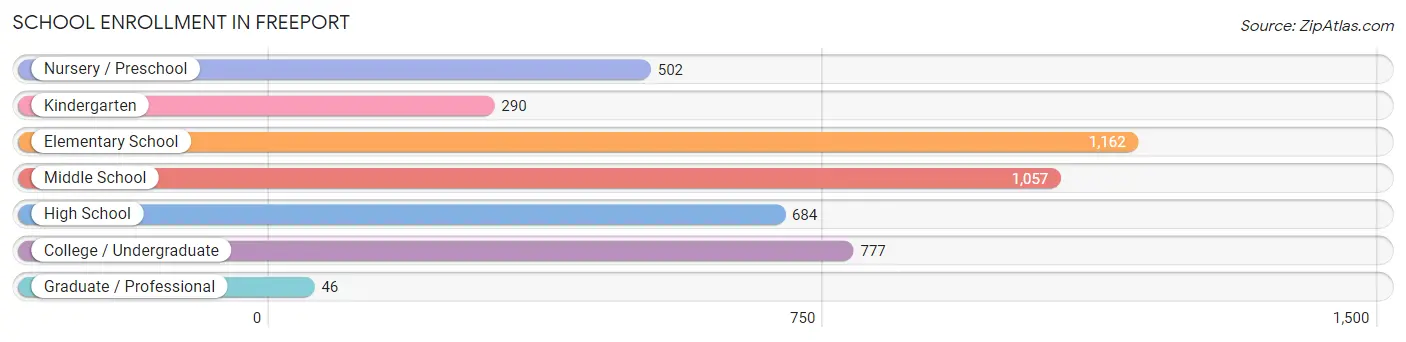
| School Level | # Students | % Students |
| Nursery / Preschool | 502 | 11.1% |
| Kindergarten | 290 | 6.4% |
| Elementary School | 1,162 | 25.7% |
| Middle School | 1,057 | 23.4% |
| High School | 684 | 15.1% |
| College / Undergraduate | 777 | 17.2% |
| Graduate / Professional | 46 | 1.0% |
| Total | 4,518 | 100.0% |
School Enrollment by Age by Funding Source in Freeport
Out of a total of 4,518 students who are enrolled in schools in Freeport, 958 (21.2%) attend a private institution, while the remaining 3,560 (78.8%) are enrolled in public schools. The age group of 3 to 4 year olds has the highest likelihood of being enrolled in private schools, with 222 (52.4% in the age bracket) enrolled. Conversely, the age group of 15 to 17 year olds has the lowest likelihood of being enrolled in a private school, with 521 (87.9% in the age bracket) attending a public institution.
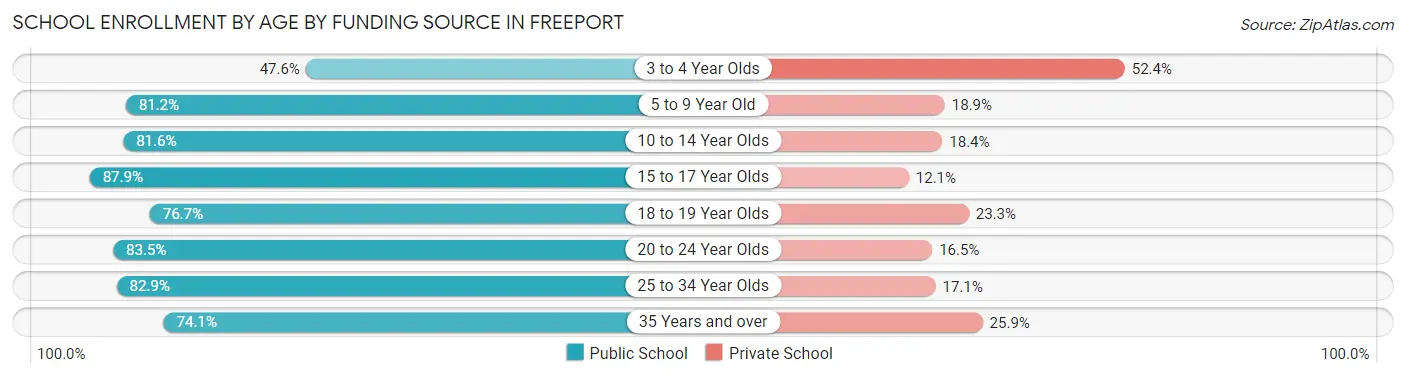
| Age Bracket | Public School | Private School |
| 3 to 4 Year Olds | 202 (47.6%) | 222 (52.4%) |
| 5 to 9 Year Old | 930 (81.1%) | 216 (18.9%) |
| 10 to 14 Year Olds | 1,208 (81.6%) | 272 (18.4%) |
| 15 to 17 Year Olds | 521 (87.9%) | 72 (12.1%) |
| 18 to 19 Year Olds | 217 (76.7%) | 66 (23.3%) |
| 20 to 24 Year Olds | 162 (83.5%) | 32 (16.5%) |
| 25 to 34 Year Olds | 237 (82.9%) | 49 (17.1%) |
| 35 Years and over | 83 (74.1%) | 29 (25.9%) |
| Total | 3,560 (78.8%) | 958 (21.2%) |
Educational Attainment by Field of Study in Freeport
Education (632 | 19.2%), science & technology (475 | 14.4%), business (444 | 13.5%), arts & humanities (300 | 9.1%), and psychology (226 | 6.9%) are the most common fields of study among 3,290 individuals in Freeport who have obtained a bachelor's degree or higher.
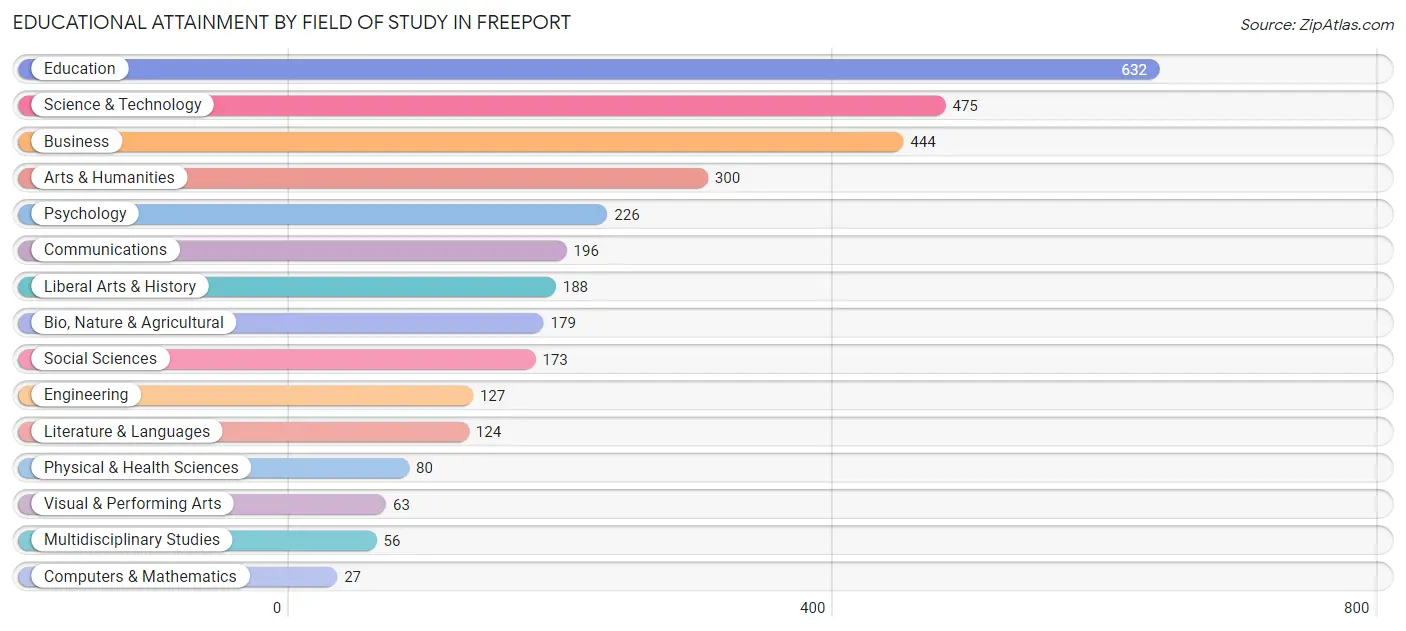
| Field of Study | # Graduates | % Graduates |
| Computers & Mathematics | 27 | 0.8% |
| Bio, Nature & Agricultural | 179 | 5.4% |
| Physical & Health Sciences | 80 | 2.4% |
| Psychology | 226 | 6.9% |
| Social Sciences | 173 | 5.3% |
| Engineering | 127 | 3.9% |
| Multidisciplinary Studies | 56 | 1.7% |
| Science & Technology | 475 | 14.4% |
| Business | 444 | 13.5% |
| Education | 632 | 19.2% |
| Literature & Languages | 124 | 3.8% |
| Liberal Arts & History | 188 | 5.7% |
| Visual & Performing Arts | 63 | 1.9% |
| Communications | 196 | 6.0% |
| Arts & Humanities | 300 | 9.1% |
| Total | 3,290 | 100.0% |
Transportation & Commute in Freeport
Vehicle Availability by Sex in Freeport
The most prevalent vehicle ownership categories in Freeport are males with 2 vehicles (2,096, accounting for 42.7%) and females with 2 vehicles (2,335, making up 40.4%).
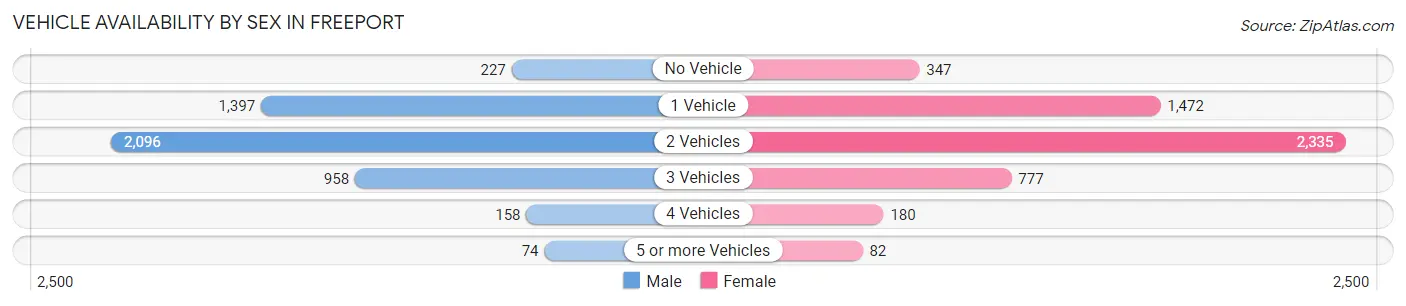
| Vehicles Available | Male | Female |
| No Vehicle | 227 (4.6%) | 347 (6.7%) |
| 1 Vehicle | 1,397 (28.4%) | 1,472 (28.3%) |
| 2 Vehicles | 2,096 (42.7%) | 2,335 (45.0%) |
| 3 Vehicles | 958 (19.5%) | 777 (15.0%) |
| 4 Vehicles | 158 (3.2%) | 180 (3.5%) |
| 5 or more Vehicles | 74 (1.5%) | 82 (1.6%) |
| Total | 4,910 (100.0%) | 5,193 (100.0%) |
Commute Time in Freeport
The most frequently occuring commute durations in Freeport are 5 to 9 minutes (2,928 commuters, 31.4%), 10 to 14 minutes (1,850 commuters, 19.8%), and 15 to 19 minutes (919 commuters, 9.9%).
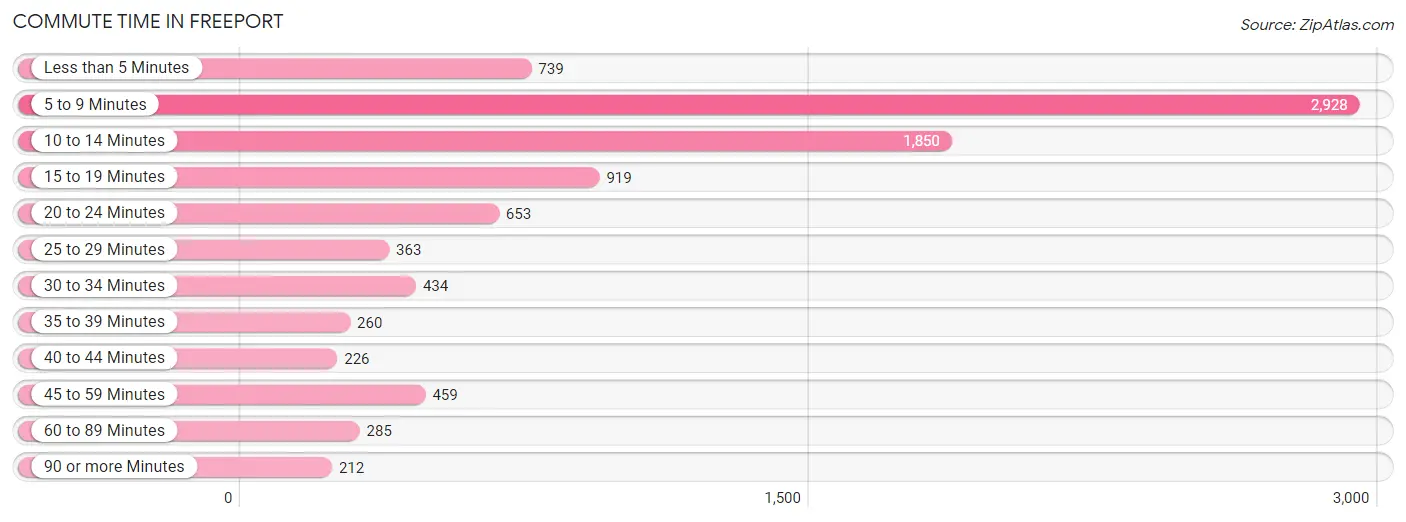
| Commute Time | # Commuters | % Commuters |
| Less than 5 Minutes | 739 | 7.9% |
| 5 to 9 Minutes | 2,928 | 31.4% |
| 10 to 14 Minutes | 1,850 | 19.8% |
| 15 to 19 Minutes | 919 | 9.9% |
| 20 to 24 Minutes | 653 | 7.0% |
| 25 to 29 Minutes | 363 | 3.9% |
| 30 to 34 Minutes | 434 | 4.6% |
| 35 to 39 Minutes | 260 | 2.8% |
| 40 to 44 Minutes | 226 | 2.4% |
| 45 to 59 Minutes | 459 | 4.9% |
| 60 to 89 Minutes | 285 | 3.1% |
| 90 or more Minutes | 212 | 2.3% |
Commute Time by Sex in Freeport
The most common commute times in Freeport are 10 to 14 minutes (1,205 commuters, 26.3%) for males and 5 to 9 minutes (1,952 commuters, 41.1%) for females.
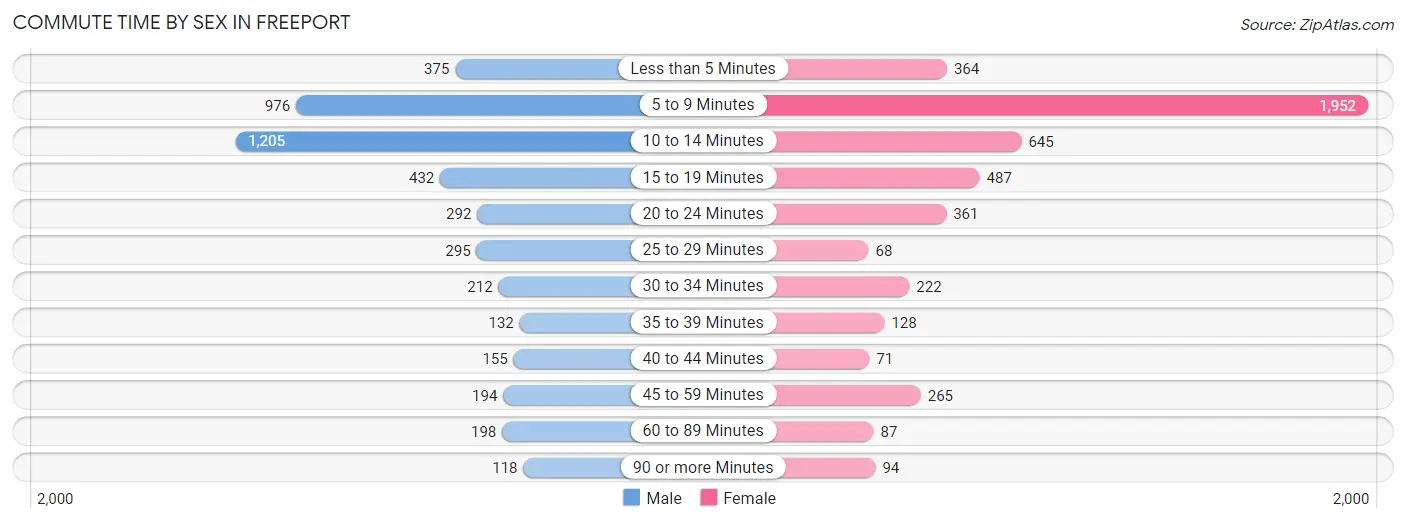
| Commute Time | Male | Female |
| Less than 5 Minutes | 375 (8.2%) | 364 (7.7%) |
| 5 to 9 Minutes | 976 (21.3%) | 1,952 (41.1%) |
| 10 to 14 Minutes | 1,205 (26.3%) | 645 (13.6%) |
| 15 to 19 Minutes | 432 (9.4%) | 487 (10.3%) |
| 20 to 24 Minutes | 292 (6.4%) | 361 (7.6%) |
| 25 to 29 Minutes | 295 (6.4%) | 68 (1.4%) |
| 30 to 34 Minutes | 212 (4.6%) | 222 (4.7%) |
| 35 to 39 Minutes | 132 (2.9%) | 128 (2.7%) |
| 40 to 44 Minutes | 155 (3.4%) | 71 (1.5%) |
| 45 to 59 Minutes | 194 (4.2%) | 265 (5.6%) |
| 60 to 89 Minutes | 198 (4.3%) | 87 (1.8%) |
| 90 or more Minutes | 118 (2.6%) | 94 (2.0%) |
Time of Departure to Work by Sex in Freeport
The most frequent times of departure to work in Freeport are 7:00 AM to 7:29 AM (741, 16.2%) for males and 6:30 AM to 6:59 AM (729, 15.4%) for females.
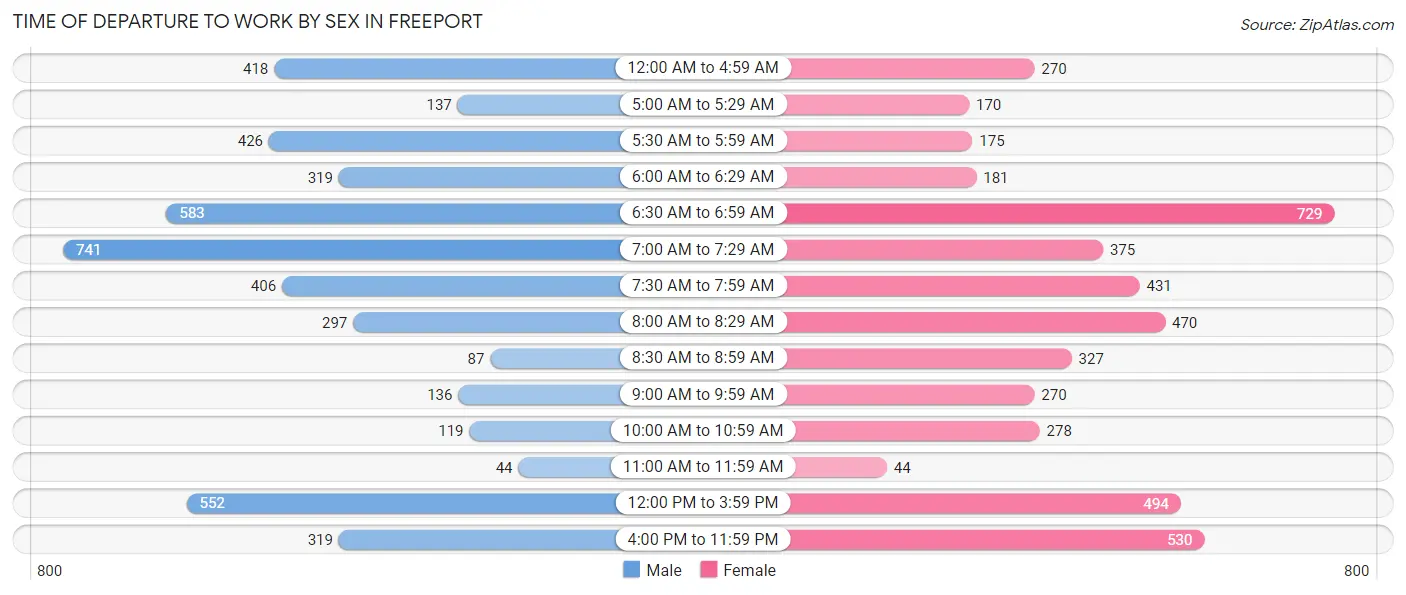
| Time of Departure | Male | Female |
| 12:00 AM to 4:59 AM | 418 (9.1%) | 270 (5.7%) |
| 5:00 AM to 5:29 AM | 137 (3.0%) | 170 (3.6%) |
| 5:30 AM to 5:59 AM | 426 (9.3%) | 175 (3.7%) |
| 6:00 AM to 6:29 AM | 319 (7.0%) | 181 (3.8%) |
| 6:30 AM to 6:59 AM | 583 (12.7%) | 729 (15.4%) |
| 7:00 AM to 7:29 AM | 741 (16.2%) | 375 (7.9%) |
| 7:30 AM to 7:59 AM | 406 (8.9%) | 431 (9.1%) |
| 8:00 AM to 8:29 AM | 297 (6.5%) | 470 (9.9%) |
| 8:30 AM to 8:59 AM | 87 (1.9%) | 327 (6.9%) |
| 9:00 AM to 9:59 AM | 136 (3.0%) | 270 (5.7%) |
| 10:00 AM to 10:59 AM | 119 (2.6%) | 278 (5.9%) |
| 11:00 AM to 11:59 AM | 44 (1.0%) | 44 (0.9%) |
| 12:00 PM to 3:59 PM | 552 (12.0%) | 494 (10.4%) |
| 4:00 PM to 11:59 PM | 319 (7.0%) | 530 (11.2%) |
| Total | 4,584 (100.0%) | 4,744 (100.0%) |
Housing Occupancy in Freeport
Occupancy by Ownership in Freeport
Of the total 10,905 dwellings in Freeport, owner-occupied units account for 6,203 (56.9%), while renter-occupied units make up 4,702 (43.1%).
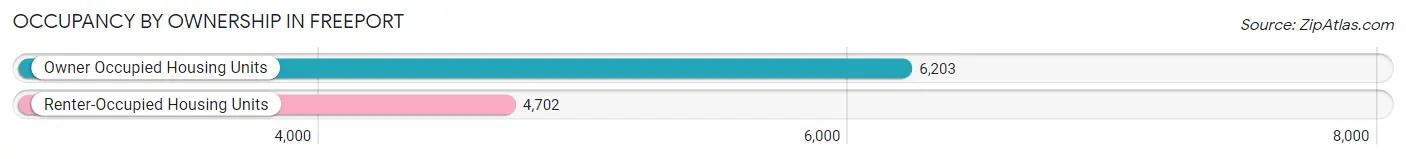
| Occupancy | # Housing Units | % Housing Units |
| Owner Occupied Housing Units | 6,203 | 56.9% |
| Renter-Occupied Housing Units | 4,702 | 43.1% |
| Total Occupied Housing Units | 10,905 | 100.0% |
Occupancy by Household Size in Freeport
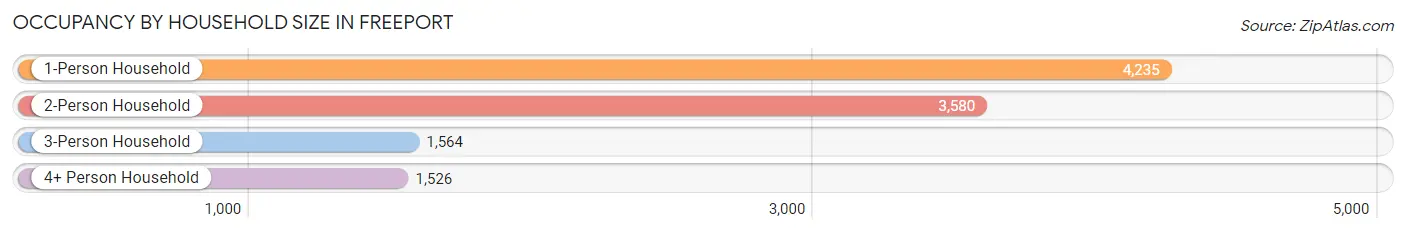
| Household Size | # Housing Units | % Housing Units |
| 1-Person Household | 4,235 | 38.8% |
| 2-Person Household | 3,580 | 32.8% |
| 3-Person Household | 1,564 | 14.3% |
| 4+ Person Household | 1,526 | 14.0% |
| Total Housing Units | 10,905 | 100.0% |
Occupancy by Ownership by Household Size in Freeport
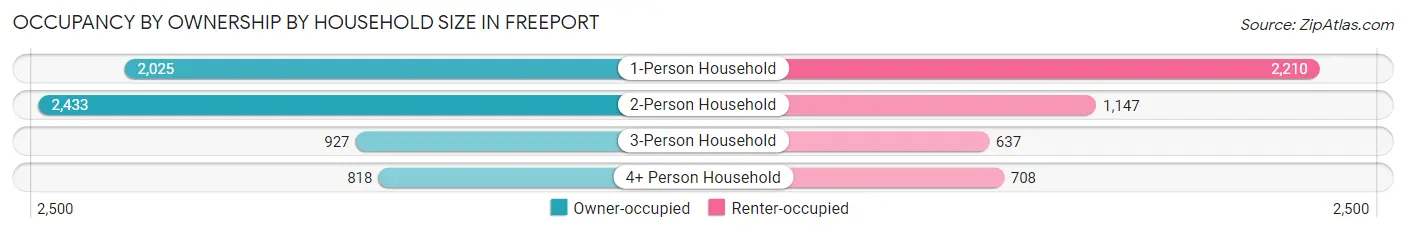
| Household Size | Owner-occupied | Renter-occupied |
| 1-Person Household | 2,025 (47.8%) | 2,210 (52.2%) |
| 2-Person Household | 2,433 (68.0%) | 1,147 (32.0%) |
| 3-Person Household | 927 (59.3%) | 637 (40.7%) |
| 4+ Person Household | 818 (53.6%) | 708 (46.4%) |
| Total Housing Units | 6,203 (56.9%) | 4,702 (43.1%) |
Occupancy by Educational Attainment in Freeport
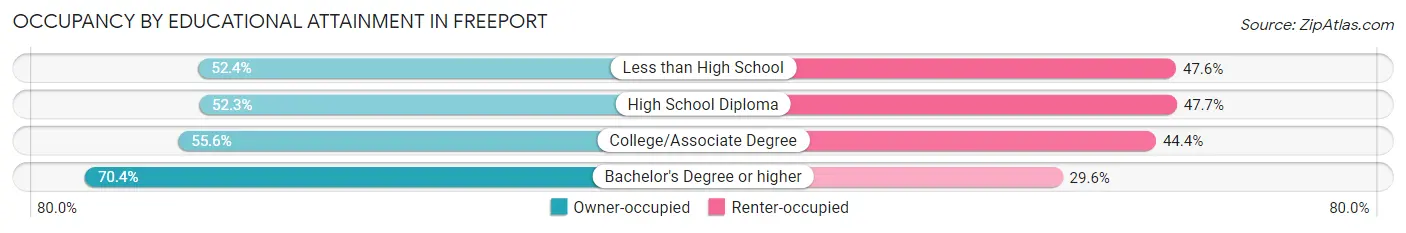
| Household Size | Owner-occupied | Renter-occupied |
| Less than High School | 475 (52.4%) | 431 (47.6%) |
| High School Diploma | 1,994 (52.3%) | 1,817 (47.7%) |
| College/Associate Degree | 2,344 (55.6%) | 1,870 (44.4%) |
| Bachelor's Degree or higher | 1,390 (70.4%) | 584 (29.6%) |
Occupancy by Age of Householder in Freeport
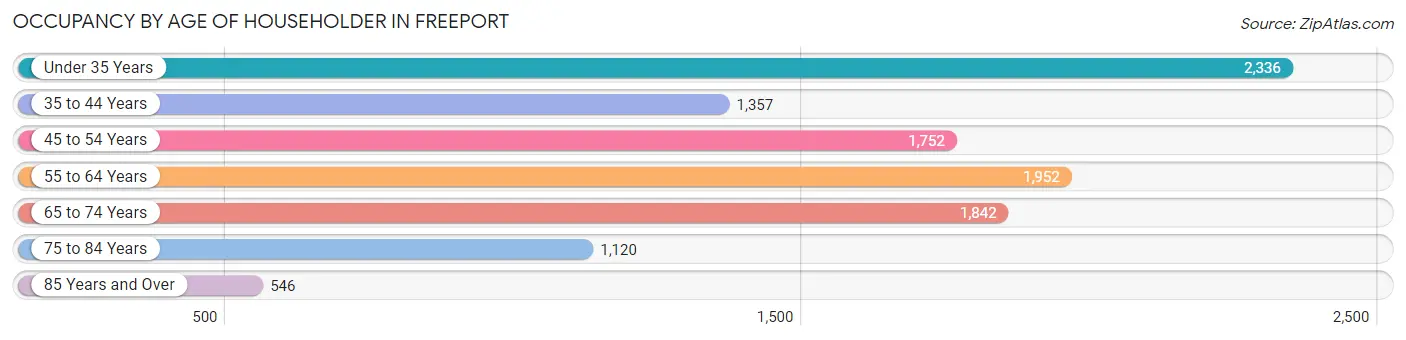
| Age Bracket | # Households | % Households |
| Under 35 Years | 2,336 | 21.4% |
| 35 to 44 Years | 1,357 | 12.4% |
| 45 to 54 Years | 1,752 | 16.1% |
| 55 to 64 Years | 1,952 | 17.9% |
| 65 to 74 Years | 1,842 | 16.9% |
| 75 to 84 Years | 1,120 | 10.3% |
| 85 Years and Over | 546 | 5.0% |
| Total | 10,905 | 100.0% |
Housing Finances in Freeport
Median Income by Occupancy in Freeport
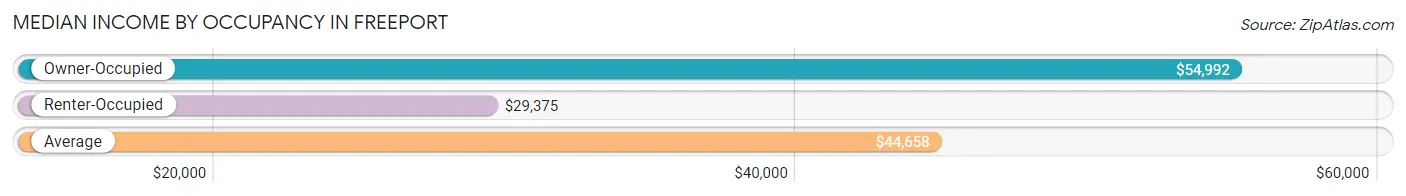
| Occupancy Type | # Households | Median Income |
| Owner-Occupied | 6,203 (56.9%) | $54,992 |
| Renter-Occupied | 4,702 (43.1%) | $29,375 |
| Average | 10,905 (100.0%) | $44,658 |
Occupancy by Householder Income Bracket in Freeport
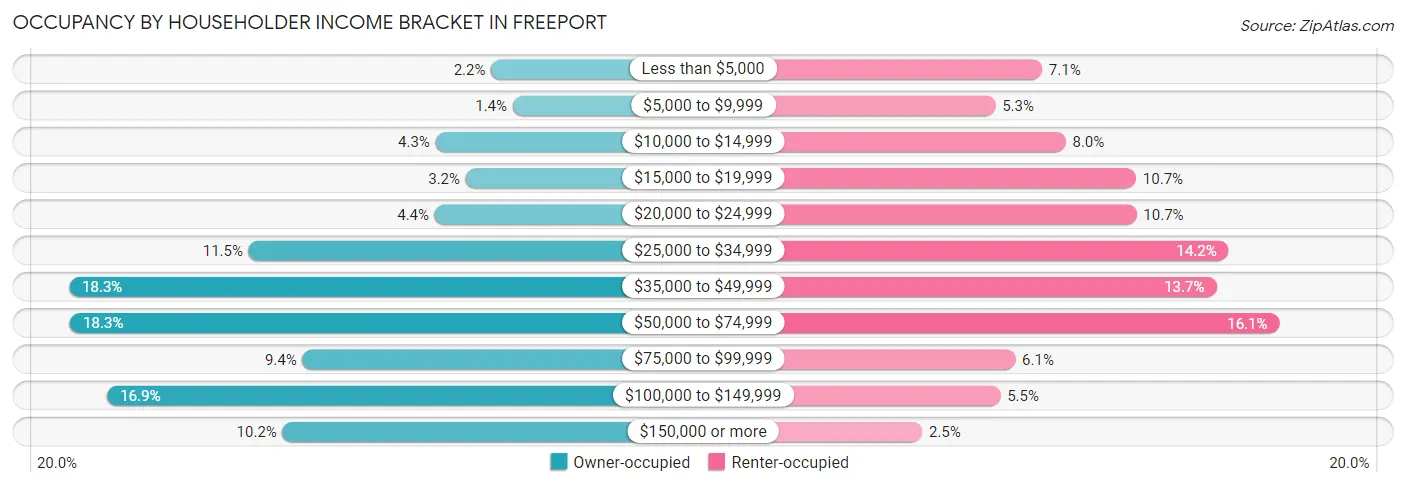
| Income Bracket | Owner-occupied | Renter-occupied |
| Less than $5,000 | 138 (2.2%) | 334 (7.1%) |
| $5,000 to $9,999 | 87 (1.4%) | 250 (5.3%) |
| $10,000 to $14,999 | 269 (4.3%) | 376 (8.0%) |
| $15,000 to $19,999 | 198 (3.2%) | 502 (10.7%) |
| $20,000 to $24,999 | 271 (4.4%) | 503 (10.7%) |
| $25,000 to $34,999 | 711 (11.5%) | 668 (14.2%) |
| $35,000 to $49,999 | 1,136 (18.3%) | 646 (13.7%) |
| $50,000 to $74,999 | 1,133 (18.3%) | 759 (16.1%) |
| $75,000 to $99,999 | 584 (9.4%) | 286 (6.1%) |
| $100,000 to $149,999 | 1,045 (16.9%) | 259 (5.5%) |
| $150,000 or more | 631 (10.2%) | 119 (2.5%) |
| Total | 6,203 (100.0%) | 4,702 (100.0%) |
Monthly Housing Cost Tiers in Freeport
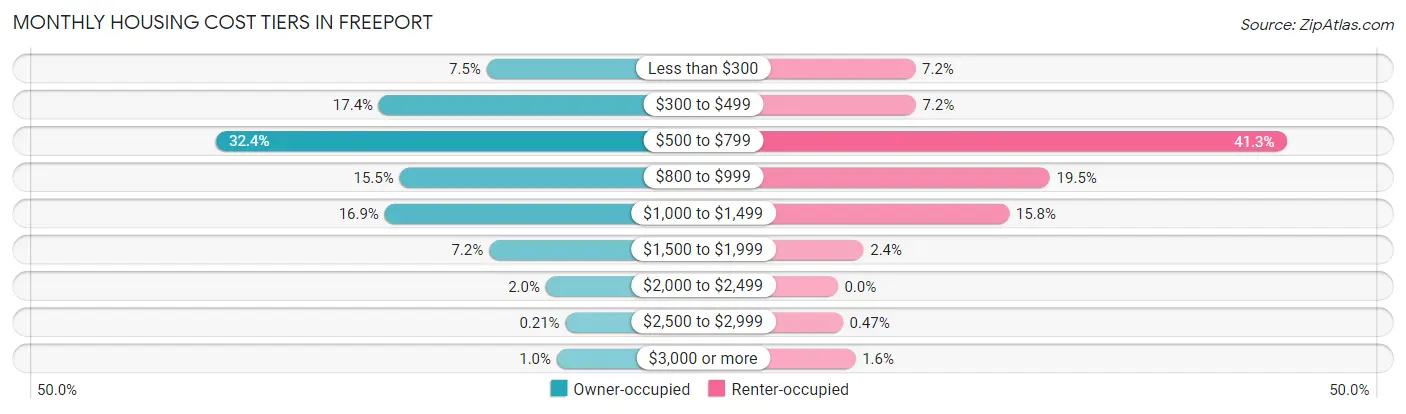
| Monthly Cost | Owner-occupied | Renter-occupied |
| Less than $300 | 463 (7.5%) | 336 (7.1%) |
| $300 to $499 | 1,078 (17.4%) | 338 (7.2%) |
| $500 to $799 | 2,008 (32.4%) | 1,943 (41.3%) |
| $800 to $999 | 960 (15.5%) | 919 (19.5%) |
| $1,000 to $1,499 | 1,045 (16.9%) | 742 (15.8%) |
| $1,500 to $1,999 | 449 (7.2%) | 112 (2.4%) |
| $2,000 to $2,499 | 125 (2.0%) | 0 (0.0%) |
| $2,500 to $2,999 | 13 (0.2%) | 22 (0.5%) |
| $3,000 or more | 62 (1.0%) | 77 (1.6%) |
| Total | 6,203 (100.0%) | 4,702 (100.0%) |
Physical Housing Characteristics in Freeport
Housing Structures in Freeport
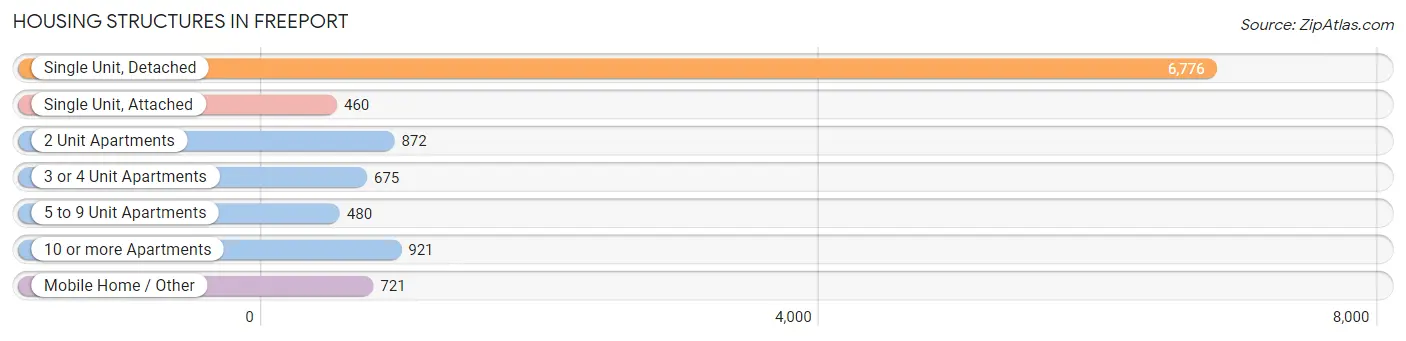
| Structure Type | # Housing Units | % Housing Units |
| Single Unit, Detached | 6,776 | 62.1% |
| Single Unit, Attached | 460 | 4.2% |
| 2 Unit Apartments | 872 | 8.0% |
| 3 or 4 Unit Apartments | 675 | 6.2% |
| 5 to 9 Unit Apartments | 480 | 4.4% |
| 10 or more Apartments | 921 | 8.5% |
| Mobile Home / Other | 721 | 6.6% |
| Total | 10,905 | 100.0% |
Housing Structures by Occupancy in Freeport
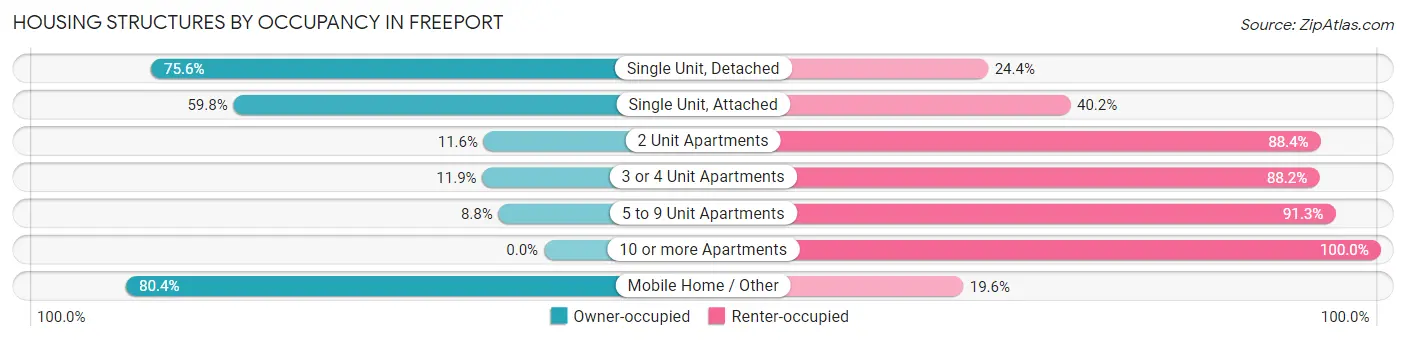
| Structure Type | Owner-occupied | Renter-occupied |
| Single Unit, Detached | 5,125 (75.6%) | 1,651 (24.4%) |
| Single Unit, Attached | 275 (59.8%) | 185 (40.2%) |
| 2 Unit Apartments | 101 (11.6%) | 771 (88.4%) |
| 3 or 4 Unit Apartments | 80 (11.8%) | 595 (88.1%) |
| 5 to 9 Unit Apartments | 42 (8.7%) | 438 (91.2%) |
| 10 or more Apartments | 0 (0.0%) | 921 (100.0%) |
| Mobile Home / Other | 580 (80.4%) | 141 (19.6%) |
| Total | 6,203 (56.9%) | 4,702 (43.1%) |
Housing Structures by Number of Rooms in Freeport
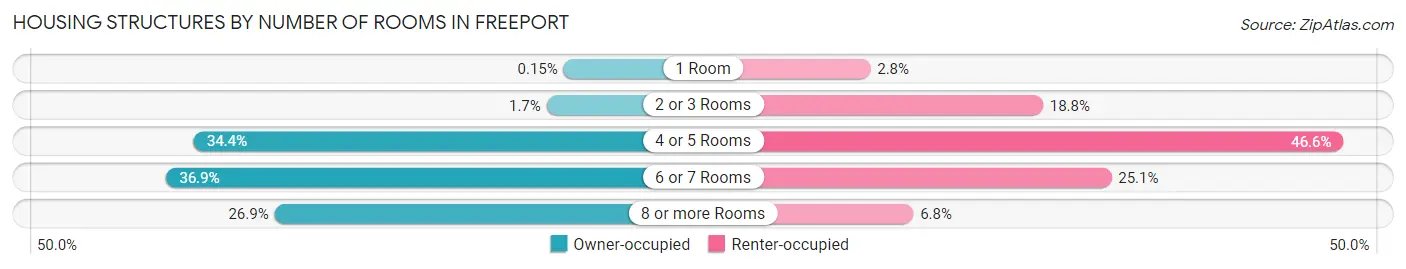
| Number of Rooms | Owner-occupied | Renter-occupied |
| 1 Room | 9 (0.2%) | 132 (2.8%) |
| 2 or 3 Rooms | 107 (1.7%) | 882 (18.8%) |
| 4 or 5 Rooms | 2,131 (34.4%) | 2,189 (46.6%) |
| 6 or 7 Rooms | 2,288 (36.9%) | 1,180 (25.1%) |
| 8 or more Rooms | 1,668 (26.9%) | 319 (6.8%) |
| Total | 6,203 (100.0%) | 4,702 (100.0%) |
Housing Structure by Heating Type in Freeport
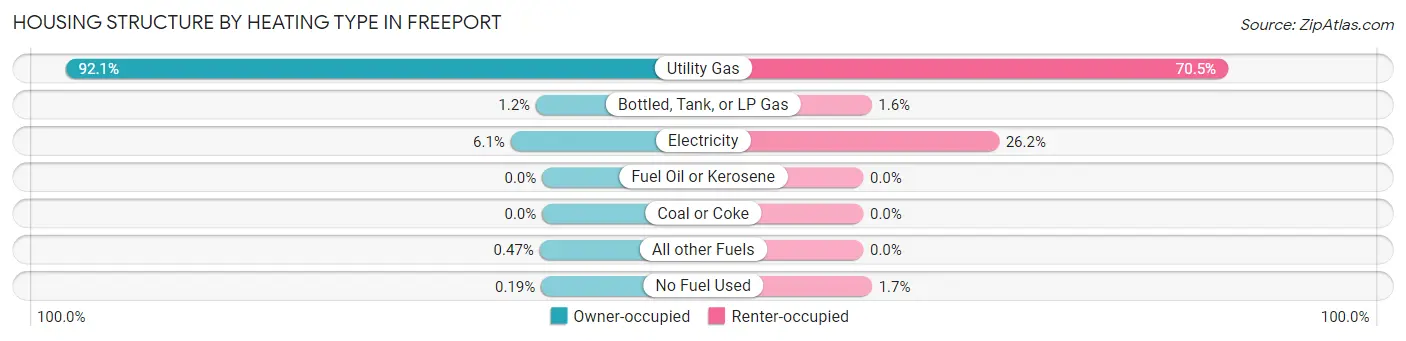
| Heating Type | Owner-occupied | Renter-occupied |
| Utility Gas | 5,711 (92.1%) | 3,315 (70.5%) |
| Bottled, Tank, or LP Gas | 74 (1.2%) | 75 (1.6%) |
| Electricity | 377 (6.1%) | 1,233 (26.2%) |
| Fuel Oil or Kerosene | 0 (0.0%) | 0 (0.0%) |
| Coal or Coke | 0 (0.0%) | 0 (0.0%) |
| All other Fuels | 29 (0.5%) | 0 (0.0%) |
| No Fuel Used | 12 (0.2%) | 79 (1.7%) |
| Total | 6,203 (100.0%) | 4,702 (100.0%) |
Household Vehicle Usage in Freeport
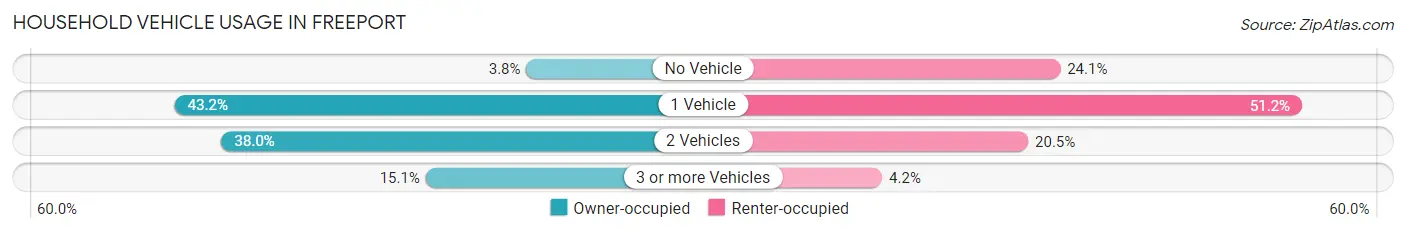
| Vehicles per Household | Owner-occupied | Renter-occupied |
| No Vehicle | 235 (3.8%) | 1,134 (24.1%) |
| 1 Vehicle | 2,679 (43.2%) | 2,407 (51.2%) |
| 2 Vehicles | 2,354 (38.0%) | 965 (20.5%) |
| 3 or more Vehicles | 935 (15.1%) | 196 (4.2%) |
| Total | 6,203 (100.0%) | 4,702 (100.0%) |
Real Estate & Mortgages in Freeport
Real Estate and Mortgage Overview in Freeport
| Characteristic | Without Mortgage | With Mortgage |
| Housing Units | 3,154 | 3,049 |
| Median Property Value | $68,800 | $89,600 |
| Median Household Income | $44,094 | $464 |
| Monthly Housing Costs | $519 | $62 |
| Real Estate Taxes | $1,438 | $112 |
Property Value by Mortgage Status in Freeport
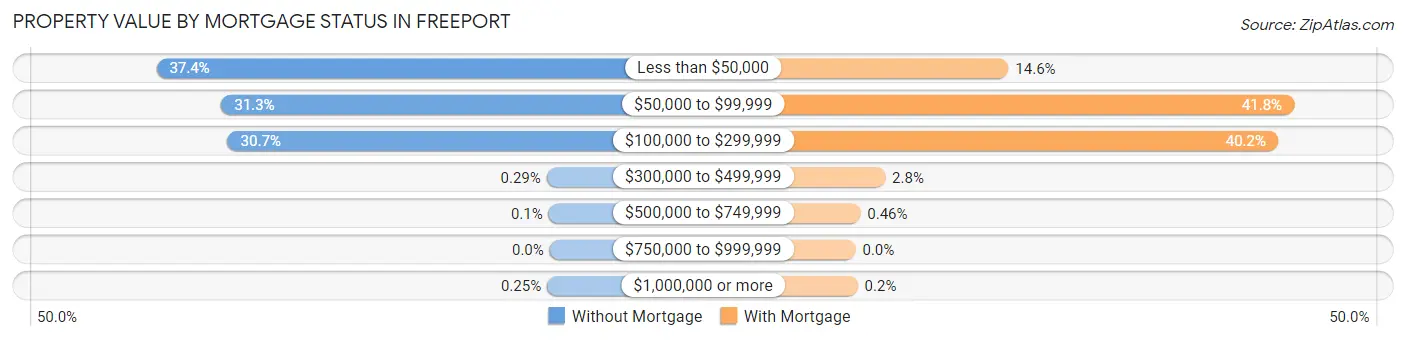
| Property Value | Without Mortgage | With Mortgage |
| Less than $50,000 | 1,181 (37.4%) | 444 (14.6%) |
| $50,000 to $99,999 | 986 (31.3%) | 1,273 (41.7%) |
| $100,000 to $299,999 | 967 (30.7%) | 1,226 (40.2%) |
| $300,000 to $499,999 | 9 (0.3%) | 86 (2.8%) |
| $500,000 to $749,999 | 3 (0.1%) | 14 (0.5%) |
| $750,000 to $999,999 | 0 (0.0%) | 0 (0.0%) |
| $1,000,000 or more | 8 (0.3%) | 6 (0.2%) |
| Total | 3,154 (100.0%) | 3,049 (100.0%) |
Household Income by Mortgage Status in Freeport
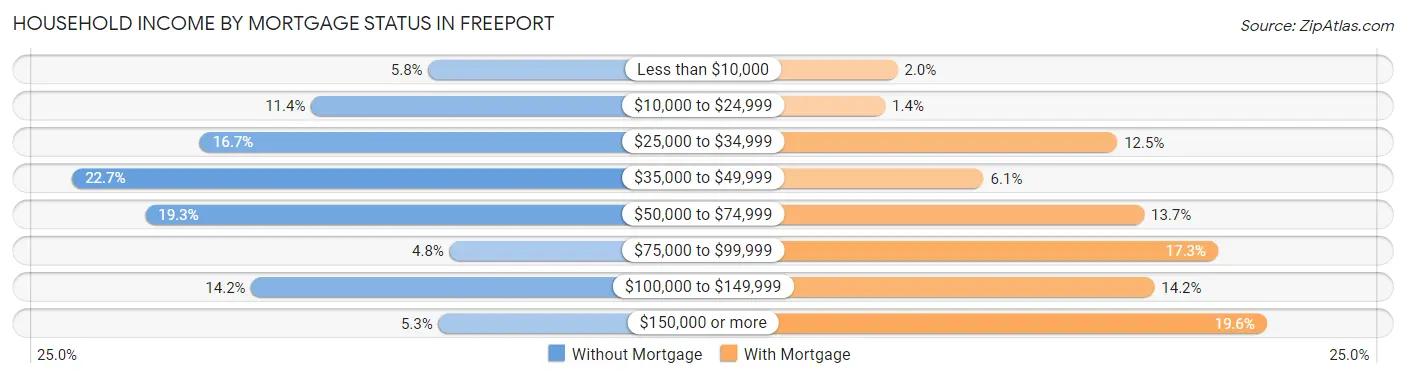
| Household Income | Without Mortgage | With Mortgage |
| Less than $10,000 | 182 (5.8%) | 61 (2.0%) |
| $10,000 to $24,999 | 358 (11.4%) | 43 (1.4%) |
| $25,000 to $34,999 | 525 (16.7%) | 380 (12.5%) |
| $35,000 to $49,999 | 717 (22.7%) | 186 (6.1%) |
| $50,000 to $74,999 | 607 (19.3%) | 419 (13.7%) |
| $75,000 to $99,999 | 150 (4.8%) | 526 (17.2%) |
| $100,000 to $149,999 | 448 (14.2%) | 434 (14.2%) |
| $150,000 or more | 167 (5.3%) | 597 (19.6%) |
| Total | 3,154 (100.0%) | 3,049 (100.0%) |
Property Value to Household Income Ratio in Freeport
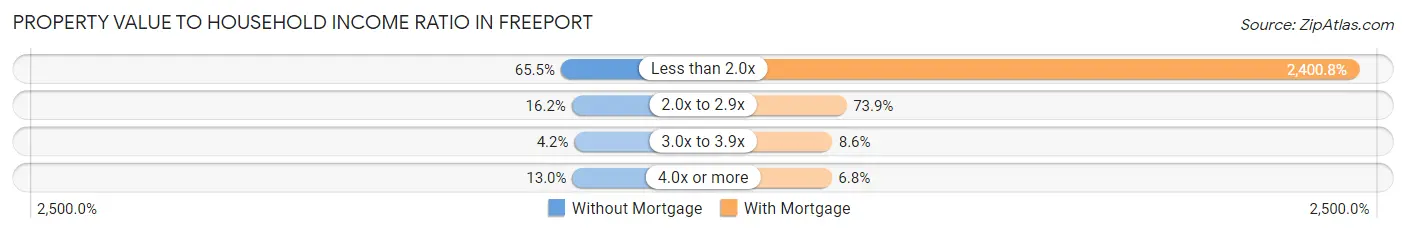
| Value-to-Income Ratio | Without Mortgage | With Mortgage |
| Less than 2.0x | 2,065 (65.5%) | 73,201 (2,400.8%) |
| 2.0x to 2.9x | 512 (16.2%) | 2,253 (73.9%) |
| 3.0x to 3.9x | 132 (4.2%) | 261 (8.6%) |
| 4.0x or more | 410 (13.0%) | 208 (6.8%) |
| Total | 3,154 (100.0%) | 3,049 (100.0%) |
Real Estate Taxes by Mortgage Status in Freeport
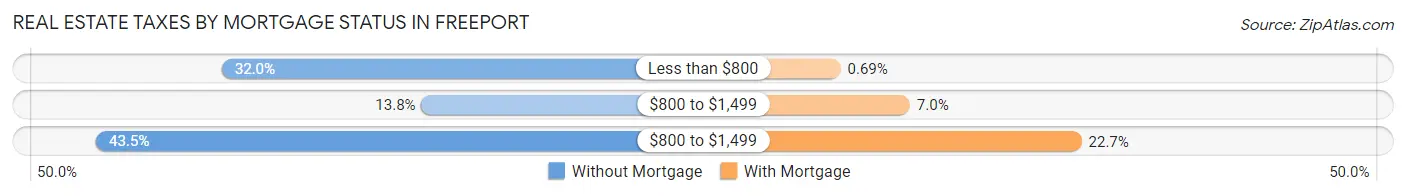
| Property Taxes | Without Mortgage | With Mortgage |
| Less than $800 | 1,009 (32.0%) | 21 (0.7%) |
| $800 to $1,499 | 434 (13.8%) | 214 (7.0%) |
| $800 to $1,499 | 1,371 (43.5%) | 692 (22.7%) |
| Total | 3,154 (100.0%) | 3,049 (100.0%) |
Health & Disability in Freeport
Health Insurance Coverage by Age in Freeport
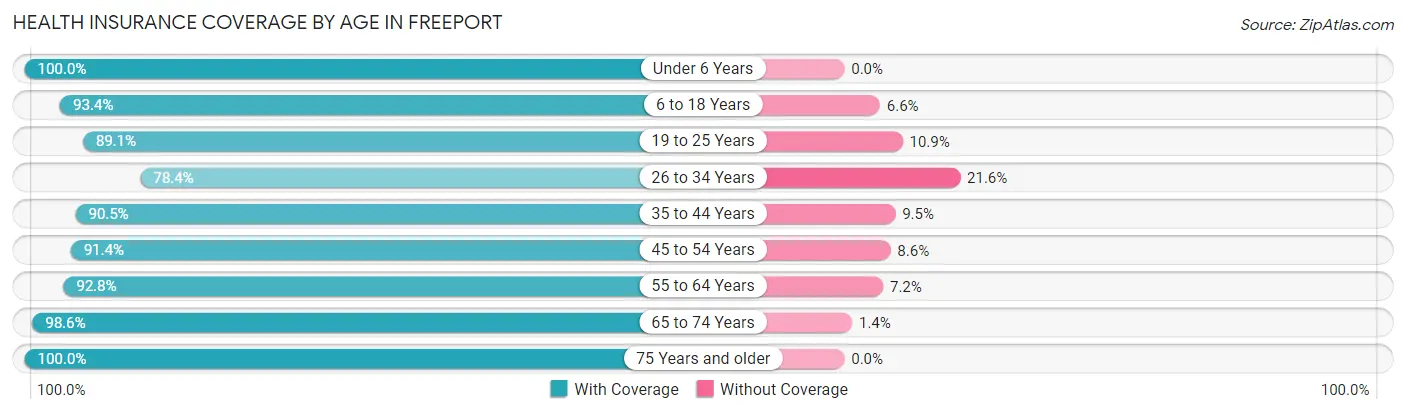
| Age Bracket | With Coverage | Without Coverage |
| Under 6 Years | 1,887 (100.0%) | 0 (0.0%) |
| 6 to 18 Years | 3,128 (93.4%) | 222 (6.6%) |
| 19 to 25 Years | 1,773 (89.1%) | 216 (10.9%) |
| 26 to 34 Years | 2,014 (78.4%) | 555 (21.6%) |
| 35 to 44 Years | 2,145 (90.5%) | 225 (9.5%) |
| 45 to 54 Years | 2,550 (91.4%) | 240 (8.6%) |
| 55 to 64 Years | 2,904 (92.8%) | 226 (7.2%) |
| 65 to 74 Years | 2,815 (98.6%) | 41 (1.4%) |
| 75 Years and older | 2,217 (100.0%) | 0 (0.0%) |
| Total | 21,433 (92.5%) | 1,725 (7.4%) |
Health Insurance Coverage by Citizenship Status in Freeport
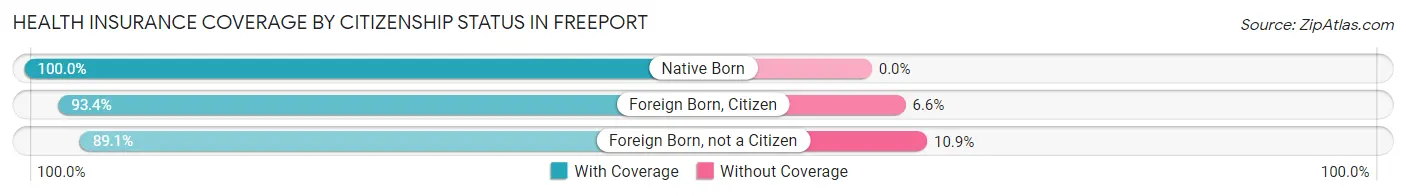
| Citizenship Status | With Coverage | Without Coverage |
| Native Born | 1,887 (100.0%) | 0 (0.0%) |
| Foreign Born, Citizen | 3,128 (93.4%) | 222 (6.6%) |
| Foreign Born, not a Citizen | 1,773 (89.1%) | 216 (10.9%) |
Health Insurance Coverage by Household Income in Freeport
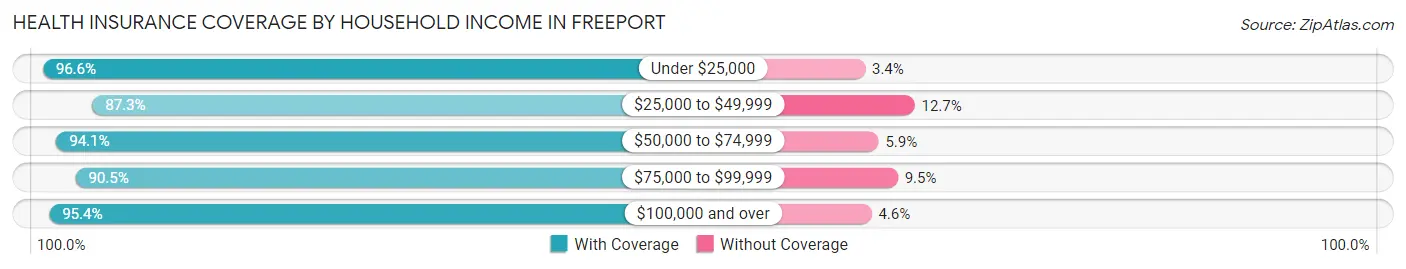
| Household Income | With Coverage | Without Coverage |
| Under $25,000 | 4,093 (96.6%) | 145 (3.4%) |
| $25,000 to $49,999 | 5,715 (87.3%) | 831 (12.7%) |
| $50,000 to $74,999 | 3,925 (94.1%) | 248 (5.9%) |
| $75,000 to $99,999 | 2,332 (90.5%) | 246 (9.5%) |
| $100,000 and over | 5,262 (95.4%) | 255 (4.6%) |
Public vs Private Health Insurance Coverage by Age in Freeport
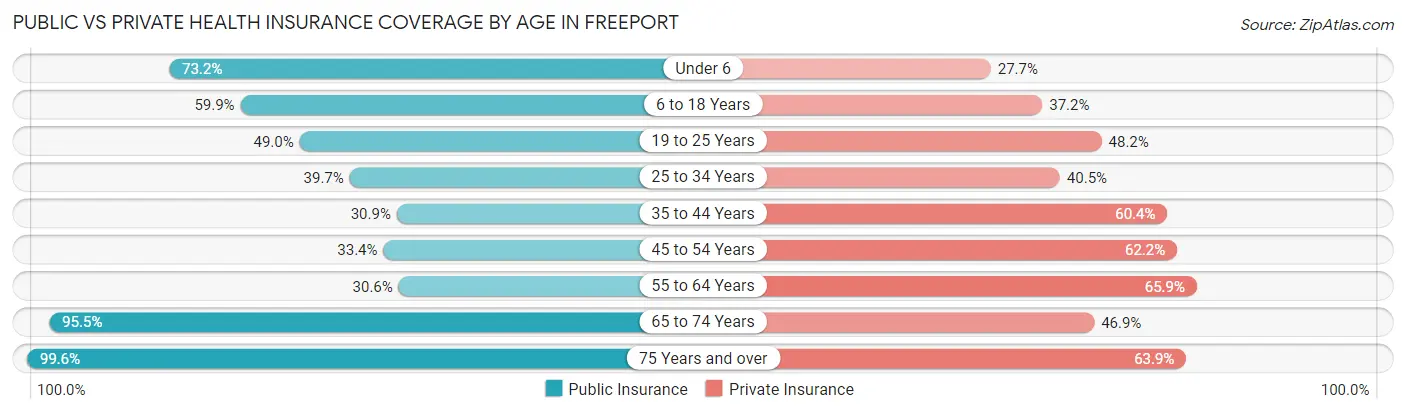
| Age Bracket | Public Insurance | Private Insurance |
| Under 6 | 1,381 (73.2%) | 522 (27.7%) |
| 6 to 18 Years | 2,008 (59.9%) | 1,247 (37.2%) |
| 19 to 25 Years | 974 (49.0%) | 959 (48.2%) |
| 25 to 34 Years | 1,019 (39.7%) | 1,040 (40.5%) |
| 35 to 44 Years | 733 (30.9%) | 1,432 (60.4%) |
| 45 to 54 Years | 932 (33.4%) | 1,736 (62.2%) |
| 55 to 64 Years | 957 (30.6%) | 2,062 (65.9%) |
| 65 to 74 Years | 2,726 (95.5%) | 1,338 (46.9%) |
| 75 Years and over | 2,208 (99.6%) | 1,417 (63.9%) |
| Total | 12,938 (55.9%) | 11,753 (50.7%) |
Disability Status by Sex by Age in Freeport
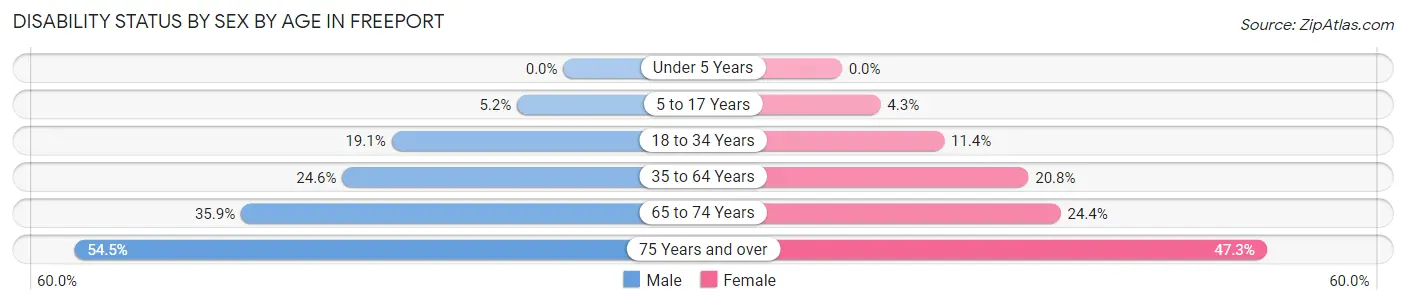
| Age Bracket | Male | Female |
| Under 5 Years | 0 (0.0%) | 0 (0.0%) |
| 5 to 17 Years | 93 (5.2%) | 72 (4.3%) |
| 18 to 34 Years | 437 (19.1%) | 281 (11.4%) |
| 35 to 64 Years | 983 (24.6%) | 892 (20.8%) |
| 65 to 74 Years | 439 (35.9%) | 398 (24.4%) |
| 75 Years and over | 459 (54.4%) | 650 (47.3%) |
Disability Class by Sex by Age in Freeport
Disability Class: Hearing Difficulty
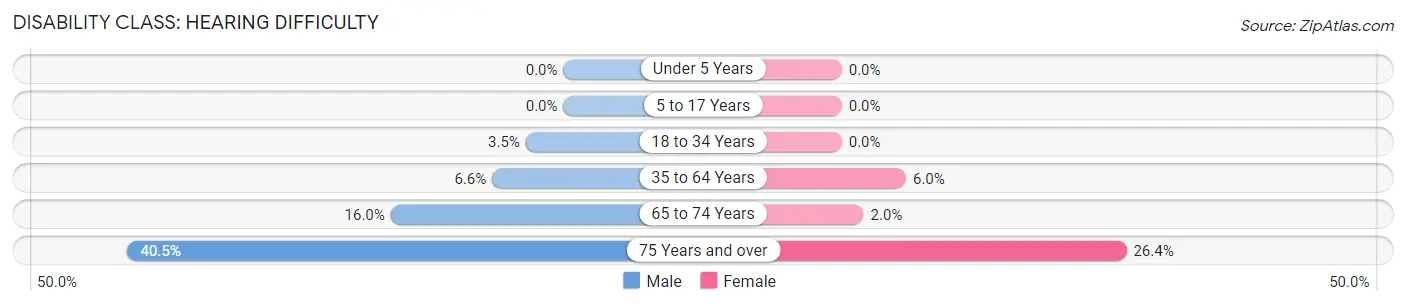
| Age Bracket | Male | Female |
| Under 5 Years | 0 (0.0%) | 0 (0.0%) |
| 5 to 17 Years | 0 (0.0%) | 0 (0.0%) |
| 18 to 34 Years | 80 (3.5%) | 0 (0.0%) |
| 35 to 64 Years | 264 (6.6%) | 256 (6.0%) |
| 65 to 74 Years | 196 (16.0%) | 33 (2.0%) |
| 75 Years and over | 341 (40.5%) | 363 (26.4%) |
Disability Class: Vision Difficulty
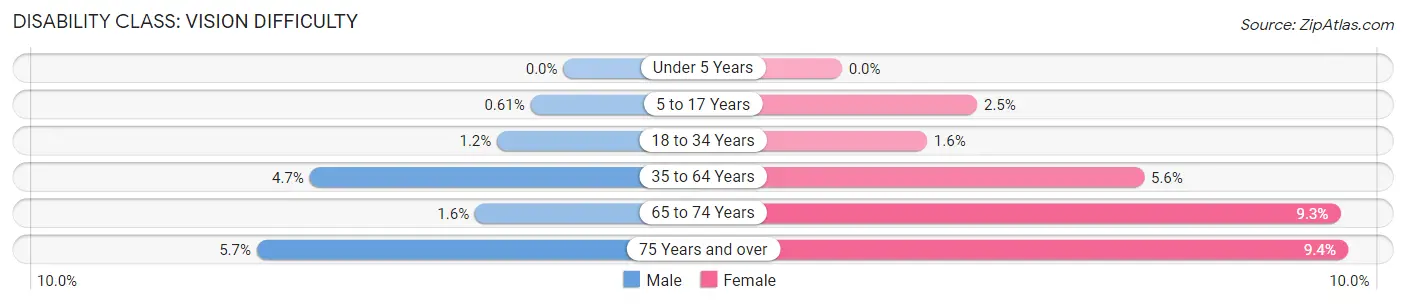
| Age Bracket | Male | Female |
| Under 5 Years | 0 (0.0%) | 0 (0.0%) |
| 5 to 17 Years | 11 (0.6%) | 42 (2.5%) |
| 18 to 34 Years | 28 (1.2%) | 39 (1.6%) |
| 35 to 64 Years | 188 (4.7%) | 241 (5.6%) |
| 65 to 74 Years | 20 (1.6%) | 151 (9.2%) |
| 75 Years and over | 48 (5.7%) | 129 (9.4%) |
Disability Class: Cognitive Difficulty
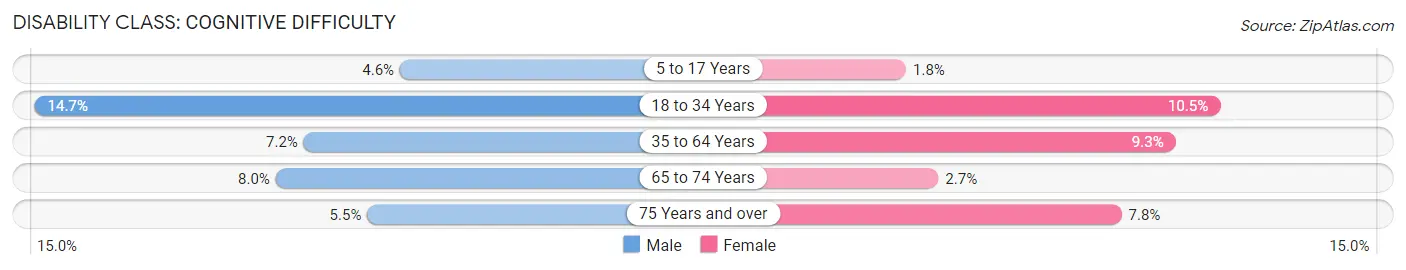
| Age Bracket | Male | Female |
| 5 to 17 Years | 82 (4.5%) | 30 (1.8%) |
| 18 to 34 Years | 336 (14.7%) | 260 (10.5%) |
| 35 to 64 Years | 289 (7.2%) | 399 (9.3%) |
| 65 to 74 Years | 98 (8.0%) | 44 (2.7%) |
| 75 Years and over | 46 (5.5%) | 107 (7.8%) |
Disability Class: Ambulatory Difficulty
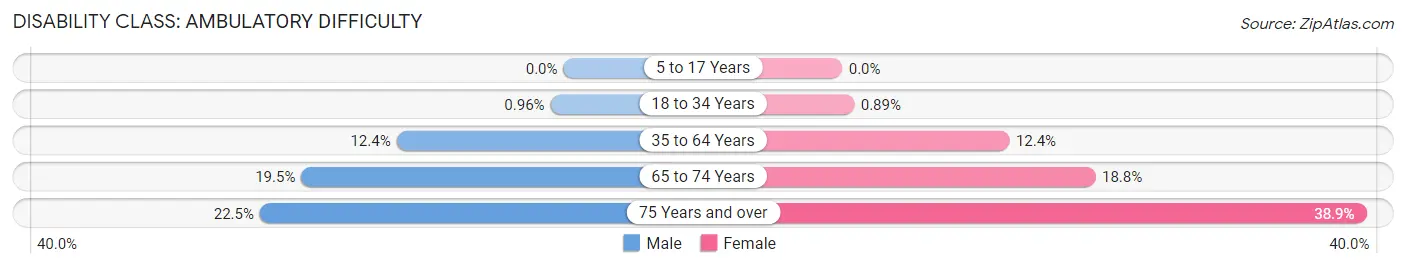
| Age Bracket | Male | Female |
| 5 to 17 Years | 0 (0.0%) | 0 (0.0%) |
| 18 to 34 Years | 22 (1.0%) | 22 (0.9%) |
| 35 to 64 Years | 495 (12.4%) | 533 (12.4%) |
| 65 to 74 Years | 238 (19.5%) | 307 (18.8%) |
| 75 Years and over | 190 (22.5%) | 535 (38.9%) |
Disability Class: Self-Care Difficulty
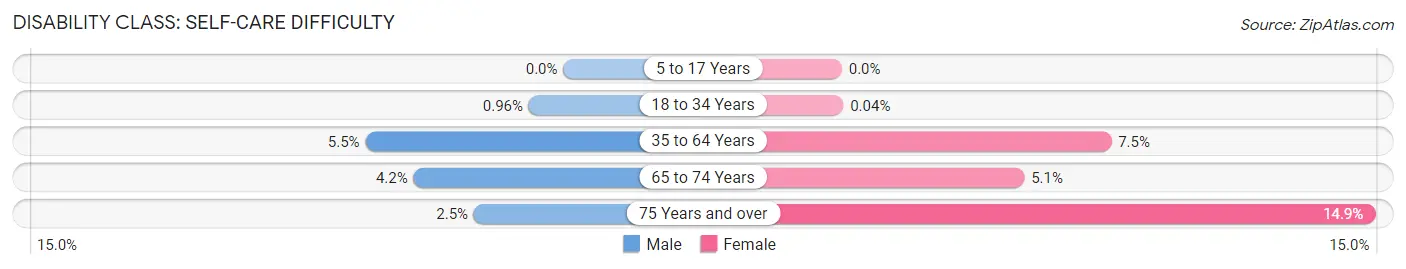
| Age Bracket | Male | Female |
| 5 to 17 Years | 0 (0.0%) | 0 (0.0%) |
| 18 to 34 Years | 22 (1.0%) | 1 (0.0%) |
| 35 to 64 Years | 220 (5.5%) | 322 (7.5%) |
| 65 to 74 Years | 51 (4.2%) | 83 (5.1%) |
| 75 Years and over | 21 (2.5%) | 204 (14.8%) |
Technology Access in Freeport
Computing Device Access in Freeport
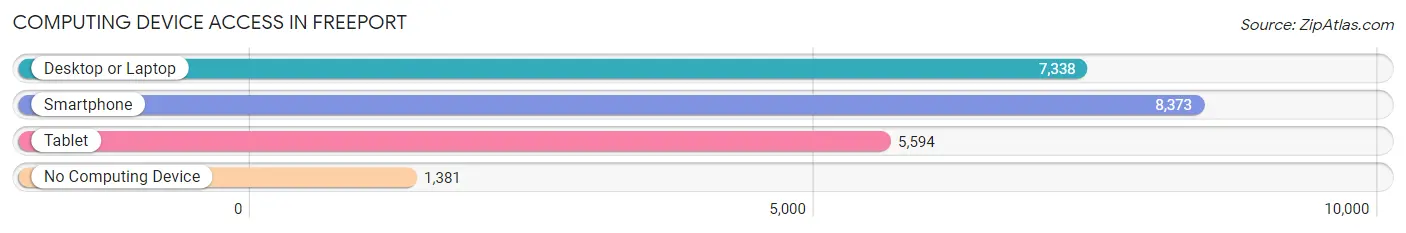
| Device Type | # Households | % Households |
| Desktop or Laptop | 7,338 | 67.3% |
| Smartphone | 8,373 | 76.8% |
| Tablet | 5,594 | 51.3% |
| No Computing Device | 1,381 | 12.7% |
| Total | 10,905 | 100.0% |
Internet Access in Freeport
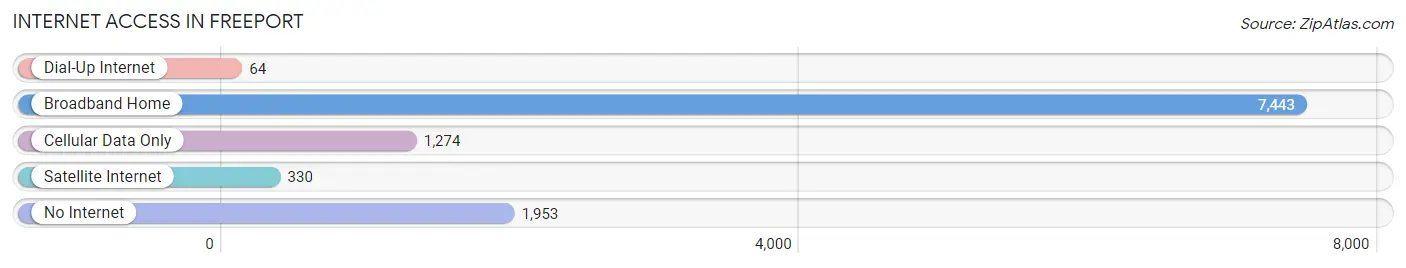
| Internet Type | # Households | % Households |
| Dial-Up Internet | 64 | 0.6% |
| Broadband Home | 7,443 | 68.2% |
| Cellular Data Only | 1,274 | 11.7% |
| Satellite Internet | 330 | 3.0% |
| No Internet | 1,953 | 17.9% |
| Total | 10,905 | 100.0% |
Freeport Summary
Freeport, Illinois is a city located in Stephenson County, Illinois, United States. It is the county seat of Stephenson County and is located along the Pecatonica River. The population of Freeport was 25,638 at the 2010 census, making it the largest city in Stephenson County.
History
The area that is now Freeport was first settled in 1832 by William B. Stephenson, who named the area Stephenson County. The city of Freeport was founded in 1838 by William B. Stephenson and was named after the city of Freeport, Maine. The city was incorporated in 1853 and was the first city in Stephenson County.
The city of Freeport was an important stop on the Underground Railroad, with many slaves escaping to freedom in Canada. The city was also an important center for the abolitionist movement in the mid-1800s.
In 1858, the first railroad line was built in Freeport, connecting the city to Chicago. This line was later extended to Galena, Illinois, and eventually to Dubuque, Iowa.
The city of Freeport was an important center for the Union Army during the Civil War. The city was the site of the Battle of Freeport in 1864, which was a major victory for the Union Army.
In the late 1800s, Freeport became an important center for the manufacturing industry. The city was home to several factories, including the Freeport Brewing Company, the Freeport Chair Company, and the Freeport Plow Company.
Geography
Freeport is located in Stephenson County, Illinois, at the intersection of U.S. Route 20 and Illinois Route 26. The city is located along the Pecatonica River and is approximately 90 miles northwest of Chicago.
The city has a total area of 11.2 square miles, of which 11.1 square miles is land and 0.1 square miles is water. The city is located in the Central Lowland region of the United States.
Economy
Freeport is an important center for manufacturing and industry in the region. The city is home to several factories, including the Freeport Brewing Company, the Freeport Chair Company, and the Freeport Plow Company.
The city is also home to several large employers, including the Freeport School District, the Freeport Memorial Hospital, and the Freeport Public Library.
The city is also home to several retail stores, including the Freeport Mall, the Freeport Shopping Center, and the Freeport Town Center.
Demographics
As of the 2010 census, the population of Freeport was 25,638. The racial makeup of the city was 79.2% White, 15.2% African American, 0.4% Native American, 0.9% Asian, 0.1% Pacific Islander, 1.7% from other races, and 2.5% from two or more races. Hispanic or Latino of any race were 4.3% of the population.
The median income for a household in the city was $41,945, and the median income for a family was $50,945. The per capita income for the city was $20,945. About 11.2% of families and 14.2% of the population were below the poverty line, including 19.2% of those under age 18 and 8.2% of those age 65 or over.
Common Questions
What is Per Capita Income in Freeport?
Per Capita income in Freeport is $28,348.
What is the Median Family Income in Freeport?
Median Family Income in Freeport is $53,873.
What is the Median Household income in Freeport?
Median Household Income in Freeport is $44,658.
What is Income or Wage Gap in Freeport?
Income or Wage Gap in Freeport is 17.1%.
Women in Freeport earn 82.9 cents for every dollar earned by a man.
What is Family Income Deficit in Freeport?
Family Income Deficit in Freeport is $7,178.
Families that are below poverty line in Freeport earn $7,178 less on average than the poverty threshold level.
What is Inequality or Gini Index in Freeport?
Inequality or Gini Index in Freeport is 0.46.
What is the Total Population of Freeport?
Total Population of Freeport is 23,884.
What is the Total Male Population of Freeport?
Total Male Population of Freeport is 11,283.
What is the Total Female Population of Freeport?
Total Female Population of Freeport is 12,601.
What is the Ratio of Males per 100 Females in Freeport?
There are 89.54 Males per 100 Females in Freeport.
What is the Ratio of Females per 100 Males in Freeport?
There are 111.68 Females per 100 Males in Freeport.
What is the Median Population Age in Freeport?
Median Population Age in Freeport is 43.4 Years.
What is the Average Family Size in Freeport
Average Family Size in Freeport is 2.8 People.
What is the Average Household Size in Freeport
Average Household Size in Freeport is 2.1 People.
How Large is the Labor Force in Freeport?
There are 11,034 People in the Labor Forcein in Freeport.
What is the Percentage of People in the Labor Force in Freeport?
57.6% of People are in the Labor Force in Freeport.
What is the Unemployment Rate in Freeport?
Unemployment Rate in Freeport is 6.5%.