South Beloit, IL Map & Demographics
South Beloit Map
South Beloit Overview
$35,108
PER CAPITA INCOME
$102,837
AVG FAMILY INCOME
$78,781
AVG HOUSEHOLD INCOME
11.3%
WAGE / INCOME GAP [ % ]
88.7¢/ $1
WAGE / INCOME GAP [ $ ]
0.38
INEQUALITY / GINI INDEX
7,943
TOTAL POPULATION
3,843
MALE POPULATION
4,100
FEMALE POPULATION
93.73
MALES / 100 FEMALES
106.69
FEMALES / 100 MALES
36.2
MEDIAN AGE
3.2
AVG FAMILY SIZE
2.4
AVG HOUSEHOLD SIZE
4,234
LABOR FORCE [ PEOPLE ]
70.9%
PERCENT IN LABOR FORCE
4.9%
UNEMPLOYMENT RATE
South Beloit Zip Codes
Income in South Beloit
Income Overview in South Beloit
Per Capita Income in South Beloit is $35,108, while median incomes of families and households are $102,837 and $78,781 respectively.
| Characteristic | Number | Measure |
| Per Capita Income | 7,943 | $35,108 |
| Median Family Income | 1,911 | $102,837 |
| Mean Family Income | 1,911 | $104,822 |
| Median Household Income | 3,234 | $78,781 |
| Mean Household Income | 3,234 | $84,898 |
| Income Deficit | 1,911 | $0 |
| Wage / Income Gap (%) | 7,943 | 11.26% |
| Wage / Income Gap ($) | 7,943 | 88.74¢ per $1 |
| Gini / Inequality Index | 7,943 | 0.38 |
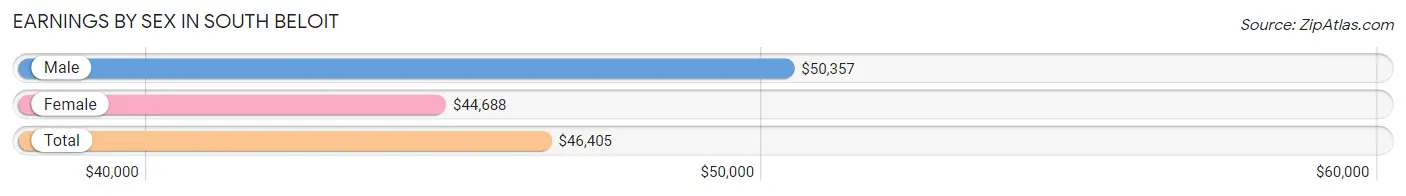
Earnings by Sex in South Beloit
Average Earnings in South Beloit are $46,405, $50,357 for men and $44,688 for women, a difference of 11.3%.
| Sex | Number | Average Earnings |
| Male | 2,364 (54.0%) | $50,357 |
| Female | 2,016 (46.0%) | $44,688 |
| Total | 4,380 (100.0%) | $46,405 |
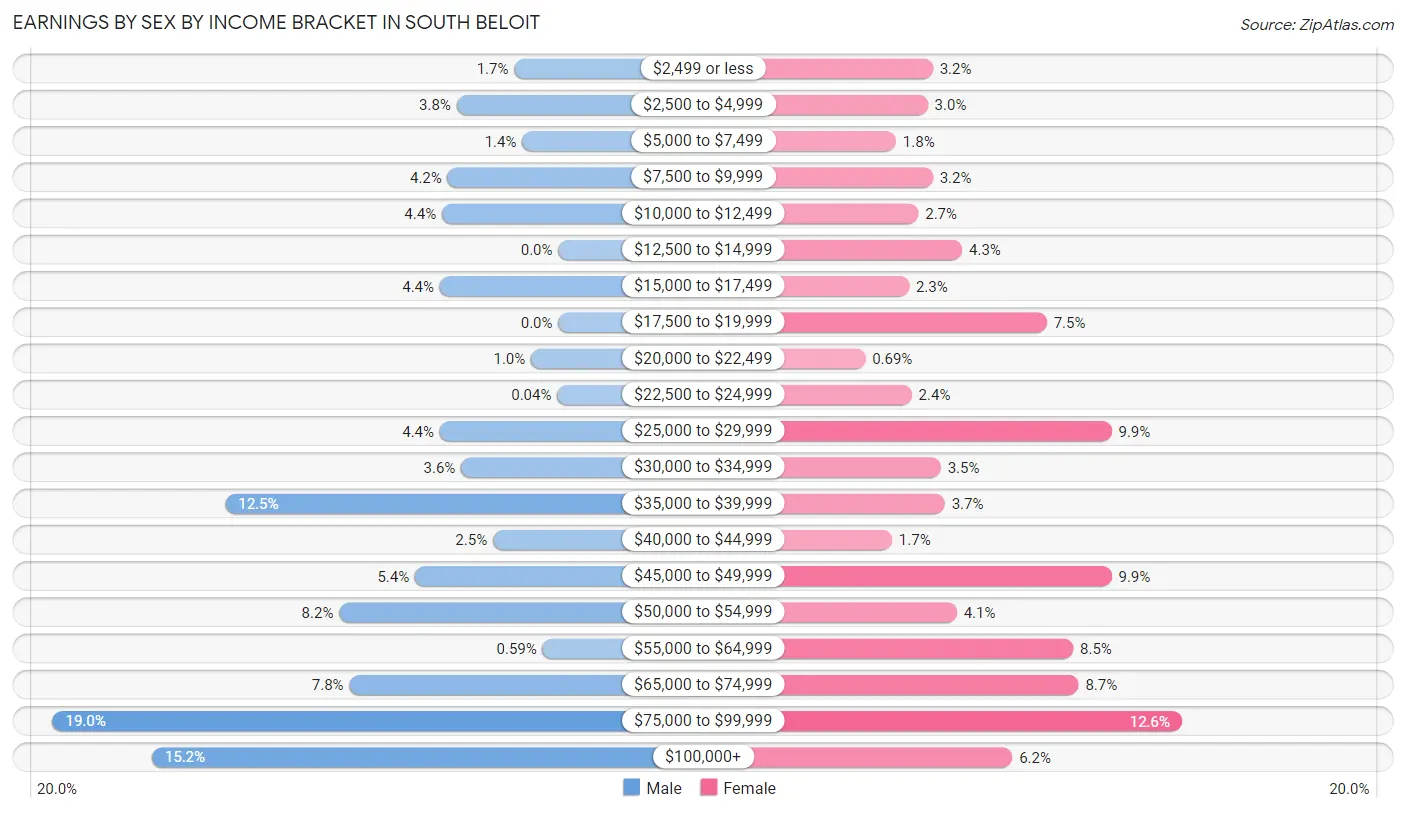
Earnings by Sex by Income Bracket in South Beloit
The most common earnings brackets in South Beloit are $75,000 to $99,999 for men (448 | 19.0%) and $75,000 to $99,999 for women (253 | 12.6%).
| Income | Male | Female |
| $2,499 or less | 39 (1.7%) | 65 (3.2%) |
| $2,500 to $4,999 | 90 (3.8%) | 61 (3.0%) |
| $5,000 to $7,499 | 32 (1.3%) | 37 (1.8%) |
| $7,500 to $9,999 | 98 (4.2%) | 65 (3.2%) |
| $10,000 to $12,499 | 103 (4.4%) | 54 (2.7%) |
| $12,500 to $14,999 | 0 (0.0%) | 87 (4.3%) |
| $15,000 to $17,499 | 105 (4.4%) | 47 (2.3%) |
| $17,500 to $19,999 | 0 (0.0%) | 151 (7.5%) |
| $20,000 to $22,499 | 24 (1.0%) | 14 (0.7%) |
| $22,500 to $24,999 | 1 (0.0%) | 49 (2.4%) |
| $25,000 to $29,999 | 105 (4.4%) | 200 (9.9%) |
| $30,000 to $34,999 | 86 (3.6%) | 71 (3.5%) |
| $35,000 to $39,999 | 295 (12.5%) | 74 (3.7%) |
| $40,000 to $44,999 | 58 (2.5%) | 34 (1.7%) |
| $45,000 to $49,999 | 127 (5.4%) | 200 (9.9%) |
| $50,000 to $54,999 | 194 (8.2%) | 83 (4.1%) |
| $55,000 to $64,999 | 14 (0.6%) | 171 (8.5%) |
| $65,000 to $74,999 | 185 (7.8%) | 175 (8.7%) |
| $75,000 to $99,999 | 448 (19.0%) | 253 (12.6%) |
| $100,000+ | 360 (15.2%) | 125 (6.2%) |
| Total | 2,364 (100.0%) | 2,016 (100.0%) |
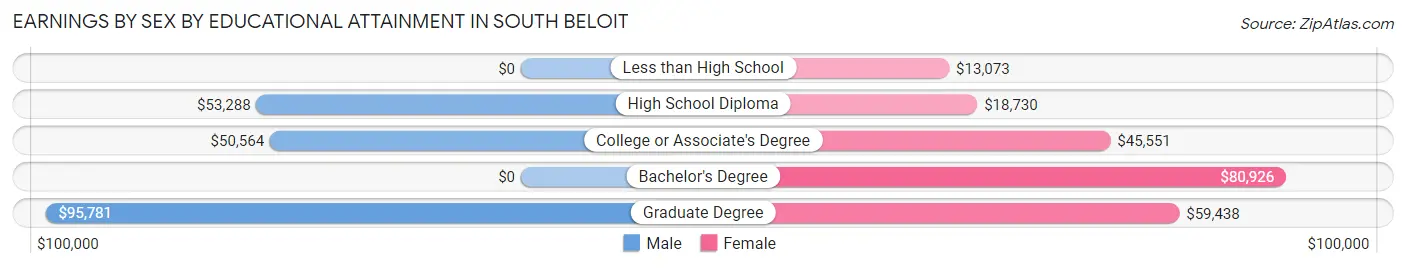
Earnings by Sex by Educational Attainment in South Beloit
Average earnings in South Beloit are $52,058 for men and $47,311 for women, a difference of 9.1%. Men with an educational attainment of graduate degree enjoy the highest average annual earnings of $95,781, while those with college or associate's degree education earn the least with $50,564. Women with an educational attainment of bachelor's degree earn the most with the average annual earnings of $80,926, while those with less than high school education have the smallest earnings of $13,073.
| Educational Attainment | Male Income | Female Income |
| Less than High School | - | - |
| High School Diploma | $53,288 | $18,730 |
| College or Associate's Degree | $50,564 | $45,551 |
| Bachelor's Degree | - | - |
| Graduate Degree | $95,781 | $59,438 |
| Total | $52,058 | $47,311 |
Family Income in South Beloit
Family Income Brackets in South Beloit
According to the South Beloit family income data, there are 713 families falling into the $100,000 to $149,999 income range, which is the most common income bracket and makes up 37.3% of all families.
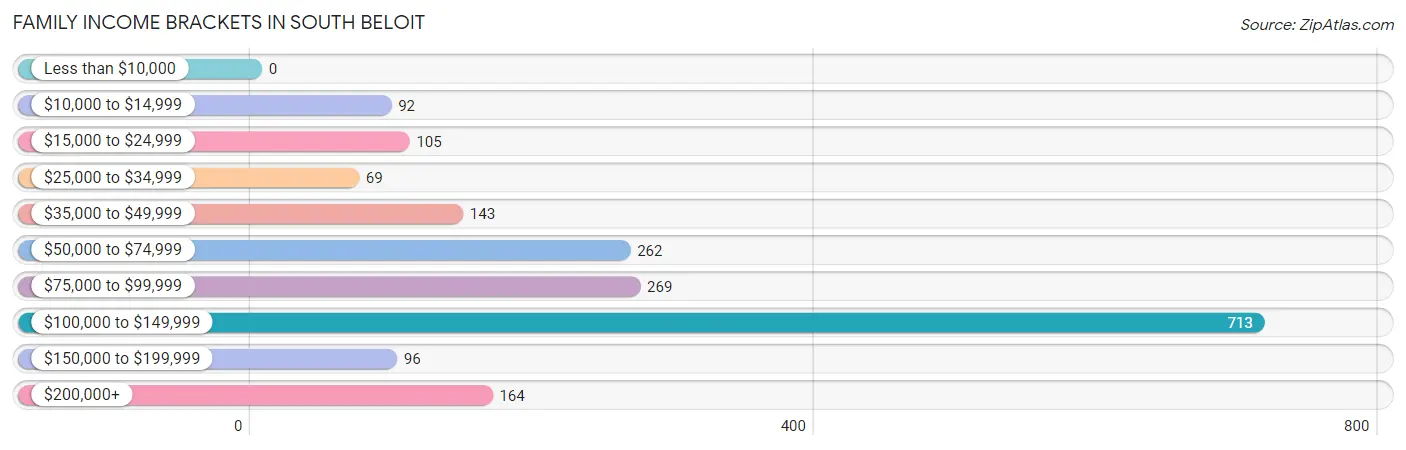
| Income Bracket | # Families | % Families |
| Less than $10,000 | 0 | 0.0% |
| $10,000 to $14,999 | 92 | 4.8% |
| $15,000 to $24,999 | 105 | 5.5% |
| $25,000 to $34,999 | 69 | 3.6% |
| $35,000 to $49,999 | 143 | 7.5% |
| $50,000 to $74,999 | 262 | 13.7% |
| $75,000 to $99,999 | 269 | 14.1% |
| $100,000 to $149,999 | 713 | 37.3% |
| $150,000 to $199,999 | 96 | 5.0% |
| $200,000+ | 164 | 8.6% |
Family Income by Famaliy Size in South Beloit
6-person families (80 | 4.2%) account for the highest median family income in South Beloit with $135,500 per family, while 3-person families (600 | 31.4%) have the highest median income of $44,545 per family member.
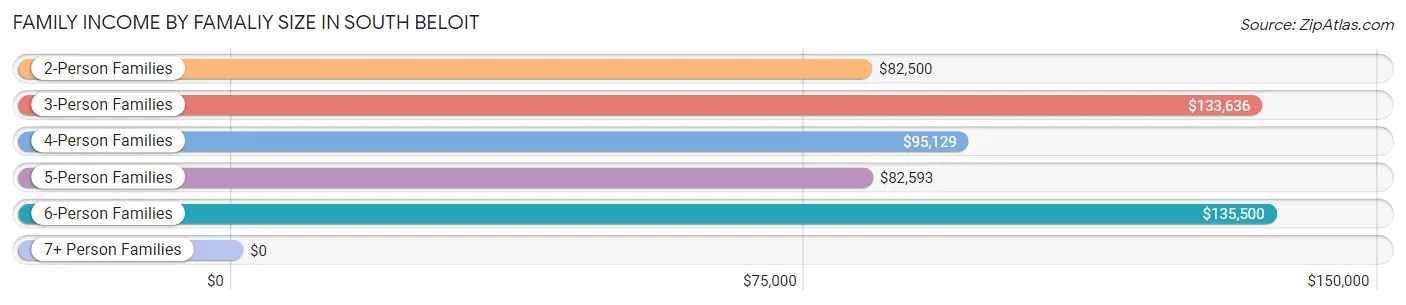
| Income Bracket | # Families | Median Income |
| 2-Person Families | 740 (38.7%) | $82,500 |
| 3-Person Families | 600 (31.4%) | $133,636 |
| 4-Person Families | 369 (19.3%) | $95,129 |
| 5-Person Families | 114 (6.0%) | $82,593 |
| 6-Person Families | 80 (4.2%) | $135,500 |
| 7+ Person Families | 8 (0.4%) | $0 |
| Total | 1,911 (100.0%) | $102,837 |
Family Income by Number of Earners in South Beloit
The median family income in South Beloit is $102,837, with families comprising 3+ earners (105) having the highest median family income of $122,026, while families with no earners (197) have the lowest median family income of $38,144, accounting for 5.5% and 10.3% of families, respectively.
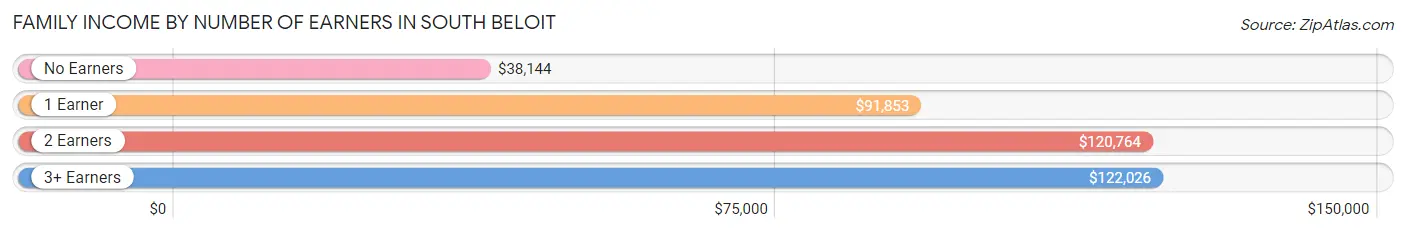
| Number of Earners | # Families | Median Income |
| No Earners | 197 (10.3%) | $38,144 |
| 1 Earner | 462 (24.2%) | $91,853 |
| 2 Earners | 1,147 (60.0%) | $120,764 |
| 3+ Earners | 105 (5.5%) | $122,026 |
| Total | 1,911 (100.0%) | $102,837 |
Household Income in South Beloit
Household Income Brackets in South Beloit
With 893 households falling in the category, the $100,000 to $149,999 income range is the most frequent in South Beloit, accounting for 27.6% of all households. In contrast, only 58 households (1.8%) fall into the less than $10,000 income bracket, making it the least populous group.
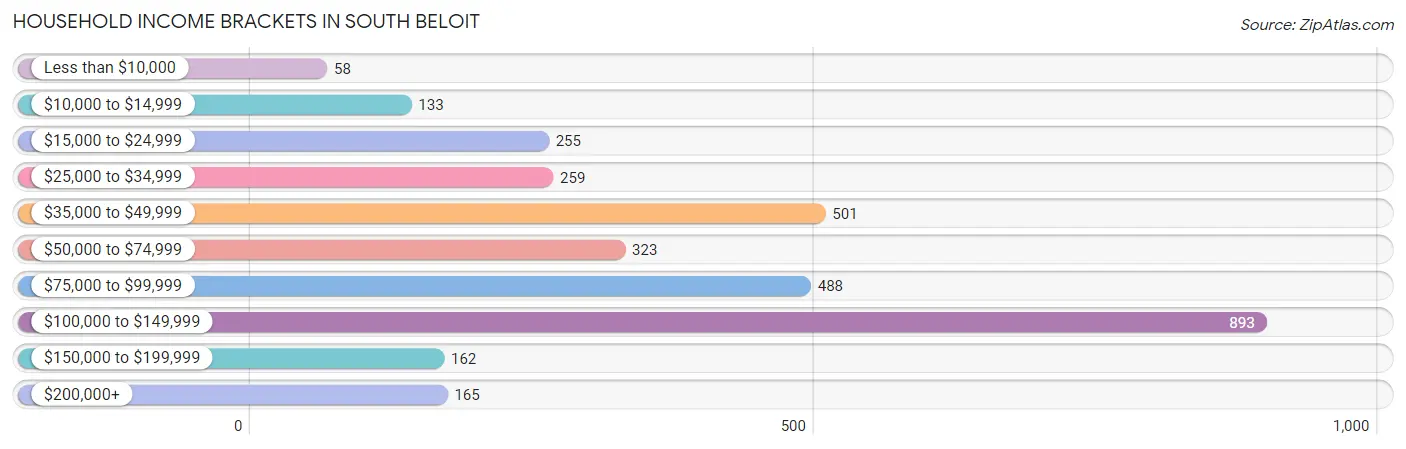
| Income Bracket | # Households | % Households |
| Less than $10,000 | 58 | 1.8% |
| $10,000 to $14,999 | 133 | 4.1% |
| $15,000 to $24,999 | 255 | 7.9% |
| $25,000 to $34,999 | 259 | 8.0% |
| $35,000 to $49,999 | 501 | 15.5% |
| $50,000 to $74,999 | 323 | 10.0% |
| $75,000 to $99,999 | 488 | 15.1% |
| $100,000 to $149,999 | 893 | 27.6% |
| $150,000 to $199,999 | 162 | 5.0% |
| $200,000+ | 165 | 5.1% |
Household Income by Householder Age in South Beloit
The median household income in South Beloit is $78,781, with the highest median household income of $104,281 found in the 25 to 44 years age bracket for the primary householder. A total of 1,228 households (38.0%) fall into this category. Meanwhile, the 15 to 24 years age bracket for the primary householder has the lowest median household income of $0, with 186 households (5.8%) in this group.
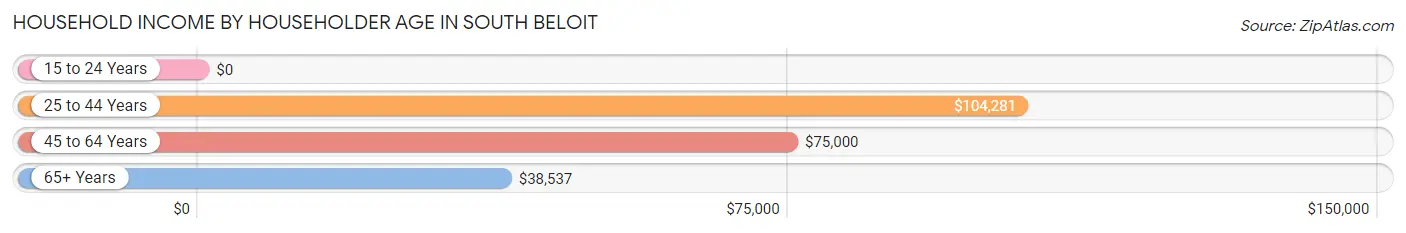
| Income Bracket | # Households | Median Income |
| 15 to 24 Years | 186 (5.8%) | $0 |
| 25 to 44 Years | 1,228 (38.0%) | $104,281 |
| 45 to 64 Years | 1,140 (35.2%) | $75,000 |
| 65+ Years | 680 (21.0%) | $38,537 |
| Total | 3,234 (100.0%) | $78,781 |
Poverty in South Beloit
Income Below Poverty by Sex and Age in South Beloit
With 9.8% poverty level for males and 7.8% for females among the residents of South Beloit, 16 and 17 year old males and 55 to 64 year old females are the most vulnerable to poverty, with 24 males (100.0%) and 82 females (18.4%) in their respective age groups living below the poverty level.
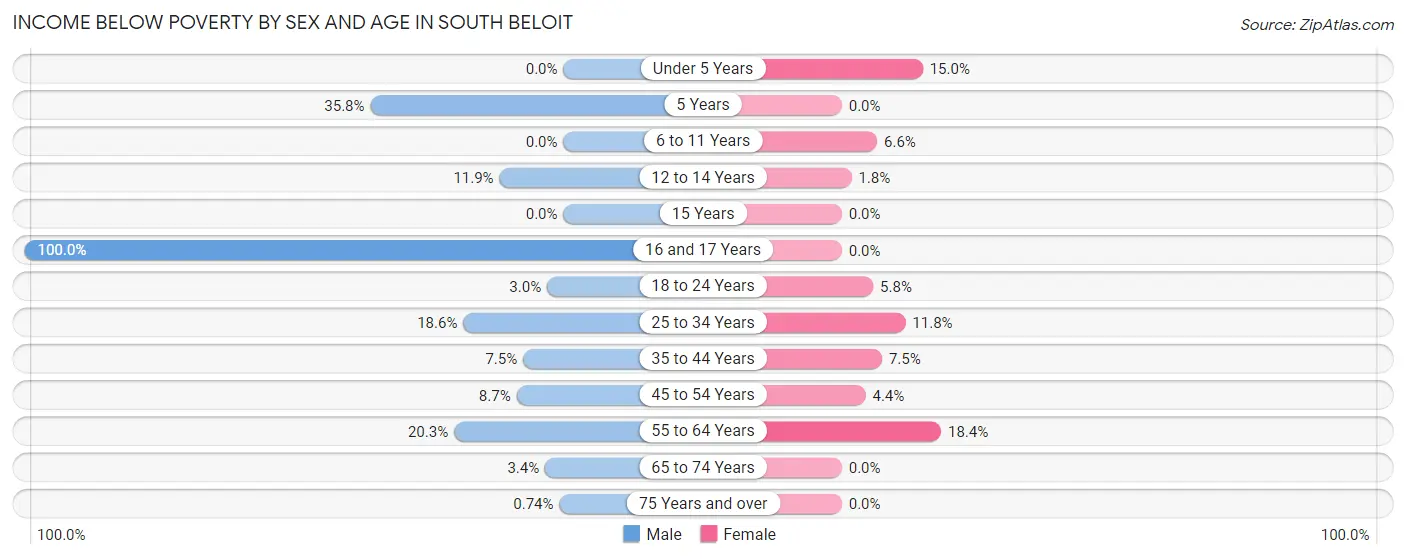
| Age Bracket | Male | Female |
| Under 5 Years | 0 (0.0%) | 50 (15.0%) |
| 5 Years | 24 (35.8%) | 0 (0.0%) |
| 6 to 11 Years | 0 (0.0%) | 23 (6.6%) |
| 12 to 14 Years | 7 (11.9%) | 6 (1.8%) |
| 15 Years | 0 (0.0%) | 0 (0.0%) |
| 16 and 17 Years | 24 (100.0%) | 0 (0.0%) |
| 18 to 24 Years | 7 (3.0%) | 17 (5.8%) |
| 25 to 34 Years | 107 (18.6%) | 75 (11.8%) |
| 35 to 44 Years | 48 (7.5%) | 41 (7.4%) |
| 45 to 54 Years | 54 (8.7%) | 20 (4.4%) |
| 55 to 64 Years | 94 (20.3%) | 82 (18.4%) |
| 65 to 74 Years | 8 (3.4%) | 0 (0.0%) |
| 75 Years and over | 1 (0.7%) | 0 (0.0%) |
| Total | 374 (9.8%) | 314 (7.8%) |
Income Above Poverty by Sex and Age in South Beloit
According to the poverty statistics in South Beloit, males aged under 5 years and females aged 5 years are the age groups that are most secure financially, with 100.0% of males and 100.0% of females in these age groups living above the poverty line.
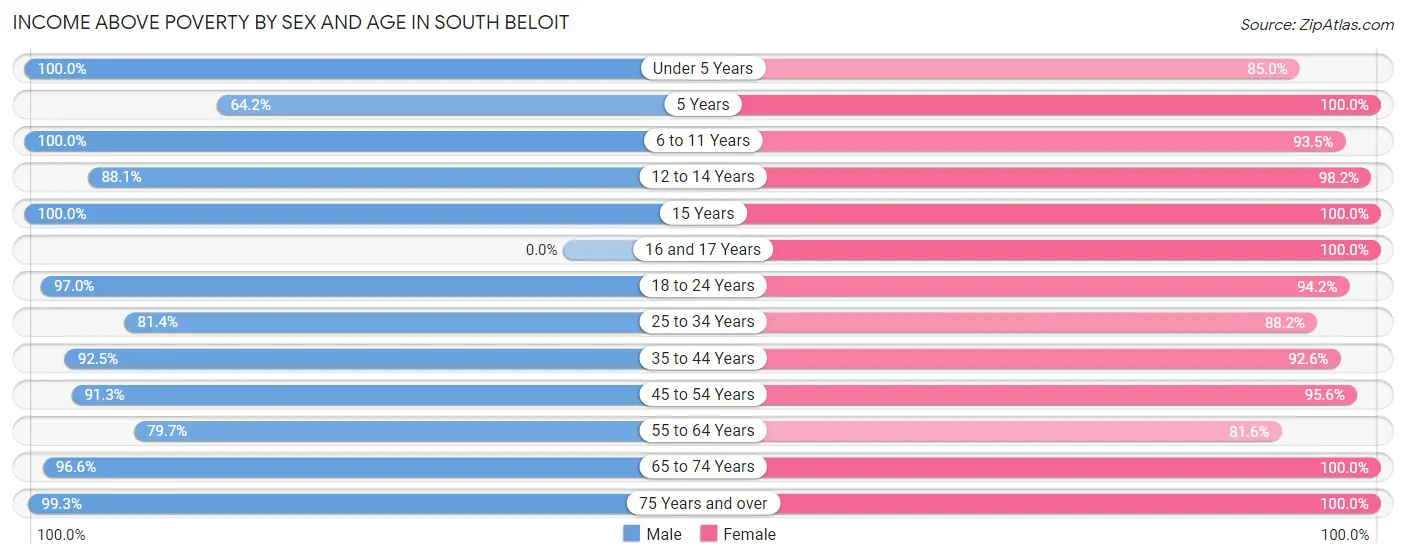
| Age Bracket | Male | Female |
| Under 5 Years | 259 (100.0%) | 283 (85.0%) |
| 5 Years | 43 (64.2%) | 25 (100.0%) |
| 6 to 11 Years | 451 (100.0%) | 328 (93.4%) |
| 12 to 14 Years | 52 (88.1%) | 329 (98.2%) |
| 15 Years | 51 (100.0%) | 27 (100.0%) |
| 16 and 17 Years | 0 (0.0%) | 89 (100.0%) |
| 18 to 24 Years | 223 (97.0%) | 275 (94.2%) |
| 25 to 34 Years | 469 (81.4%) | 560 (88.2%) |
| 35 to 44 Years | 594 (92.5%) | 509 (92.5%) |
| 45 to 54 Years | 567 (91.3%) | 434 (95.6%) |
| 55 to 64 Years | 369 (79.7%) | 363 (81.6%) |
| 65 to 74 Years | 227 (96.6%) | 279 (100.0%) |
| 75 Years and over | 135 (99.3%) | 230 (100.0%) |
| Total | 3,440 (90.2%) | 3,731 (92.2%) |
Income Below Poverty Among Married-Couple Families in South Beloit
The poverty statistics for married-couple families in South Beloit show that 7.9% or 125 of the total 1,590 families live below the poverty line. Families with 3 or 4 children have the highest poverty rate of 17.4%, comprising of 23 families. On the other hand, families with 1 or 2 children have the lowest poverty rate of 0.0%, which includes 0 families.
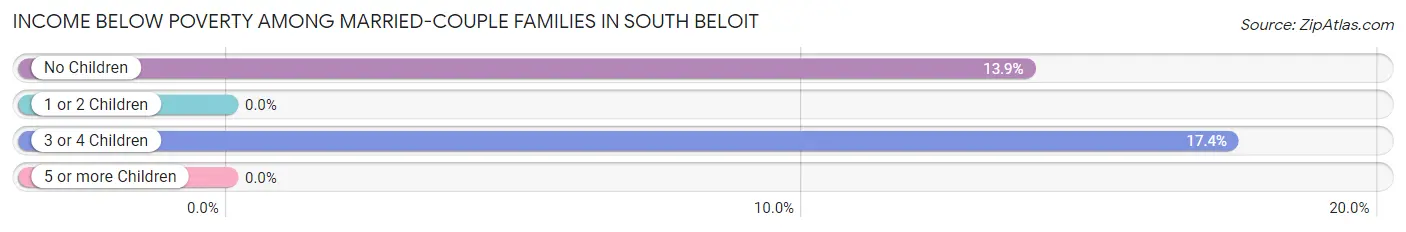
| Children | Above Poverty | Below Poverty |
| No Children | 633 (86.1%) | 102 (13.9%) |
| 1 or 2 Children | 715 (100.0%) | 0 (0.0%) |
| 3 or 4 Children | 109 (82.6%) | 23 (17.4%) |
| 5 or more Children | 8 (100.0%) | 0 (0.0%) |
| Total | 1,465 (92.1%) | 125 (7.9%) |
Income Below Poverty Among Single-Parent Households in South Beloit
According to the poverty data in South Beloit, 23.3% or 28 single-father households and 16.9% or 34 single-mother households are living below the poverty line. Among single-father households, those with 1 or 2 children have the highest poverty rate, with 20 households (30.8%) experiencing poverty. Likewise, among single-mother households, those with 1 or 2 children have the highest poverty rate, with 27 households (20.2%) falling below the poverty line.
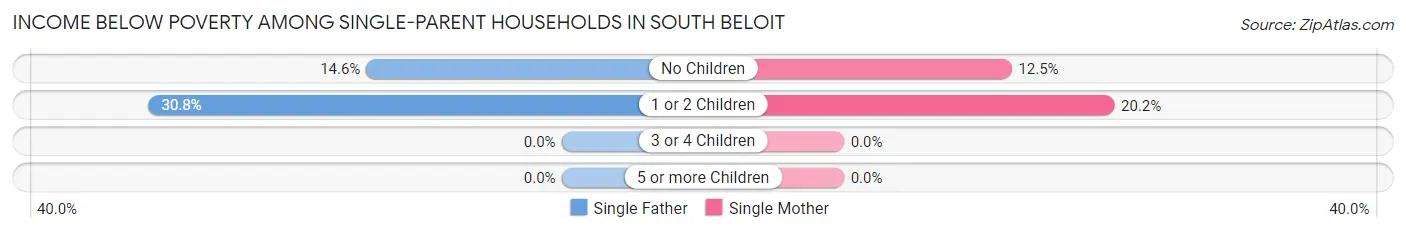
| Children | Single Father | Single Mother |
| No Children | 8 (14.5%) | 7 (12.5%) |
| 1 or 2 Children | 20 (30.8%) | 27 (20.2%) |
| 3 or 4 Children | 0 (0.0%) | 0 (0.0%) |
| 5 or more Children | 0 (0.0%) | 0 (0.0%) |
| Total | 28 (23.3%) | 34 (16.9%) |
Income Below Poverty Among Married-Couple vs Single-Parent Households in South Beloit
The poverty data for South Beloit shows that 125 of the married-couple family households (7.9%) and 62 of the single-parent households (19.3%) are living below the poverty level. Within the married-couple family households, those with 3 or 4 children have the highest poverty rate, with 23 households (17.4%) falling below the poverty line. Among the single-parent households, those with 1 or 2 children have the highest poverty rate, with 47 household (23.6%) living below poverty.
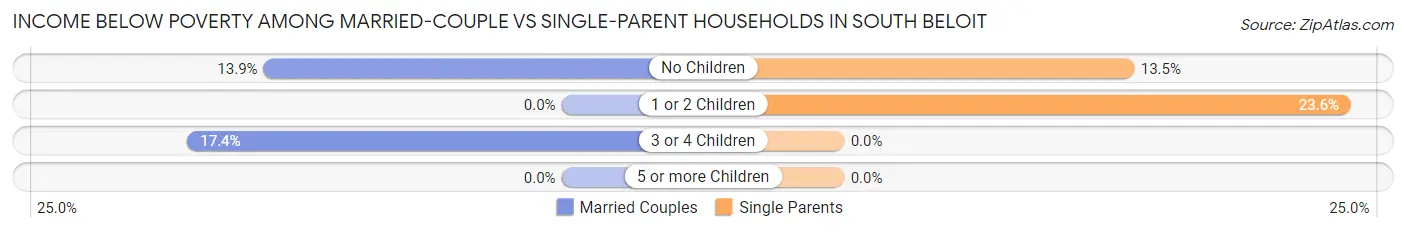
| Children | Married-Couple Families | Single-Parent Households |
| No Children | 102 (13.9%) | 15 (13.5%) |
| 1 or 2 Children | 0 (0.0%) | 47 (23.6%) |
| 3 or 4 Children | 23 (17.4%) | 0 (0.0%) |
| 5 or more Children | 0 (0.0%) | 0 (0.0%) |
| Total | 125 (7.9%) | 62 (19.3%) |
Race in South Beloit
The most populous races in South Beloit are White / Caucasian (6,767 | 85.2%), Hispanic or Latino (597 | 7.5%), and Two or more Races (389 | 4.9%).
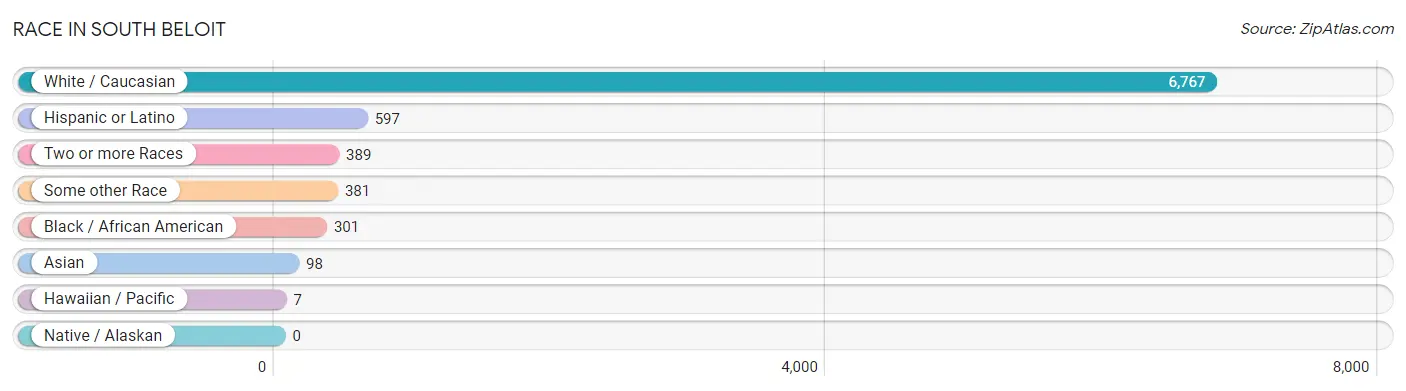
| Race | # Population | % Population |
| Asian | 98 | 1.2% |
| Black / African American | 301 | 3.8% |
| Hawaiian / Pacific | 7 | 0.1% |
| Hispanic or Latino | 597 | 7.5% |
| Native / Alaskan | 0 | 0.0% |
| White / Caucasian | 6,767 | 85.2% |
| Two or more Races | 389 | 4.9% |
| Some other Race | 381 | 4.8% |
| Total | 7,943 | 100.0% |
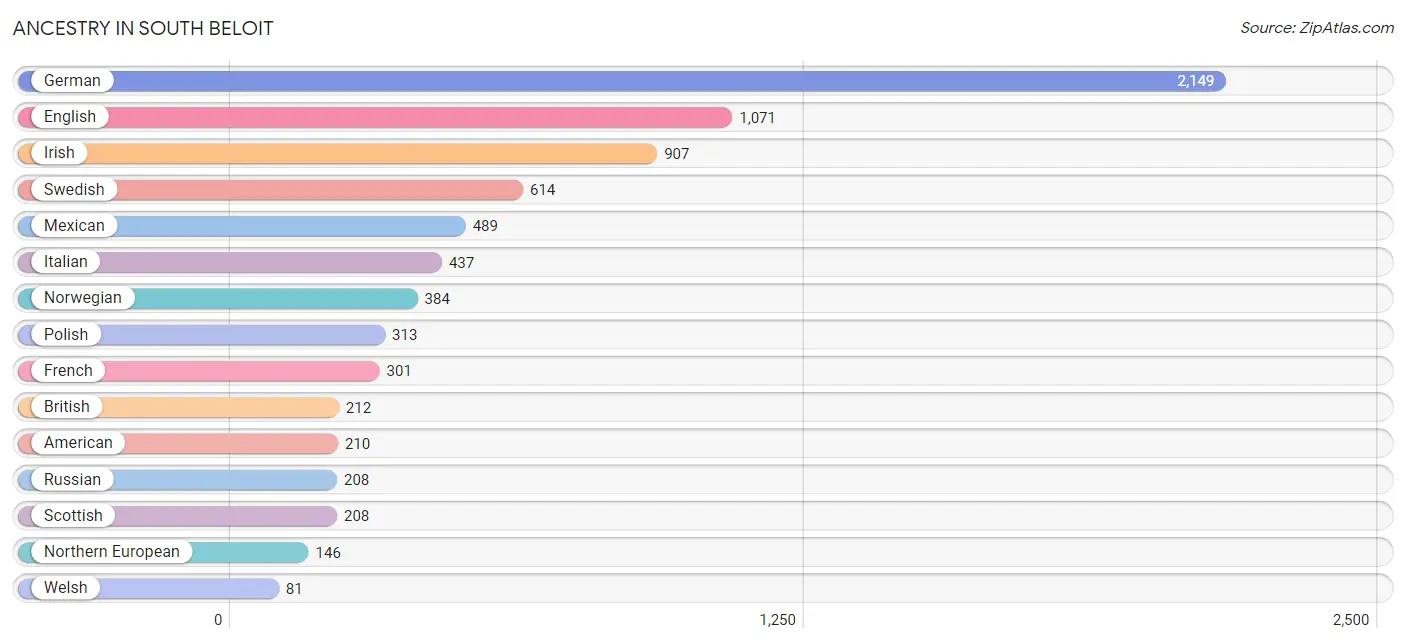
Ancestry in South Beloit
The most populous ancestries reported in South Beloit are German (2,149 | 27.1%), English (1,071 | 13.5%), Irish (907 | 11.4%), Swedish (614 | 7.7%), and Mexican (489 | 6.2%), together accounting for 65.8% of all South Beloit residents.
| Ancestry | # Population | % Population |
| American | 210 | 2.6% |
| Belgian | 19 | 0.2% |
| British | 212 | 2.7% |
| Czech | 51 | 0.6% |
| Danish | 44 | 0.5% |
| Dominican | 75 | 0.9% |
| Dutch | 68 | 0.9% |
| English | 1,071 | 13.5% |
| European | 8 | 0.1% |
| Finnish | 32 | 0.4% |
| French | 301 | 3.8% |
| French American Indian | 6 | 0.1% |
| French Canadian | 7 | 0.1% |
| German | 2,149 | 27.1% |
| Indian (Asian) | 78 | 1.0% |
| Irish | 907 | 11.4% |
| Italian | 437 | 5.5% |
| Korean | 20 | 0.3% |
| Mexican | 489 | 6.2% |
| Northern European | 146 | 1.8% |
| Norwegian | 384 | 4.8% |
| Polish | 313 | 3.9% |
| Puerto Rican | 14 | 0.2% |
| Russian | 208 | 2.6% |
| Samoan | 30 | 0.4% |
| Scandinavian | 65 | 0.8% |
| Scotch-Irish | 15 | 0.2% |
| Scottish | 208 | 2.6% |
| Slovak | 9 | 0.1% |
| Swedish | 614 | 7.7% |
| Swiss | 20 | 0.3% |
| Welsh | 81 | 1.0% | View All 32 Rows |
Immigrants in South Beloit
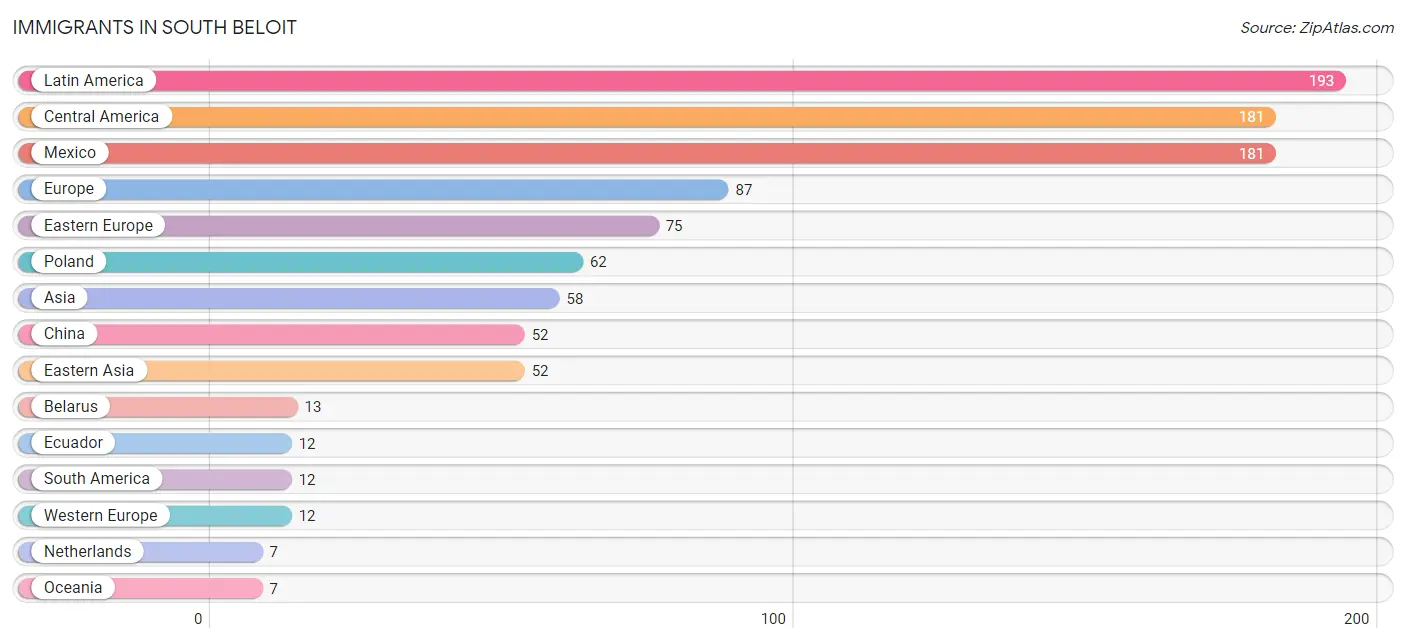
The most numerous immigrant groups reported in South Beloit came from Latin America (193 | 2.4%), Central America (181 | 2.3%), Mexico (181 | 2.3%), Europe (87 | 1.1%), and Eastern Europe (75 | 0.9%), together accounting for 9.0% of all South Beloit residents.
| Immigration Origin | # Population | % Population |
| Asia | 58 | 0.7% |
| Belarus | 13 | 0.2% |
| Central America | 181 | 2.3% |
| China | 52 | 0.6% |
| Eastern Asia | 52 | 0.6% |
| Eastern Europe | 75 | 0.9% |
| Ecuador | 12 | 0.2% |
| Europe | 87 | 1.1% |
| Germany | 5 | 0.1% |
| Latin America | 193 | 2.4% |
| Mexico | 181 | 2.3% |
| Netherlands | 7 | 0.1% |
| Oceania | 7 | 0.1% |
| Poland | 62 | 0.8% |
| South America | 12 | 0.2% |
| South Eastern Asia | 6 | 0.1% |
| Vietnam | 6 | 0.1% |
| Western Europe | 12 | 0.2% | View All 18 Rows |
Sex and Age in South Beloit
Sex and Age in South Beloit
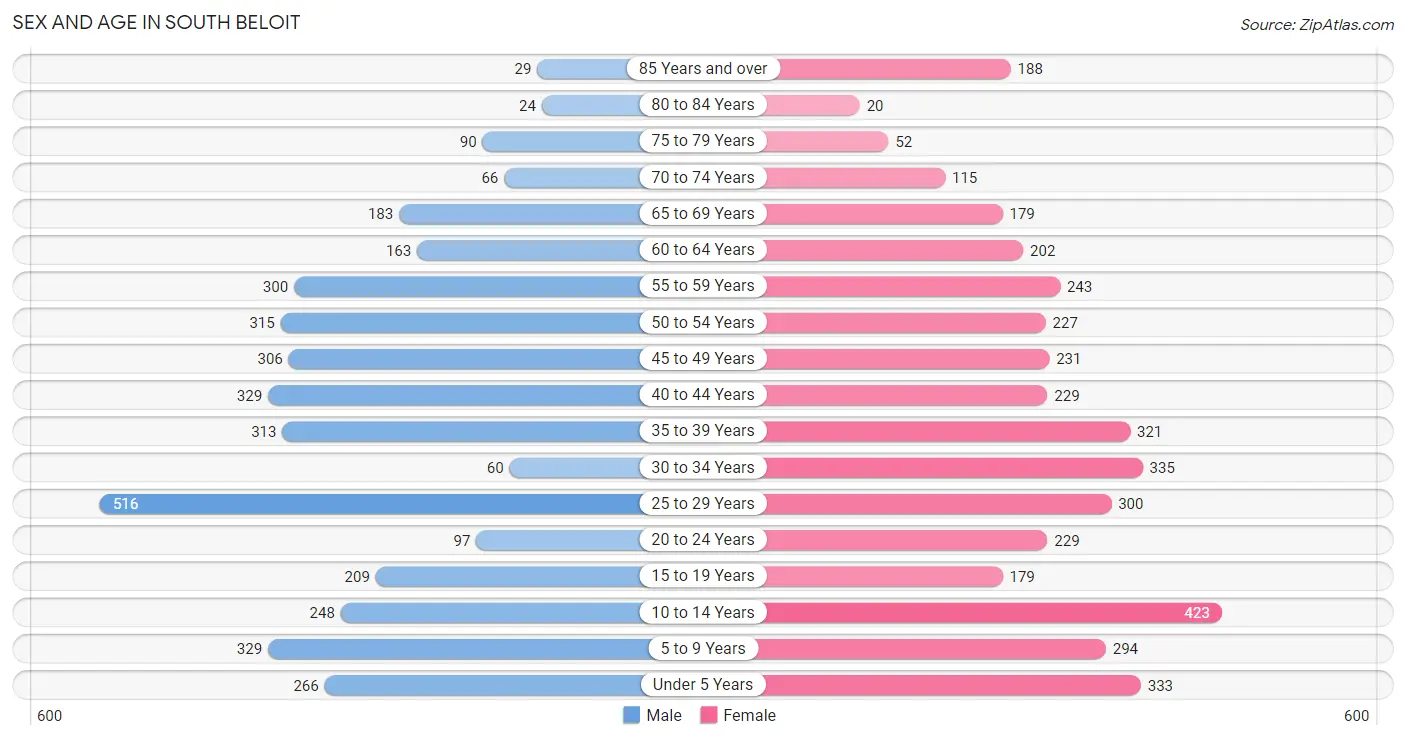
The most populous age groups in South Beloit are 25 to 29 Years (516 | 13.4%) for men and 10 to 14 Years (423 | 10.3%) for women.
| Age Bracket | Male | Female |
| Under 5 Years | 266 (6.9%) | 333 (8.1%) |
| 5 to 9 Years | 329 (8.6%) | 294 (7.2%) |
| 10 to 14 Years | 248 (6.5%) | 423 (10.3%) |
| 15 to 19 Years | 209 (5.4%) | 179 (4.4%) |
| 20 to 24 Years | 97 (2.5%) | 229 (5.6%) |
| 25 to 29 Years | 516 (13.4%) | 300 (7.3%) |
| 30 to 34 Years | 60 (1.6%) | 335 (8.2%) |
| 35 to 39 Years | 313 (8.1%) | 321 (7.8%) |
| 40 to 44 Years | 329 (8.6%) | 229 (5.6%) |
| 45 to 49 Years | 306 (8.0%) | 231 (5.6%) |
| 50 to 54 Years | 315 (8.2%) | 227 (5.5%) |
| 55 to 59 Years | 300 (7.8%) | 243 (5.9%) |
| 60 to 64 Years | 163 (4.2%) | 202 (4.9%) |
| 65 to 69 Years | 183 (4.8%) | 179 (4.4%) |
| 70 to 74 Years | 66 (1.7%) | 115 (2.8%) |
| 75 to 79 Years | 90 (2.3%) | 52 (1.3%) |
| 80 to 84 Years | 24 (0.6%) | 20 (0.5%) |
| 85 Years and over | 29 (0.7%) | 188 (4.6%) |
| Total | 3,843 (100.0%) | 4,100 (100.0%) |
Families and Households in South Beloit
Median Family Size in South Beloit
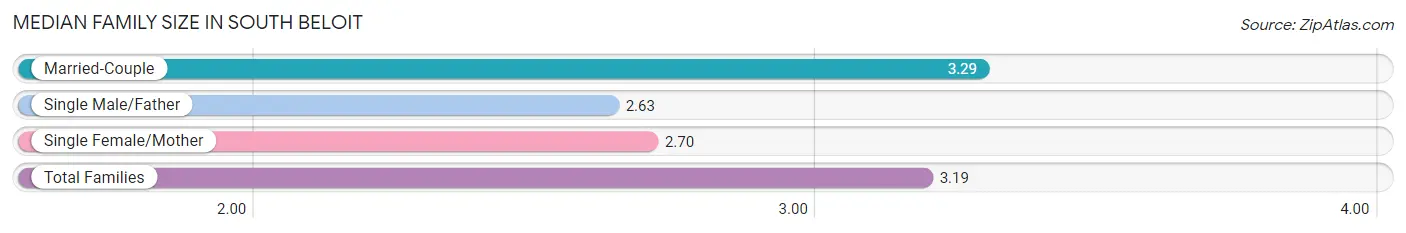
The median family size in South Beloit is 3.19 persons per family, with married-couple families (1,590 | 83.2%) accounting for the largest median family size of 3.29 persons per family. On the other hand, single male/father families (120 | 6.3%) represent the smallest median family size with 2.63 persons per family.
| Family Type | # Families | Family Size |
| Married-Couple | 1,590 (83.2%) | 3.29 |
| Single Male/Father | 120 (6.3%) | 2.63 |
| Single Female/Mother | 201 (10.5%) | 2.70 |
| Total Families | 1,911 (100.0%) | 3.19 |
Median Household Size in South Beloit
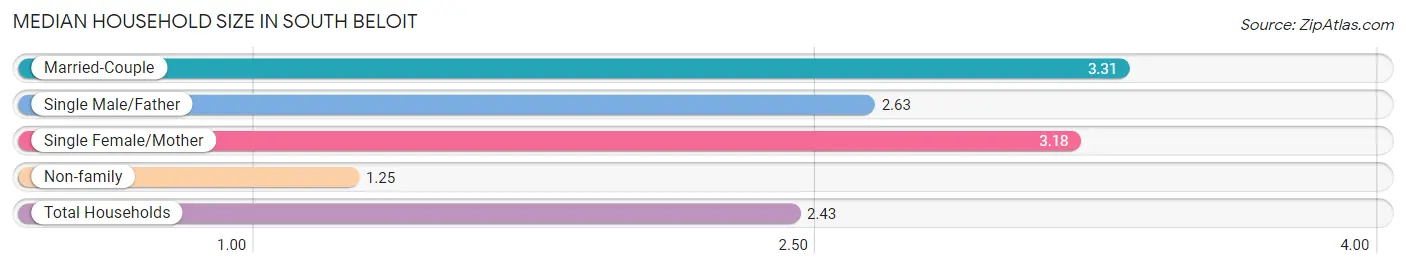
The median household size in South Beloit is 2.43 persons per household, with married-couple households (1,590 | 49.2%) accounting for the largest median household size of 3.31 persons per household. non-family households (1,323 | 40.9%) represent the smallest median household size with 1.25 persons per household.
| Household Type | # Households | Household Size |
| Married-Couple | 1,590 (49.2%) | 3.31 |
| Single Male/Father | 120 (3.7%) | 2.63 |
| Single Female/Mother | 201 (6.2%) | 3.18 |
| Non-family | 1,323 (40.9%) | 1.25 |
| Total Households | 3,234 (100.0%) | 2.43 |
Household Size by Marriage Status in South Beloit
Out of a total of 3,234 households in South Beloit, 1,911 (59.1%) are family households, while 1,323 (40.9%) are nonfamily households. The most numerous type of family households are 2-person households, comprising 692, and the most common type of nonfamily households are 1-person households, comprising 1,031.
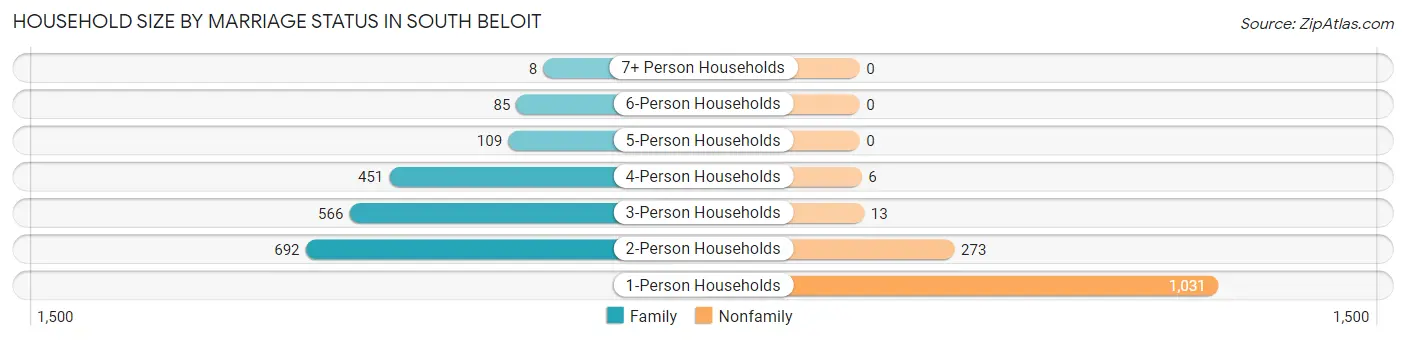
| Household Size | Family Households | Nonfamily Households |
| 1-Person Households | - | 1,031 (31.9%) |
| 2-Person Households | 692 (21.4%) | 273 (8.4%) |
| 3-Person Households | 566 (17.5%) | 13 (0.4%) |
| 4-Person Households | 451 (14.0%) | 6 (0.2%) |
| 5-Person Households | 109 (3.4%) | 0 (0.0%) |
| 6-Person Households | 85 (2.6%) | 0 (0.0%) |
| 7+ Person Households | 8 (0.3%) | 0 (0.0%) |
| Total | 1,911 (59.1%) | 1,323 (40.9%) |
Female Fertility in South Beloit
Fertility by Age in South Beloit
Average fertility rate in South Beloit is 63.0 births per 1,000 women. Women in the age bracket of 20 to 34 years have the highest fertility rate with 141.0 births per 1,000 women. Women in the age bracket of 20 to 34 years acount for 100.0% of all women with births.
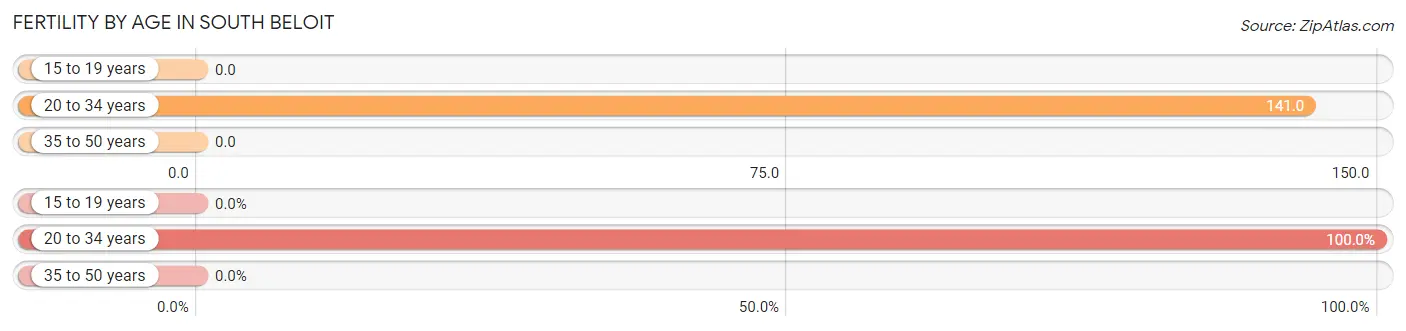
| Age Bracket | Women with Births | Births / 1,000 Women |
| 15 to 19 years | 0 (0.0%) | 0.0 |
| 20 to 34 years | 122 (100.0%) | 141.0 |
| 35 to 50 years | 0 (0.0%) | 0.0 |
| Total | 122 (100.0%) | 63.0 |
Fertility by Age by Marriage Status in South Beloit
49.2% of women with births (122) in South Beloit are married. The highest percentage of unmarried women with births falls into 20 to 34 years age bracket with 50.8% of them unmarried at the time of birth, while the lowest percentage of unmarried women with births belong to 20 to 34 years age bracket with 50.8% of them unmarried.
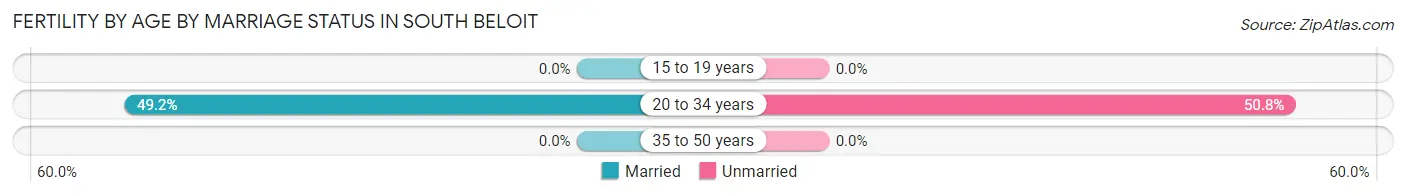
| Age Bracket | Married | Unmarried |
| 15 to 19 years | 0 (0.0%) | 0 (0.0%) |
| 20 to 34 years | 60 (49.2%) | 62 (50.8%) |
| 35 to 50 years | 0 (0.0%) | 0 (0.0%) |
| Total | 60 (49.2%) | 62 (50.8%) |
Fertility by Education in South Beloit
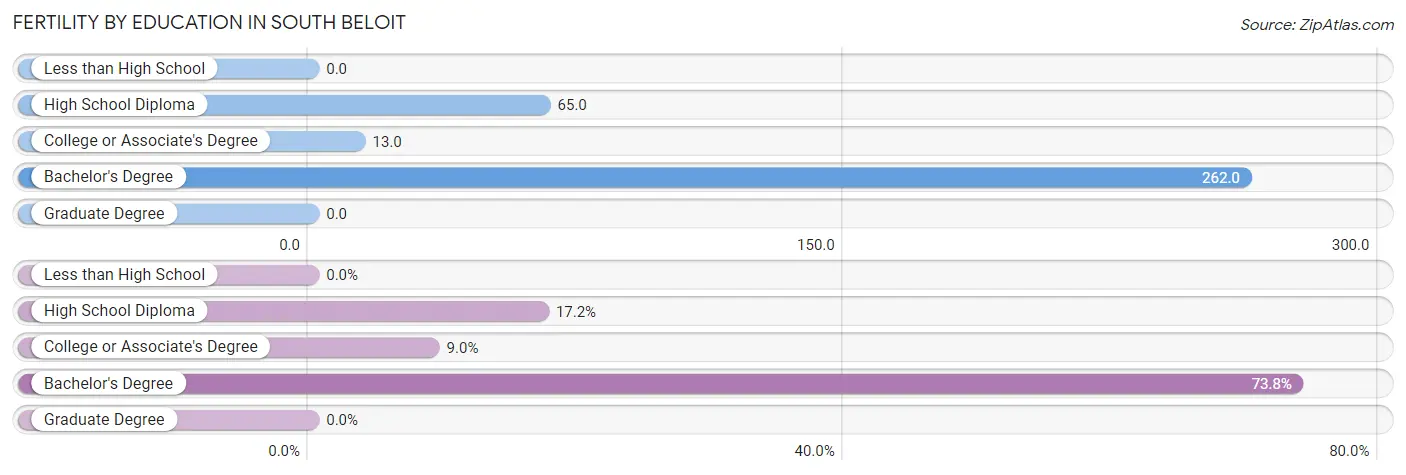
| Educational Attainment | Women with Births | Births / 1,000 Women |
| Less than High School | 0 (0.0%) | 0.0 |
| High School Diploma | 21 (17.2%) | 65.0 |
| College or Associate's Degree | 11 (9.0%) | 13.0 |
| Bachelor's Degree | 90 (73.8%) | 262.0 |
| Graduate Degree | 0 (0.0%) | 0.0 |
| Total | 122 (100.0%) | 63.0 |
Fertility by Education by Marriage Status in South Beloit
50.8% of women with births in South Beloit are unmarried. Women with the educational attainment of high school diploma are most likely to be married with 100.0% of them married at childbirth, while women with the educational attainment of college or associate's degree are least likely to be married with 100.0% of them unmarried at childbirth.
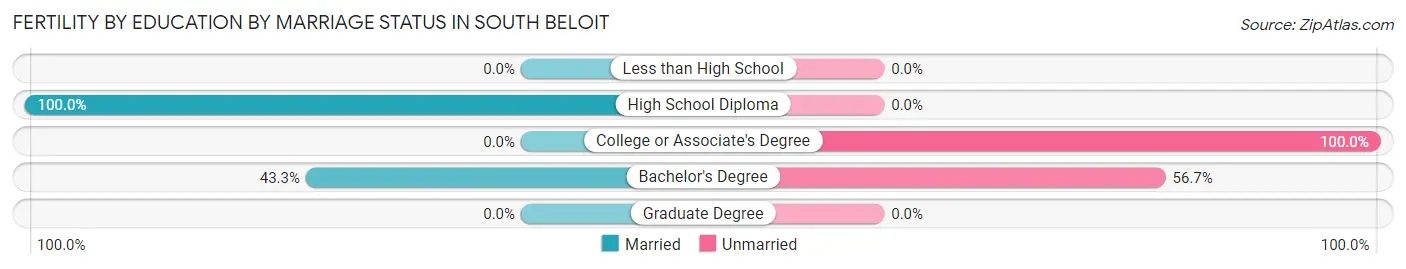
| Educational Attainment | Married | Unmarried |
| Less than High School | 0 (0.0%) | 0 (0.0%) |
| High School Diploma | 21 (100.0%) | 0 (0.0%) |
| College or Associate's Degree | 0 (0.0%) | 11 (100.0%) |
| Bachelor's Degree | 39 (43.3%) | 51 (56.7%) |
| Graduate Degree | 0 (0.0%) | 0 (0.0%) |
| Total | 60 (49.2%) | 62 (50.8%) |
Employment Characteristics in South Beloit
Employment by Class of Employer in South Beloit
Among the 4,015 employed individuals in South Beloit, private company employees (2,846 | 70.9%), local government employees (379 | 9.4%), and not-for-profit organizations (319 | 8.0%) make up the most common classes of employment.
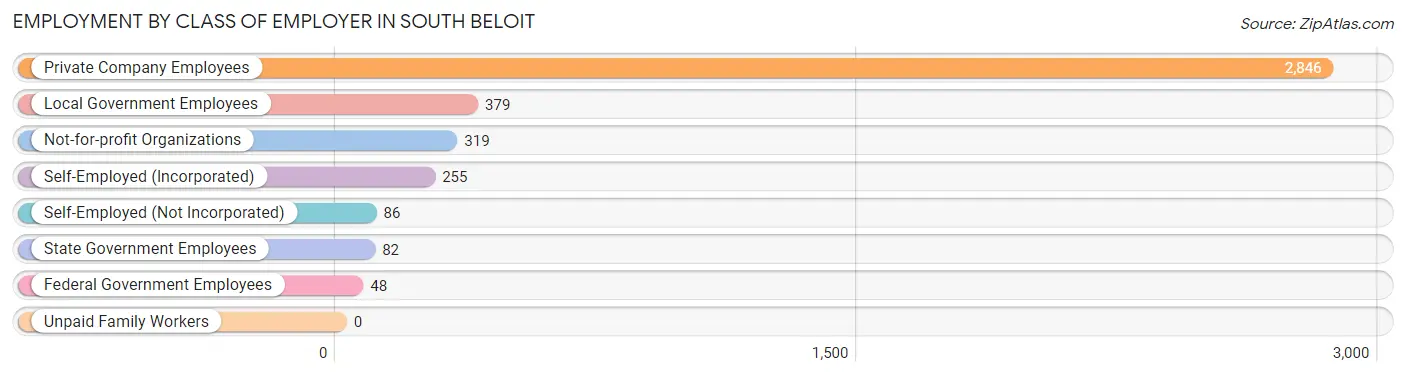
| Employer Class | # Employees | % Employees |
| Private Company Employees | 2,846 | 70.9% |
| Self-Employed (Incorporated) | 255 | 6.4% |
| Self-Employed (Not Incorporated) | 86 | 2.1% |
| Not-for-profit Organizations | 319 | 8.0% |
| Local Government Employees | 379 | 9.4% |
| State Government Employees | 82 | 2.0% |
| Federal Government Employees | 48 | 1.2% |
| Unpaid Family Workers | 0 | 0.0% |
| Total | 4,015 | 100.0% |
Employment Status by Age in South Beloit
According to the labor force statistics for South Beloit, out of the total population over 16 years of age (5,972), 70.9% or 4,234 individuals are in the labor force, with 4.9% or 207 of them unemployed. The age group with the highest labor force participation rate is 20 to 24 years, with 99.7% or 325 individuals in the labor force. Within the labor force, the 20 to 24 years age range has the highest percentage of unemployed individuals, with 31.7% or 103 of them being unemployed.

| Age Bracket | In Labor Force | Unemployed |
| 16 to 19 Years | 190 (61.3%) | 0 (0.0%) |
| 20 to 24 Years | 325 (99.7%) | 103 (31.7%) |
| 25 to 29 Years | 763 (93.5%) | 32 (4.2%) |
| 30 to 34 Years | 328 (83.0%) | 0 (0.0%) |
| 35 to 44 Years | 1,084 (90.9%) | 17 (1.6%) |
| 45 to 54 Years | 870 (80.6%) | 15 (1.7%) |
| 55 to 59 Years | 378 (69.6%) | 41 (10.8%) |
| 60 to 64 Years | 198 (54.2%) | 0 (0.0%) |
| 65 to 74 Years | 68 (12.5%) | 0 (0.0%) |
| 75 Years and over | 34 (8.4%) | 0 (0.0%) |
| Total | 4,234 (70.9%) | 207 (4.9%) |
Employment Status by Educational Attainment in South Beloit
According to labor force statistics for South Beloit, 82.5% of individuals (3,622) out of the total population between 25 and 64 years of age (4,390) are in the labor force, with 2.9% or 105 of them being unemployed. The group with the highest labor force participation rate are those with the educational attainment of bachelor's degree or higher, with 95.8% or 1,144 individuals in the labor force. Within the labor force, individuals with less than high school education have the highest percentage of unemployment, with 8.4% or 26 of them being unemployed.
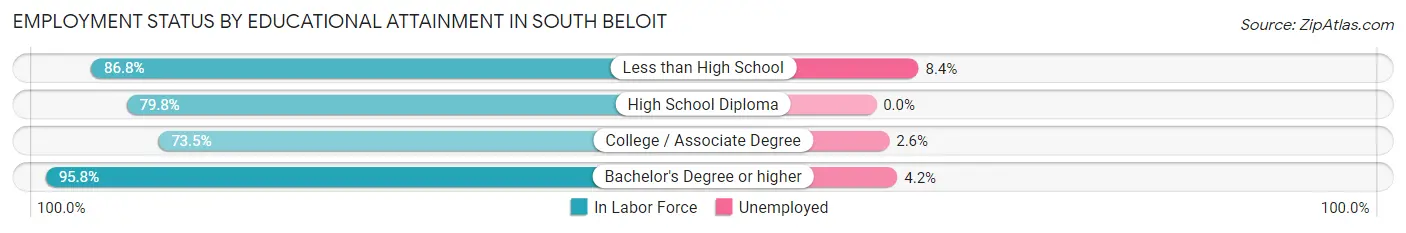
| Educational Attainment | In Labor Force | Unemployed |
| Less than High School | 310 (86.8%) | 30 (8.4%) |
| High School Diploma | 1,005 (79.8%) | 0 (0.0%) |
| College / Associate Degree | 1,161 (73.5%) | 41 (2.6%) |
| Bachelor's Degree or higher | 1,144 (95.8%) | 50 (4.2%) |
| Total | 3,622 (82.5%) | 127 (2.9%) |
Employment Occupations by Sex in South Beloit
Management, Business, Science and Arts Occupations
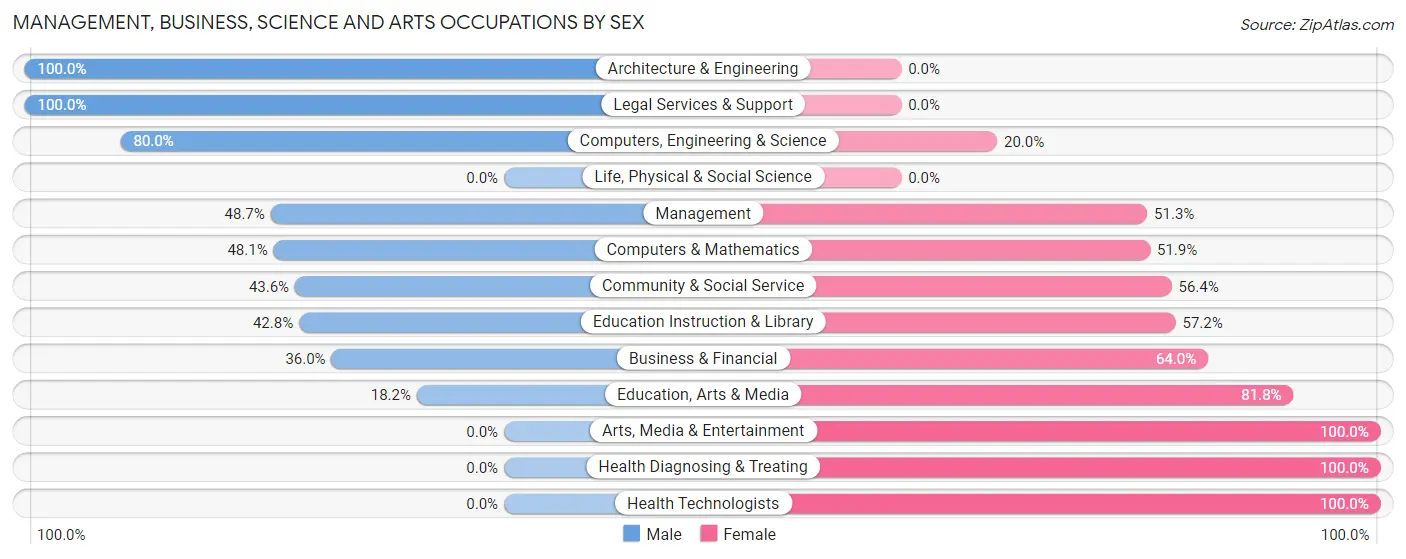
The most common Management, Business, Science and Arts occupations in South Beloit are Community & Social Service (406 | 10.2%), Business & Financial (339 | 8.5%), Education Instruction & Library (304 | 7.6%), Health Diagnosing & Treating (262 | 6.6%), and Management (228 | 5.7%).
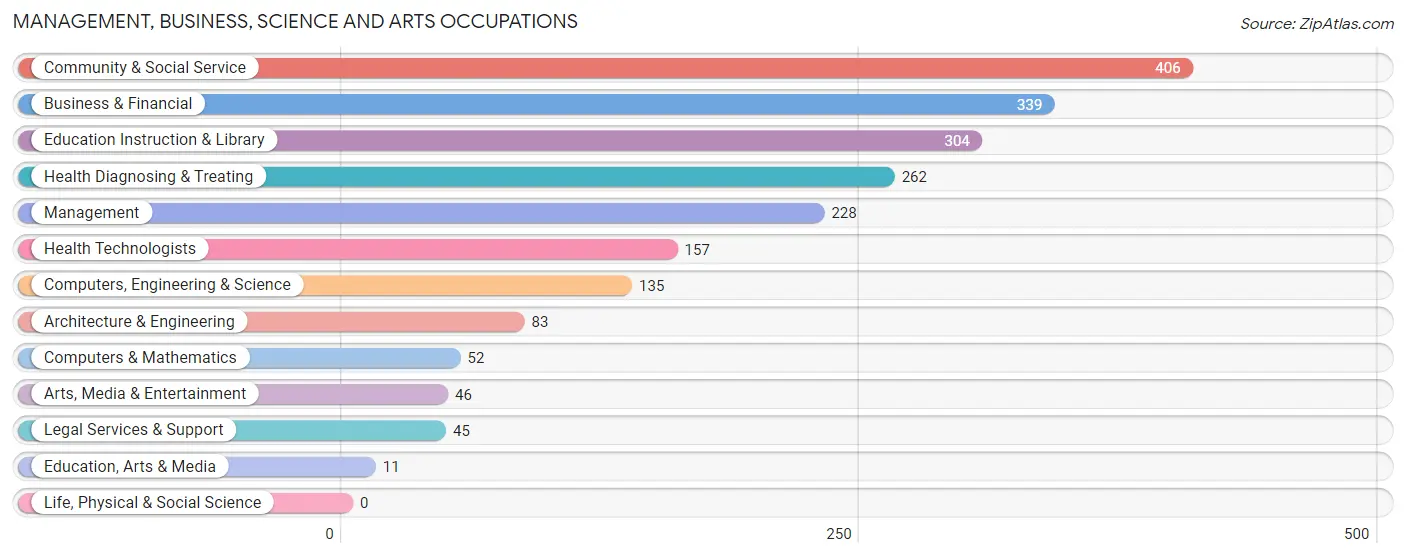
Management, Business, Science and Arts Occupations by Sex
Within the Management, Business, Science and Arts occupations in South Beloit, the most male-oriented occupations are Architecture & Engineering (100.0%), Legal Services & Support (100.0%), and Computers, Engineering & Science (80.0%), while the most female-oriented occupations are Arts, Media & Entertainment (100.0%), Health Diagnosing & Treating (100.0%), and Health Technologists (100.0%).
| Occupation | Male | Female |
| Management | 111 (48.7%) | 117 (51.3%) |
| Business & Financial | 122 (36.0%) | 217 (64.0%) |
| Computers, Engineering & Science | 108 (80.0%) | 27 (20.0%) |
| Computers & Mathematics | 25 (48.1%) | 27 (51.9%) |
| Architecture & Engineering | 83 (100.0%) | 0 (0.0%) |
| Life, Physical & Social Science | 0 (0.0%) | 0 (0.0%) |
| Community & Social Service | 177 (43.6%) | 229 (56.4%) |
| Education, Arts & Media | 2 (18.2%) | 9 (81.8%) |
| Legal Services & Support | 45 (100.0%) | 0 (0.0%) |
| Education Instruction & Library | 130 (42.8%) | 174 (57.2%) |
| Arts, Media & Entertainment | 0 (0.0%) | 46 (100.0%) |
| Health Diagnosing & Treating | 0 (0.0%) | 262 (100.0%) |
| Health Technologists | 0 (0.0%) | 157 (100.0%) |
| Total (Category) | 518 (37.8%) | 852 (62.2%) |
| Total (Overall) | 2,114 (52.9%) | 1,884 (47.1%) |
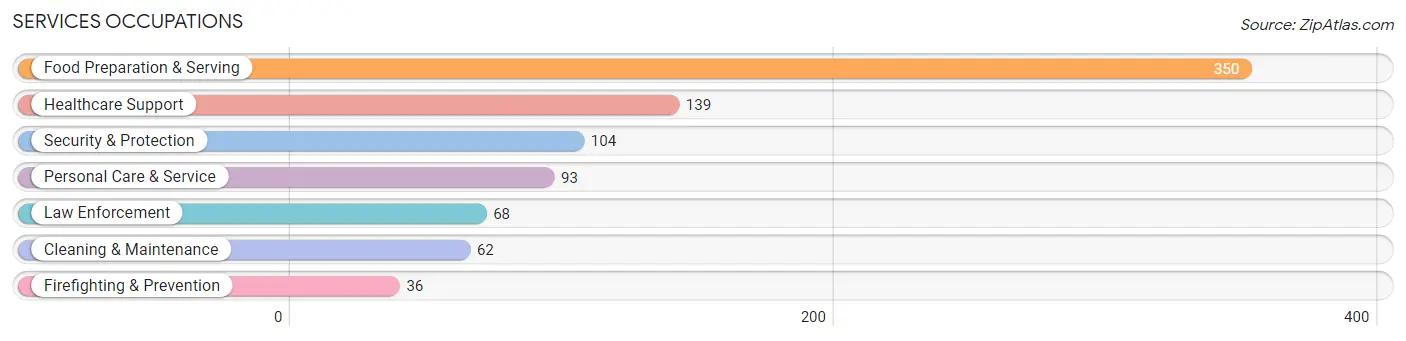
Services Occupations
The most common Services occupations in South Beloit are Food Preparation & Serving (350 | 8.7%), Healthcare Support (139 | 3.5%), Security & Protection (104 | 2.6%), Personal Care & Service (93 | 2.3%), and Law Enforcement (68 | 1.7%).
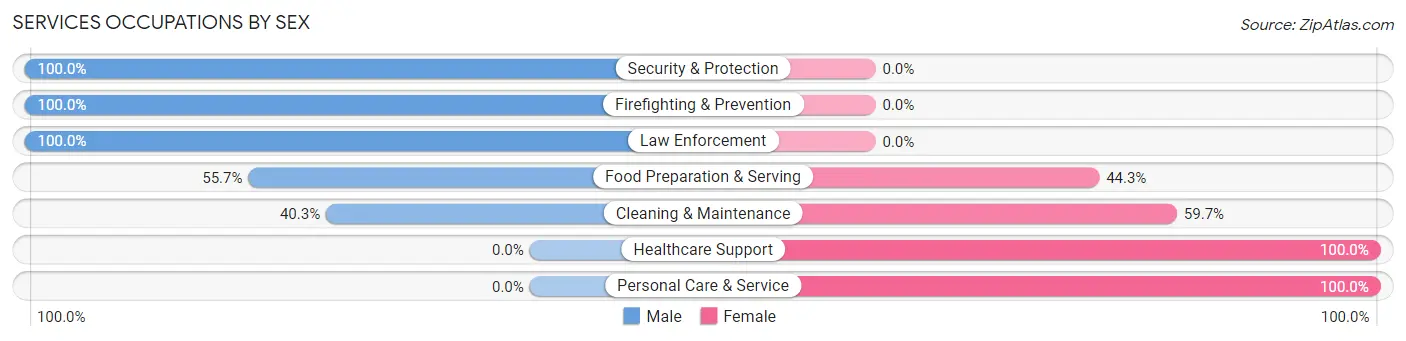
Services Occupations by Sex
Within the Services occupations in South Beloit, the most male-oriented occupations are Security & Protection (100.0%), Firefighting & Prevention (100.0%), and Law Enforcement (100.0%), while the most female-oriented occupations are Healthcare Support (100.0%), Personal Care & Service (100.0%), and Cleaning & Maintenance (59.7%).
| Occupation | Male | Female |
| Healthcare Support | 0 (0.0%) | 139 (100.0%) |
| Security & Protection | 104 (100.0%) | 0 (0.0%) |
| Firefighting & Prevention | 36 (100.0%) | 0 (0.0%) |
| Law Enforcement | 68 (100.0%) | 0 (0.0%) |
| Food Preparation & Serving | 195 (55.7%) | 155 (44.3%) |
| Cleaning & Maintenance | 25 (40.3%) | 37 (59.7%) |
| Personal Care & Service | 0 (0.0%) | 93 (100.0%) |
| Total (Category) | 324 (43.3%) | 424 (56.7%) |
| Total (Overall) | 2,114 (52.9%) | 1,884 (47.1%) |
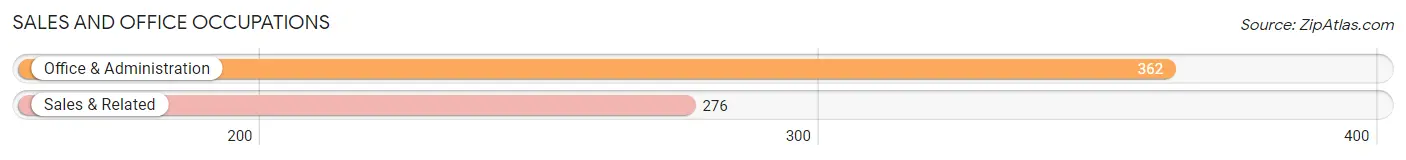
Sales and Office Occupations
The most common Sales and Office occupations in South Beloit are Office & Administration (362 | 9.0%), and Sales & Related (276 | 6.9%).
Sales and Office Occupations by Sex
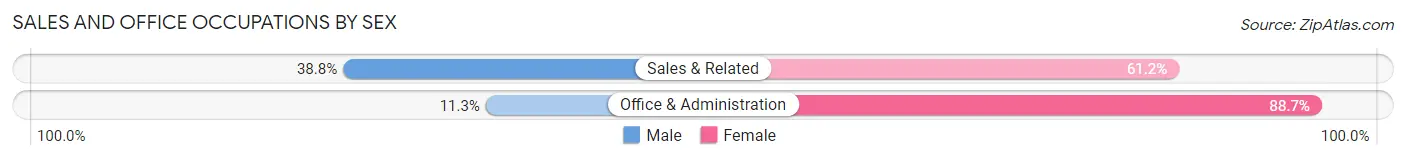
| Occupation | Male | Female |
| Sales & Related | 107 (38.8%) | 169 (61.2%) |
| Office & Administration | 41 (11.3%) | 321 (88.7%) |
| Total (Category) | 148 (23.2%) | 490 (76.8%) |
| Total (Overall) | 2,114 (52.9%) | 1,884 (47.1%) |
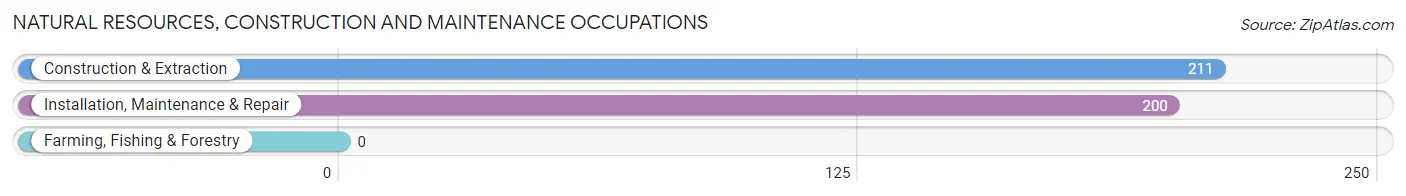
Natural Resources, Construction and Maintenance Occupations
The most common Natural Resources, Construction and Maintenance occupations in South Beloit are Construction & Extraction (211 | 5.3%), and Installation, Maintenance & Repair (200 | 5.0%).
Natural Resources, Construction and Maintenance Occupations by Sex
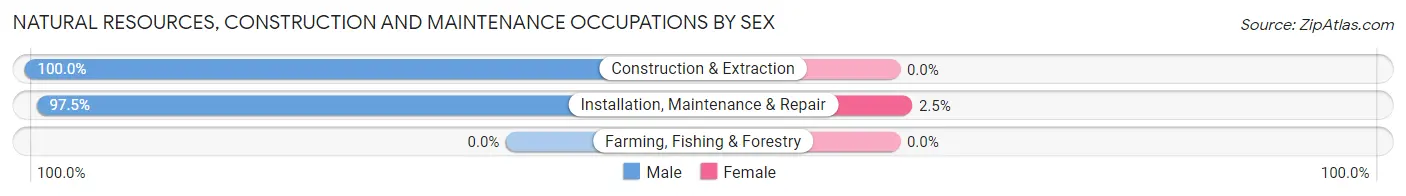
| Occupation | Male | Female |
| Farming, Fishing & Forestry | 0 (0.0%) | 0 (0.0%) |
| Construction & Extraction | 211 (100.0%) | 0 (0.0%) |
| Installation, Maintenance & Repair | 195 (97.5%) | 5 (2.5%) |
| Total (Category) | 406 (98.8%) | 5 (1.2%) |
| Total (Overall) | 2,114 (52.9%) | 1,884 (47.1%) |
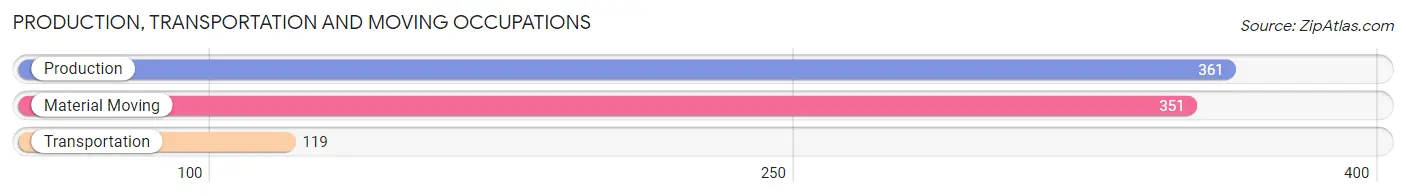
Production, Transportation and Moving Occupations
The most common Production, Transportation and Moving occupations in South Beloit are Production (361 | 9.0%), Material Moving (351 | 8.8%), and Transportation (119 | 3.0%).
Production, Transportation and Moving Occupations by Sex
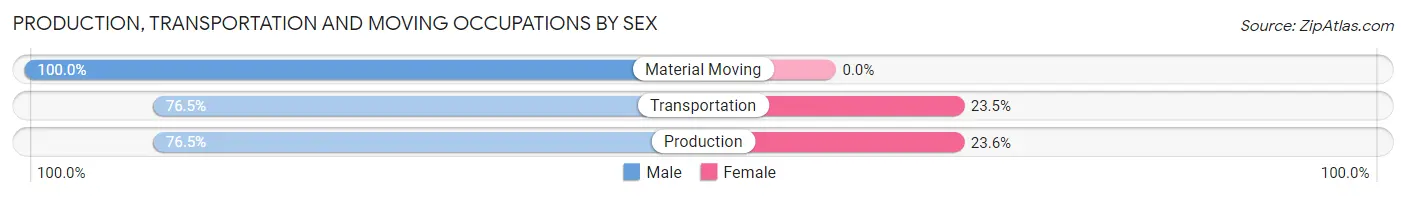
| Occupation | Male | Female |
| Production | 276 (76.4%) | 85 (23.5%) |
| Transportation | 91 (76.5%) | 28 (23.5%) |
| Material Moving | 351 (100.0%) | 0 (0.0%) |
| Total (Category) | 718 (86.4%) | 113 (13.6%) |
| Total (Overall) | 2,114 (52.9%) | 1,884 (47.1%) |
Employment Industries by Sex in South Beloit
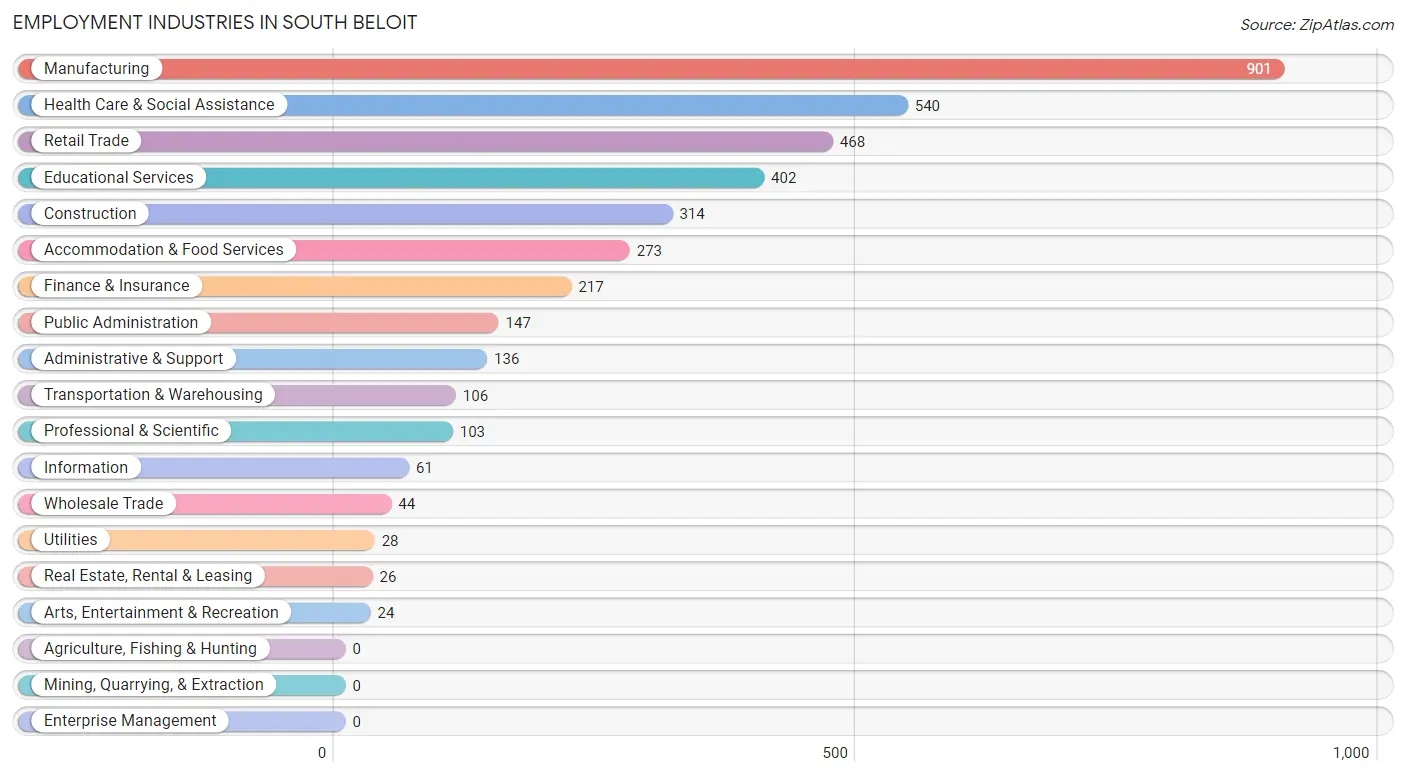
Employment Industries in South Beloit
The major employment industries in South Beloit include Manufacturing (901 | 22.5%), Health Care & Social Assistance (540 | 13.5%), Retail Trade (468 | 11.7%), Educational Services (402 | 10.1%), and Construction (314 | 7.9%).
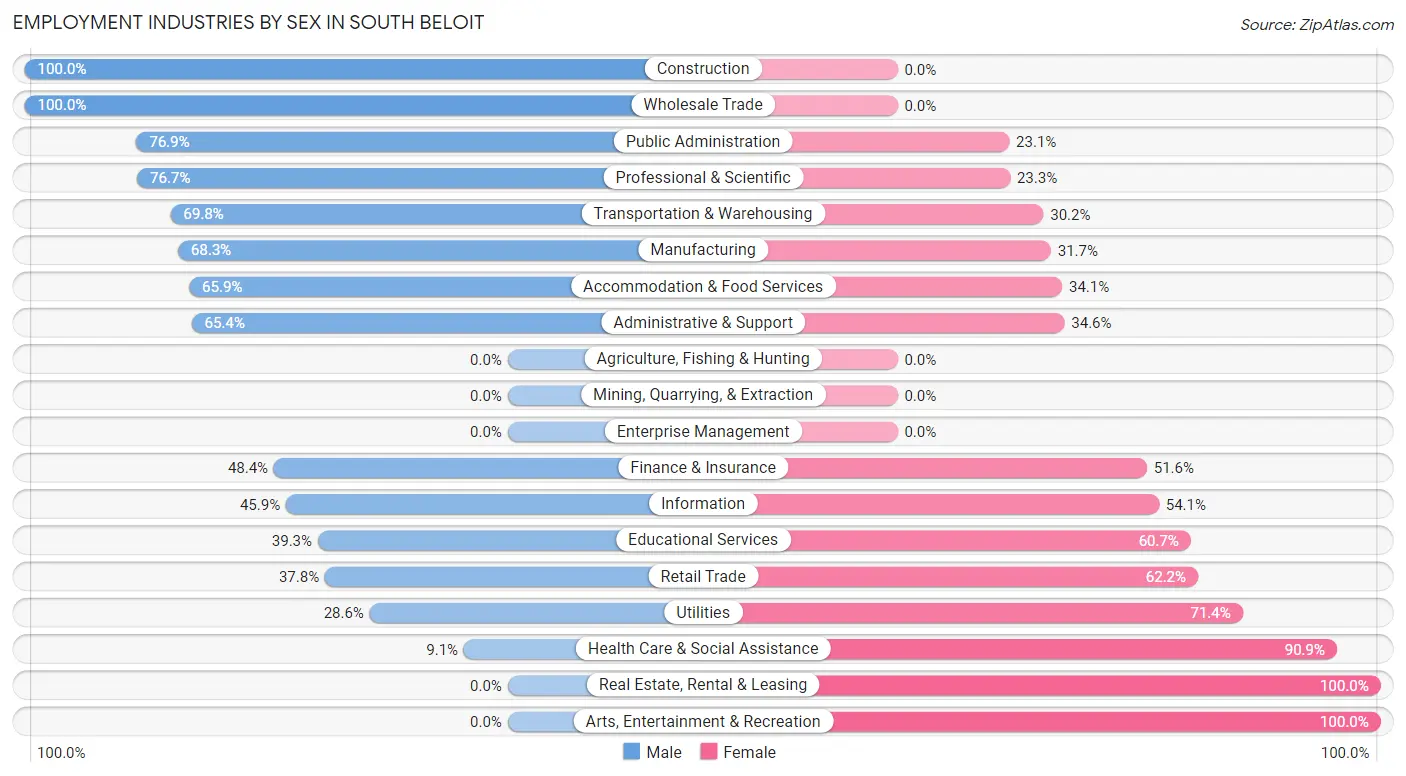
Employment Industries by Sex in South Beloit
The South Beloit industries that see more men than women are Construction (100.0%), Wholesale Trade (100.0%), and Public Administration (76.9%), whereas the industries that tend to have a higher number of women are Real Estate, Rental & Leasing (100.0%), Arts, Entertainment & Recreation (100.0%), and Health Care & Social Assistance (90.9%).
| Industry | Male | Female |
| Agriculture, Fishing & Hunting | 0 (0.0%) | 0 (0.0%) |
| Mining, Quarrying, & Extraction | 0 (0.0%) | 0 (0.0%) |
| Construction | 314 (100.0%) | 0 (0.0%) |
| Manufacturing | 615 (68.3%) | 286 (31.7%) |
| Wholesale Trade | 44 (100.0%) | 0 (0.0%) |
| Retail Trade | 177 (37.8%) | 291 (62.2%) |
| Transportation & Warehousing | 74 (69.8%) | 32 (30.2%) |
| Utilities | 8 (28.6%) | 20 (71.4%) |
| Information | 28 (45.9%) | 33 (54.1%) |
| Finance & Insurance | 105 (48.4%) | 112 (51.6%) |
| Real Estate, Rental & Leasing | 0 (0.0%) | 26 (100.0%) |
| Professional & Scientific | 79 (76.7%) | 24 (23.3%) |
| Enterprise Management | 0 (0.0%) | 0 (0.0%) |
| Administrative & Support | 89 (65.4%) | 47 (34.6%) |
| Educational Services | 158 (39.3%) | 244 (60.7%) |
| Health Care & Social Assistance | 49 (9.1%) | 491 (90.9%) |
| Arts, Entertainment & Recreation | 0 (0.0%) | 24 (100.0%) |
| Accommodation & Food Services | 180 (65.9%) | 93 (34.1%) |
| Public Administration | 113 (76.9%) | 34 (23.1%) |
| Total | 2,114 (52.9%) | 1,884 (47.1%) |
Education in South Beloit
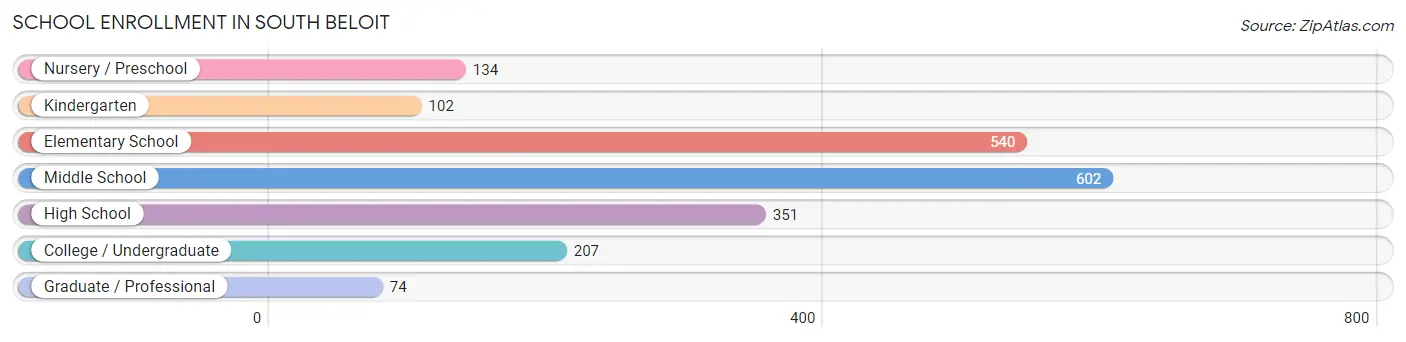
School Enrollment in South Beloit
The most common levels of schooling among the 2,010 students in South Beloit are middle school (602 | 29.9%), elementary school (540 | 26.9%), and high school (351 | 17.5%).
| School Level | # Students | % Students |
| Nursery / Preschool | 134 | 6.7% |
| Kindergarten | 102 | 5.1% |
| Elementary School | 540 | 26.9% |
| Middle School | 602 | 29.9% |
| High School | 351 | 17.5% |
| College / Undergraduate | 207 | 10.3% |
| Graduate / Professional | 74 | 3.7% |
| Total | 2,010 | 100.0% |
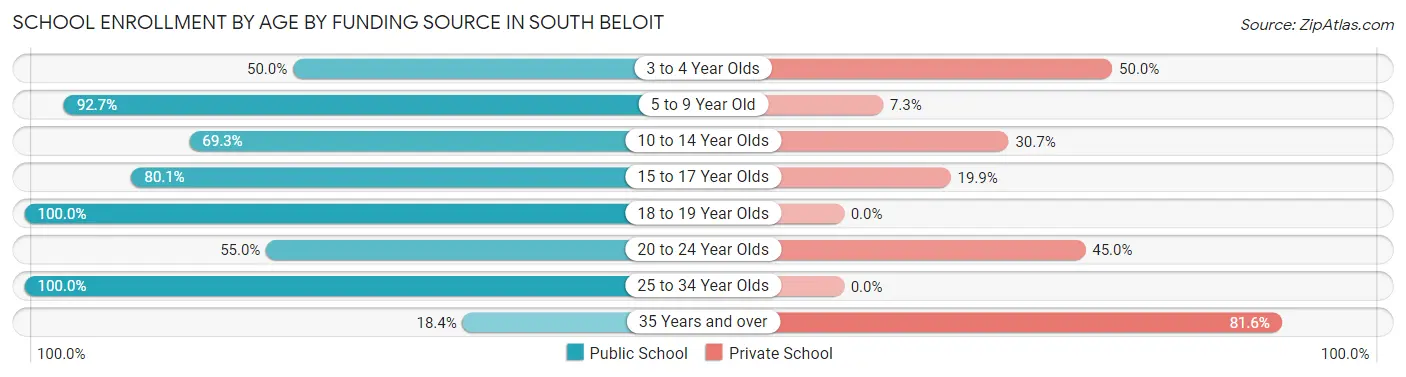
School Enrollment by Age by Funding Source in South Beloit
Out of a total of 2,010 students who are enrolled in schools in South Beloit, 430 (21.4%) attend a private institution, while the remaining 1,580 (78.6%) are enrolled in public schools. The age group of 35 years and over has the highest likelihood of being enrolled in private schools, with 31 (81.6% in the age bracket) enrolled. Conversely, the age group of 18 to 19 year olds has the lowest likelihood of being enrolled in a private school, with 182 (100.0% in the age bracket) attending a public institution.
| Age Bracket | Public School | Private School |
| 3 to 4 Year Olds | 67 (50.0%) | 67 (50.0%) |
| 5 to 9 Year Old | 545 (92.7%) | 43 (7.3%) |
| 10 to 14 Year Olds | 465 (69.3%) | 206 (30.7%) |
| 15 to 17 Year Olds | 153 (80.1%) | 38 (19.9%) |
| 18 to 19 Year Olds | 182 (100.0%) | 0 (0.0%) |
| 20 to 24 Year Olds | 55 (55.0%) | 45 (45.0%) |
| 25 to 34 Year Olds | 106 (100.0%) | 0 (0.0%) |
| 35 Years and over | 7 (18.4%) | 31 (81.6%) |
| Total | 1,580 (78.6%) | 430 (21.4%) |
Educational Attainment by Field of Study in South Beloit
Education (265 | 19.4%), business (191 | 14.0%), bio, nature & agricultural (155 | 11.3%), science & technology (155 | 11.3%), and arts & humanities (133 | 9.7%) are the most common fields of study among 1,367 individuals in South Beloit who have obtained a bachelor's degree or higher.
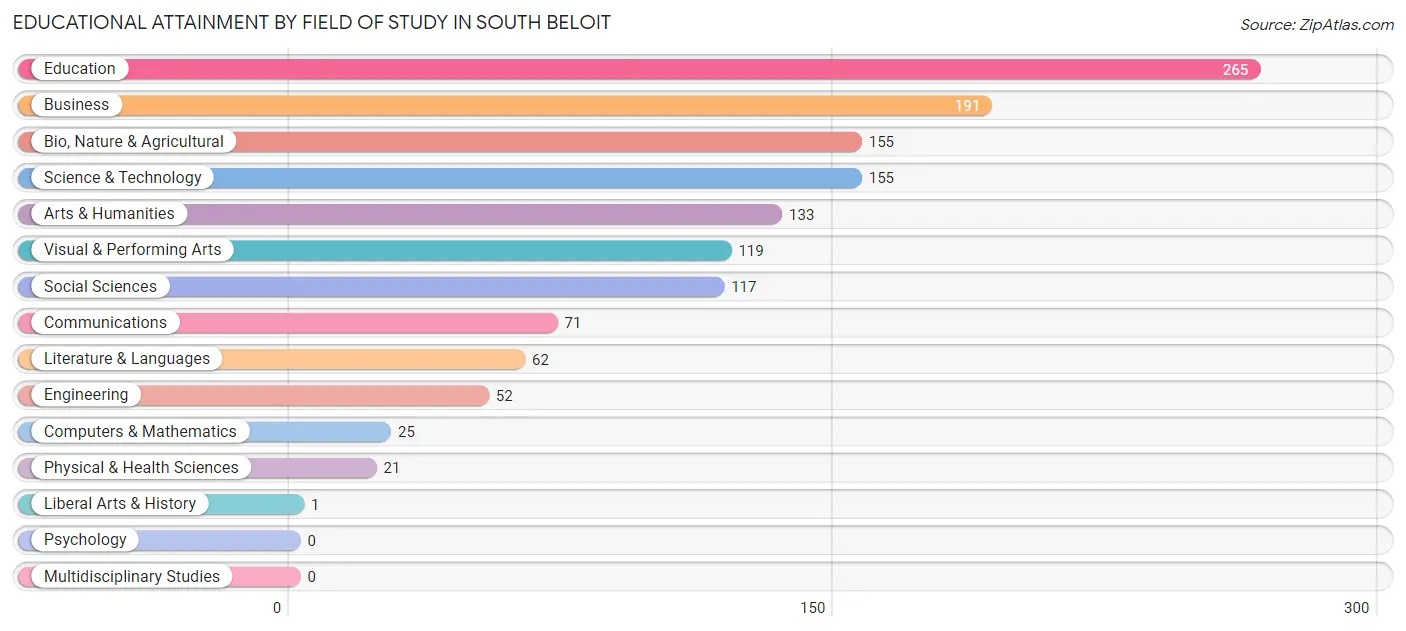
| Field of Study | # Graduates | % Graduates |
| Computers & Mathematics | 25 | 1.8% |
| Bio, Nature & Agricultural | 155 | 11.3% |
| Physical & Health Sciences | 21 | 1.5% |
| Psychology | 0 | 0.0% |
| Social Sciences | 117 | 8.6% |
| Engineering | 52 | 3.8% |
| Multidisciplinary Studies | 0 | 0.0% |
| Science & Technology | 155 | 11.3% |
| Business | 191 | 14.0% |
| Education | 265 | 19.4% |
| Literature & Languages | 62 | 4.5% |
| Liberal Arts & History | 1 | 0.1% |
| Visual & Performing Arts | 119 | 8.7% |
| Communications | 71 | 5.2% |
| Arts & Humanities | 133 | 9.7% |
| Total | 1,367 | 100.0% |
Transportation & Commute in South Beloit
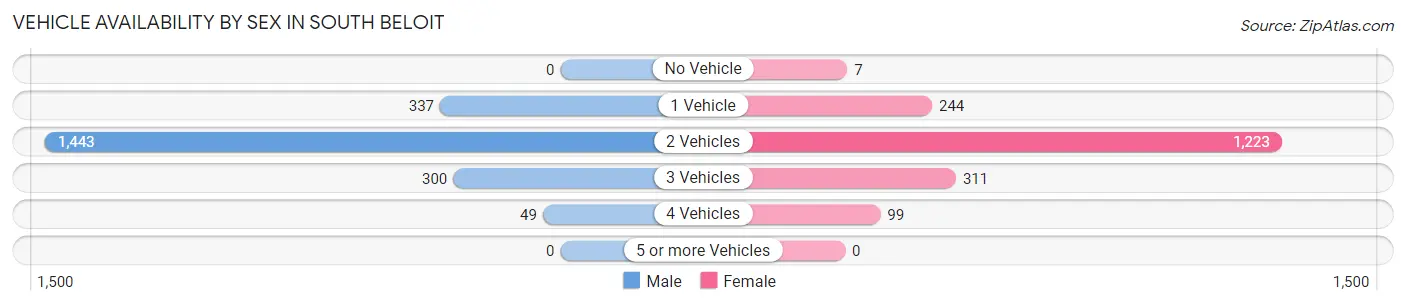
Vehicle Availability by Sex in South Beloit
The most prevalent vehicle ownership categories in South Beloit are males with 2 vehicles (1,443, accounting for 67.8%) and females with 2 vehicles (1,223, making up 76.6%).
| Vehicles Available | Male | Female |
| No Vehicle | 0 (0.0%) | 7 (0.4%) |
| 1 Vehicle | 337 (15.8%) | 244 (13.0%) |
| 2 Vehicles | 1,443 (67.8%) | 1,223 (64.9%) |
| 3 Vehicles | 300 (14.1%) | 311 (16.5%) |
| 4 Vehicles | 49 (2.3%) | 99 (5.2%) |
| 5 or more Vehicles | 0 (0.0%) | 0 (0.0%) |
| Total | 2,129 (100.0%) | 1,884 (100.0%) |
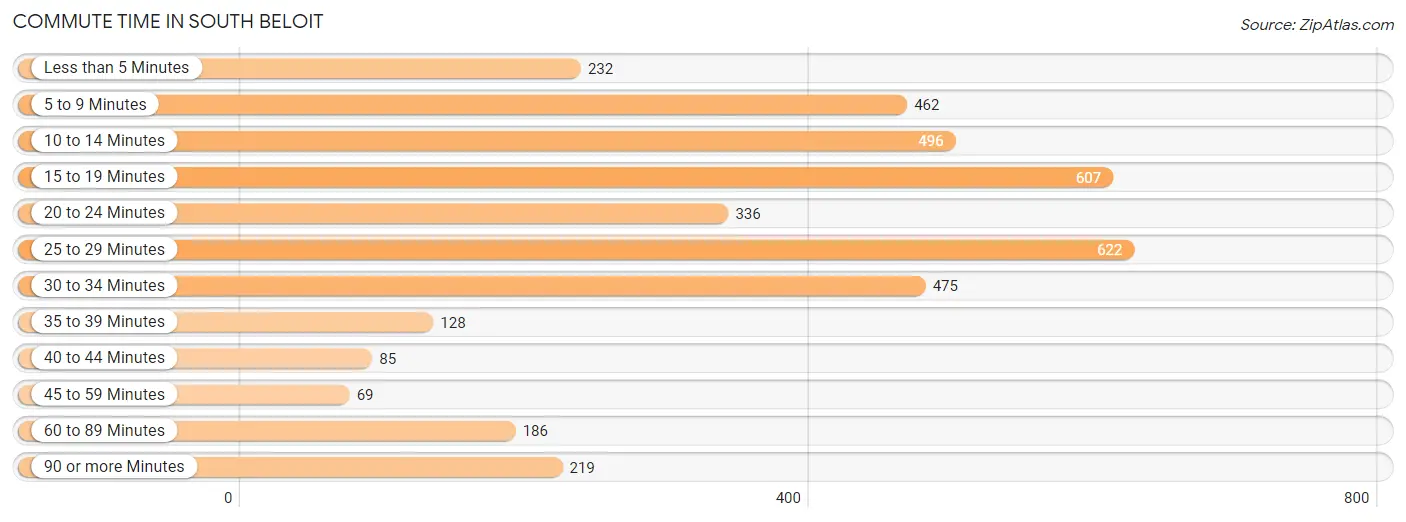
Commute Time in South Beloit
The most frequently occuring commute durations in South Beloit are 25 to 29 minutes (622 commuters, 15.9%), 15 to 19 minutes (607 commuters, 15.5%), and 10 to 14 minutes (496 commuters, 12.7%).
| Commute Time | # Commuters | % Commuters |
| Less than 5 Minutes | 232 | 5.9% |
| 5 to 9 Minutes | 462 | 11.8% |
| 10 to 14 Minutes | 496 | 12.7% |
| 15 to 19 Minutes | 607 | 15.5% |
| 20 to 24 Minutes | 336 | 8.6% |
| 25 to 29 Minutes | 622 | 15.9% |
| 30 to 34 Minutes | 475 | 12.1% |
| 35 to 39 Minutes | 128 | 3.3% |
| 40 to 44 Minutes | 85 | 2.2% |
| 45 to 59 Minutes | 69 | 1.8% |
| 60 to 89 Minutes | 186 | 4.8% |
| 90 or more Minutes | 219 | 5.6% |
Commute Time by Sex in South Beloit
The most common commute times in South Beloit are 30 to 34 minutes (367 commuters, 17.7%) for males and 25 to 29 minutes (315 commuters, 17.1%) for females.
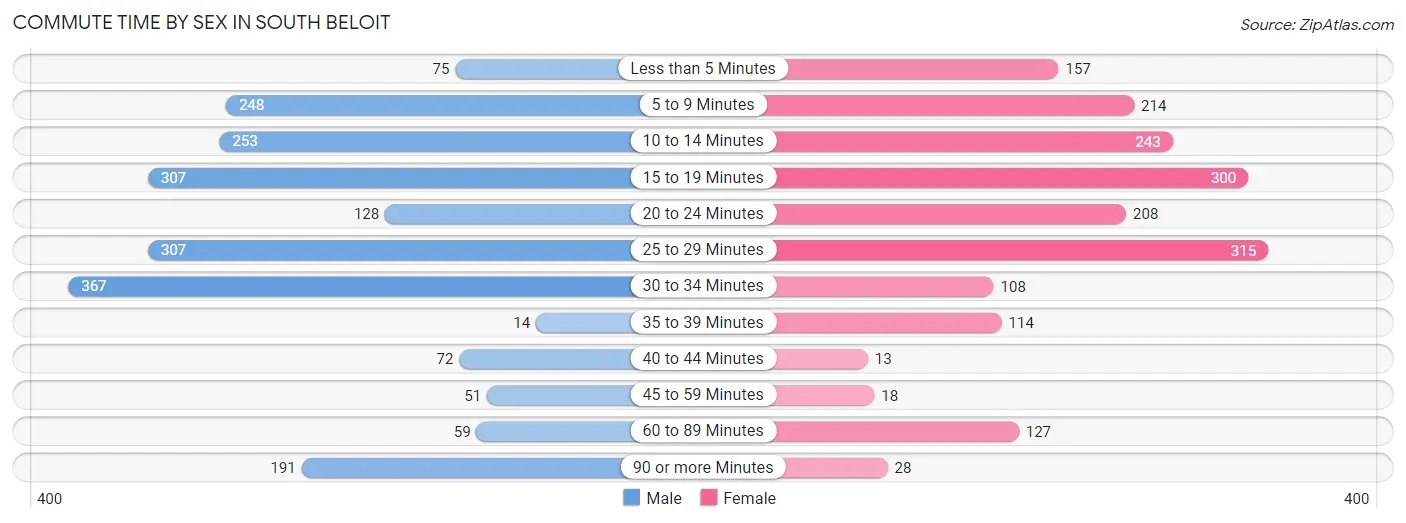
| Commute Time | Male | Female |
| Less than 5 Minutes | 75 (3.6%) | 157 (8.5%) |
| 5 to 9 Minutes | 248 (12.0%) | 214 (11.6%) |
| 10 to 14 Minutes | 253 (12.2%) | 243 (13.2%) |
| 15 to 19 Minutes | 307 (14.8%) | 300 (16.3%) |
| 20 to 24 Minutes | 128 (6.2%) | 208 (11.3%) |
| 25 to 29 Minutes | 307 (14.8%) | 315 (17.1%) |
| 30 to 34 Minutes | 367 (17.7%) | 108 (5.9%) |
| 35 to 39 Minutes | 14 (0.7%) | 114 (6.2%) |
| 40 to 44 Minutes | 72 (3.5%) | 13 (0.7%) |
| 45 to 59 Minutes | 51 (2.5%) | 18 (1.0%) |
| 60 to 89 Minutes | 59 (2.9%) | 127 (6.9%) |
| 90 or more Minutes | 191 (9.2%) | 28 (1.5%) |
Time of Departure to Work by Sex in South Beloit
The most frequent times of departure to work in South Beloit are 4:00 PM to 11:59 PM (417, 20.1%) for males and 7:00 AM to 7:29 AM (533, 28.9%) for females.
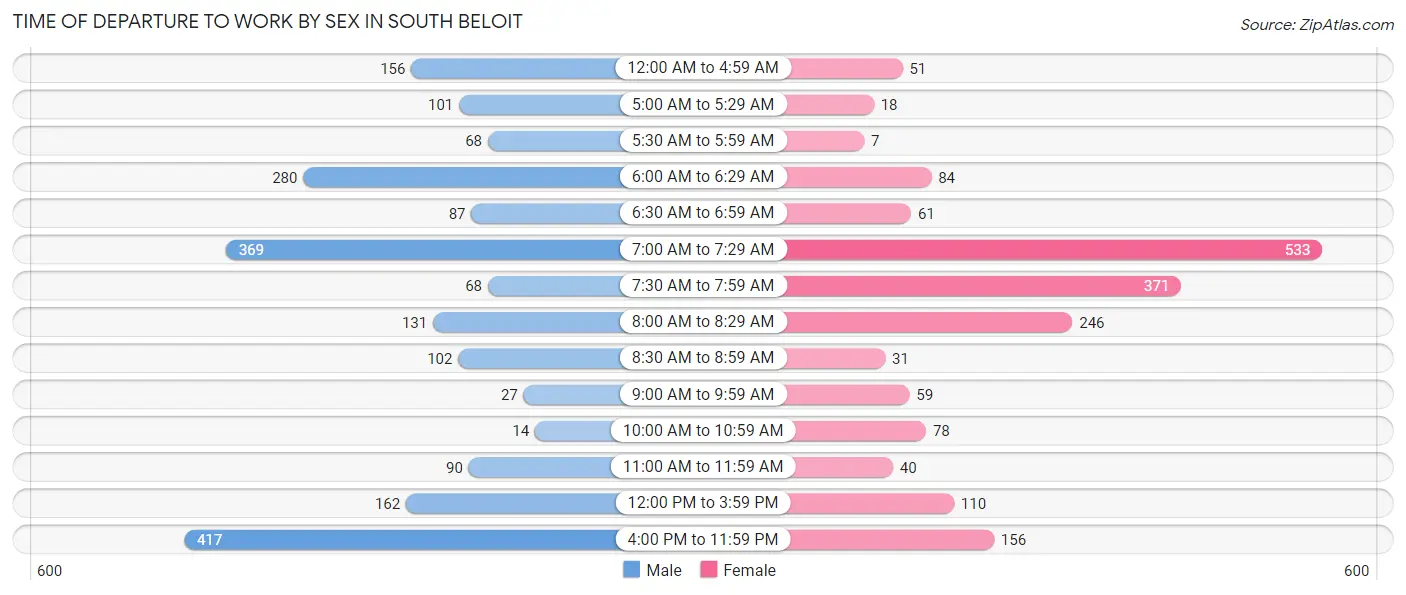
| Time of Departure | Male | Female |
| 12:00 AM to 4:59 AM | 156 (7.5%) | 51 (2.8%) |
| 5:00 AM to 5:29 AM | 101 (4.9%) | 18 (1.0%) |
| 5:30 AM to 5:59 AM | 68 (3.3%) | 7 (0.4%) |
| 6:00 AM to 6:29 AM | 280 (13.5%) | 84 (4.5%) |
| 6:30 AM to 6:59 AM | 87 (4.2%) | 61 (3.3%) |
| 7:00 AM to 7:29 AM | 369 (17.8%) | 533 (28.9%) |
| 7:30 AM to 7:59 AM | 68 (3.3%) | 371 (20.1%) |
| 8:00 AM to 8:29 AM | 131 (6.3%) | 246 (13.3%) |
| 8:30 AM to 8:59 AM | 102 (4.9%) | 31 (1.7%) |
| 9:00 AM to 9:59 AM | 27 (1.3%) | 59 (3.2%) |
| 10:00 AM to 10:59 AM | 14 (0.7%) | 78 (4.2%) |
| 11:00 AM to 11:59 AM | 90 (4.3%) | 40 (2.2%) |
| 12:00 PM to 3:59 PM | 162 (7.8%) | 110 (6.0%) |
| 4:00 PM to 11:59 PM | 417 (20.1%) | 156 (8.5%) |
| Total | 2,072 (100.0%) | 1,845 (100.0%) |
Housing Occupancy in South Beloit
Occupancy by Ownership in South Beloit
Of the total 3,234 dwellings in South Beloit, owner-occupied units account for 2,264 (70.0%), while renter-occupied units make up 970 (30.0%).
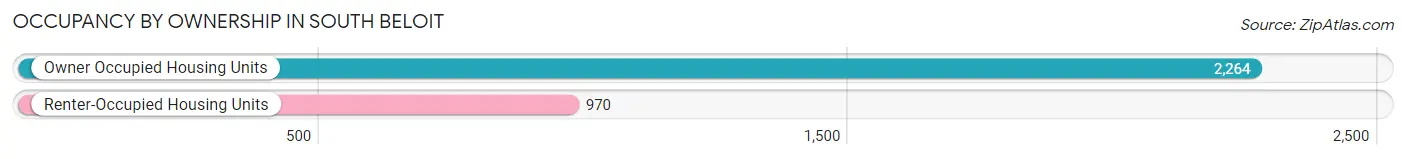
| Occupancy | # Housing Units | % Housing Units |
| Owner Occupied Housing Units | 2,264 | 70.0% |
| Renter-Occupied Housing Units | 970 | 30.0% |
| Total Occupied Housing Units | 3,234 | 100.0% |
Occupancy by Household Size in South Beloit
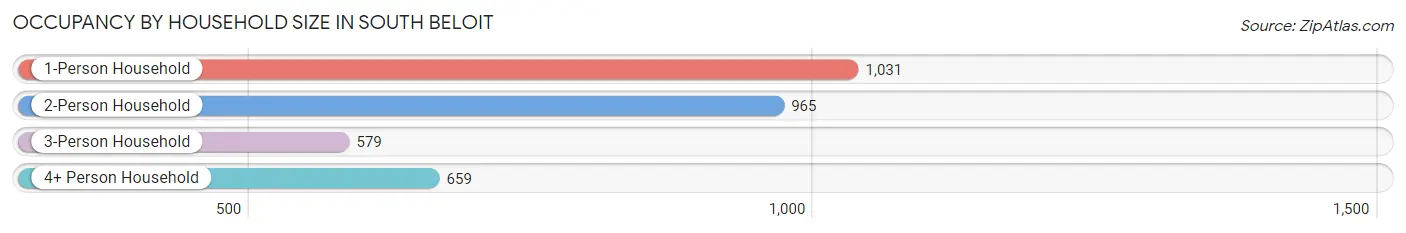
| Household Size | # Housing Units | % Housing Units |
| 1-Person Household | 1,031 | 31.9% |
| 2-Person Household | 965 | 29.8% |
| 3-Person Household | 579 | 17.9% |
| 4+ Person Household | 659 | 20.4% |
| Total Housing Units | 3,234 | 100.0% |
Occupancy by Ownership by Household Size in South Beloit
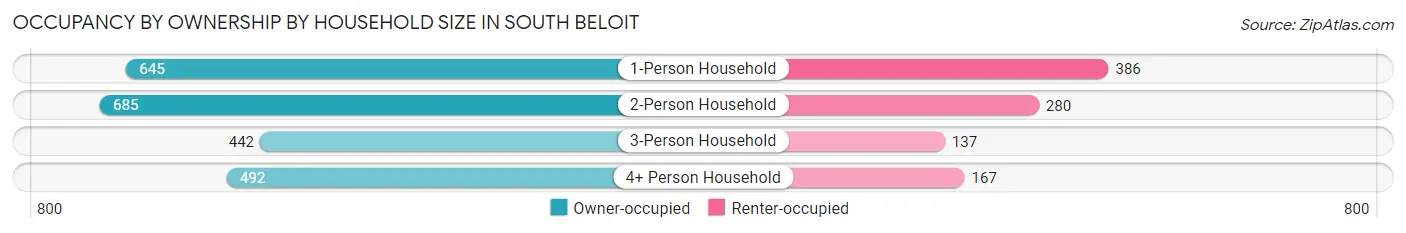
| Household Size | Owner-occupied | Renter-occupied |
| 1-Person Household | 645 (62.6%) | 386 (37.4%) |
| 2-Person Household | 685 (71.0%) | 280 (29.0%) |
| 3-Person Household | 442 (76.3%) | 137 (23.7%) |
| 4+ Person Household | 492 (74.7%) | 167 (25.3%) |
| Total Housing Units | 2,264 (70.0%) | 970 (30.0%) |
Occupancy by Educational Attainment in South Beloit
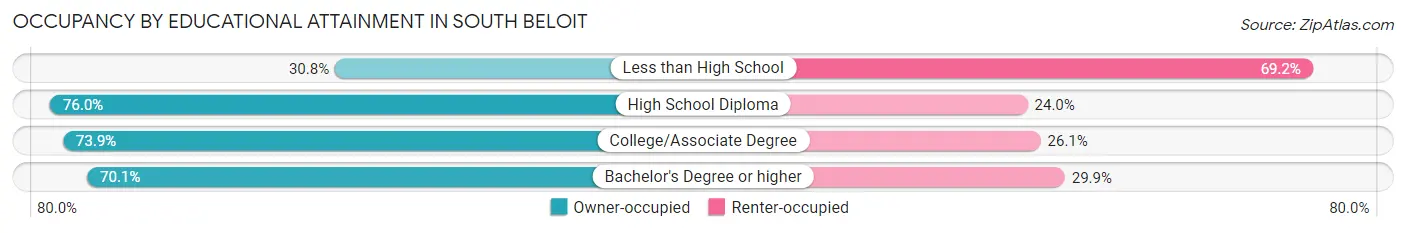
| Household Size | Owner-occupied | Renter-occupied |
| Less than High School | 84 (30.8%) | 189 (69.2%) |
| High School Diploma | 759 (76.0%) | 240 (24.0%) |
| College/Associate Degree | 887 (73.9%) | 313 (26.1%) |
| Bachelor's Degree or higher | 534 (70.1%) | 228 (29.9%) |
Occupancy by Age of Householder in South Beloit
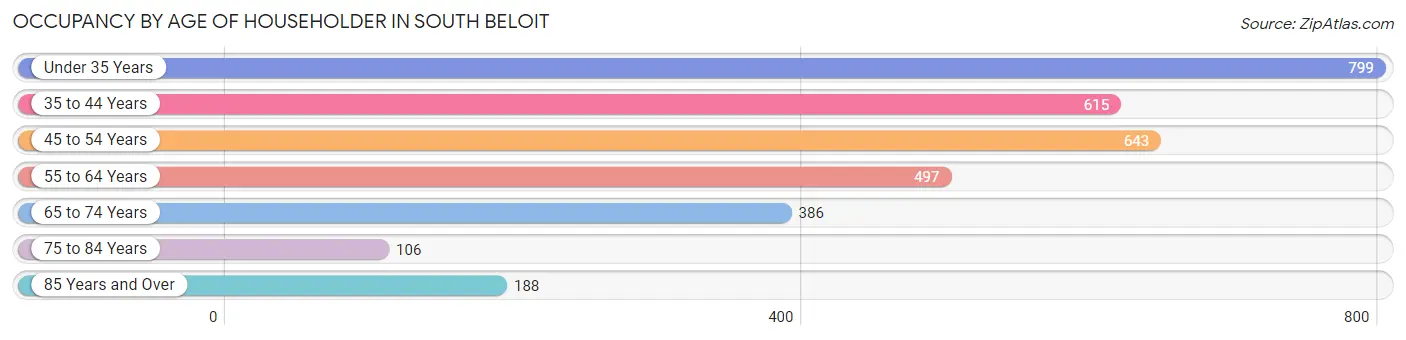
| Age Bracket | # Households | % Households |
| Under 35 Years | 799 | 24.7% |
| 35 to 44 Years | 615 | 19.0% |
| 45 to 54 Years | 643 | 19.9% |
| 55 to 64 Years | 497 | 15.4% |
| 65 to 74 Years | 386 | 11.9% |
| 75 to 84 Years | 106 | 3.3% |
| 85 Years and Over | 188 | 5.8% |
| Total | 3,234 | 100.0% |
Housing Finances in South Beloit
Median Income by Occupancy in South Beloit
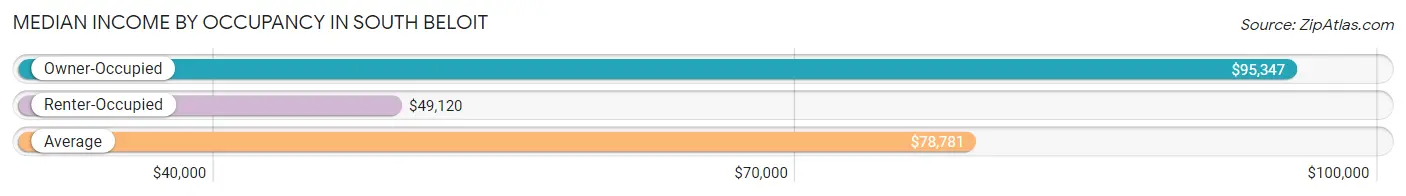
| Occupancy Type | # Households | Median Income |
| Owner-Occupied | 2,264 (70.0%) | $95,347 |
| Renter-Occupied | 970 (30.0%) | $49,120 |
| Average | 3,234 (100.0%) | $78,781 |
Occupancy by Householder Income Bracket in South Beloit
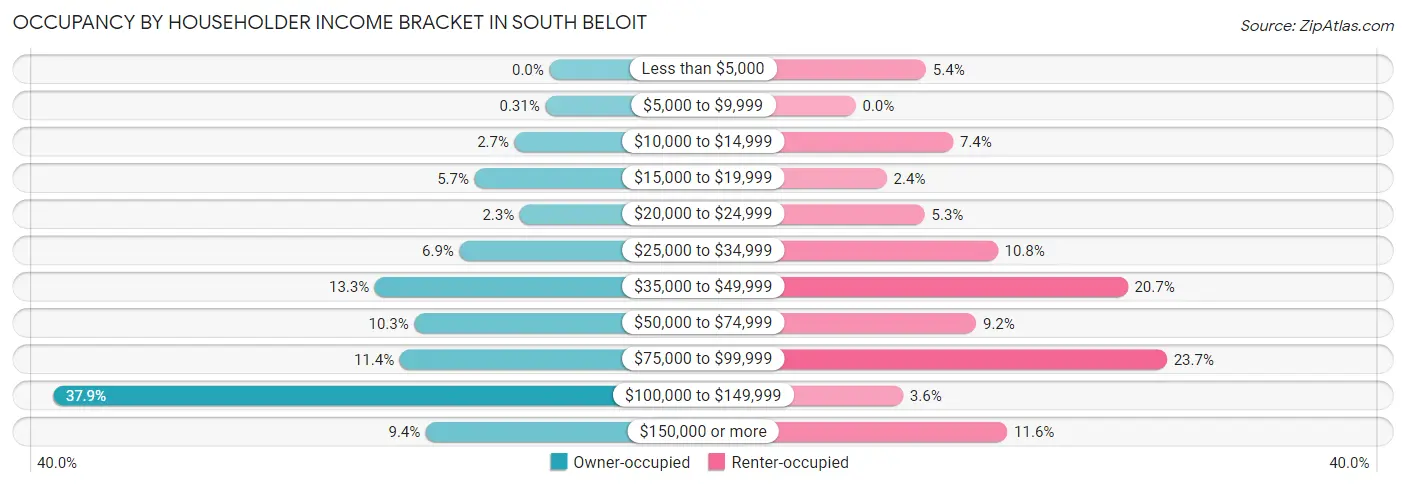
| Income Bracket | Owner-occupied | Renter-occupied |
| Less than $5,000 | 0 (0.0%) | 52 (5.4%) |
| $5,000 to $9,999 | 7 (0.3%) | 0 (0.0%) |
| $10,000 to $14,999 | 60 (2.6%) | 72 (7.4%) |
| $15,000 to $19,999 | 129 (5.7%) | 23 (2.4%) |
| $20,000 to $24,999 | 51 (2.2%) | 51 (5.3%) |
| $25,000 to $34,999 | 155 (6.9%) | 105 (10.8%) |
| $35,000 to $49,999 | 301 (13.3%) | 201 (20.7%) |
| $50,000 to $74,999 | 233 (10.3%) | 89 (9.2%) |
| $75,000 to $99,999 | 258 (11.4%) | 230 (23.7%) |
| $100,000 to $149,999 | 857 (37.9%) | 35 (3.6%) |
| $150,000 or more | 213 (9.4%) | 112 (11.6%) |
| Total | 2,264 (100.0%) | 970 (100.0%) |
Monthly Housing Cost Tiers in South Beloit
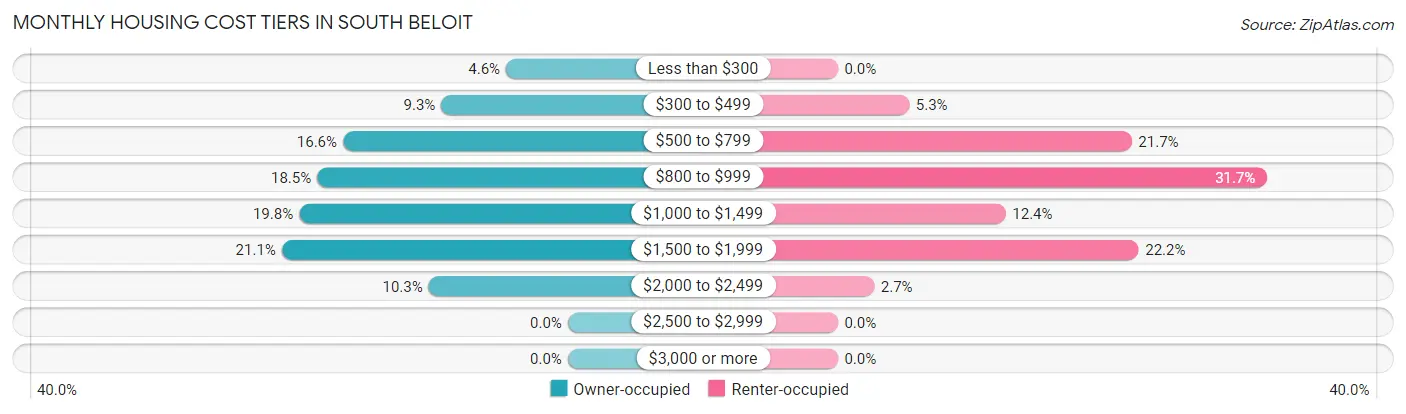
| Monthly Cost | Owner-occupied | Renter-occupied |
| Less than $300 | 103 (4.5%) | 0 (0.0%) |
| $300 to $499 | 211 (9.3%) | 51 (5.3%) |
| $500 to $799 | 375 (16.6%) | 210 (21.6%) |
| $800 to $999 | 418 (18.5%) | 307 (31.7%) |
| $1,000 to $1,499 | 448 (19.8%) | 120 (12.4%) |
| $1,500 to $1,999 | 477 (21.1%) | 215 (22.2%) |
| $2,000 to $2,499 | 232 (10.2%) | 26 (2.7%) |
| $2,500 to $2,999 | 0 (0.0%) | 0 (0.0%) |
| $3,000 or more | 0 (0.0%) | 0 (0.0%) |
| Total | 2,264 (100.0%) | 970 (100.0%) |
Physical Housing Characteristics in South Beloit
Housing Structures in South Beloit
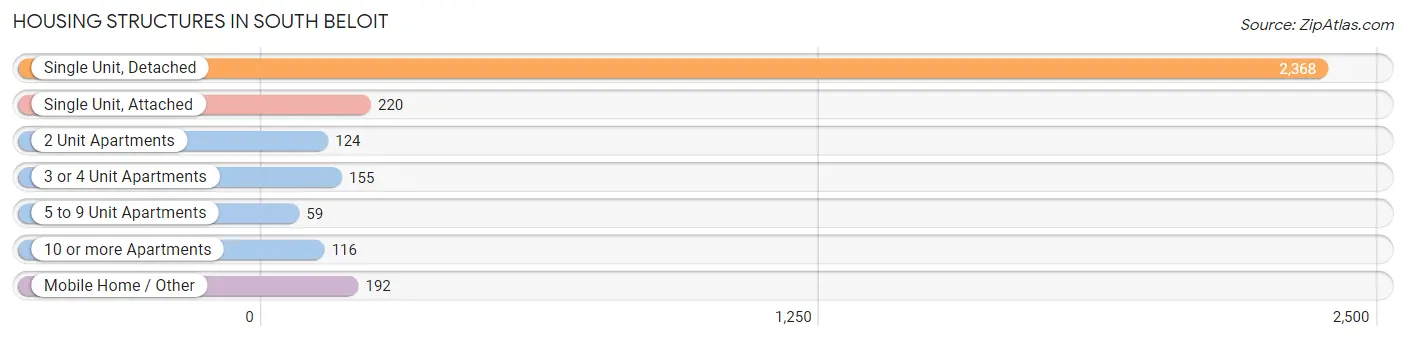
| Structure Type | # Housing Units | % Housing Units |
| Single Unit, Detached | 2,368 | 73.2% |
| Single Unit, Attached | 220 | 6.8% |
| 2 Unit Apartments | 124 | 3.8% |
| 3 or 4 Unit Apartments | 155 | 4.8% |
| 5 to 9 Unit Apartments | 59 | 1.8% |
| 10 or more Apartments | 116 | 3.6% |
| Mobile Home / Other | 192 | 5.9% |
| Total | 3,234 | 100.0% |
Housing Structures by Occupancy in South Beloit
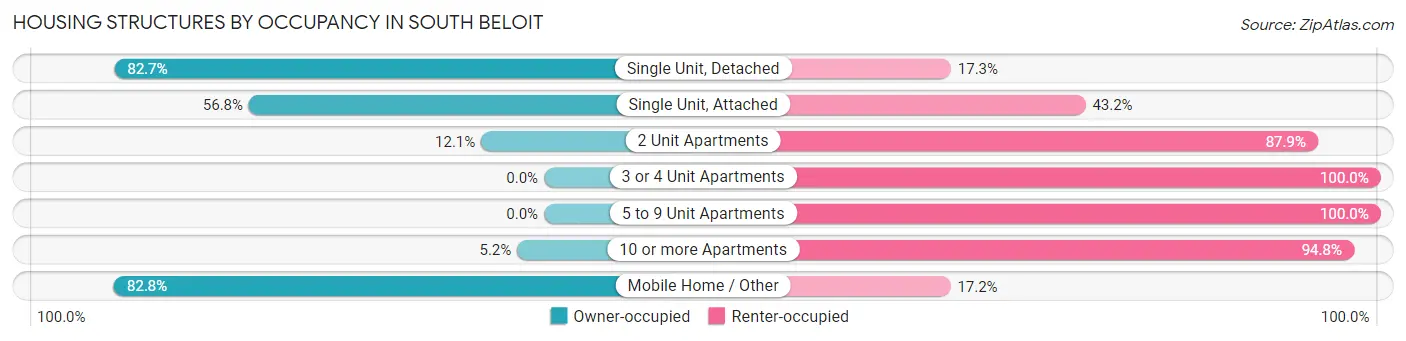
| Structure Type | Owner-occupied | Renter-occupied |
| Single Unit, Detached | 1,959 (82.7%) | 409 (17.3%) |
| Single Unit, Attached | 125 (56.8%) | 95 (43.2%) |
| 2 Unit Apartments | 15 (12.1%) | 109 (87.9%) |
| 3 or 4 Unit Apartments | 0 (0.0%) | 155 (100.0%) |
| 5 to 9 Unit Apartments | 0 (0.0%) | 59 (100.0%) |
| 10 or more Apartments | 6 (5.2%) | 110 (94.8%) |
| Mobile Home / Other | 159 (82.8%) | 33 (17.2%) |
| Total | 2,264 (70.0%) | 970 (30.0%) |
Housing Structures by Number of Rooms in South Beloit
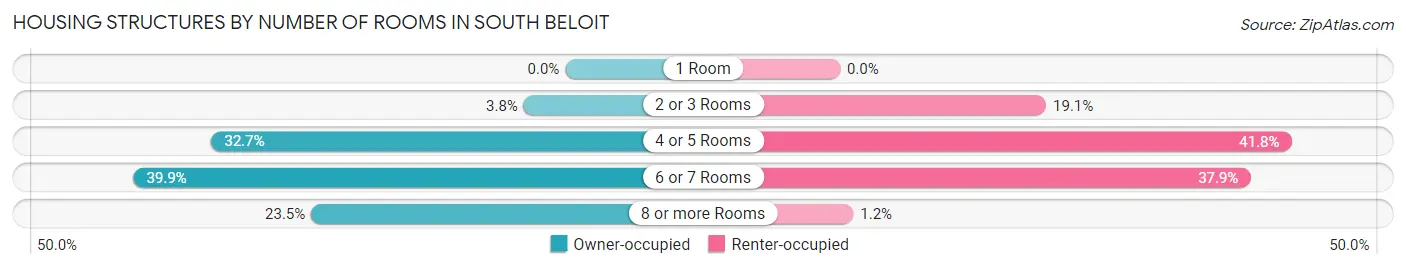
| Number of Rooms | Owner-occupied | Renter-occupied |
| 1 Room | 0 (0.0%) | 0 (0.0%) |
| 2 or 3 Rooms | 87 (3.8%) | 185 (19.1%) |
| 4 or 5 Rooms | 741 (32.7%) | 405 (41.7%) |
| 6 or 7 Rooms | 904 (39.9%) | 368 (37.9%) |
| 8 or more Rooms | 532 (23.5%) | 12 (1.2%) |
| Total | 2,264 (100.0%) | 970 (100.0%) |
Housing Structure by Heating Type in South Beloit
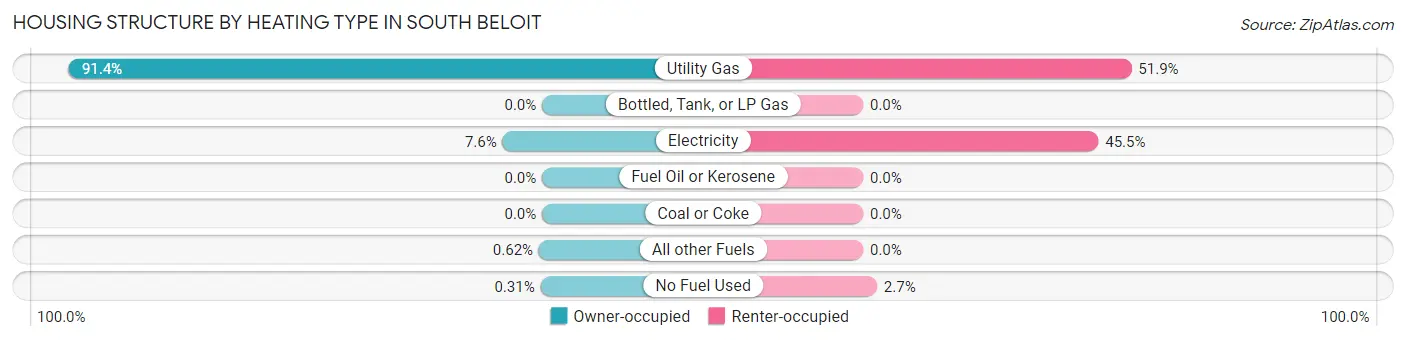
| Heating Type | Owner-occupied | Renter-occupied |
| Utility Gas | 2,070 (91.4%) | 503 (51.9%) |
| Bottled, Tank, or LP Gas | 0 (0.0%) | 0 (0.0%) |
| Electricity | 173 (7.6%) | 441 (45.5%) |
| Fuel Oil or Kerosene | 0 (0.0%) | 0 (0.0%) |
| Coal or Coke | 0 (0.0%) | 0 (0.0%) |
| All other Fuels | 14 (0.6%) | 0 (0.0%) |
| No Fuel Used | 7 (0.3%) | 26 (2.7%) |
| Total | 2,264 (100.0%) | 970 (100.0%) |
Household Vehicle Usage in South Beloit
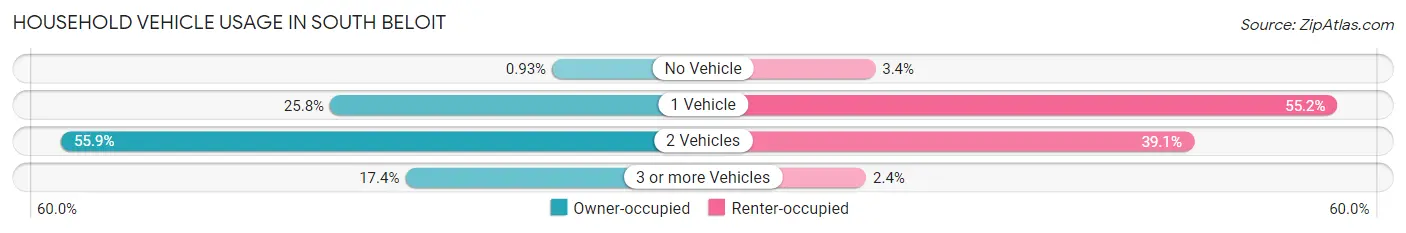
| Vehicles per Household | Owner-occupied | Renter-occupied |
| No Vehicle | 21 (0.9%) | 33 (3.4%) |
| 1 Vehicle | 584 (25.8%) | 535 (55.1%) |
| 2 Vehicles | 1,266 (55.9%) | 379 (39.1%) |
| 3 or more Vehicles | 393 (17.4%) | 23 (2.4%) |
| Total | 2,264 (100.0%) | 970 (100.0%) |
Real Estate & Mortgages in South Beloit
Real Estate and Mortgage Overview in South Beloit
| Characteristic | Without Mortgage | With Mortgage |
| Housing Units | 907 | 1,357 |
| Median Property Value | $131,600 | $174,400 |
| Median Household Income | $64,125 | $174 |
| Monthly Housing Costs | $633 | $0 |
| Real Estate Taxes | $2,624 | $7 |
Property Value by Mortgage Status in South Beloit
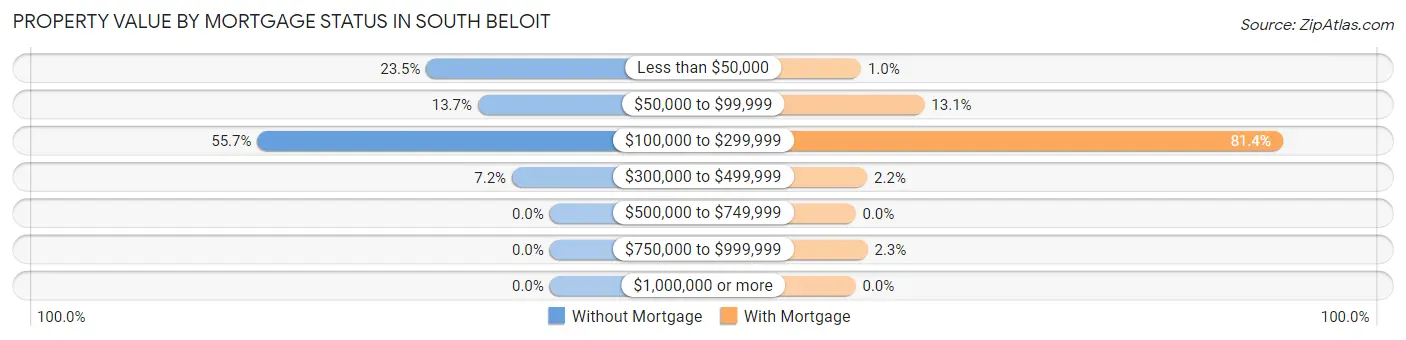
| Property Value | Without Mortgage | With Mortgage |
| Less than $50,000 | 213 (23.5%) | 14 (1.0%) |
| $50,000 to $99,999 | 124 (13.7%) | 178 (13.1%) |
| $100,000 to $299,999 | 505 (55.7%) | 1,104 (81.4%) |
| $300,000 to $499,999 | 65 (7.2%) | 30 (2.2%) |
| $500,000 to $749,999 | 0 (0.0%) | 0 (0.0%) |
| $750,000 to $999,999 | 0 (0.0%) | 31 (2.3%) |
| $1,000,000 or more | 0 (0.0%) | 0 (0.0%) |
| Total | 907 (100.0%) | 1,357 (100.0%) |
Household Income by Mortgage Status in South Beloit
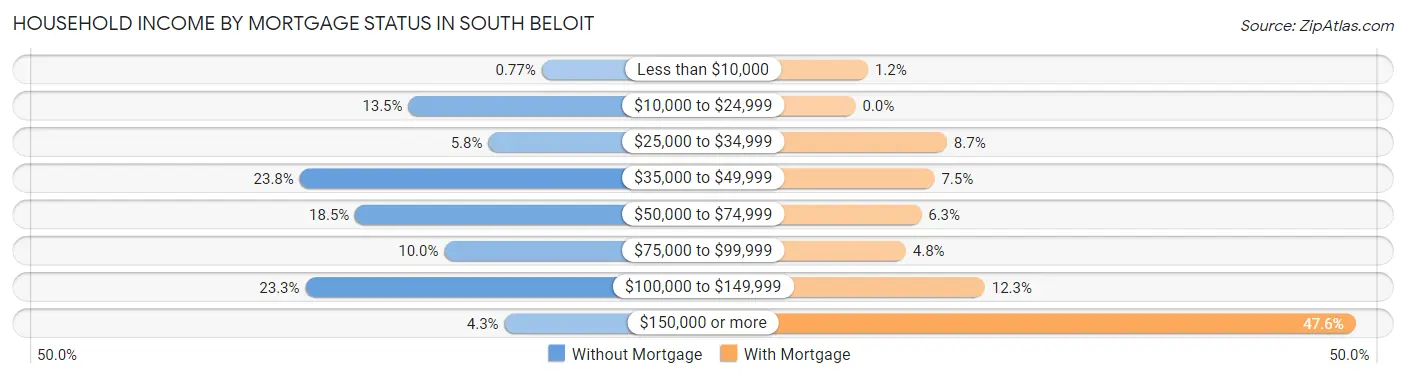
| Household Income | Without Mortgage | With Mortgage |
| Less than $10,000 | 7 (0.8%) | 16 (1.2%) |
| $10,000 to $24,999 | 122 (13.5%) | 0 (0.0%) |
| $25,000 to $34,999 | 53 (5.8%) | 118 (8.7%) |
| $35,000 to $49,999 | 216 (23.8%) | 102 (7.5%) |
| $50,000 to $74,999 | 168 (18.5%) | 85 (6.3%) |
| $75,000 to $99,999 | 91 (10.0%) | 65 (4.8%) |
| $100,000 to $149,999 | 211 (23.3%) | 167 (12.3%) |
| $150,000 or more | 39 (4.3%) | 646 (47.6%) |
| Total | 907 (100.0%) | 1,357 (100.0%) |
Property Value to Household Income Ratio in South Beloit
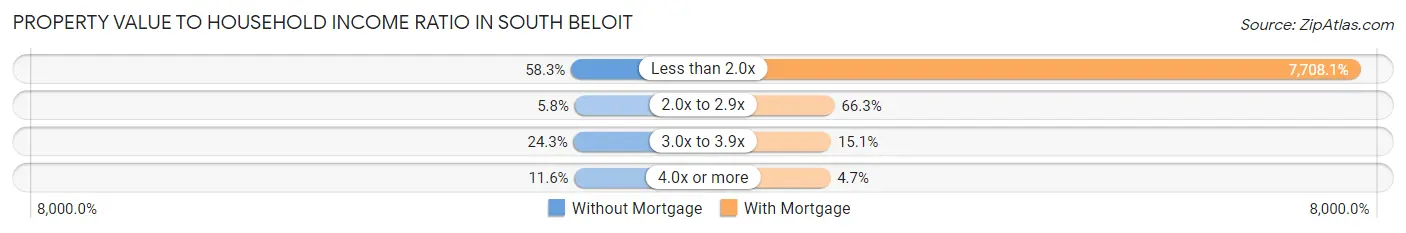
| Value-to-Income Ratio | Without Mortgage | With Mortgage |
| Less than 2.0x | 529 (58.3%) | 104,599 (7,708.1%) |
| 2.0x to 2.9x | 53 (5.8%) | 899 (66.2%) |
| 3.0x to 3.9x | 220 (24.3%) | 205 (15.1%) |
| 4.0x or more | 105 (11.6%) | 64 (4.7%) |
| Total | 907 (100.0%) | 1,357 (100.0%) |
Real Estate Taxes by Mortgage Status in South Beloit
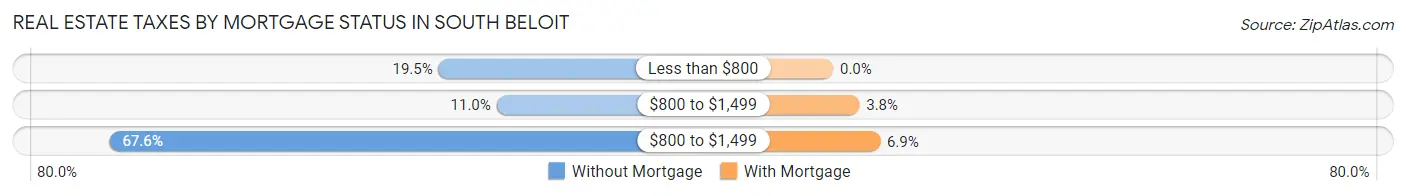
| Property Taxes | Without Mortgage | With Mortgage |
| Less than $800 | 177 (19.5%) | 0 (0.0%) |
| $800 to $1,499 | 100 (11.0%) | 52 (3.8%) |
| $800 to $1,499 | 613 (67.6%) | 93 (6.9%) |
| Total | 907 (100.0%) | 1,357 (100.0%) |
Health & Disability in South Beloit
Health Insurance Coverage by Age in South Beloit
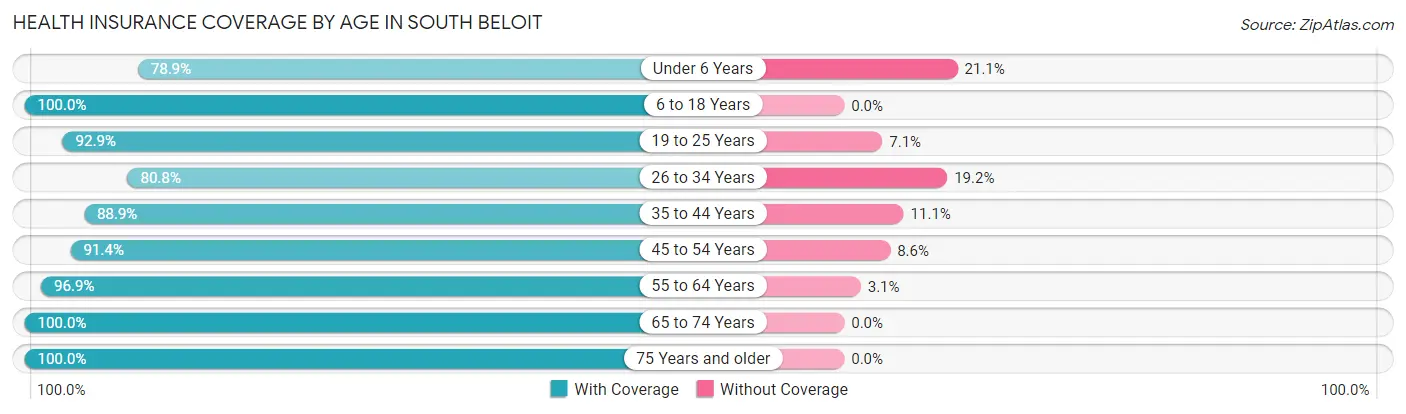
| Age Bracket | With Coverage | Without Coverage |
| Under 6 Years | 545 (78.9%) | 146 (21.1%) |
| 6 to 18 Years | 1,565 (100.0%) | 0 (0.0%) |
| 19 to 25 Years | 419 (92.9%) | 32 (7.1%) |
| 26 to 34 Years | 871 (80.8%) | 207 (19.2%) |
| 35 to 44 Years | 1,060 (88.9%) | 132 (11.1%) |
| 45 to 54 Years | 983 (91.4%) | 92 (8.6%) |
| 55 to 64 Years | 880 (96.9%) | 28 (3.1%) |
| 65 to 74 Years | 514 (100.0%) | 0 (0.0%) |
| 75 Years and older | 366 (100.0%) | 0 (0.0%) |
| Total | 7,203 (91.9%) | 637 (8.1%) |
Health Insurance Coverage by Citizenship Status in South Beloit
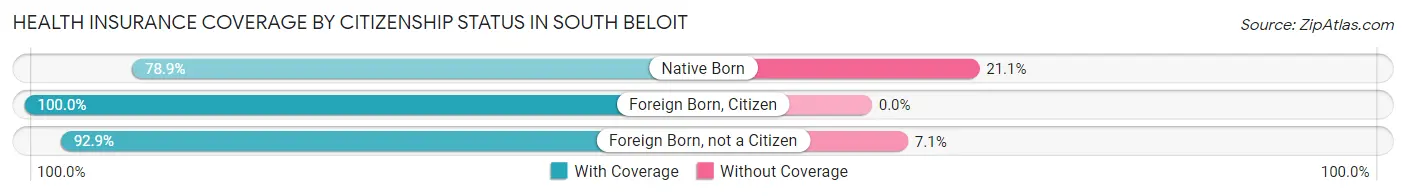
| Citizenship Status | With Coverage | Without Coverage |
| Native Born | 545 (78.9%) | 146 (21.1%) |
| Foreign Born, Citizen | 1,565 (100.0%) | 0 (0.0%) |
| Foreign Born, not a Citizen | 419 (92.9%) | 32 (7.1%) |
Health Insurance Coverage by Household Income in South Beloit
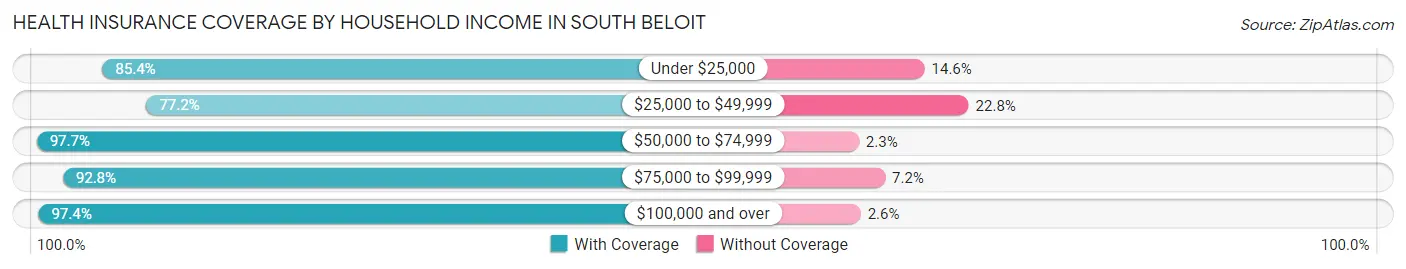
| Household Income | With Coverage | Without Coverage |
| Under $25,000 | 545 (85.4%) | 93 (14.6%) |
| $25,000 to $49,999 | 1,166 (77.2%) | 345 (22.8%) |
| $50,000 to $74,999 | 860 (97.7%) | 20 (2.3%) |
| $75,000 to $99,999 | 1,088 (92.8%) | 84 (7.2%) |
| $100,000 and over | 3,538 (97.4%) | 95 (2.6%) |
Public vs Private Health Insurance Coverage by Age in South Beloit
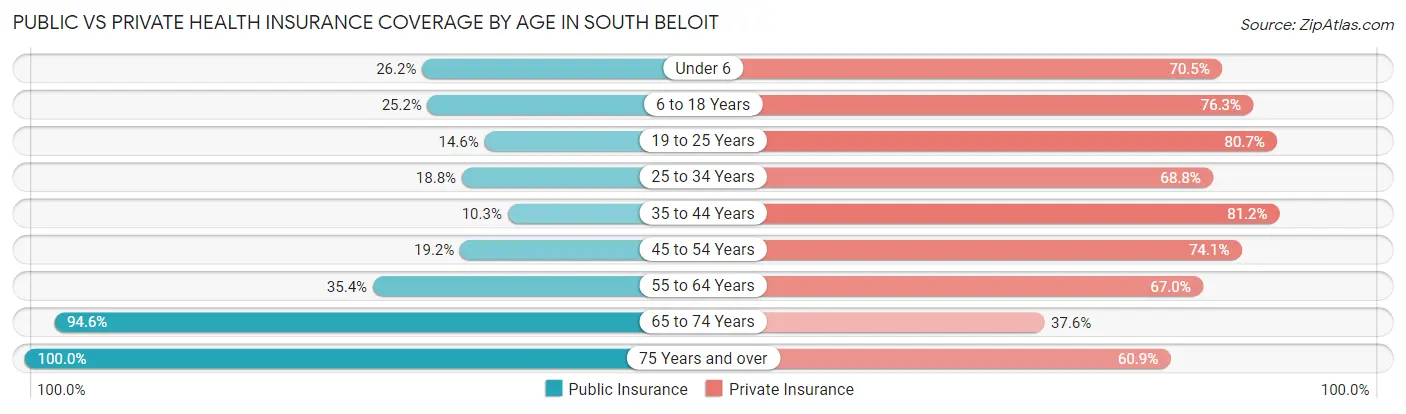
| Age Bracket | Public Insurance | Private Insurance |
| Under 6 | 181 (26.2%) | 487 (70.5%) |
| 6 to 18 Years | 394 (25.2%) | 1,194 (76.3%) |
| 19 to 25 Years | 66 (14.6%) | 364 (80.7%) |
| 25 to 34 Years | 203 (18.8%) | 742 (68.8%) |
| 35 to 44 Years | 123 (10.3%) | 968 (81.2%) |
| 45 to 54 Years | 206 (19.2%) | 797 (74.1%) |
| 55 to 64 Years | 321 (35.3%) | 608 (67.0%) |
| 65 to 74 Years | 486 (94.6%) | 193 (37.6%) |
| 75 Years and over | 366 (100.0%) | 223 (60.9%) |
| Total | 2,346 (29.9%) | 5,576 (71.1%) |
Disability Status by Sex by Age in South Beloit
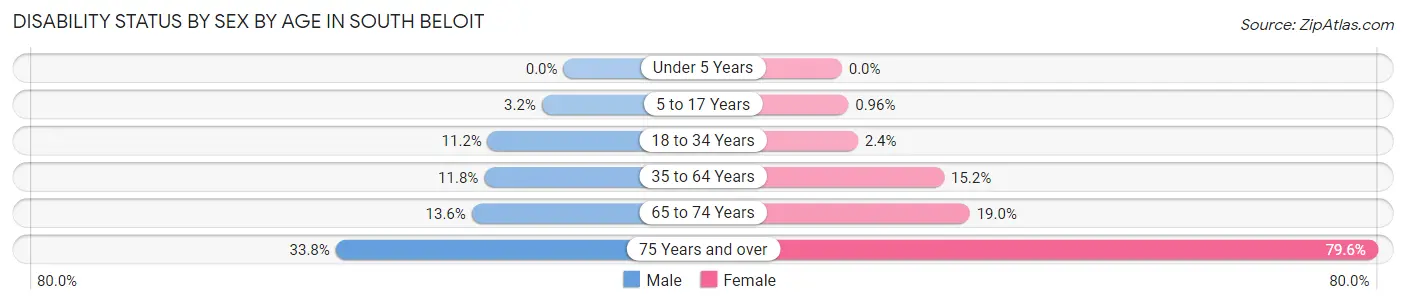
| Age Bracket | Male | Female |
| Under 5 Years | 0 (0.0%) | 0 (0.0%) |
| 5 to 17 Years | 21 (3.2%) | 8 (1.0%) |
| 18 to 34 Years | 87 (11.2%) | 22 (2.4%) |
| 35 to 64 Years | 203 (11.8%) | 220 (15.2%) |
| 65 to 74 Years | 32 (13.6%) | 53 (19.0%) |
| 75 Years and over | 46 (33.8%) | 183 (79.6%) |
Disability Class by Sex by Age in South Beloit
Disability Class: Hearing Difficulty
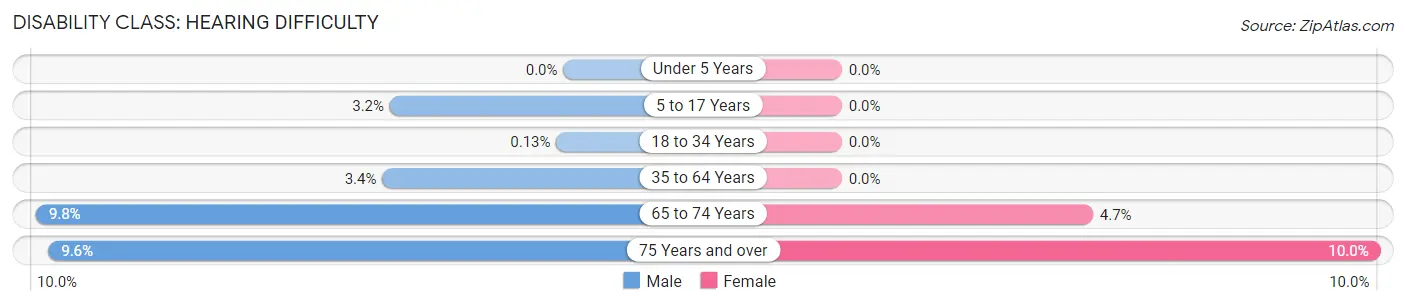
| Age Bracket | Male | Female |
| Under 5 Years | 0 (0.0%) | 0 (0.0%) |
| 5 to 17 Years | 21 (3.2%) | 0 (0.0%) |
| 18 to 34 Years | 1 (0.1%) | 0 (0.0%) |
| 35 to 64 Years | 58 (3.4%) | 0 (0.0%) |
| 65 to 74 Years | 23 (9.8%) | 13 (4.7%) |
| 75 Years and over | 13 (9.6%) | 23 (10.0%) |
Disability Class: Vision Difficulty
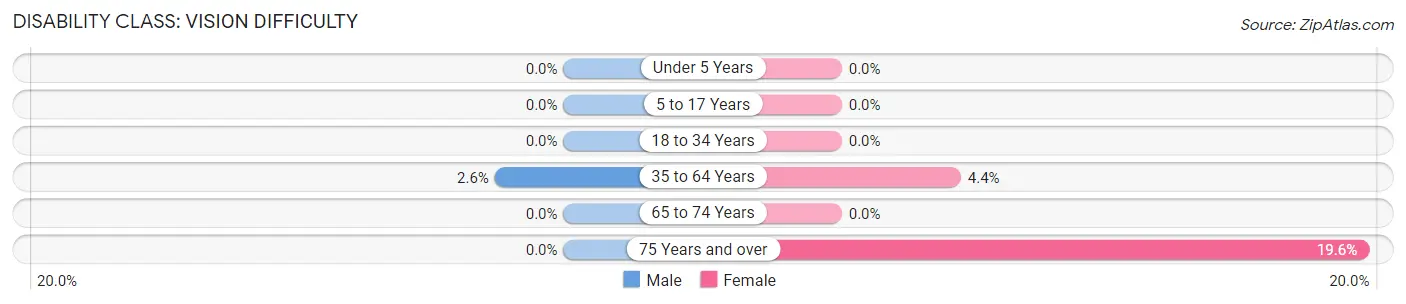
| Age Bracket | Male | Female |
| Under 5 Years | 0 (0.0%) | 0 (0.0%) |
| 5 to 17 Years | 0 (0.0%) | 0 (0.0%) |
| 18 to 34 Years | 0 (0.0%) | 0 (0.0%) |
| 35 to 64 Years | 44 (2.5%) | 64 (4.4%) |
| 65 to 74 Years | 0 (0.0%) | 0 (0.0%) |
| 75 Years and over | 0 (0.0%) | 45 (19.6%) |
Disability Class: Cognitive Difficulty
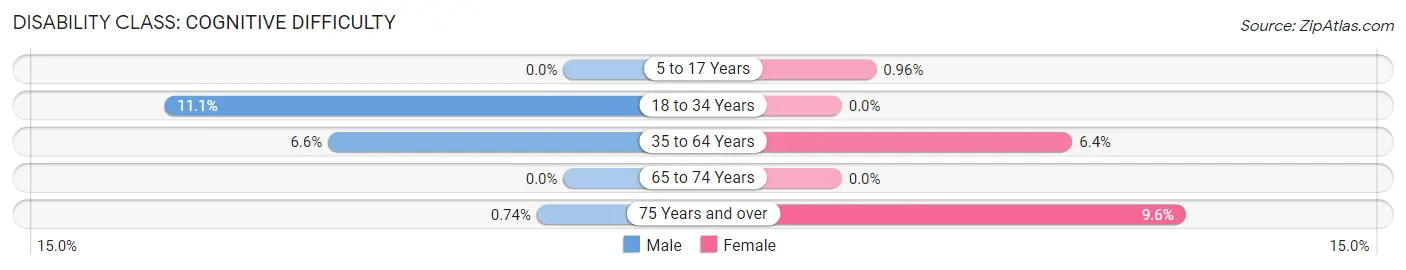
| Age Bracket | Male | Female |
| 5 to 17 Years | 0 (0.0%) | 8 (1.0%) |
| 18 to 34 Years | 86 (11.1%) | 0 (0.0%) |
| 35 to 64 Years | 113 (6.6%) | 93 (6.4%) |
| 65 to 74 Years | 0 (0.0%) | 0 (0.0%) |
| 75 Years and over | 1 (0.7%) | 22 (9.6%) |
Disability Class: Ambulatory Difficulty
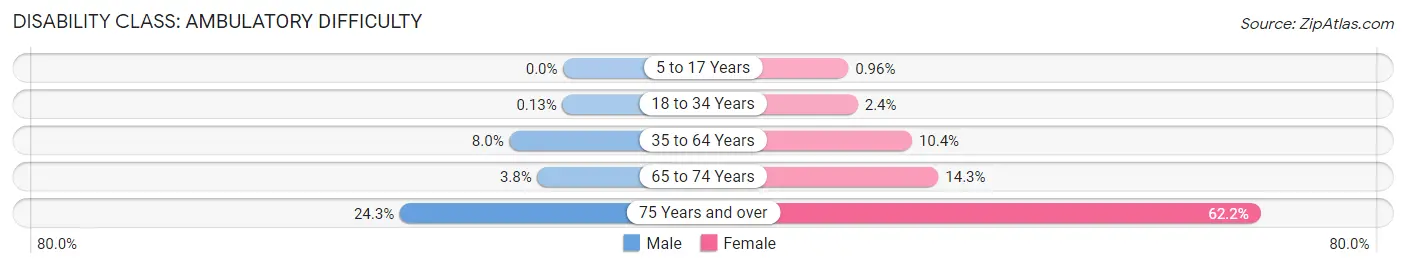
| Age Bracket | Male | Female |
| 5 to 17 Years | 0 (0.0%) | 8 (1.0%) |
| 18 to 34 Years | 1 (0.1%) | 22 (2.4%) |
| 35 to 64 Years | 138 (8.0%) | 151 (10.4%) |
| 65 to 74 Years | 9 (3.8%) | 40 (14.3%) |
| 75 Years and over | 33 (24.3%) | 143 (62.2%) |
Disability Class: Self-Care Difficulty
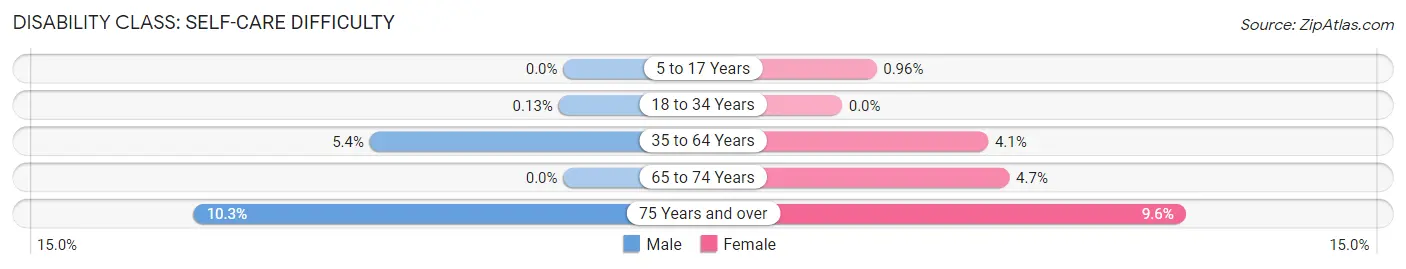
| Age Bracket | Male | Female |
| 5 to 17 Years | 0 (0.0%) | 8 (1.0%) |
| 18 to 34 Years | 1 (0.1%) | 0 (0.0%) |
| 35 to 64 Years | 93 (5.4%) | 59 (4.1%) |
| 65 to 74 Years | 0 (0.0%) | 13 (4.7%) |
| 75 Years and over | 14 (10.3%) | 22 (9.6%) |
Technology Access in South Beloit
Computing Device Access in South Beloit
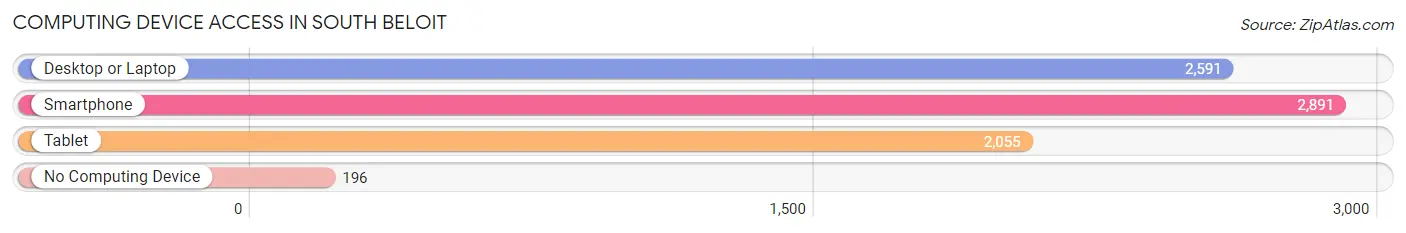
| Device Type | # Households | % Households |
| Desktop or Laptop | 2,591 | 80.1% |
| Smartphone | 2,891 | 89.4% |
| Tablet | 2,055 | 63.5% |
| No Computing Device | 196 | 6.1% |
| Total | 3,234 | 100.0% |
Internet Access in South Beloit
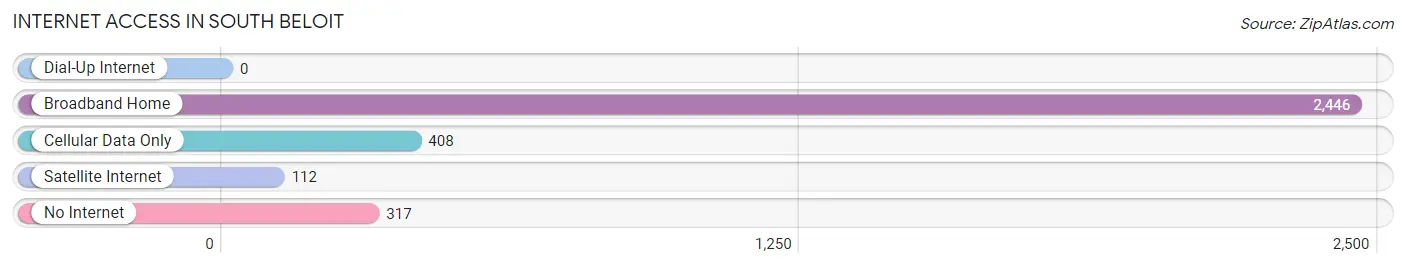
| Internet Type | # Households | % Households |
| Dial-Up Internet | 0 | 0.0% |
| Broadband Home | 2,446 | 75.6% |
| Cellular Data Only | 408 | 12.6% |
| Satellite Internet | 112 | 3.5% |
| No Internet | 317 | 9.8% |
| Total | 3,234 | 100.0% |
South Beloit Summary
Beloit, Illinois is a small city located in the northern part of the state, just south of the Wisconsin border. It is part of the Rockford metropolitan area and is located in Winnebago County. The city has a population of approximately 8,000 people and is known for its small-town charm and friendly atmosphere.
History
Beloit was first settled in 1835 by a group of settlers from New York. The city was named after the nearby Beloit River, which was named after the French explorer, Jean Baptiste Beloit. The city was officially incorporated in 1846 and was the first city in Winnebago County.
In the late 19th century, Beloit was a major industrial center, with several factories and mills located in the city. The city was also home to several large companies, such as the Beloit Iron Works, the Beloit Woolen Mills, and the Beloit Paper Company.
In the early 20th century, Beloit experienced a period of growth and prosperity. The city was home to several large businesses, such as the Beloit Corporation, the Beloit Machine Works, and the Beloit Foundry. The city also had a thriving downtown area, with several stores, restaurants, and other businesses.
Geography
Beloit is located in northern Illinois, just south of the Wisconsin border. The city is situated on the banks of the Rock River, which flows through the city. The city is located in a flat, open area, with several small hills and valleys. The city is surrounded by several small towns and villages, including South Beloit, Rockton, and Roscoe.
The climate in Beloit is typical of the Midwest, with hot summers and cold winters. The average temperature in the summer is around 75 degrees Fahrenheit, while the average temperature in the winter is around 25 degrees Fahrenheit.
Economy
Beloit has a diverse economy, with several large employers located in the city. The largest employer in the city is the Beloit Corporation, which manufactures industrial machinery and equipment. Other major employers in the city include the Beloit Machine Works, the Beloit Foundry, and the Beloit Paper Company.
The city also has a thriving retail sector, with several stores, restaurants, and other businesses located in the downtown area. The city also has a large tourism industry, with several attractions, such as the Beloit Historical Museum, the Beloit Zoo, and the Beloit College campus.
Demographics
As of the 2010 census, Beloit had a population of 8,000 people. The racial makeup of the city was 79.3% White, 14.2% African American, 0.7% Native American, 1.2% Asian, and 4.6% from other races. The median household income in Beloit was $41,000, and the median family income was $50,000.
Beloit is a diverse city, with a variety of cultures and backgrounds represented in the population. The city is home to several churches, including the First Presbyterian Church, the First United Methodist Church, and the Beloit Christian Church. The city also has several schools, including Beloit College, Beloit Memorial High School, and Beloit Middle School.
Common Questions
What is Per Capita Income in South Beloit?
Per Capita income in South Beloit is $35,108.
What is the Median Family Income in South Beloit?
Median Family Income in South Beloit is $102,837.
What is the Median Household income in South Beloit?
Median Household Income in South Beloit is $78,781.
What is Income or Wage Gap in South Beloit?
Income or Wage Gap in South Beloit is 11.3%.
Women in South Beloit earn 88.7 cents for every dollar earned by a man.
What is Inequality or Gini Index in South Beloit?
Inequality or Gini Index in South Beloit is 0.38.
What is the Total Population of South Beloit?
Total Population of South Beloit is 7,943.
What is the Total Male Population of South Beloit?
Total Male Population of South Beloit is 3,843.
What is the Total Female Population of South Beloit?
Total Female Population of South Beloit is 4,100.
What is the Ratio of Males per 100 Females in South Beloit?
There are 93.73 Males per 100 Females in South Beloit.
What is the Ratio of Females per 100 Males in South Beloit?
There are 106.69 Females per 100 Males in South Beloit.
What is the Median Population Age in South Beloit?
Median Population Age in South Beloit is 36.2 Years.
What is the Average Family Size in South Beloit
Average Family Size in South Beloit is 3.2 People.
What is the Average Household Size in South Beloit
Average Household Size in South Beloit is 2.4 People.
How Large is the Labor Force in South Beloit?
There are 4,234 People in the Labor Forcein in South Beloit.
What is the Percentage of People in the Labor Force in South Beloit?
70.9% of People are in the Labor Force in South Beloit.
What is the Unemployment Rate in South Beloit?
Unemployment Rate in South Beloit is 4.9%.