Belvidere, IL Map & Demographics
Belvidere Map
Belvidere Overview
$29,682
PER CAPITA INCOME
$77,738
AVG FAMILY INCOME
$59,216
AVG HOUSEHOLD INCOME
20.1%
WAGE / INCOME GAP [ % ]
79.9¢/ $1
WAGE / INCOME GAP [ $ ]
0.41
INEQUALITY / GINI INDEX
25,389
TOTAL POPULATION
12,614
MALE POPULATION
12,775
FEMALE POPULATION
98.74
MALES / 100 FEMALES
101.28
FEMALES / 100 MALES
39.1
MEDIAN AGE
3.2
AVG FAMILY SIZE
2.6
AVG HOUSEHOLD SIZE
13,597
LABOR FORCE [ PEOPLE ]
66.7%
PERCENT IN LABOR FORCE
5.6%
UNEMPLOYMENT RATE
Belvidere Zip Codes
Income in Belvidere
Income Overview in Belvidere
Per Capita Income in Belvidere is $29,682, while median incomes of families and households are $77,738 and $59,216 respectively.
| Characteristic | Number | Measure |
| Per Capita Income | 25,389 | $29,682 |
| Median Family Income | 6,015 | $77,738 |
| Mean Family Income | 6,015 | $89,000 |
| Median Household Income | 9,714 | $59,216 |
| Mean Household Income | 9,714 | $74,605 |
| Income Deficit | 6,015 | $0 |
| Wage / Income Gap (%) | 25,389 | 20.08% |
| Wage / Income Gap ($) | 25,389 | 79.92¢ per $1 |
| Gini / Inequality Index | 25,389 | 0.41 |
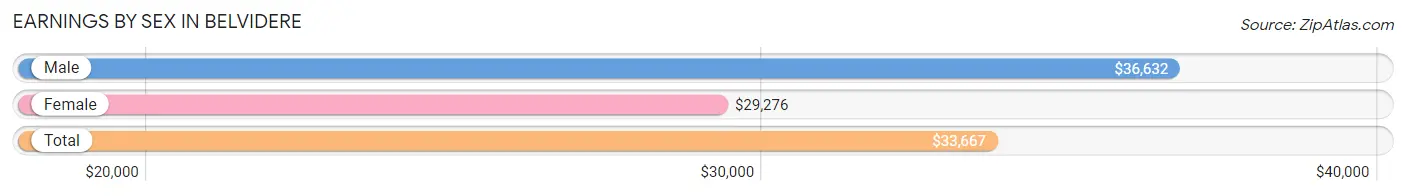
Earnings by Sex in Belvidere
Average Earnings in Belvidere are $33,667, $36,632 for men and $29,276 for women, a difference of 20.1%.
| Sex | Number | Average Earnings |
| Male | 7,542 (53.1%) | $36,632 |
| Female | 6,671 (46.9%) | $29,276 |
| Total | 14,213 (100.0%) | $33,667 |
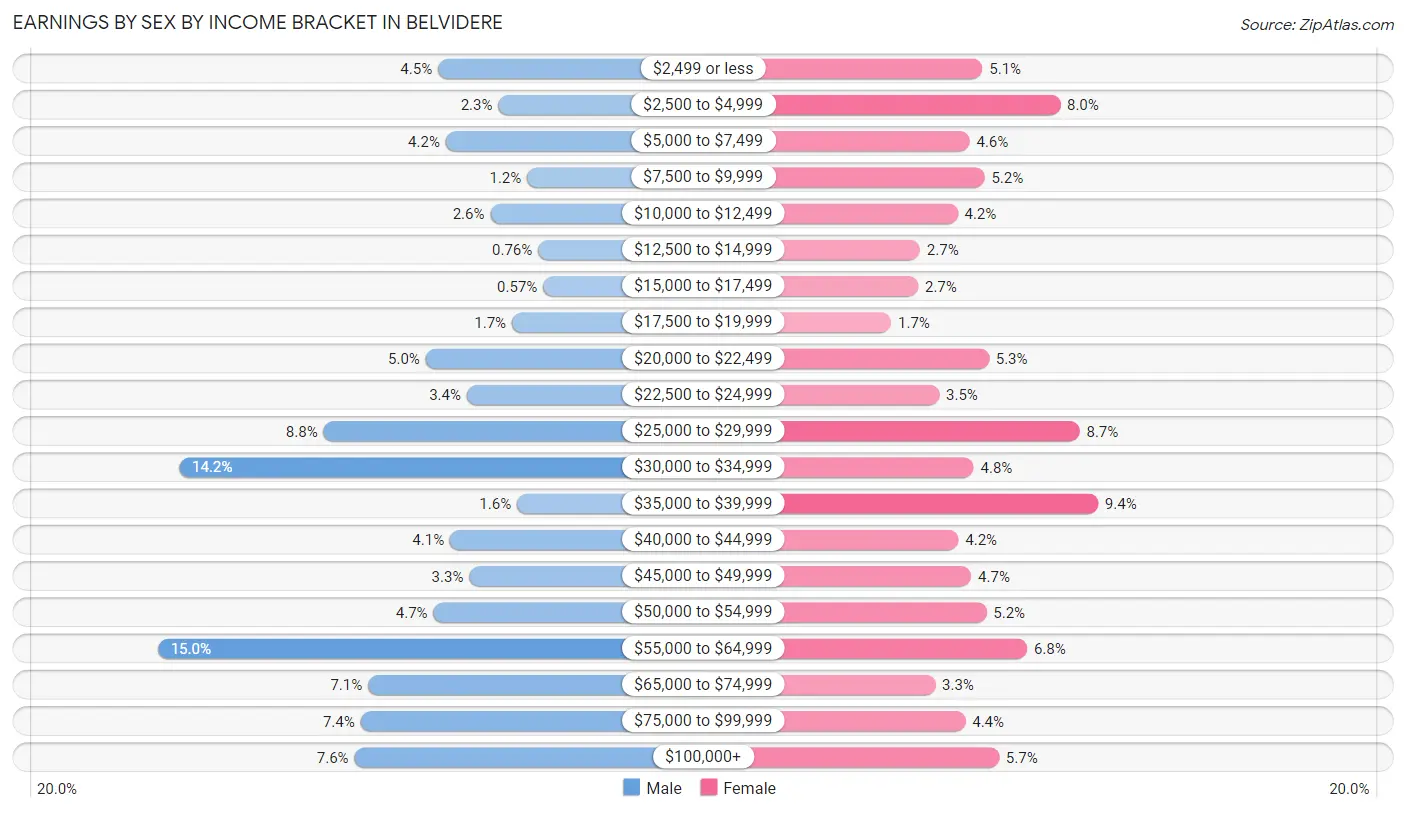
Earnings by Sex by Income Bracket in Belvidere
The most common earnings brackets in Belvidere are $55,000 to $64,999 for men (1,132 | 15.0%) and $35,000 to $39,999 for women (628 | 9.4%).
| Income | Male | Female |
| $2,499 or less | 340 (4.5%) | 339 (5.1%) |
| $2,500 to $4,999 | 170 (2.2%) | 533 (8.0%) |
| $5,000 to $7,499 | 318 (4.2%) | 307 (4.6%) |
| $7,500 to $9,999 | 88 (1.2%) | 344 (5.2%) |
| $10,000 to $12,499 | 192 (2.5%) | 277 (4.2%) |
| $12,500 to $14,999 | 57 (0.8%) | 183 (2.7%) |
| $15,000 to $17,499 | 43 (0.6%) | 178 (2.7%) |
| $17,500 to $19,999 | 131 (1.7%) | 111 (1.7%) |
| $20,000 to $22,499 | 375 (5.0%) | 355 (5.3%) |
| $22,500 to $24,999 | 259 (3.4%) | 231 (3.5%) |
| $25,000 to $29,999 | 664 (8.8%) | 582 (8.7%) |
| $30,000 to $34,999 | 1,072 (14.2%) | 317 (4.8%) |
| $35,000 to $39,999 | 117 (1.5%) | 628 (9.4%) |
| $40,000 to $44,999 | 306 (4.1%) | 279 (4.2%) |
| $45,000 to $49,999 | 252 (3.3%) | 311 (4.7%) |
| $50,000 to $54,999 | 353 (4.7%) | 349 (5.2%) |
| $55,000 to $64,999 | 1,132 (15.0%) | 450 (6.8%) |
| $65,000 to $74,999 | 538 (7.1%) | 221 (3.3%) |
| $75,000 to $99,999 | 559 (7.4%) | 296 (4.4%) |
| $100,000+ | 576 (7.6%) | 380 (5.7%) |
| Total | 7,542 (100.0%) | 6,671 (100.0%) |
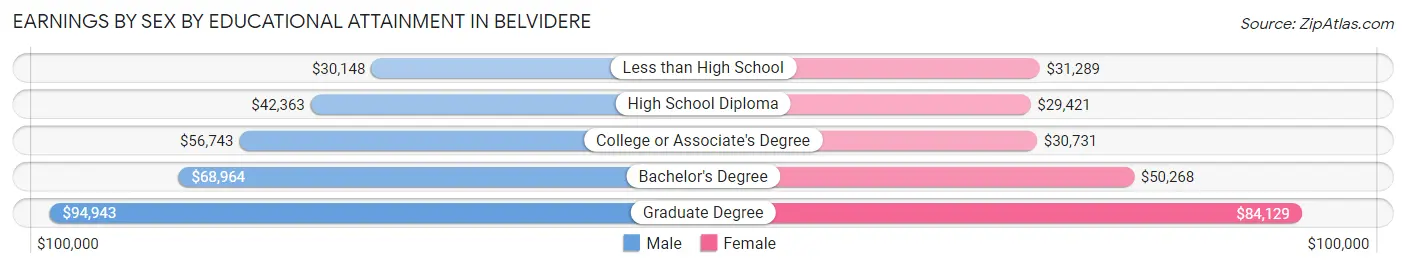
Earnings by Sex by Educational Attainment in Belvidere
Average earnings in Belvidere are $46,979 for men and $35,412 for women, a difference of 24.6%. Men with an educational attainment of graduate degree enjoy the highest average annual earnings of $94,943, while those with less than high school education earn the least with $30,148. Women with an educational attainment of graduate degree earn the most with the average annual earnings of $84,129, while those with high school diploma education have the smallest earnings of $29,421.
| Educational Attainment | Male Income | Female Income |
| Less than High School | $30,148 | $31,289 |
| High School Diploma | $42,363 | $29,421 |
| College or Associate's Degree | $56,743 | $30,731 |
| Bachelor's Degree | $68,964 | $50,268 |
| Graduate Degree | $94,943 | $84,129 |
| Total | $46,979 | $35,412 |
Family Income in Belvidere
Family Income Brackets in Belvidere
According to the Belvidere family income data, there are 1,263 families falling into the $100,000 to $149,999 income range, which is the most common income bracket and makes up 21.0% of all families. Conversely, the $10,000 to $14,999 income bracket is the least frequent group with only 120 families (2.0%) belonging to this category.
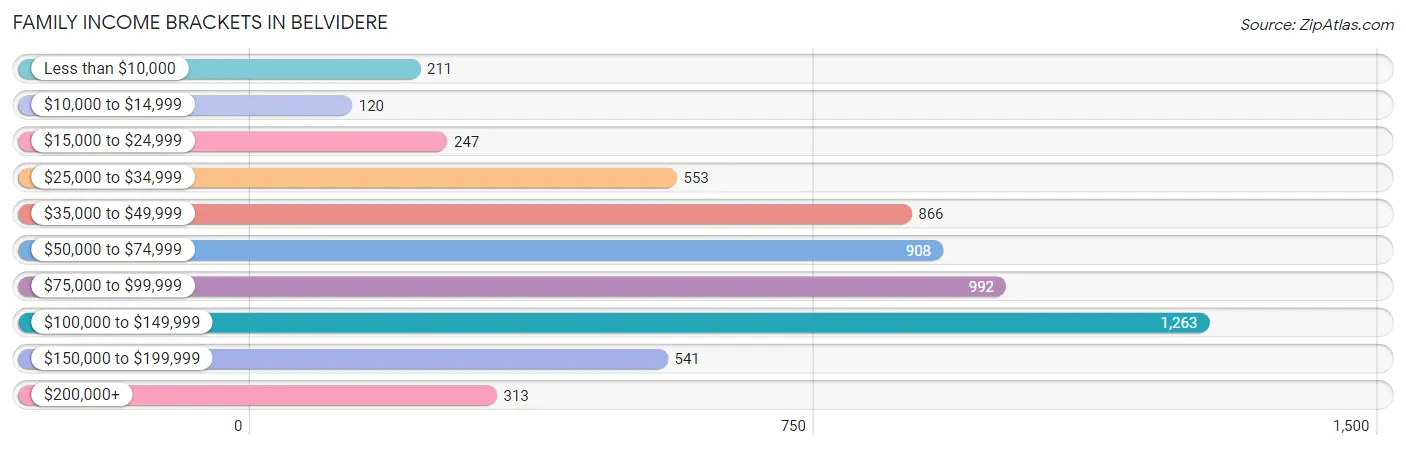
| Income Bracket | # Families | % Families |
| Less than $10,000 | 211 | 3.5% |
| $10,000 to $14,999 | 120 | 2.0% |
| $15,000 to $24,999 | 247 | 4.1% |
| $25,000 to $34,999 | 553 | 9.2% |
| $35,000 to $49,999 | 866 | 14.4% |
| $50,000 to $74,999 | 908 | 15.1% |
| $75,000 to $99,999 | 992 | 16.5% |
| $100,000 to $149,999 | 1,263 | 21.0% |
| $150,000 to $199,999 | 541 | 9.0% |
| $200,000+ | 313 | 5.2% |
Family Income by Famaliy Size in Belvidere
7+ person families (141 | 2.3%) account for the highest median family income in Belvidere with $129,464 per family, while 2-person families (2,622 | 43.6%) have the highest median income of $30,142 per family member.
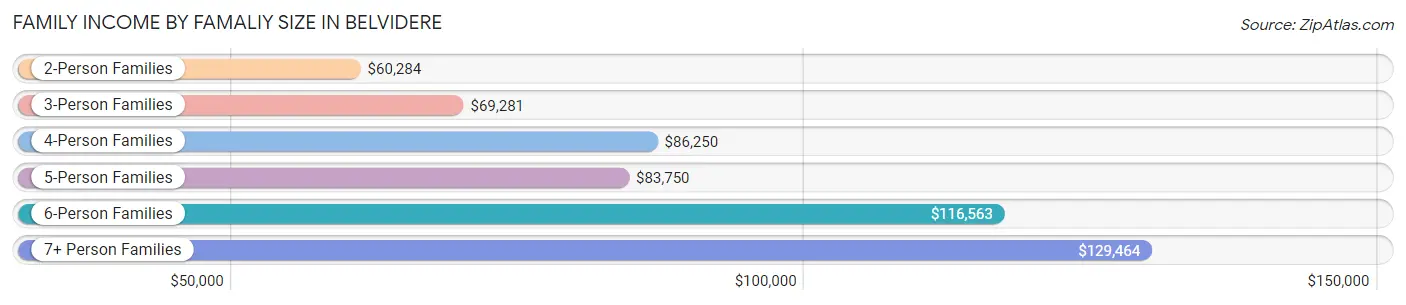
| Income Bracket | # Families | Median Income |
| 2-Person Families | 2,622 (43.6%) | $60,284 |
| 3-Person Families | 1,503 (25.0%) | $69,281 |
| 4-Person Families | 832 (13.8%) | $86,250 |
| 5-Person Families | 785 (13.1%) | $83,750 |
| 6-Person Families | 132 (2.2%) | $116,563 |
| 7+ Person Families | 141 (2.3%) | $129,464 |
| Total | 6,015 (100.0%) | $77,738 |
Family Income by Number of Earners in Belvidere
The median family income in Belvidere is $77,738, with families comprising 3+ earners (1,413) having the highest median family income of $129,162, while families with 1 earner (2,158) have the lowest median family income of $39,864, accounting for 23.5% and 35.9% of families, respectively.
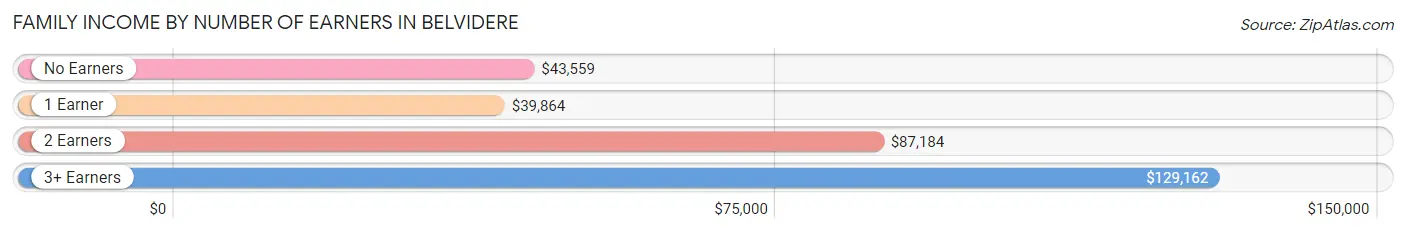
| Number of Earners | # Families | Median Income |
| No Earners | 524 (8.7%) | $43,559 |
| 1 Earner | 2,158 (35.9%) | $39,864 |
| 2 Earners | 1,920 (31.9%) | $87,184 |
| 3+ Earners | 1,413 (23.5%) | $129,162 |
| Total | 6,015 (100.0%) | $77,738 |
Household Income in Belvidere
Household Income Brackets in Belvidere
With 1,632 households falling in the category, the $50,000 to $74,999 income range is the most frequent in Belvidere, accounting for 16.8% of all households. In contrast, only 311 households (3.2%) fall into the $200,000+ income bracket, making it the least populous group.
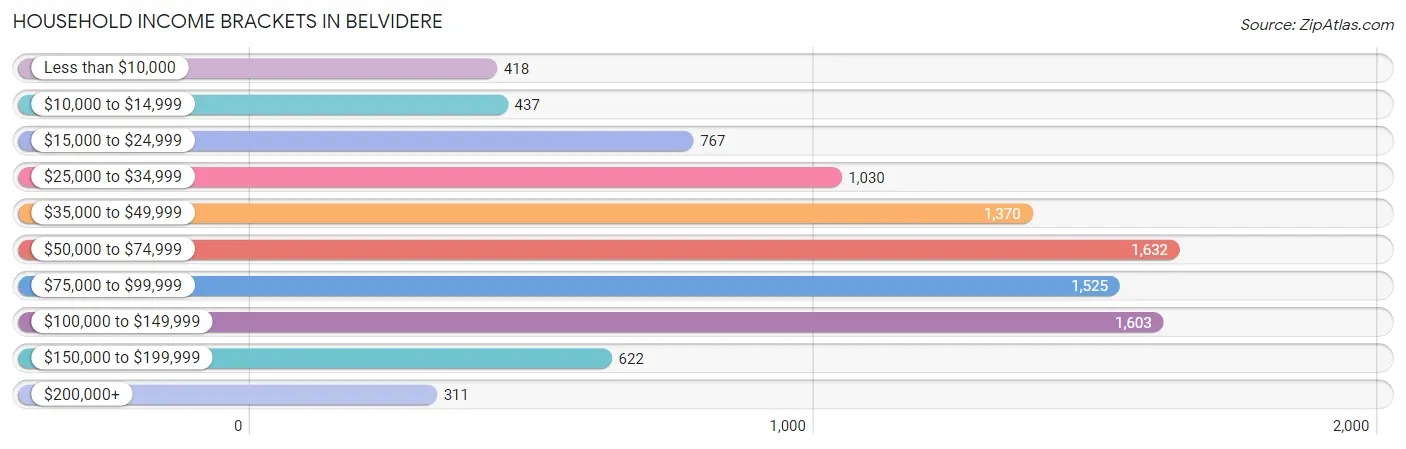
| Income Bracket | # Households | % Households |
| Less than $10,000 | 418 | 4.3% |
| $10,000 to $14,999 | 437 | 4.5% |
| $15,000 to $24,999 | 767 | 7.9% |
| $25,000 to $34,999 | 1,030 | 10.6% |
| $35,000 to $49,999 | 1,370 | 14.1% |
| $50,000 to $74,999 | 1,632 | 16.8% |
| $75,000 to $99,999 | 1,525 | 15.7% |
| $100,000 to $149,999 | 1,603 | 16.5% |
| $150,000 to $199,999 | 622 | 6.4% |
| $200,000+ | 311 | 3.2% |
Household Income by Householder Age in Belvidere
The median household income in Belvidere is $59,216, with the highest median household income of $80,095 found in the 45 to 64 years age bracket for the primary householder. A total of 3,871 households (39.9%) fall into this category. Meanwhile, the 15 to 24 years age bracket for the primary householder has the lowest median household income of $0, with 157 households (1.6%) in this group.
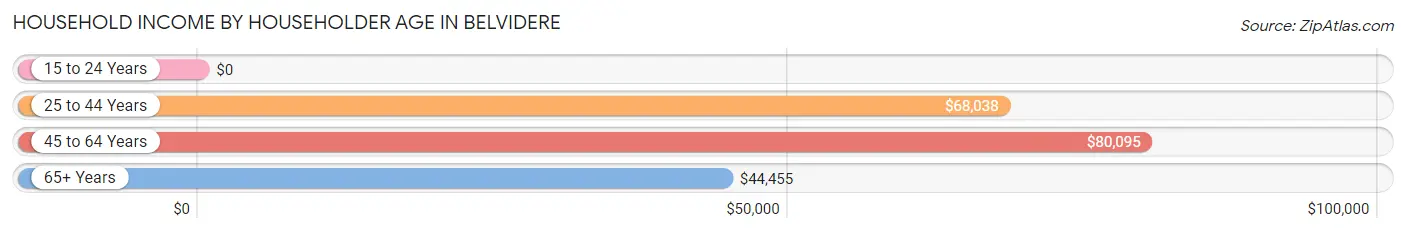
| Income Bracket | # Households | Median Income |
| 15 to 24 Years | 157 (1.6%) | $0 |
| 25 to 44 Years | 2,628 (27.1%) | $68,038 |
| 45 to 64 Years | 3,871 (39.9%) | $80,095 |
| 65+ Years | 3,058 (31.5%) | $44,455 |
| Total | 9,714 (100.0%) | $59,216 |
Poverty in Belvidere
Income Below Poverty by Sex and Age in Belvidere
With 13.1% poverty level for males and 15.8% for females among the residents of Belvidere, 15 year old males and 15 year old females are the most vulnerable to poverty, with 61 males (47.3%) and 51 females (58.6%) in their respective age groups living below the poverty level.
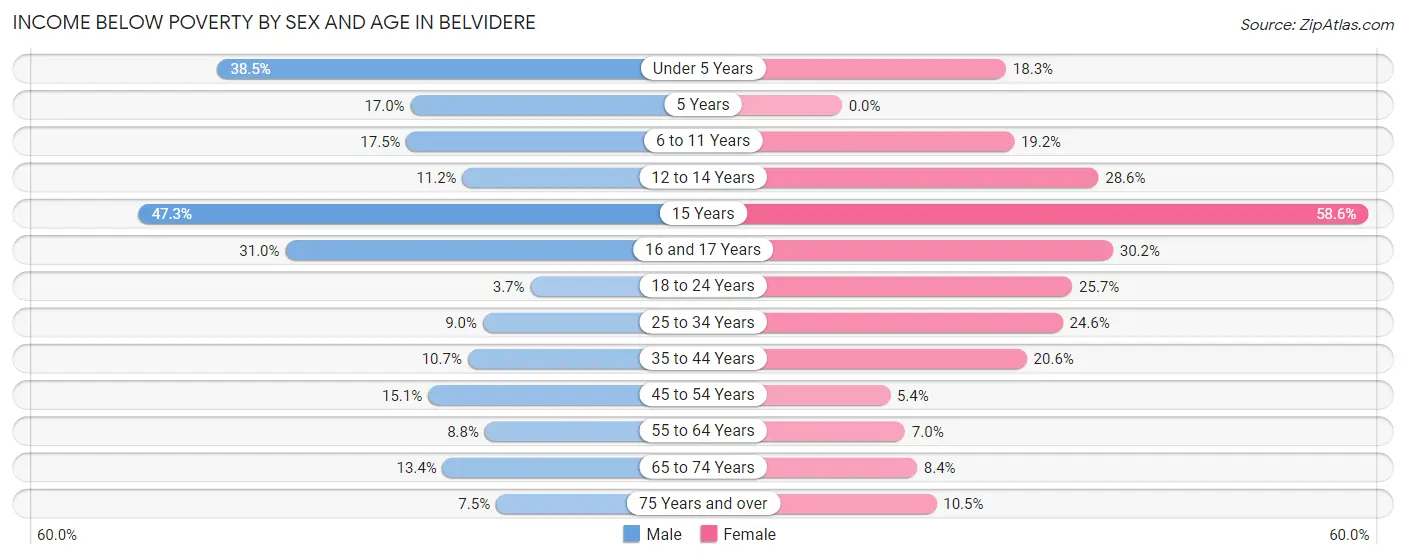
| Age Bracket | Male | Female |
| Under 5 Years | 208 (38.5%) | 132 (18.3%) |
| 5 Years | 39 (17.0%) | 0 (0.0%) |
| 6 to 11 Years | 228 (17.5%) | 130 (19.2%) |
| 12 to 14 Years | 38 (11.2%) | 112 (28.6%) |
| 15 Years | 61 (47.3%) | 51 (58.6%) |
| 16 and 17 Years | 74 (31.0%) | 147 (30.2%) |
| 18 to 24 Years | 48 (3.7%) | 327 (25.7%) |
| 25 to 34 Years | 147 (9.0%) | 343 (24.6%) |
| 35 to 44 Years | 140 (10.6%) | 314 (20.6%) |
| 45 to 54 Years | 273 (15.1%) | 98 (5.4%) |
| 55 to 64 Years | 133 (8.7%) | 111 (7.0%) |
| 65 to 74 Years | 180 (13.4%) | 108 (8.4%) |
| 75 Years and over | 49 (7.5%) | 100 (10.5%) |
| Total | 1,618 (13.1%) | 1,973 (15.8%) |
Income Above Poverty by Sex and Age in Belvidere
According to the poverty statistics in Belvidere, males aged 18 to 24 years and females aged 5 years are the age groups that are most secure financially, with 96.3% of males and 100.0% of females in these age groups living above the poverty line.
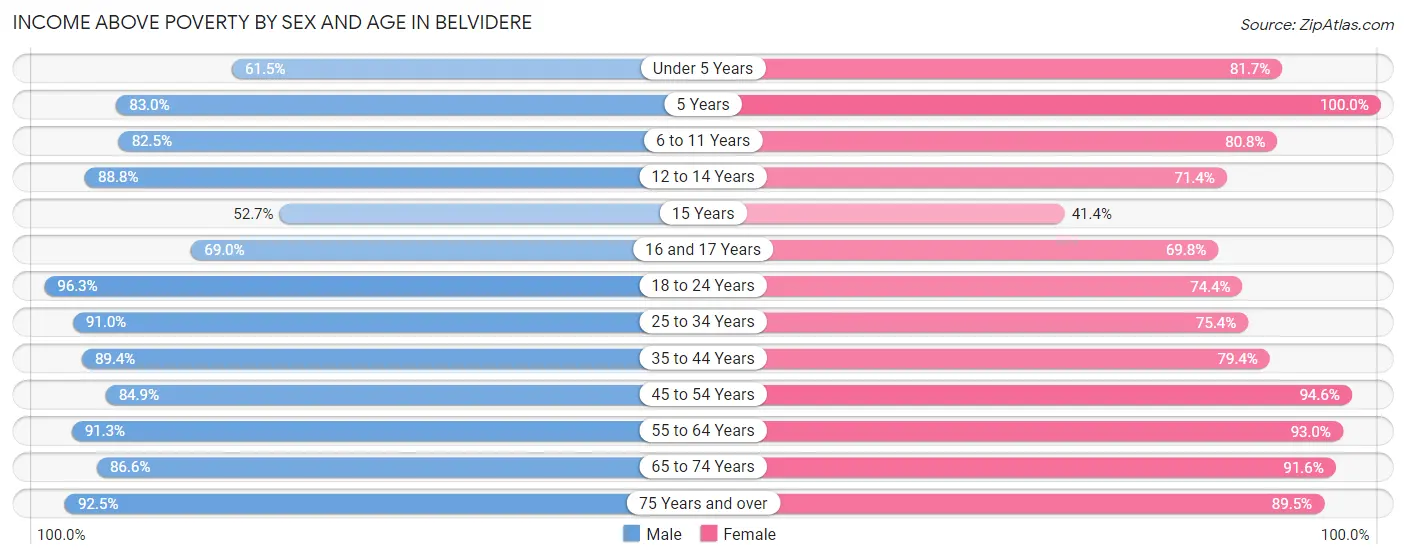
| Age Bracket | Male | Female |
| Under 5 Years | 332 (61.5%) | 590 (81.7%) |
| 5 Years | 190 (83.0%) | 285 (100.0%) |
| 6 to 11 Years | 1,076 (82.5%) | 548 (80.8%) |
| 12 to 14 Years | 300 (88.8%) | 280 (71.4%) |
| 15 Years | 68 (52.7%) | 36 (41.4%) |
| 16 and 17 Years | 165 (69.0%) | 340 (69.8%) |
| 18 to 24 Years | 1,260 (96.3%) | 948 (74.4%) |
| 25 to 34 Years | 1,492 (91.0%) | 1,052 (75.4%) |
| 35 to 44 Years | 1,174 (89.3%) | 1,211 (79.4%) |
| 45 to 54 Years | 1,538 (84.9%) | 1,729 (94.6%) |
| 55 to 64 Years | 1,387 (91.2%) | 1,468 (93.0%) |
| 65 to 74 Years | 1,159 (86.6%) | 1,184 (91.6%) |
| 75 Years and over | 604 (92.5%) | 851 (89.5%) |
| Total | 10,745 (86.9%) | 10,522 (84.2%) |
Income Below Poverty Among Married-Couple Families in Belvidere
The poverty statistics for married-couple families in Belvidere show that 5.8% or 228 of the total 3,960 families live below the poverty line. Families with 3 or 4 children have the highest poverty rate of 21.2%, comprising of 85 families. On the other hand, families with no children have the lowest poverty rate of 2.5%, which includes 61 families.
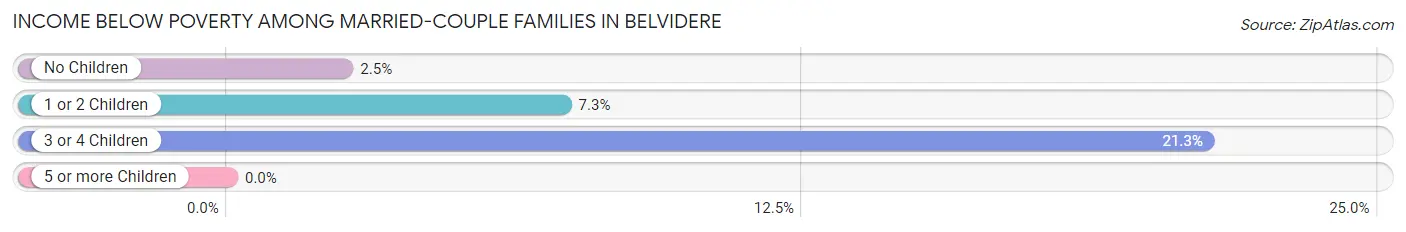
| Children | Above Poverty | Below Poverty |
| No Children | 2,370 (97.5%) | 61 (2.5%) |
| 1 or 2 Children | 1,047 (92.7%) | 82 (7.3%) |
| 3 or 4 Children | 315 (78.7%) | 85 (21.2%) |
| 5 or more Children | 0 (0.0%) | 0 (0.0%) |
| Total | 3,732 (94.2%) | 228 (5.8%) |
Income Below Poverty Among Single-Parent Households in Belvidere
According to the poverty data in Belvidere, 4.8% or 27 single-father households and 23.0% or 344 single-mother households are living below the poverty line. Among single-father households, those with no children have the highest poverty rate, with 17 households (9.0%) experiencing poverty. Likewise, among single-mother households, those with 5 or more children have the highest poverty rate, with 21 households (100.0%) falling below the poverty line.
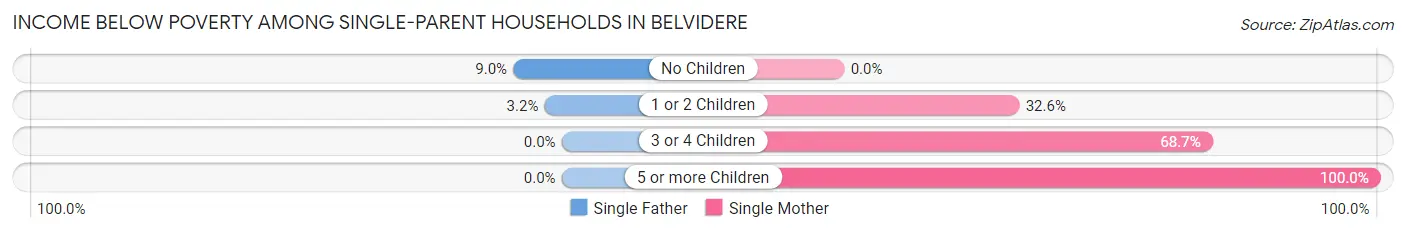
| Children | Single Father | Single Mother |
| No Children | 17 (9.0%) | 0 (0.0%) |
| 1 or 2 Children | 10 (3.2%) | 255 (32.6%) |
| 3 or 4 Children | 0 (0.0%) | 68 (68.7%) |
| 5 or more Children | 0 (0.0%) | 21 (100.0%) |
| Total | 27 (4.8%) | 344 (23.0%) |
Income Below Poverty Among Married-Couple vs Single-Parent Households in Belvidere
The poverty data for Belvidere shows that 228 of the married-couple family households (5.8%) and 371 of the single-parent households (18.0%) are living below the poverty level. Within the married-couple family households, those with 3 or 4 children have the highest poverty rate, with 85 households (21.2%) falling below the poverty line. Among the single-parent households, those with 5 or more children have the highest poverty rate, with 21 household (100.0%) living below poverty.
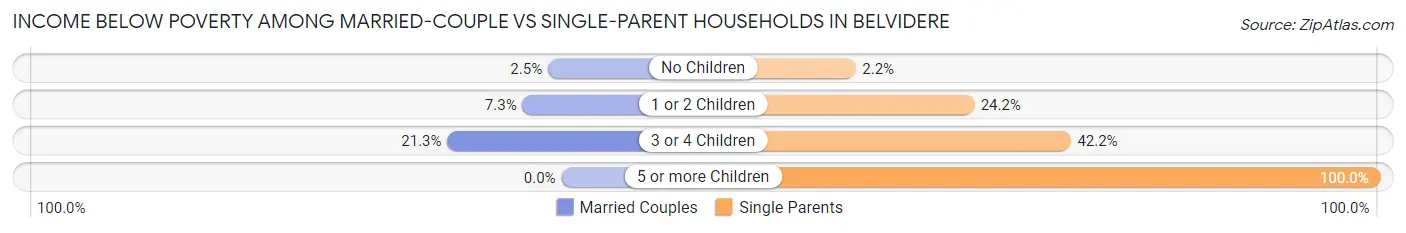
| Children | Married-Couple Families | Single-Parent Households |
| No Children | 61 (2.5%) | 17 (2.2%) |
| 1 or 2 Children | 82 (7.3%) | 265 (24.2%) |
| 3 or 4 Children | 85 (21.2%) | 68 (42.2%) |
| 5 or more Children | 0 (0.0%) | 21 (100.0%) |
| Total | 228 (5.8%) | 371 (18.0%) |
Race in Belvidere
The most populous races in Belvidere are White / Caucasian (18,201 | 71.7%), Hispanic or Latino (9,391 | 37.0%), and Some other Race (4,313 | 17.0%).
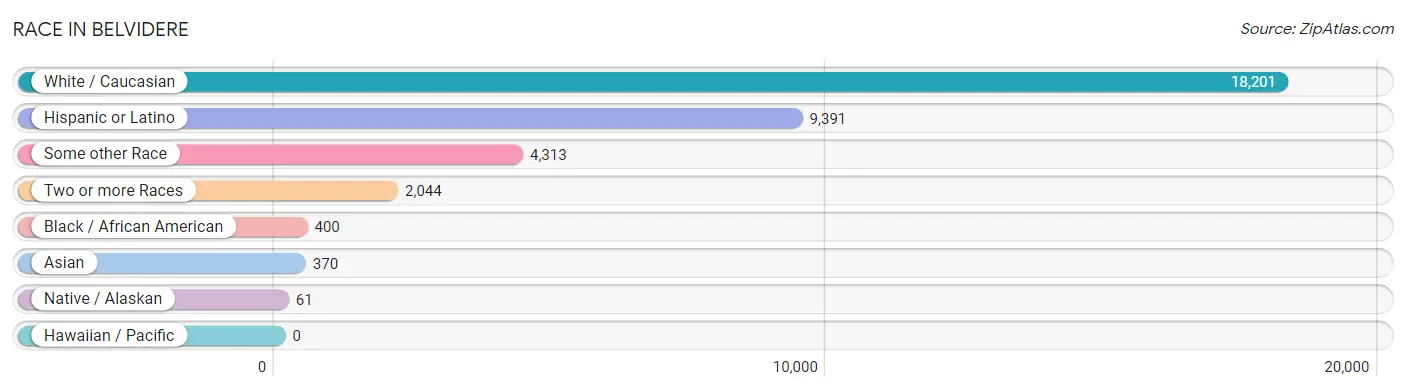
| Race | # Population | % Population |
| Asian | 370 | 1.5% |
| Black / African American | 400 | 1.6% |
| Hawaiian / Pacific | 0 | 0.0% |
| Hispanic or Latino | 9,391 | 37.0% |
| Native / Alaskan | 61 | 0.2% |
| White / Caucasian | 18,201 | 71.7% |
| Two or more Races | 2,044 | 8.1% |
| Some other Race | 4,313 | 17.0% |
| Total | 25,389 | 100.0% |
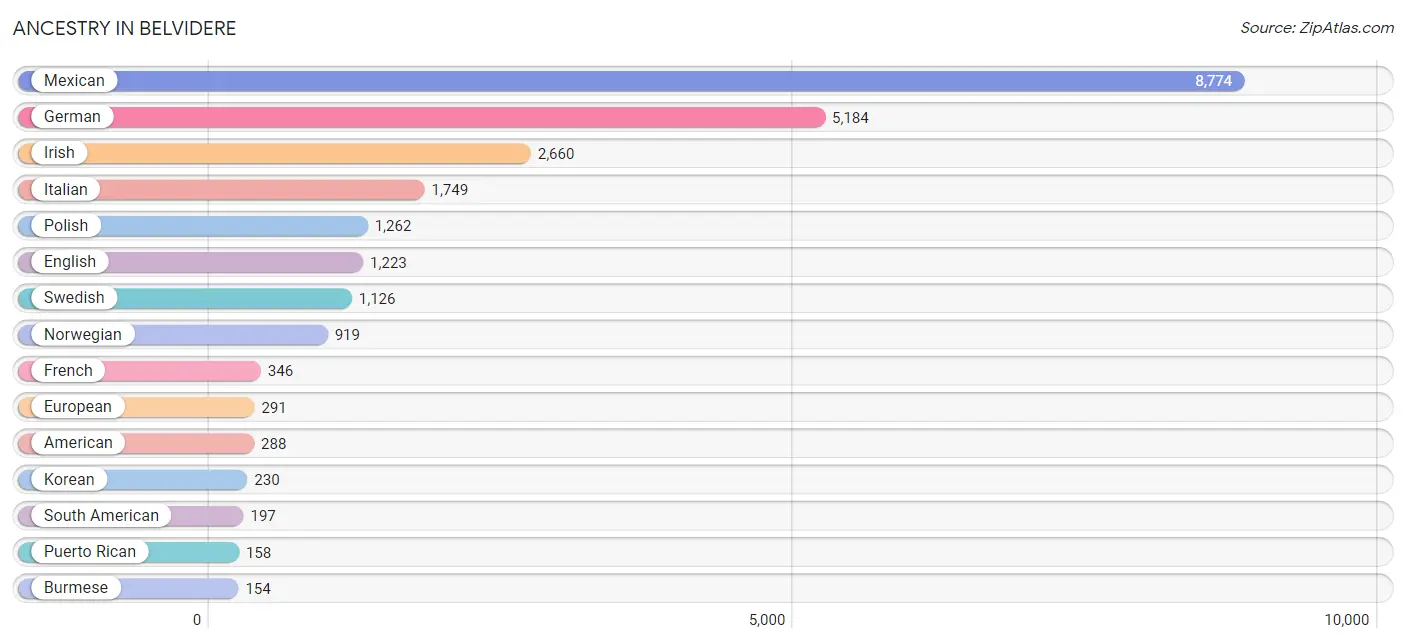
Ancestry in Belvidere
The most populous ancestries reported in Belvidere are Mexican (8,774 | 34.6%), German (5,184 | 20.4%), Irish (2,660 | 10.5%), Italian (1,749 | 6.9%), and Polish (1,262 | 5.0%), together accounting for 77.3% of all Belvidere residents.
| Ancestry | # Population | % Population |
| American | 288 | 1.1% |
| Arab | 86 | 0.3% |
| Argentinean | 110 | 0.4% |
| Austrian | 36 | 0.1% |
| Belgian | 41 | 0.2% |
| Bhutanese | 31 | 0.1% |
| British | 87 | 0.3% |
| Burmese | 154 | 0.6% |
| Canadian | 51 | 0.2% |
| Central American | 26 | 0.1% |
| Cherokee | 8 | 0.0% |
| Croatian | 25 | 0.1% |
| Cuban | 11 | 0.0% |
| Czech | 25 | 0.1% |
| Czechoslovakian | 14 | 0.1% |
| Danish | 44 | 0.2% |
| Dutch | 96 | 0.4% |
| Eastern European | 72 | 0.3% |
| Ecuadorian | 19 | 0.1% |
| English | 1,223 | 4.8% |
| European | 291 | 1.1% |
| Finnish | 23 | 0.1% |
| French | 346 | 1.4% |
| French Canadian | 89 | 0.4% |
| German | 5,184 | 20.4% |
| Ghanaian | 20 | 0.1% |
| Greek | 7 | 0.0% |
| Haitian | 5 | 0.0% |
| Irish | 2,660 | 10.5% |
| Italian | 1,749 | 6.9% |
| Korean | 230 | 0.9% |
| Lithuanian | 17 | 0.1% |
| Malaysian | 74 | 0.3% |
| Mexican | 8,774 | 34.6% |
| Mexican American Indian | 61 | 0.2% |
| Norwegian | 919 | 3.6% |
| Palestinian | 62 | 0.2% |
| Pennsylvania German | 17 | 0.1% |
| Peruvian | 68 | 0.3% |
| Polish | 1,262 | 5.0% |
| Puerto Rican | 158 | 0.6% |
| Russian | 151 | 0.6% |
| Salvadoran | 26 | 0.1% |
| Scandinavian | 9 | 0.0% |
| Scotch-Irish | 73 | 0.3% |
| Scottish | 153 | 0.6% |
| Serbian | 19 | 0.1% |
| Sioux | 11 | 0.0% |
| South American | 197 | 0.8% |
| South American Indian | 31 | 0.1% |
| Spaniard | 71 | 0.3% |
| Spanish | 98 | 0.4% |
| Sri Lankan | 20 | 0.1% |
| Subsaharan African | 20 | 0.1% |
| Swedish | 1,126 | 4.4% |
| Swiss | 53 | 0.2% |
| Syrian | 64 | 0.3% |
| Thai | 25 | 0.1% |
| Turkish | 24 | 0.1% |
| Ukrainian | 15 | 0.1% |
| Welsh | 93 | 0.4% | View All 61 Rows |
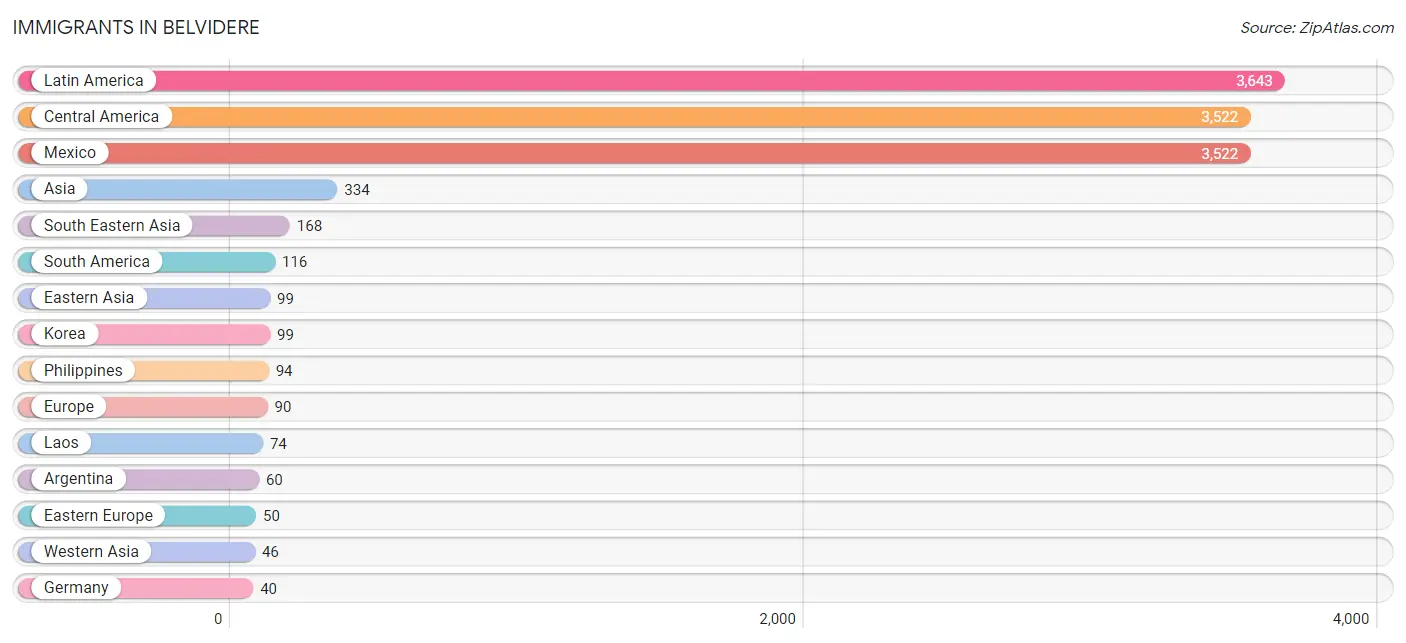
Immigrants in Belvidere
The most numerous immigrant groups reported in Belvidere came from Latin America (3,643 | 14.3%), Central America (3,522 | 13.9%), Mexico (3,522 | 13.9%), Asia (334 | 1.3%), and South Eastern Asia (168 | 0.7%), together accounting for 44.1% of all Belvidere residents.
| Immigration Origin | # Population | % Population |
| Africa | 20 | 0.1% |
| Argentina | 60 | 0.2% |
| Asia | 334 | 1.3% |
| Canada | 7 | 0.0% |
| Caribbean | 5 | 0.0% |
| Central America | 3,522 | 13.9% |
| Croatia | 27 | 0.1% |
| Eastern Asia | 99 | 0.4% |
| Eastern Europe | 50 | 0.2% |
| Ecuador | 19 | 0.1% |
| Europe | 90 | 0.4% |
| Germany | 40 | 0.2% |
| Ghana | 20 | 0.1% |
| Haiti | 5 | 0.0% |
| India | 21 | 0.1% |
| Korea | 99 | 0.4% |
| Laos | 74 | 0.3% |
| Latin America | 3,643 | 14.3% |
| Lebanon | 22 | 0.1% |
| Mexico | 3,522 | 13.9% |
| North Macedonia | 6 | 0.0% |
| Peru | 37 | 0.2% |
| Philippines | 94 | 0.4% |
| Poland | 17 | 0.1% |
| South America | 116 | 0.5% |
| South Central Asia | 21 | 0.1% |
| South Eastern Asia | 168 | 0.7% |
| Western Africa | 20 | 0.1% |
| Western Asia | 46 | 0.2% |
| Western Europe | 40 | 0.2% | View All 30 Rows |
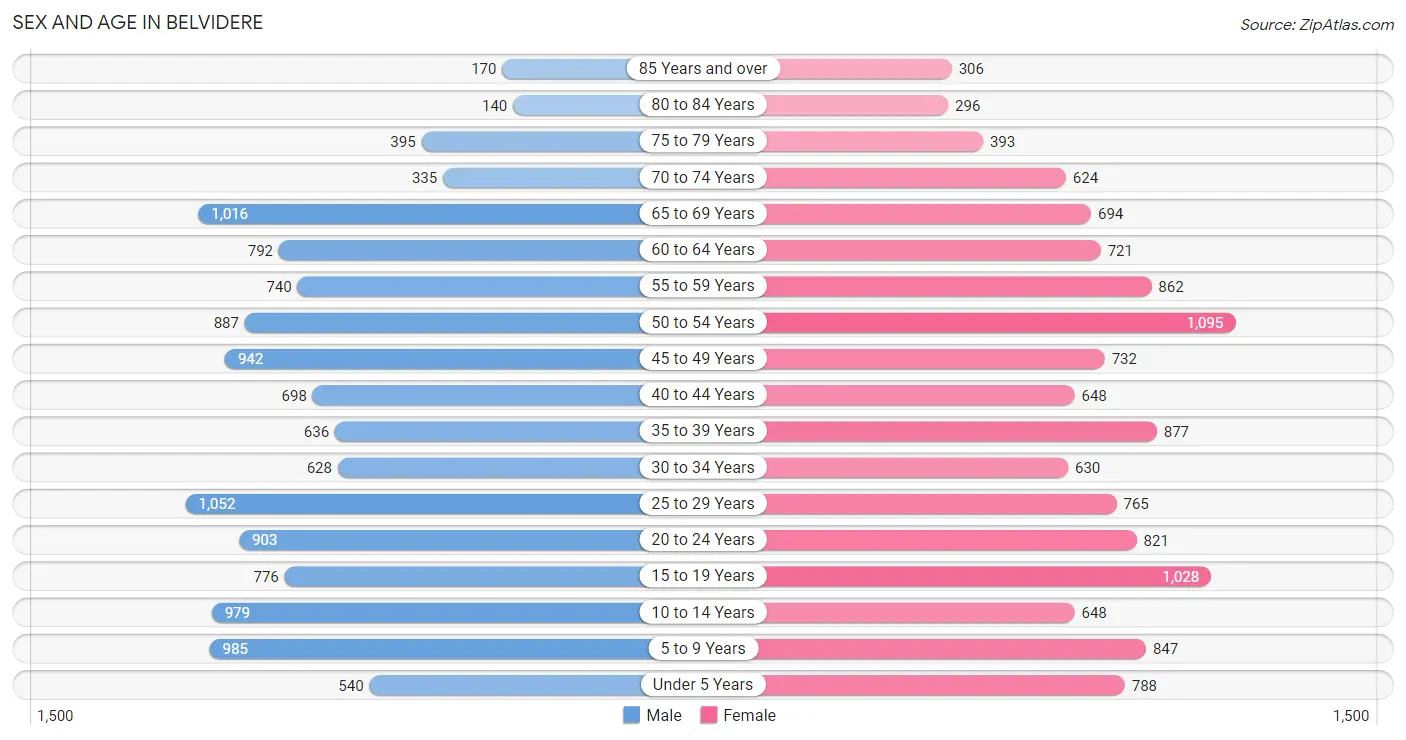
Sex and Age in Belvidere
Sex and Age in Belvidere
The most populous age groups in Belvidere are 25 to 29 Years (1,052 | 8.3%) for men and 50 to 54 Years (1,095 | 8.6%) for women.
| Age Bracket | Male | Female |
| Under 5 Years | 540 (4.3%) | 788 (6.2%) |
| 5 to 9 Years | 985 (7.8%) | 847 (6.6%) |
| 10 to 14 Years | 979 (7.8%) | 648 (5.1%) |
| 15 to 19 Years | 776 (6.1%) | 1,028 (8.1%) |
| 20 to 24 Years | 903 (7.2%) | 821 (6.4%) |
| 25 to 29 Years | 1,052 (8.3%) | 765 (6.0%) |
| 30 to 34 Years | 628 (5.0%) | 630 (4.9%) |
| 35 to 39 Years | 636 (5.0%) | 877 (6.9%) |
| 40 to 44 Years | 698 (5.5%) | 648 (5.1%) |
| 45 to 49 Years | 942 (7.5%) | 732 (5.7%) |
| 50 to 54 Years | 887 (7.0%) | 1,095 (8.6%) |
| 55 to 59 Years | 740 (5.9%) | 862 (6.8%) |
| 60 to 64 Years | 792 (6.3%) | 721 (5.6%) |
| 65 to 69 Years | 1,016 (8.1%) | 694 (5.4%) |
| 70 to 74 Years | 335 (2.7%) | 624 (4.9%) |
| 75 to 79 Years | 395 (3.1%) | 393 (3.1%) |
| 80 to 84 Years | 140 (1.1%) | 296 (2.3%) |
| 85 Years and over | 170 (1.3%) | 306 (2.4%) |
| Total | 12,614 (100.0%) | 12,775 (100.0%) |
Families and Households in Belvidere
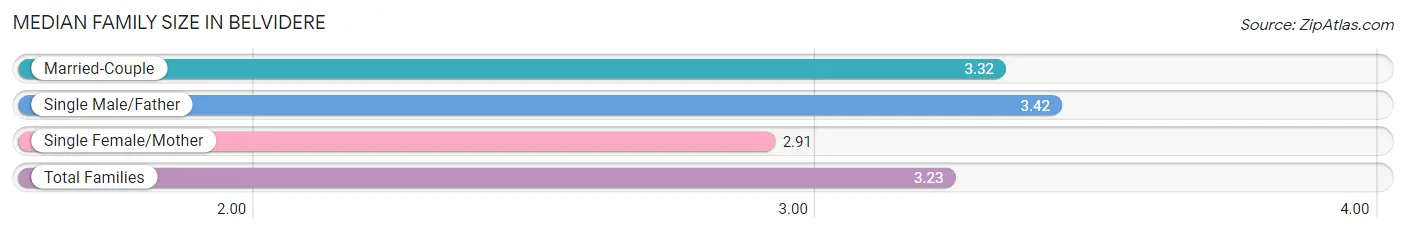
Median Family Size in Belvidere
The median family size in Belvidere is 3.23 persons per family, with single male/father families (562 | 9.3%) accounting for the largest median family size of 3.42 persons per family. On the other hand, single female/mother families (1,493 | 24.8%) represent the smallest median family size with 2.91 persons per family.
| Family Type | # Families | Family Size |
| Married-Couple | 3,960 (65.8%) | 3.32 |
| Single Male/Father | 562 (9.3%) | 3.42 |
| Single Female/Mother | 1,493 (24.8%) | 2.91 |
| Total Families | 6,015 (100.0%) | 3.23 |
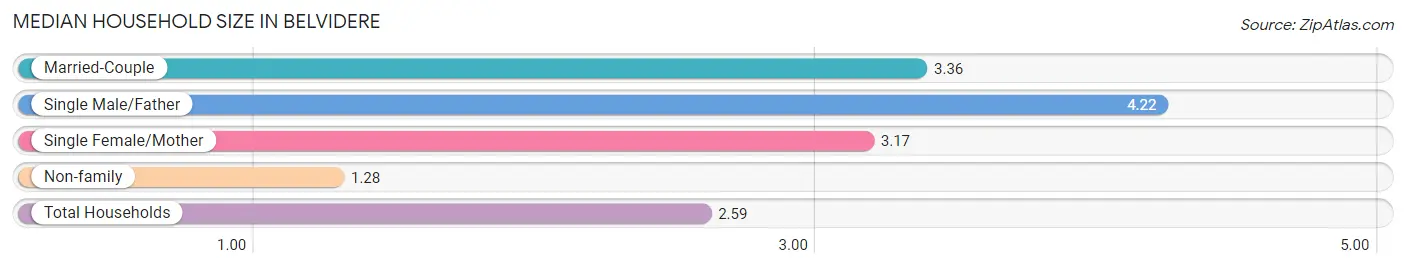
Median Household Size in Belvidere
The median household size in Belvidere is 2.59 persons per household, with single male/father households (562 | 5.8%) accounting for the largest median household size of 4.22 persons per household. non-family households (3,699 | 38.1%) represent the smallest median household size with 1.28 persons per household.
| Household Type | # Households | Household Size |
| Married-Couple | 3,960 (40.8%) | 3.36 |
| Single Male/Father | 562 (5.8%) | 4.22 |
| Single Female/Mother | 1,493 (15.4%) | 3.17 |
| Non-family | 3,699 (38.1%) | 1.28 |
| Total Households | 9,714 (100.0%) | 2.59 |
Household Size by Marriage Status in Belvidere
Out of a total of 9,714 households in Belvidere, 6,015 (61.9%) are family households, while 3,699 (38.1%) are nonfamily households. The most numerous type of family households are 2-person households, comprising 2,361, and the most common type of nonfamily households are 1-person households, comprising 2,889.
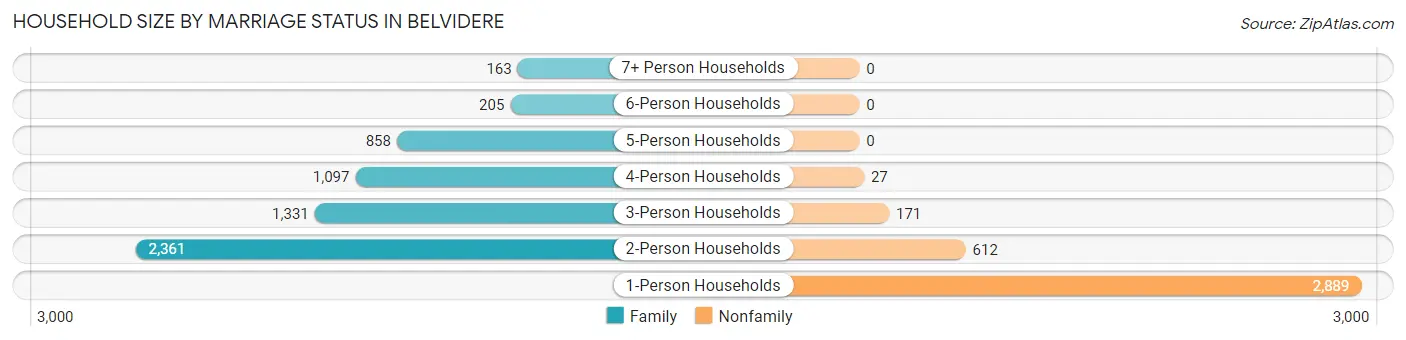
| Household Size | Family Households | Nonfamily Households |
| 1-Person Households | - | 2,889 (29.7%) |
| 2-Person Households | 2,361 (24.3%) | 612 (6.3%) |
| 3-Person Households | 1,331 (13.7%) | 171 (1.8%) |
| 4-Person Households | 1,097 (11.3%) | 27 (0.3%) |
| 5-Person Households | 858 (8.8%) | 0 (0.0%) |
| 6-Person Households | 205 (2.1%) | 0 (0.0%) |
| 7+ Person Households | 163 (1.7%) | 0 (0.0%) |
| Total | 6,015 (61.9%) | 3,699 (38.1%) |
Female Fertility in Belvidere
Fertility by Age in Belvidere
Average fertility rate in Belvidere is 45.0 births per 1,000 women. Women in the age bracket of 20 to 34 years have the highest fertility rate with 120.0 births per 1,000 women. Women in the age bracket of 20 to 34 years acount for 100.0% of all women with births.
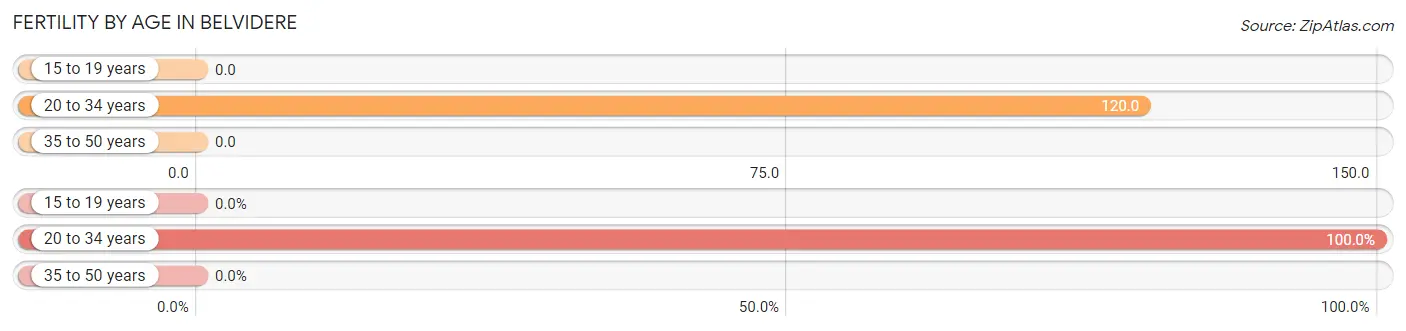
| Age Bracket | Women with Births | Births / 1,000 Women |
| 15 to 19 years | 0 (0.0%) | 0.0 |
| 20 to 34 years | 266 (100.0%) | 120.0 |
| 35 to 50 years | 0 (0.0%) | 0.0 |
| Total | 266 (100.0%) | 45.0 |
Fertility by Age by Marriage Status in Belvidere
16.9% of women with births (266) in Belvidere are married. The highest percentage of unmarried women with births falls into 20 to 34 years age bracket with 83.1% of them unmarried at the time of birth, while the lowest percentage of unmarried women with births belong to 20 to 34 years age bracket with 83.1% of them unmarried.
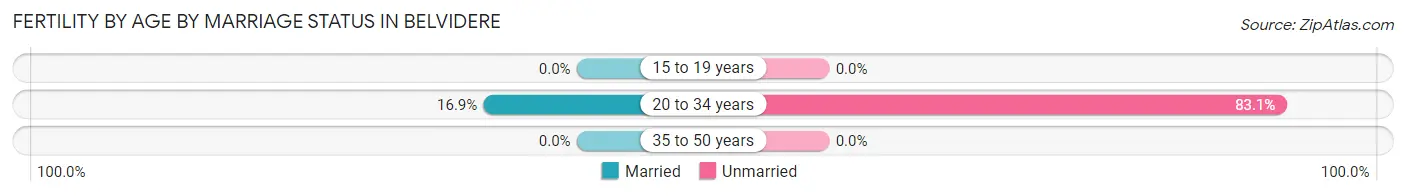
| Age Bracket | Married | Unmarried |
| 15 to 19 years | 0 (0.0%) | 0 (0.0%) |
| 20 to 34 years | 45 (16.9%) | 221 (83.1%) |
| 35 to 50 years | 0 (0.0%) | 0 (0.0%) |
| Total | 45 (16.9%) | 221 (83.1%) |
Fertility by Education in Belvidere
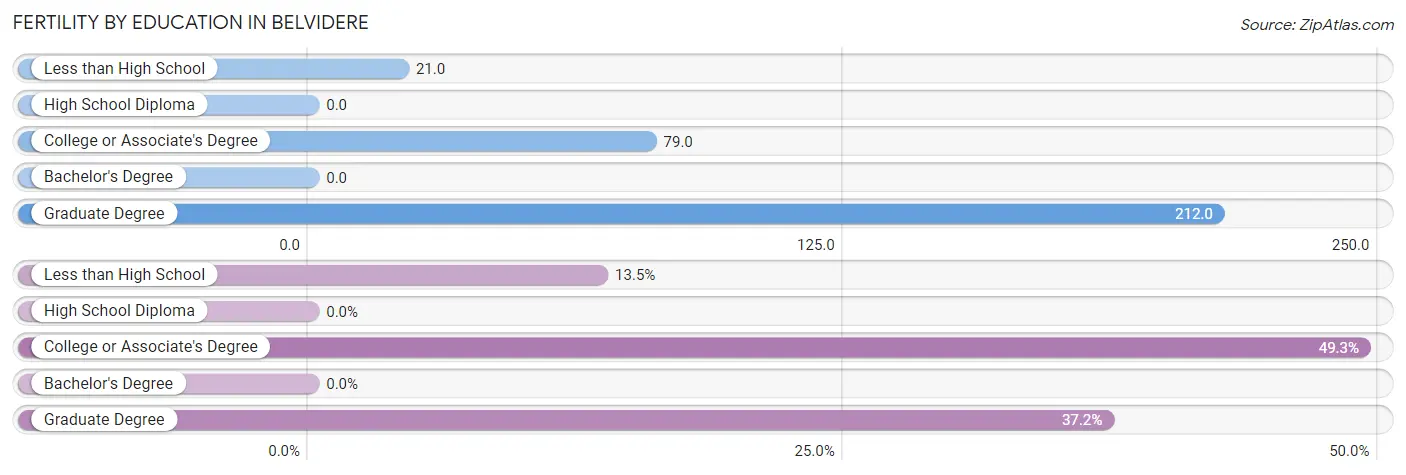
| Educational Attainment | Women with Births | Births / 1,000 Women |
| Less than High School | 36 (13.5%) | 21.0 |
| High School Diploma | 0 (0.0%) | 0.0 |
| College or Associate's Degree | 131 (49.2%) | 79.0 |
| Bachelor's Degree | 0 (0.0%) | 0.0 |
| Graduate Degree | 99 (37.2%) | 212.0 |
| Total | 266 (100.0%) | 45.0 |
Fertility by Education by Marriage Status in Belvidere
83.1% of women with births in Belvidere are unmarried. Women with the educational attainment of college or associate's degree are most likely to be married with 25.2% of them married at childbirth, while women with the educational attainment of less than high school are least likely to be married with 100.0% of them unmarried at childbirth.
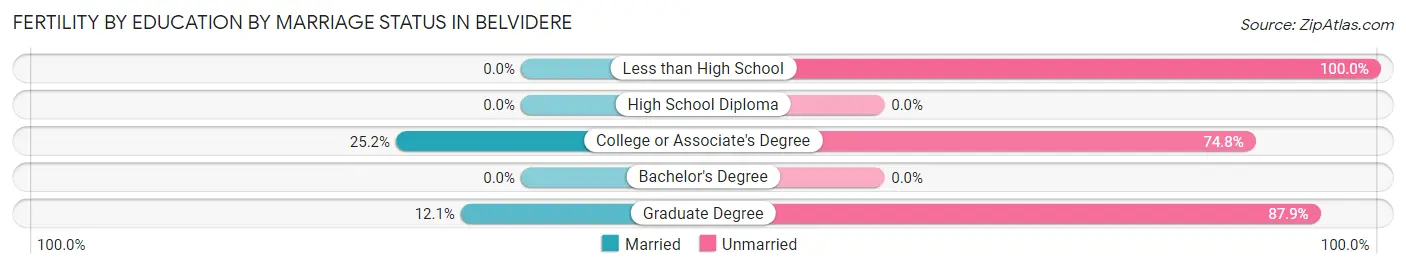
| Educational Attainment | Married | Unmarried |
| Less than High School | 0 (0.0%) | 36 (100.0%) |
| High School Diploma | 0 (0.0%) | 0 (0.0%) |
| College or Associate's Degree | 33 (25.2%) | 98 (74.8%) |
| Bachelor's Degree | 0 (0.0%) | 0 (0.0%) |
| Graduate Degree | 12 (12.1%) | 87 (87.9%) |
| Total | 45 (16.9%) | 221 (83.1%) |
Employment Characteristics in Belvidere
Employment by Class of Employer in Belvidere
Among the 12,372 employed individuals in Belvidere, private company employees (10,333 | 83.5%), local government employees (752 | 6.1%), and not-for-profit organizations (492 | 4.0%) make up the most common classes of employment.
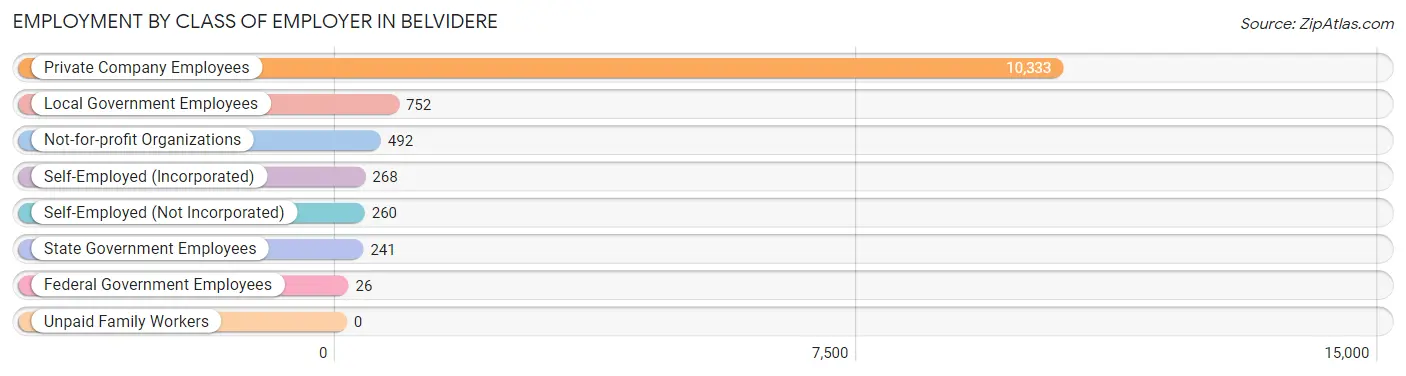
| Employer Class | # Employees | % Employees |
| Private Company Employees | 10,333 | 83.5% |
| Self-Employed (Incorporated) | 268 | 2.2% |
| Self-Employed (Not Incorporated) | 260 | 2.1% |
| Not-for-profit Organizations | 492 | 4.0% |
| Local Government Employees | 752 | 6.1% |
| State Government Employees | 241 | 1.9% |
| Federal Government Employees | 26 | 0.2% |
| Unpaid Family Workers | 0 | 0.0% |
| Total | 12,372 | 100.0% |
Employment Status by Age in Belvidere
According to the labor force statistics for Belvidere, out of the total population over 16 years of age (20,386), 66.7% or 13,597 individuals are in the labor force, with 5.6% or 761 of them unemployed. The age group with the highest labor force participation rate is 20 to 24 years, with 91.4% or 1,576 individuals in the labor force. Within the labor force, the 16 to 19 years age range has the highest percentage of unemployed individuals, with 16.9% or 144 of them being unemployed.
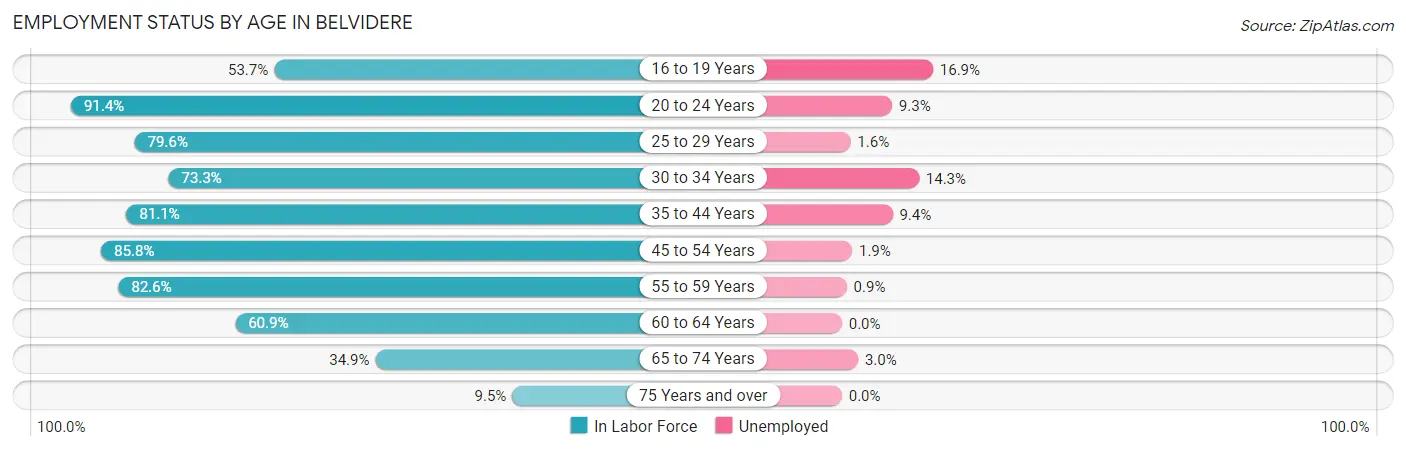
| Age Bracket | In Labor Force | Unemployed |
| 16 to 19 Years | 853 (53.7%) | 144 (16.9%) |
| 20 to 24 Years | 1,576 (91.4%) | 147 (9.3%) |
| 25 to 29 Years | 1,446 (79.6%) | 23 (1.6%) |
| 30 to 34 Years | 922 (73.3%) | 132 (14.3%) |
| 35 to 44 Years | 2,319 (81.1%) | 218 (9.4%) |
| 45 to 54 Years | 3,137 (85.8%) | 60 (1.9%) |
| 55 to 59 Years | 1,323 (82.6%) | 12 (0.9%) |
| 60 to 64 Years | 921 (60.9%) | 0 (0.0%) |
| 65 to 74 Years | 931 (34.9%) | 28 (3.0%) |
| 75 Years and over | 162 (9.5%) | 0 (0.0%) |
| Total | 13,597 (66.7%) | 761 (5.6%) |
Employment Status by Educational Attainment in Belvidere
According to labor force statistics for Belvidere, 79.3% of individuals (10,075) out of the total population between 25 and 64 years of age (12,705) are in the labor force, with 4.4% or 443 of them being unemployed. The group with the highest labor force participation rate are those with the educational attainment of bachelor's degree or higher, with 84.9% or 1,506 individuals in the labor force. Within the labor force, individuals with high school diploma education have the highest percentage of unemployment, with 5.6% or 168 of them being unemployed.
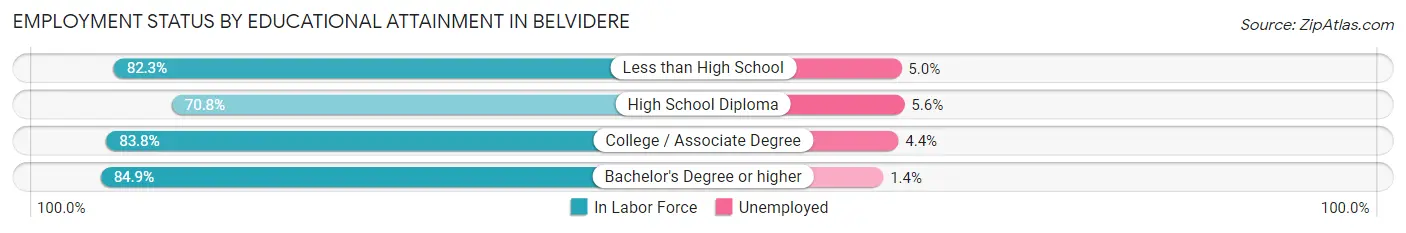
| Educational Attainment | In Labor Force | Unemployed |
| Less than High School | 2,452 (82.3%) | 149 (5.0%) |
| High School Diploma | 3,008 (70.8%) | 238 (5.6%) |
| College / Associate Degree | 3,103 (83.8%) | 163 (4.4%) |
| Bachelor's Degree or higher | 1,506 (84.9%) | 25 (1.4%) |
| Total | 10,075 (79.3%) | 559 (4.4%) |
Employment Occupations by Sex in Belvidere
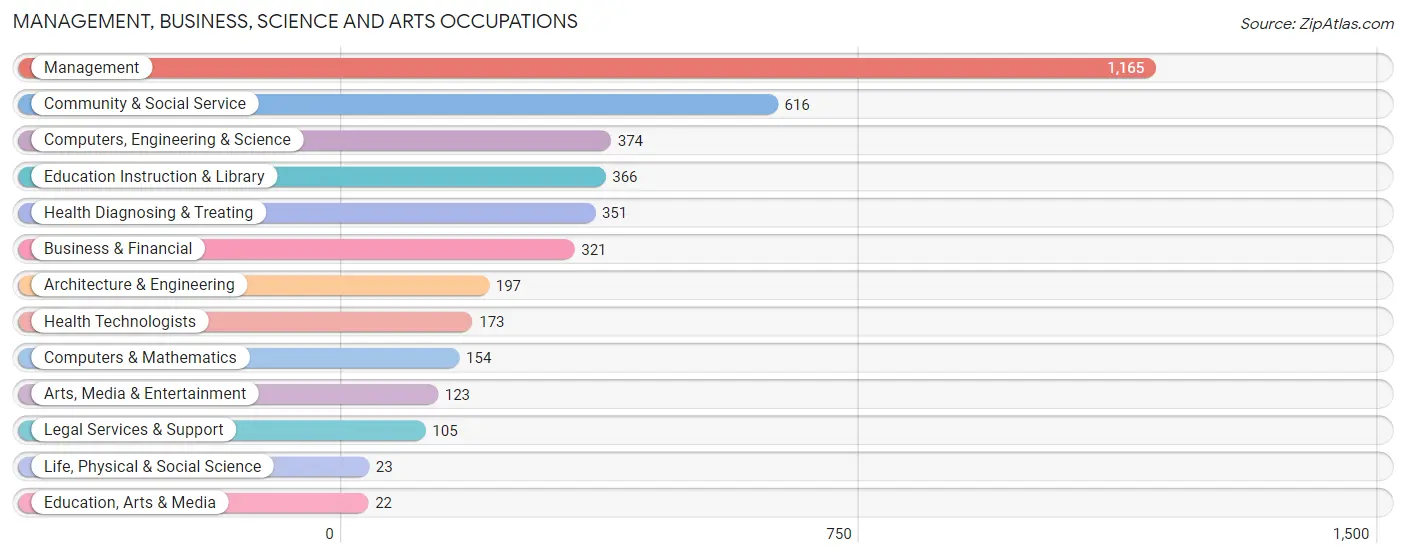
Management, Business, Science and Arts Occupations
The most common Management, Business, Science and Arts occupations in Belvidere are Management (1,165 | 9.1%), Community & Social Service (616 | 4.8%), Computers, Engineering & Science (374 | 2.9%), Education Instruction & Library (366 | 2.9%), and Health Diagnosing & Treating (351 | 2.7%).
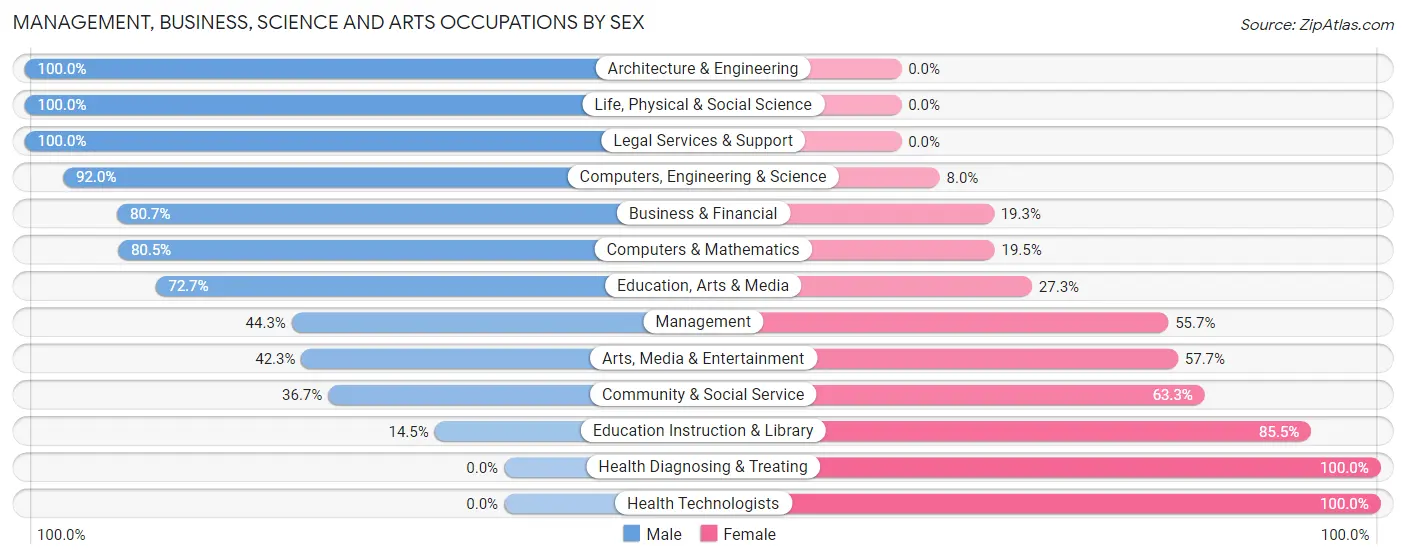
Management, Business, Science and Arts Occupations by Sex
Within the Management, Business, Science and Arts occupations in Belvidere, the most male-oriented occupations are Architecture & Engineering (100.0%), Life, Physical & Social Science (100.0%), and Legal Services & Support (100.0%), while the most female-oriented occupations are Health Diagnosing & Treating (100.0%), Health Technologists (100.0%), and Education Instruction & Library (85.5%).
| Occupation | Male | Female |
| Management | 516 (44.3%) | 649 (55.7%) |
| Business & Financial | 259 (80.7%) | 62 (19.3%) |
| Computers, Engineering & Science | 344 (92.0%) | 30 (8.0%) |
| Computers & Mathematics | 124 (80.5%) | 30 (19.5%) |
| Architecture & Engineering | 197 (100.0%) | 0 (0.0%) |
| Life, Physical & Social Science | 23 (100.0%) | 0 (0.0%) |
| Community & Social Service | 226 (36.7%) | 390 (63.3%) |
| Education, Arts & Media | 16 (72.7%) | 6 (27.3%) |
| Legal Services & Support | 105 (100.0%) | 0 (0.0%) |
| Education Instruction & Library | 53 (14.5%) | 313 (85.5%) |
| Arts, Media & Entertainment | 52 (42.3%) | 71 (57.7%) |
| Health Diagnosing & Treating | 0 (0.0%) | 351 (100.0%) |
| Health Technologists | 0 (0.0%) | 173 (100.0%) |
| Total (Category) | 1,345 (47.6%) | 1,482 (52.4%) |
| Total (Overall) | 6,843 (53.3%) | 5,984 (46.7%) |
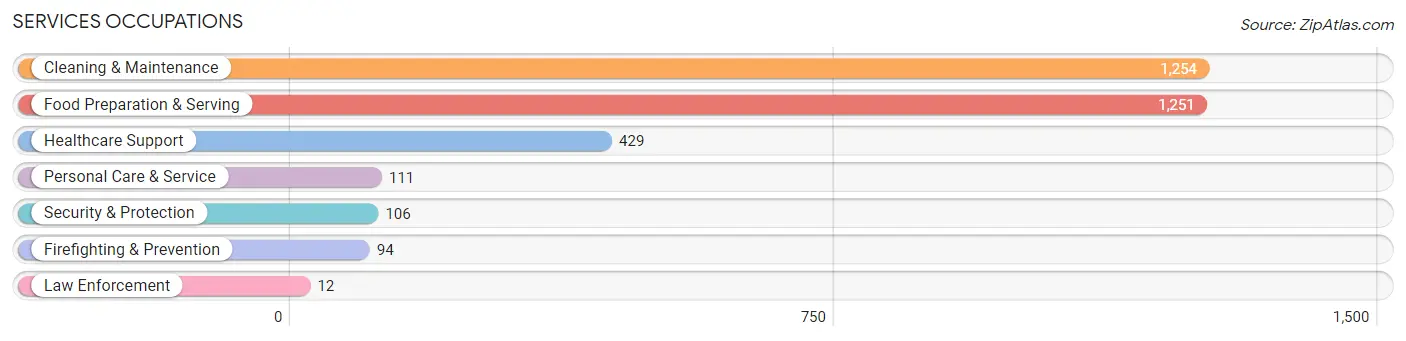
Services Occupations
The most common Services occupations in Belvidere are Cleaning & Maintenance (1,254 | 9.8%), Food Preparation & Serving (1,251 | 9.8%), Healthcare Support (429 | 3.3%), Personal Care & Service (111 | 0.9%), and Security & Protection (106 | 0.8%).
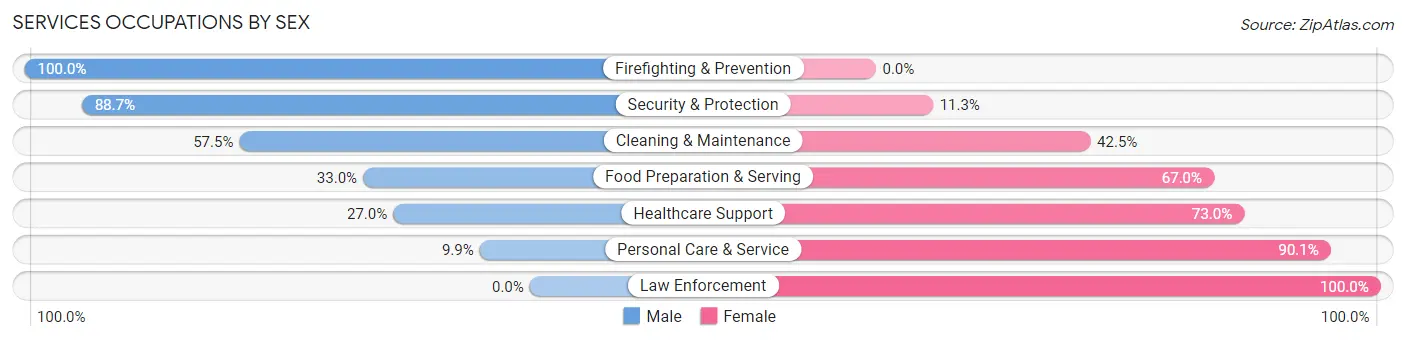
Services Occupations by Sex
Within the Services occupations in Belvidere, the most male-oriented occupations are Firefighting & Prevention (100.0%), Security & Protection (88.7%), and Cleaning & Maintenance (57.5%), while the most female-oriented occupations are Law Enforcement (100.0%), Personal Care & Service (90.1%), and Healthcare Support (73.0%).
| Occupation | Male | Female |
| Healthcare Support | 116 (27.0%) | 313 (73.0%) |
| Security & Protection | 94 (88.7%) | 12 (11.3%) |
| Firefighting & Prevention | 94 (100.0%) | 0 (0.0%) |
| Law Enforcement | 0 (0.0%) | 12 (100.0%) |
| Food Preparation & Serving | 413 (33.0%) | 838 (67.0%) |
| Cleaning & Maintenance | 721 (57.5%) | 533 (42.5%) |
| Personal Care & Service | 11 (9.9%) | 100 (90.1%) |
| Total (Category) | 1,355 (43.0%) | 1,796 (57.0%) |
| Total (Overall) | 6,843 (53.3%) | 5,984 (46.7%) |
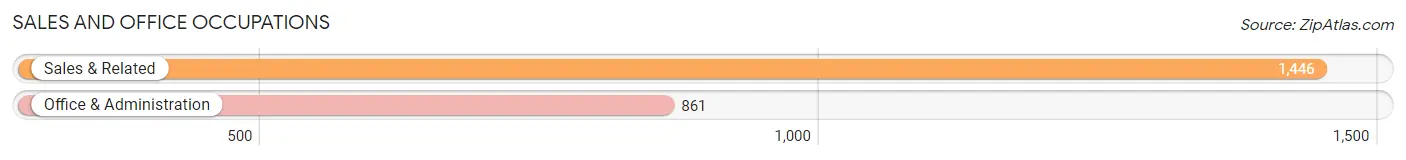
Sales and Office Occupations
The most common Sales and Office occupations in Belvidere are Sales & Related (1,446 | 11.3%), and Office & Administration (861 | 6.7%).
Sales and Office Occupations by Sex
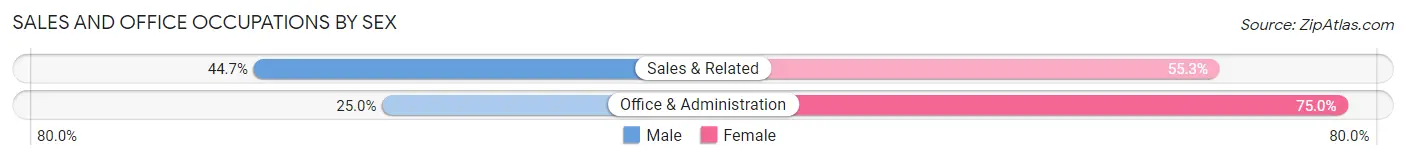
| Occupation | Male | Female |
| Sales & Related | 647 (44.7%) | 799 (55.3%) |
| Office & Administration | 215 (25.0%) | 646 (75.0%) |
| Total (Category) | 862 (37.4%) | 1,445 (62.6%) |
| Total (Overall) | 6,843 (53.3%) | 5,984 (46.7%) |
Natural Resources, Construction and Maintenance Occupations
The most common Natural Resources, Construction and Maintenance occupations in Belvidere are Construction & Extraction (700 | 5.5%), Installation, Maintenance & Repair (422 | 3.3%), and Farming, Fishing & Forestry (61 | 0.5%).

Natural Resources, Construction and Maintenance Occupations by Sex

| Occupation | Male | Female |
| Farming, Fishing & Forestry | 43 (70.5%) | 18 (29.5%) |
| Construction & Extraction | 700 (100.0%) | 0 (0.0%) |
| Installation, Maintenance & Repair | 422 (100.0%) | 0 (0.0%) |
| Total (Category) | 1,165 (98.5%) | 18 (1.5%) |
| Total (Overall) | 6,843 (53.3%) | 5,984 (46.7%) |
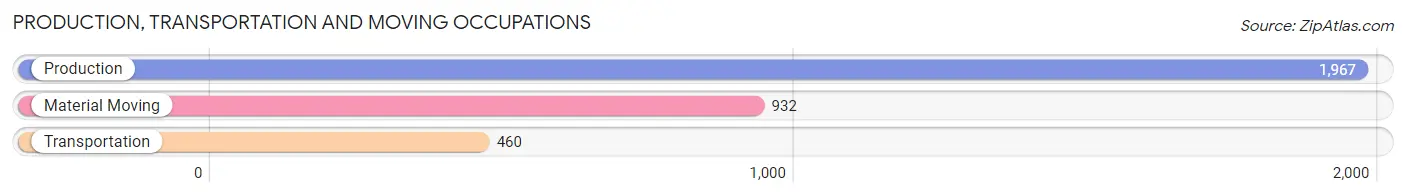
Production, Transportation and Moving Occupations
The most common Production, Transportation and Moving occupations in Belvidere are Production (1,967 | 15.3%), Material Moving (932 | 7.3%), and Transportation (460 | 3.6%).
Production, Transportation and Moving Occupations by Sex

| Occupation | Male | Female |
| Production | 1,264 (64.3%) | 703 (35.7%) |
| Transportation | 369 (80.2%) | 91 (19.8%) |
| Material Moving | 483 (51.8%) | 449 (48.2%) |
| Total (Category) | 2,116 (63.0%) | 1,243 (37.0%) |
| Total (Overall) | 6,843 (53.3%) | 5,984 (46.7%) |
Employment Industries by Sex in Belvidere
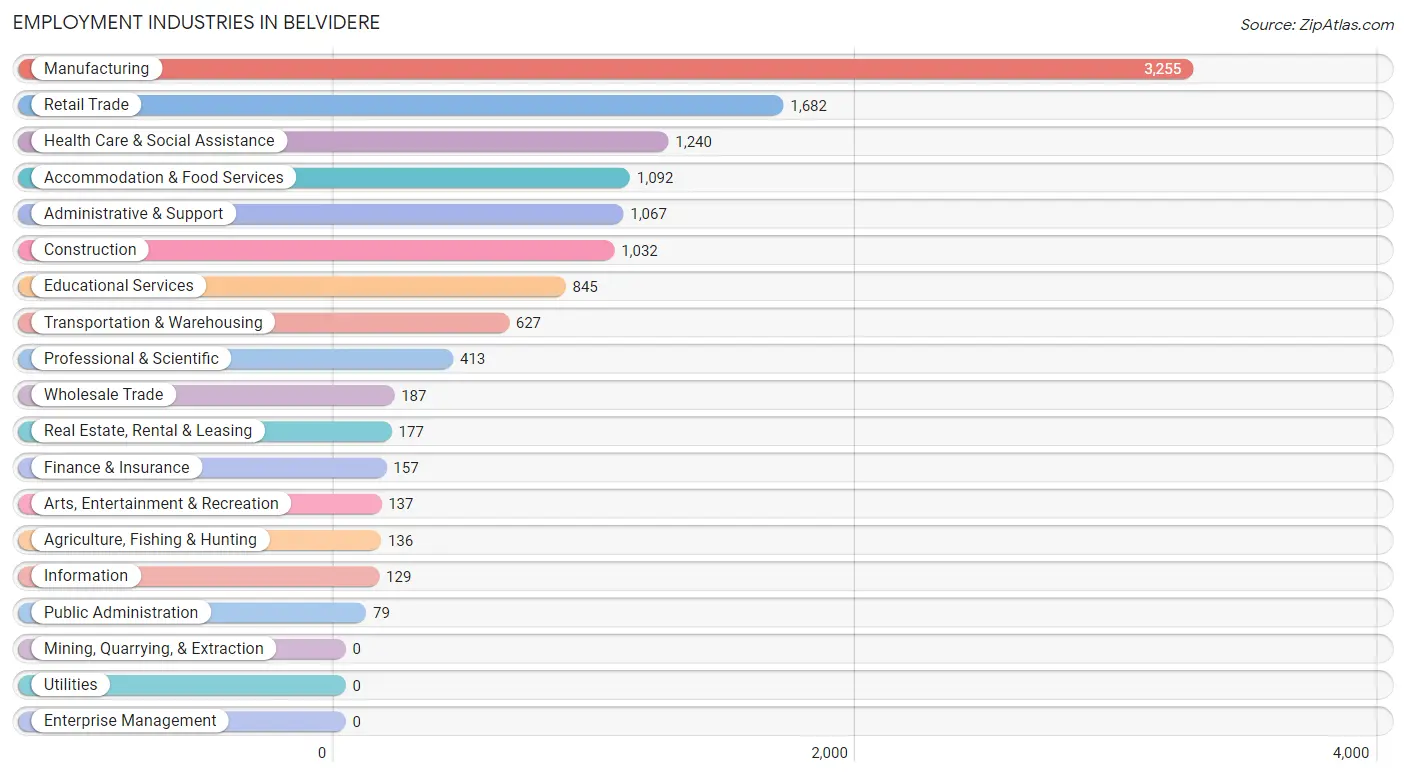
Employment Industries in Belvidere
The major employment industries in Belvidere include Manufacturing (3,255 | 25.4%), Retail Trade (1,682 | 13.1%), Health Care & Social Assistance (1,240 | 9.7%), Accommodation & Food Services (1,092 | 8.5%), and Administrative & Support (1,067 | 8.3%).
Employment Industries by Sex in Belvidere
The Belvidere industries that see more men than women are Construction (87.0%), Arts, Entertainment & Recreation (73.7%), and Agriculture, Fishing & Hunting (69.9%), whereas the industries that tend to have a higher number of women are Retail Trade (76.4%), Health Care & Social Assistance (73.0%), and Accommodation & Food Services (68.3%).
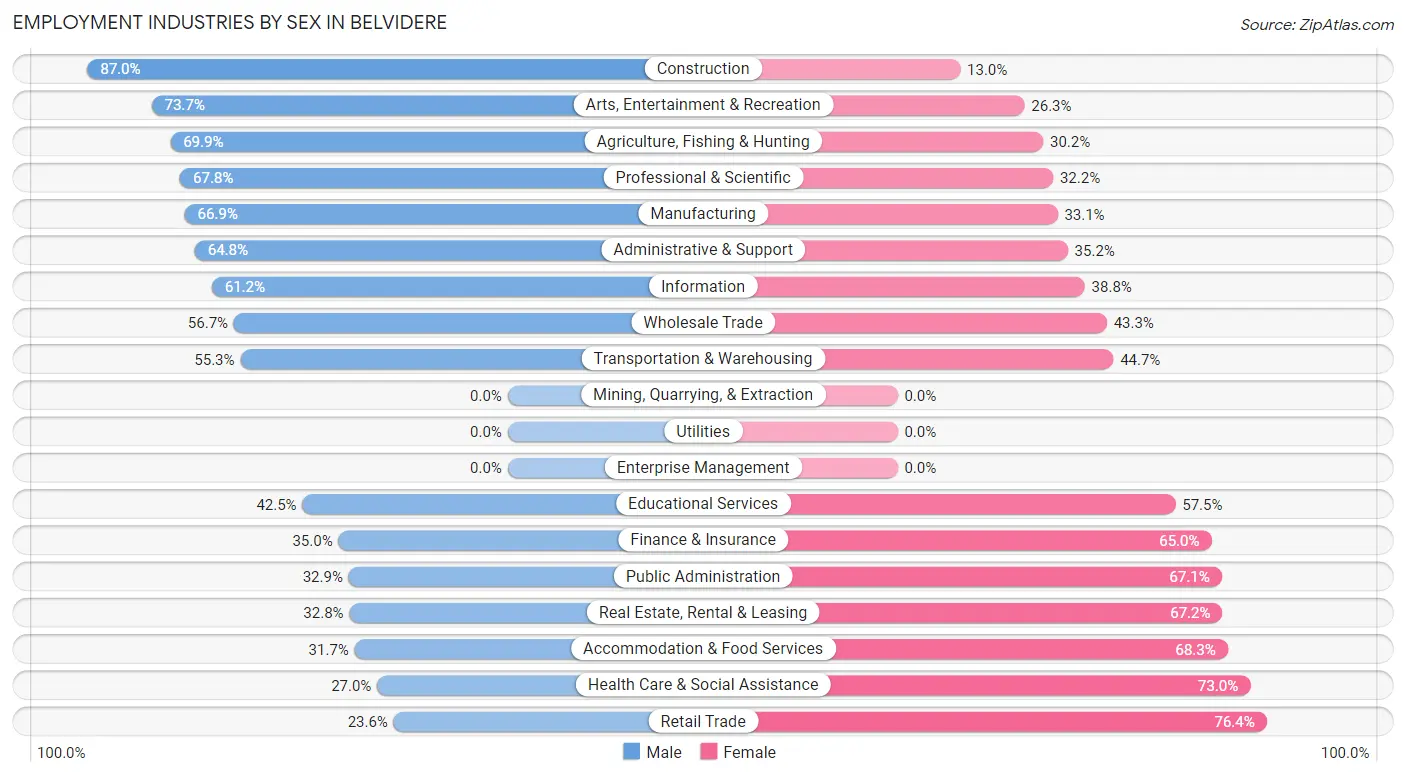
| Industry | Male | Female |
| Agriculture, Fishing & Hunting | 95 (69.9%) | 41 (30.1%) |
| Mining, Quarrying, & Extraction | 0 (0.0%) | 0 (0.0%) |
| Construction | 898 (87.0%) | 134 (13.0%) |
| Manufacturing | 2,177 (66.9%) | 1,078 (33.1%) |
| Wholesale Trade | 106 (56.7%) | 81 (43.3%) |
| Retail Trade | 397 (23.6%) | 1,285 (76.4%) |
| Transportation & Warehousing | 347 (55.3%) | 280 (44.7%) |
| Utilities | 0 (0.0%) | 0 (0.0%) |
| Information | 79 (61.2%) | 50 (38.8%) |
| Finance & Insurance | 55 (35.0%) | 102 (65.0%) |
| Real Estate, Rental & Leasing | 58 (32.8%) | 119 (67.2%) |
| Professional & Scientific | 280 (67.8%) | 133 (32.2%) |
| Enterprise Management | 0 (0.0%) | 0 (0.0%) |
| Administrative & Support | 691 (64.8%) | 376 (35.2%) |
| Educational Services | 359 (42.5%) | 486 (57.5%) |
| Health Care & Social Assistance | 335 (27.0%) | 905 (73.0%) |
| Arts, Entertainment & Recreation | 101 (73.7%) | 36 (26.3%) |
| Accommodation & Food Services | 346 (31.7%) | 746 (68.3%) |
| Public Administration | 26 (32.9%) | 53 (67.1%) |
| Total | 6,843 (53.3%) | 5,984 (46.7%) |
Education in Belvidere
School Enrollment in Belvidere
The most common levels of schooling among the 5,865 students in Belvidere are elementary school (1,434 | 24.4%), high school (1,388 | 23.7%), and college / undergraduate (1,241 | 21.2%).
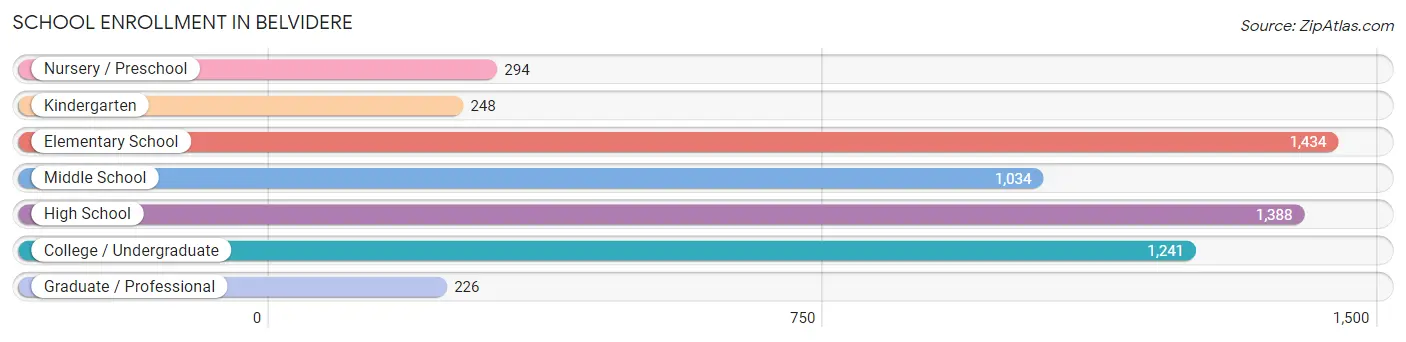
| School Level | # Students | % Students |
| Nursery / Preschool | 294 | 5.0% |
| Kindergarten | 248 | 4.2% |
| Elementary School | 1,434 | 24.4% |
| Middle School | 1,034 | 17.6% |
| High School | 1,388 | 23.7% |
| College / Undergraduate | 1,241 | 21.2% |
| Graduate / Professional | 226 | 3.8% |
| Total | 5,865 | 100.0% |
School Enrollment by Age by Funding Source in Belvidere
Out of a total of 5,865 students who are enrolled in schools in Belvidere, 557 (9.5%) attend a private institution, while the remaining 5,308 (90.5%) are enrolled in public schools. The age group of 3 to 4 year olds has the highest likelihood of being enrolled in private schools, with 32 (39.0% in the age bracket) enrolled. Conversely, the age group of 25 to 34 year olds has the lowest likelihood of being enrolled in a private school, with 242 (100.0% in the age bracket) attending a public institution.
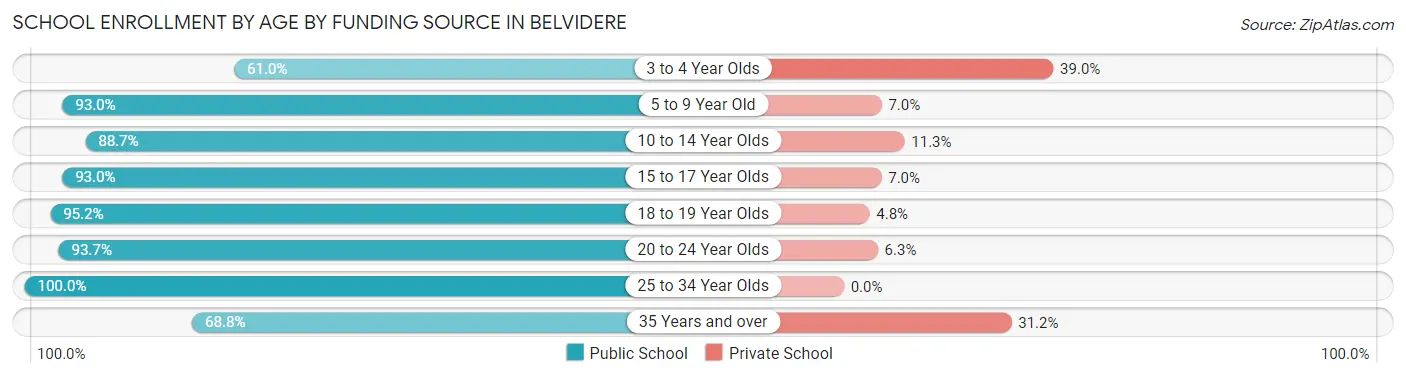
| Age Bracket | Public School | Private School |
| 3 to 4 Year Olds | 50 (61.0%) | 32 (39.0%) |
| 5 to 9 Year Old | 1,478 (93.0%) | 112 (7.0%) |
| 10 to 14 Year Olds | 1,309 (88.7%) | 167 (11.3%) |
| 15 to 17 Year Olds | 876 (93.0%) | 66 (7.0%) |
| 18 to 19 Year Olds | 498 (95.2%) | 25 (4.8%) |
| 20 to 24 Year Olds | 607 (93.7%) | 41 (6.3%) |
| 25 to 34 Year Olds | 242 (100.0%) | 0 (0.0%) |
| 35 Years and over | 249 (68.8%) | 113 (31.2%) |
| Total | 5,308 (90.5%) | 557 (9.5%) |
Educational Attainment by Field of Study in Belvidere
Science & technology (478 | 20.3%), education (473 | 20.1%), business (444 | 18.9%), physical & health sciences (176 | 7.5%), and communications (165 | 7.0%) are the most common fields of study among 2,352 individuals in Belvidere who have obtained a bachelor's degree or higher.
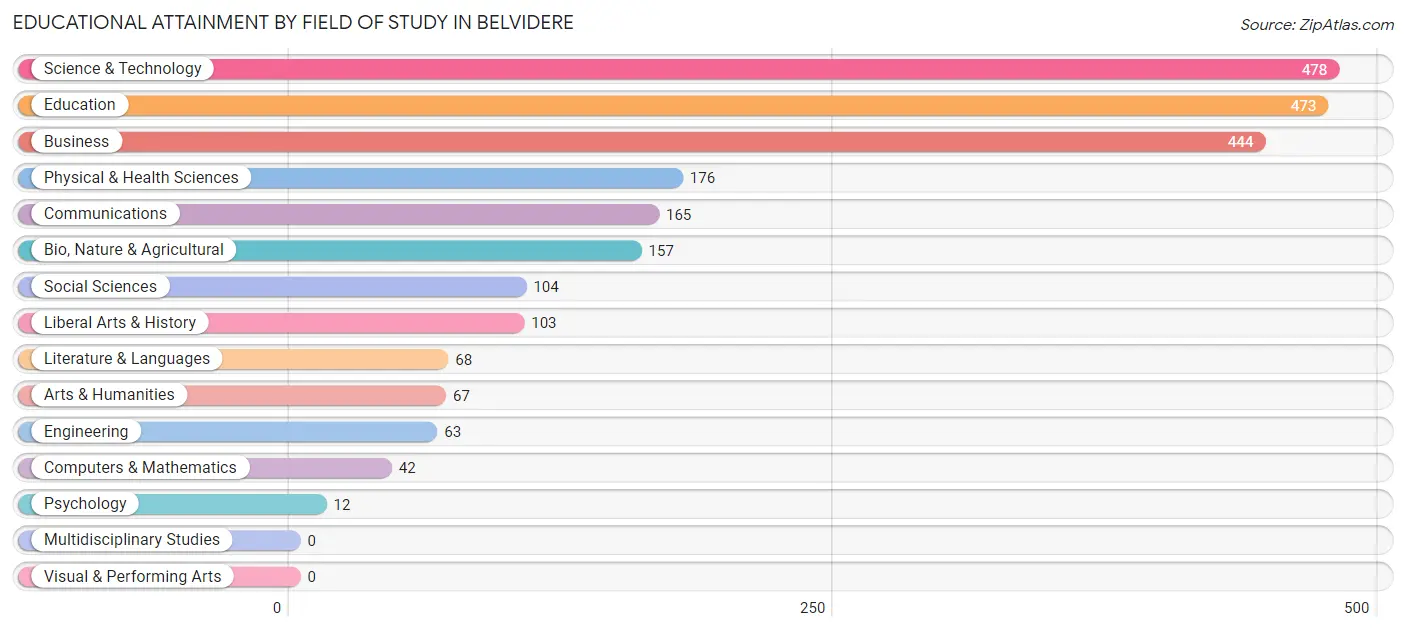
| Field of Study | # Graduates | % Graduates |
| Computers & Mathematics | 42 | 1.8% |
| Bio, Nature & Agricultural | 157 | 6.7% |
| Physical & Health Sciences | 176 | 7.5% |
| Psychology | 12 | 0.5% |
| Social Sciences | 104 | 4.4% |
| Engineering | 63 | 2.7% |
| Multidisciplinary Studies | 0 | 0.0% |
| Science & Technology | 478 | 20.3% |
| Business | 444 | 18.9% |
| Education | 473 | 20.1% |
| Literature & Languages | 68 | 2.9% |
| Liberal Arts & History | 103 | 4.4% |
| Visual & Performing Arts | 0 | 0.0% |
| Communications | 165 | 7.0% |
| Arts & Humanities | 67 | 2.9% |
| Total | 2,352 | 100.0% |
Transportation & Commute in Belvidere
Vehicle Availability by Sex in Belvidere
The most prevalent vehicle ownership categories in Belvidere are males with 2 vehicles (2,082, accounting for 31.8%) and females with 2 vehicles (2,340, making up 35.8%).
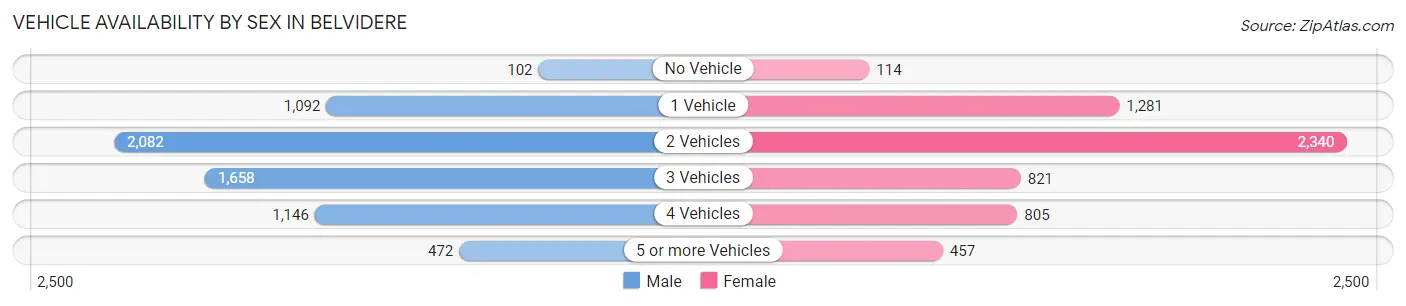
| Vehicles Available | Male | Female |
| No Vehicle | 102 (1.6%) | 114 (2.0%) |
| 1 Vehicle | 1,092 (16.7%) | 1,281 (22.0%) |
| 2 Vehicles | 2,082 (31.8%) | 2,340 (40.2%) |
| 3 Vehicles | 1,658 (25.3%) | 821 (14.1%) |
| 4 Vehicles | 1,146 (17.5%) | 805 (13.8%) |
| 5 or more Vehicles | 472 (7.2%) | 457 (7.9%) |
| Total | 6,552 (100.0%) | 5,818 (100.0%) |
Commute Time in Belvidere
The most frequently occuring commute durations in Belvidere are 5 to 9 minutes (2,428 commuters, 20.6%), 10 to 14 minutes (1,725 commuters, 14.6%), and 20 to 24 minutes (1,622 commuters, 13.7%).
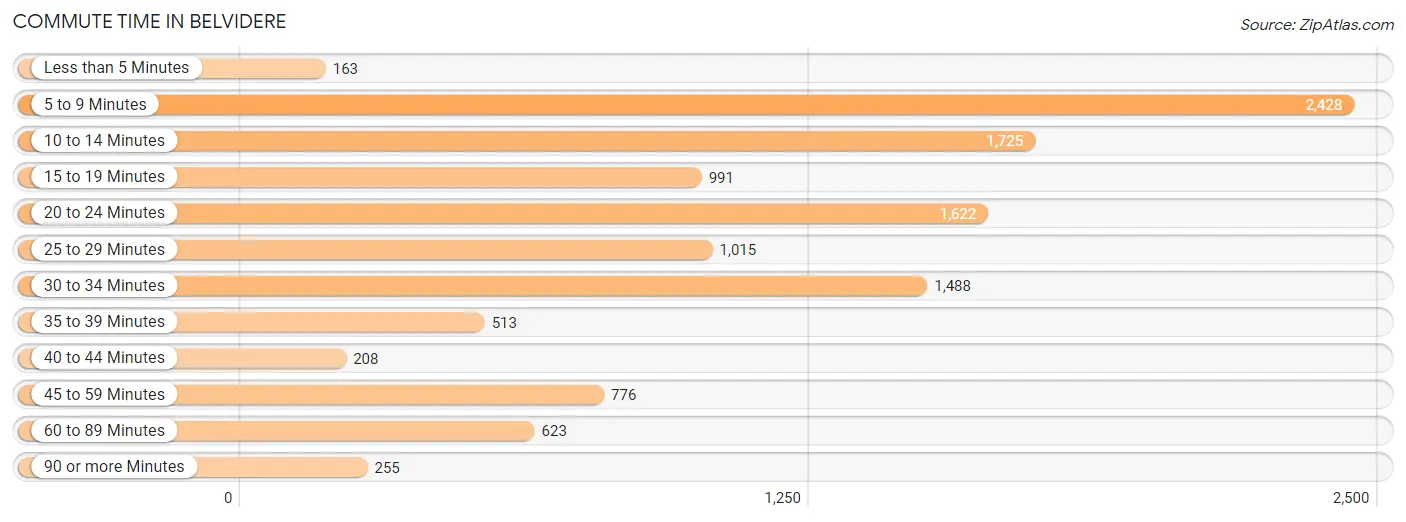
| Commute Time | # Commuters | % Commuters |
| Less than 5 Minutes | 163 | 1.4% |
| 5 to 9 Minutes | 2,428 | 20.6% |
| 10 to 14 Minutes | 1,725 | 14.6% |
| 15 to 19 Minutes | 991 | 8.4% |
| 20 to 24 Minutes | 1,622 | 13.7% |
| 25 to 29 Minutes | 1,015 | 8.6% |
| 30 to 34 Minutes | 1,488 | 12.6% |
| 35 to 39 Minutes | 513 | 4.3% |
| 40 to 44 Minutes | 208 | 1.8% |
| 45 to 59 Minutes | 776 | 6.6% |
| 60 to 89 Minutes | 623 | 5.3% |
| 90 or more Minutes | 255 | 2.2% |
Commute Time by Sex in Belvidere
The most common commute times in Belvidere are 10 to 14 minutes (1,240 commuters, 19.5%) for males and 5 to 9 minutes (1,338 commuters, 24.5%) for females.
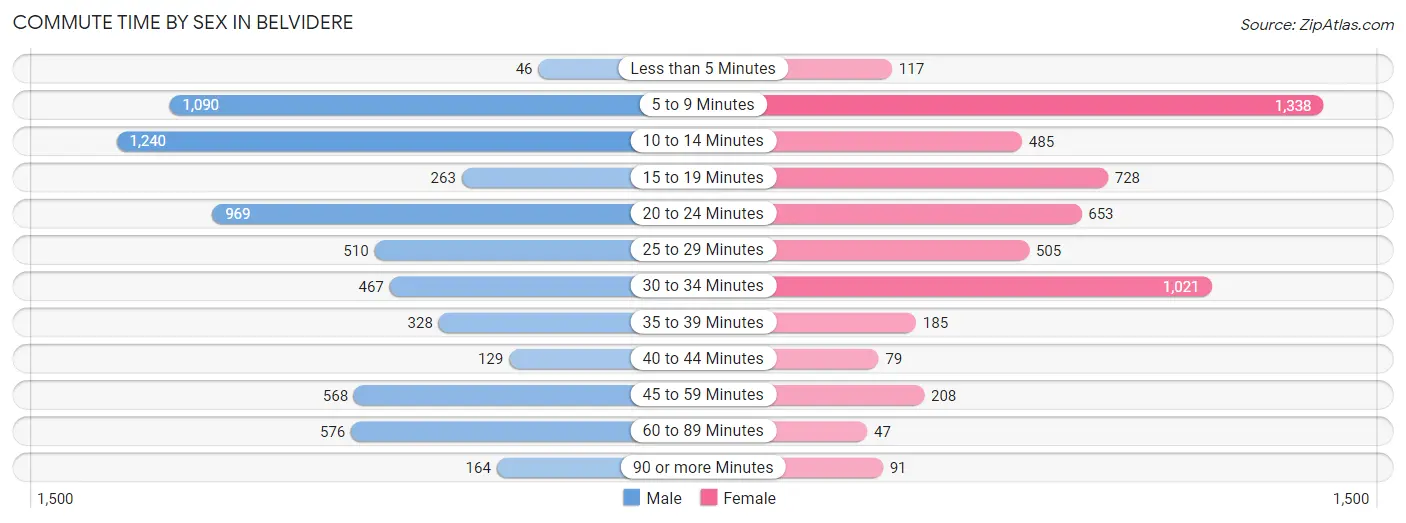
| Commute Time | Male | Female |
| Less than 5 Minutes | 46 (0.7%) | 117 (2.1%) |
| 5 to 9 Minutes | 1,090 (17.2%) | 1,338 (24.5%) |
| 10 to 14 Minutes | 1,240 (19.5%) | 485 (8.9%) |
| 15 to 19 Minutes | 263 (4.1%) | 728 (13.3%) |
| 20 to 24 Minutes | 969 (15.3%) | 653 (12.0%) |
| 25 to 29 Minutes | 510 (8.0%) | 505 (9.2%) |
| 30 to 34 Minutes | 467 (7.3%) | 1,021 (18.7%) |
| 35 to 39 Minutes | 328 (5.2%) | 185 (3.4%) |
| 40 to 44 Minutes | 129 (2.0%) | 79 (1.5%) |
| 45 to 59 Minutes | 568 (8.9%) | 208 (3.8%) |
| 60 to 89 Minutes | 576 (9.1%) | 47 (0.9%) |
| 90 or more Minutes | 164 (2.6%) | 91 (1.7%) |
Time of Departure to Work by Sex in Belvidere
The most frequent times of departure to work in Belvidere are 5:30 AM to 5:59 AM (800, 12.6%) for males and 12:00 PM to 3:59 PM (1,058, 19.4%) for females.
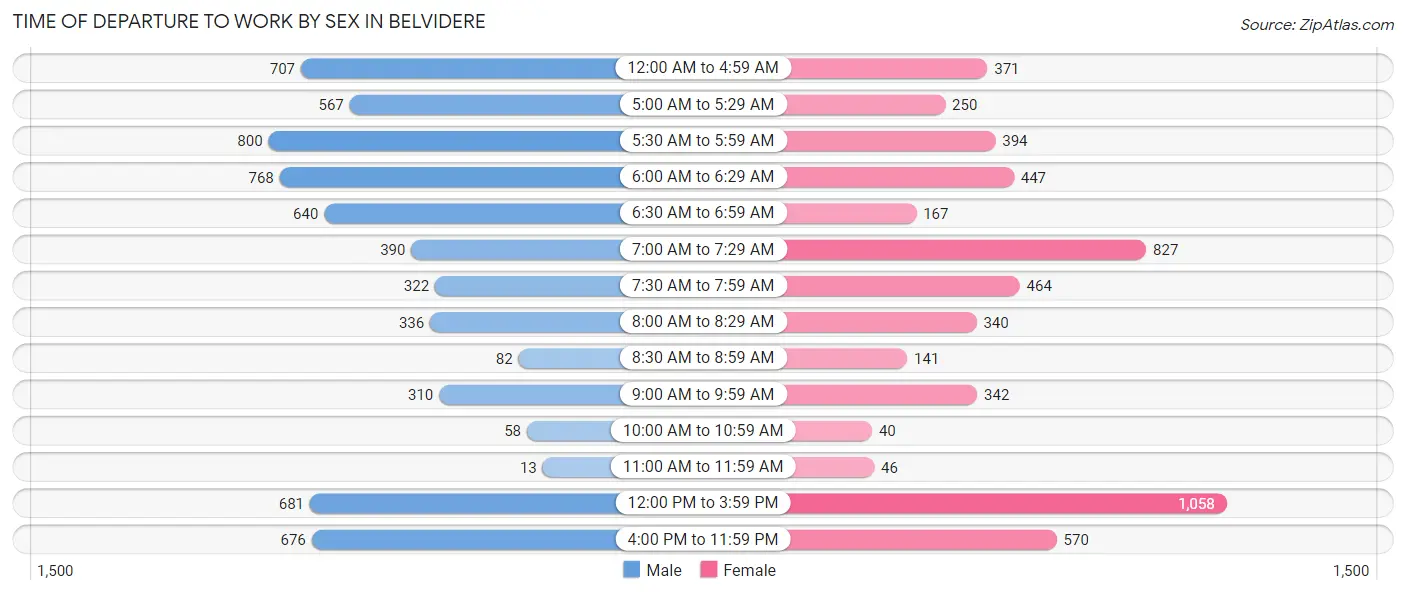
| Time of Departure | Male | Female |
| 12:00 AM to 4:59 AM | 707 (11.1%) | 371 (6.8%) |
| 5:00 AM to 5:29 AM | 567 (8.9%) | 250 (4.6%) |
| 5:30 AM to 5:59 AM | 800 (12.6%) | 394 (7.2%) |
| 6:00 AM to 6:29 AM | 768 (12.1%) | 447 (8.2%) |
| 6:30 AM to 6:59 AM | 640 (10.1%) | 167 (3.1%) |
| 7:00 AM to 7:29 AM | 390 (6.1%) | 827 (15.1%) |
| 7:30 AM to 7:59 AM | 322 (5.1%) | 464 (8.5%) |
| 8:00 AM to 8:29 AM | 336 (5.3%) | 340 (6.2%) |
| 8:30 AM to 8:59 AM | 82 (1.3%) | 141 (2.6%) |
| 9:00 AM to 9:59 AM | 310 (4.9%) | 342 (6.3%) |
| 10:00 AM to 10:59 AM | 58 (0.9%) | 40 (0.7%) |
| 11:00 AM to 11:59 AM | 13 (0.2%) | 46 (0.8%) |
| 12:00 PM to 3:59 PM | 681 (10.7%) | 1,058 (19.4%) |
| 4:00 PM to 11:59 PM | 676 (10.6%) | 570 (10.4%) |
| Total | 6,350 (100.0%) | 5,457 (100.0%) |
Housing Occupancy in Belvidere
Occupancy by Ownership in Belvidere
Of the total 9,714 dwellings in Belvidere, owner-occupied units account for 7,203 (74.2%), while renter-occupied units make up 2,511 (25.9%).
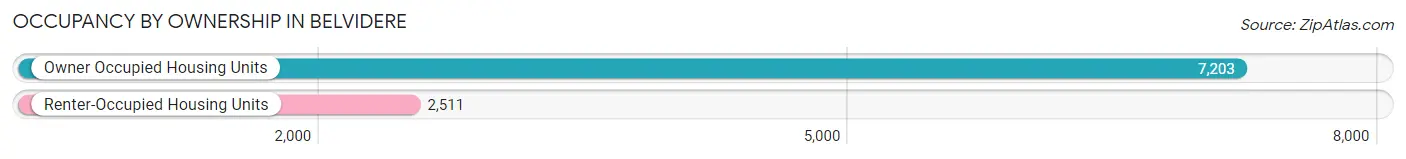
| Occupancy | # Housing Units | % Housing Units |
| Owner Occupied Housing Units | 7,203 | 74.2% |
| Renter-Occupied Housing Units | 2,511 | 25.9% |
| Total Occupied Housing Units | 9,714 | 100.0% |
Occupancy by Household Size in Belvidere
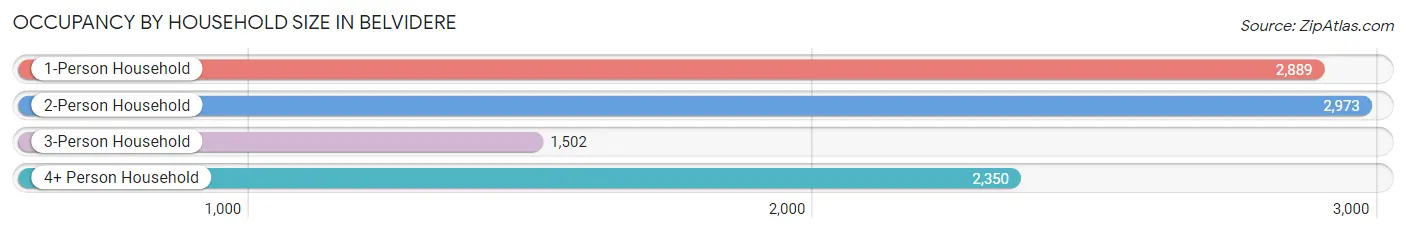
| Household Size | # Housing Units | % Housing Units |
| 1-Person Household | 2,889 | 29.7% |
| 2-Person Household | 2,973 | 30.6% |
| 3-Person Household | 1,502 | 15.5% |
| 4+ Person Household | 2,350 | 24.2% |
| Total Housing Units | 9,714 | 100.0% |
Occupancy by Ownership by Household Size in Belvidere
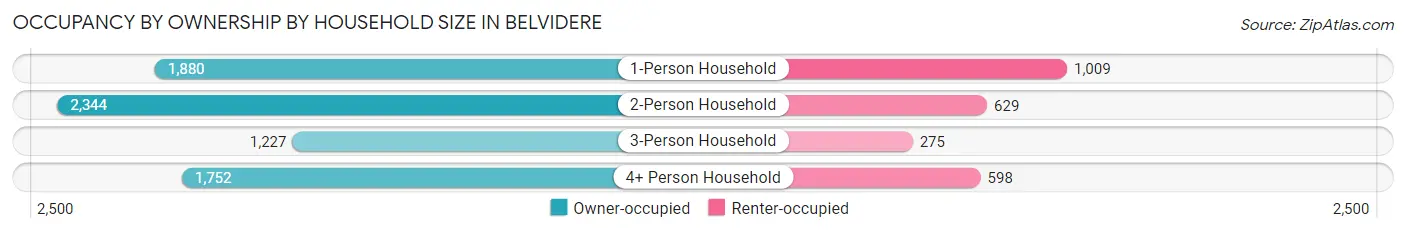
| Household Size | Owner-occupied | Renter-occupied |
| 1-Person Household | 1,880 (65.1%) | 1,009 (34.9%) |
| 2-Person Household | 2,344 (78.8%) | 629 (21.2%) |
| 3-Person Household | 1,227 (81.7%) | 275 (18.3%) |
| 4+ Person Household | 1,752 (74.6%) | 598 (25.5%) |
| Total Housing Units | 7,203 (74.2%) | 2,511 (25.9%) |
Occupancy by Educational Attainment in Belvidere
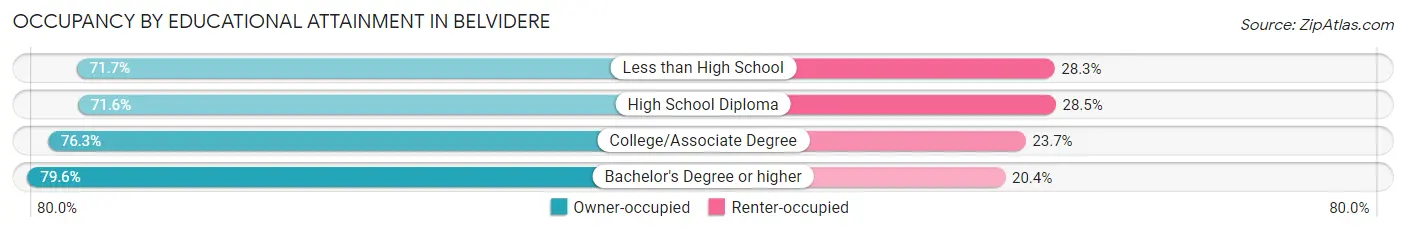
| Household Size | Owner-occupied | Renter-occupied |
| Less than High School | 1,447 (71.7%) | 570 (28.3%) |
| High School Diploma | 2,309 (71.6%) | 918 (28.4%) |
| College/Associate Degree | 2,579 (76.3%) | 800 (23.7%) |
| Bachelor's Degree or higher | 868 (79.6%) | 223 (20.4%) |
Occupancy by Age of Householder in Belvidere
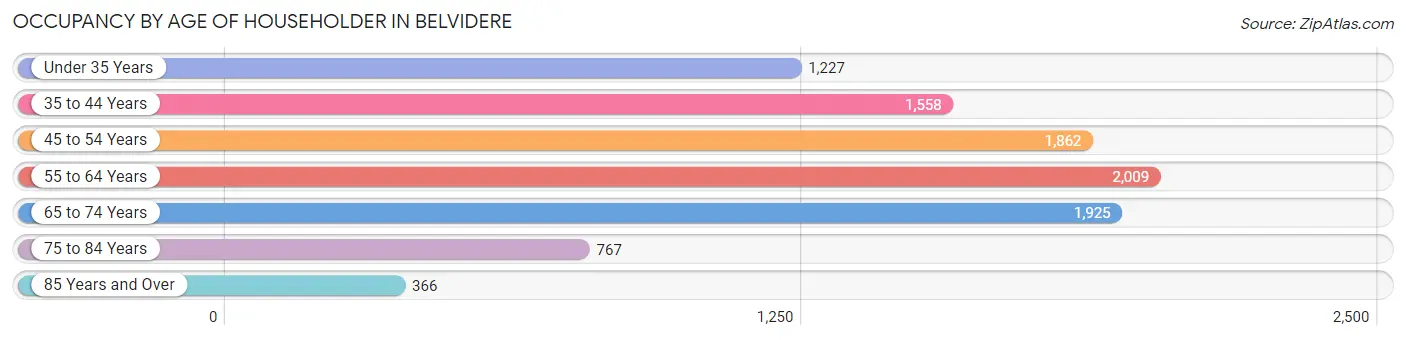
| Age Bracket | # Households | % Households |
| Under 35 Years | 1,227 | 12.6% |
| 35 to 44 Years | 1,558 | 16.0% |
| 45 to 54 Years | 1,862 | 19.2% |
| 55 to 64 Years | 2,009 | 20.7% |
| 65 to 74 Years | 1,925 | 19.8% |
| 75 to 84 Years | 767 | 7.9% |
| 85 Years and Over | 366 | 3.8% |
| Total | 9,714 | 100.0% |
Housing Finances in Belvidere
Median Income by Occupancy in Belvidere
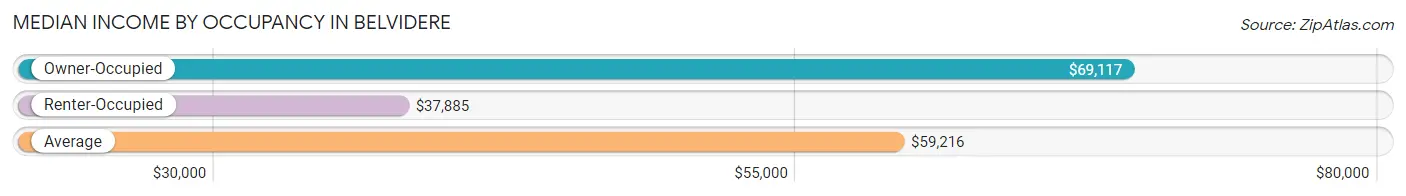
| Occupancy Type | # Households | Median Income |
| Owner-Occupied | 7,203 (74.2%) | $69,117 |
| Renter-Occupied | 2,511 (25.9%) | $37,885 |
| Average | 9,714 (100.0%) | $59,216 |
Occupancy by Householder Income Bracket in Belvidere
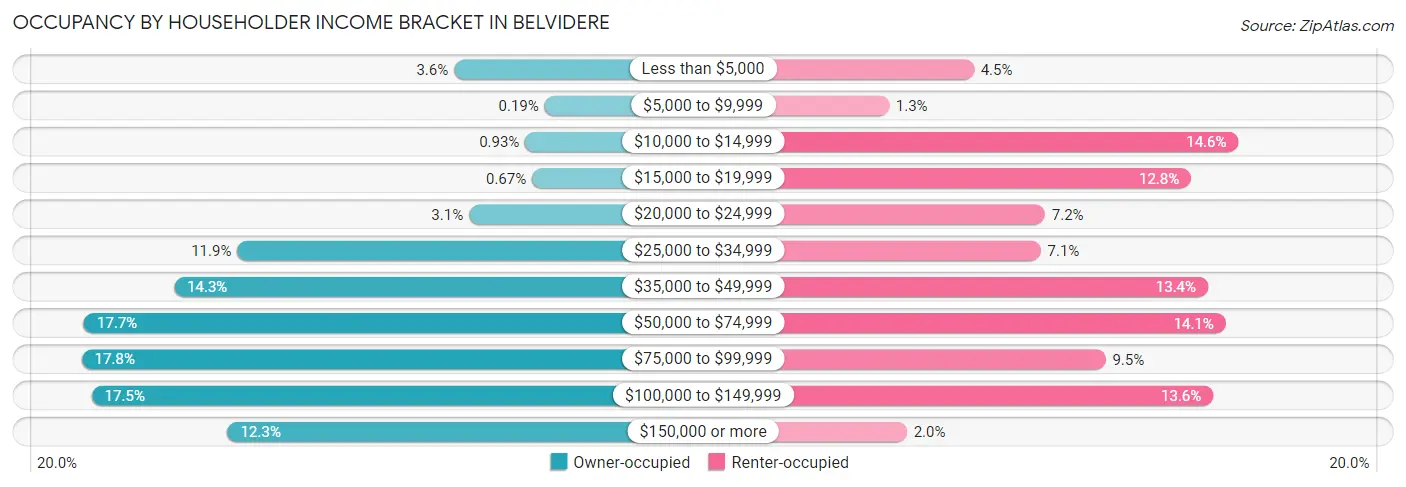
| Income Bracket | Owner-occupied | Renter-occupied |
| Less than $5,000 | 262 (3.6%) | 113 (4.5%) |
| $5,000 to $9,999 | 14 (0.2%) | 32 (1.3%) |
| $10,000 to $14,999 | 67 (0.9%) | 366 (14.6%) |
| $15,000 to $19,999 | 48 (0.7%) | 321 (12.8%) |
| $20,000 to $24,999 | 221 (3.1%) | 181 (7.2%) |
| $25,000 to $34,999 | 857 (11.9%) | 177 (7.0%) |
| $35,000 to $49,999 | 1,031 (14.3%) | 337 (13.4%) |
| $50,000 to $74,999 | 1,278 (17.7%) | 354 (14.1%) |
| $75,000 to $99,999 | 1,284 (17.8%) | 239 (9.5%) |
| $100,000 to $149,999 | 1,257 (17.4%) | 342 (13.6%) |
| $150,000 or more | 884 (12.3%) | 49 (1.9%) |
| Total | 7,203 (100.0%) | 2,511 (100.0%) |
Monthly Housing Cost Tiers in Belvidere
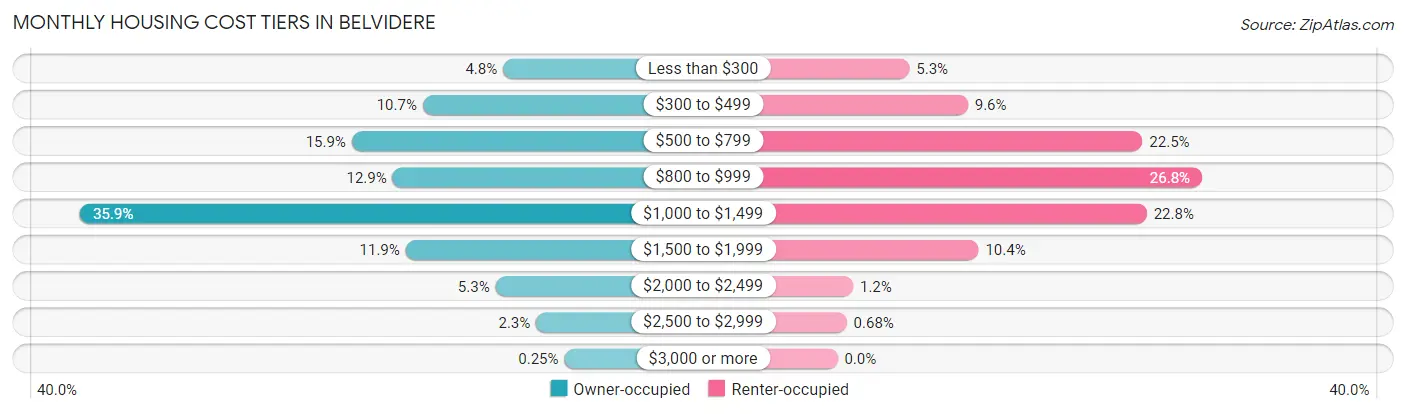
| Monthly Cost | Owner-occupied | Renter-occupied |
| Less than $300 | 343 (4.8%) | 133 (5.3%) |
| $300 to $499 | 769 (10.7%) | 241 (9.6%) |
| $500 to $799 | 1,146 (15.9%) | 564 (22.5%) |
| $800 to $999 | 929 (12.9%) | 674 (26.8%) |
| $1,000 to $1,499 | 2,587 (35.9%) | 572 (22.8%) |
| $1,500 to $1,999 | 860 (11.9%) | 261 (10.4%) |
| $2,000 to $2,499 | 383 (5.3%) | 29 (1.1%) |
| $2,500 to $2,999 | 168 (2.3%) | 17 (0.7%) |
| $3,000 or more | 18 (0.3%) | 0 (0.0%) |
| Total | 7,203 (100.0%) | 2,511 (100.0%) |
Physical Housing Characteristics in Belvidere
Housing Structures in Belvidere
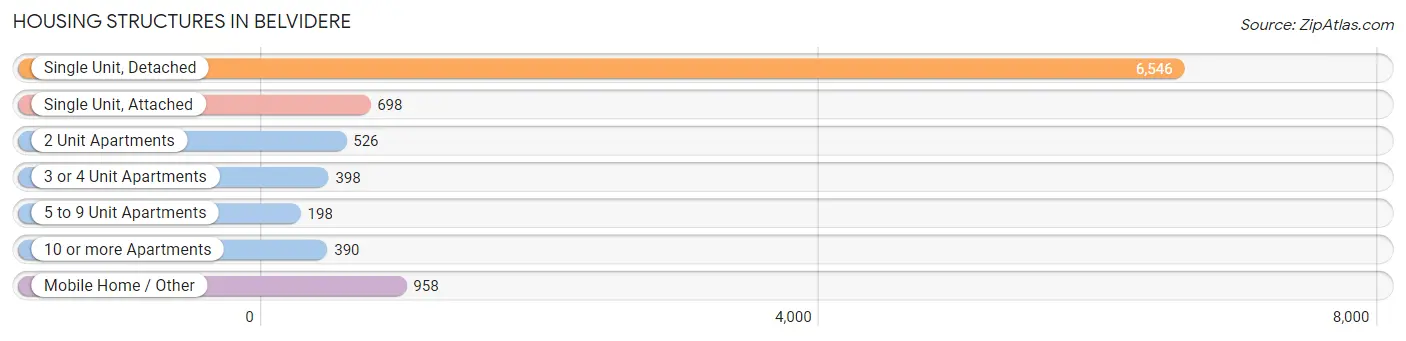
| Structure Type | # Housing Units | % Housing Units |
| Single Unit, Detached | 6,546 | 67.4% |
| Single Unit, Attached | 698 | 7.2% |
| 2 Unit Apartments | 526 | 5.4% |
| 3 or 4 Unit Apartments | 398 | 4.1% |
| 5 to 9 Unit Apartments | 198 | 2.0% |
| 10 or more Apartments | 390 | 4.0% |
| Mobile Home / Other | 958 | 9.9% |
| Total | 9,714 | 100.0% |
Housing Structures by Occupancy in Belvidere
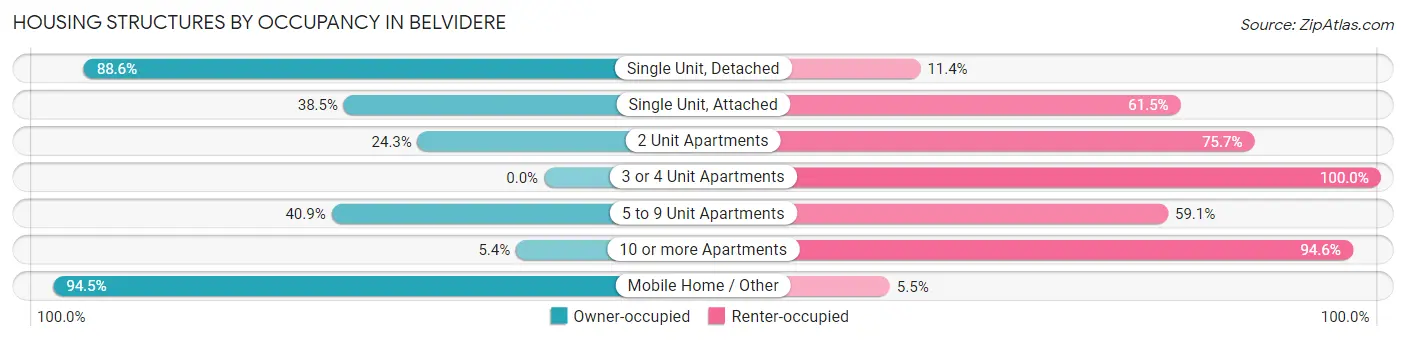
| Structure Type | Owner-occupied | Renter-occupied |
| Single Unit, Detached | 5,799 (88.6%) | 747 (11.4%) |
| Single Unit, Attached | 269 (38.5%) | 429 (61.5%) |
| 2 Unit Apartments | 128 (24.3%) | 398 (75.7%) |
| 3 or 4 Unit Apartments | 0 (0.0%) | 398 (100.0%) |
| 5 to 9 Unit Apartments | 81 (40.9%) | 117 (59.1%) |
| 10 or more Apartments | 21 (5.4%) | 369 (94.6%) |
| Mobile Home / Other | 905 (94.5%) | 53 (5.5%) |
| Total | 7,203 (74.2%) | 2,511 (25.9%) |
Housing Structures by Number of Rooms in Belvidere
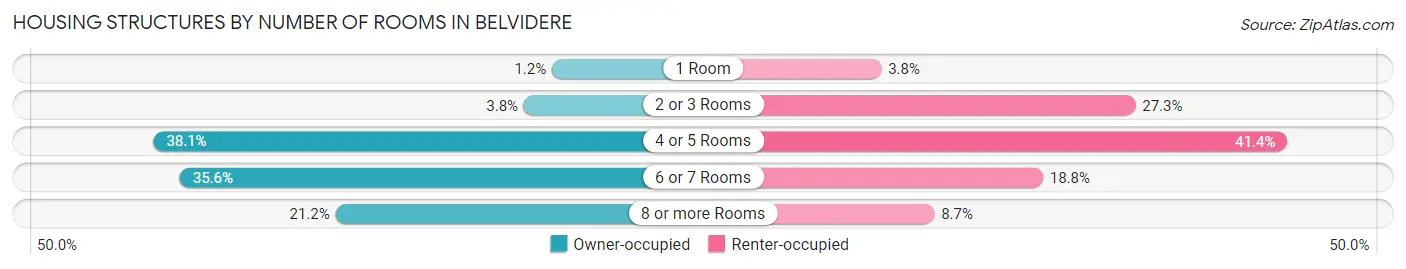
| Number of Rooms | Owner-occupied | Renter-occupied |
| 1 Room | 88 (1.2%) | 96 (3.8%) |
| 2 or 3 Rooms | 275 (3.8%) | 686 (27.3%) |
| 4 or 5 Rooms | 2,743 (38.1%) | 1,039 (41.4%) |
| 6 or 7 Rooms | 2,567 (35.6%) | 471 (18.8%) |
| 8 or more Rooms | 1,530 (21.2%) | 219 (8.7%) |
| Total | 7,203 (100.0%) | 2,511 (100.0%) |
Housing Structure by Heating Type in Belvidere
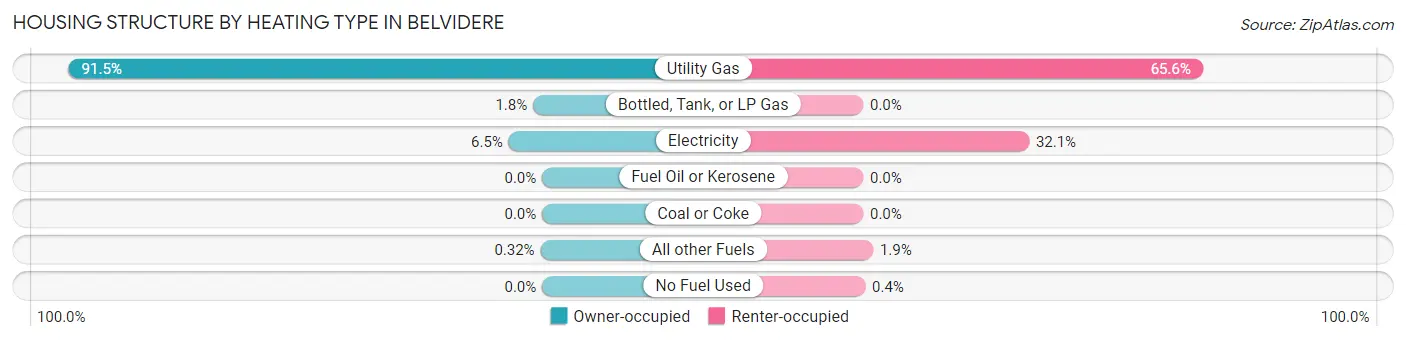
| Heating Type | Owner-occupied | Renter-occupied |
| Utility Gas | 6,589 (91.5%) | 1,648 (65.6%) |
| Bottled, Tank, or LP Gas | 126 (1.8%) | 0 (0.0%) |
| Electricity | 465 (6.5%) | 805 (32.1%) |
| Fuel Oil or Kerosene | 0 (0.0%) | 0 (0.0%) |
| Coal or Coke | 0 (0.0%) | 0 (0.0%) |
| All other Fuels | 23 (0.3%) | 48 (1.9%) |
| No Fuel Used | 0 (0.0%) | 10 (0.4%) |
| Total | 7,203 (100.0%) | 2,511 (100.0%) |
Household Vehicle Usage in Belvidere
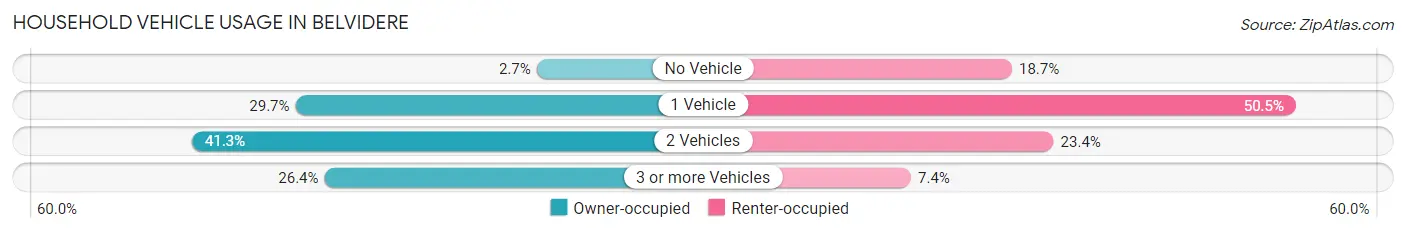
| Vehicles per Household | Owner-occupied | Renter-occupied |
| No Vehicle | 191 (2.6%) | 470 (18.7%) |
| 1 Vehicle | 2,137 (29.7%) | 1,268 (50.5%) |
| 2 Vehicles | 2,972 (41.3%) | 587 (23.4%) |
| 3 or more Vehicles | 1,903 (26.4%) | 186 (7.4%) |
| Total | 7,203 (100.0%) | 2,511 (100.0%) |
Real Estate & Mortgages in Belvidere
Real Estate and Mortgage Overview in Belvidere
| Characteristic | Without Mortgage | With Mortgage |
| Housing Units | 2,821 | 4,382 |
| Median Property Value | $122,400 | $152,100 |
| Median Household Income | $58,208 | $564 |
| Monthly Housing Costs | $571 | $18 |
| Real Estate Taxes | $2,815 | $193 |
Property Value by Mortgage Status in Belvidere
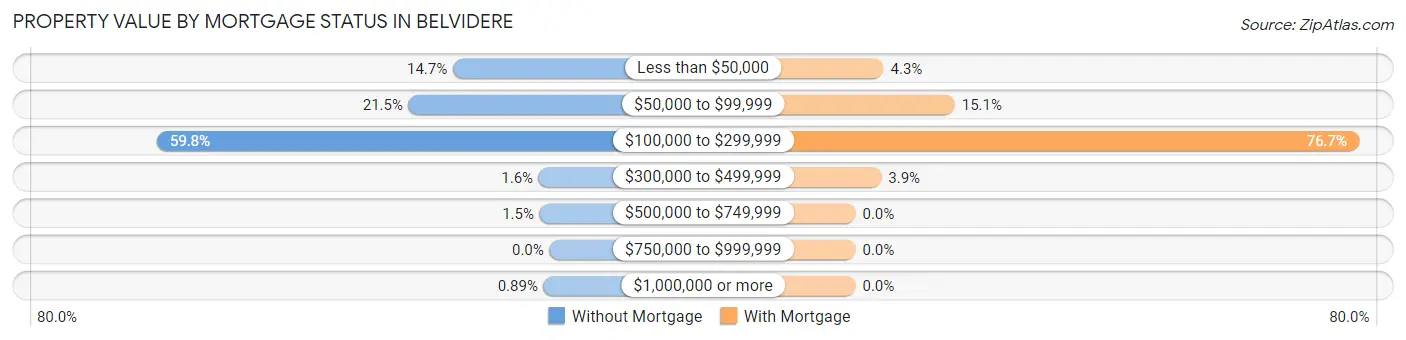
| Property Value | Without Mortgage | With Mortgage |
| Less than $50,000 | 415 (14.7%) | 187 (4.3%) |
| $50,000 to $99,999 | 605 (21.4%) | 663 (15.1%) |
| $100,000 to $299,999 | 1,688 (59.8%) | 3,360 (76.7%) |
| $300,000 to $499,999 | 46 (1.6%) | 172 (3.9%) |
| $500,000 to $749,999 | 42 (1.5%) | 0 (0.0%) |
| $750,000 to $999,999 | 0 (0.0%) | 0 (0.0%) |
| $1,000,000 or more | 25 (0.9%) | 0 (0.0%) |
| Total | 2,821 (100.0%) | 4,382 (100.0%) |
Household Income by Mortgage Status in Belvidere
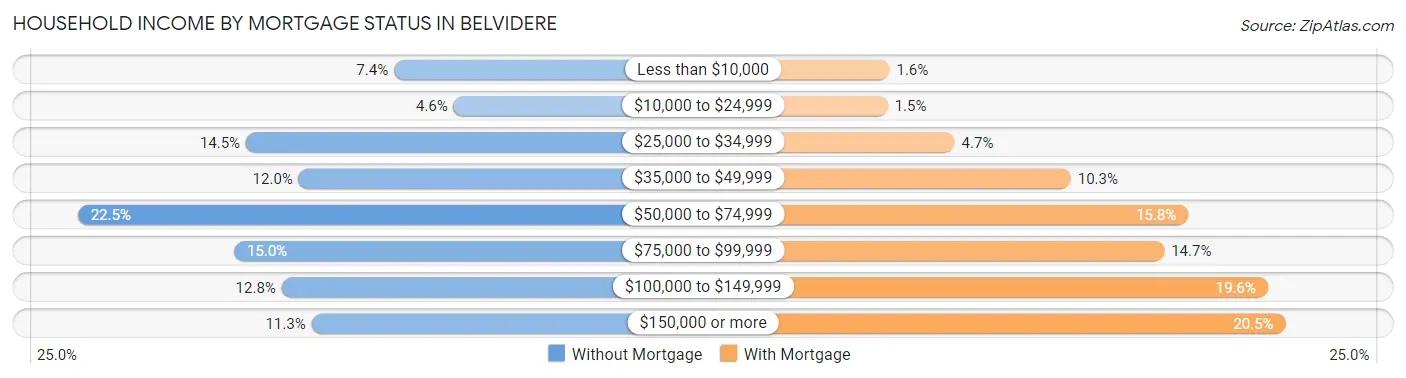
| Household Income | Without Mortgage | With Mortgage |
| Less than $10,000 | 209 (7.4%) | 71 (1.6%) |
| $10,000 to $24,999 | 129 (4.6%) | 67 (1.5%) |
| $25,000 to $34,999 | 408 (14.5%) | 207 (4.7%) |
| $35,000 to $49,999 | 337 (11.9%) | 449 (10.2%) |
| $50,000 to $74,999 | 634 (22.5%) | 694 (15.8%) |
| $75,000 to $99,999 | 424 (15.0%) | 644 (14.7%) |
| $100,000 to $149,999 | 360 (12.8%) | 860 (19.6%) |
| $150,000 or more | 320 (11.3%) | 897 (20.5%) |
| Total | 2,821 (100.0%) | 4,382 (100.0%) |
Property Value to Household Income Ratio in Belvidere
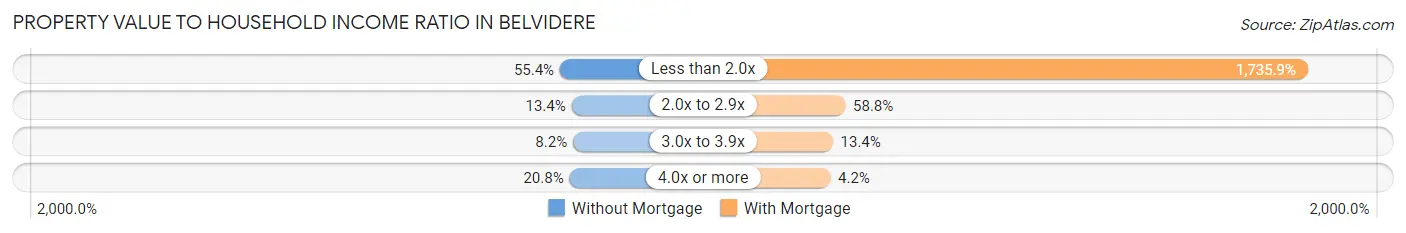
| Value-to-Income Ratio | Without Mortgage | With Mortgage |
| Less than 2.0x | 1,564 (55.4%) | 76,069 (1,735.9%) |
| 2.0x to 2.9x | 378 (13.4%) | 2,575 (58.8%) |
| 3.0x to 3.9x | 231 (8.2%) | 588 (13.4%) |
| 4.0x or more | 588 (20.8%) | 184 (4.2%) |
| Total | 2,821 (100.0%) | 4,382 (100.0%) |
Real Estate Taxes by Mortgage Status in Belvidere
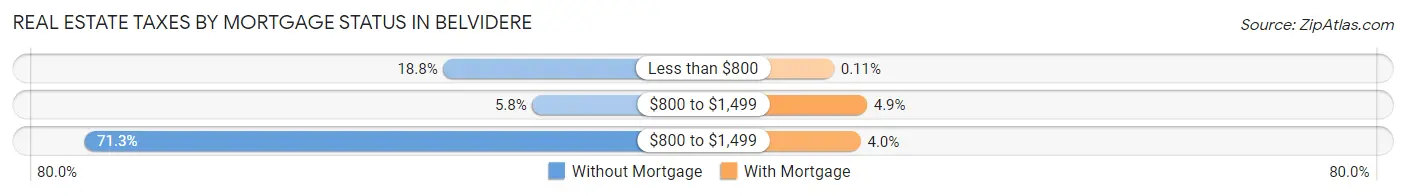
| Property Taxes | Without Mortgage | With Mortgage |
| Less than $800 | 530 (18.8%) | 5 (0.1%) |
| $800 to $1,499 | 163 (5.8%) | 216 (4.9%) |
| $800 to $1,499 | 2,011 (71.3%) | 176 (4.0%) |
| Total | 2,821 (100.0%) | 4,382 (100.0%) |
Health & Disability in Belvidere
Health Insurance Coverage by Age in Belvidere
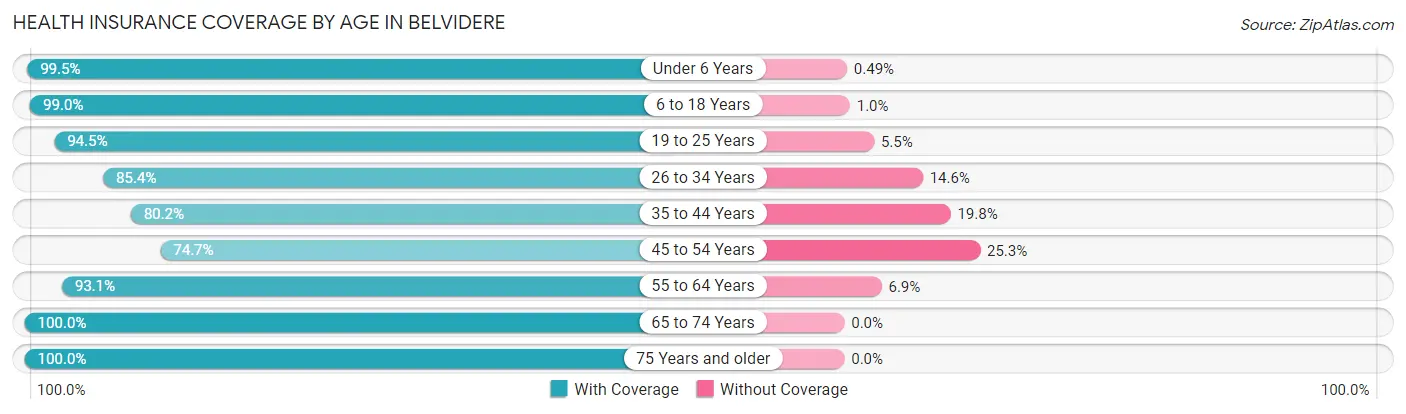
| Age Bracket | With Coverage | Without Coverage |
| Under 6 Years | 1,833 (99.5%) | 9 (0.5%) |
| 6 to 18 Years | 4,263 (99.0%) | 44 (1.0%) |
| 19 to 25 Years | 2,254 (94.5%) | 132 (5.5%) |
| 26 to 34 Years | 2,400 (85.4%) | 411 (14.6%) |
| 35 to 44 Years | 2,277 (80.2%) | 562 (19.8%) |
| 45 to 54 Years | 2,717 (74.7%) | 921 (25.3%) |
| 55 to 64 Years | 2,884 (93.1%) | 215 (6.9%) |
| 65 to 74 Years | 2,631 (100.0%) | 0 (0.0%) |
| 75 Years and older | 1,604 (100.0%) | 0 (0.0%) |
| Total | 22,863 (90.9%) | 2,294 (9.1%) |
Health Insurance Coverage by Citizenship Status in Belvidere

| Citizenship Status | With Coverage | Without Coverage |
| Native Born | 1,833 (99.5%) | 9 (0.5%) |
| Foreign Born, Citizen | 4,263 (99.0%) | 44 (1.0%) |
| Foreign Born, not a Citizen | 2,254 (94.5%) | 132 (5.5%) |
Health Insurance Coverage by Household Income in Belvidere
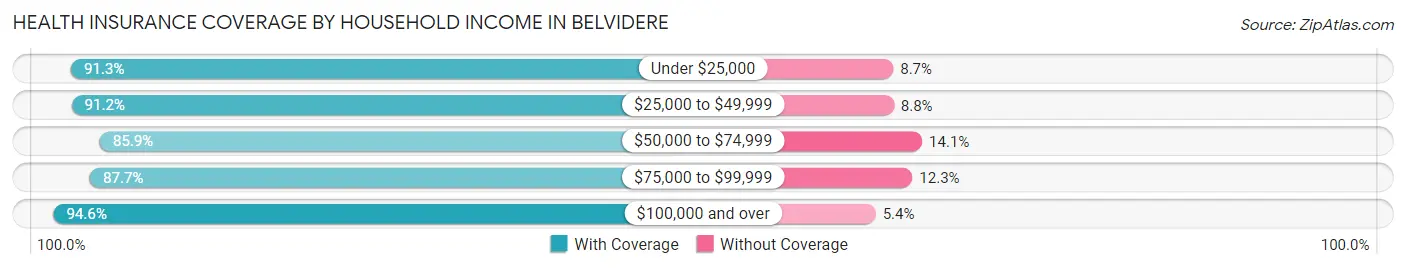
| Household Income | With Coverage | Without Coverage |
| Under $25,000 | 2,443 (91.3%) | 233 (8.7%) |
| $25,000 to $49,999 | 4,547 (91.2%) | 440 (8.8%) |
| $50,000 to $74,999 | 3,669 (85.9%) | 603 (14.1%) |
| $75,000 to $99,999 | 3,833 (87.7%) | 537 (12.3%) |
| $100,000 and over | 8,368 (94.6%) | 480 (5.4%) |
Public vs Private Health Insurance Coverage by Age in Belvidere
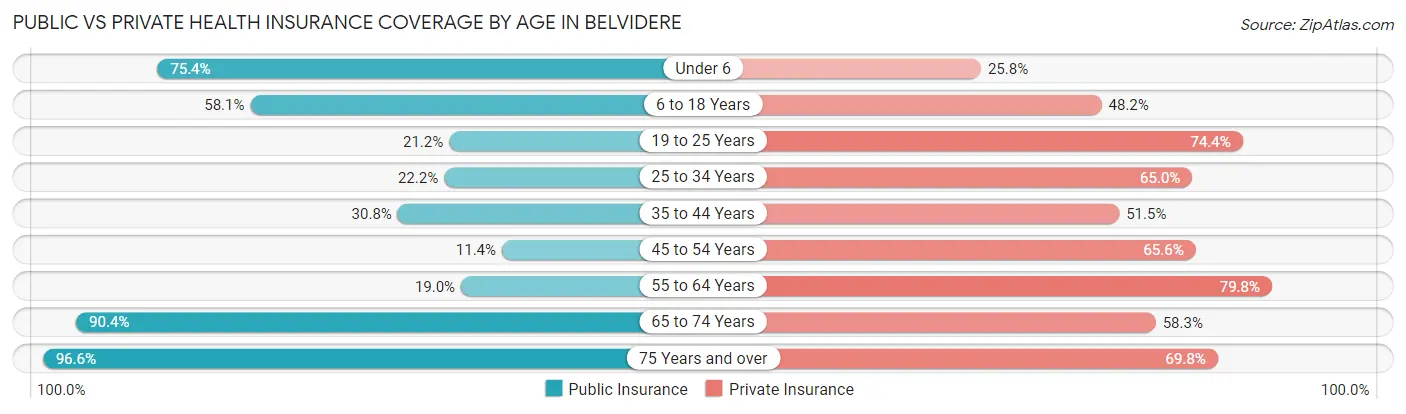
| Age Bracket | Public Insurance | Private Insurance |
| Under 6 | 1,388 (75.3%) | 476 (25.8%) |
| 6 to 18 Years | 2,503 (58.1%) | 2,077 (48.2%) |
| 19 to 25 Years | 506 (21.2%) | 1,775 (74.4%) |
| 25 to 34 Years | 623 (22.2%) | 1,828 (65.0%) |
| 35 to 44 Years | 873 (30.7%) | 1,462 (51.5%) |
| 45 to 54 Years | 415 (11.4%) | 2,388 (65.6%) |
| 55 to 64 Years | 589 (19.0%) | 2,473 (79.8%) |
| 65 to 74 Years | 2,379 (90.4%) | 1,533 (58.3%) |
| 75 Years and over | 1,550 (96.6%) | 1,119 (69.8%) |
| Total | 10,826 (43.0%) | 15,131 (60.2%) |
Disability Status by Sex by Age in Belvidere
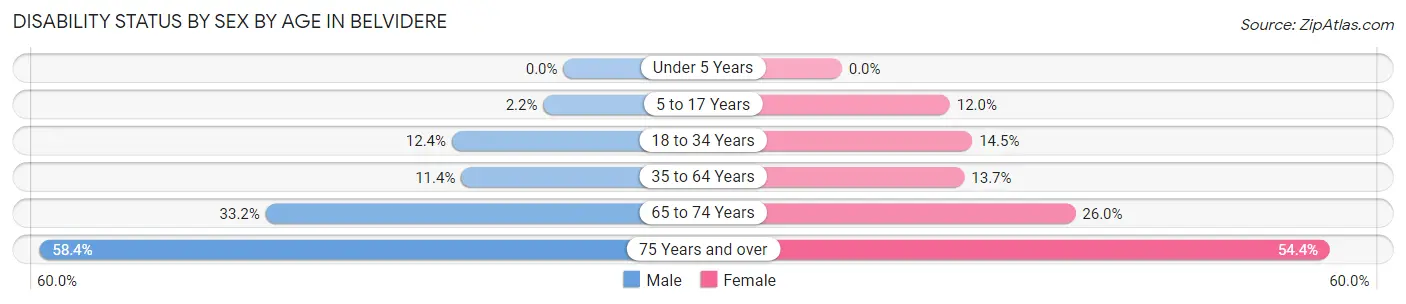
| Age Bracket | Male | Female |
| Under 5 Years | 0 (0.0%) | 0 (0.0%) |
| 5 to 17 Years | 52 (2.2%) | 249 (12.0%) |
| 18 to 34 Years | 366 (12.4%) | 388 (14.5%) |
| 35 to 64 Years | 528 (11.4%) | 673 (13.7%) |
| 65 to 74 Years | 444 (33.2%) | 336 (26.0%) |
| 75 Years and over | 381 (58.4%) | 517 (54.4%) |
Disability Class by Sex by Age in Belvidere
Disability Class: Hearing Difficulty
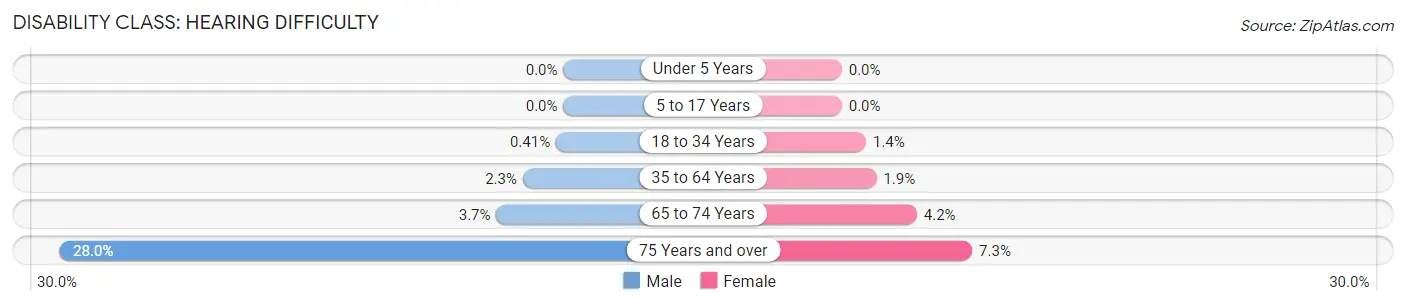
| Age Bracket | Male | Female |
| Under 5 Years | 0 (0.0%) | 0 (0.0%) |
| 5 to 17 Years | 0 (0.0%) | 0 (0.0%) |
| 18 to 34 Years | 12 (0.4%) | 36 (1.3%) |
| 35 to 64 Years | 105 (2.3%) | 95 (1.9%) |
| 65 to 74 Years | 50 (3.7%) | 54 (4.2%) |
| 75 Years and over | 183 (28.0%) | 69 (7.3%) |
Disability Class: Vision Difficulty
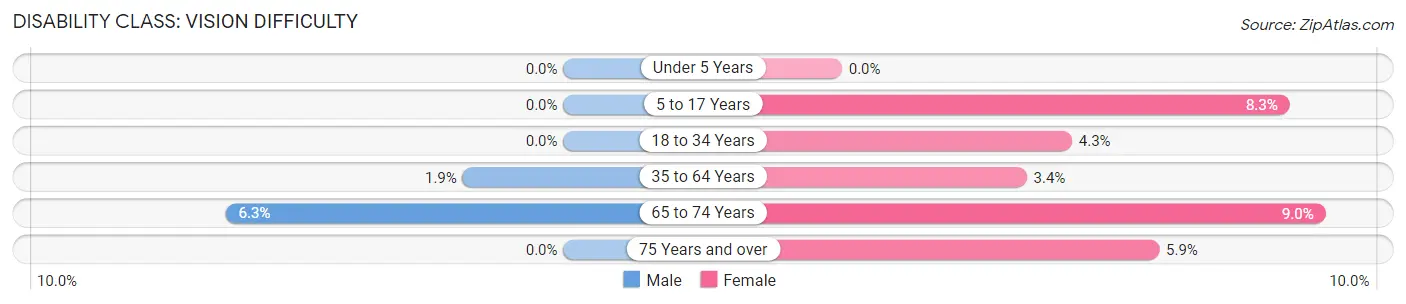
| Age Bracket | Male | Female |
| Under 5 Years | 0 (0.0%) | 0 (0.0%) |
| 5 to 17 Years | 0 (0.0%) | 172 (8.3%) |
| 18 to 34 Years | 0 (0.0%) | 114 (4.3%) |
| 35 to 64 Years | 87 (1.9%) | 169 (3.4%) |
| 65 to 74 Years | 84 (6.3%) | 116 (9.0%) |
| 75 Years and over | 0 (0.0%) | 56 (5.9%) |
Disability Class: Cognitive Difficulty
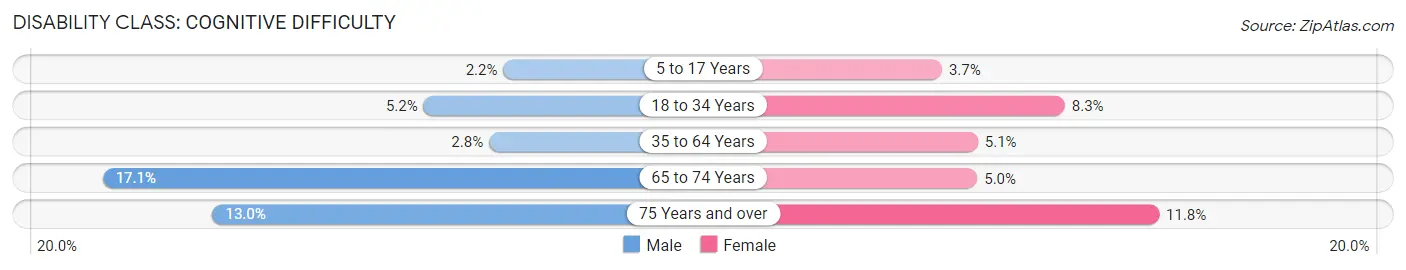
| Age Bracket | Male | Female |
| 5 to 17 Years | 52 (2.2%) | 77 (3.7%) |
| 18 to 34 Years | 153 (5.2%) | 221 (8.3%) |
| 35 to 64 Years | 128 (2.8%) | 249 (5.1%) |
| 65 to 74 Years | 229 (17.1%) | 65 (5.0%) |
| 75 Years and over | 85 (13.0%) | 112 (11.8%) |
Disability Class: Ambulatory Difficulty
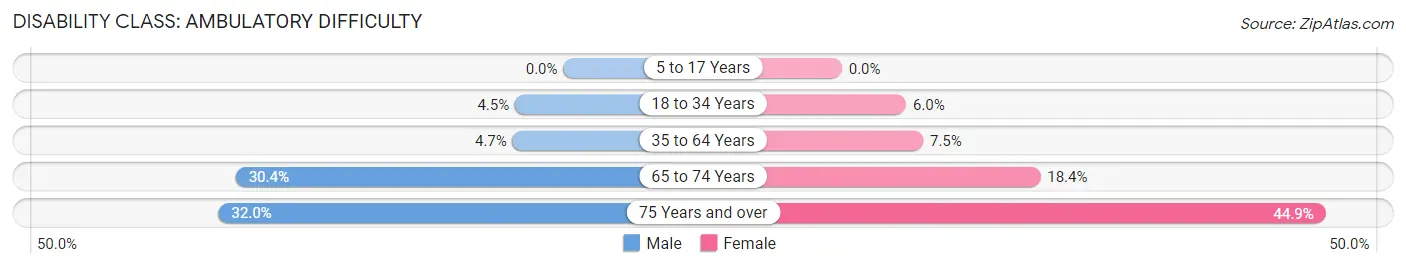
| Age Bracket | Male | Female |
| 5 to 17 Years | 0 (0.0%) | 0 (0.0%) |
| 18 to 34 Years | 132 (4.5%) | 159 (6.0%) |
| 35 to 64 Years | 219 (4.7%) | 372 (7.5%) |
| 65 to 74 Years | 407 (30.4%) | 238 (18.4%) |
| 75 Years and over | 209 (32.0%) | 427 (44.9%) |
Disability Class: Self-Care Difficulty
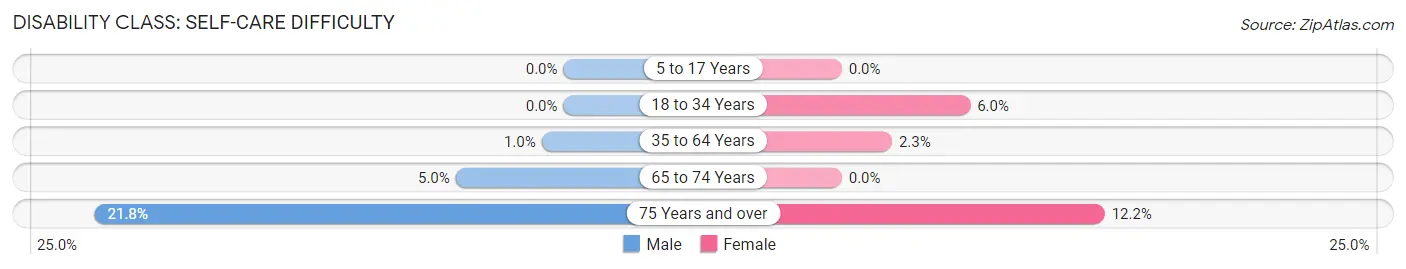
| Age Bracket | Male | Female |
| 5 to 17 Years | 0 (0.0%) | 0 (0.0%) |
| 18 to 34 Years | 0 (0.0%) | 159 (6.0%) |
| 35 to 64 Years | 47 (1.0%) | 115 (2.3%) |
| 65 to 74 Years | 67 (5.0%) | 0 (0.0%) |
| 75 Years and over | 142 (21.7%) | 116 (12.2%) |
Technology Access in Belvidere
Computing Device Access in Belvidere
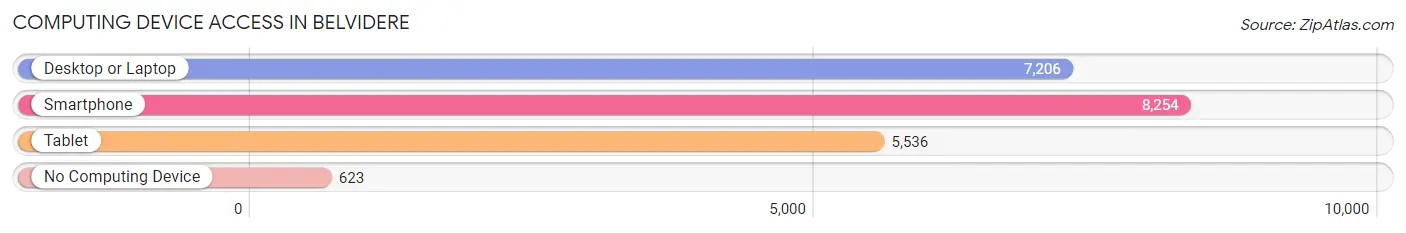
| Device Type | # Households | % Households |
| Desktop or Laptop | 7,206 | 74.2% |
| Smartphone | 8,254 | 85.0% |
| Tablet | 5,536 | 57.0% |
| No Computing Device | 623 | 6.4% |
| Total | 9,714 | 100.0% |
Internet Access in Belvidere
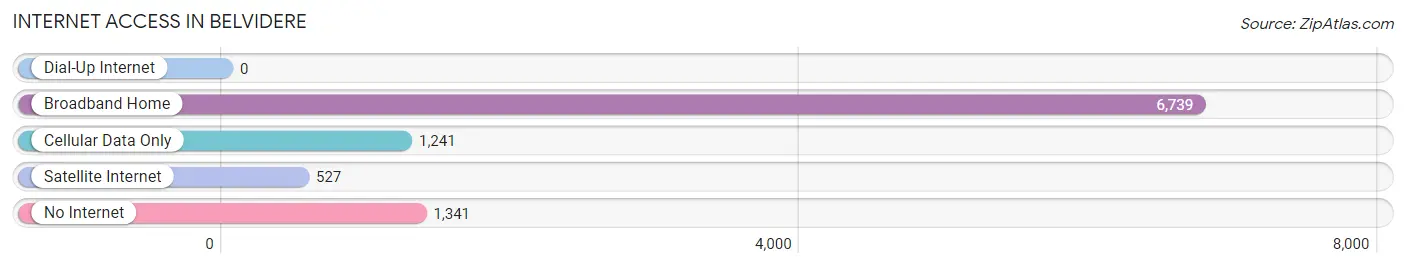
| Internet Type | # Households | % Households |
| Dial-Up Internet | 0 | 0.0% |
| Broadband Home | 6,739 | 69.4% |
| Cellular Data Only | 1,241 | 12.8% |
| Satellite Internet | 527 | 5.4% |
| No Internet | 1,341 | 13.8% |
| Total | 9,714 | 100.0% |
Belvidere Summary
Belvidere, Illinois is a city located in Boone County, Illinois, United States. It is part of the Rockford, Illinois Metropolitan Statistical Area. The population was 25,585 at the 2010 census, and estimated to be 25,902 in 2019. Belvidere is the county seat of Boone County.
History
Belvidere was founded in 1835 by James Latham, a settler from New York. The city was named after the town of Belvidere, New Jersey, which was the hometown of Latham's wife. The city was incorporated in 1845.
Belvidere was an important stop on the Underground Railroad, and was home to the first African-American church in Boone County. The church, known as the African Methodist Episcopal Church, was founded in 1845.
Belvidere was also the site of the first public school in Boone County, which was established in 1847.
Geography
Belvidere is located at 42°17′N 88°50′W (42.28, -88.83). According to the 2010 census, the city has a total area of 8.9 square miles (23.1 km2), of which 8.8 square miles (22.8 km2) is land and 0.1 square miles (0.3 km2) is water.
Economy
Belvidere is home to several major employers, including Chrysler, which has a large manufacturing plant in the city. Other major employers include Belvidere Community Hospital, Belvidere School District, and the Belvidere Post Office.
The city also has a vibrant small business community, with many locally owned restaurants, shops, and services.
Demographics
As of the 2010 census, there were 25,585 people, 9,945 households, and 6,717 families residing in the city. The population density was 2,890.3 people per square mile (1,114.2/km2). There were 10,541 housing units at an average density of 1,190.2 per square mile (459.3/km2). The racial makeup of the city was 87.2% White, 5.7% African American, 0.3% Native American, 1.2% Asian, 0.1% Pacific Islander, 3.7% from other races, and 1.9% from two or more races. Hispanic or Latino of any race were 8.7% of the population.
There were 9,945 households, out of which 33.2% had children under the age of 18 living with them, 48.2% were married couples living together, 13.7% had a female householder with no husband present, and 33.2% were non-families. 28.2% of all households were made up of individuals, and 11.2% had someone living alone who was 65 years of age or older. The average household size was 2.54 and the average family size was 3.12.
In the city, the population was spread out, with 26.2% under the age of 18, 8.7% from 18 to 24, 29.2% from 25 to 44, 22.2% from 45 to 64, and 13.7% who were 65 years of age or older. The median age was 36 years. For every 100 females, there were 93.2 males. For every 100 females age 18 and over, there were 89.3 males.
The median income for a household in the city was $45,945, and the median income for a family was $54,945. Males had a median income of $41,945 versus $30,945 for females. The per capita income for the city was $21,945. About 6.2% of families and 8.7% of the population were below the poverty line, including 11.2% of those under age 18 and 6.2% of those age 65 or over.
Common Questions
What is Per Capita Income in Belvidere?
Per Capita income in Belvidere is $29,682.
What is the Median Family Income in Belvidere?
Median Family Income in Belvidere is $77,738.
What is the Median Household income in Belvidere?
Median Household Income in Belvidere is $59,216.
What is Income or Wage Gap in Belvidere?
Income or Wage Gap in Belvidere is 20.1%.
Women in Belvidere earn 79.9 cents for every dollar earned by a man.
What is Inequality or Gini Index in Belvidere?
Inequality or Gini Index in Belvidere is 0.41.
What is the Total Population of Belvidere?
Total Population of Belvidere is 25,389.
What is the Total Male Population of Belvidere?
Total Male Population of Belvidere is 12,614.
What is the Total Female Population of Belvidere?
Total Female Population of Belvidere is 12,775.
What is the Ratio of Males per 100 Females in Belvidere?
There are 98.74 Males per 100 Females in Belvidere.
What is the Ratio of Females per 100 Males in Belvidere?
There are 101.28 Females per 100 Males in Belvidere.
What is the Median Population Age in Belvidere?
Median Population Age in Belvidere is 39.1 Years.
What is the Average Family Size in Belvidere
Average Family Size in Belvidere is 3.2 People.
What is the Average Household Size in Belvidere
Average Household Size in Belvidere is 2.6 People.
How Large is the Labor Force in Belvidere?
There are 13,597 People in the Labor Forcein in Belvidere.
What is the Percentage of People in the Labor Force in Belvidere?
66.7% of People are in the Labor Force in Belvidere.
What is the Unemployment Rate in Belvidere?
Unemployment Rate in Belvidere is 5.6%.