Marine, IL Map & Demographics
Marine Map
Marine Overview
$30,344
PER CAPITA INCOME
$80,167
AVG FAMILY INCOME
$71,042
AVG HOUSEHOLD INCOME
51.5%
WAGE / INCOME GAP [ % ]
48.5¢/ $1
WAGE / INCOME GAP [ $ ]
0.32
INEQUALITY / GINI INDEX
1,264
TOTAL POPULATION
637
MALE POPULATION
627
FEMALE POPULATION
101.59
MALES / 100 FEMALES
98.43
FEMALES / 100 MALES
34.7
MEDIAN AGE
3.2
AVG FAMILY SIZE
2.8
AVG HOUSEHOLD SIZE
596
LABOR FORCE [ PEOPLE ]
61.4%
PERCENT IN LABOR FORCE
Marine Zip Codes
Marine Area Codes
Income in Marine
Income Overview in Marine
Per Capita Income in Marine is $30,344, while median incomes of families and households are $80,167 and $71,042 respectively.
| Characteristic | Number | Measure |
| Per Capita Income | 1,264 | $30,344 |
| Median Family Income | 364 | $80,167 |
| Mean Family Income | 364 | $90,641 |
| Median Household Income | 455 | $71,042 |
| Mean Household Income | 455 | $84,677 |
| Income Deficit | 364 | $0 |
| Wage / Income Gap (%) | 1,264 | 51.47% |
| Wage / Income Gap ($) | 1,264 | 48.53¢ per $1 |
| Gini / Inequality Index | 1,264 | 0.32 |
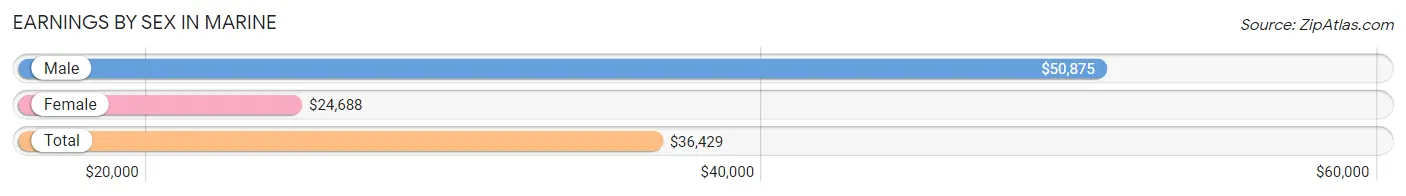
Earnings by Sex in Marine
Average Earnings in Marine are $36,429, $50,875 for men and $24,688 for women, a difference of 51.5%.
| Sex | Number | Average Earnings |
| Male | 331 (52.5%) | $50,875 |
| Female | 299 (47.5%) | $24,688 |
| Total | 630 (100.0%) | $36,429 |
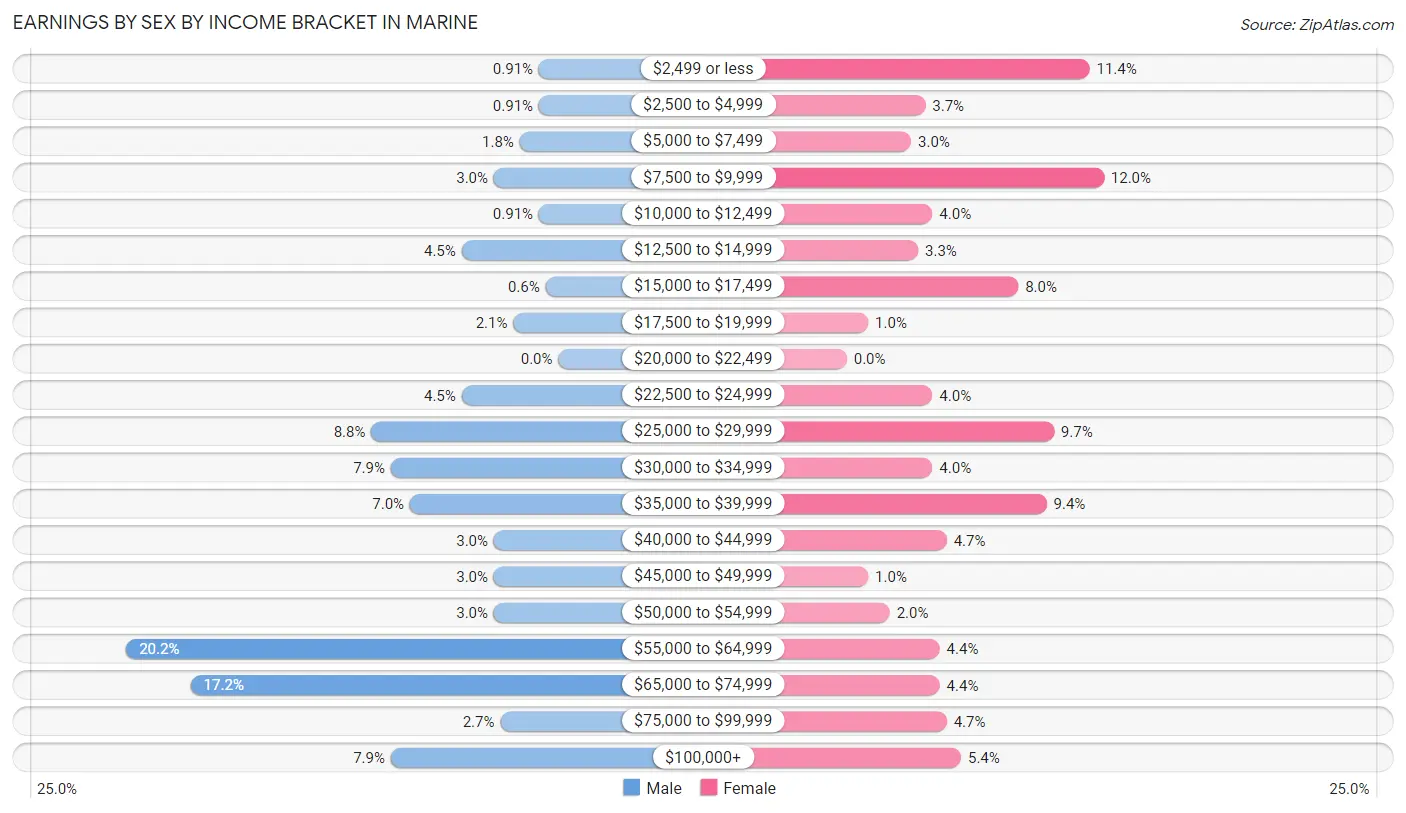
Earnings by Sex by Income Bracket in Marine
The most common earnings brackets in Marine are $55,000 to $64,999 for men (67 | 20.2%) and $7,500 to $9,999 for women (36 | 12.0%).
| Income | Male | Female |
| $2,499 or less | 3 (0.9%) | 34 (11.4%) |
| $2,500 to $4,999 | 3 (0.9%) | 11 (3.7%) |
| $5,000 to $7,499 | 6 (1.8%) | 9 (3.0%) |
| $7,500 to $9,999 | 10 (3.0%) | 36 (12.0%) |
| $10,000 to $12,499 | 3 (0.9%) | 12 (4.0%) |
| $12,500 to $14,999 | 15 (4.5%) | 10 (3.3%) |
| $15,000 to $17,499 | 2 (0.6%) | 24 (8.0%) |
| $17,500 to $19,999 | 7 (2.1%) | 3 (1.0%) |
| $20,000 to $22,499 | 0 (0.0%) | 0 (0.0%) |
| $22,500 to $24,999 | 15 (4.5%) | 12 (4.0%) |
| $25,000 to $29,999 | 29 (8.8%) | 29 (9.7%) |
| $30,000 to $34,999 | 26 (7.9%) | 12 (4.0%) |
| $35,000 to $39,999 | 23 (7.0%) | 28 (9.4%) |
| $40,000 to $44,999 | 10 (3.0%) | 14 (4.7%) |
| $45,000 to $49,999 | 10 (3.0%) | 3 (1.0%) |
| $50,000 to $54,999 | 10 (3.0%) | 6 (2.0%) |
| $55,000 to $64,999 | 67 (20.2%) | 13 (4.3%) |
| $65,000 to $74,999 | 57 (17.2%) | 13 (4.3%) |
| $75,000 to $99,999 | 9 (2.7%) | 14 (4.7%) |
| $100,000+ | 26 (7.9%) | 16 (5.3%) |
| Total | 331 (100.0%) | 299 (100.0%) |
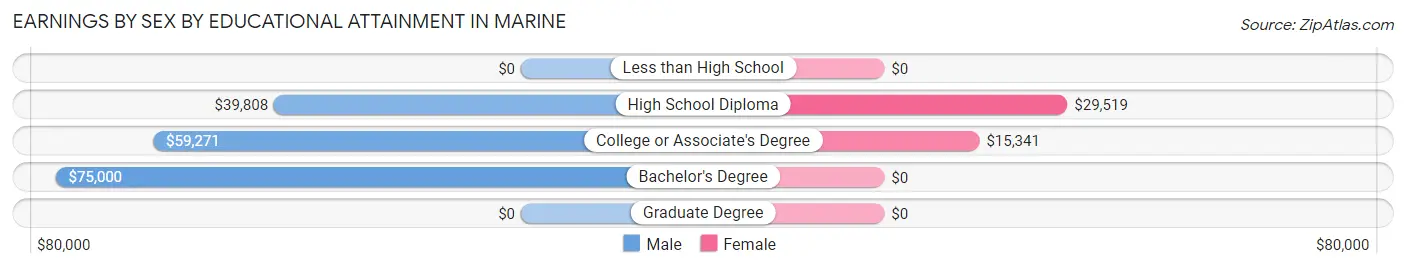
Earnings by Sex by Educational Attainment in Marine
Average earnings in Marine are $55,500 for men and $28,365 for women, a difference of 48.9%. Men with an educational attainment of bachelor's degree enjoy the highest average annual earnings of $75,000, while those with high school diploma education earn the least with $39,808. Women with an educational attainment of high school diploma earn the most with the average annual earnings of $29,519, while those with college or associate's degree education have the smallest earnings of $15,341.
| Educational Attainment | Male Income | Female Income |
| Less than High School | - | - |
| High School Diploma | $39,808 | $29,519 |
| College or Associate's Degree | $59,271 | $15,341 |
| Bachelor's Degree | $75,000 | $0 |
| Graduate Degree | - | - |
| Total | $55,500 | $28,365 |
Family Income in Marine
Family Income Brackets in Marine
According to the Marine family income data, there are 126 families falling into the $50,000 to $74,999 income range, which is the most common income bracket and makes up 34.6% of all families.
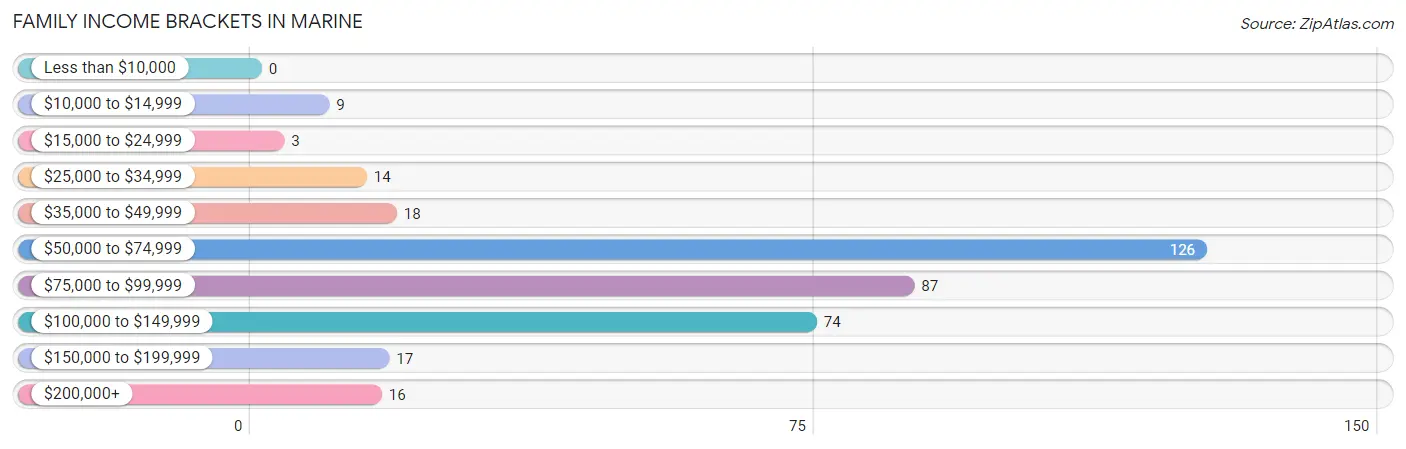
| Income Bracket | # Families | % Families |
| Less than $10,000 | 0 | 0.0% |
| $10,000 to $14,999 | 9 | 2.5% |
| $15,000 to $24,999 | 3 | 0.8% |
| $25,000 to $34,999 | 14 | 3.8% |
| $35,000 to $49,999 | 18 | 4.9% |
| $50,000 to $74,999 | 126 | 34.6% |
| $75,000 to $99,999 | 87 | 23.9% |
| $100,000 to $149,999 | 74 | 20.3% |
| $150,000 to $199,999 | 17 | 4.7% |
| $200,000+ | 16 | 4.4% |
Family Income by Famaliy Size in Marine
5-person families (39 | 10.7%) account for the highest median family income in Marine with $85,903 per family, while 2-person families (142 | 39.0%) have the highest median income of $35,834 per family member.
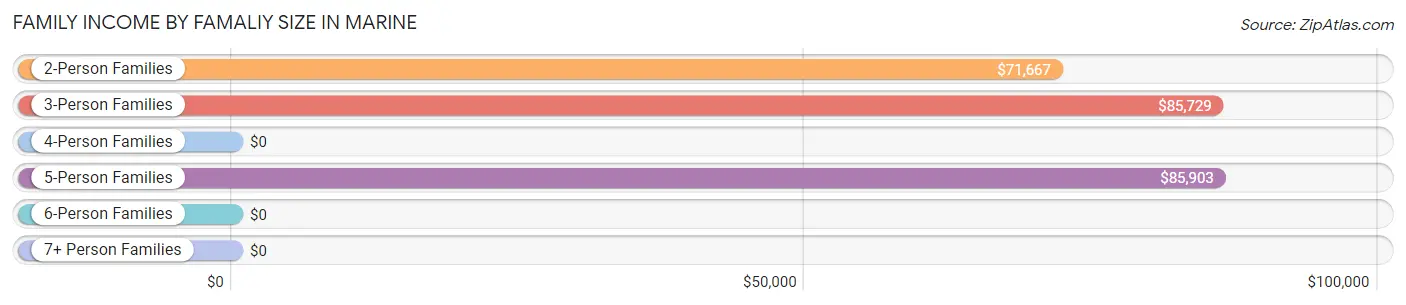
| Income Bracket | # Families | Median Income |
| 2-Person Families | 142 (39.0%) | $71,667 |
| 3-Person Families | 113 (31.0%) | $85,729 |
| 4-Person Families | 37 (10.2%) | $0 |
| 5-Person Families | 39 (10.7%) | $85,903 |
| 6-Person Families | 33 (9.1%) | $0 |
| 7+ Person Families | 0 (0.0%) | $0 |
| Total | 364 (100.0%) | $80,167 |
Family Income by Number of Earners in Marine
The median family income in Marine is $80,167, with families comprising 3+ earners (25) having the highest median family income of $103,750, while families with no earners (48) have the lowest median family income of $63,333, accounting for 6.9% and 13.2% of families, respectively.
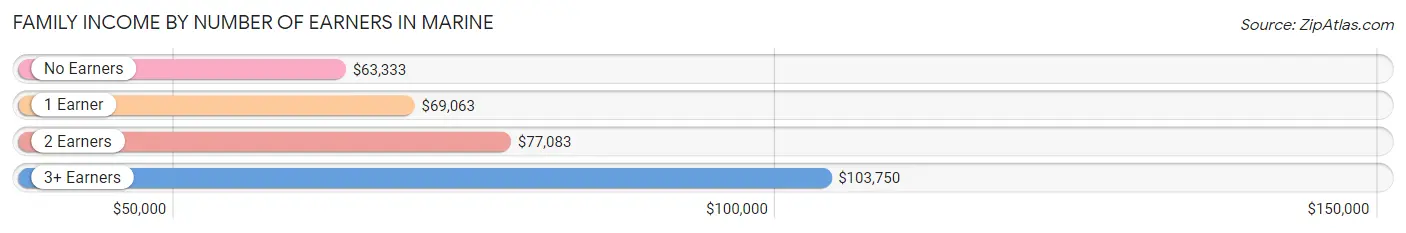
| Number of Earners | # Families | Median Income |
| No Earners | 48 (13.2%) | $63,333 |
| 1 Earner | 103 (28.3%) | $69,063 |
| 2 Earners | 188 (51.6%) | $77,083 |
| 3+ Earners | 25 (6.9%) | $103,750 |
| Total | 364 (100.0%) | $80,167 |
Household Income in Marine
Household Income Brackets in Marine
With 145 households falling in the category, the $50,000 to $74,999 income range is the most frequent in Marine, accounting for 31.9% of all households. In contrast, only 4 households (0.9%) fall into the less than $10,000 income bracket, making it the least populous group.
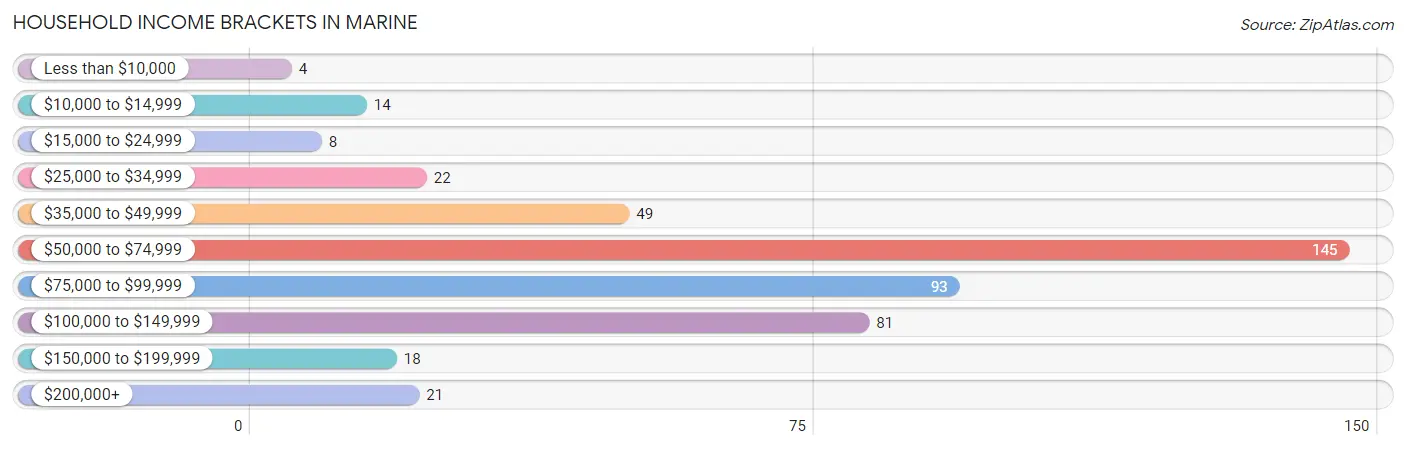
| Income Bracket | # Households | % Households |
| Less than $10,000 | 4 | 0.9% |
| $10,000 to $14,999 | 14 | 3.1% |
| $15,000 to $24,999 | 8 | 1.8% |
| $25,000 to $34,999 | 22 | 4.8% |
| $35,000 to $49,999 | 49 | 10.8% |
| $50,000 to $74,999 | 145 | 31.9% |
| $75,000 to $99,999 | 93 | 20.4% |
| $100,000 to $149,999 | 81 | 17.8% |
| $150,000 to $199,999 | 18 | 4.0% |
| $200,000+ | 21 | 4.6% |
Household Income by Householder Age in Marine
The median household income in Marine is $71,042, with the highest median household income of $80,714 found in the 15 to 24 years age bracket for the primary householder. A total of 10 households (2.2%) fall into this category. Meanwhile, the 25 to 44 years age bracket for the primary householder has the lowest median household income of $67,813, with 163 households (35.8%) in this group.
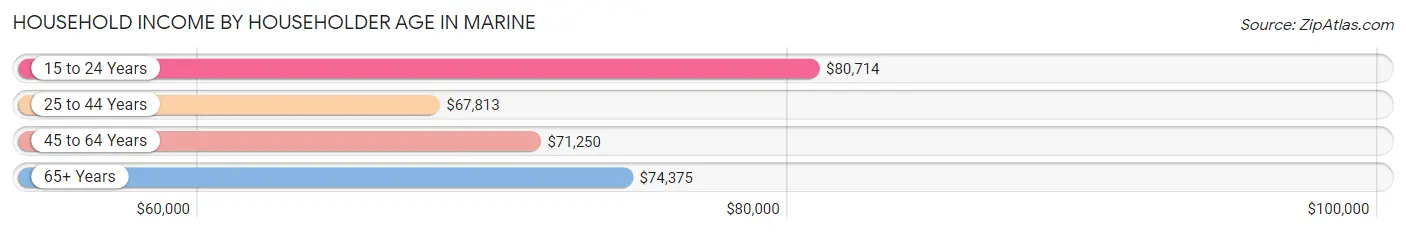
| Income Bracket | # Households | Median Income |
| 15 to 24 Years | 10 (2.2%) | $80,714 |
| 25 to 44 Years | 163 (35.8%) | $67,813 |
| 45 to 64 Years | 153 (33.6%) | $71,250 |
| 65+ Years | 129 (28.3%) | $74,375 |
| Total | 455 (100.0%) | $71,042 |
Poverty in Marine
Income Below Poverty by Sex and Age in Marine
With 2.7% poverty level for males and 4.3% for females among the residents of Marine, 18 to 24 year old males and 75 year old and over females are the most vulnerable to poverty, with 5 males (12.8%) and 7 females (15.6%) in their respective age groups living below the poverty level.
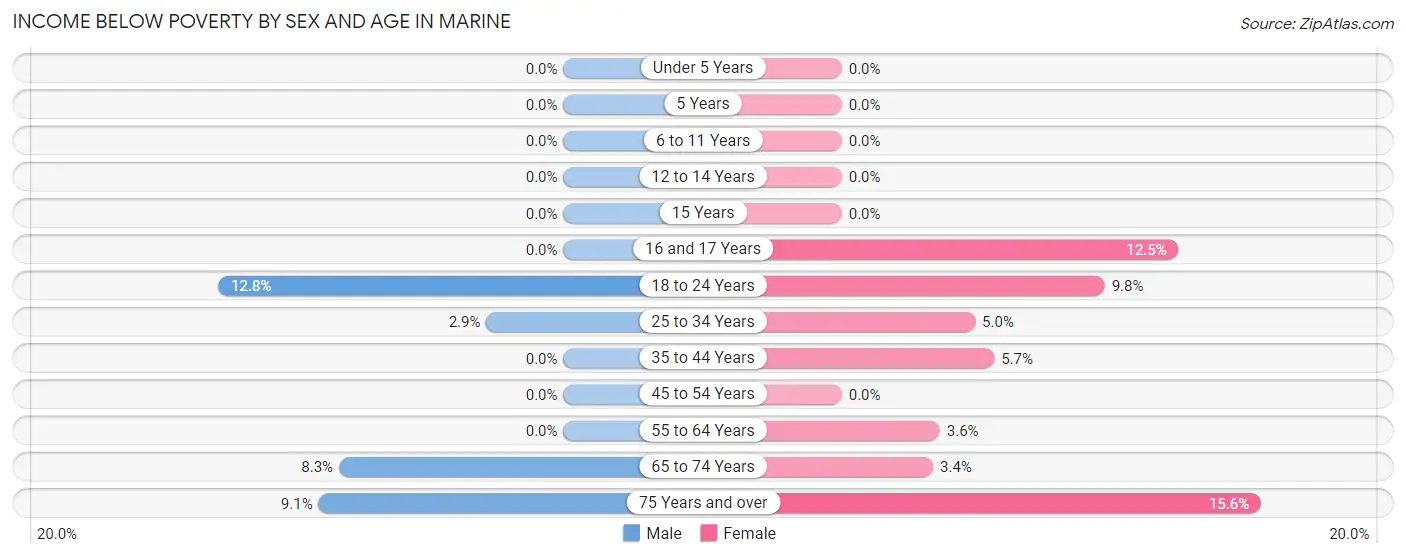
| Age Bracket | Male | Female |
| Under 5 Years | 0 (0.0%) | 0 (0.0%) |
| 5 Years | 0 (0.0%) | 0 (0.0%) |
| 6 to 11 Years | 0 (0.0%) | 0 (0.0%) |
| 12 to 14 Years | 0 (0.0%) | 0 (0.0%) |
| 15 Years | 0 (0.0%) | 0 (0.0%) |
| 16 and 17 Years | 0 (0.0%) | 2 (12.5%) |
| 18 to 24 Years | 5 (12.8%) | 4 (9.8%) |
| 25 to 34 Years | 3 (2.9%) | 5 (5.0%) |
| 35 to 44 Years | 0 (0.0%) | 3 (5.7%) |
| 45 to 54 Years | 0 (0.0%) | 0 (0.0%) |
| 55 to 64 Years | 0 (0.0%) | 4 (3.6%) |
| 65 to 74 Years | 6 (8.3%) | 2 (3.4%) |
| 75 Years and over | 3 (9.1%) | 7 (15.6%) |
| Total | 17 (2.7%) | 27 (4.3%) |
Income Above Poverty by Sex and Age in Marine
According to the poverty statistics in Marine, males aged under 5 years and females aged under 5 years are the age groups that are most secure financially, with 100.0% of males and 100.0% of females in these age groups living above the poverty line.
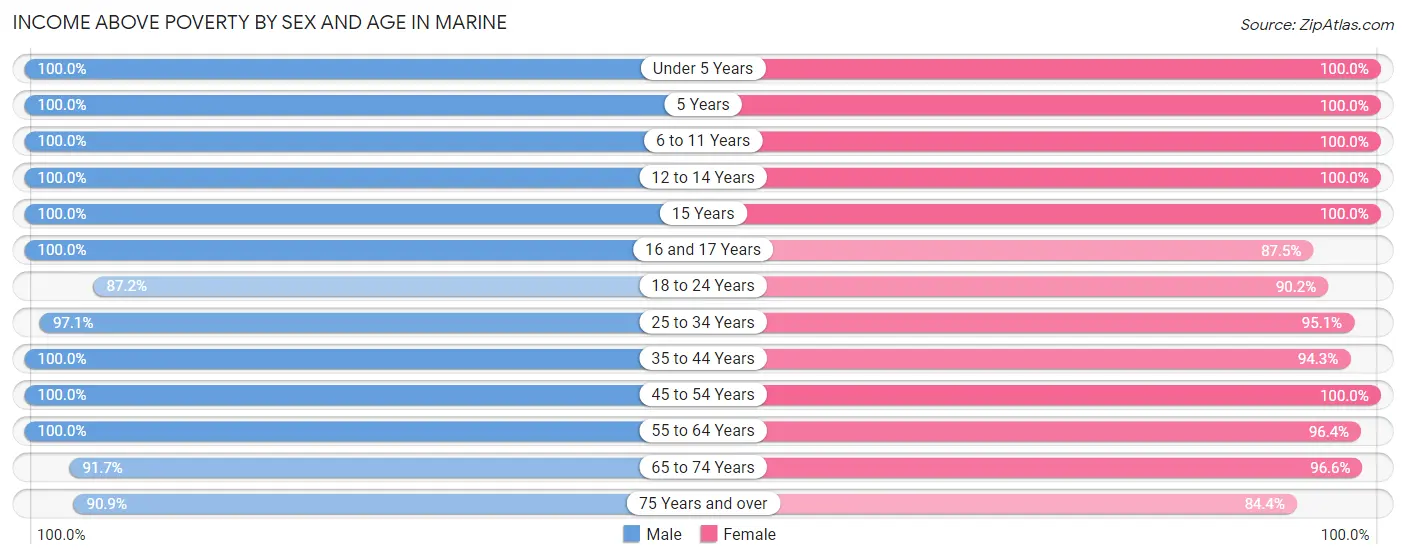
| Age Bracket | Male | Female |
| Under 5 Years | 46 (100.0%) | 14 (100.0%) |
| 5 Years | 19 (100.0%) | 20 (100.0%) |
| 6 to 11 Years | 46 (100.0%) | 63 (100.0%) |
| 12 to 14 Years | 41 (100.0%) | 39 (100.0%) |
| 15 Years | 2 (100.0%) | 3 (100.0%) |
| 16 and 17 Years | 43 (100.0%) | 14 (87.5%) |
| 18 to 24 Years | 34 (87.2%) | 37 (90.2%) |
| 25 to 34 Years | 102 (97.1%) | 96 (95.1%) |
| 35 to 44 Years | 85 (100.0%) | 50 (94.3%) |
| 45 to 54 Years | 39 (100.0%) | 63 (100.0%) |
| 55 to 64 Years | 67 (100.0%) | 106 (96.4%) |
| 65 to 74 Years | 66 (91.7%) | 57 (96.6%) |
| 75 Years and over | 30 (90.9%) | 38 (84.4%) |
| Total | 620 (97.3%) | 600 (95.7%) |
Income Below Poverty Among Married-Couple Families in Marine
The poverty statistics for married-couple families in Marine show that 2.2% or 6 of the total 271 families live below the poverty line. Families with no children have the highest poverty rate of 4.8%, comprising of 6 families. On the other hand, families with 1 or 2 children have the lowest poverty rate of 0.0%, which includes 0 families.
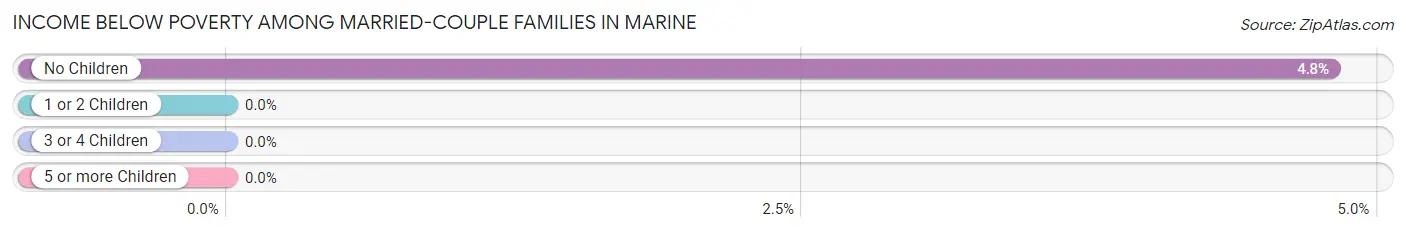
| Children | Above Poverty | Below Poverty |
| No Children | 119 (95.2%) | 6 (4.8%) |
| 1 or 2 Children | 95 (100.0%) | 0 (0.0%) |
| 3 or 4 Children | 51 (100.0%) | 0 (0.0%) |
| 5 or more Children | 0 (0.0%) | 0 (0.0%) |
| Total | 265 (97.8%) | 6 (2.2%) |
Income Below Poverty Among Single-Parent Households in Marine
According to the poverty data in Marine, 20.0% or 3 single-father households and 3.8% or 3 single-mother households are living below the poverty line. Among single-father households, those with no children have the highest poverty rate, with 3 households (100.0%) experiencing poverty. Likewise, among single-mother households, those with 1 or 2 children have the highest poverty rate, with 3 households (21.4%) falling below the poverty line.
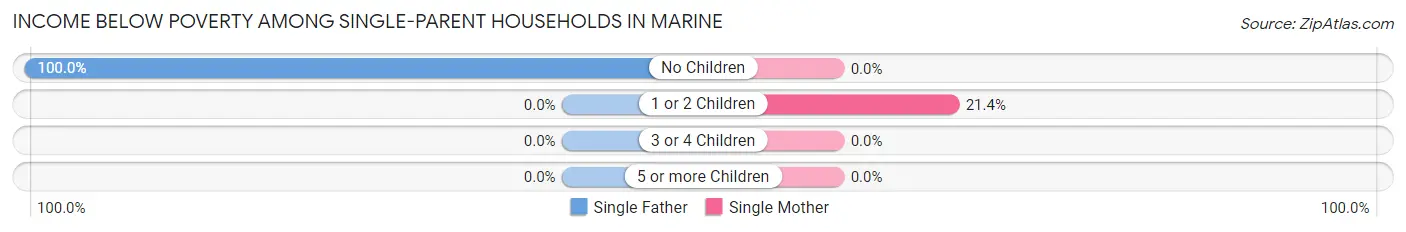
| Children | Single Father | Single Mother |
| No Children | 3 (100.0%) | 0 (0.0%) |
| 1 or 2 Children | 0 (0.0%) | 3 (21.4%) |
| 3 or 4 Children | 0 (0.0%) | 0 (0.0%) |
| 5 or more Children | 0 (0.0%) | 0 (0.0%) |
| Total | 3 (20.0%) | 3 (3.8%) |
Income Below Poverty Among Married-Couple vs Single-Parent Households in Marine
The poverty data for Marine shows that 6 of the married-couple family households (2.2%) and 6 of the single-parent households (6.5%) are living below the poverty level. Within the married-couple family households, those with no children have the highest poverty rate, with 6 households (4.8%) falling below the poverty line. Among the single-parent households, those with 1 or 2 children have the highest poverty rate, with 3 household (11.5%) living below poverty.
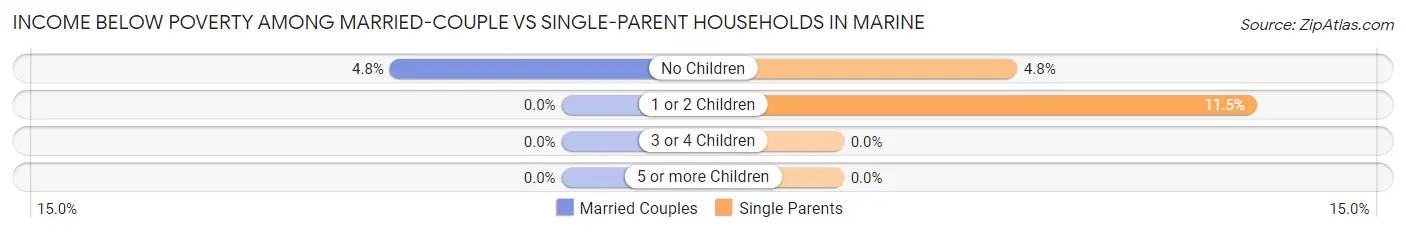
| Children | Married-Couple Families | Single-Parent Households |
| No Children | 6 (4.8%) | 3 (4.8%) |
| 1 or 2 Children | 0 (0.0%) | 3 (11.5%) |
| 3 or 4 Children | 0 (0.0%) | 0 (0.0%) |
| 5 or more Children | 0 (0.0%) | 0 (0.0%) |
| Total | 6 (2.2%) | 6 (6.5%) |
Race in Marine
The most populous races in Marine are White / Caucasian (1,169 | 92.5%), Two or more Races (65 | 5.1%), and Hispanic or Latino (53 | 4.2%).
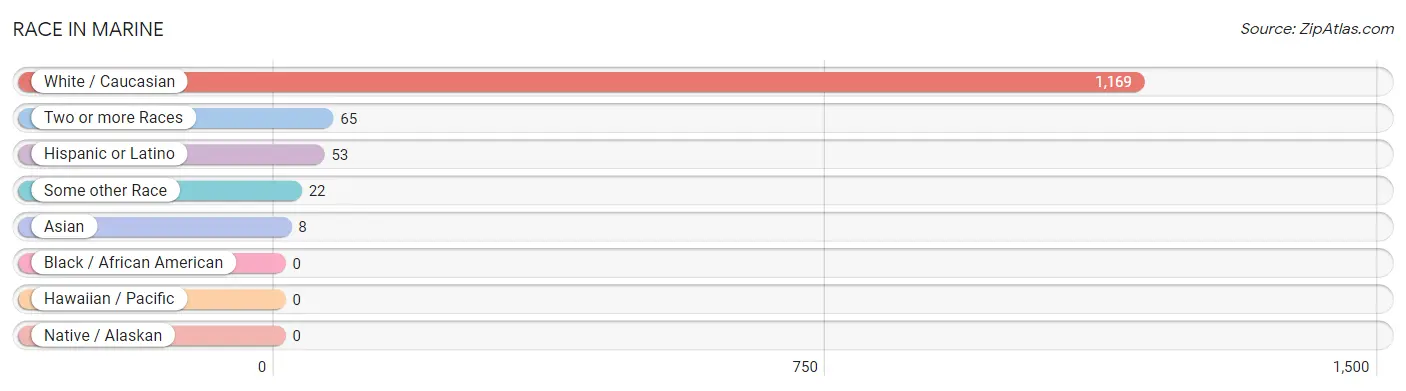
| Race | # Population | % Population |
| Asian | 8 | 0.6% |
| Black / African American | 0 | 0.0% |
| Hawaiian / Pacific | 0 | 0.0% |
| Hispanic or Latino | 53 | 4.2% |
| Native / Alaskan | 0 | 0.0% |
| White / Caucasian | 1,169 | 92.5% |
| Two or more Races | 65 | 5.1% |
| Some other Race | 22 | 1.7% |
| Total | 1,264 | 100.0% |
Ancestry in Marine
The most populous ancestries reported in Marine are German (350 | 27.7%), Irish (176 | 13.9%), English (156 | 12.3%), Polish (81 | 6.4%), and American (61 | 4.8%), together accounting for 65.2% of all Marine residents.
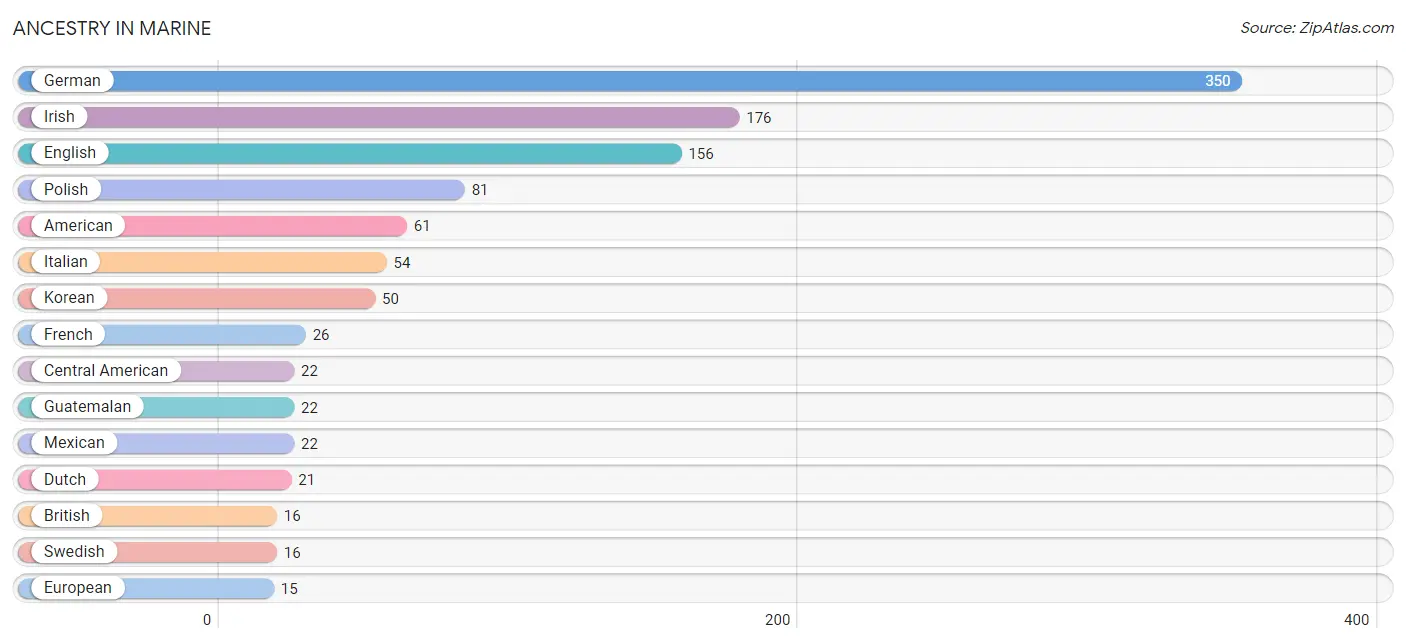
| Ancestry | # Population | % Population |
| American | 61 | 4.8% |
| Austrian | 9 | 0.7% |
| Bermudan | 5 | 0.4% |
| Bhutanese | 1 | 0.1% |
| British | 16 | 1.3% |
| Burmese | 3 | 0.2% |
| Central American | 22 | 1.7% |
| Colombian | 9 | 0.7% |
| Croatian | 4 | 0.3% |
| Czech | 8 | 0.6% |
| Danish | 3 | 0.2% |
| Dutch | 21 | 1.7% |
| English | 156 | 12.3% |
| European | 15 | 1.2% |
| French | 26 | 2.1% |
| French Canadian | 2 | 0.2% |
| German | 350 | 27.7% |
| Greek | 9 | 0.7% |
| Guatemalan | 22 | 1.7% |
| Irish | 176 | 13.9% |
| Italian | 54 | 4.3% |
| Korean | 50 | 4.0% |
| Lithuanian | 4 | 0.3% |
| Mexican | 22 | 1.7% |
| Pennsylvania German | 6 | 0.5% |
| Polish | 81 | 6.4% |
| Russian | 6 | 0.5% |
| Scotch-Irish | 4 | 0.3% |
| Scottish | 7 | 0.5% |
| South American | 9 | 0.7% |
| Swedish | 16 | 1.3% |
| Swiss | 6 | 0.5% |
| Thai | 9 | 0.7% | View All 33 Rows |
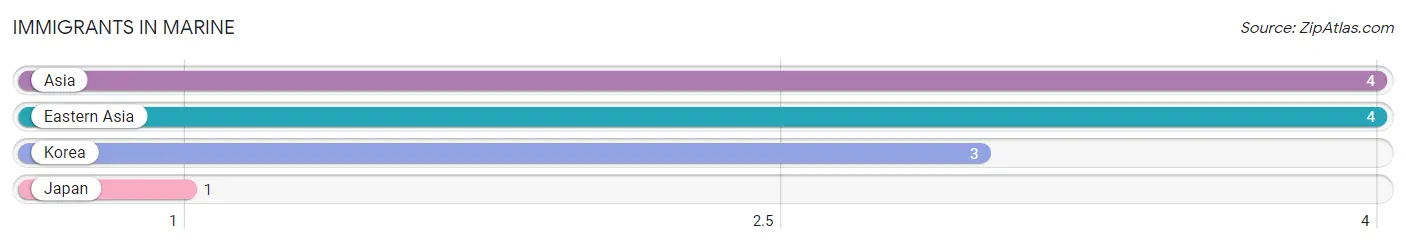
Immigrants in Marine
The most numerous immigrant groups reported in Marine came from Asia (4 | 0.3%), Eastern Asia (4 | 0.3%), Korea (3 | 0.2%), and Japan (1 | 0.1%), together accounting for 1.0% of all Marine residents.
| Immigration Origin | # Population | % Population |
| Asia | 4 | 0.3% |
| Eastern Asia | 4 | 0.3% |
| Japan | 1 | 0.1% |
| Korea | 3 | 0.2% | View All 4 Rows |
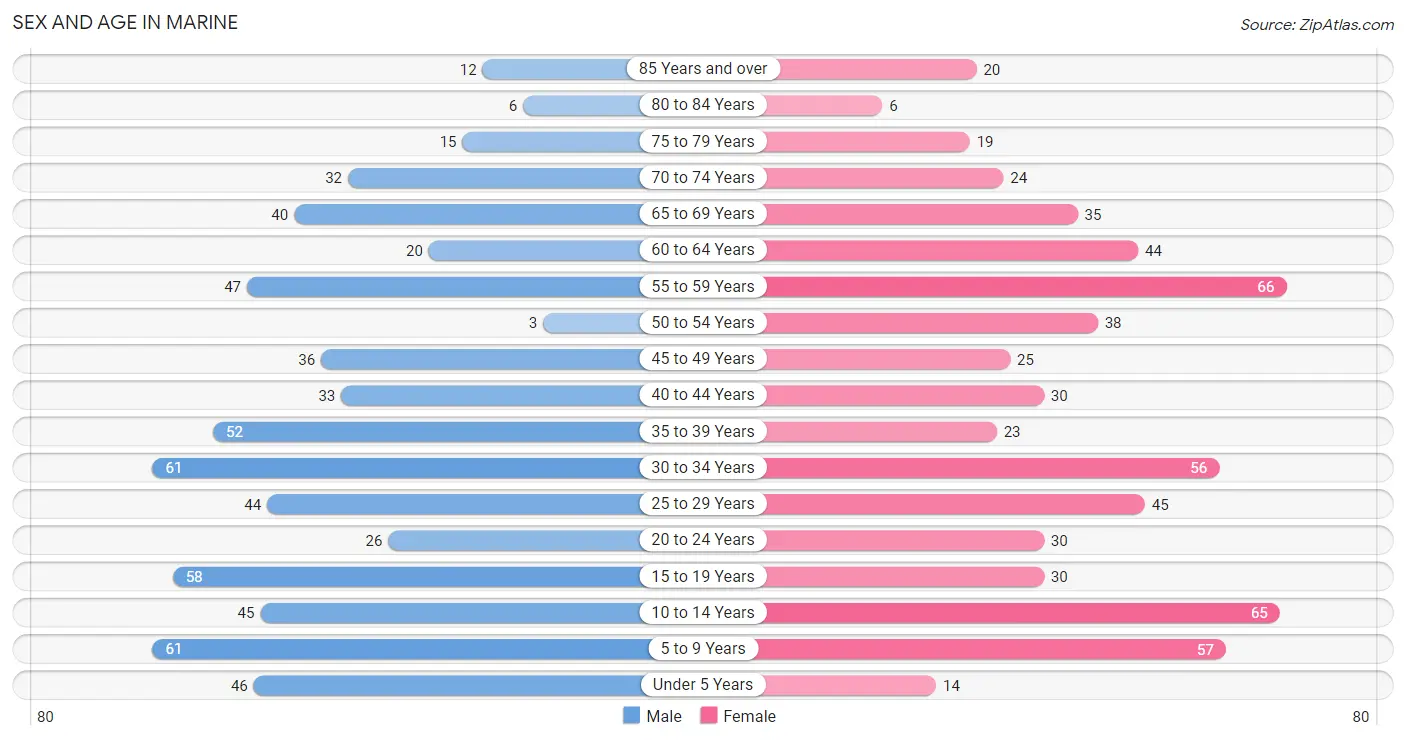
Sex and Age in Marine
Sex and Age in Marine
The most populous age groups in Marine are 5 to 9 Years (61 | 9.6%) for men and 55 to 59 Years (66 | 10.5%) for women.
| Age Bracket | Male | Female |
| Under 5 Years | 46 (7.2%) | 14 (2.2%) |
| 5 to 9 Years | 61 (9.6%) | 57 (9.1%) |
| 10 to 14 Years | 45 (7.1%) | 65 (10.4%) |
| 15 to 19 Years | 58 (9.1%) | 30 (4.8%) |
| 20 to 24 Years | 26 (4.1%) | 30 (4.8%) |
| 25 to 29 Years | 44 (6.9%) | 45 (7.2%) |
| 30 to 34 Years | 61 (9.6%) | 56 (8.9%) |
| 35 to 39 Years | 52 (8.2%) | 23 (3.7%) |
| 40 to 44 Years | 33 (5.2%) | 30 (4.8%) |
| 45 to 49 Years | 36 (5.7%) | 25 (4.0%) |
| 50 to 54 Years | 3 (0.5%) | 38 (6.1%) |
| 55 to 59 Years | 47 (7.4%) | 66 (10.5%) |
| 60 to 64 Years | 20 (3.1%) | 44 (7.0%) |
| 65 to 69 Years | 40 (6.3%) | 35 (5.6%) |
| 70 to 74 Years | 32 (5.0%) | 24 (3.8%) |
| 75 to 79 Years | 15 (2.4%) | 19 (3.0%) |
| 80 to 84 Years | 6 (0.9%) | 6 (1.0%) |
| 85 Years and over | 12 (1.9%) | 20 (3.2%) |
| Total | 637 (100.0%) | 627 (100.0%) |
Families and Households in Marine
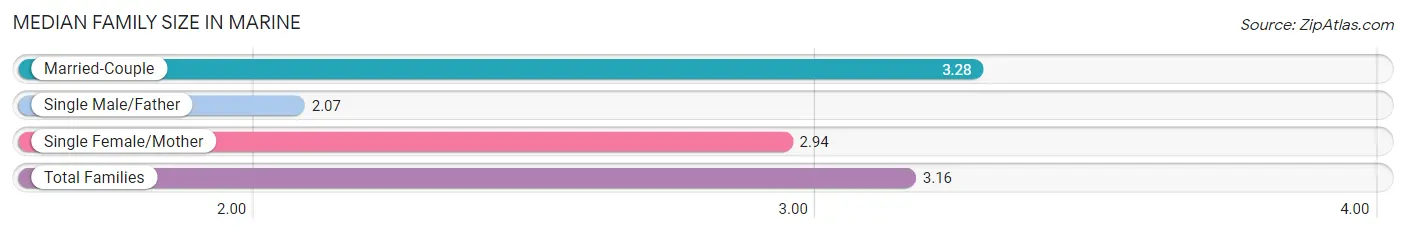
Median Family Size in Marine
The median family size in Marine is 3.16 persons per family, with married-couple families (271 | 74.5%) accounting for the largest median family size of 3.28 persons per family. On the other hand, single male/father families (15 | 4.1%) represent the smallest median family size with 2.07 persons per family.
| Family Type | # Families | Family Size |
| Married-Couple | 271 (74.5%) | 3.28 |
| Single Male/Father | 15 (4.1%) | 2.07 |
| Single Female/Mother | 78 (21.4%) | 2.94 |
| Total Families | 364 (100.0%) | 3.16 |
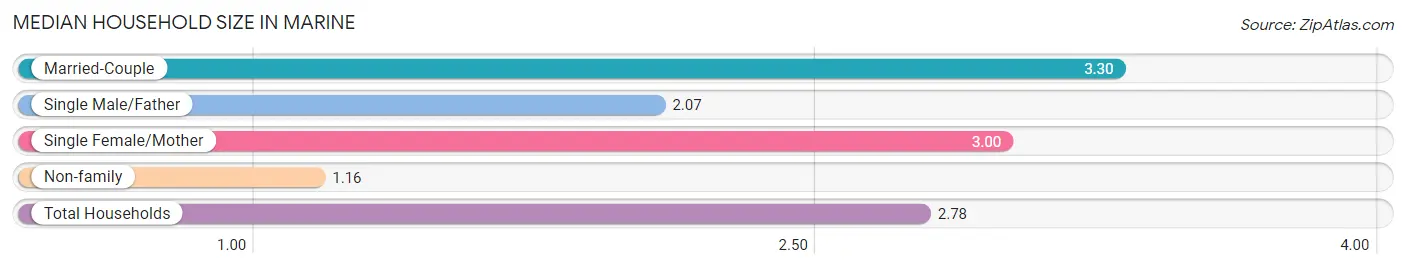
Median Household Size in Marine
The median household size in Marine is 2.78 persons per household, with married-couple households (271 | 59.6%) accounting for the largest median household size of 3.3 persons per household. non-family households (91 | 20.0%) represent the smallest median household size with 1.16 persons per household.
| Household Type | # Households | Household Size |
| Married-Couple | 271 (59.6%) | 3.30 |
| Single Male/Father | 15 (3.3%) | 2.07 |
| Single Female/Mother | 78 (17.1%) | 3.00 |
| Non-family | 91 (20.0%) | 1.16 |
| Total Households | 455 (100.0%) | 2.78 |
Household Size by Marriage Status in Marine
Out of a total of 455 households in Marine, 364 (80.0%) are family households, while 91 (20.0%) are nonfamily households. The most numerous type of family households are 2-person households, comprising 136, and the most common type of nonfamily households are 1-person households, comprising 78.
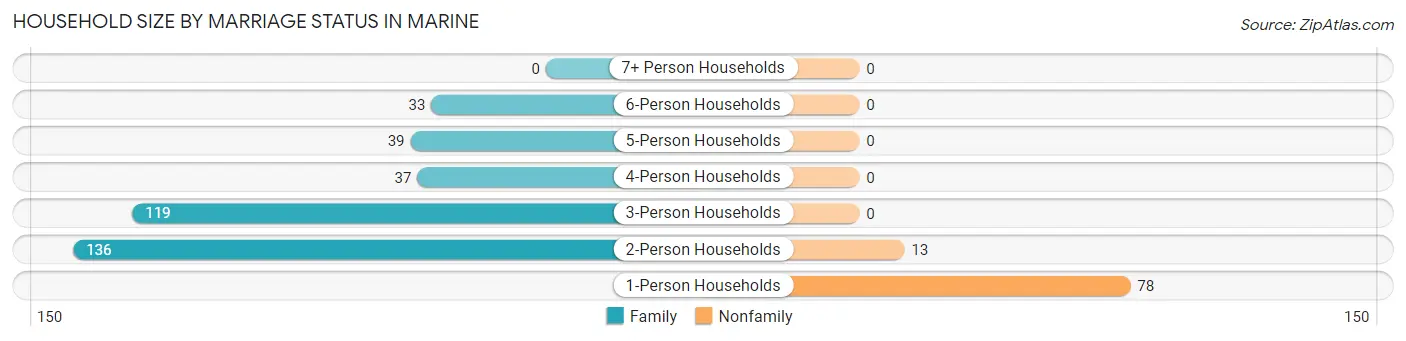
| Household Size | Family Households | Nonfamily Households |
| 1-Person Households | - | 78 (17.1%) |
| 2-Person Households | 136 (29.9%) | 13 (2.9%) |
| 3-Person Households | 119 (26.2%) | 0 (0.0%) |
| 4-Person Households | 37 (8.1%) | 0 (0.0%) |
| 5-Person Households | 39 (8.6%) | 0 (0.0%) |
| 6-Person Households | 33 (7.2%) | 0 (0.0%) |
| 7+ Person Households | 0 (0.0%) | 0 (0.0%) |
| Total | 364 (80.0%) | 91 (20.0%) |
Female Fertility in Marine
Fertility by Age in Marine
Average fertility rate in Marine is 59.0 births per 1,000 women. Women in the age bracket of 20 to 34 years have the highest fertility rate with 69.0 births per 1,000 women. Women in the age bracket of 20 to 34 years acount for 64.3% of all women with births.
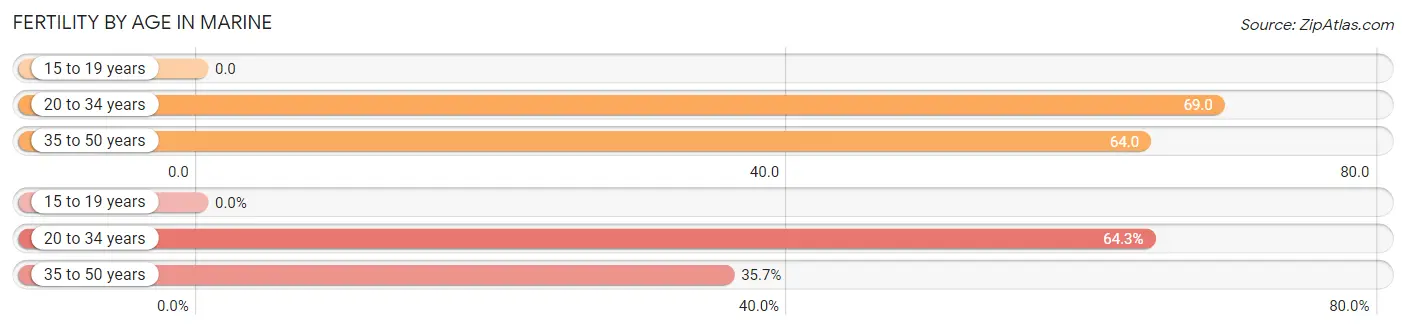
| Age Bracket | Women with Births | Births / 1,000 Women |
| 15 to 19 years | 0 (0.0%) | 0.0 |
| 20 to 34 years | 9 (64.3%) | 69.0 |
| 35 to 50 years | 5 (35.7%) | 64.0 |
| Total | 14 (100.0%) | 59.0 |
Fertility by Age by Marriage Status in Marine
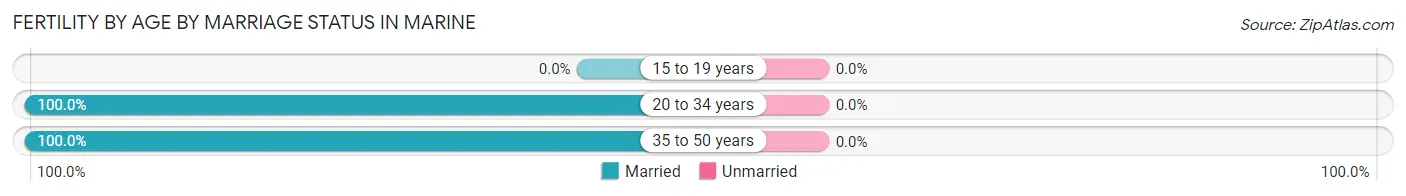
| Age Bracket | Married | Unmarried |
| 15 to 19 years | 0 (0.0%) | 0 (0.0%) |
| 20 to 34 years | 9 (100.0%) | 0 (0.0%) |
| 35 to 50 years | 5 (100.0%) | 0 (0.0%) |
| Total | 14 (100.0%) | 0 (0.0%) |
Fertility by Education in Marine
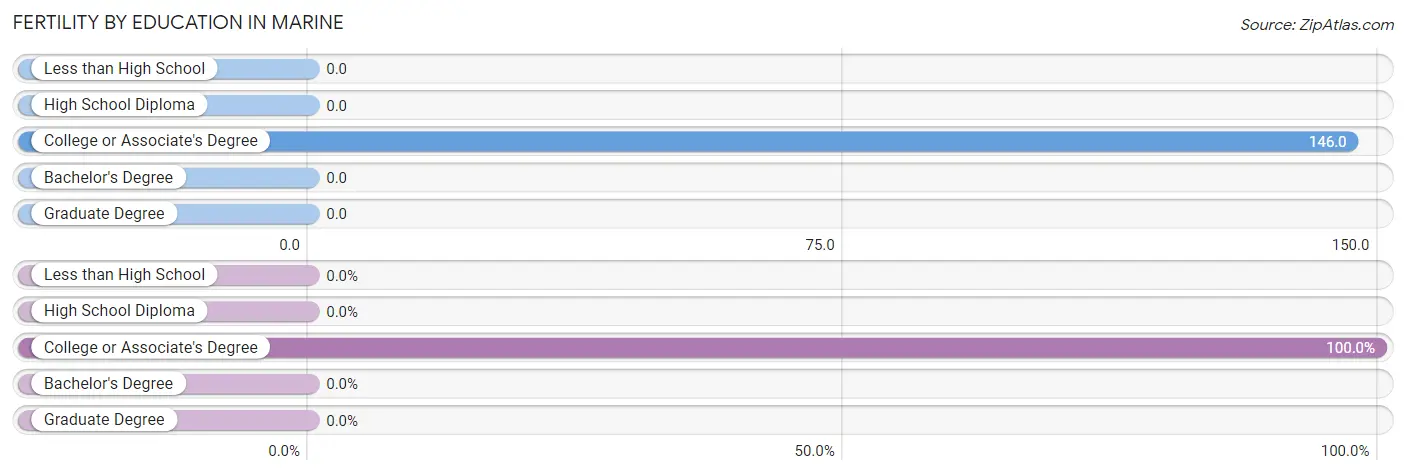
| Educational Attainment | Women with Births | Births / 1,000 Women |
| Less than High School | 0 (0.0%) | 0.0 |
| High School Diploma | 0 (0.0%) | 0.0 |
| College or Associate's Degree | 14 (100.0%) | 146.0 |
| Bachelor's Degree | 0 (0.0%) | 0.0 |
| Graduate Degree | 0 (0.0%) | 0.0 |
| Total | 14 (100.0%) | 59.0 |
Fertility by Education by Marriage Status in Marine
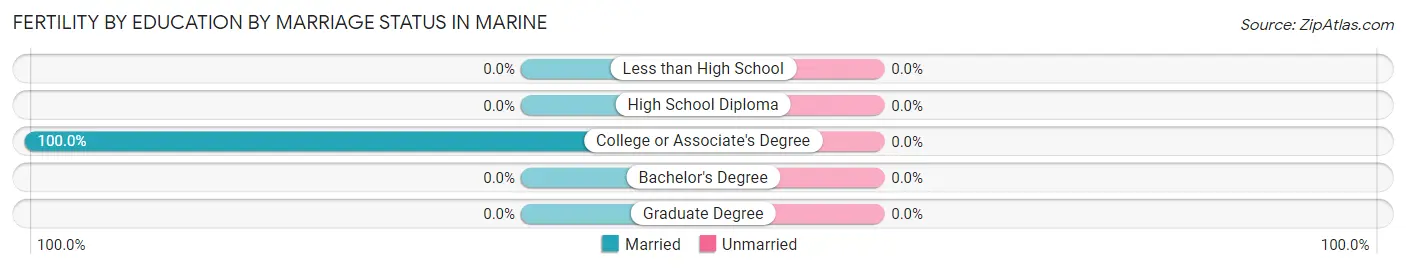
| Educational Attainment | Married | Unmarried |
| Less than High School | 0 (0.0%) | 0 (0.0%) |
| High School Diploma | 0 (0.0%) | 0 (0.0%) |
| College or Associate's Degree | 14 (100.0%) | 0 (0.0%) |
| Bachelor's Degree | 0 (0.0%) | 0 (0.0%) |
| Graduate Degree | 0 (0.0%) | 0 (0.0%) |
| Total | 14 (100.0%) | 0 (0.0%) |
Employment Characteristics in Marine
Employment by Class of Employer in Marine
Among the 592 employed individuals in Marine, private company employees (470 | 79.4%), self-employed (incorporated) (34 | 5.7%), and self-employed (not incorporated) (31 | 5.2%) make up the most common classes of employment.
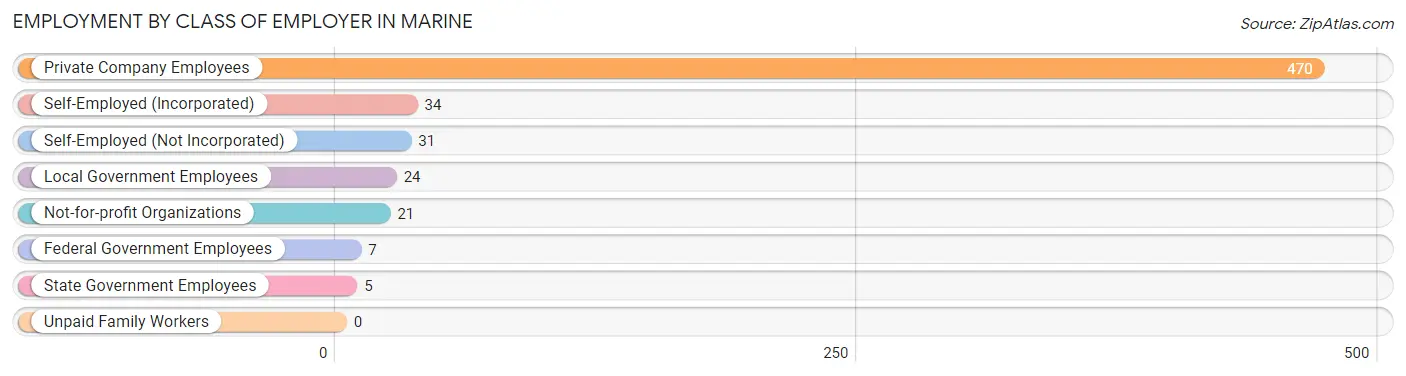
| Employer Class | # Employees | % Employees |
| Private Company Employees | 470 | 79.4% |
| Self-Employed (Incorporated) | 34 | 5.7% |
| Self-Employed (Not Incorporated) | 31 | 5.2% |
| Not-for-profit Organizations | 21 | 3.5% |
| Local Government Employees | 24 | 4.1% |
| State Government Employees | 5 | 0.8% |
| Federal Government Employees | 7 | 1.2% |
| Unpaid Family Workers | 0 | 0.0% |
| Total | 592 | 100.0% |
Employment Status by Age in Marine
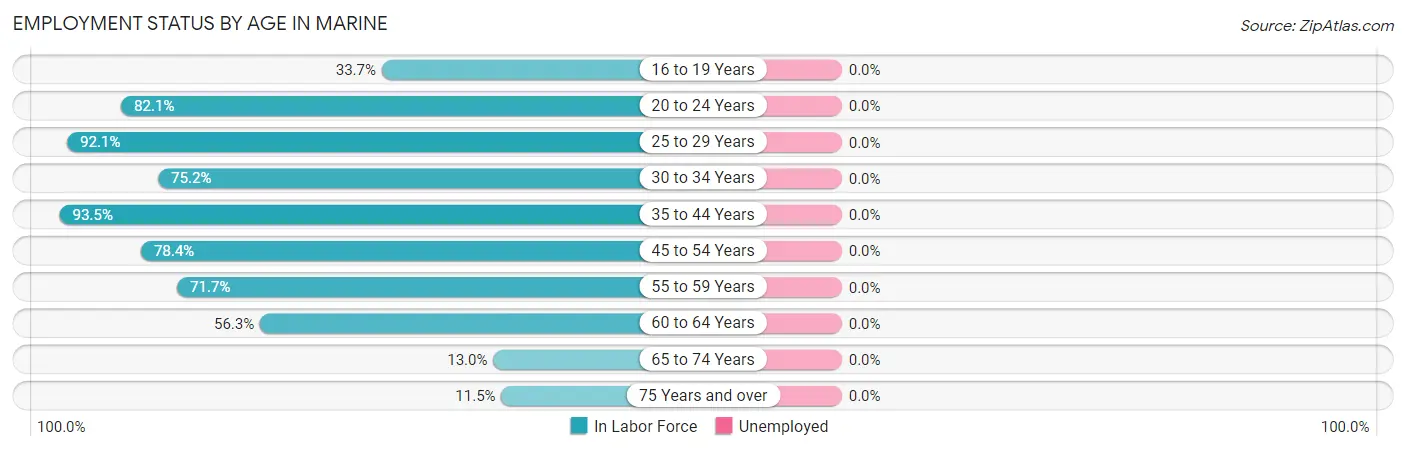
| Age Bracket | In Labor Force | Unemployed |
| 16 to 19 Years | 28 (33.7%) | 0 (0.0%) |
| 20 to 24 Years | 46 (82.1%) | 0 (0.0%) |
| 25 to 29 Years | 82 (92.1%) | 0 (0.0%) |
| 30 to 34 Years | 88 (75.2%) | 0 (0.0%) |
| 35 to 44 Years | 129 (93.5%) | 0 (0.0%) |
| 45 to 54 Years | 80 (78.4%) | 0 (0.0%) |
| 55 to 59 Years | 81 (71.7%) | 0 (0.0%) |
| 60 to 64 Years | 36 (56.3%) | 0 (0.0%) |
| 65 to 74 Years | 17 (13.0%) | 0 (0.0%) |
| 75 Years and over | 9 (11.5%) | 0 (0.0%) |
| Total | 596 (61.4%) | 0 (0.0%) |
Employment Status by Educational Attainment in Marine
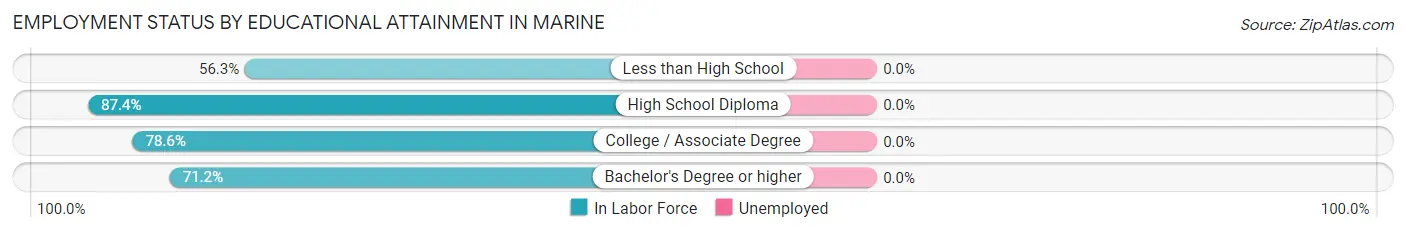
| Educational Attainment | In Labor Force | Unemployed |
| Less than High School | 9 (56.3%) | 0 (0.0%) |
| High School Diploma | 180 (87.4%) | 0 (0.0%) |
| College / Associate Degree | 228 (78.6%) | 0 (0.0%) |
| Bachelor's Degree or higher | 79 (71.2%) | 0 (0.0%) |
| Total | 496 (79.6%) | 0 (0.0%) |
Employment Occupations by Sex in Marine
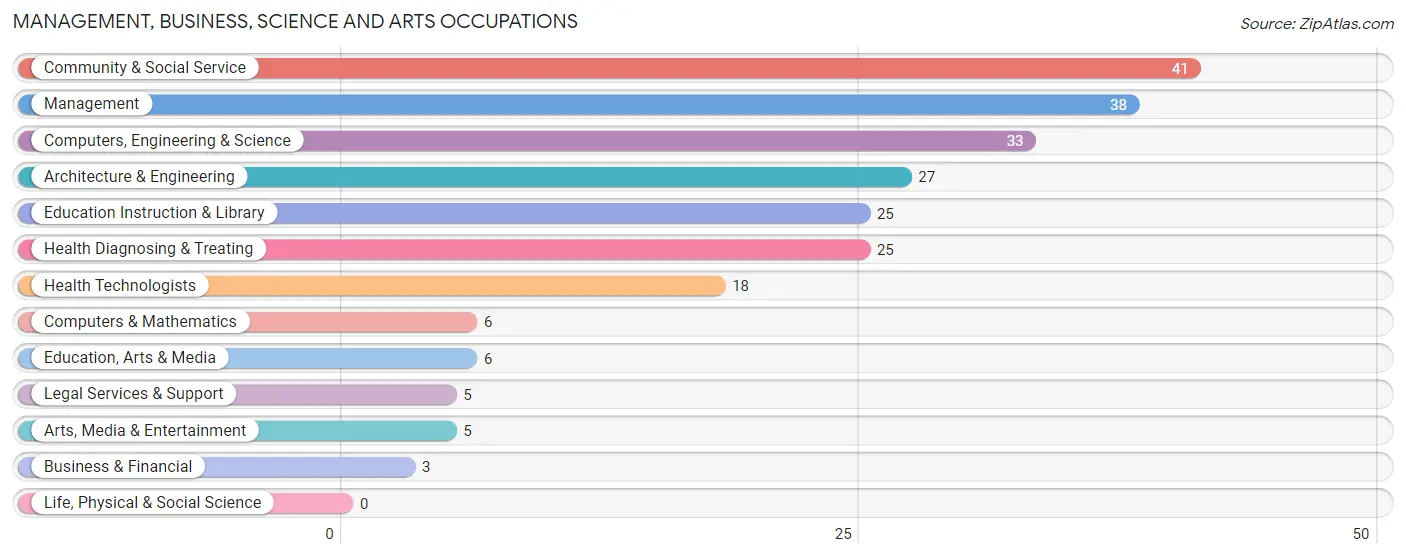
Management, Business, Science and Arts Occupations
The most common Management, Business, Science and Arts occupations in Marine are Community & Social Service (41 | 6.9%), Management (38 | 6.4%), Computers, Engineering & Science (33 | 5.5%), Architecture & Engineering (27 | 4.5%), and Education Instruction & Library (25 | 4.2%).
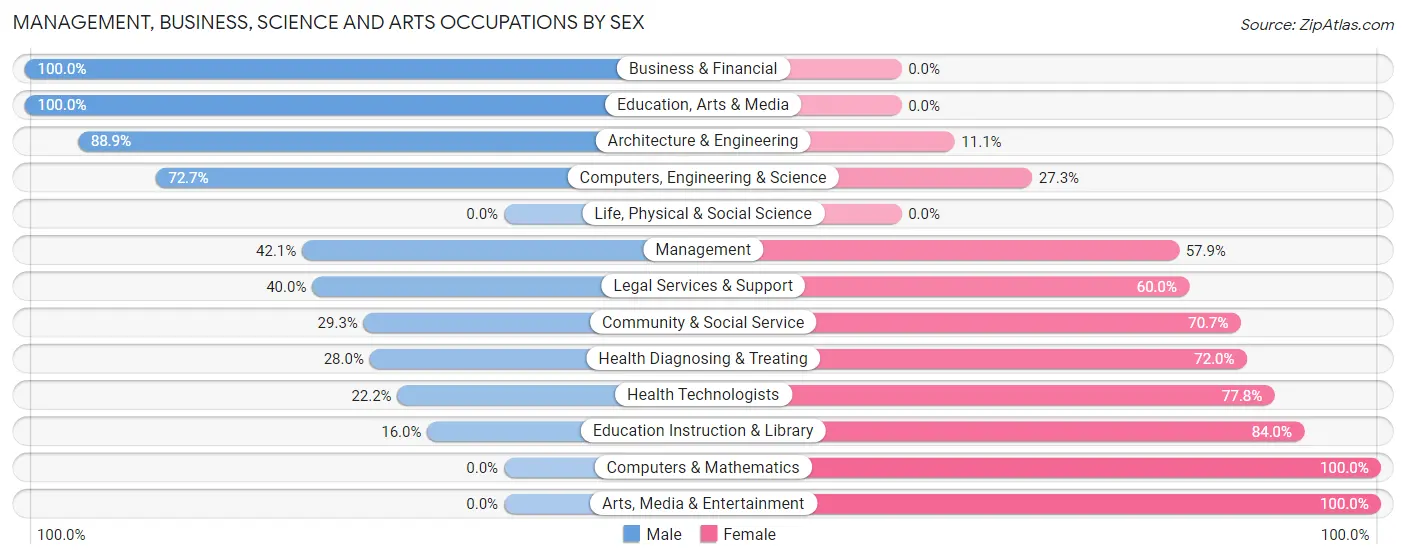
Management, Business, Science and Arts Occupations by Sex
Within the Management, Business, Science and Arts occupations in Marine, the most male-oriented occupations are Business & Financial (100.0%), Education, Arts & Media (100.0%), and Architecture & Engineering (88.9%), while the most female-oriented occupations are Computers & Mathematics (100.0%), Arts, Media & Entertainment (100.0%), and Education Instruction & Library (84.0%).
| Occupation | Male | Female |
| Management | 16 (42.1%) | 22 (57.9%) |
| Business & Financial | 3 (100.0%) | 0 (0.0%) |
| Computers, Engineering & Science | 24 (72.7%) | 9 (27.3%) |
| Computers & Mathematics | 0 (0.0%) | 6 (100.0%) |
| Architecture & Engineering | 24 (88.9%) | 3 (11.1%) |
| Life, Physical & Social Science | 0 (0.0%) | 0 (0.0%) |
| Community & Social Service | 12 (29.3%) | 29 (70.7%) |
| Education, Arts & Media | 6 (100.0%) | 0 (0.0%) |
| Legal Services & Support | 2 (40.0%) | 3 (60.0%) |
| Education Instruction & Library | 4 (16.0%) | 21 (84.0%) |
| Arts, Media & Entertainment | 0 (0.0%) | 5 (100.0%) |
| Health Diagnosing & Treating | 7 (28.0%) | 18 (72.0%) |
| Health Technologists | 4 (22.2%) | 14 (77.8%) |
| Total (Category) | 62 (44.3%) | 78 (55.7%) |
| Total (Overall) | 319 (53.5%) | 277 (46.5%) |
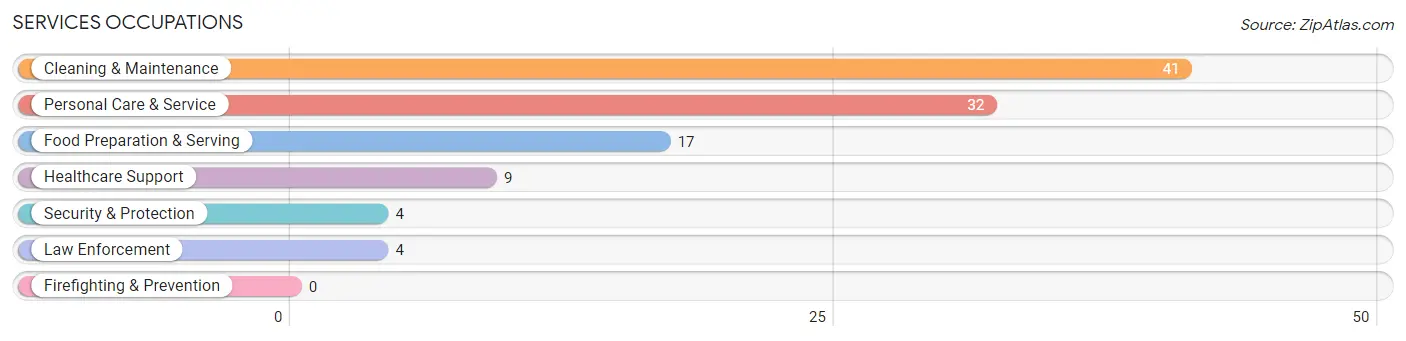
Services Occupations
The most common Services occupations in Marine are Cleaning & Maintenance (41 | 6.9%), Personal Care & Service (32 | 5.4%), Food Preparation & Serving (17 | 2.9%), Healthcare Support (9 | 1.5%), and Security & Protection (4 | 0.7%).
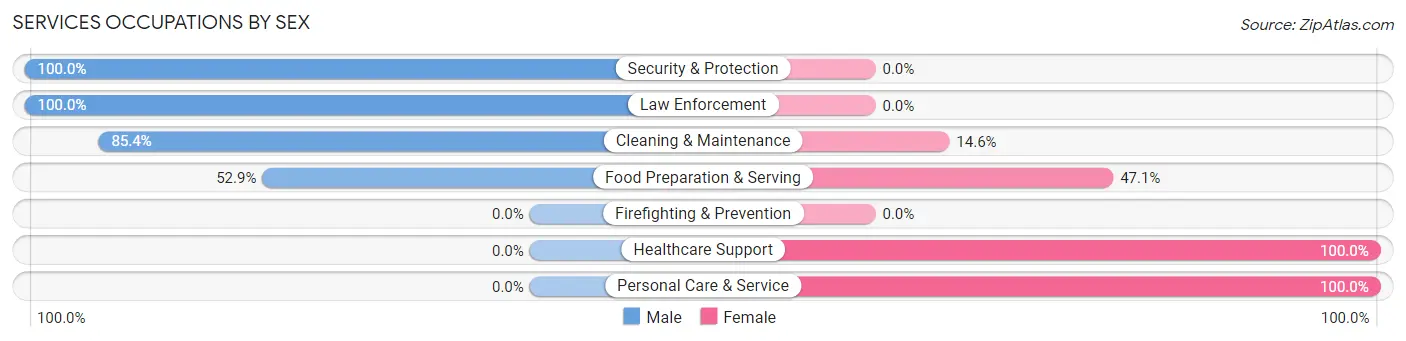
Services Occupations by Sex
Within the Services occupations in Marine, the most male-oriented occupations are Security & Protection (100.0%), Law Enforcement (100.0%), and Cleaning & Maintenance (85.4%), while the most female-oriented occupations are Healthcare Support (100.0%), Personal Care & Service (100.0%), and Food Preparation & Serving (47.1%).
| Occupation | Male | Female |
| Healthcare Support | 0 (0.0%) | 9 (100.0%) |
| Security & Protection | 4 (100.0%) | 0 (0.0%) |
| Firefighting & Prevention | 0 (0.0%) | 0 (0.0%) |
| Law Enforcement | 4 (100.0%) | 0 (0.0%) |
| Food Preparation & Serving | 9 (52.9%) | 8 (47.1%) |
| Cleaning & Maintenance | 35 (85.4%) | 6 (14.6%) |
| Personal Care & Service | 0 (0.0%) | 32 (100.0%) |
| Total (Category) | 48 (46.6%) | 55 (53.4%) |
| Total (Overall) | 319 (53.5%) | 277 (46.5%) |
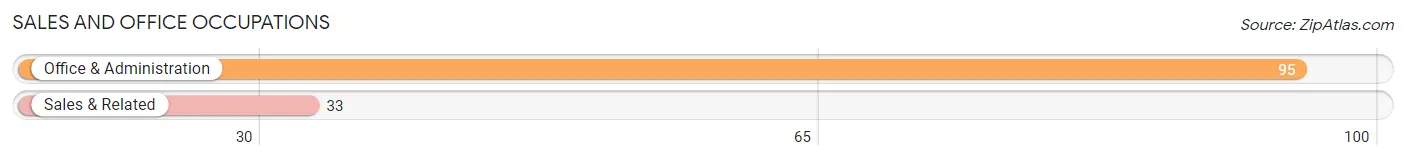
Sales and Office Occupations
The most common Sales and Office occupations in Marine are Office & Administration (95 | 15.9%), and Sales & Related (33 | 5.5%).
Sales and Office Occupations by Sex
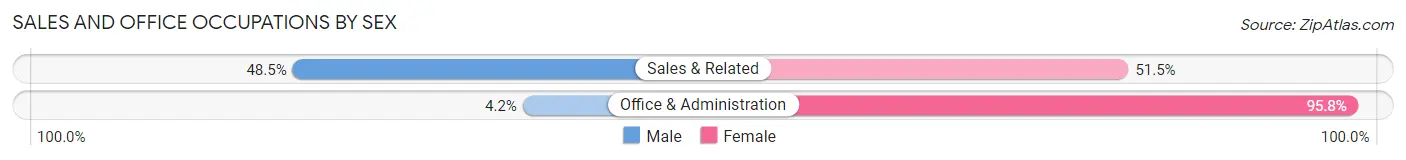
| Occupation | Male | Female |
| Sales & Related | 16 (48.5%) | 17 (51.5%) |
| Office & Administration | 4 (4.2%) | 91 (95.8%) |
| Total (Category) | 20 (15.6%) | 108 (84.4%) |
| Total (Overall) | 319 (53.5%) | 277 (46.5%) |
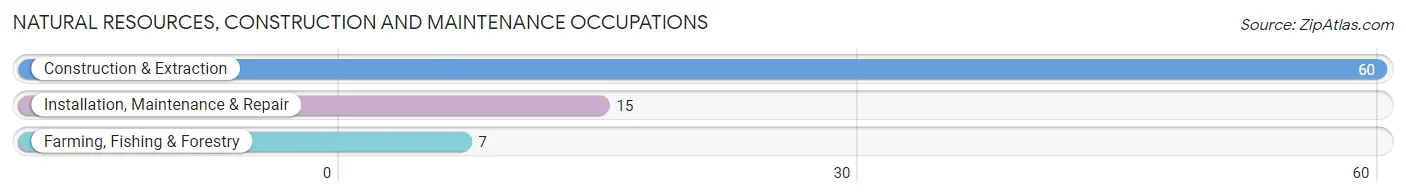
Natural Resources, Construction and Maintenance Occupations
The most common Natural Resources, Construction and Maintenance occupations in Marine are Construction & Extraction (60 | 10.1%), Installation, Maintenance & Repair (15 | 2.5%), and Farming, Fishing & Forestry (7 | 1.2%).
Natural Resources, Construction and Maintenance Occupations by Sex
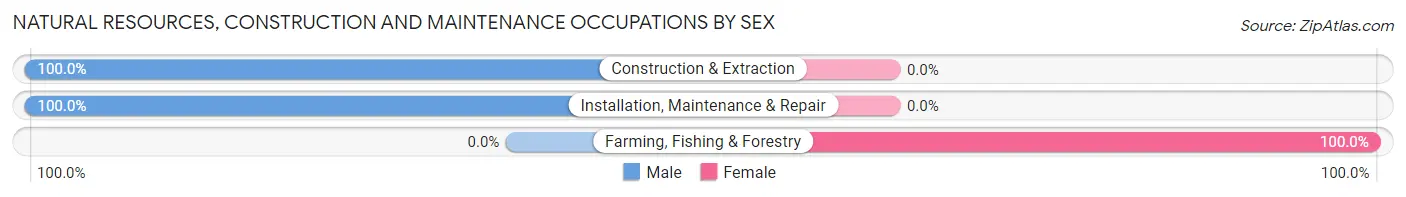
| Occupation | Male | Female |
| Farming, Fishing & Forestry | 0 (0.0%) | 7 (100.0%) |
| Construction & Extraction | 60 (100.0%) | 0 (0.0%) |
| Installation, Maintenance & Repair | 15 (100.0%) | 0 (0.0%) |
| Total (Category) | 75 (91.5%) | 7 (8.5%) |
| Total (Overall) | 319 (53.5%) | 277 (46.5%) |
Production, Transportation and Moving Occupations
The most common Production, Transportation and Moving occupations in Marine are Material Moving (60 | 10.1%), Production (54 | 9.1%), and Transportation (29 | 4.9%).
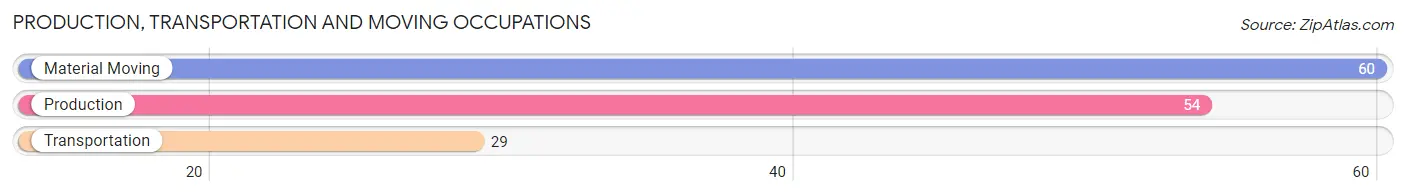
Production, Transportation and Moving Occupations by Sex
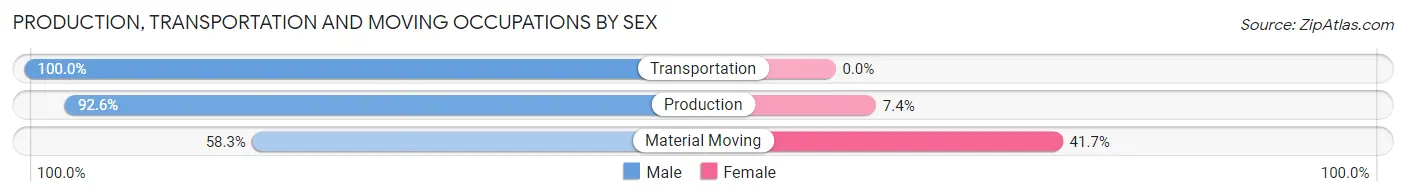
| Occupation | Male | Female |
| Production | 50 (92.6%) | 4 (7.4%) |
| Transportation | 29 (100.0%) | 0 (0.0%) |
| Material Moving | 35 (58.3%) | 25 (41.7%) |
| Total (Category) | 114 (79.7%) | 29 (20.3%) |
| Total (Overall) | 319 (53.5%) | 277 (46.5%) |
Employment Industries by Sex in Marine
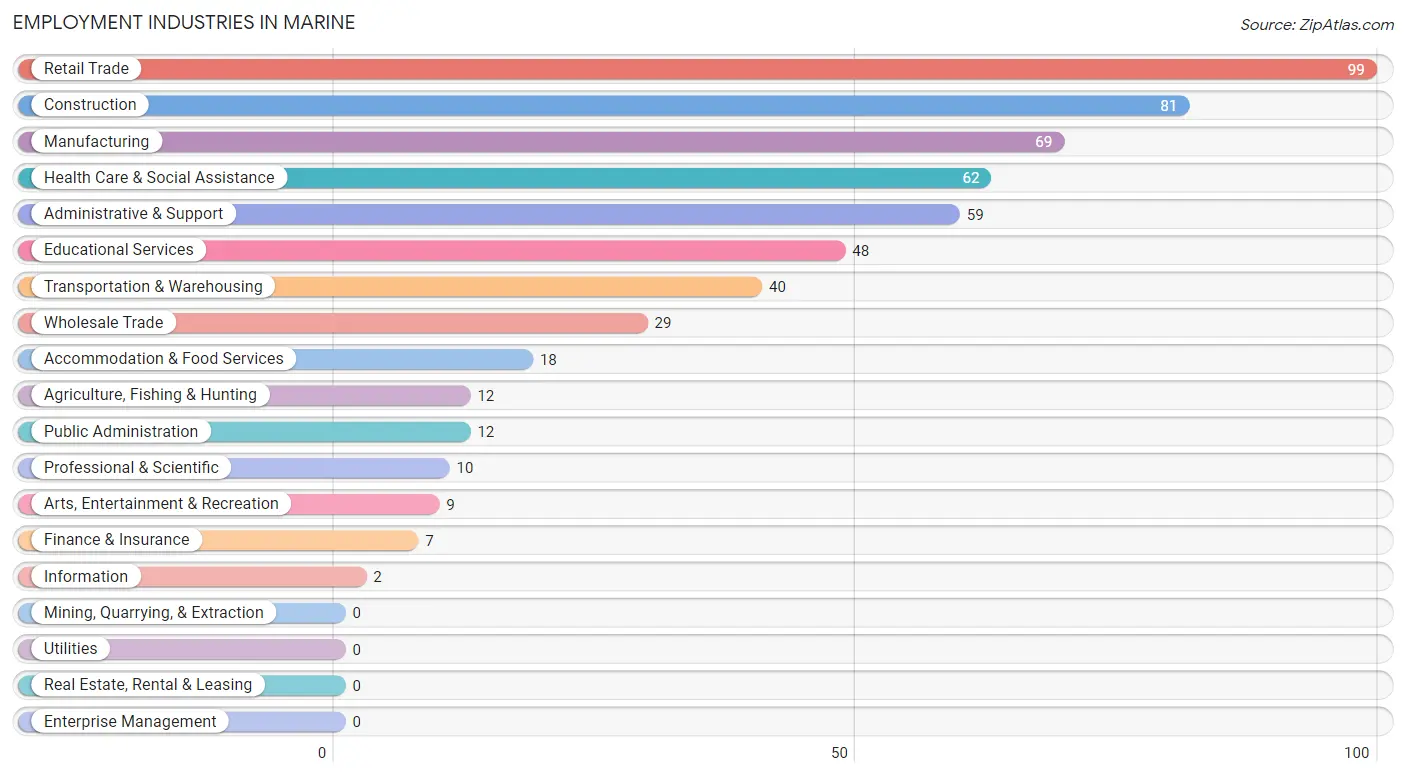
Employment Industries in Marine
The major employment industries in Marine include Retail Trade (99 | 16.6%), Construction (81 | 13.6%), Manufacturing (69 | 11.6%), Health Care & Social Assistance (62 | 10.4%), and Administrative & Support (59 | 9.9%).
Employment Industries by Sex in Marine
The Marine industries that see more men than women are Information (100.0%), Manufacturing (89.9%), and Accommodation & Food Services (83.3%), whereas the industries that tend to have a higher number of women are Arts, Entertainment & Recreation (100.0%), Health Care & Social Assistance (88.7%), and Wholesale Trade (82.8%).
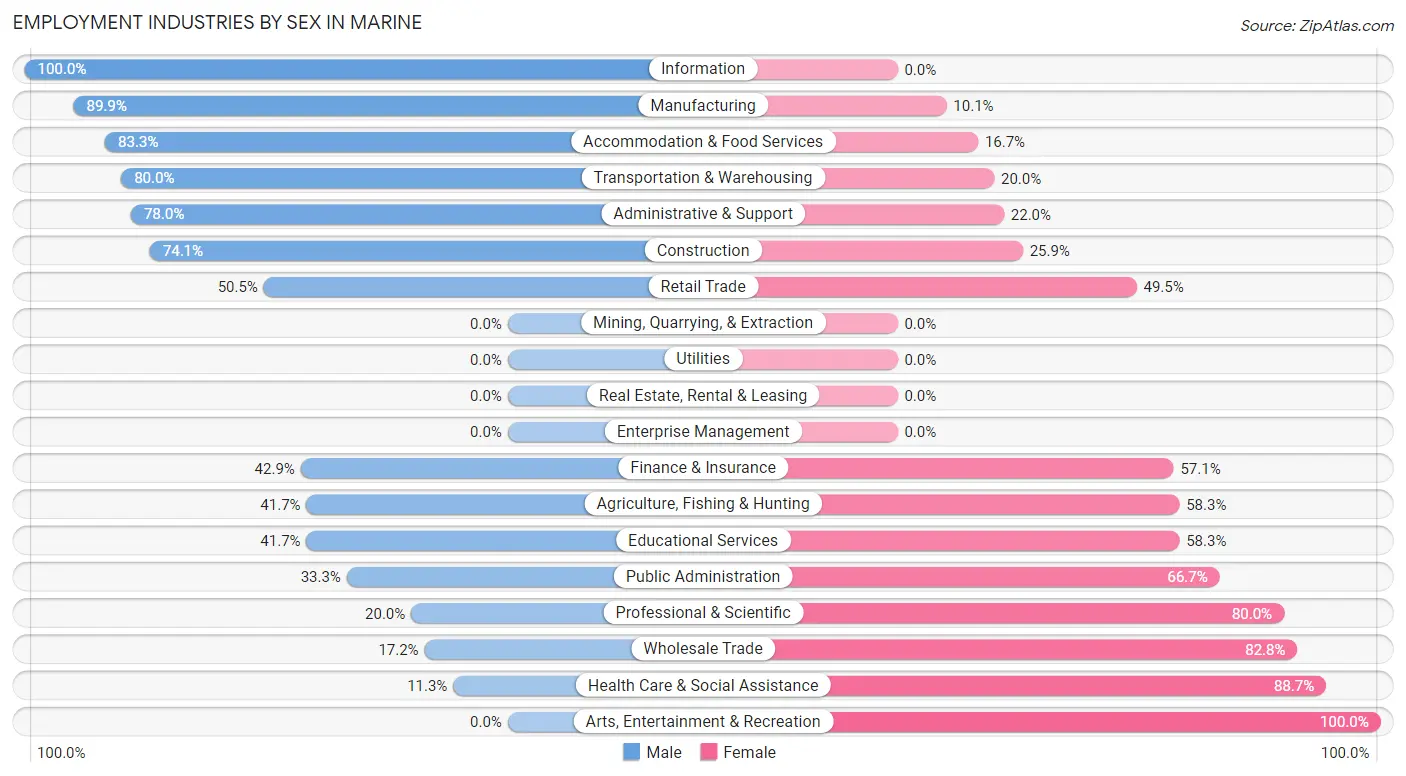
| Industry | Male | Female |
| Agriculture, Fishing & Hunting | 5 (41.7%) | 7 (58.3%) |
| Mining, Quarrying, & Extraction | 0 (0.0%) | 0 (0.0%) |
| Construction | 60 (74.1%) | 21 (25.9%) |
| Manufacturing | 62 (89.9%) | 7 (10.1%) |
| Wholesale Trade | 5 (17.2%) | 24 (82.8%) |
| Retail Trade | 50 (50.5%) | 49 (49.5%) |
| Transportation & Warehousing | 32 (80.0%) | 8 (20.0%) |
| Utilities | 0 (0.0%) | 0 (0.0%) |
| Information | 2 (100.0%) | 0 (0.0%) |
| Finance & Insurance | 3 (42.9%) | 4 (57.1%) |
| Real Estate, Rental & Leasing | 0 (0.0%) | 0 (0.0%) |
| Professional & Scientific | 2 (20.0%) | 8 (80.0%) |
| Enterprise Management | 0 (0.0%) | 0 (0.0%) |
| Administrative & Support | 46 (78.0%) | 13 (22.0%) |
| Educational Services | 20 (41.7%) | 28 (58.3%) |
| Health Care & Social Assistance | 7 (11.3%) | 55 (88.7%) |
| Arts, Entertainment & Recreation | 0 (0.0%) | 9 (100.0%) |
| Accommodation & Food Services | 15 (83.3%) | 3 (16.7%) |
| Public Administration | 4 (33.3%) | 8 (66.7%) |
| Total | 319 (53.5%) | 277 (46.5%) |
Education in Marine
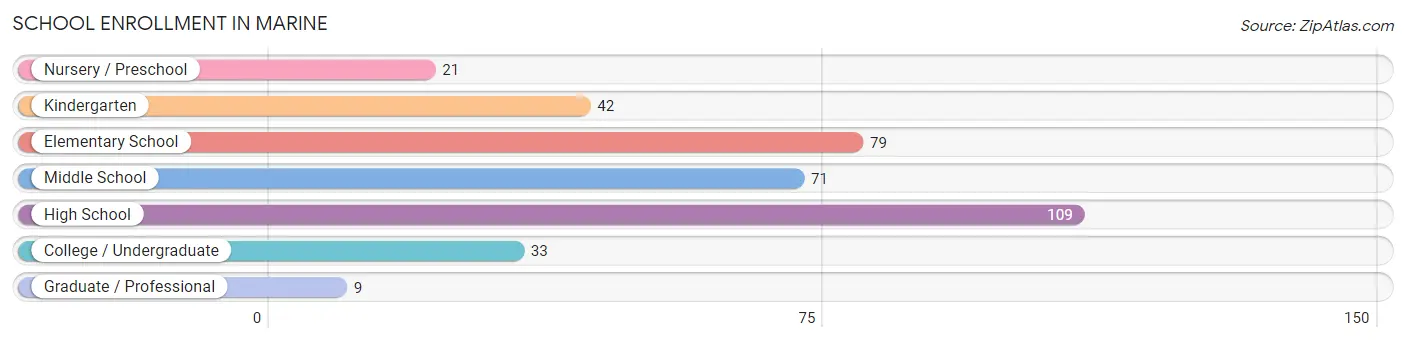
School Enrollment in Marine
The most common levels of schooling among the 364 students in Marine are high school (109 | 29.9%), elementary school (79 | 21.7%), and middle school (71 | 19.5%).
| School Level | # Students | % Students |
| Nursery / Preschool | 21 | 5.8% |
| Kindergarten | 42 | 11.5% |
| Elementary School | 79 | 21.7% |
| Middle School | 71 | 19.5% |
| High School | 109 | 29.9% |
| College / Undergraduate | 33 | 9.1% |
| Graduate / Professional | 9 | 2.5% |
| Total | 364 | 100.0% |
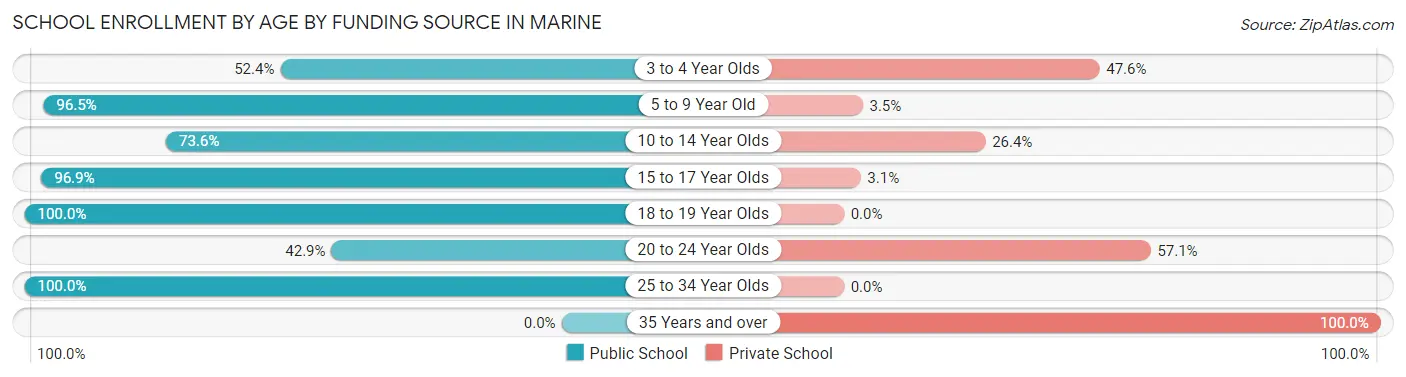
School Enrollment by Age by Funding Source in Marine
Out of a total of 364 students who are enrolled in schools in Marine, 56 (15.4%) attend a private institution, while the remaining 308 (84.6%) are enrolled in public schools. The age group of 35 years and over has the highest likelihood of being enrolled in private schools, with 3 (100.0% in the age bracket) enrolled. Conversely, the age group of 18 to 19 year olds has the lowest likelihood of being enrolled in a private school, with 24 (100.0% in the age bracket) attending a public institution.
| Age Bracket | Public School | Private School |
| 3 to 4 Year Olds | 11 (52.4%) | 10 (47.6%) |
| 5 to 9 Year Old | 110 (96.5%) | 4 (3.5%) |
| 10 to 14 Year Olds | 81 (73.6%) | 29 (26.4%) |
| 15 to 17 Year Olds | 62 (96.9%) | 2 (3.1%) |
| 18 to 19 Year Olds | 24 (100.0%) | 0 (0.0%) |
| 20 to 24 Year Olds | 6 (42.9%) | 8 (57.1%) |
| 25 to 34 Year Olds | 14 (100.0%) | 0 (0.0%) |
| 35 Years and over | 0 (0.0%) | 3 (100.0%) |
| Total | 308 (84.6%) | 56 (15.4%) |
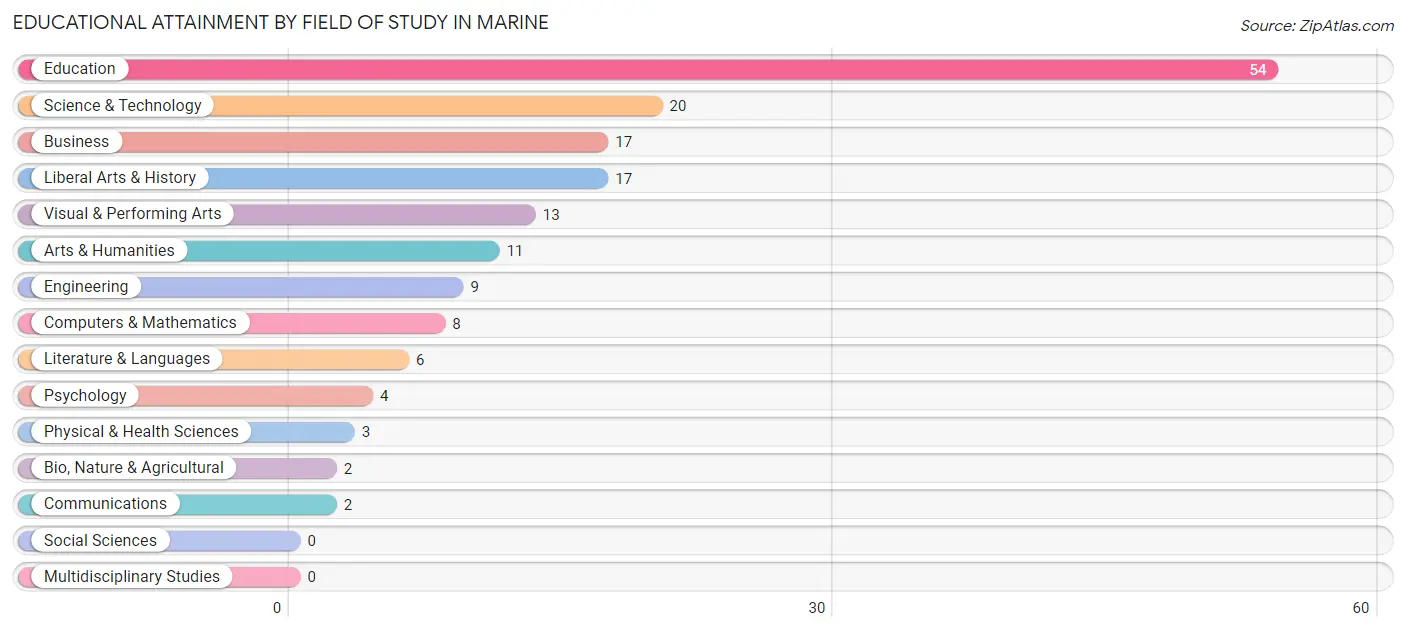
Educational Attainment by Field of Study in Marine
Education (54 | 32.5%), science & technology (20 | 12.0%), business (17 | 10.2%), liberal arts & history (17 | 10.2%), and visual & performing arts (13 | 7.8%) are the most common fields of study among 166 individuals in Marine who have obtained a bachelor's degree or higher.
| Field of Study | # Graduates | % Graduates |
| Computers & Mathematics | 8 | 4.8% |
| Bio, Nature & Agricultural | 2 | 1.2% |
| Physical & Health Sciences | 3 | 1.8% |
| Psychology | 4 | 2.4% |
| Social Sciences | 0 | 0.0% |
| Engineering | 9 | 5.4% |
| Multidisciplinary Studies | 0 | 0.0% |
| Science & Technology | 20 | 12.0% |
| Business | 17 | 10.2% |
| Education | 54 | 32.5% |
| Literature & Languages | 6 | 3.6% |
| Liberal Arts & History | 17 | 10.2% |
| Visual & Performing Arts | 13 | 7.8% |
| Communications | 2 | 1.2% |
| Arts & Humanities | 11 | 6.6% |
| Total | 166 | 100.0% |
Transportation & Commute in Marine
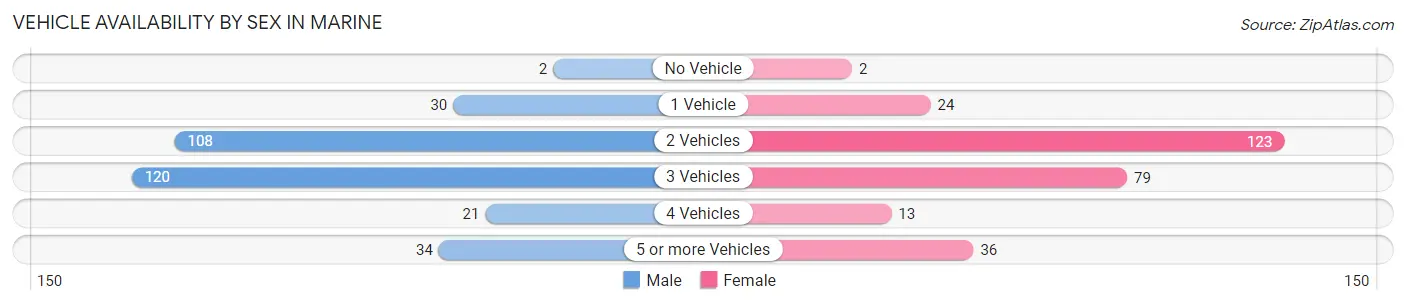
Vehicle Availability by Sex in Marine
The most prevalent vehicle ownership categories in Marine are males with 3 vehicles (120, accounting for 38.1%) and females with 3 vehicles (79, making up 43.3%).
| Vehicles Available | Male | Female |
| No Vehicle | 2 (0.6%) | 2 (0.7%) |
| 1 Vehicle | 30 (9.5%) | 24 (8.7%) |
| 2 Vehicles | 108 (34.3%) | 123 (44.4%) |
| 3 Vehicles | 120 (38.1%) | 79 (28.5%) |
| 4 Vehicles | 21 (6.7%) | 13 (4.7%) |
| 5 or more Vehicles | 34 (10.8%) | 36 (13.0%) |
| Total | 315 (100.0%) | 277 (100.0%) |
Commute Time in Marine
The most frequently occuring commute durations in Marine are 15 to 19 minutes (82 commuters, 15.2%), 10 to 14 minutes (80 commuters, 14.8%), and 25 to 29 minutes (68 commuters, 12.6%).
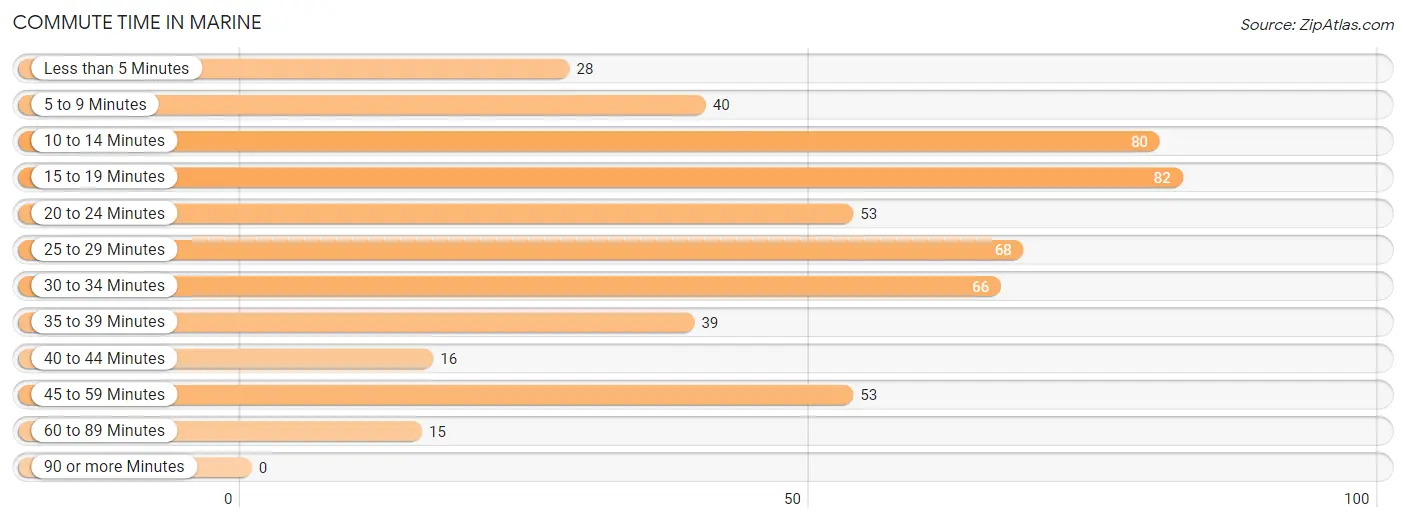
| Commute Time | # Commuters | % Commuters |
| Less than 5 Minutes | 28 | 5.2% |
| 5 to 9 Minutes | 40 | 7.4% |
| 10 to 14 Minutes | 80 | 14.8% |
| 15 to 19 Minutes | 82 | 15.2% |
| 20 to 24 Minutes | 53 | 9.8% |
| 25 to 29 Minutes | 68 | 12.6% |
| 30 to 34 Minutes | 66 | 12.2% |
| 35 to 39 Minutes | 39 | 7.2% |
| 40 to 44 Minutes | 16 | 3.0% |
| 45 to 59 Minutes | 53 | 9.8% |
| 60 to 89 Minutes | 15 | 2.8% |
| 90 or more Minutes | 0 | 0.0% |
Commute Time by Sex in Marine
The most common commute times in Marine are 25 to 29 minutes (57 commuters, 19.8%) for males and 20 to 24 minutes (48 commuters, 19.1%) for females.
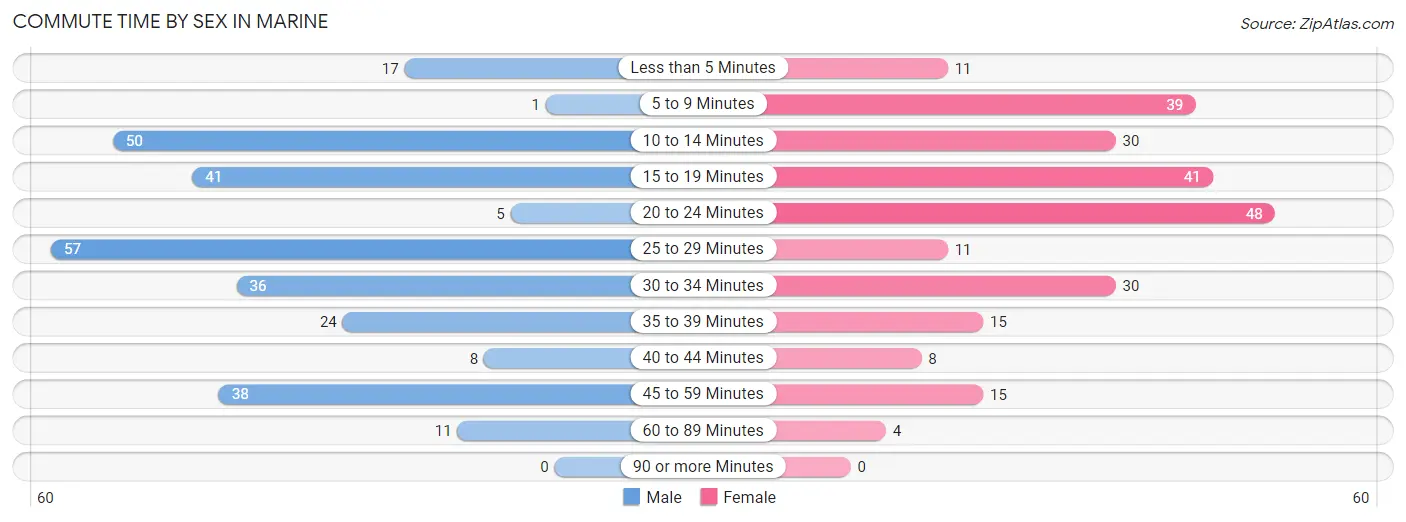
| Commute Time | Male | Female |
| Less than 5 Minutes | 17 (5.9%) | 11 (4.4%) |
| 5 to 9 Minutes | 1 (0.4%) | 39 (15.5%) |
| 10 to 14 Minutes | 50 (17.4%) | 30 (11.9%) |
| 15 to 19 Minutes | 41 (14.2%) | 41 (16.3%) |
| 20 to 24 Minutes | 5 (1.7%) | 48 (19.1%) |
| 25 to 29 Minutes | 57 (19.8%) | 11 (4.4%) |
| 30 to 34 Minutes | 36 (12.5%) | 30 (11.9%) |
| 35 to 39 Minutes | 24 (8.3%) | 15 (5.9%) |
| 40 to 44 Minutes | 8 (2.8%) | 8 (3.2%) |
| 45 to 59 Minutes | 38 (13.2%) | 15 (5.9%) |
| 60 to 89 Minutes | 11 (3.8%) | 4 (1.6%) |
| 90 or more Minutes | 0 (0.0%) | 0 (0.0%) |
Time of Departure to Work by Sex in Marine
The most frequent times of departure to work in Marine are 6:00 AM to 6:29 AM (71, 24.6%) for males and 7:30 AM to 7:59 AM (61, 24.2%) for females.
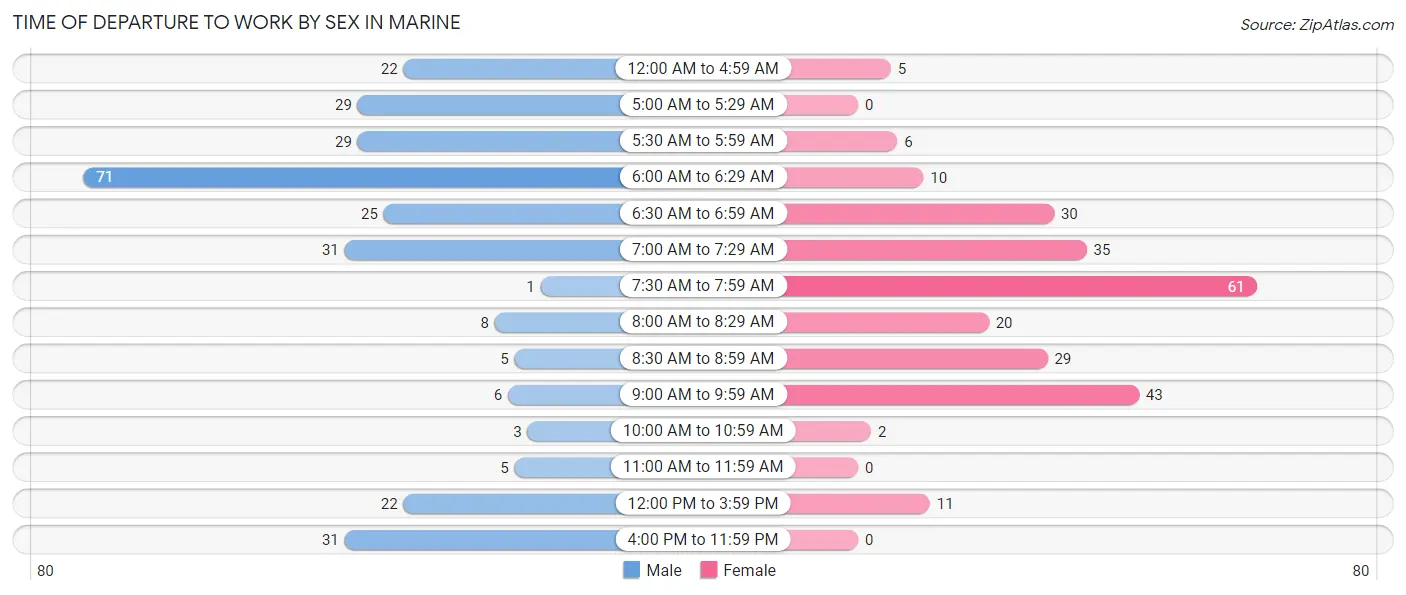
| Time of Departure | Male | Female |
| 12:00 AM to 4:59 AM | 22 (7.6%) | 5 (2.0%) |
| 5:00 AM to 5:29 AM | 29 (10.1%) | 0 (0.0%) |
| 5:30 AM to 5:59 AM | 29 (10.1%) | 6 (2.4%) |
| 6:00 AM to 6:29 AM | 71 (24.6%) | 10 (4.0%) |
| 6:30 AM to 6:59 AM | 25 (8.7%) | 30 (11.9%) |
| 7:00 AM to 7:29 AM | 31 (10.8%) | 35 (13.9%) |
| 7:30 AM to 7:59 AM | 1 (0.4%) | 61 (24.2%) |
| 8:00 AM to 8:29 AM | 8 (2.8%) | 20 (7.9%) |
| 8:30 AM to 8:59 AM | 5 (1.7%) | 29 (11.5%) |
| 9:00 AM to 9:59 AM | 6 (2.1%) | 43 (17.1%) |
| 10:00 AM to 10:59 AM | 3 (1.0%) | 2 (0.8%) |
| 11:00 AM to 11:59 AM | 5 (1.7%) | 0 (0.0%) |
| 12:00 PM to 3:59 PM | 22 (7.6%) | 11 (4.4%) |
| 4:00 PM to 11:59 PM | 31 (10.8%) | 0 (0.0%) |
| Total | 288 (100.0%) | 252 (100.0%) |
Housing Occupancy in Marine
Occupancy by Ownership in Marine
Of the total 455 dwellings in Marine, owner-occupied units account for 385 (84.6%), while renter-occupied units make up 70 (15.4%).
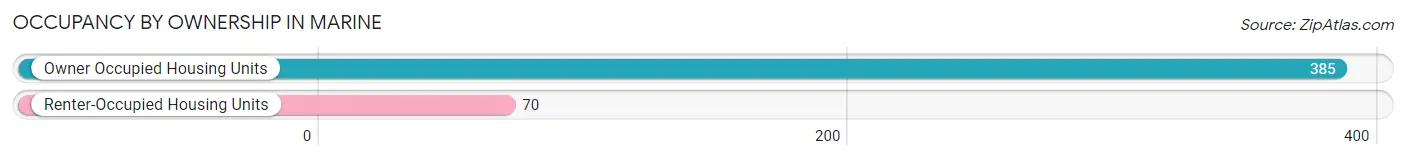
| Occupancy | # Housing Units | % Housing Units |
| Owner Occupied Housing Units | 385 | 84.6% |
| Renter-Occupied Housing Units | 70 | 15.4% |
| Total Occupied Housing Units | 455 | 100.0% |
Occupancy by Household Size in Marine
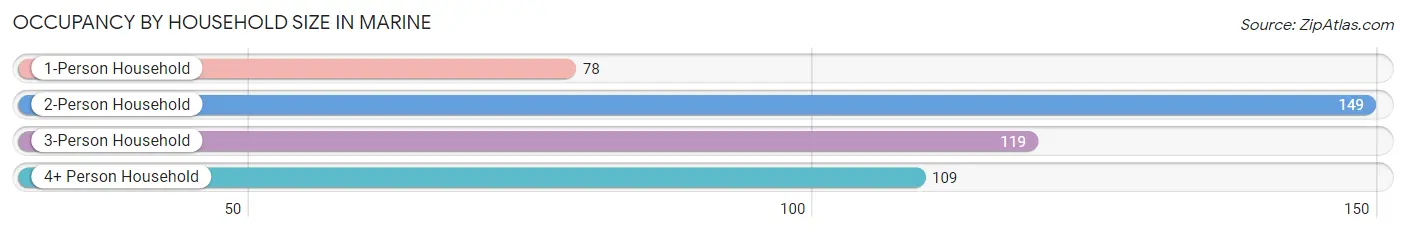
| Household Size | # Housing Units | % Housing Units |
| 1-Person Household | 78 | 17.1% |
| 2-Person Household | 149 | 32.8% |
| 3-Person Household | 119 | 26.2% |
| 4+ Person Household | 109 | 24.0% |
| Total Housing Units | 455 | 100.0% |
Occupancy by Ownership by Household Size in Marine
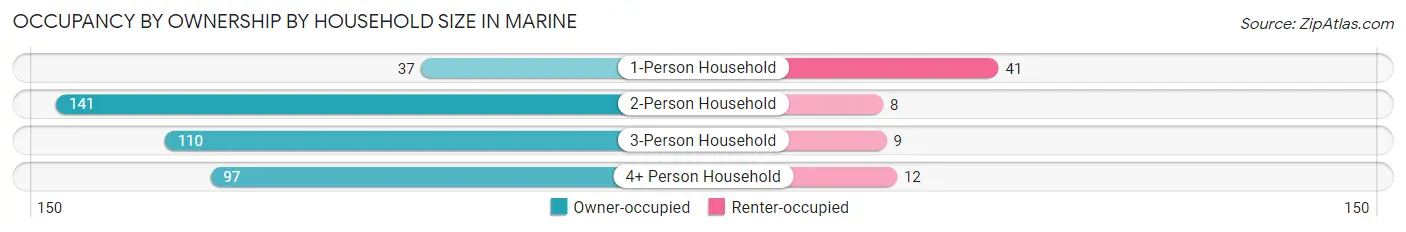
| Household Size | Owner-occupied | Renter-occupied |
| 1-Person Household | 37 (47.4%) | 41 (52.6%) |
| 2-Person Household | 141 (94.6%) | 8 (5.4%) |
| 3-Person Household | 110 (92.4%) | 9 (7.6%) |
| 4+ Person Household | 97 (89.0%) | 12 (11.0%) |
| Total Housing Units | 385 (84.6%) | 70 (15.4%) |
Occupancy by Educational Attainment in Marine
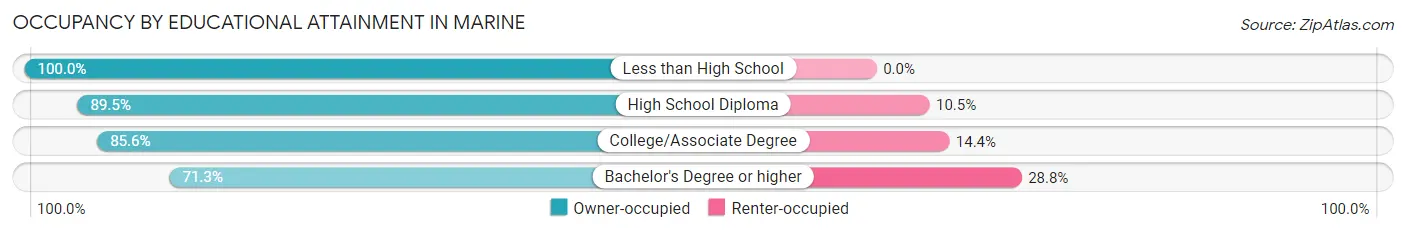
| Household Size | Owner-occupied | Renter-occupied |
| Less than High School | 10 (100.0%) | 0 (0.0%) |
| High School Diploma | 128 (89.5%) | 15 (10.5%) |
| College/Associate Degree | 190 (85.6%) | 32 (14.4%) |
| Bachelor's Degree or higher | 57 (71.3%) | 23 (28.7%) |
Occupancy by Age of Householder in Marine
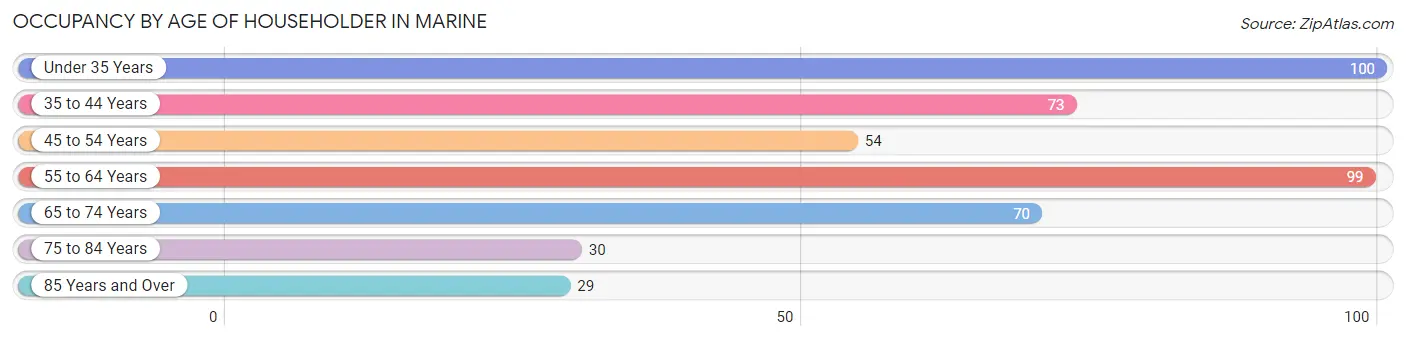
| Age Bracket | # Households | % Households |
| Under 35 Years | 100 | 22.0% |
| 35 to 44 Years | 73 | 16.0% |
| 45 to 54 Years | 54 | 11.9% |
| 55 to 64 Years | 99 | 21.8% |
| 65 to 74 Years | 70 | 15.4% |
| 75 to 84 Years | 30 | 6.6% |
| 85 Years and Over | 29 | 6.4% |
| Total | 455 | 100.0% |
Housing Finances in Marine
Median Income by Occupancy in Marine
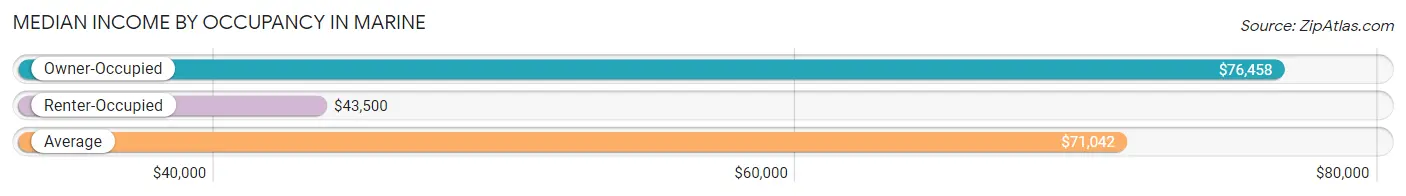
| Occupancy Type | # Households | Median Income |
| Owner-Occupied | 385 (84.6%) | $76,458 |
| Renter-Occupied | 70 (15.4%) | $43,500 |
| Average | 455 (100.0%) | $71,042 |
Occupancy by Householder Income Bracket in Marine
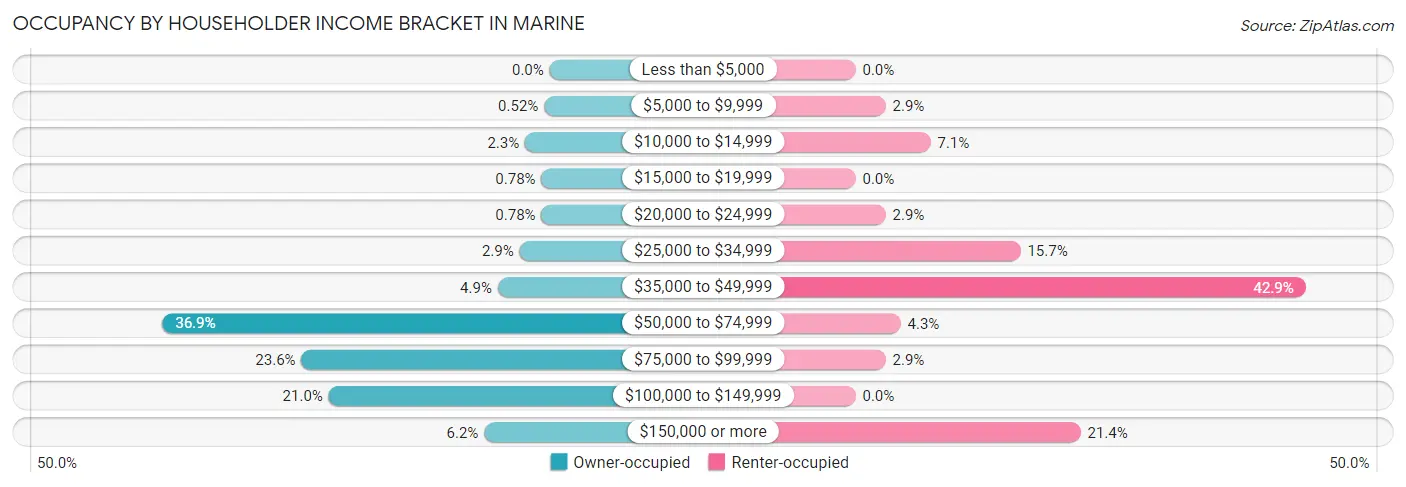
| Income Bracket | Owner-occupied | Renter-occupied |
| Less than $5,000 | 0 (0.0%) | 0 (0.0%) |
| $5,000 to $9,999 | 2 (0.5%) | 2 (2.9%) |
| $10,000 to $14,999 | 9 (2.3%) | 5 (7.1%) |
| $15,000 to $19,999 | 3 (0.8%) | 0 (0.0%) |
| $20,000 to $24,999 | 3 (0.8%) | 2 (2.9%) |
| $25,000 to $34,999 | 11 (2.9%) | 11 (15.7%) |
| $35,000 to $49,999 | 19 (4.9%) | 30 (42.9%) |
| $50,000 to $74,999 | 142 (36.9%) | 3 (4.3%) |
| $75,000 to $99,999 | 91 (23.6%) | 2 (2.9%) |
| $100,000 to $149,999 | 81 (21.0%) | 0 (0.0%) |
| $150,000 or more | 24 (6.2%) | 15 (21.4%) |
| Total | 385 (100.0%) | 70 (100.0%) |
Monthly Housing Cost Tiers in Marine
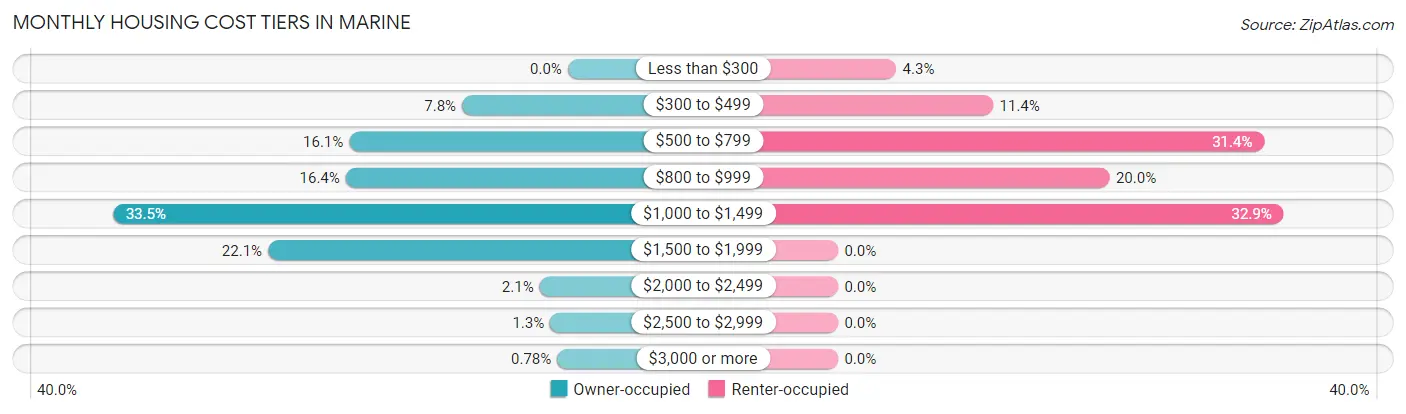
| Monthly Cost | Owner-occupied | Renter-occupied |
| Less than $300 | 0 (0.0%) | 3 (4.3%) |
| $300 to $499 | 30 (7.8%) | 8 (11.4%) |
| $500 to $799 | 62 (16.1%) | 22 (31.4%) |
| $800 to $999 | 63 (16.4%) | 14 (20.0%) |
| $1,000 to $1,499 | 129 (33.5%) | 23 (32.9%) |
| $1,500 to $1,999 | 85 (22.1%) | 0 (0.0%) |
| $2,000 to $2,499 | 8 (2.1%) | 0 (0.0%) |
| $2,500 to $2,999 | 5 (1.3%) | 0 (0.0%) |
| $3,000 or more | 3 (0.8%) | 0 (0.0%) |
| Total | 385 (100.0%) | 70 (100.0%) |
Physical Housing Characteristics in Marine
Housing Structures in Marine
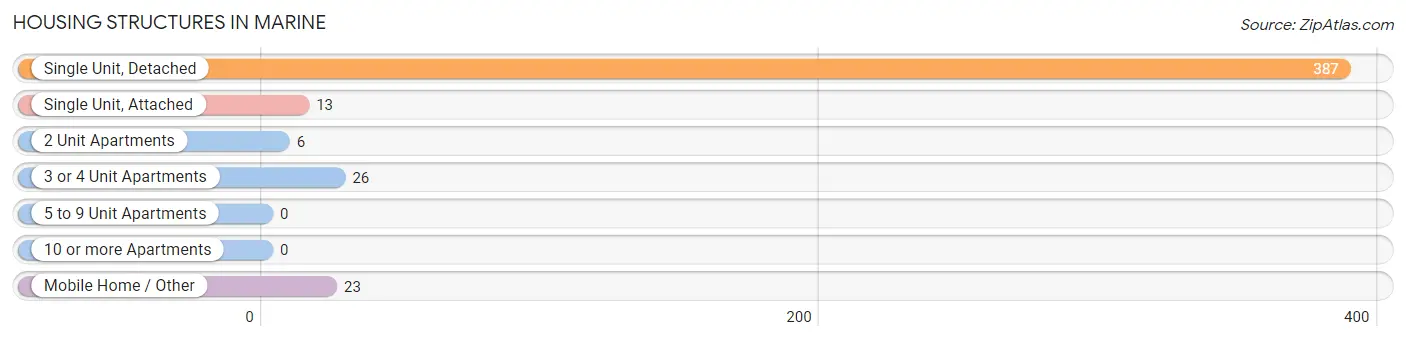
| Structure Type | # Housing Units | % Housing Units |
| Single Unit, Detached | 387 | 85.1% |
| Single Unit, Attached | 13 | 2.9% |
| 2 Unit Apartments | 6 | 1.3% |
| 3 or 4 Unit Apartments | 26 | 5.7% |
| 5 to 9 Unit Apartments | 0 | 0.0% |
| 10 or more Apartments | 0 | 0.0% |
| Mobile Home / Other | 23 | 5.1% |
| Total | 455 | 100.0% |
Housing Structures by Occupancy in Marine

| Structure Type | Owner-occupied | Renter-occupied |
| Single Unit, Detached | 359 (92.8%) | 28 (7.2%) |
| Single Unit, Attached | 8 (61.5%) | 5 (38.5%) |
| 2 Unit Apartments | 0 (0.0%) | 6 (100.0%) |
| 3 or 4 Unit Apartments | 0 (0.0%) | 26 (100.0%) |
| 5 to 9 Unit Apartments | 0 (0.0%) | 0 (0.0%) |
| 10 or more Apartments | 0 (0.0%) | 0 (0.0%) |
| Mobile Home / Other | 18 (78.3%) | 5 (21.7%) |
| Total | 385 (84.6%) | 70 (15.4%) |
Housing Structures by Number of Rooms in Marine
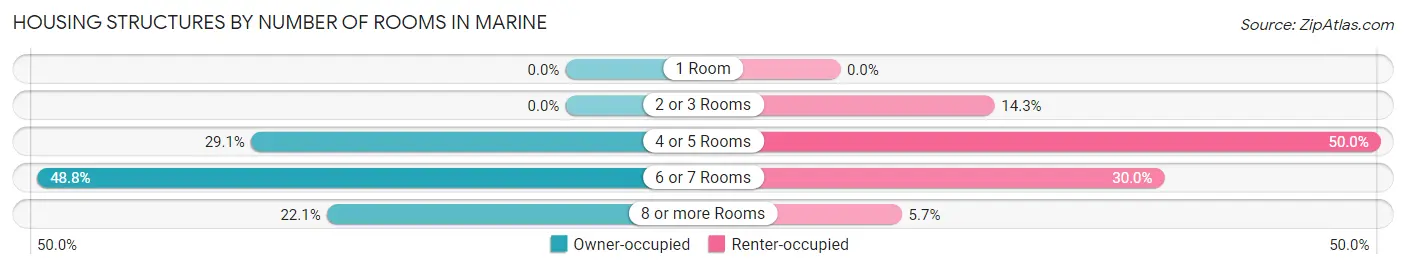
| Number of Rooms | Owner-occupied | Renter-occupied |
| 1 Room | 0 (0.0%) | 0 (0.0%) |
| 2 or 3 Rooms | 0 (0.0%) | 10 (14.3%) |
| 4 or 5 Rooms | 112 (29.1%) | 35 (50.0%) |
| 6 or 7 Rooms | 188 (48.8%) | 21 (30.0%) |
| 8 or more Rooms | 85 (22.1%) | 4 (5.7%) |
| Total | 385 (100.0%) | 70 (100.0%) |
Housing Structure by Heating Type in Marine
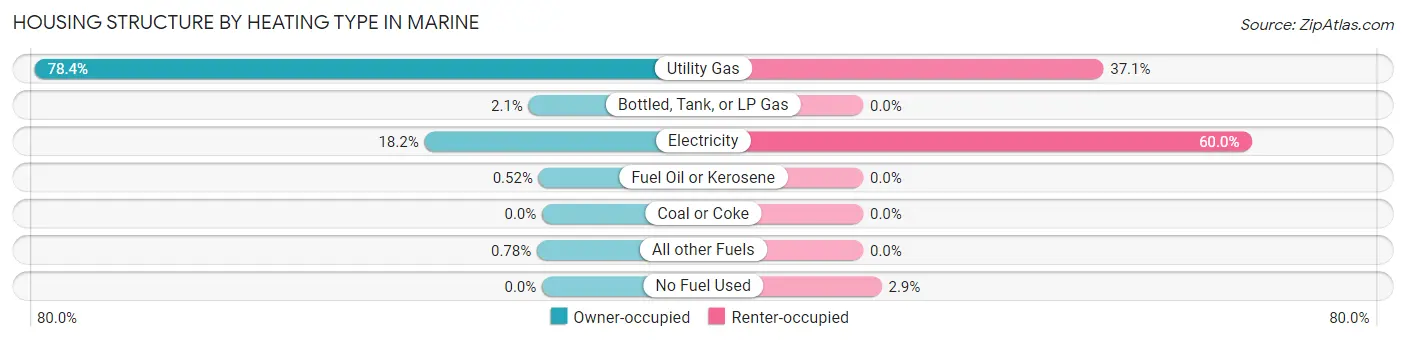
| Heating Type | Owner-occupied | Renter-occupied |
| Utility Gas | 302 (78.4%) | 26 (37.1%) |
| Bottled, Tank, or LP Gas | 8 (2.1%) | 0 (0.0%) |
| Electricity | 70 (18.2%) | 42 (60.0%) |
| Fuel Oil or Kerosene | 2 (0.5%) | 0 (0.0%) |
| Coal or Coke | 0 (0.0%) | 0 (0.0%) |
| All other Fuels | 3 (0.8%) | 0 (0.0%) |
| No Fuel Used | 0 (0.0%) | 2 (2.9%) |
| Total | 385 (100.0%) | 70 (100.0%) |
Household Vehicle Usage in Marine
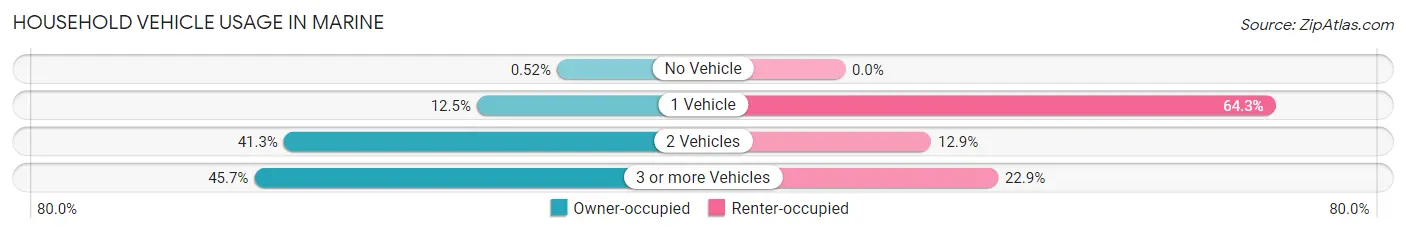
| Vehicles per Household | Owner-occupied | Renter-occupied |
| No Vehicle | 2 (0.5%) | 0 (0.0%) |
| 1 Vehicle | 48 (12.5%) | 45 (64.3%) |
| 2 Vehicles | 159 (41.3%) | 9 (12.9%) |
| 3 or more Vehicles | 176 (45.7%) | 16 (22.9%) |
| Total | 385 (100.0%) | 70 (100.0%) |
Real Estate & Mortgages in Marine
Real Estate and Mortgage Overview in Marine
| Characteristic | Without Mortgage | With Mortgage |
| Housing Units | 118 | 267 |
| Median Property Value | $164,300 | $147,400 |
| Median Household Income | $85,694 | $14 |
| Monthly Housing Costs | $659 | $3 |
| Real Estate Taxes | $3,150 | $0 |
Property Value by Mortgage Status in Marine
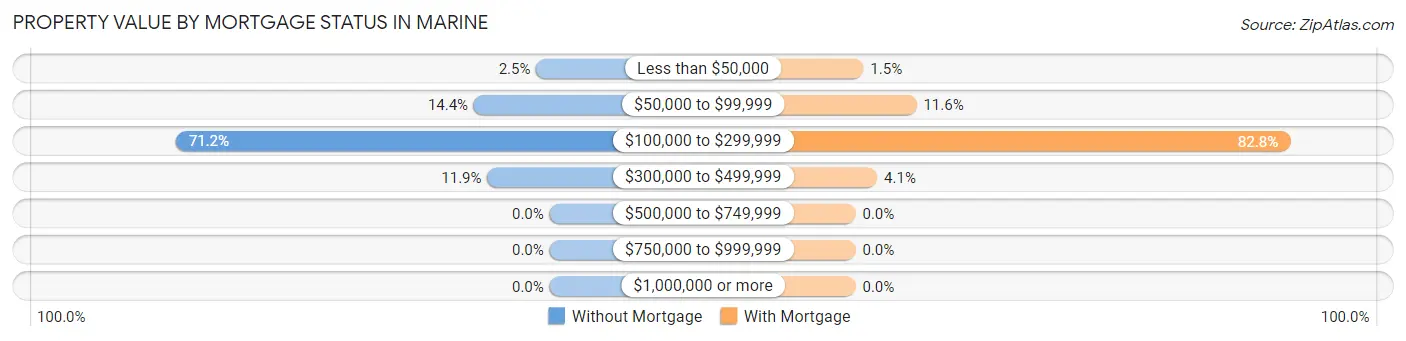
| Property Value | Without Mortgage | With Mortgage |
| Less than $50,000 | 3 (2.5%) | 4 (1.5%) |
| $50,000 to $99,999 | 17 (14.4%) | 31 (11.6%) |
| $100,000 to $299,999 | 84 (71.2%) | 221 (82.8%) |
| $300,000 to $499,999 | 14 (11.9%) | 11 (4.1%) |
| $500,000 to $749,999 | 0 (0.0%) | 0 (0.0%) |
| $750,000 to $999,999 | 0 (0.0%) | 0 (0.0%) |
| $1,000,000 or more | 0 (0.0%) | 0 (0.0%) |
| Total | 118 (100.0%) | 267 (100.0%) |
Household Income by Mortgage Status in Marine
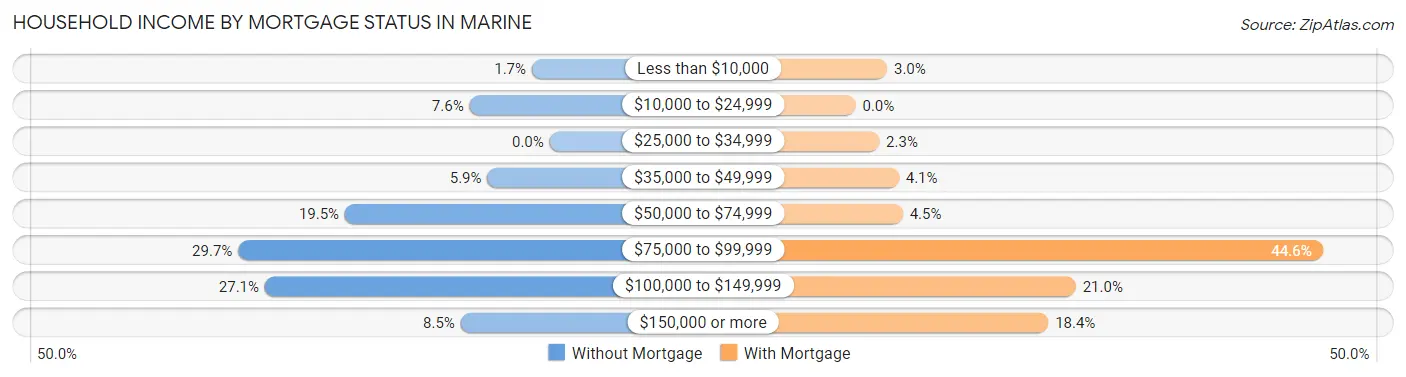
| Household Income | Without Mortgage | With Mortgage |
| Less than $10,000 | 2 (1.7%) | 8 (3.0%) |
| $10,000 to $24,999 | 9 (7.6%) | 0 (0.0%) |
| $25,000 to $34,999 | 0 (0.0%) | 6 (2.2%) |
| $35,000 to $49,999 | 7 (5.9%) | 11 (4.1%) |
| $50,000 to $74,999 | 23 (19.5%) | 12 (4.5%) |
| $75,000 to $99,999 | 35 (29.7%) | 119 (44.6%) |
| $100,000 to $149,999 | 32 (27.1%) | 56 (21.0%) |
| $150,000 or more | 10 (8.5%) | 49 (18.3%) |
| Total | 118 (100.0%) | 267 (100.0%) |
Property Value to Household Income Ratio in Marine
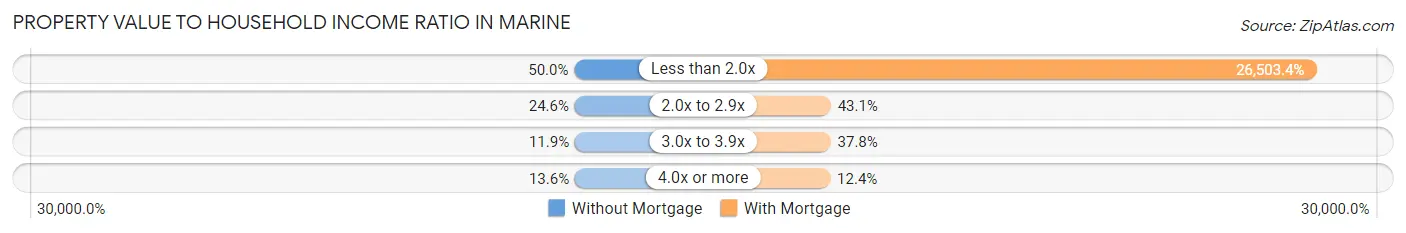
| Value-to-Income Ratio | Without Mortgage | With Mortgage |
| Less than 2.0x | 59 (50.0%) | 70,764 (26,503.4%) |
| 2.0x to 2.9x | 29 (24.6%) | 115 (43.1%) |
| 3.0x to 3.9x | 14 (11.9%) | 101 (37.8%) |
| 4.0x or more | 16 (13.6%) | 33 (12.4%) |
| Total | 118 (100.0%) | 267 (100.0%) |
Real Estate Taxes by Mortgage Status in Marine
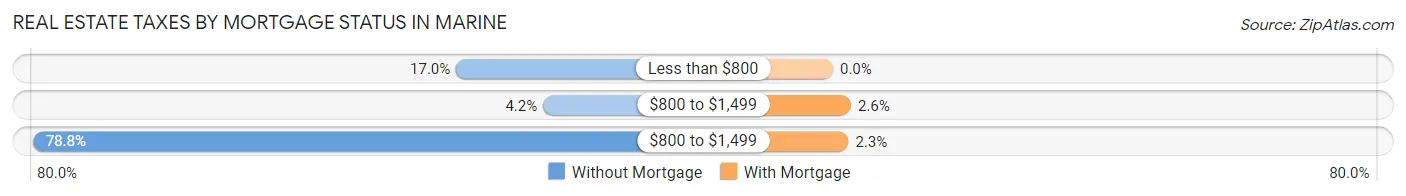
| Property Taxes | Without Mortgage | With Mortgage |
| Less than $800 | 20 (17.0%) | 0 (0.0%) |
| $800 to $1,499 | 5 (4.2%) | 7 (2.6%) |
| $800 to $1,499 | 93 (78.8%) | 6 (2.2%) |
| Total | 118 (100.0%) | 267 (100.0%) |
Health & Disability in Marine
Health Insurance Coverage by Age in Marine
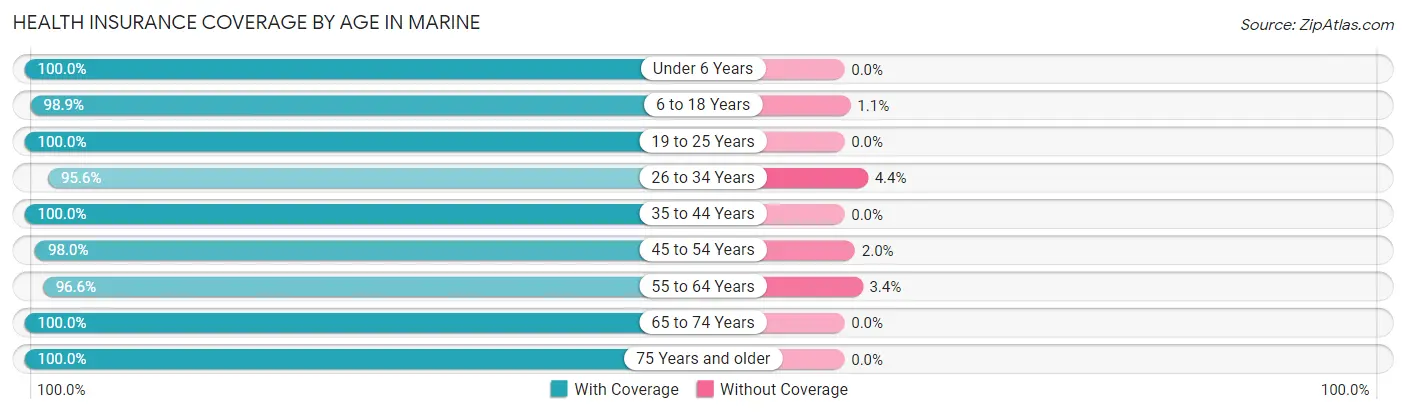
| Age Bracket | With Coverage | Without Coverage |
| Under 6 Years | 99 (100.0%) | 0 (0.0%) |
| 6 to 18 Years | 261 (98.9%) | 3 (1.1%) |
| 19 to 25 Years | 69 (100.0%) | 0 (0.0%) |
| 26 to 34 Years | 197 (95.6%) | 9 (4.4%) |
| 35 to 44 Years | 138 (100.0%) | 0 (0.0%) |
| 45 to 54 Years | 100 (98.0%) | 2 (2.0%) |
| 55 to 64 Years | 171 (96.6%) | 6 (3.4%) |
| 65 to 74 Years | 131 (100.0%) | 0 (0.0%) |
| 75 Years and older | 78 (100.0%) | 0 (0.0%) |
| Total | 1,244 (98.4%) | 20 (1.6%) |
Health Insurance Coverage by Citizenship Status in Marine
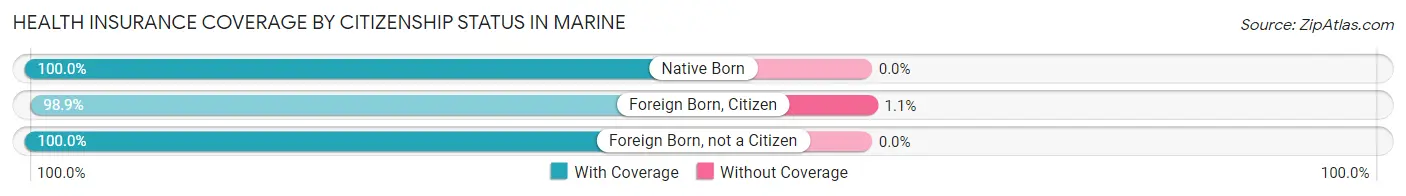
| Citizenship Status | With Coverage | Without Coverage |
| Native Born | 99 (100.0%) | 0 (0.0%) |
| Foreign Born, Citizen | 261 (98.9%) | 3 (1.1%) |
| Foreign Born, not a Citizen | 69 (100.0%) | 0 (0.0%) |
Health Insurance Coverage by Household Income in Marine
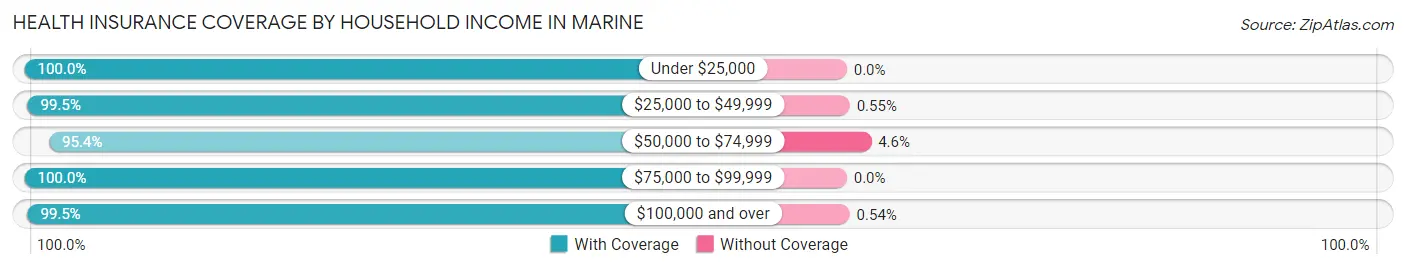
| Household Income | With Coverage | Without Coverage |
| Under $25,000 | 44 (100.0%) | 0 (0.0%) |
| $25,000 to $49,999 | 181 (99.5%) | 1 (0.5%) |
| $50,000 to $74,999 | 354 (95.4%) | 17 (4.6%) |
| $75,000 to $99,999 | 295 (100.0%) | 0 (0.0%) |
| $100,000 and over | 370 (99.5%) | 2 (0.5%) |
Public vs Private Health Insurance Coverage by Age in Marine
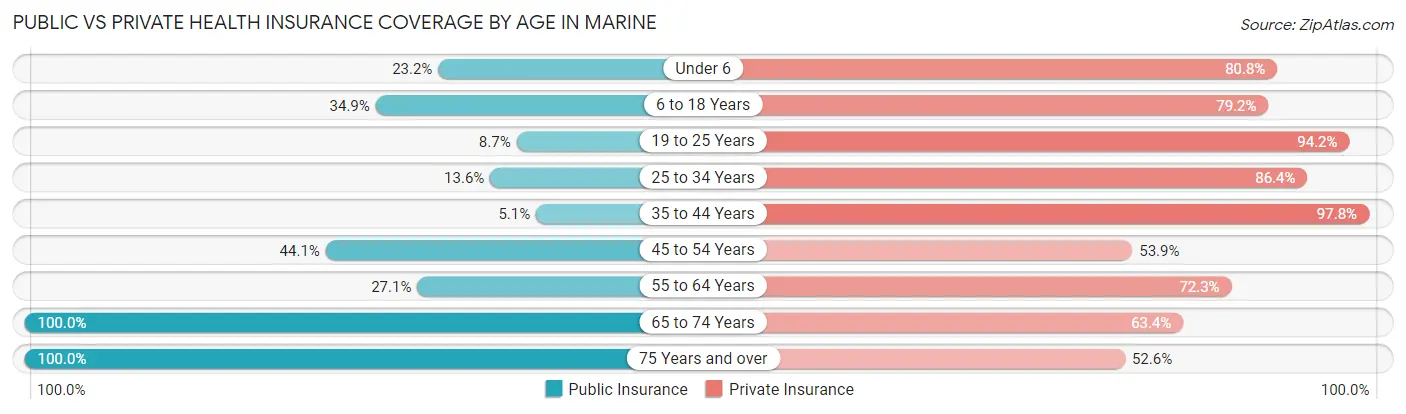
| Age Bracket | Public Insurance | Private Insurance |
| Under 6 | 23 (23.2%) | 80 (80.8%) |
| 6 to 18 Years | 92 (34.8%) | 209 (79.2%) |
| 19 to 25 Years | 6 (8.7%) | 65 (94.2%) |
| 25 to 34 Years | 28 (13.6%) | 178 (86.4%) |
| 35 to 44 Years | 7 (5.1%) | 135 (97.8%) |
| 45 to 54 Years | 45 (44.1%) | 55 (53.9%) |
| 55 to 64 Years | 48 (27.1%) | 128 (72.3%) |
| 65 to 74 Years | 131 (100.0%) | 83 (63.4%) |
| 75 Years and over | 78 (100.0%) | 41 (52.6%) |
| Total | 458 (36.2%) | 974 (77.1%) |
Disability Status by Sex by Age in Marine
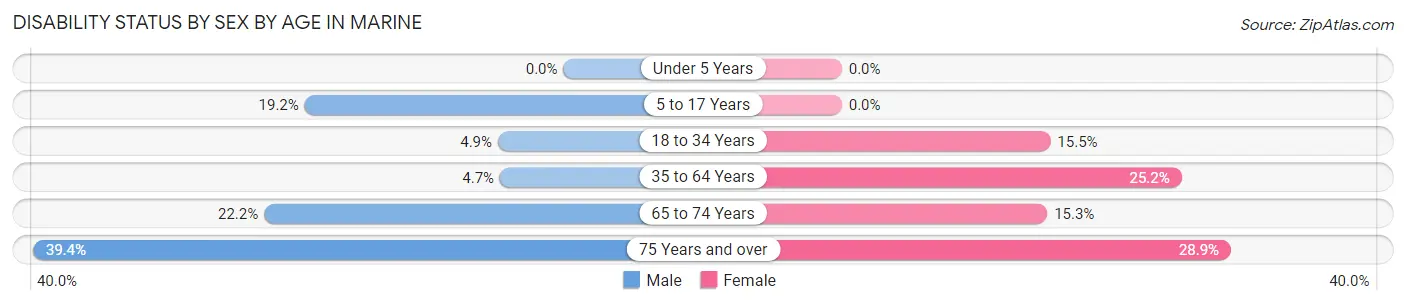
| Age Bracket | Male | Female |
| Under 5 Years | 0 (0.0%) | 0 (0.0%) |
| 5 to 17 Years | 29 (19.2%) | 0 (0.0%) |
| 18 to 34 Years | 7 (4.9%) | 22 (15.5%) |
| 35 to 64 Years | 9 (4.7%) | 57 (25.2%) |
| 65 to 74 Years | 16 (22.2%) | 9 (15.2%) |
| 75 Years and over | 13 (39.4%) | 13 (28.9%) |
Disability Class by Sex by Age in Marine
Disability Class: Hearing Difficulty
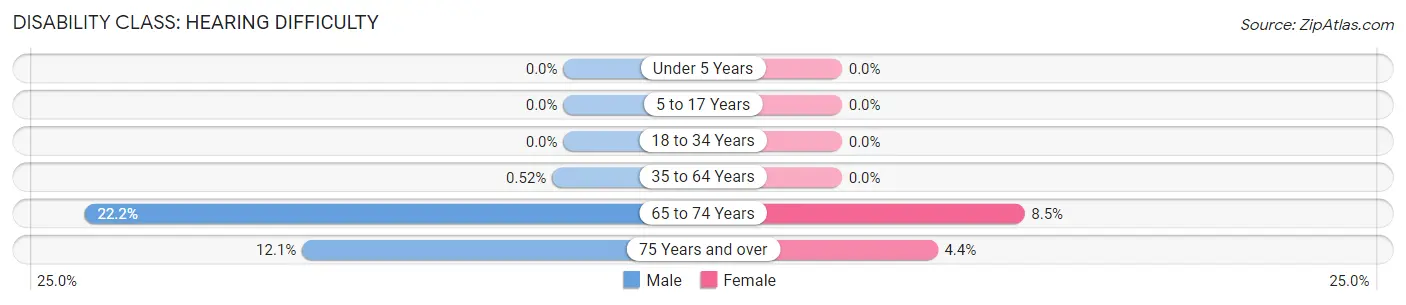
| Age Bracket | Male | Female |
| Under 5 Years | 0 (0.0%) | 0 (0.0%) |
| 5 to 17 Years | 0 (0.0%) | 0 (0.0%) |
| 18 to 34 Years | 0 (0.0%) | 0 (0.0%) |
| 35 to 64 Years | 1 (0.5%) | 0 (0.0%) |
| 65 to 74 Years | 16 (22.2%) | 5 (8.5%) |
| 75 Years and over | 4 (12.1%) | 2 (4.4%) |
Disability Class: Vision Difficulty
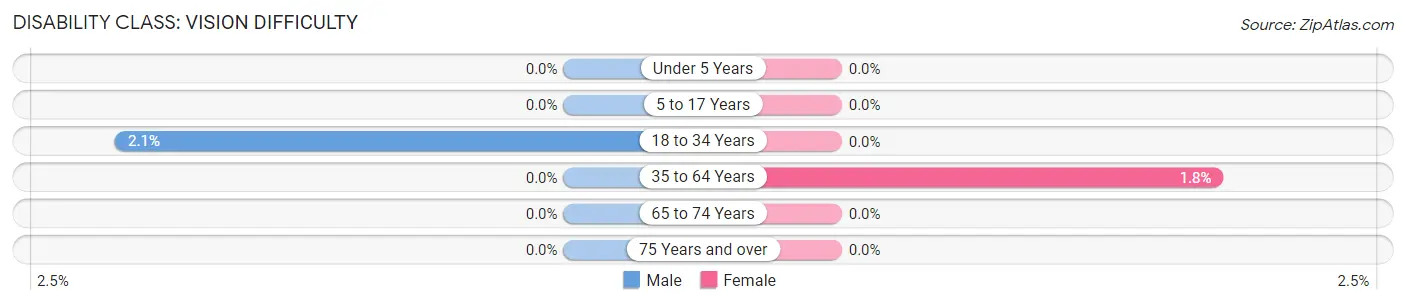
| Age Bracket | Male | Female |
| Under 5 Years | 0 (0.0%) | 0 (0.0%) |
| 5 to 17 Years | 0 (0.0%) | 0 (0.0%) |
| 18 to 34 Years | 3 (2.1%) | 0 (0.0%) |
| 35 to 64 Years | 0 (0.0%) | 4 (1.8%) |
| 65 to 74 Years | 0 (0.0%) | 0 (0.0%) |
| 75 Years and over | 0 (0.0%) | 0 (0.0%) |
Disability Class: Cognitive Difficulty
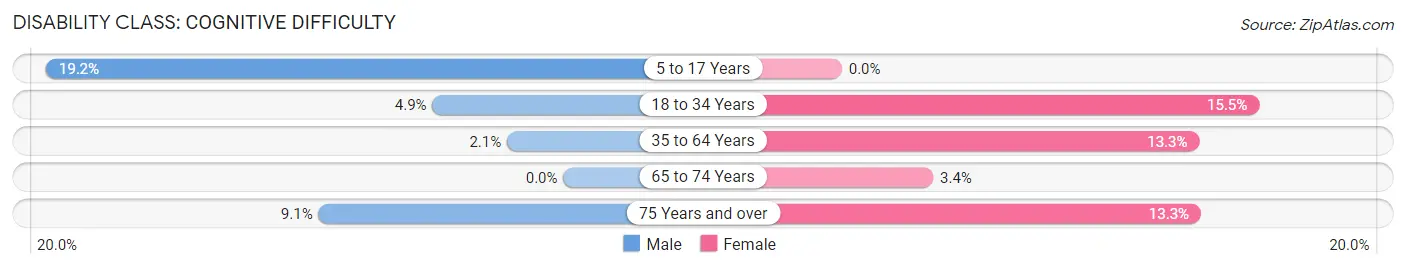
| Age Bracket | Male | Female |
| 5 to 17 Years | 29 (19.2%) | 0 (0.0%) |
| 18 to 34 Years | 7 (4.9%) | 22 (15.5%) |
| 35 to 64 Years | 4 (2.1%) | 30 (13.3%) |
| 65 to 74 Years | 0 (0.0%) | 2 (3.4%) |
| 75 Years and over | 3 (9.1%) | 6 (13.3%) |
Disability Class: Ambulatory Difficulty
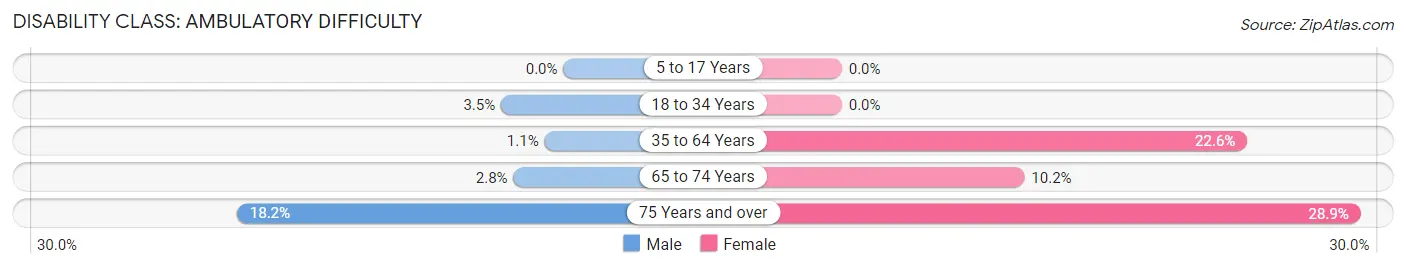
| Age Bracket | Male | Female |
| 5 to 17 Years | 0 (0.0%) | 0 (0.0%) |
| 18 to 34 Years | 5 (3.5%) | 0 (0.0%) |
| 35 to 64 Years | 2 (1.1%) | 51 (22.6%) |
| 65 to 74 Years | 2 (2.8%) | 6 (10.2%) |
| 75 Years and over | 6 (18.2%) | 13 (28.9%) |
Disability Class: Self-Care Difficulty
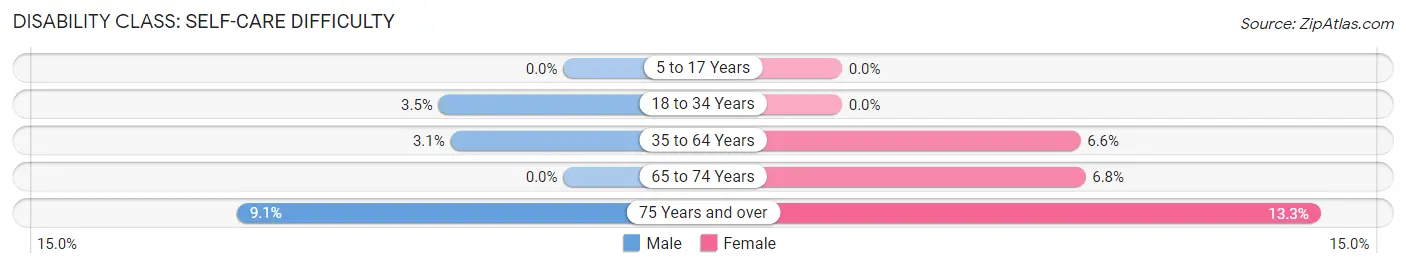
| Age Bracket | Male | Female |
| 5 to 17 Years | 0 (0.0%) | 0 (0.0%) |
| 18 to 34 Years | 5 (3.5%) | 0 (0.0%) |
| 35 to 64 Years | 6 (3.1%) | 15 (6.6%) |
| 65 to 74 Years | 0 (0.0%) | 4 (6.8%) |
| 75 Years and over | 3 (9.1%) | 6 (13.3%) |
Technology Access in Marine
Computing Device Access in Marine
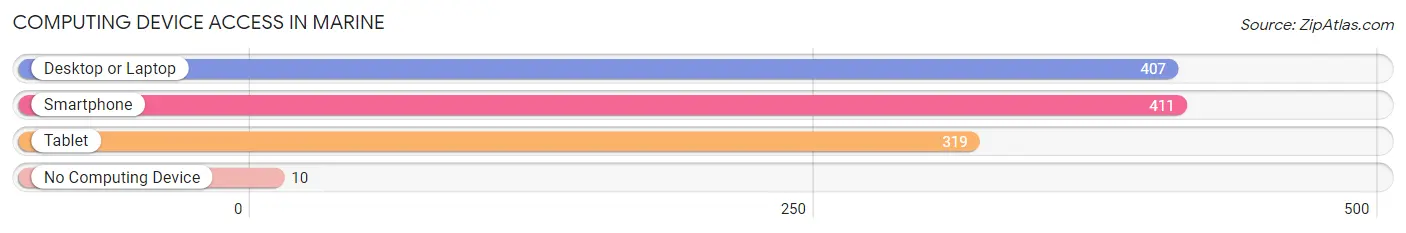
| Device Type | # Households | % Households |
| Desktop or Laptop | 407 | 89.4% |
| Smartphone | 411 | 90.3% |
| Tablet | 319 | 70.1% |
| No Computing Device | 10 | 2.2% |
| Total | 455 | 100.0% |
Internet Access in Marine
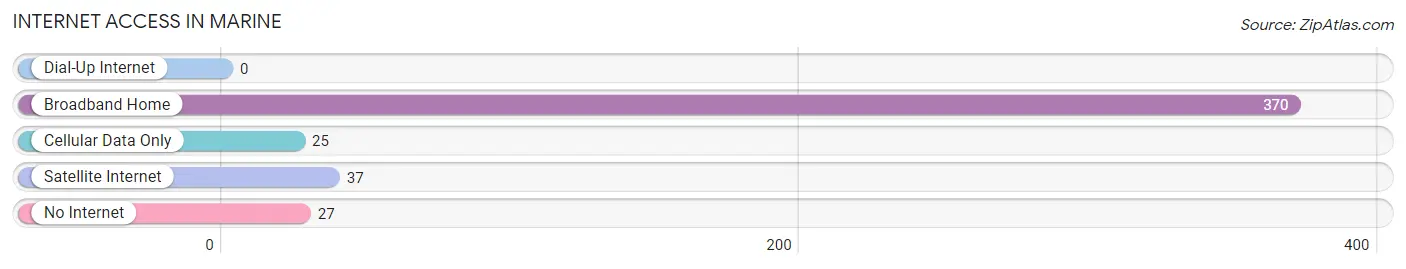
| Internet Type | # Households | % Households |
| Dial-Up Internet | 0 | 0.0% |
| Broadband Home | 370 | 81.3% |
| Cellular Data Only | 25 | 5.5% |
| Satellite Internet | 37 | 8.1% |
| No Internet | 27 | 5.9% |
| Total | 455 | 100.0% |
Marine Summary
Marine, Illinois is a small village located in Madison County, Illinois. It is situated on the banks of the Mississippi River, approximately 20 miles northeast of St. Louis, Missouri. The village has a population of 1,845 people, according to the 2010 census.
History
Marine was founded in 1819 by a group of settlers from Kentucky. The village was named after the nearby Marine Creek, which was named after a French explorer who had explored the area in the late 1700s. The village was incorporated in 1867.
In the late 1800s, Marine was a thriving river port town. It was a major stop for steamboats traveling up and down the Mississippi River. The village was also home to a number of businesses, including a sawmill, a grist mill, a blacksmith shop, and a general store.
In the early 1900s, the village began to decline as the steamboat industry declined. The Great Depression also had a major impact on the village, as many businesses closed and people moved away in search of work.
Geography
Marine is located in Madison County, Illinois, on the banks of the Mississippi River. The village is situated on the western edge of the American Bottom, a large floodplain that stretches from St. Louis to the confluence of the Mississippi and Missouri Rivers.
The village is located in a rural area, with the nearest major city being St. Louis, Missouri, which is approximately 20 miles to the southwest. The village is also located near the towns of Alton, Edwardsville, and Granite City.
Economy
Marine’s economy is largely based on agriculture and tourism. The village is home to a number of farms, which produce a variety of crops, including corn, soybeans, and wheat. The village is also home to a number of tourist attractions, including the Marine Creek Wildlife Refuge, the Marine Creek Nature Center, and the Marine Creek Marina.
The village is also home to a number of small businesses, including restaurants, retail stores, and service providers. The village is also home to a number of manufacturing companies, including a plastics manufacturer and a metal fabrication company.
Demographics
According to the 2010 census, the population of Marine was 1,845 people. The village is predominantly white, with 94.3% of the population identifying as white. The village is also home to a small Hispanic population, with 4.2% of the population identifying as Hispanic or Latino.
The median household income in Marine is $50,938, which is slightly lower than the national median of $53,482. The median home value in the village is $117,400, which is slightly higher than the national median of $184,700. The village has a poverty rate of 11.2%, which is slightly higher than the national average of 10.5%.
Common Questions
What is Per Capita Income in Marine?
Per Capita income in Marine is $30,344.
What is the Median Family Income in Marine?
Median Family Income in Marine is $80,167.
What is the Median Household income in Marine?
Median Household Income in Marine is $71,042.
What is Income or Wage Gap in Marine?
Income or Wage Gap in Marine is 51.5%.
Women in Marine earn 48.5 cents for every dollar earned by a man.
What is Inequality or Gini Index in Marine?
Inequality or Gini Index in Marine is 0.32.
What is the Total Population of Marine?
Total Population of Marine is 1,264.
What is the Total Male Population of Marine?
Total Male Population of Marine is 637.
What is the Total Female Population of Marine?
Total Female Population of Marine is 627.
What is the Ratio of Males per 100 Females in Marine?
There are 101.59 Males per 100 Females in Marine.
What is the Ratio of Females per 100 Males in Marine?
There are 98.43 Females per 100 Males in Marine.
What is the Median Population Age in Marine?
Median Population Age in Marine is 34.7 Years.
What is the Average Family Size in Marine
Average Family Size in Marine is 3.2 People.
What is the Average Household Size in Marine
Average Household Size in Marine is 2.8 People.
How Large is the Labor Force in Marine?
There are 596 People in the Labor Forcein in Marine.
What is the Percentage of People in the Labor Force in Marine?
61.4% of People are in the Labor Force in Marine.