Sesser, IL Map & Demographics
Sesser Map
Sesser Overview
$25,028
PER CAPITA INCOME
$61,250
AVG FAMILY INCOME
$49,681
AVG HOUSEHOLD INCOME
21.8%
WAGE / INCOME GAP [ % ]
78.2¢/ $1
WAGE / INCOME GAP [ $ ]
0.43
INEQUALITY / GINI INDEX
1,909
TOTAL POPULATION
937
MALE POPULATION
972
FEMALE POPULATION
96.40
MALES / 100 FEMALES
103.74
FEMALES / 100 MALES
38.6
MEDIAN AGE
3.1
AVG FAMILY SIZE
2.6
AVG HOUSEHOLD SIZE
852
LABOR FORCE [ PEOPLE ]
56.3%
PERCENT IN LABOR FORCE
9.5%
UNEMPLOYMENT RATE
Sesser Zip Codes
Sesser Area Codes
Income in Sesser
Income Overview in Sesser
Per Capita Income in Sesser is $25,028, while median incomes of families and households are $61,250 and $49,681 respectively.
| Characteristic | Number | Measure |
| Per Capita Income | 1,909 | $25,028 |
| Median Family Income | 524 | $61,250 |
| Mean Family Income | 524 | $71,679 |
| Median Household Income | 722 | $49,681 |
| Mean Household Income | 722 | $66,905 |
| Income Deficit | 524 | $0 |
| Wage / Income Gap (%) | 1,909 | 21.76% |
| Wage / Income Gap ($) | 1,909 | 78.24¢ per $1 |
| Gini / Inequality Index | 1,909 | 0.43 |
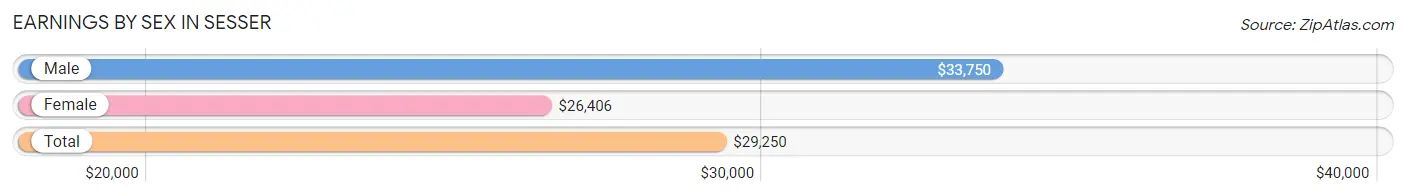
Earnings by Sex in Sesser
Average Earnings in Sesser are $29,250, $33,750 for men and $26,406 for women, a difference of 21.8%.
| Sex | Number | Average Earnings |
| Male | 429 (48.3%) | $33,750 |
| Female | 459 (51.7%) | $26,406 |
| Total | 888 (100.0%) | $29,250 |
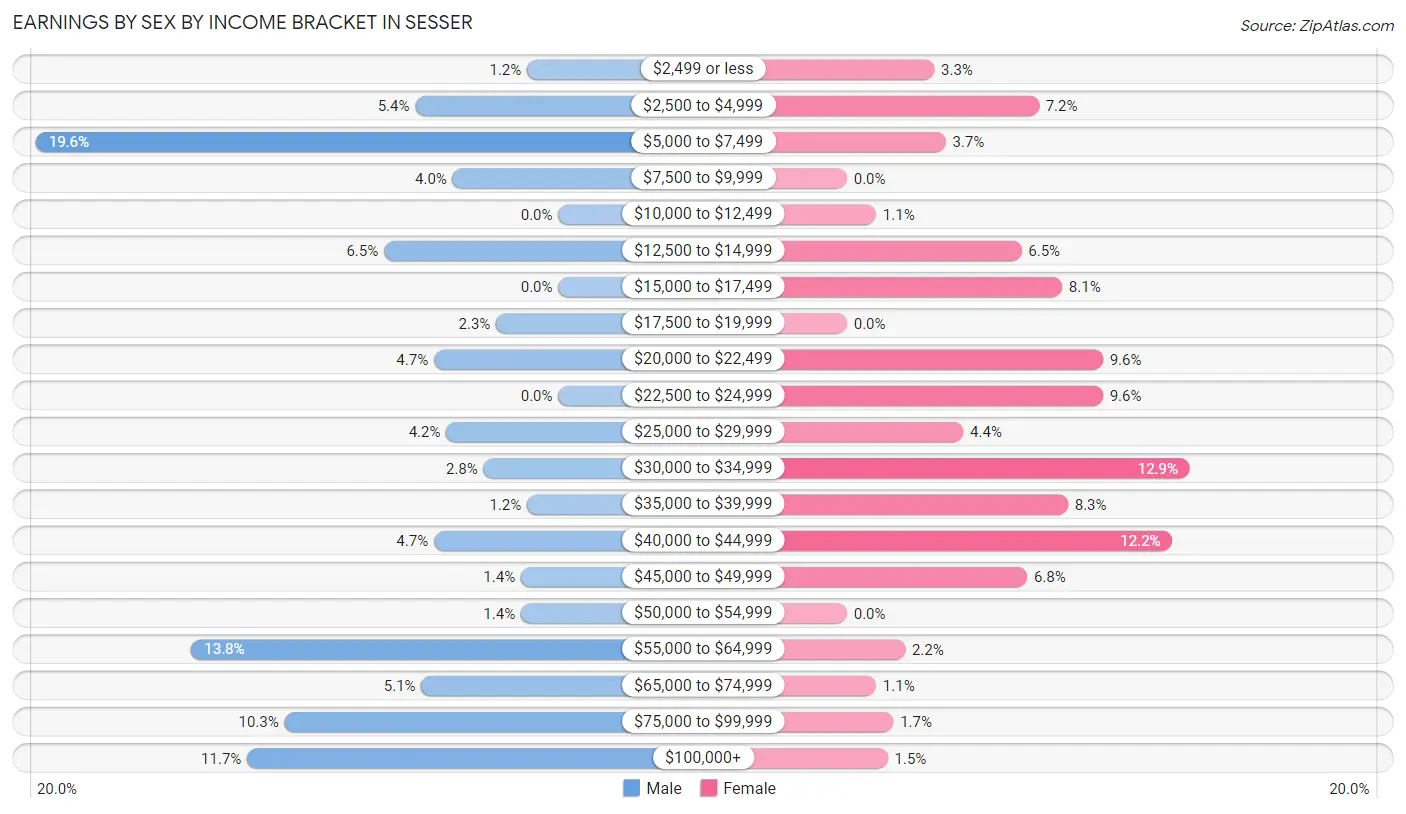
Earnings by Sex by Income Bracket in Sesser
The most common earnings brackets in Sesser are $5,000 to $7,499 for men (84 | 19.6%) and $30,000 to $34,999 for women (59 | 12.9%).
| Income | Male | Female |
| $2,499 or less | 5 (1.2%) | 15 (3.3%) |
| $2,500 to $4,999 | 23 (5.4%) | 33 (7.2%) |
| $5,000 to $7,499 | 84 (19.6%) | 17 (3.7%) |
| $7,500 to $9,999 | 17 (4.0%) | 0 (0.0%) |
| $10,000 to $12,499 | 0 (0.0%) | 5 (1.1%) |
| $12,500 to $14,999 | 28 (6.5%) | 30 (6.5%) |
| $15,000 to $17,499 | 0 (0.0%) | 37 (8.1%) |
| $17,500 to $19,999 | 10 (2.3%) | 0 (0.0%) |
| $20,000 to $22,499 | 20 (4.7%) | 44 (9.6%) |
| $22,500 to $24,999 | 0 (0.0%) | 44 (9.6%) |
| $25,000 to $29,999 | 18 (4.2%) | 20 (4.4%) |
| $30,000 to $34,999 | 12 (2.8%) | 59 (12.9%) |
| $35,000 to $39,999 | 5 (1.2%) | 38 (8.3%) |
| $40,000 to $44,999 | 20 (4.7%) | 56 (12.2%) |
| $45,000 to $49,999 | 6 (1.4%) | 31 (6.8%) |
| $50,000 to $54,999 | 6 (1.4%) | 0 (0.0%) |
| $55,000 to $64,999 | 59 (13.8%) | 10 (2.2%) |
| $65,000 to $74,999 | 22 (5.1%) | 5 (1.1%) |
| $75,000 to $99,999 | 44 (10.3%) | 8 (1.7%) |
| $100,000+ | 50 (11.7%) | 7 (1.5%) |
| Total | 429 (100.0%) | 459 (100.0%) |
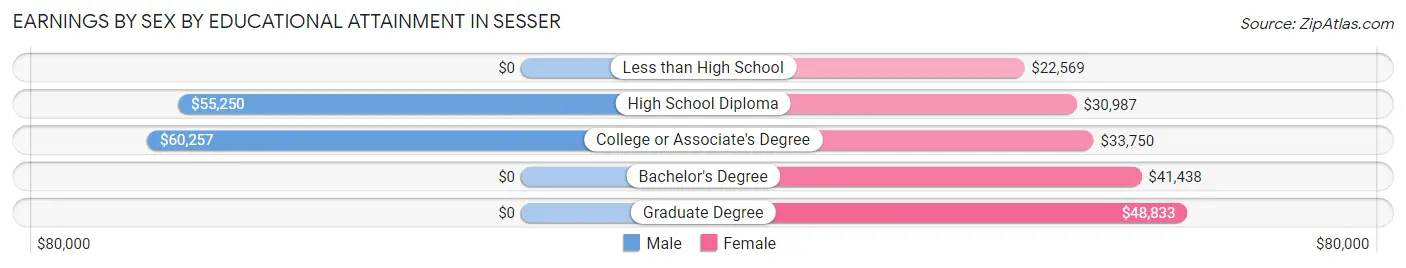
Earnings by Sex by Educational Attainment in Sesser
Average earnings in Sesser are $55,500 for men and $33,000 for women, a difference of 40.5%. Men with an educational attainment of college or associate's degree enjoy the highest average annual earnings of $60,257, while those with high school diploma education earn the least with $55,250. Women with an educational attainment of graduate degree earn the most with the average annual earnings of $48,833, while those with less than high school education have the smallest earnings of $22,569.
| Educational Attainment | Male Income | Female Income |
| Less than High School | - | - |
| High School Diploma | $55,250 | $30,987 |
| College or Associate's Degree | $60,257 | $33,750 |
| Bachelor's Degree | - | - |
| Graduate Degree | - | - |
| Total | $55,500 | $33,000 |
Family Income in Sesser
Family Income Brackets in Sesser
According to the Sesser family income data, there are 99 families falling into the $50,000 to $74,999 income range, which is the most common income bracket and makes up 18.9% of all families. Conversely, the $10,000 to $14,999 income bracket is the least frequent group with only 5 families (0.9%) belonging to this category.
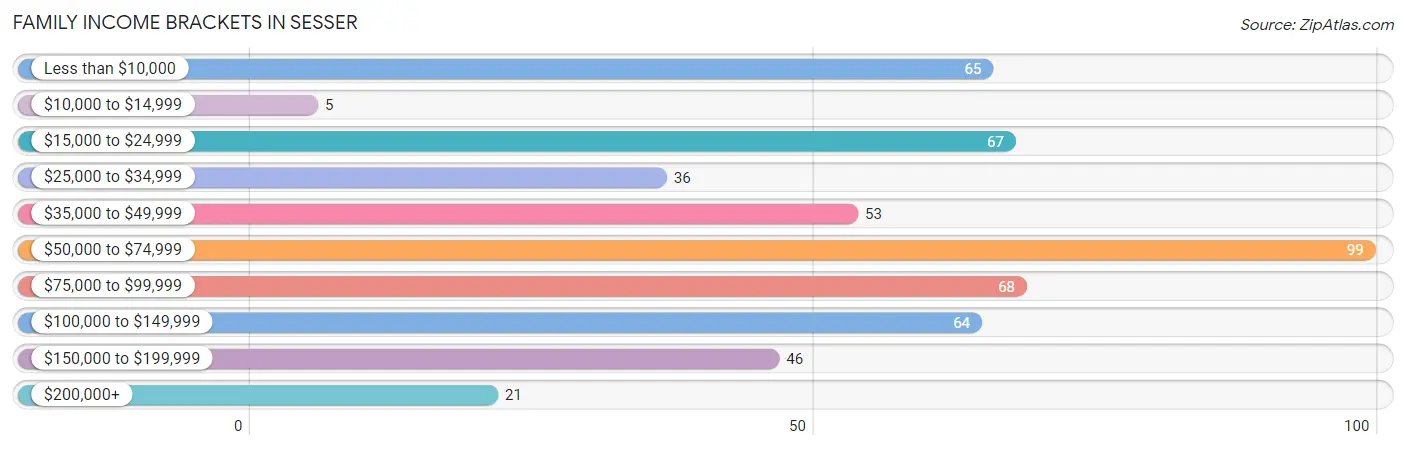
| Income Bracket | # Families | % Families |
| Less than $10,000 | 65 | 12.4% |
| $10,000 to $14,999 | 5 | 1.0% |
| $15,000 to $24,999 | 67 | 12.8% |
| $25,000 to $34,999 | 36 | 6.9% |
| $35,000 to $49,999 | 53 | 10.1% |
| $50,000 to $74,999 | 99 | 18.9% |
| $75,000 to $99,999 | 68 | 13.0% |
| $100,000 to $149,999 | 64 | 12.2% |
| $150,000 to $199,999 | 46 | 8.8% |
| $200,000+ | 21 | 4.0% |
Family Income by Famaliy Size in Sesser
4-person families (100 | 19.1%) account for the highest median family income in Sesser with $95,500 per family, while 4-person families (100 | 19.1%) have the highest median income of $23,875 per family member.
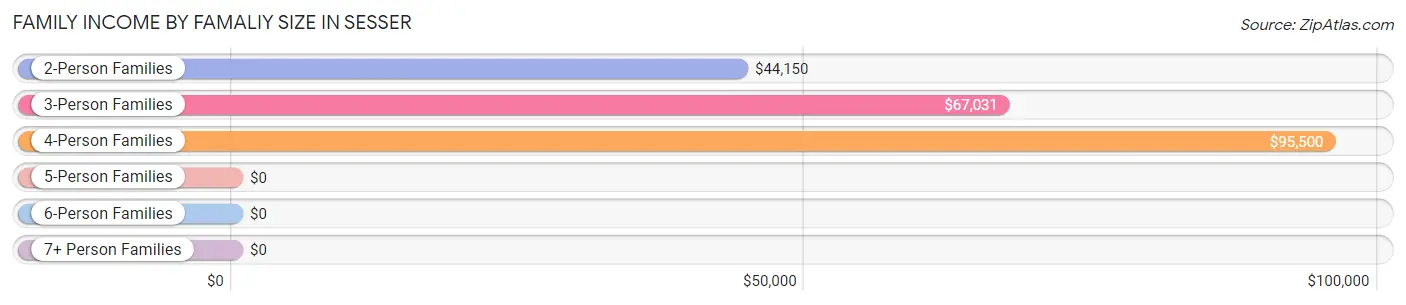
| Income Bracket | # Families | Median Income |
| 2-Person Families | 251 (47.9%) | $44,150 |
| 3-Person Families | 105 (20.0%) | $67,031 |
| 4-Person Families | 100 (19.1%) | $95,500 |
| 5-Person Families | 43 (8.2%) | $0 |
| 6-Person Families | 25 (4.8%) | $0 |
| 7+ Person Families | 0 (0.0%) | $0 |
| Total | 524 (100.0%) | $61,250 |
Family Income by Number of Earners in Sesser
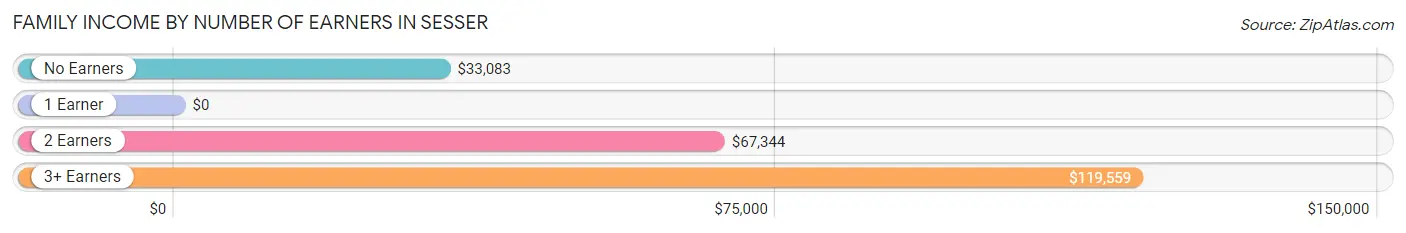
| Number of Earners | # Families | Median Income |
| No Earners | 151 (28.8%) | $33,083 |
| 1 Earner | 114 (21.8%) | $0 |
| 2 Earners | 163 (31.1%) | $67,344 |
| 3+ Earners | 96 (18.3%) | $119,559 |
| Total | 524 (100.0%) | $61,250 |
Household Income in Sesser
Household Income Brackets in Sesser
With 122 households falling in the category, the $75,000 to $99,999 income range is the most frequent in Sesser, accounting for 16.9% of all households. In contrast, only 21 households (2.9%) fall into the $200,000+ income bracket, making it the least populous group.
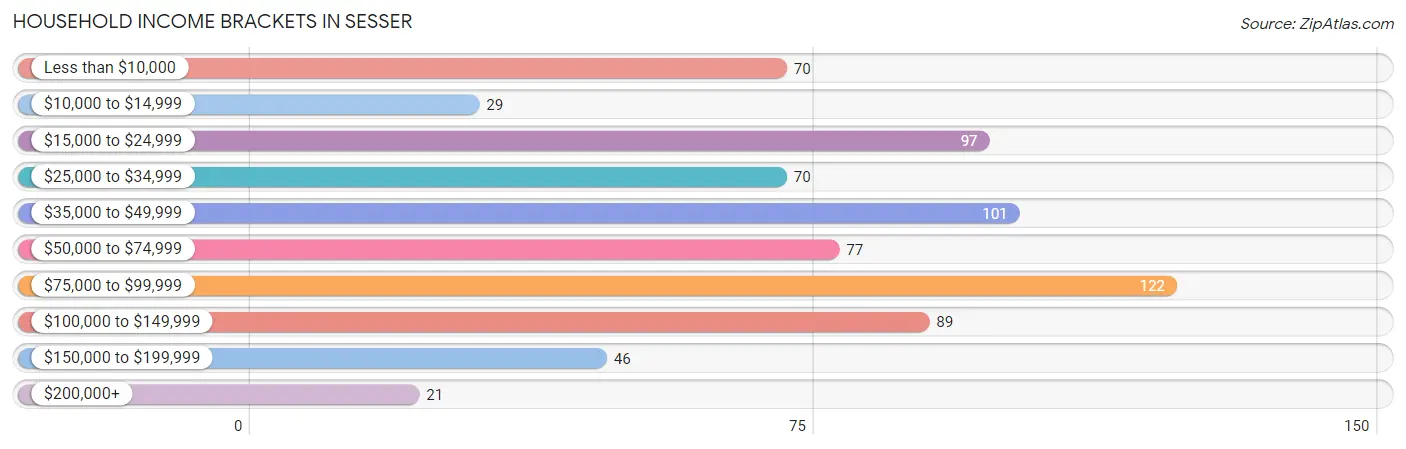
| Income Bracket | # Households | % Households |
| Less than $10,000 | 70 | 9.7% |
| $10,000 to $14,999 | 29 | 4.0% |
| $15,000 to $24,999 | 97 | 13.4% |
| $25,000 to $34,999 | 70 | 9.7% |
| $35,000 to $49,999 | 101 | 14.0% |
| $50,000 to $74,999 | 77 | 10.7% |
| $75,000 to $99,999 | 122 | 16.9% |
| $100,000 to $149,999 | 89 | 12.3% |
| $150,000 to $199,999 | 46 | 6.4% |
| $200,000+ | 21 | 2.9% |
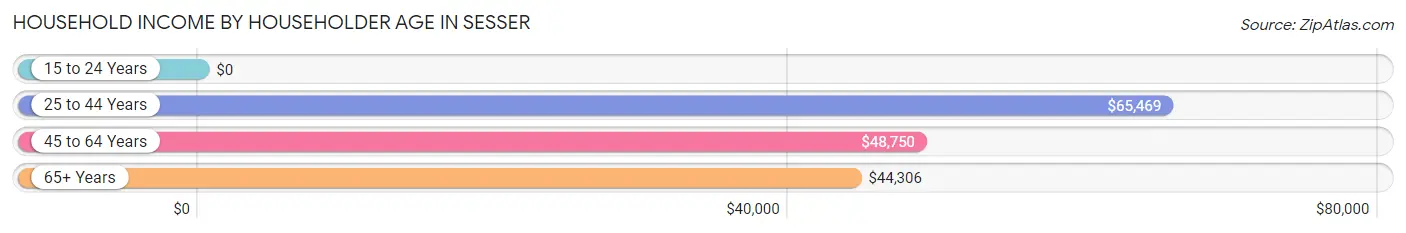
Household Income by Householder Age in Sesser
The median household income in Sesser is $49,681, with the highest median household income of $65,469 found in the 25 to 44 years age bracket for the primary householder. A total of 227 households (31.4%) fall into this category. Meanwhile, the 15 to 24 years age bracket for the primary householder has the lowest median household income of $0, with 6 households (0.8%) in this group.
| Income Bracket | # Households | Median Income |
| 15 to 24 Years | 6 (0.8%) | $0 |
| 25 to 44 Years | 227 (31.4%) | $65,469 |
| 45 to 64 Years | 257 (35.6%) | $48,750 |
| 65+ Years | 232 (32.1%) | $44,306 |
| Total | 722 (100.0%) | $49,681 |
Poverty in Sesser
Income Below Poverty by Sex and Age in Sesser
With 16.7% poverty level for males and 20.5% for females among the residents of Sesser, 12 to 14 year old males and 5 year old females are the most vulnerable to poverty, with 29 males (60.4%) and 32 females (100.0%) in their respective age groups living below the poverty level.
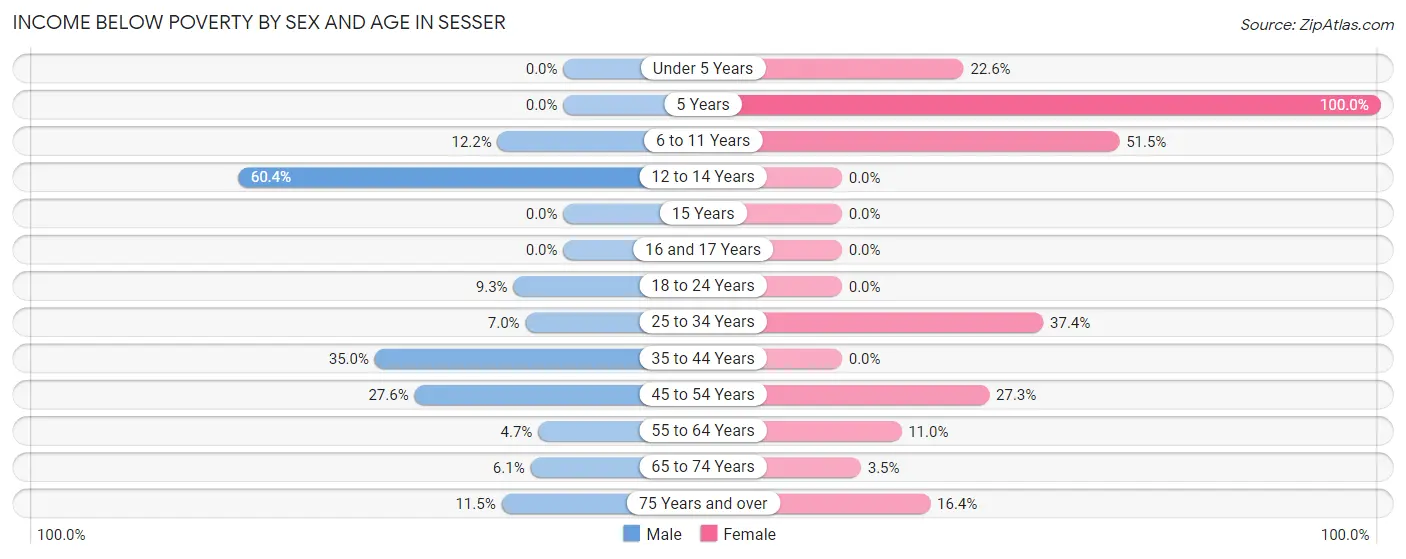
| Age Bracket | Male | Female |
| Under 5 Years | 0 (0.0%) | 14 (22.6%) |
| 5 Years | 0 (0.0%) | 32 (100.0%) |
| 6 to 11 Years | 11 (12.2%) | 52 (51.5%) |
| 12 to 14 Years | 29 (60.4%) | 0 (0.0%) |
| 15 Years | 0 (0.0%) | 0 (0.0%) |
| 16 and 17 Years | 0 (0.0%) | 0 (0.0%) |
| 18 to 24 Years | 10 (9.3%) | 0 (0.0%) |
| 25 to 34 Years | 5 (7.0%) | 37 (37.4%) |
| 35 to 44 Years | 42 (35.0%) | 0 (0.0%) |
| 45 to 54 Years | 42 (27.6%) | 35 (27.3%) |
| 55 to 64 Years | 5 (4.7%) | 16 (11.0%) |
| 65 to 74 Years | 5 (6.1%) | 3 (3.5%) |
| 75 Years and over | 7 (11.5%) | 10 (16.4%) |
| Total | 156 (16.7%) | 199 (20.5%) |
Income Above Poverty by Sex and Age in Sesser
According to the poverty statistics in Sesser, males aged under 5 years and females aged 12 to 14 years are the age groups that are most secure financially, with 100.0% of males and 100.0% of females in these age groups living above the poverty line.
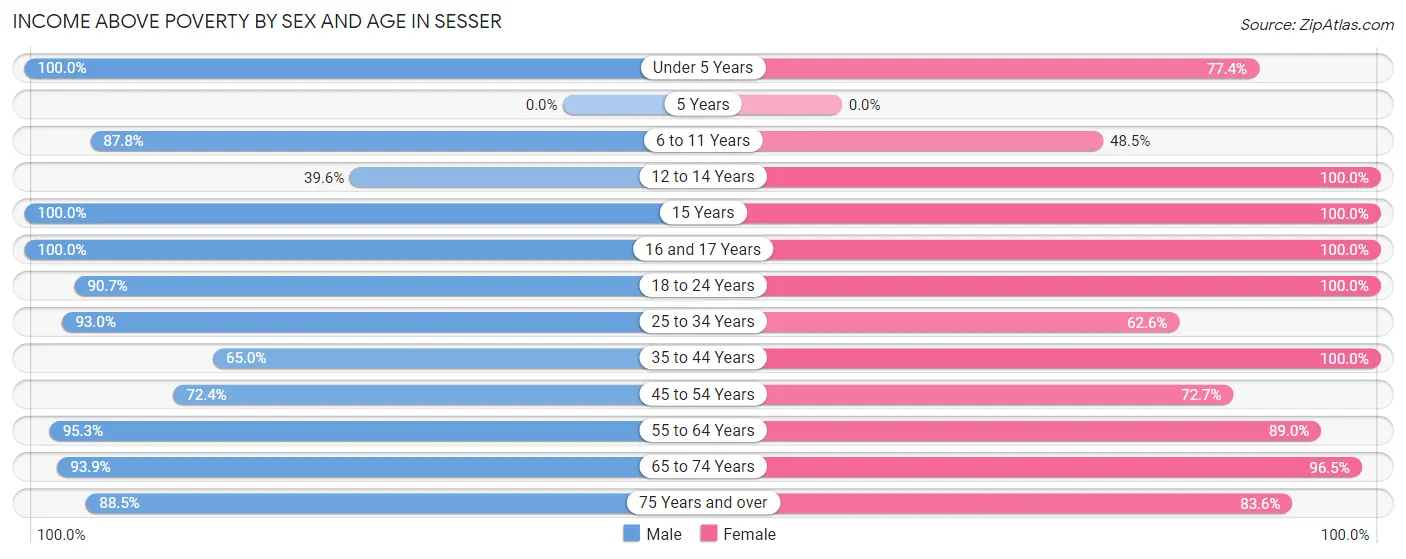
| Age Bracket | Male | Female |
| Under 5 Years | 28 (100.0%) | 48 (77.4%) |
| 5 Years | 0 (0.0%) | 0 (0.0%) |
| 6 to 11 Years | 79 (87.8%) | 49 (48.5%) |
| 12 to 14 Years | 19 (39.6%) | 11 (100.0%) |
| 15 Years | 18 (100.0%) | 6 (100.0%) |
| 16 and 17 Years | 52 (100.0%) | 3 (100.0%) |
| 18 to 24 Years | 98 (90.7%) | 102 (100.0%) |
| 25 to 34 Years | 66 (93.0%) | 62 (62.6%) |
| 35 to 44 Years | 78 (65.0%) | 137 (100.0%) |
| 45 to 54 Years | 110 (72.4%) | 93 (72.7%) |
| 55 to 64 Years | 102 (95.3%) | 129 (89.0%) |
| 65 to 74 Years | 77 (93.9%) | 82 (96.5%) |
| 75 Years and over | 54 (88.5%) | 51 (83.6%) |
| Total | 781 (83.4%) | 773 (79.5%) |
Income Below Poverty Among Married-Couple Families in Sesser
The poverty statistics for married-couple families in Sesser show that 17.9% or 69 of the total 385 families live below the poverty line. Families with 3 or 4 children have the highest poverty rate of 64.6%, comprising of 31 families. On the other hand, families with no children have the lowest poverty rate of 2.7%, which includes 5 families.
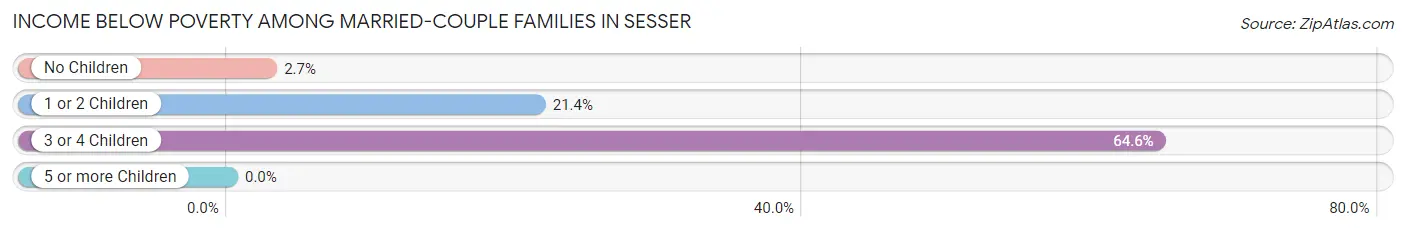
| Children | Above Poverty | Below Poverty |
| No Children | 178 (97.3%) | 5 (2.7%) |
| 1 or 2 Children | 121 (78.6%) | 33 (21.4%) |
| 3 or 4 Children | 17 (35.4%) | 31 (64.6%) |
| 5 or more Children | 0 (0.0%) | 0 (0.0%) |
| Total | 316 (82.1%) | 69 (17.9%) |
Income Below Poverty Among Single-Parent Households in Sesser
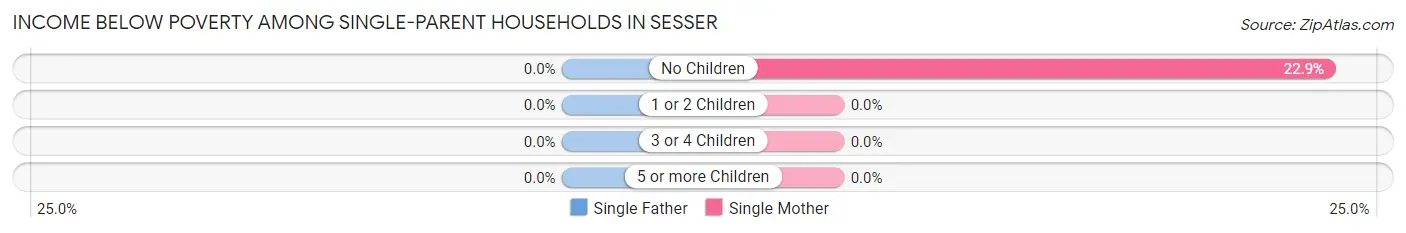
| Children | Single Father | Single Mother |
| No Children | 0 (0.0%) | 11 (22.9%) |
| 1 or 2 Children | 0 (0.0%) | 0 (0.0%) |
| 3 or 4 Children | 0 (0.0%) | 0 (0.0%) |
| 5 or more Children | 0 (0.0%) | 0 (0.0%) |
| Total | 0 (0.0%) | 11 (12.4%) |
Income Below Poverty Among Married-Couple vs Single-Parent Households in Sesser
The poverty data for Sesser shows that 69 of the married-couple family households (17.9%) and 11 of the single-parent households (7.9%) are living below the poverty level. Within the married-couple family households, those with 3 or 4 children have the highest poverty rate, with 31 households (64.6%) falling below the poverty line. Among the single-parent households, those with no children have the highest poverty rate, with 11 household (12.1%) living below poverty.
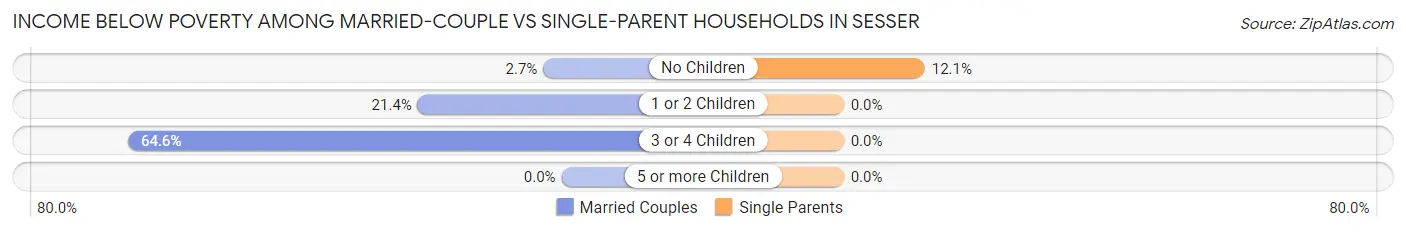
| Children | Married-Couple Families | Single-Parent Households |
| No Children | 5 (2.7%) | 11 (12.1%) |
| 1 or 2 Children | 33 (21.4%) | 0 (0.0%) |
| 3 or 4 Children | 31 (64.6%) | 0 (0.0%) |
| 5 or more Children | 0 (0.0%) | 0 (0.0%) |
| Total | 69 (17.9%) | 11 (7.9%) |
Race in Sesser
The most populous races in Sesser are White / Caucasian (1,782 | 93.3%), Asian (85 | 4.4%), and Hispanic or Latino (70 | 3.7%).
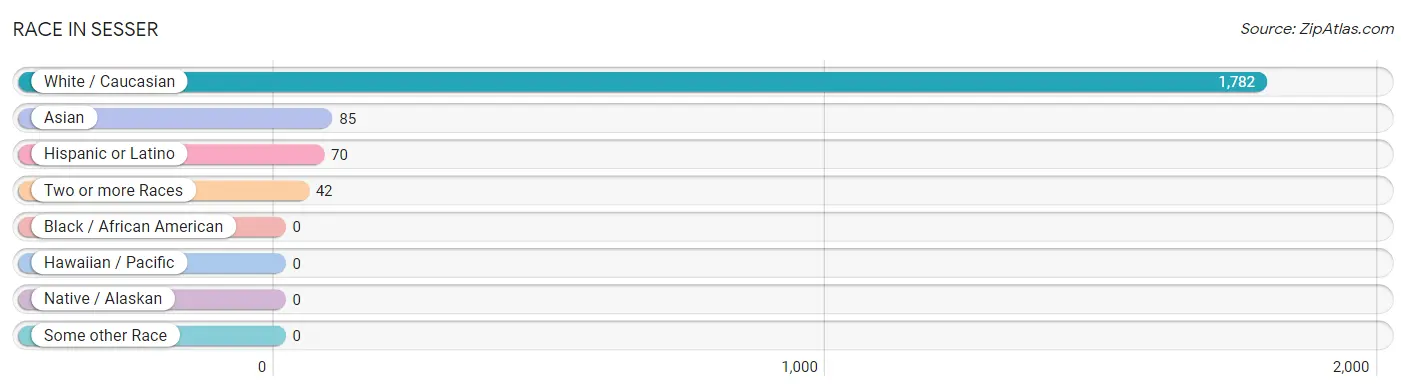
| Race | # Population | % Population |
| Asian | 85 | 4.4% |
| Black / African American | 0 | 0.0% |
| Hawaiian / Pacific | 0 | 0.0% |
| Hispanic or Latino | 70 | 3.7% |
| Native / Alaskan | 0 | 0.0% |
| White / Caucasian | 1,782 | 93.3% |
| Two or more Races | 42 | 2.2% |
| Some other Race | 0 | 0.0% |
| Total | 1,909 | 100.0% |
Ancestry in Sesser
The most populous ancestries reported in Sesser are English (293 | 15.3%), German (284 | 14.9%), Irish (252 | 13.2%), Korean (114 | 6.0%), and Italian (78 | 4.1%), together accounting for 53.5% of all Sesser residents.
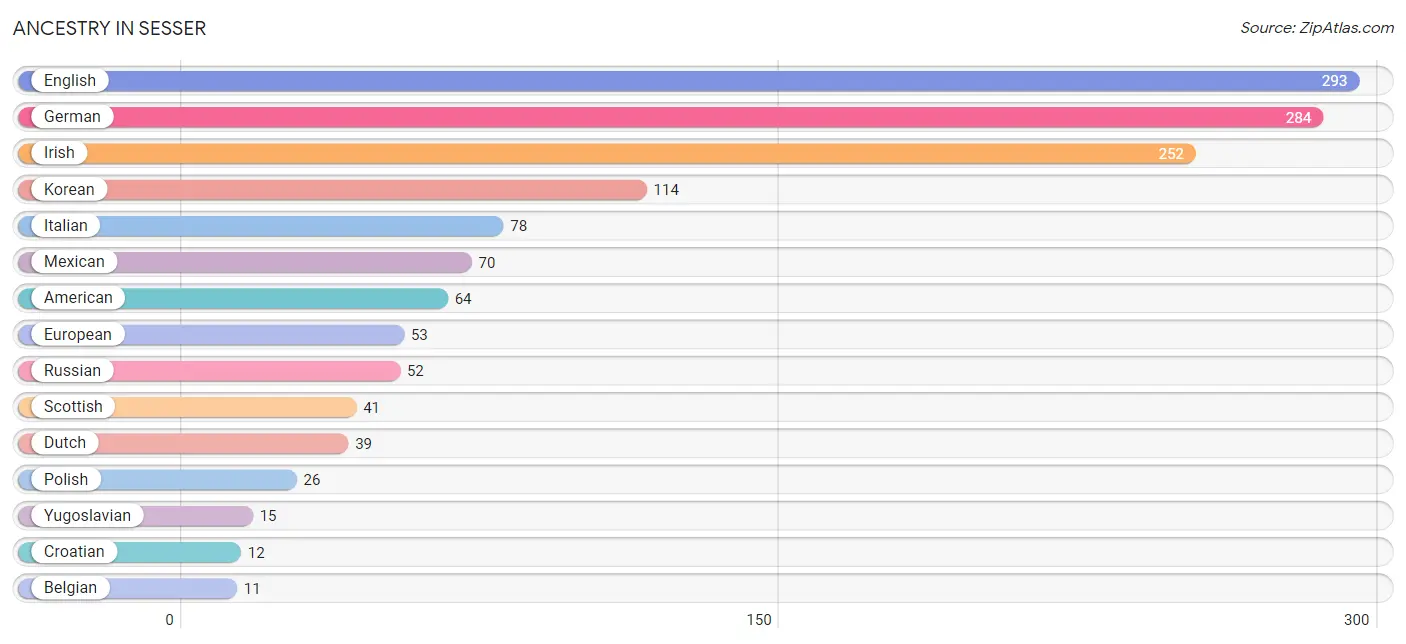
| Ancestry | # Population | % Population |
| American | 64 | 3.4% |
| Belgian | 11 | 0.6% |
| British | 7 | 0.4% |
| Cherokee | 2 | 0.1% |
| Croatian | 12 | 0.6% |
| Dutch | 39 | 2.0% |
| English | 293 | 15.3% |
| European | 53 | 2.8% |
| French | 10 | 0.5% |
| German | 284 | 14.9% |
| Irish | 252 | 13.2% |
| Italian | 78 | 4.1% |
| Korean | 114 | 6.0% |
| Latvian | 8 | 0.4% |
| Mexican | 70 | 3.7% |
| Polish | 26 | 1.4% |
| Russian | 52 | 2.7% |
| Scandinavian | 4 | 0.2% |
| Scottish | 41 | 2.1% |
| Swedish | 5 | 0.3% |
| Yugoslavian | 15 | 0.8% | View All 21 Rows |
Immigrants in Sesser
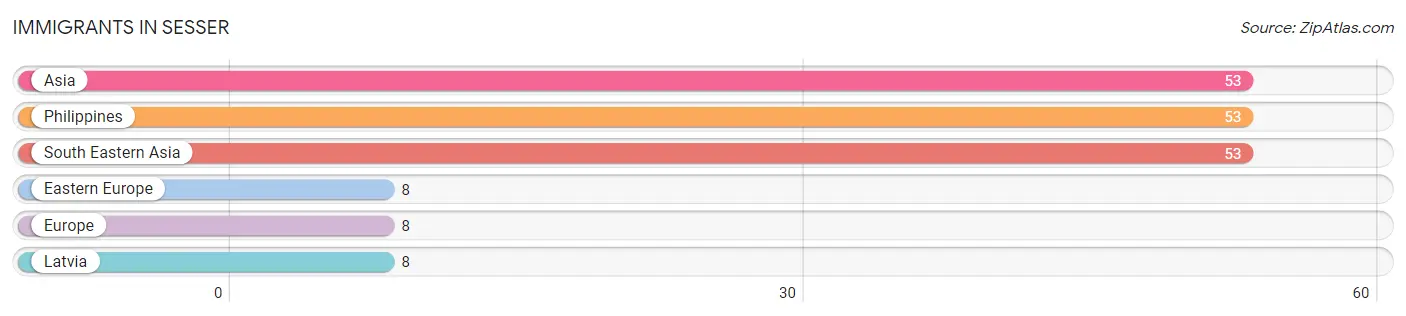
The most numerous immigrant groups reported in Sesser came from Asia (53 | 2.8%), Philippines (53 | 2.8%), South Eastern Asia (53 | 2.8%), Eastern Europe (8 | 0.4%), and Europe (8 | 0.4%), together accounting for 9.2% of all Sesser residents.
| Immigration Origin | # Population | % Population |
| Asia | 53 | 2.8% |
| Eastern Europe | 8 | 0.4% |
| Europe | 8 | 0.4% |
| Latvia | 8 | 0.4% |
| Philippines | 53 | 2.8% |
| South Eastern Asia | 53 | 2.8% | View All 6 Rows |
Sex and Age in Sesser
Sex and Age in Sesser
The most populous age groups in Sesser are 45 to 49 Years (109 | 11.6%) for men and 5 to 9 Years (103 | 10.6%) for women.
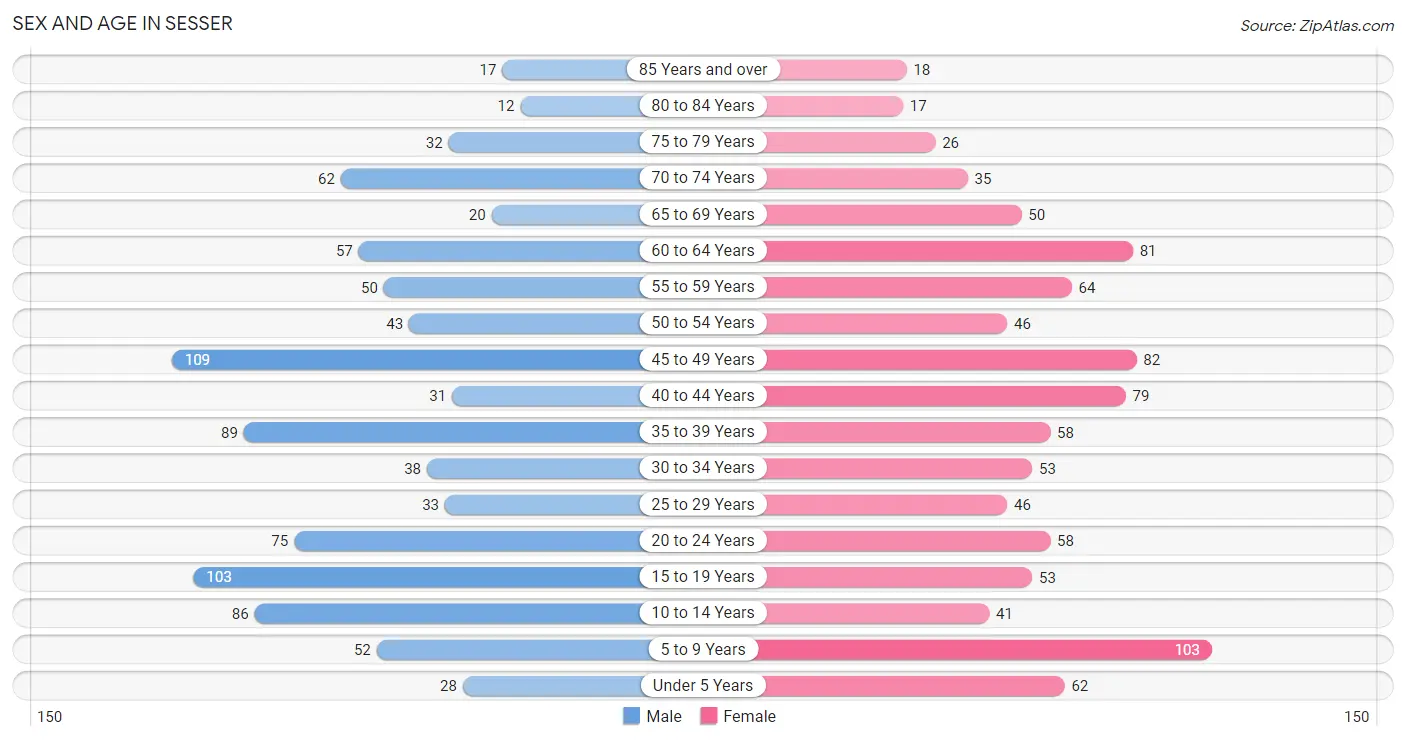
| Age Bracket | Male | Female |
| Under 5 Years | 28 (3.0%) | 62 (6.4%) |
| 5 to 9 Years | 52 (5.6%) | 103 (10.6%) |
| 10 to 14 Years | 86 (9.2%) | 41 (4.2%) |
| 15 to 19 Years | 103 (11.0%) | 53 (5.4%) |
| 20 to 24 Years | 75 (8.0%) | 58 (6.0%) |
| 25 to 29 Years | 33 (3.5%) | 46 (4.7%) |
| 30 to 34 Years | 38 (4.1%) | 53 (5.4%) |
| 35 to 39 Years | 89 (9.5%) | 58 (6.0%) |
| 40 to 44 Years | 31 (3.3%) | 79 (8.1%) |
| 45 to 49 Years | 109 (11.6%) | 82 (8.4%) |
| 50 to 54 Years | 43 (4.6%) | 46 (4.7%) |
| 55 to 59 Years | 50 (5.3%) | 64 (6.6%) |
| 60 to 64 Years | 57 (6.1%) | 81 (8.3%) |
| 65 to 69 Years | 20 (2.1%) | 50 (5.1%) |
| 70 to 74 Years | 62 (6.6%) | 35 (3.6%) |
| 75 to 79 Years | 32 (3.4%) | 26 (2.7%) |
| 80 to 84 Years | 12 (1.3%) | 17 (1.8%) |
| 85 Years and over | 17 (1.8%) | 18 (1.8%) |
| Total | 937 (100.0%) | 972 (100.0%) |
Families and Households in Sesser
Median Family Size in Sesser
The median family size in Sesser is 3.11 persons per family, with married-couple families (385 | 73.5%) accounting for the largest median family size of 3.34 persons per family. On the other hand, single male/father families (50 | 9.5%) represent the smallest median family size with 2.20 persons per family.
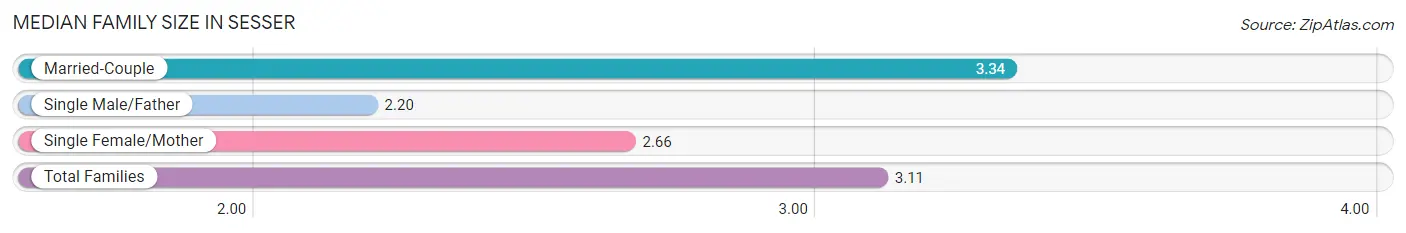
| Family Type | # Families | Family Size |
| Married-Couple | 385 (73.5%) | 3.34 |
| Single Male/Father | 50 (9.5%) | 2.20 |
| Single Female/Mother | 89 (17.0%) | 2.66 |
| Total Families | 524 (100.0%) | 3.11 |
Median Household Size in Sesser
The median household size in Sesser is 2.64 persons per household, with married-couple households (385 | 53.3%) accounting for the largest median household size of 3.36 persons per household. non-family households (198 | 27.4%) represent the smallest median household size with 1.21 persons per household.
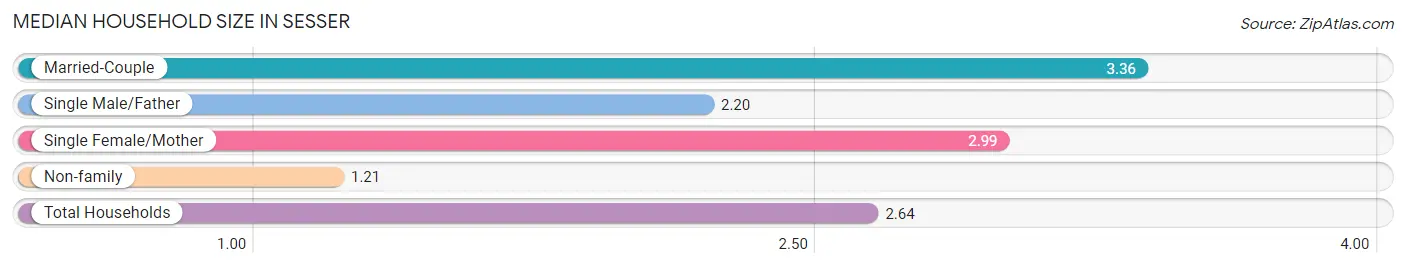
| Household Type | # Households | Household Size |
| Married-Couple | 385 (53.3%) | 3.36 |
| Single Male/Father | 50 (6.9%) | 2.20 |
| Single Female/Mother | 89 (12.3%) | 2.99 |
| Non-family | 198 (27.4%) | 1.21 |
| Total Households | 722 (100.0%) | 2.64 |
Household Size by Marriage Status in Sesser
Out of a total of 722 households in Sesser, 524 (72.6%) are family households, while 198 (27.4%) are nonfamily households. The most numerous type of family households are 2-person households, comprising 244, and the most common type of nonfamily households are 1-person households, comprising 166.
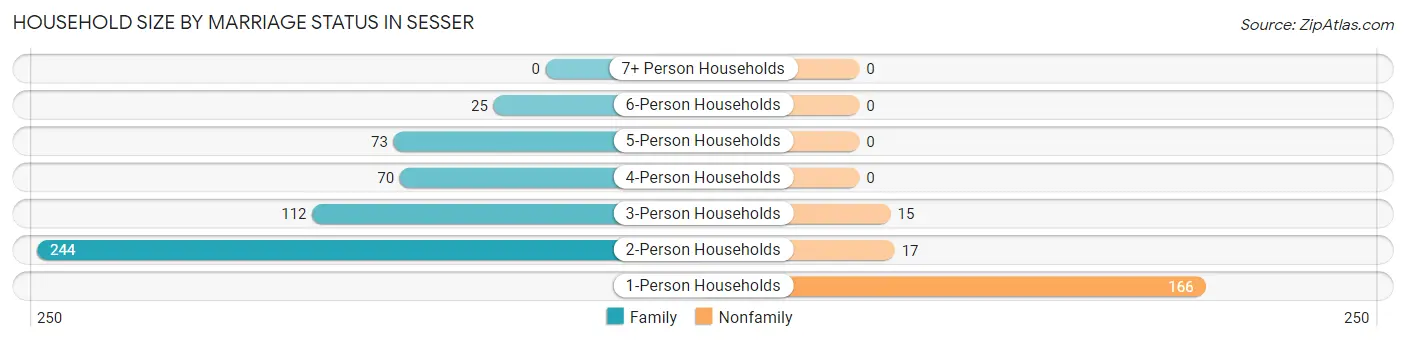
| Household Size | Family Households | Nonfamily Households |
| 1-Person Households | - | 166 (23.0%) |
| 2-Person Households | 244 (33.8%) | 17 (2.4%) |
| 3-Person Households | 112 (15.5%) | 15 (2.1%) |
| 4-Person Households | 70 (9.7%) | 0 (0.0%) |
| 5-Person Households | 73 (10.1%) | 0 (0.0%) |
| 6-Person Households | 25 (3.5%) | 0 (0.0%) |
| 7+ Person Households | 0 (0.0%) | 0 (0.0%) |
| Total | 524 (72.6%) | 198 (27.4%) |
Female Fertility in Sesser
Fertility by Age in Sesser
Average fertility rate in Sesser is 24.0 births per 1,000 women. Women in the age bracket of 20 to 34 years have the highest fertility rate with 32.0 births per 1,000 women. Women in the age bracket of 35 to 50 years acount for 54.5% of all women with births.
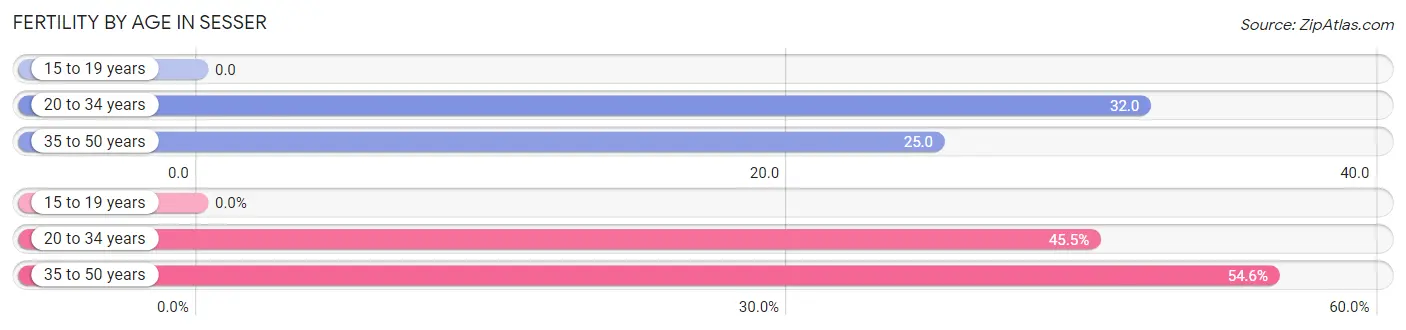
| Age Bracket | Women with Births | Births / 1,000 Women |
| 15 to 19 years | 0 (0.0%) | 0.0 |
| 20 to 34 years | 5 (45.5%) | 32.0 |
| 35 to 50 years | 6 (54.5%) | 25.0 |
| Total | 11 (100.0%) | 24.0 |
Fertility by Age by Marriage Status in Sesser
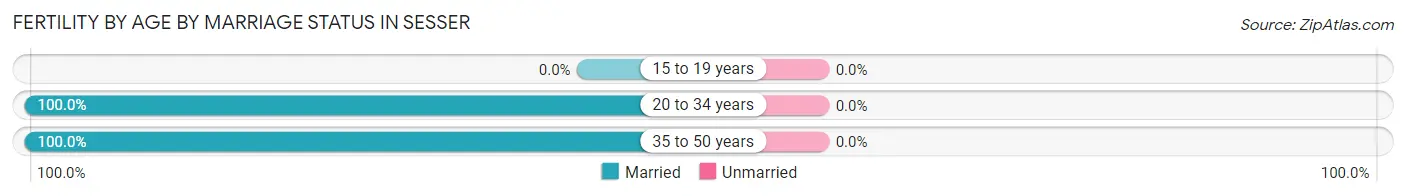
| Age Bracket | Married | Unmarried |
| 15 to 19 years | 0 (0.0%) | 0 (0.0%) |
| 20 to 34 years | 5 (100.0%) | 0 (0.0%) |
| 35 to 50 years | 6 (100.0%) | 0 (0.0%) |
| Total | 11 (100.0%) | 0 (0.0%) |
Fertility by Education in Sesser
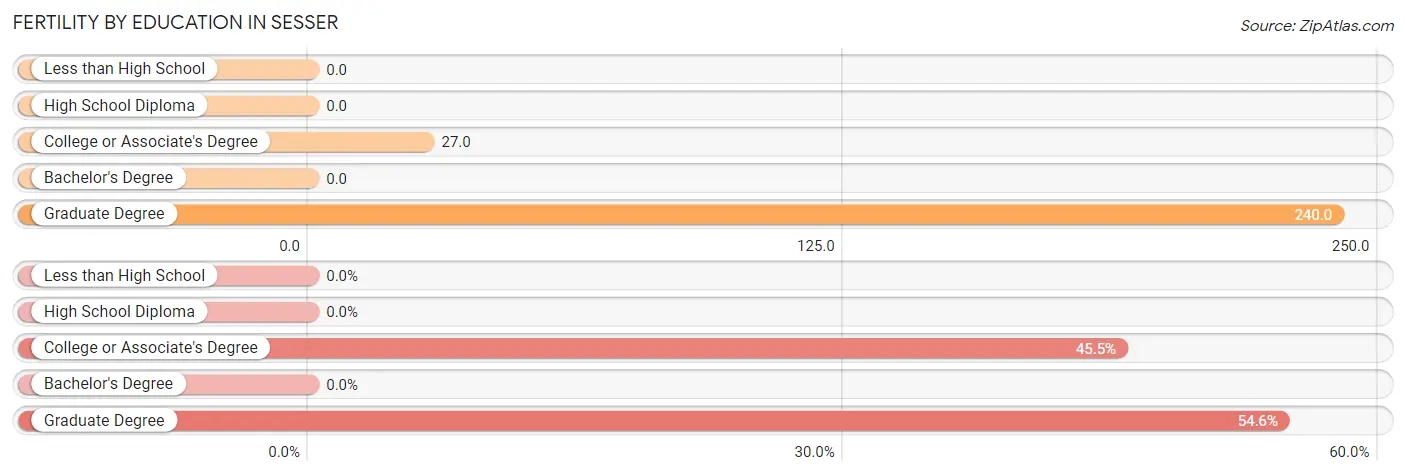
| Educational Attainment | Women with Births | Births / 1,000 Women |
| Less than High School | 0 (0.0%) | 0.0 |
| High School Diploma | 0 (0.0%) | 0.0 |
| College or Associate's Degree | 5 (45.5%) | 27.0 |
| Bachelor's Degree | 0 (0.0%) | 0.0 |
| Graduate Degree | 6 (54.5%) | 240.0 |
| Total | 11 (100.0%) | 24.0 |
Fertility by Education by Marriage Status in Sesser
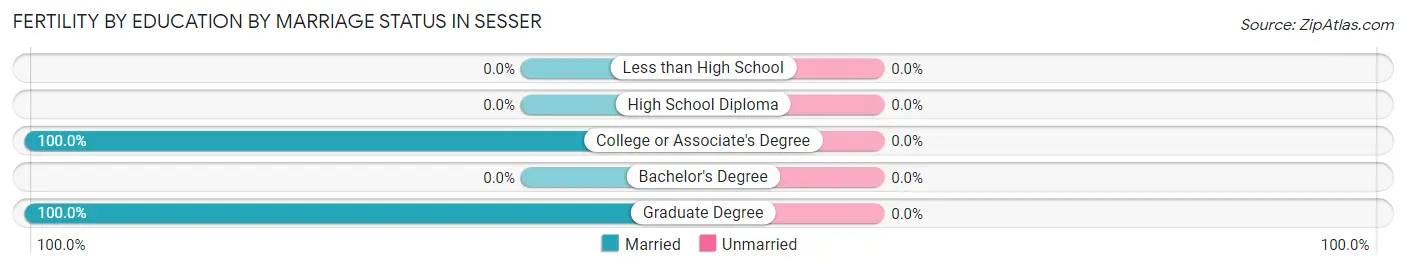
| Educational Attainment | Married | Unmarried |
| Less than High School | 0 (0.0%) | 0 (0.0%) |
| High School Diploma | 0 (0.0%) | 0 (0.0%) |
| College or Associate's Degree | 5 (100.0%) | 0 (0.0%) |
| Bachelor's Degree | 0 (0.0%) | 0 (0.0%) |
| Graduate Degree | 6 (100.0%) | 0 (0.0%) |
| Total | 11 (100.0%) | 0 (0.0%) |
Employment Characteristics in Sesser
Employment by Class of Employer in Sesser
Among the 771 employed individuals in Sesser, private company employees (571 | 74.1%), local government employees (80 | 10.4%), and not-for-profit organizations (68 | 8.8%) make up the most common classes of employment.
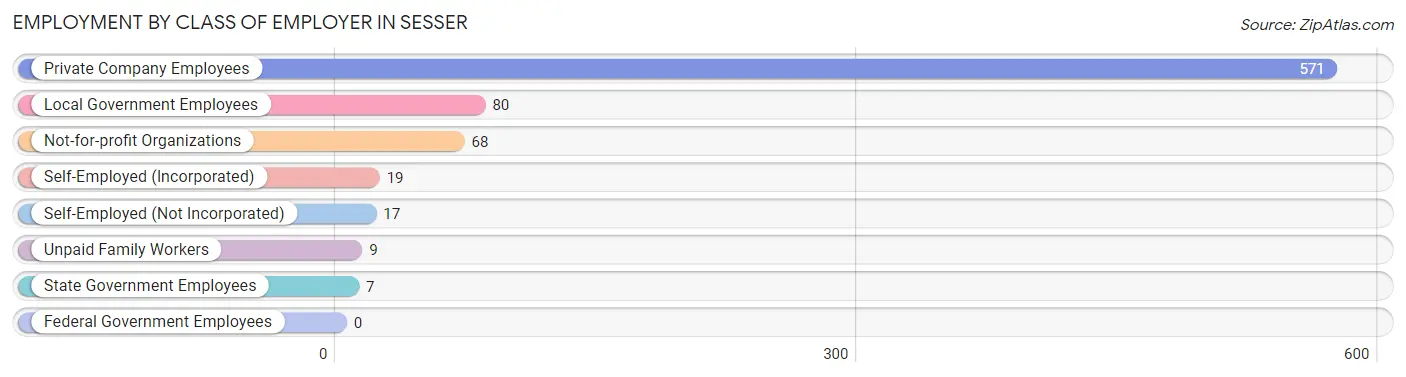
| Employer Class | # Employees | % Employees |
| Private Company Employees | 571 | 74.1% |
| Self-Employed (Incorporated) | 19 | 2.5% |
| Self-Employed (Not Incorporated) | 17 | 2.2% |
| Not-for-profit Organizations | 68 | 8.8% |
| Local Government Employees | 80 | 10.4% |
| State Government Employees | 7 | 0.9% |
| Federal Government Employees | 0 | 0.0% |
| Unpaid Family Workers | 9 | 1.2% |
| Total | 771 | 100.0% |
Employment Status by Age in Sesser
According to the labor force statistics for Sesser, out of the total population over 16 years of age (1,513), 56.3% or 852 individuals are in the labor force, with 9.5% or 81 of them unemployed. The age group with the highest labor force participation rate is 45 to 54 years, with 89.6% or 251 individuals in the labor force. Within the labor force, the 45 to 54 years age range has the highest percentage of unemployed individuals, with 19.5% or 49 of them being unemployed.
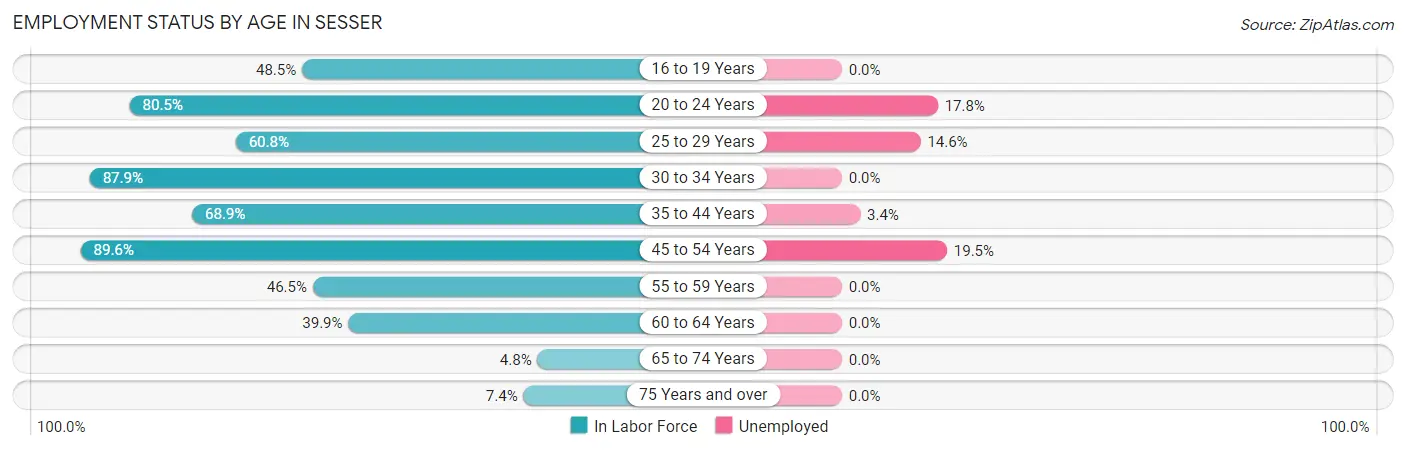
| Age Bracket | In Labor Force | Unemployed |
| 16 to 19 Years | 64 (48.5%) | 0 (0.0%) |
| 20 to 24 Years | 107 (80.5%) | 19 (17.8%) |
| 25 to 29 Years | 48 (60.8%) | 7 (14.6%) |
| 30 to 34 Years | 80 (87.9%) | 0 (0.0%) |
| 35 to 44 Years | 177 (68.9%) | 6 (3.4%) |
| 45 to 54 Years | 251 (89.6%) | 49 (19.5%) |
| 55 to 59 Years | 53 (46.5%) | 0 (0.0%) |
| 60 to 64 Years | 55 (39.9%) | 0 (0.0%) |
| 65 to 74 Years | 8 (4.8%) | 0 (0.0%) |
| 75 Years and over | 9 (7.4%) | 0 (0.0%) |
| Total | 852 (56.3%) | 81 (9.5%) |
Employment Status by Educational Attainment in Sesser
According to labor force statistics for Sesser, 69.2% of individuals (664) out of the total population between 25 and 64 years of age (959) are in the labor force, with 9.3% or 62 of them being unemployed. The group with the highest labor force participation rate are those with the educational attainment of college / associate degree, with 74.6% or 318 individuals in the labor force. Within the labor force, individuals with high school diploma education have the highest percentage of unemployment, with 25.0% or 48 of them being unemployed.
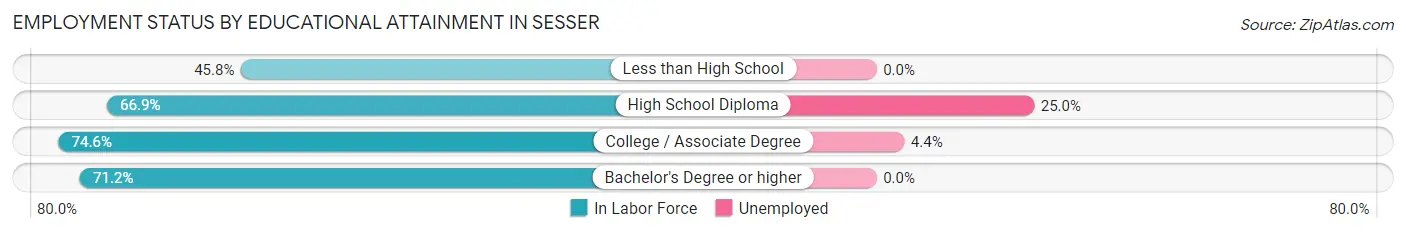
| Educational Attainment | In Labor Force | Unemployed |
| Less than High School | 38 (45.8%) | 0 (0.0%) |
| High School Diploma | 192 (66.9%) | 72 (25.0%) |
| College / Associate Degree | 318 (74.6%) | 19 (4.4%) |
| Bachelor's Degree or higher | 116 (71.2%) | 0 (0.0%) |
| Total | 664 (69.2%) | 89 (9.3%) |
Employment Occupations by Sex in Sesser
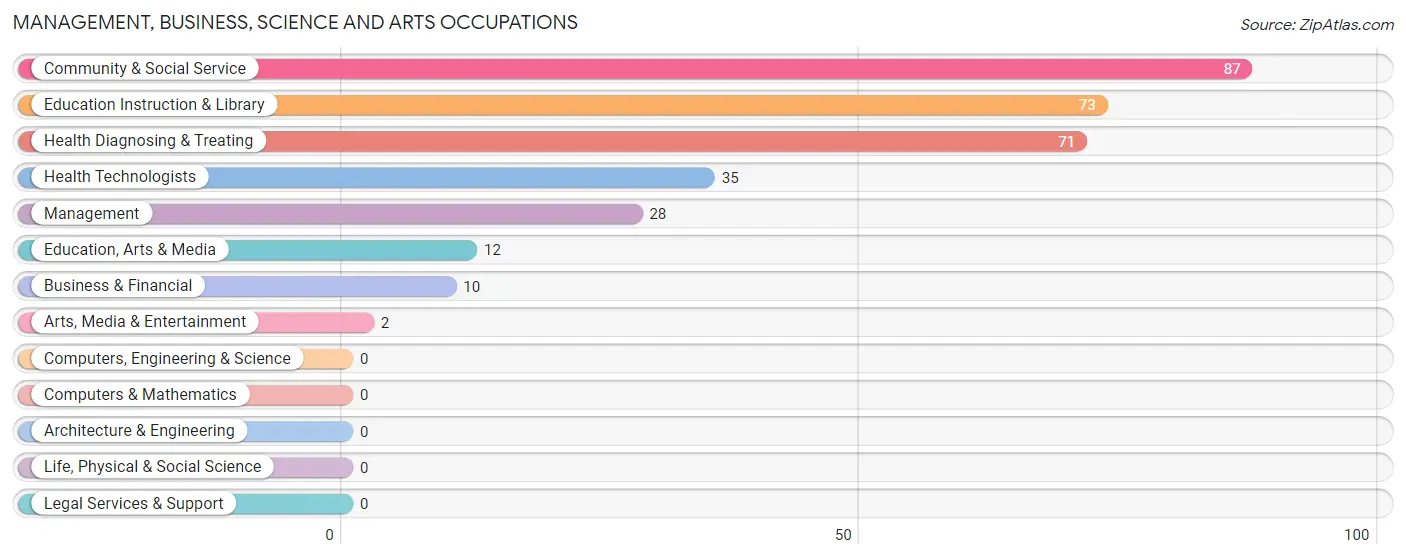
Management, Business, Science and Arts Occupations
The most common Management, Business, Science and Arts occupations in Sesser are Community & Social Service (87 | 11.3%), Education Instruction & Library (73 | 9.5%), Health Diagnosing & Treating (71 | 9.2%), Health Technologists (35 | 4.5%), and Management (28 | 3.6%).
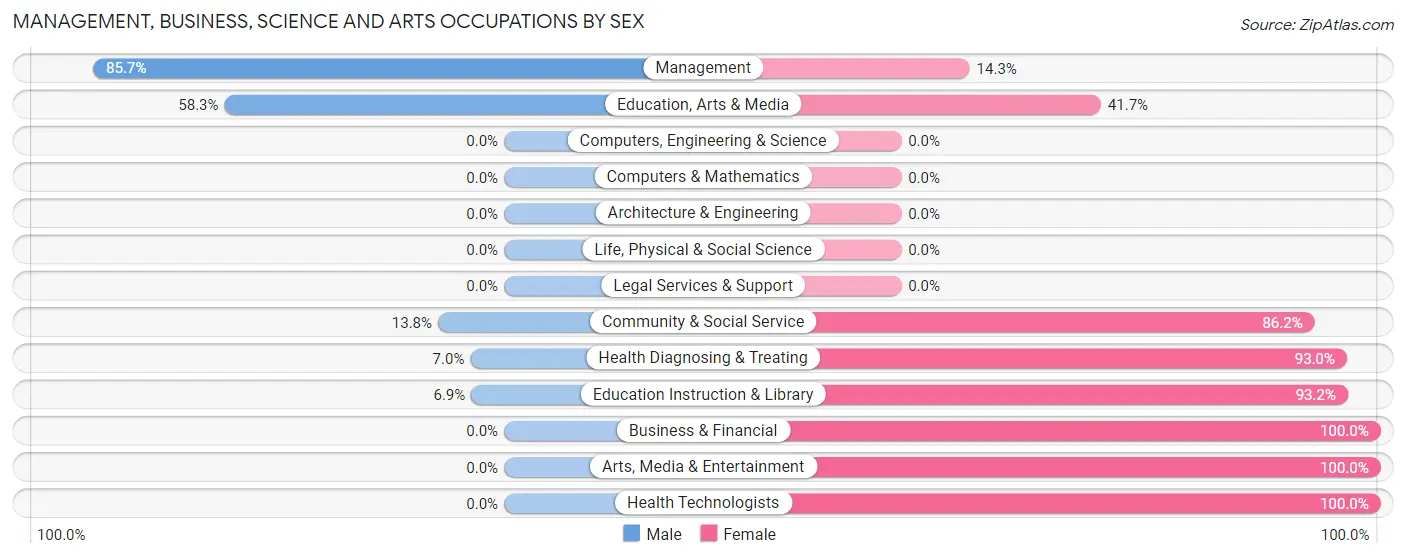
Management, Business, Science and Arts Occupations by Sex
Within the Management, Business, Science and Arts occupations in Sesser, the most male-oriented occupations are Management (85.7%), Education, Arts & Media (58.3%), and Community & Social Service (13.8%), while the most female-oriented occupations are Business & Financial (100.0%), Arts, Media & Entertainment (100.0%), and Health Technologists (100.0%).
| Occupation | Male | Female |
| Management | 24 (85.7%) | 4 (14.3%) |
| Business & Financial | 0 (0.0%) | 10 (100.0%) |
| Computers, Engineering & Science | 0 (0.0%) | 0 (0.0%) |
| Computers & Mathematics | 0 (0.0%) | 0 (0.0%) |
| Architecture & Engineering | 0 (0.0%) | 0 (0.0%) |
| Life, Physical & Social Science | 0 (0.0%) | 0 (0.0%) |
| Community & Social Service | 12 (13.8%) | 75 (86.2%) |
| Education, Arts & Media | 7 (58.3%) | 5 (41.7%) |
| Legal Services & Support | 0 (0.0%) | 0 (0.0%) |
| Education Instruction & Library | 5 (6.9%) | 68 (93.1%) |
| Arts, Media & Entertainment | 0 (0.0%) | 2 (100.0%) |
| Health Diagnosing & Treating | 5 (7.0%) | 66 (93.0%) |
| Health Technologists | 0 (0.0%) | 35 (100.0%) |
| Total (Category) | 41 (20.9%) | 155 (79.1%) |
| Total (Overall) | 320 (41.5%) | 451 (58.5%) |
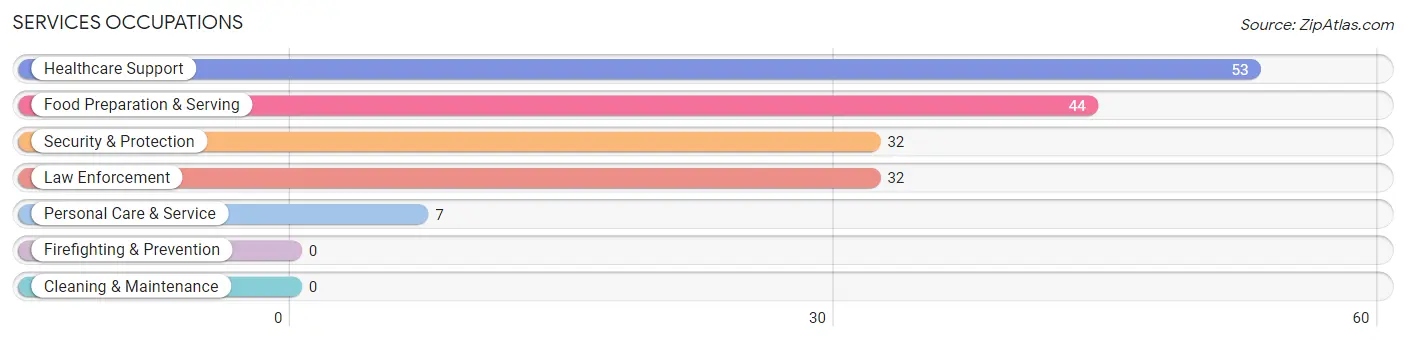
Services Occupations
The most common Services occupations in Sesser are Healthcare Support (53 | 6.9%), Food Preparation & Serving (44 | 5.7%), Security & Protection (32 | 4.2%), Law Enforcement (32 | 4.2%), and Personal Care & Service (7 | 0.9%).
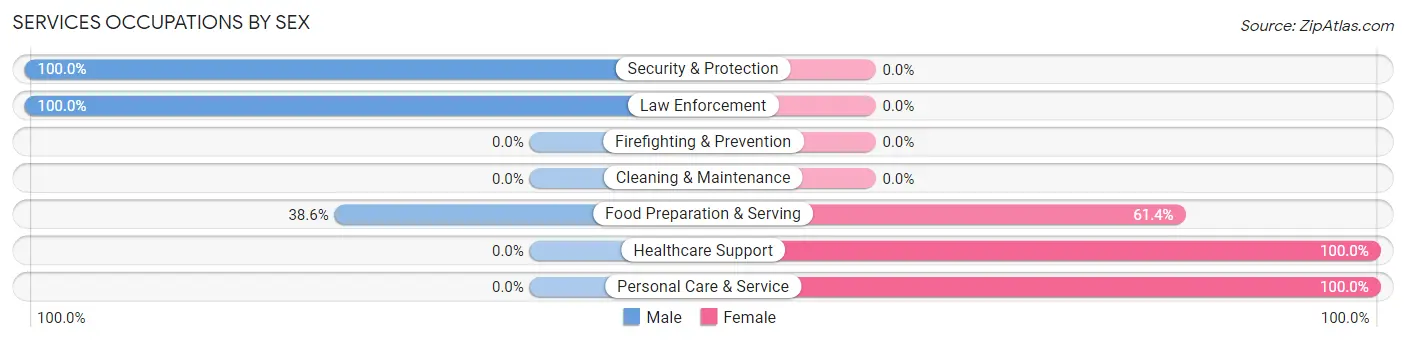
Services Occupations by Sex
Within the Services occupations in Sesser, the most male-oriented occupations are Security & Protection (100.0%), Law Enforcement (100.0%), and Food Preparation & Serving (38.6%), while the most female-oriented occupations are Healthcare Support (100.0%), Personal Care & Service (100.0%), and Food Preparation & Serving (61.4%).
| Occupation | Male | Female |
| Healthcare Support | 0 (0.0%) | 53 (100.0%) |
| Security & Protection | 32 (100.0%) | 0 (0.0%) |
| Firefighting & Prevention | 0 (0.0%) | 0 (0.0%) |
| Law Enforcement | 32 (100.0%) | 0 (0.0%) |
| Food Preparation & Serving | 17 (38.6%) | 27 (61.4%) |
| Cleaning & Maintenance | 0 (0.0%) | 0 (0.0%) |
| Personal Care & Service | 0 (0.0%) | 7 (100.0%) |
| Total (Category) | 49 (36.0%) | 87 (64.0%) |
| Total (Overall) | 320 (41.5%) | 451 (58.5%) |
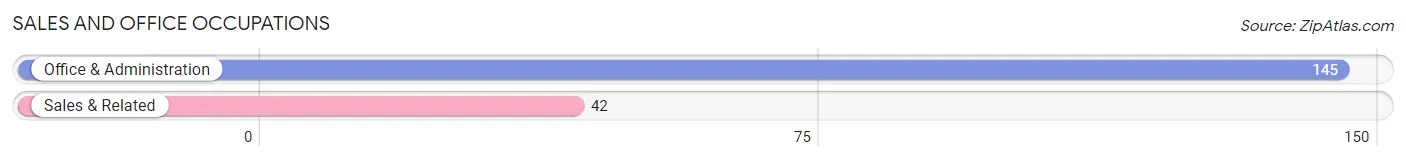
Sales and Office Occupations
The most common Sales and Office occupations in Sesser are Office & Administration (145 | 18.8%), and Sales & Related (42 | 5.4%).
Sales and Office Occupations by Sex
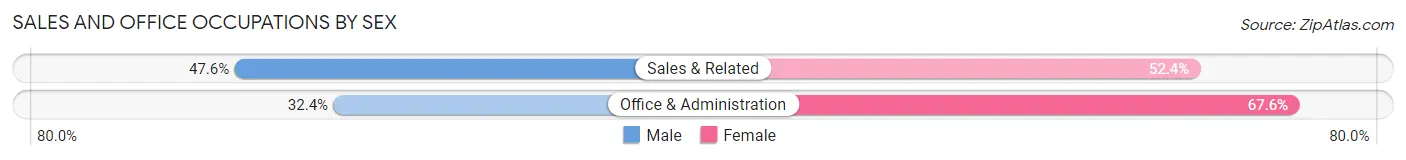
| Occupation | Male | Female |
| Sales & Related | 20 (47.6%) | 22 (52.4%) |
| Office & Administration | 47 (32.4%) | 98 (67.6%) |
| Total (Category) | 67 (35.8%) | 120 (64.2%) |
| Total (Overall) | 320 (41.5%) | 451 (58.5%) |
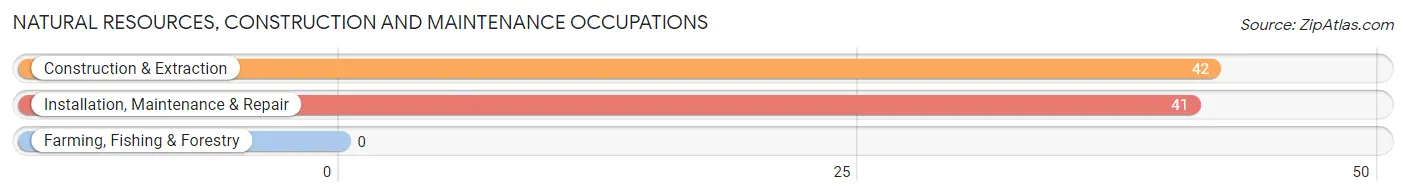
Natural Resources, Construction and Maintenance Occupations
The most common Natural Resources, Construction and Maintenance occupations in Sesser are Construction & Extraction (42 | 5.4%), and Installation, Maintenance & Repair (41 | 5.3%).
Natural Resources, Construction and Maintenance Occupations by Sex
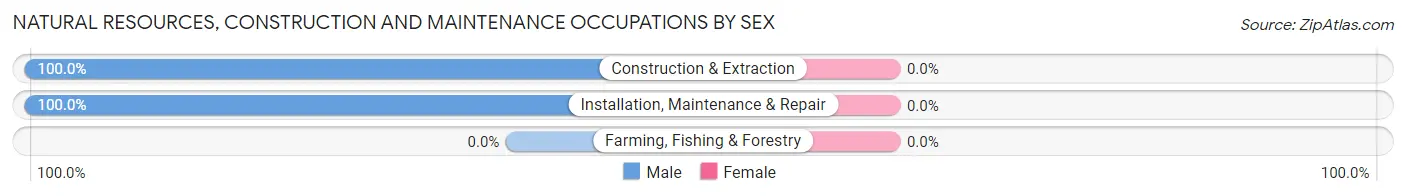
| Occupation | Male | Female |
| Farming, Fishing & Forestry | 0 (0.0%) | 0 (0.0%) |
| Construction & Extraction | 42 (100.0%) | 0 (0.0%) |
| Installation, Maintenance & Repair | 41 (100.0%) | 0 (0.0%) |
| Total (Category) | 83 (100.0%) | 0 (0.0%) |
| Total (Overall) | 320 (41.5%) | 451 (58.5%) |
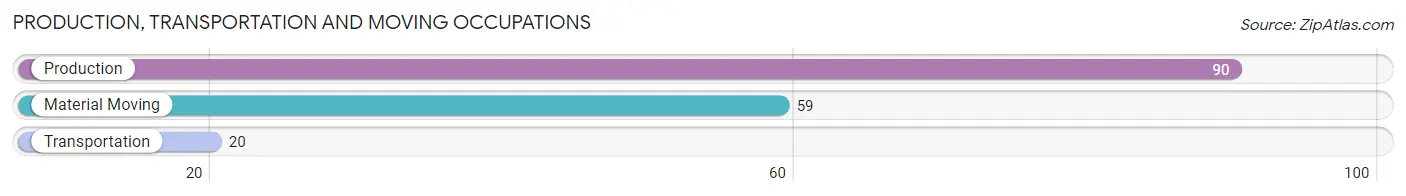
Production, Transportation and Moving Occupations
The most common Production, Transportation and Moving occupations in Sesser are Production (90 | 11.7%), Material Moving (59 | 7.6%), and Transportation (20 | 2.6%).
Production, Transportation and Moving Occupations by Sex
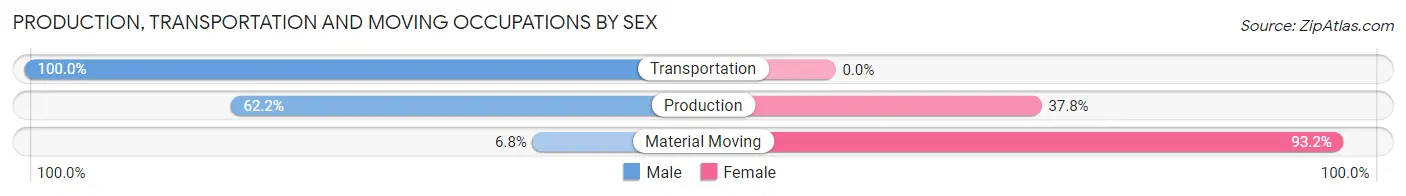
| Occupation | Male | Female |
| Production | 56 (62.2%) | 34 (37.8%) |
| Transportation | 20 (100.0%) | 0 (0.0%) |
| Material Moving | 4 (6.8%) | 55 (93.2%) |
| Total (Category) | 80 (47.3%) | 89 (52.7%) |
| Total (Overall) | 320 (41.5%) | 451 (58.5%) |
Employment Industries by Sex in Sesser
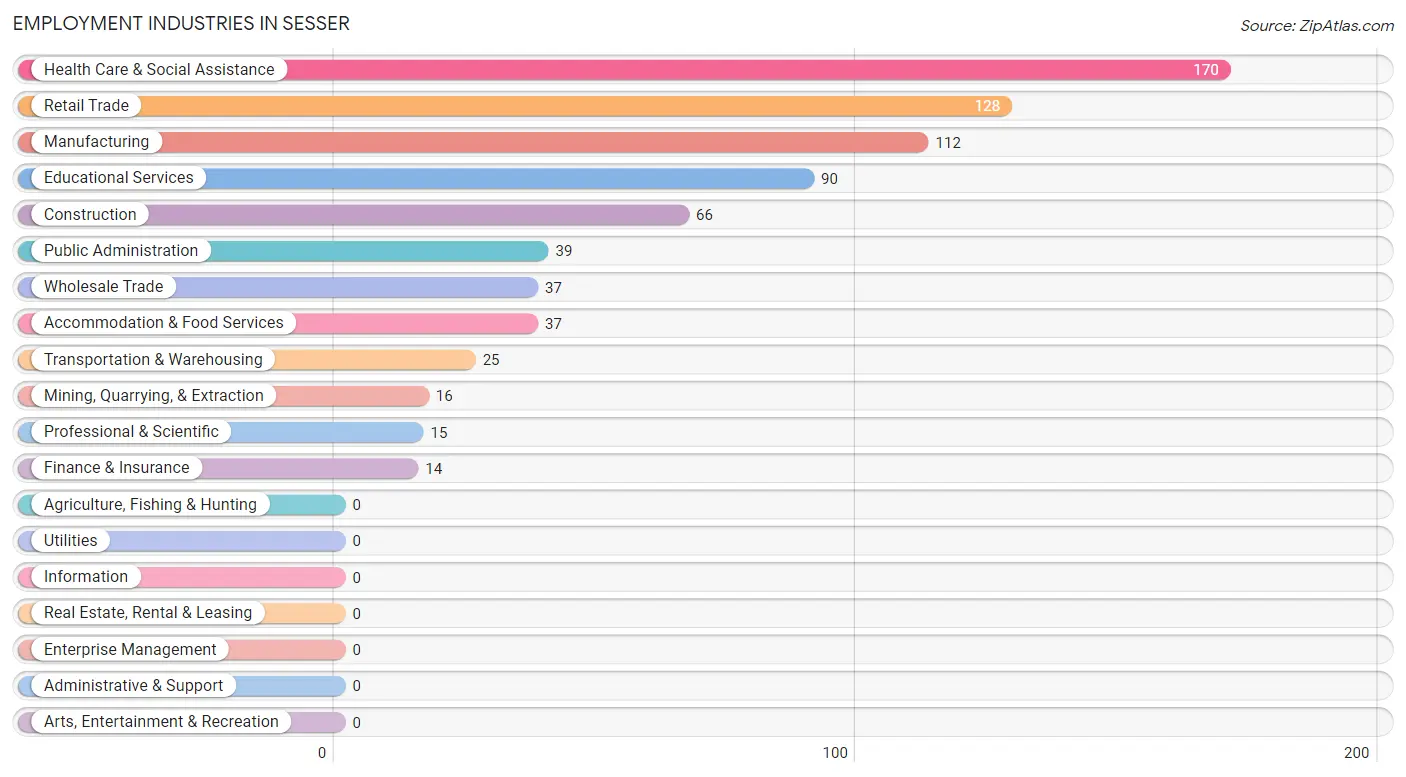
Employment Industries in Sesser
The major employment industries in Sesser include Health Care & Social Assistance (170 | 22.1%), Retail Trade (128 | 16.6%), Manufacturing (112 | 14.5%), Educational Services (90 | 11.7%), and Construction (66 | 8.6%).
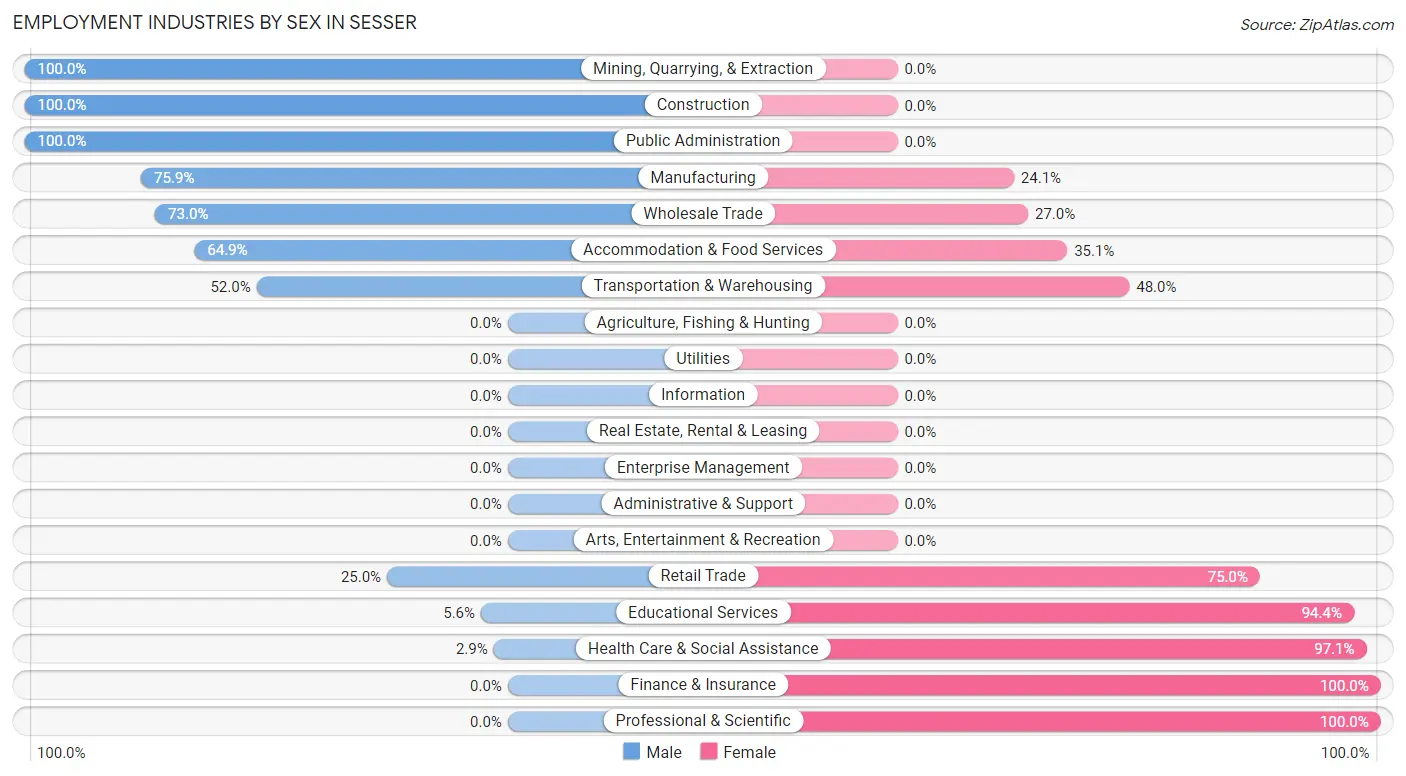
Employment Industries by Sex in Sesser
The Sesser industries that see more men than women are Mining, Quarrying, & Extraction (100.0%), Construction (100.0%), and Public Administration (100.0%), whereas the industries that tend to have a higher number of women are Finance & Insurance (100.0%), Professional & Scientific (100.0%), and Health Care & Social Assistance (97.1%).
| Industry | Male | Female |
| Agriculture, Fishing & Hunting | 0 (0.0%) | 0 (0.0%) |
| Mining, Quarrying, & Extraction | 16 (100.0%) | 0 (0.0%) |
| Construction | 66 (100.0%) | 0 (0.0%) |
| Manufacturing | 85 (75.9%) | 27 (24.1%) |
| Wholesale Trade | 27 (73.0%) | 10 (27.0%) |
| Retail Trade | 32 (25.0%) | 96 (75.0%) |
| Transportation & Warehousing | 13 (52.0%) | 12 (48.0%) |
| Utilities | 0 (0.0%) | 0 (0.0%) |
| Information | 0 (0.0%) | 0 (0.0%) |
| Finance & Insurance | 0 (0.0%) | 14 (100.0%) |
| Real Estate, Rental & Leasing | 0 (0.0%) | 0 (0.0%) |
| Professional & Scientific | 0 (0.0%) | 15 (100.0%) |
| Enterprise Management | 0 (0.0%) | 0 (0.0%) |
| Administrative & Support | 0 (0.0%) | 0 (0.0%) |
| Educational Services | 5 (5.6%) | 85 (94.4%) |
| Health Care & Social Assistance | 5 (2.9%) | 165 (97.1%) |
| Arts, Entertainment & Recreation | 0 (0.0%) | 0 (0.0%) |
| Accommodation & Food Services | 24 (64.9%) | 13 (35.1%) |
| Public Administration | 39 (100.0%) | 0 (0.0%) |
| Total | 320 (41.5%) | 451 (58.5%) |
Education in Sesser
School Enrollment in Sesser
The most common levels of schooling among the 576 students in Sesser are college / undergraduate (140 | 24.3%), elementary school (126 | 21.9%), and high school (118 | 20.5%).
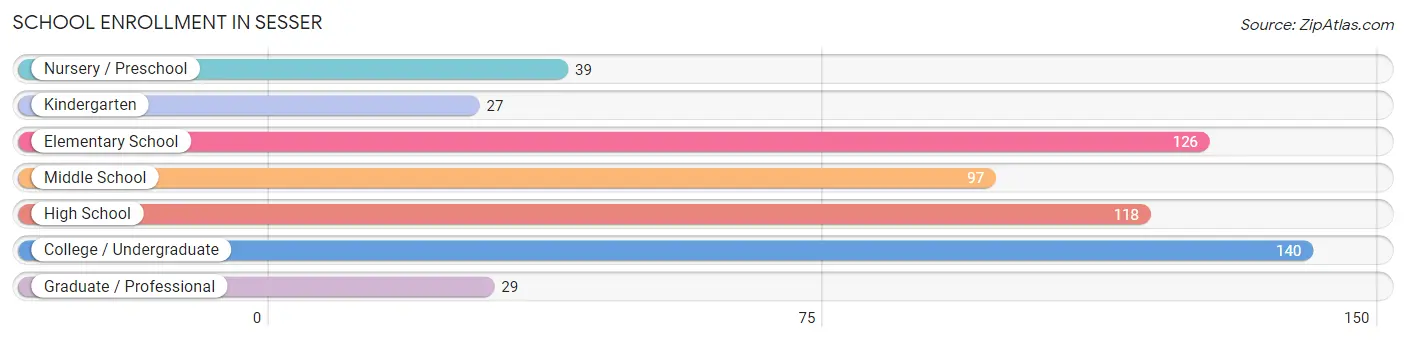
| School Level | # Students | % Students |
| Nursery / Preschool | 39 | 6.8% |
| Kindergarten | 27 | 4.7% |
| Elementary School | 126 | 21.9% |
| Middle School | 97 | 16.8% |
| High School | 118 | 20.5% |
| College / Undergraduate | 140 | 24.3% |
| Graduate / Professional | 29 | 5.0% |
| Total | 576 | 100.0% |
School Enrollment by Age by Funding Source in Sesser
Out of a total of 576 students who are enrolled in schools in Sesser, 46 (8.0%) attend a private institution, while the remaining 530 (92.0%) are enrolled in public schools. The age group of 35 years and over has the highest likelihood of being enrolled in private schools, with 15 (71.4% in the age bracket) enrolled. Conversely, the age group of 3 to 4 year olds has the lowest likelihood of being enrolled in a private school, with 13 (100.0% in the age bracket) attending a public institution.
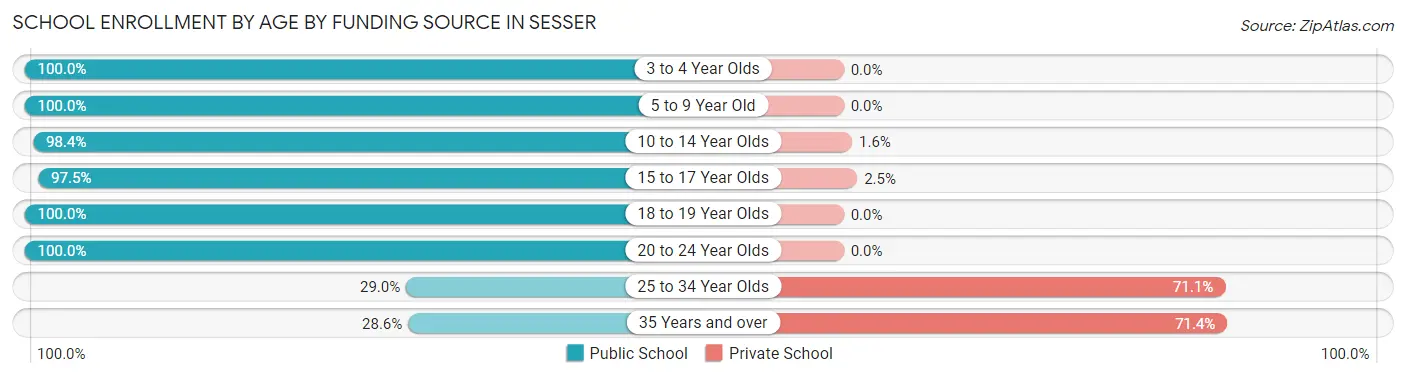
| Age Bracket | Public School | Private School |
| 3 to 4 Year Olds | 13 (100.0%) | 0 (0.0%) |
| 5 to 9 Year Old | 155 (100.0%) | 0 (0.0%) |
| 10 to 14 Year Olds | 125 (98.4%) | 2 (1.6%) |
| 15 to 17 Year Olds | 77 (97.5%) | 2 (2.5%) |
| 18 to 19 Year Olds | 77 (100.0%) | 0 (0.0%) |
| 20 to 24 Year Olds | 66 (100.0%) | 0 (0.0%) |
| 25 to 34 Year Olds | 11 (28.9%) | 27 (71.1%) |
| 35 Years and over | 6 (28.6%) | 15 (71.4%) |
| Total | 530 (92.0%) | 46 (8.0%) |
Educational Attainment by Field of Study in Sesser
Arts & humanities (57 | 32.8%), education (45 | 25.9%), science & technology (29 | 16.7%), business (22 | 12.6%), and psychology (12 | 6.9%) are the most common fields of study among 174 individuals in Sesser who have obtained a bachelor's degree or higher.
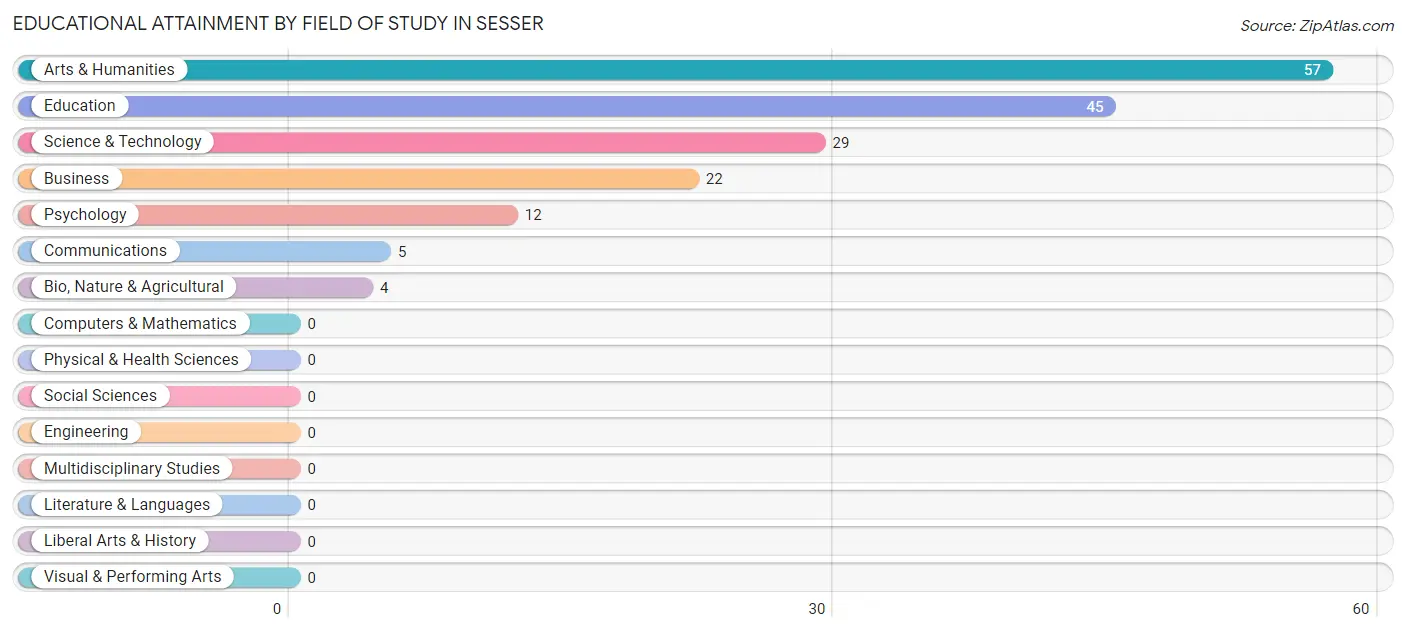
| Field of Study | # Graduates | % Graduates |
| Computers & Mathematics | 0 | 0.0% |
| Bio, Nature & Agricultural | 4 | 2.3% |
| Physical & Health Sciences | 0 | 0.0% |
| Psychology | 12 | 6.9% |
| Social Sciences | 0 | 0.0% |
| Engineering | 0 | 0.0% |
| Multidisciplinary Studies | 0 | 0.0% |
| Science & Technology | 29 | 16.7% |
| Business | 22 | 12.6% |
| Education | 45 | 25.9% |
| Literature & Languages | 0 | 0.0% |
| Liberal Arts & History | 0 | 0.0% |
| Visual & Performing Arts | 0 | 0.0% |
| Communications | 5 | 2.9% |
| Arts & Humanities | 57 | 32.8% |
| Total | 174 | 100.0% |
Transportation & Commute in Sesser
Vehicle Availability by Sex in Sesser
The most prevalent vehicle ownership categories in Sesser are males with 2 vehicles (158, accounting for 49.4%) and females with 2 vehicles (137, making up 35.0%).
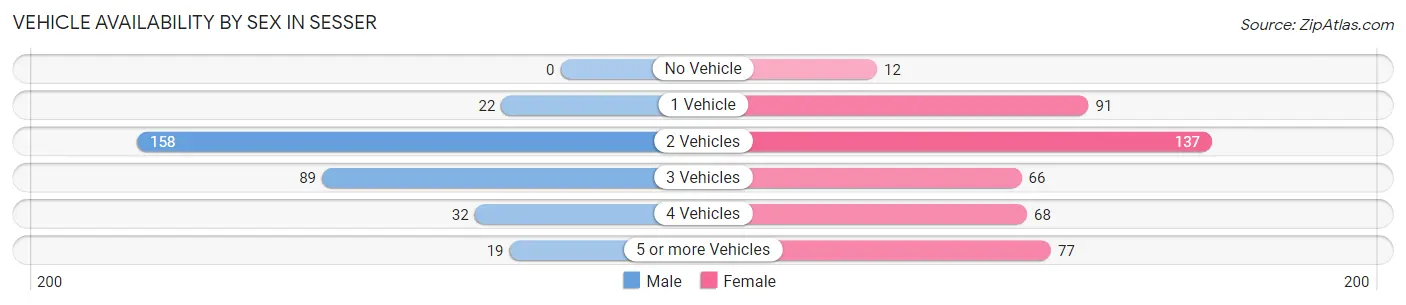
| Vehicles Available | Male | Female |
| No Vehicle | 0 (0.0%) | 12 (2.7%) |
| 1 Vehicle | 22 (6.9%) | 91 (20.2%) |
| 2 Vehicles | 158 (49.4%) | 137 (30.4%) |
| 3 Vehicles | 89 (27.8%) | 66 (14.6%) |
| 4 Vehicles | 32 (10.0%) | 68 (15.1%) |
| 5 or more Vehicles | 19 (5.9%) | 77 (17.1%) |
| Total | 320 (100.0%) | 451 (100.0%) |
Commute Time in Sesser
The most frequently occuring commute durations in Sesser are 30 to 34 minutes (191 commuters, 25.5%), 25 to 29 minutes (122 commuters, 16.3%), and 45 to 59 minutes (111 commuters, 14.8%).
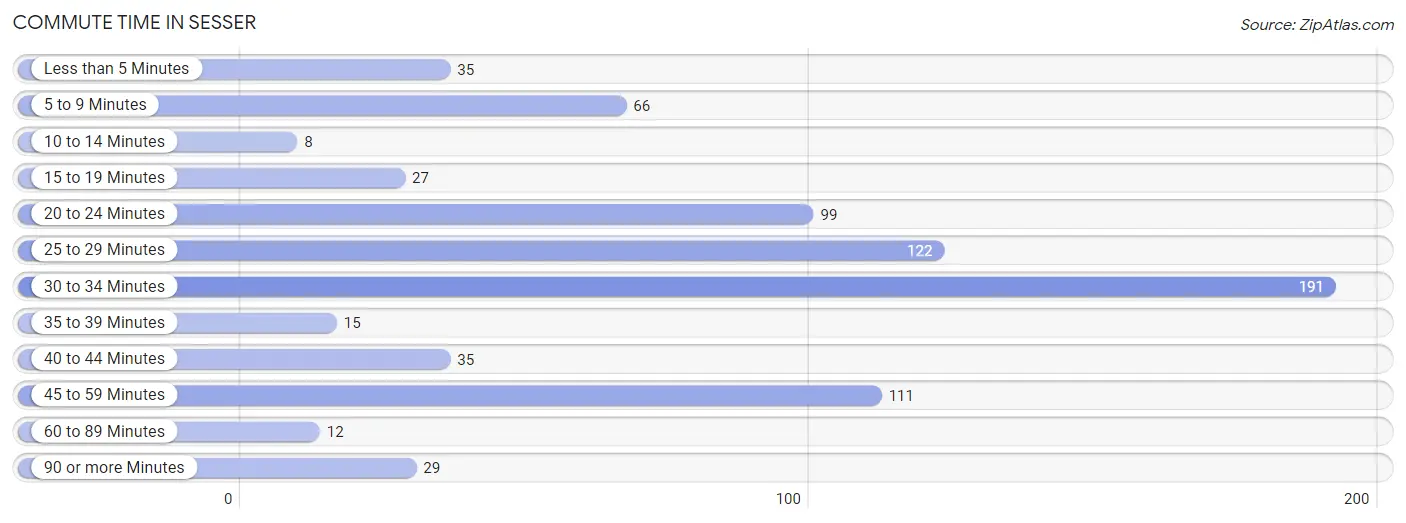
| Commute Time | # Commuters | % Commuters |
| Less than 5 Minutes | 35 | 4.7% |
| 5 to 9 Minutes | 66 | 8.8% |
| 10 to 14 Minutes | 8 | 1.1% |
| 15 to 19 Minutes | 27 | 3.6% |
| 20 to 24 Minutes | 99 | 13.2% |
| 25 to 29 Minutes | 122 | 16.3% |
| 30 to 34 Minutes | 191 | 25.5% |
| 35 to 39 Minutes | 15 | 2.0% |
| 40 to 44 Minutes | 35 | 4.7% |
| 45 to 59 Minutes | 111 | 14.8% |
| 60 to 89 Minutes | 12 | 1.6% |
| 90 or more Minutes | 29 | 3.9% |
Commute Time by Sex in Sesser
The most common commute times in Sesser are 30 to 34 minutes (133 commuters, 41.6%) for males and 20 to 24 minutes (91 commuters, 21.2%) for females.
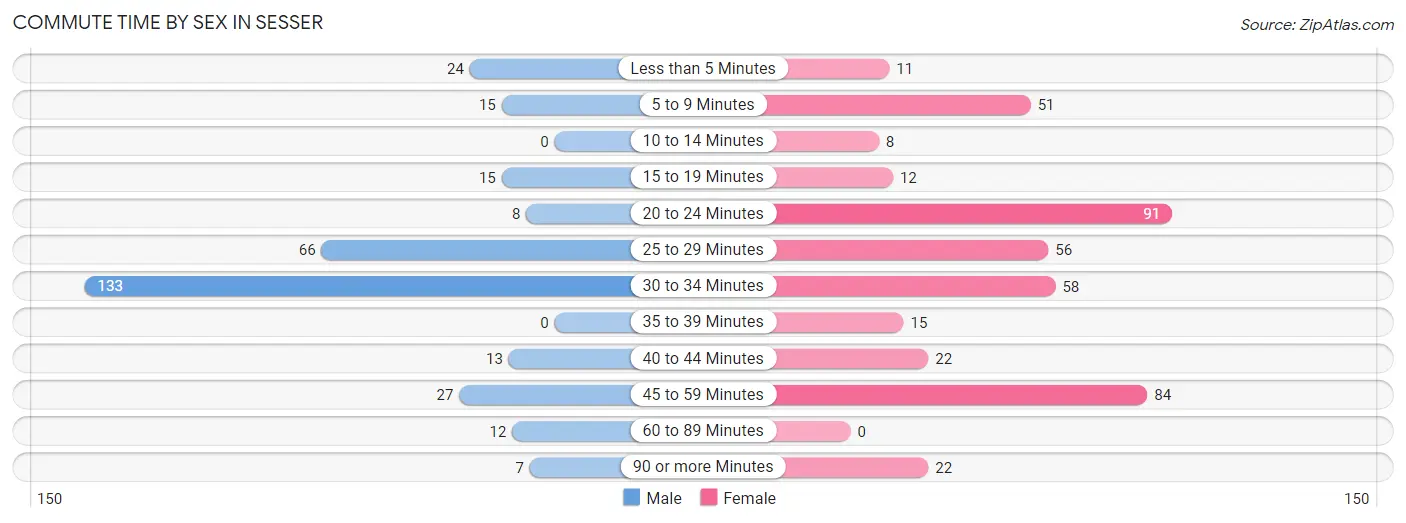
| Commute Time | Male | Female |
| Less than 5 Minutes | 24 (7.5%) | 11 (2.6%) |
| 5 to 9 Minutes | 15 (4.7%) | 51 (11.9%) |
| 10 to 14 Minutes | 0 (0.0%) | 8 (1.9%) |
| 15 to 19 Minutes | 15 (4.7%) | 12 (2.8%) |
| 20 to 24 Minutes | 8 (2.5%) | 91 (21.2%) |
| 25 to 29 Minutes | 66 (20.6%) | 56 (13.0%) |
| 30 to 34 Minutes | 133 (41.6%) | 58 (13.5%) |
| 35 to 39 Minutes | 0 (0.0%) | 15 (3.5%) |
| 40 to 44 Minutes | 13 (4.1%) | 22 (5.1%) |
| 45 to 59 Minutes | 27 (8.4%) | 84 (19.5%) |
| 60 to 89 Minutes | 12 (3.7%) | 0 (0.0%) |
| 90 or more Minutes | 7 (2.2%) | 22 (5.1%) |
Time of Departure to Work by Sex in Sesser
The most frequent times of departure to work in Sesser are 12:00 PM to 3:59 PM (76, 23.7%) for males and 7:30 AM to 7:59 AM (101, 23.5%) for females.
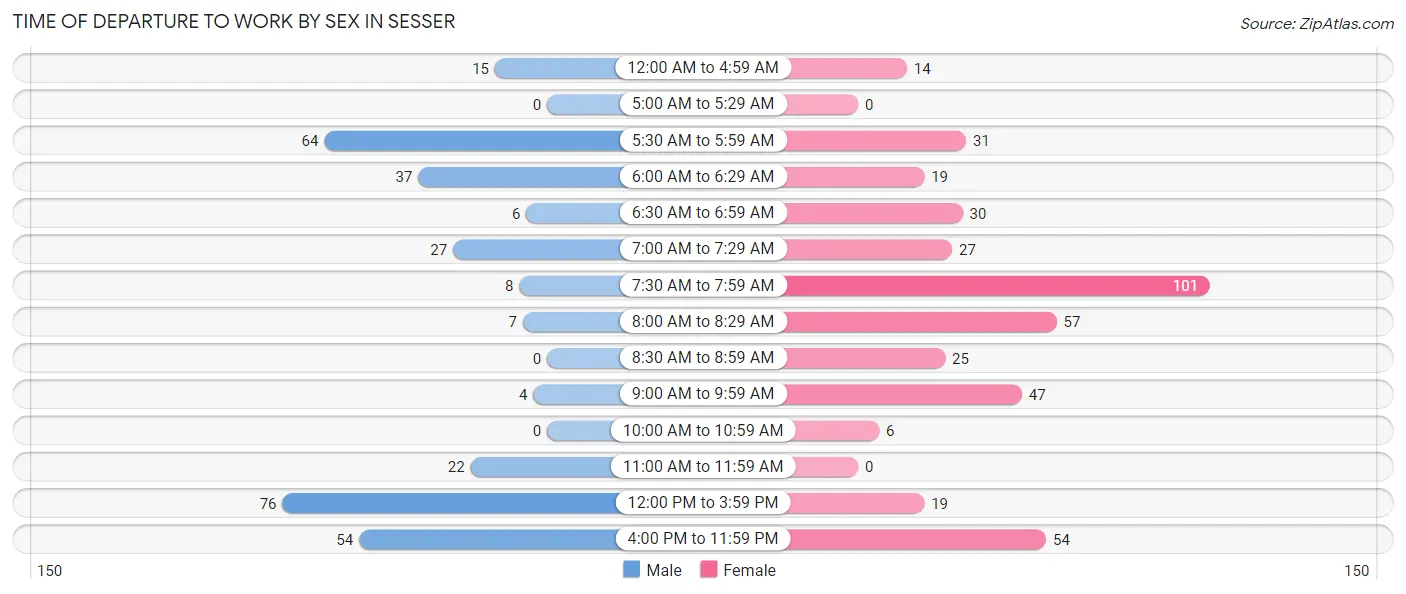
| Time of Departure | Male | Female |
| 12:00 AM to 4:59 AM | 15 (4.7%) | 14 (3.3%) |
| 5:00 AM to 5:29 AM | 0 (0.0%) | 0 (0.0%) |
| 5:30 AM to 5:59 AM | 64 (20.0%) | 31 (7.2%) |
| 6:00 AM to 6:29 AM | 37 (11.6%) | 19 (4.4%) |
| 6:30 AM to 6:59 AM | 6 (1.9%) | 30 (7.0%) |
| 7:00 AM to 7:29 AM | 27 (8.4%) | 27 (6.3%) |
| 7:30 AM to 7:59 AM | 8 (2.5%) | 101 (23.5%) |
| 8:00 AM to 8:29 AM | 7 (2.2%) | 57 (13.3%) |
| 8:30 AM to 8:59 AM | 0 (0.0%) | 25 (5.8%) |
| 9:00 AM to 9:59 AM | 4 (1.3%) | 47 (10.9%) |
| 10:00 AM to 10:59 AM | 0 (0.0%) | 6 (1.4%) |
| 11:00 AM to 11:59 AM | 22 (6.9%) | 0 (0.0%) |
| 12:00 PM to 3:59 PM | 76 (23.7%) | 19 (4.4%) |
| 4:00 PM to 11:59 PM | 54 (16.9%) | 54 (12.6%) |
| Total | 320 (100.0%) | 430 (100.0%) |
Housing Occupancy in Sesser
Occupancy by Ownership in Sesser
Of the total 722 dwellings in Sesser, owner-occupied units account for 540 (74.8%), while renter-occupied units make up 182 (25.2%).
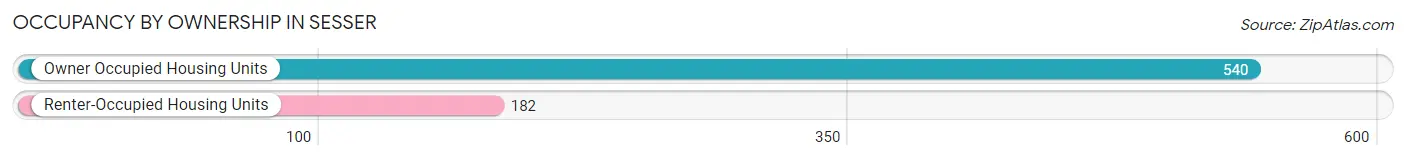
| Occupancy | # Housing Units | % Housing Units |
| Owner Occupied Housing Units | 540 | 74.8% |
| Renter-Occupied Housing Units | 182 | 25.2% |
| Total Occupied Housing Units | 722 | 100.0% |
Occupancy by Household Size in Sesser
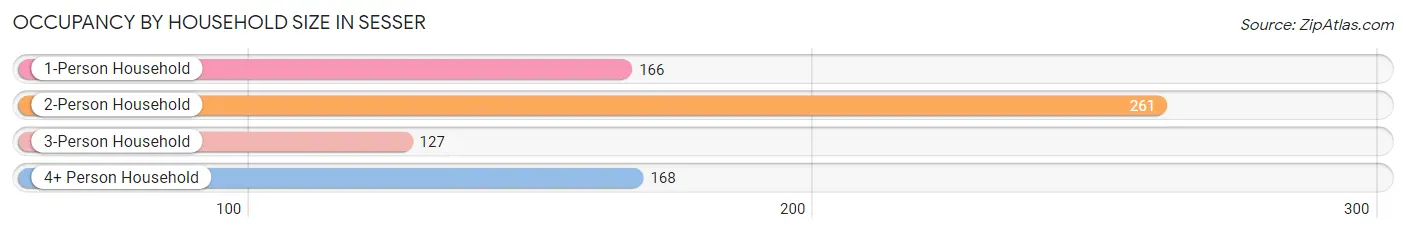
| Household Size | # Housing Units | % Housing Units |
| 1-Person Household | 166 | 23.0% |
| 2-Person Household | 261 | 36.1% |
| 3-Person Household | 127 | 17.6% |
| 4+ Person Household | 168 | 23.3% |
| Total Housing Units | 722 | 100.0% |
Occupancy by Ownership by Household Size in Sesser
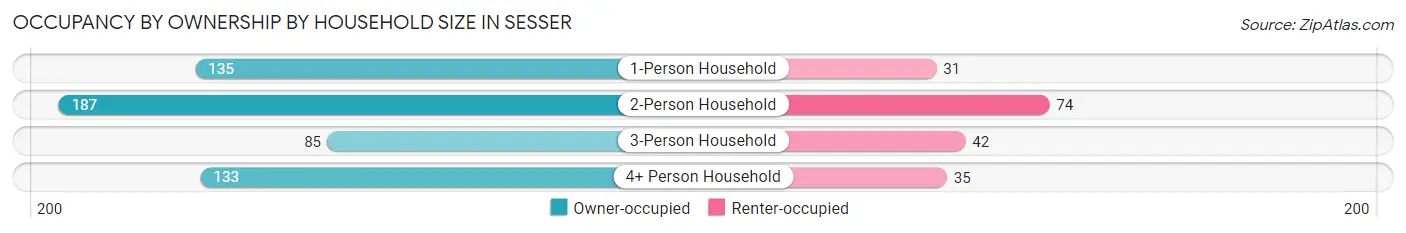
| Household Size | Owner-occupied | Renter-occupied |
| 1-Person Household | 135 (81.3%) | 31 (18.7%) |
| 2-Person Household | 187 (71.7%) | 74 (28.3%) |
| 3-Person Household | 85 (66.9%) | 42 (33.1%) |
| 4+ Person Household | 133 (79.2%) | 35 (20.8%) |
| Total Housing Units | 540 (74.8%) | 182 (25.2%) |
Occupancy by Educational Attainment in Sesser
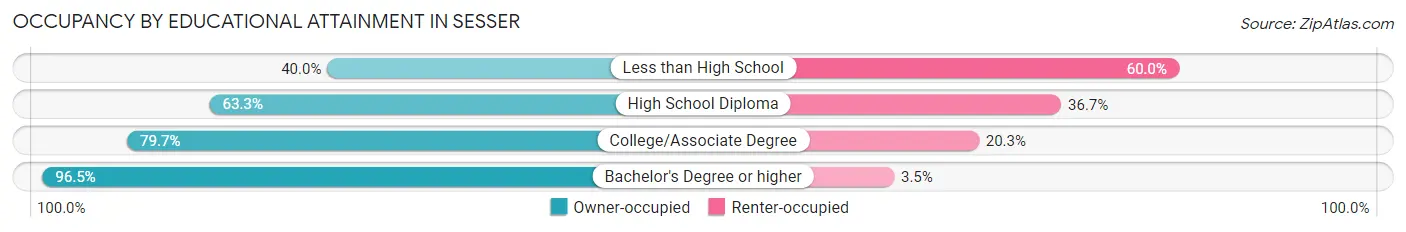
| Household Size | Owner-occupied | Renter-occupied |
| Less than High School | 20 (40.0%) | 30 (60.0%) |
| High School Diploma | 133 (63.3%) | 77 (36.7%) |
| College/Associate Degree | 278 (79.7%) | 71 (20.3%) |
| Bachelor's Degree or higher | 109 (96.5%) | 4 (3.5%) |
Occupancy by Age of Householder in Sesser
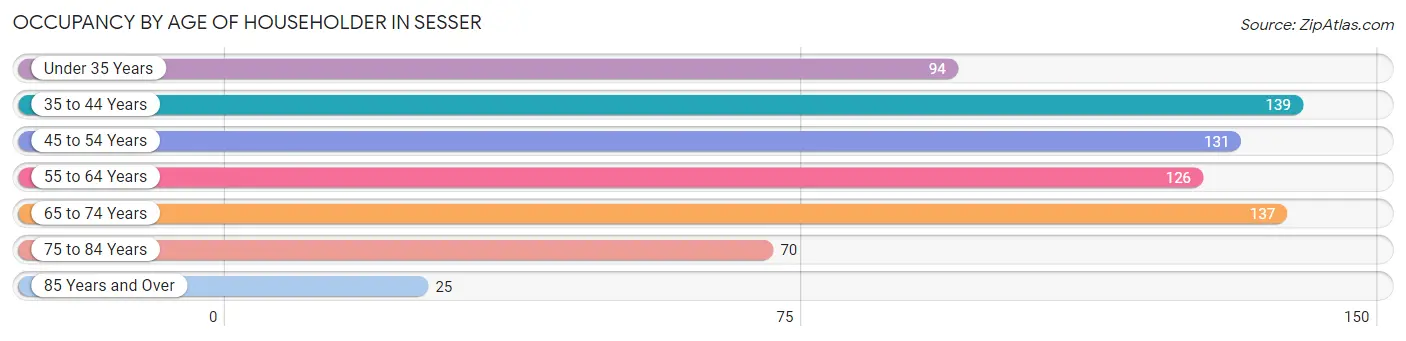
| Age Bracket | # Households | % Households |
| Under 35 Years | 94 | 13.0% |
| 35 to 44 Years | 139 | 19.3% |
| 45 to 54 Years | 131 | 18.1% |
| 55 to 64 Years | 126 | 17.4% |
| 65 to 74 Years | 137 | 19.0% |
| 75 to 84 Years | 70 | 9.7% |
| 85 Years and Over | 25 | 3.5% |
| Total | 722 | 100.0% |
Housing Finances in Sesser
Median Income by Occupancy in Sesser
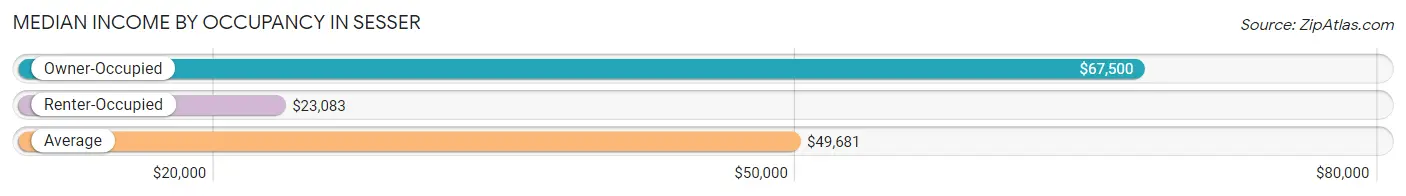
| Occupancy Type | # Households | Median Income |
| Owner-Occupied | 540 (74.8%) | $67,500 |
| Renter-Occupied | 182 (25.2%) | $23,083 |
| Average | 722 (100.0%) | $49,681 |
Occupancy by Householder Income Bracket in Sesser
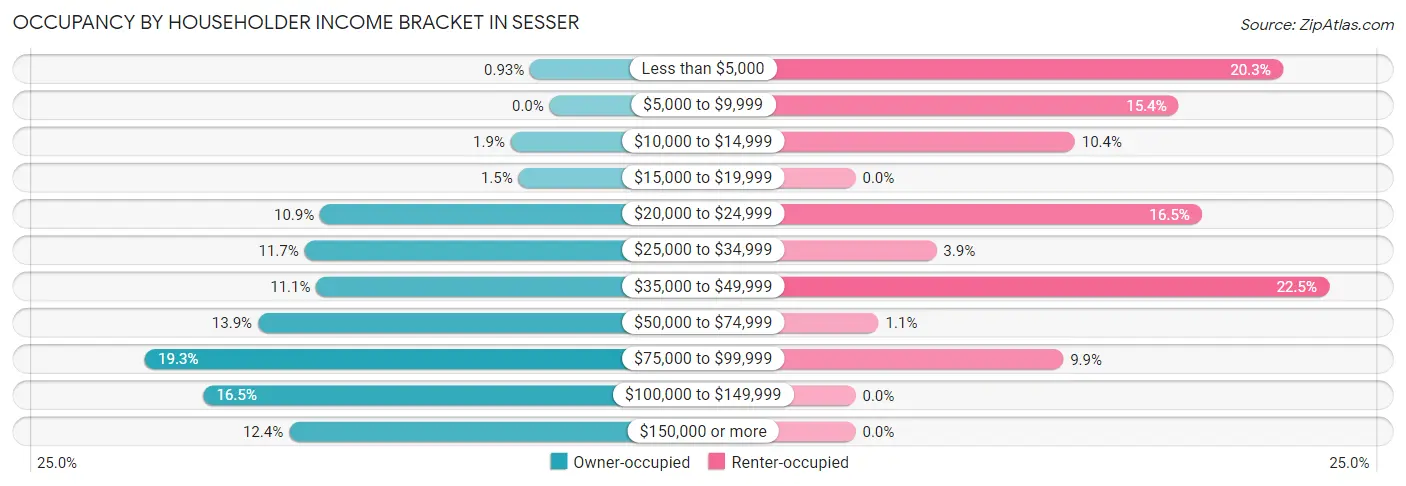
| Income Bracket | Owner-occupied | Renter-occupied |
| Less than $5,000 | 5 (0.9%) | 37 (20.3%) |
| $5,000 to $9,999 | 0 (0.0%) | 28 (15.4%) |
| $10,000 to $14,999 | 10 (1.8%) | 19 (10.4%) |
| $15,000 to $19,999 | 8 (1.5%) | 0 (0.0%) |
| $20,000 to $24,999 | 59 (10.9%) | 30 (16.5%) |
| $25,000 to $34,999 | 63 (11.7%) | 7 (3.8%) |
| $35,000 to $49,999 | 60 (11.1%) | 41 (22.5%) |
| $50,000 to $74,999 | 75 (13.9%) | 2 (1.1%) |
| $75,000 to $99,999 | 104 (19.3%) | 18 (9.9%) |
| $100,000 to $149,999 | 89 (16.5%) | 0 (0.0%) |
| $150,000 or more | 67 (12.4%) | 0 (0.0%) |
| Total | 540 (100.0%) | 182 (100.0%) |
Monthly Housing Cost Tiers in Sesser
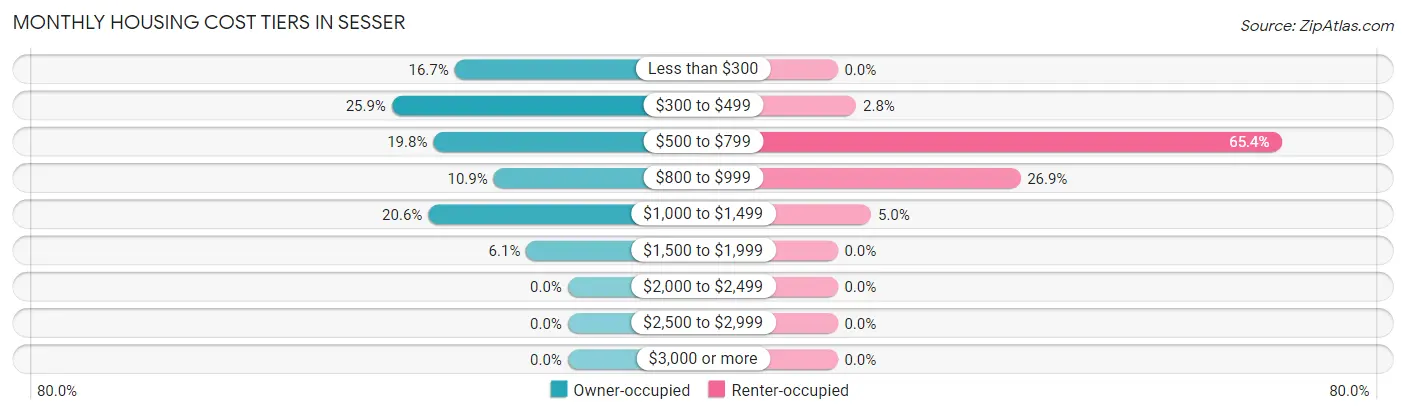
| Monthly Cost | Owner-occupied | Renter-occupied |
| Less than $300 | 90 (16.7%) | 0 (0.0%) |
| $300 to $499 | 140 (25.9%) | 5 (2.8%) |
| $500 to $799 | 107 (19.8%) | 119 (65.4%) |
| $800 to $999 | 59 (10.9%) | 49 (26.9%) |
| $1,000 to $1,499 | 111 (20.6%) | 9 (5.0%) |
| $1,500 to $1,999 | 33 (6.1%) | 0 (0.0%) |
| $2,000 to $2,499 | 0 (0.0%) | 0 (0.0%) |
| $2,500 to $2,999 | 0 (0.0%) | 0 (0.0%) |
| $3,000 or more | 0 (0.0%) | 0 (0.0%) |
| Total | 540 (100.0%) | 182 (100.0%) |
Physical Housing Characteristics in Sesser
Housing Structures in Sesser
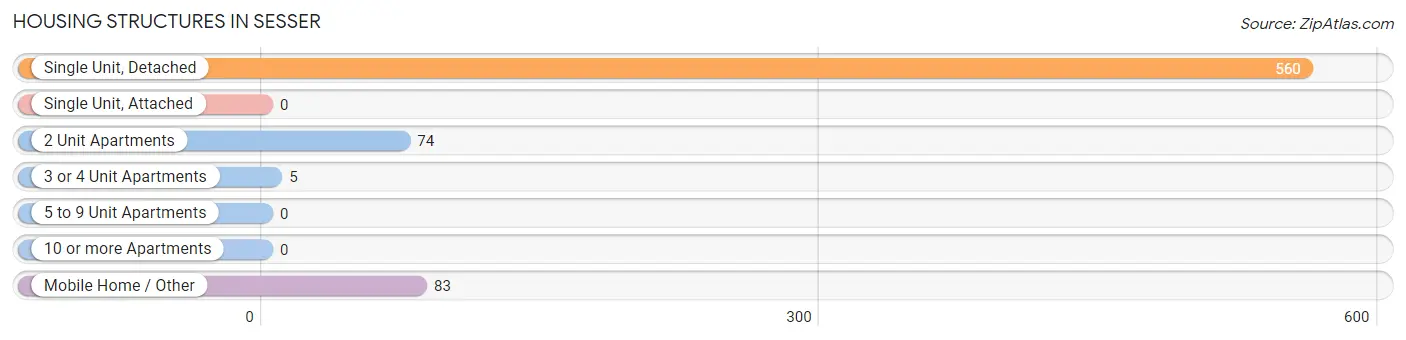
| Structure Type | # Housing Units | % Housing Units |
| Single Unit, Detached | 560 | 77.6% |
| Single Unit, Attached | 0 | 0.0% |
| 2 Unit Apartments | 74 | 10.2% |
| 3 or 4 Unit Apartments | 5 | 0.7% |
| 5 to 9 Unit Apartments | 0 | 0.0% |
| 10 or more Apartments | 0 | 0.0% |
| Mobile Home / Other | 83 | 11.5% |
| Total | 722 | 100.0% |
Housing Structures by Occupancy in Sesser
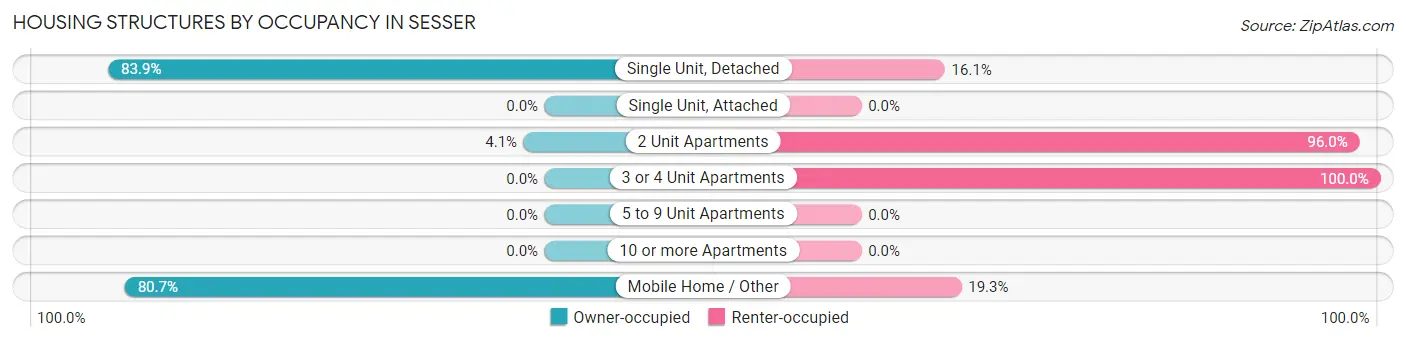
| Structure Type | Owner-occupied | Renter-occupied |
| Single Unit, Detached | 470 (83.9%) | 90 (16.1%) |
| Single Unit, Attached | 0 (0.0%) | 0 (0.0%) |
| 2 Unit Apartments | 3 (4.1%) | 71 (96.0%) |
| 3 or 4 Unit Apartments | 0 (0.0%) | 5 (100.0%) |
| 5 to 9 Unit Apartments | 0 (0.0%) | 0 (0.0%) |
| 10 or more Apartments | 0 (0.0%) | 0 (0.0%) |
| Mobile Home / Other | 67 (80.7%) | 16 (19.3%) |
| Total | 540 (74.8%) | 182 (25.2%) |
Housing Structures by Number of Rooms in Sesser
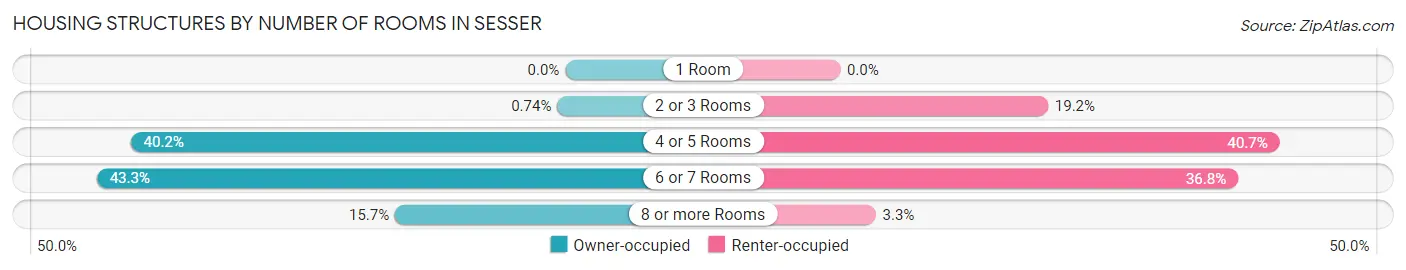
| Number of Rooms | Owner-occupied | Renter-occupied |
| 1 Room | 0 (0.0%) | 0 (0.0%) |
| 2 or 3 Rooms | 4 (0.7%) | 35 (19.2%) |
| 4 or 5 Rooms | 217 (40.2%) | 74 (40.7%) |
| 6 or 7 Rooms | 234 (43.3%) | 67 (36.8%) |
| 8 or more Rooms | 85 (15.7%) | 6 (3.3%) |
| Total | 540 (100.0%) | 182 (100.0%) |
Housing Structure by Heating Type in Sesser
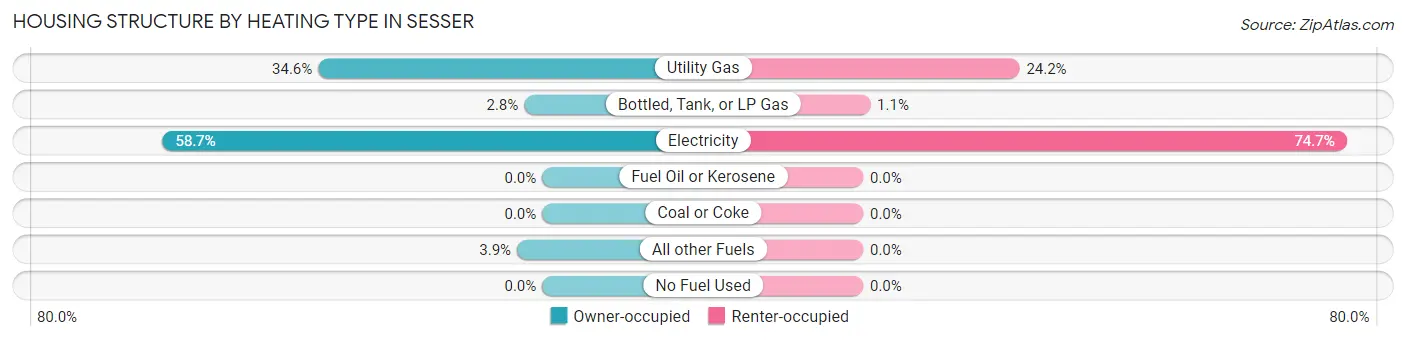
| Heating Type | Owner-occupied | Renter-occupied |
| Utility Gas | 187 (34.6%) | 44 (24.2%) |
| Bottled, Tank, or LP Gas | 15 (2.8%) | 2 (1.1%) |
| Electricity | 317 (58.7%) | 136 (74.7%) |
| Fuel Oil or Kerosene | 0 (0.0%) | 0 (0.0%) |
| Coal or Coke | 0 (0.0%) | 0 (0.0%) |
| All other Fuels | 21 (3.9%) | 0 (0.0%) |
| No Fuel Used | 0 (0.0%) | 0 (0.0%) |
| Total | 540 (100.0%) | 182 (100.0%) |
Household Vehicle Usage in Sesser
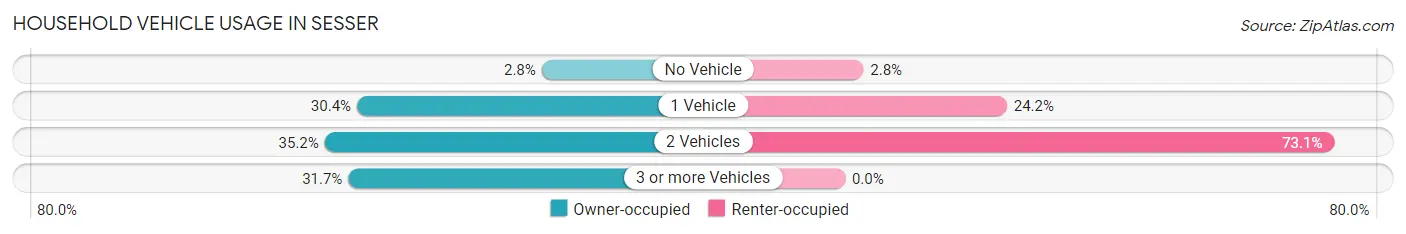
| Vehicles per Household | Owner-occupied | Renter-occupied |
| No Vehicle | 15 (2.8%) | 5 (2.8%) |
| 1 Vehicle | 164 (30.4%) | 44 (24.2%) |
| 2 Vehicles | 190 (35.2%) | 133 (73.1%) |
| 3 or more Vehicles | 171 (31.7%) | 0 (0.0%) |
| Total | 540 (100.0%) | 182 (100.0%) |
Real Estate & Mortgages in Sesser
Real Estate and Mortgage Overview in Sesser
| Characteristic | Without Mortgage | With Mortgage |
| Housing Units | 306 | 234 |
| Median Property Value | $84,400 | $79,600 |
| Median Household Income | $64,239 | $25 |
| Monthly Housing Costs | $404 | $0 |
| Real Estate Taxes | $1,216 | $5 |
Property Value by Mortgage Status in Sesser
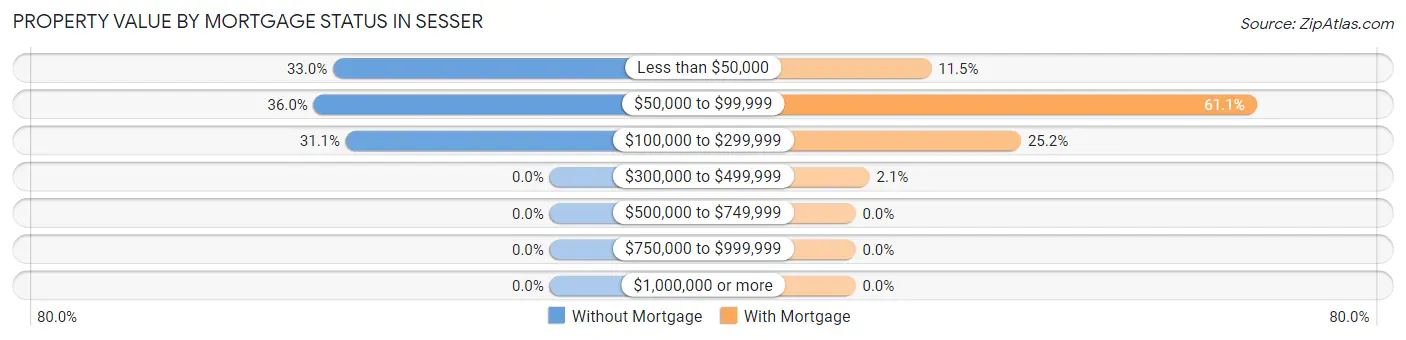
| Property Value | Without Mortgage | With Mortgage |
| Less than $50,000 | 101 (33.0%) | 27 (11.5%) |
| $50,000 to $99,999 | 110 (35.9%) | 143 (61.1%) |
| $100,000 to $299,999 | 95 (31.0%) | 59 (25.2%) |
| $300,000 to $499,999 | 0 (0.0%) | 5 (2.1%) |
| $500,000 to $749,999 | 0 (0.0%) | 0 (0.0%) |
| $750,000 to $999,999 | 0 (0.0%) | 0 (0.0%) |
| $1,000,000 or more | 0 (0.0%) | 0 (0.0%) |
| Total | 306 (100.0%) | 234 (100.0%) |
Household Income by Mortgage Status in Sesser
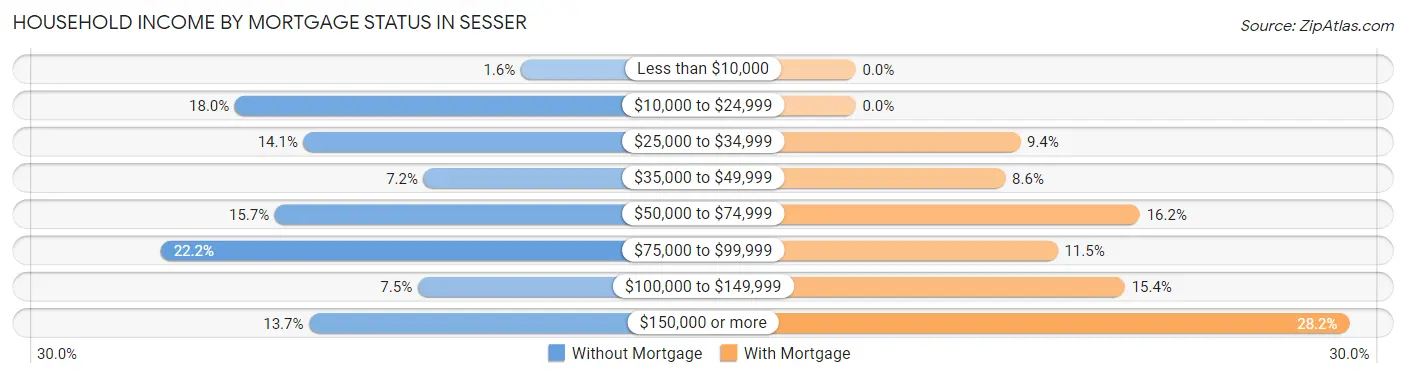
| Household Income | Without Mortgage | With Mortgage |
| Less than $10,000 | 5 (1.6%) | 0 (0.0%) |
| $10,000 to $24,999 | 55 (18.0%) | 0 (0.0%) |
| $25,000 to $34,999 | 43 (14.1%) | 22 (9.4%) |
| $35,000 to $49,999 | 22 (7.2%) | 20 (8.6%) |
| $50,000 to $74,999 | 48 (15.7%) | 38 (16.2%) |
| $75,000 to $99,999 | 68 (22.2%) | 27 (11.5%) |
| $100,000 to $149,999 | 23 (7.5%) | 36 (15.4%) |
| $150,000 or more | 42 (13.7%) | 66 (28.2%) |
| Total | 306 (100.0%) | 234 (100.0%) |
Property Value to Household Income Ratio in Sesser
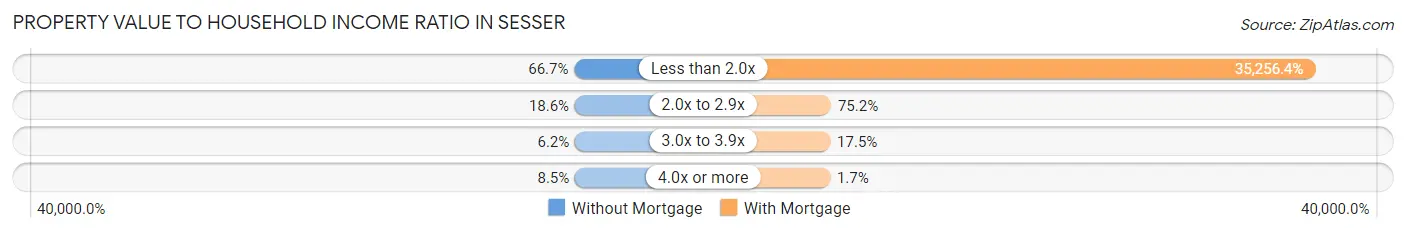
| Value-to-Income Ratio | Without Mortgage | With Mortgage |
| Less than 2.0x | 204 (66.7%) | 82,500 (35,256.4%) |
| 2.0x to 2.9x | 57 (18.6%) | 176 (75.2%) |
| 3.0x to 3.9x | 19 (6.2%) | 41 (17.5%) |
| 4.0x or more | 26 (8.5%) | 4 (1.7%) |
| Total | 306 (100.0%) | 234 (100.0%) |
Real Estate Taxes by Mortgage Status in Sesser
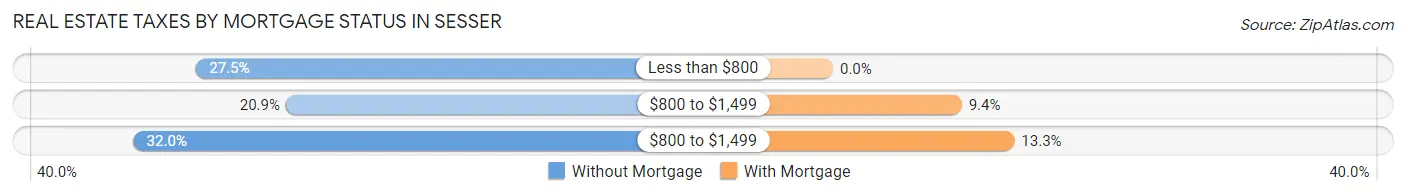
| Property Taxes | Without Mortgage | With Mortgage |
| Less than $800 | 84 (27.5%) | 0 (0.0%) |
| $800 to $1,499 | 64 (20.9%) | 22 (9.4%) |
| $800 to $1,499 | 98 (32.0%) | 31 (13.3%) |
| Total | 306 (100.0%) | 234 (100.0%) |
Health & Disability in Sesser
Health Insurance Coverage by Age in Sesser

| Age Bracket | With Coverage | Without Coverage |
| Under 6 Years | 114 (93.4%) | 8 (6.6%) |
| 6 to 18 Years | 366 (95.3%) | 18 (4.7%) |
| 19 to 25 Years | 121 (78.1%) | 34 (21.9%) |
| 26 to 34 Years | 162 (95.3%) | 8 (4.7%) |
| 35 to 44 Years | 248 (96.5%) | 9 (3.5%) |
| 45 to 54 Years | 280 (100.0%) | 0 (0.0%) |
| 55 to 64 Years | 203 (80.6%) | 49 (19.4%) |
| 65 to 74 Years | 167 (100.0%) | 0 (0.0%) |
| 75 Years and older | 122 (100.0%) | 0 (0.0%) |
| Total | 1,783 (93.4%) | 126 (6.6%) |
Health Insurance Coverage by Citizenship Status in Sesser
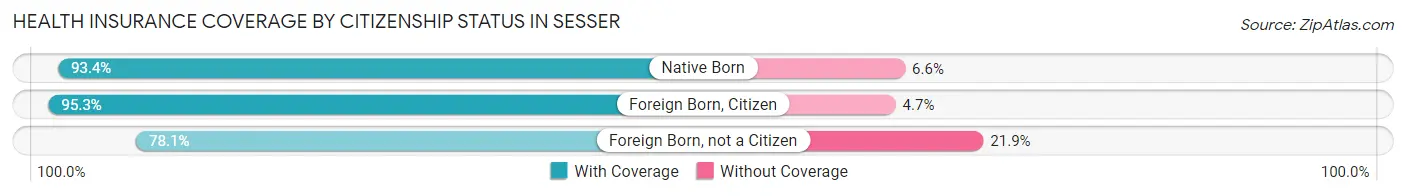
| Citizenship Status | With Coverage | Without Coverage |
| Native Born | 114 (93.4%) | 8 (6.6%) |
| Foreign Born, Citizen | 366 (95.3%) | 18 (4.7%) |
| Foreign Born, not a Citizen | 121 (78.1%) | 34 (21.9%) |
Health Insurance Coverage by Household Income in Sesser
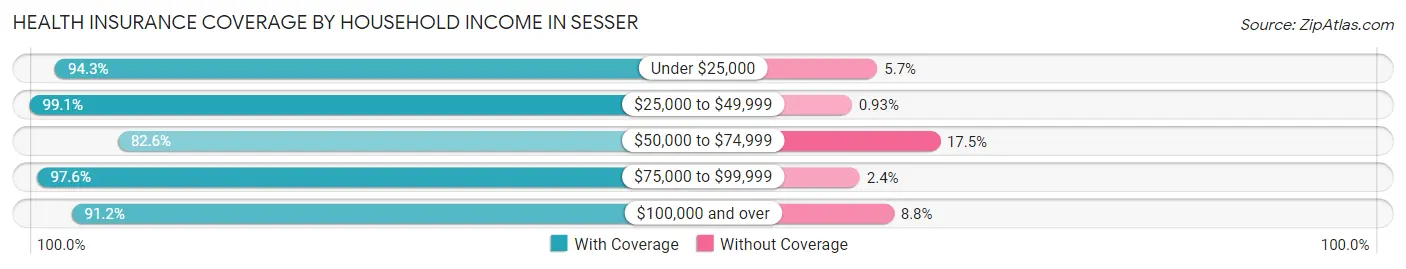
| Household Income | With Coverage | Without Coverage |
| Under $25,000 | 428 (94.3%) | 26 (5.7%) |
| $25,000 to $49,999 | 321 (99.1%) | 3 (0.9%) |
| $50,000 to $74,999 | 175 (82.6%) | 37 (17.4%) |
| $75,000 to $99,999 | 320 (97.6%) | 8 (2.4%) |
| $100,000 and over | 539 (91.2%) | 52 (8.8%) |
Public vs Private Health Insurance Coverage by Age in Sesser
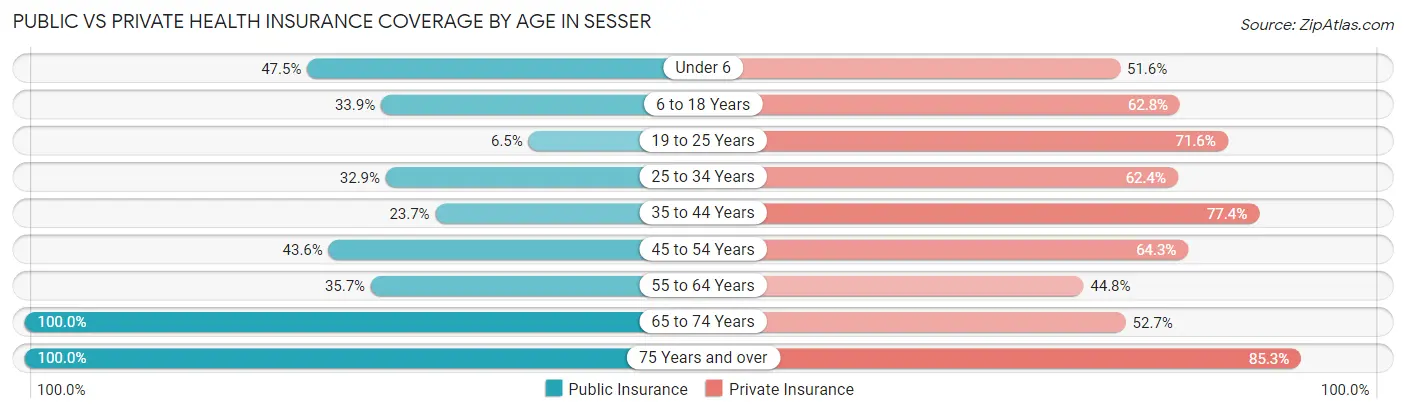
| Age Bracket | Public Insurance | Private Insurance |
| Under 6 | 58 (47.5%) | 63 (51.6%) |
| 6 to 18 Years | 130 (33.9%) | 241 (62.8%) |
| 19 to 25 Years | 10 (6.5%) | 111 (71.6%) |
| 25 to 34 Years | 56 (32.9%) | 106 (62.4%) |
| 35 to 44 Years | 61 (23.7%) | 199 (77.4%) |
| 45 to 54 Years | 122 (43.6%) | 180 (64.3%) |
| 55 to 64 Years | 90 (35.7%) | 113 (44.8%) |
| 65 to 74 Years | 167 (100.0%) | 88 (52.7%) |
| 75 Years and over | 122 (100.0%) | 104 (85.3%) |
| Total | 816 (42.7%) | 1,205 (63.1%) |
Disability Status by Sex by Age in Sesser
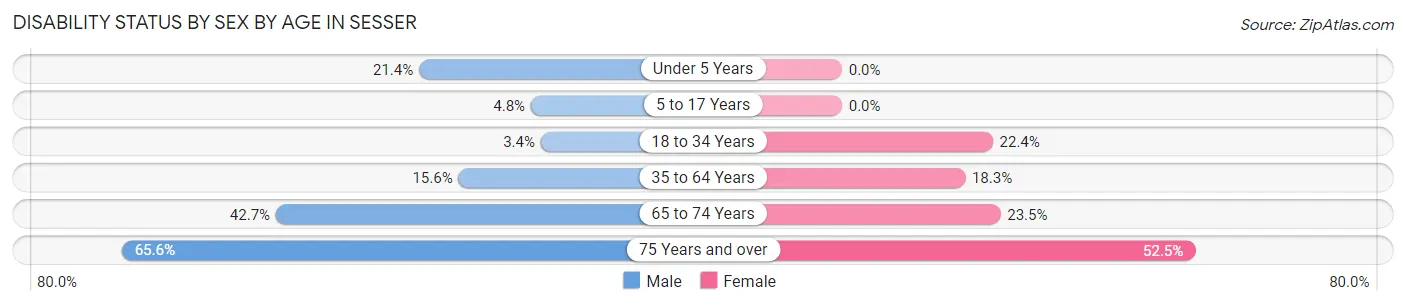
| Age Bracket | Male | Female |
| Under 5 Years | 6 (21.4%) | 0 (0.0%) |
| 5 to 17 Years | 10 (4.8%) | 0 (0.0%) |
| 18 to 34 Years | 6 (3.4%) | 45 (22.4%) |
| 35 to 64 Years | 59 (15.6%) | 75 (18.3%) |
| 65 to 74 Years | 35 (42.7%) | 20 (23.5%) |
| 75 Years and over | 40 (65.6%) | 32 (52.5%) |
Disability Class by Sex by Age in Sesser
Disability Class: Hearing Difficulty
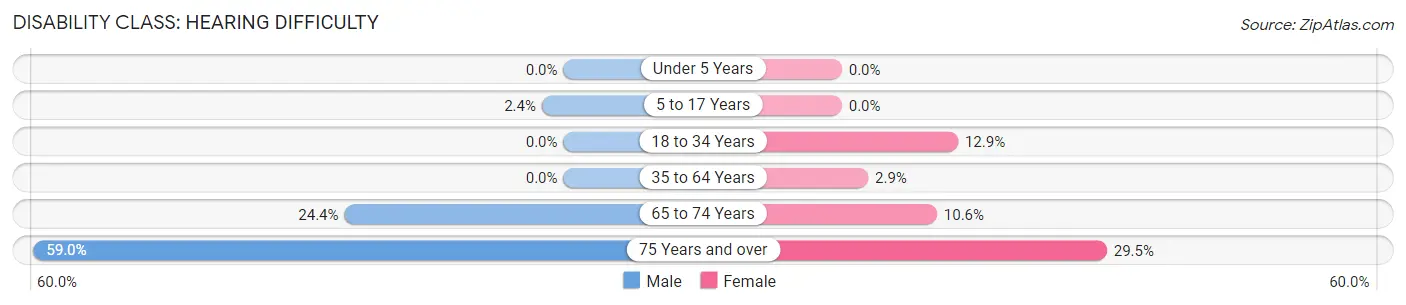
| Age Bracket | Male | Female |
| Under 5 Years | 0 (0.0%) | 0 (0.0%) |
| 5 to 17 Years | 5 (2.4%) | 0 (0.0%) |
| 18 to 34 Years | 0 (0.0%) | 26 (12.9%) |
| 35 to 64 Years | 0 (0.0%) | 12 (2.9%) |
| 65 to 74 Years | 20 (24.4%) | 9 (10.6%) |
| 75 Years and over | 36 (59.0%) | 18 (29.5%) |
Disability Class: Vision Difficulty
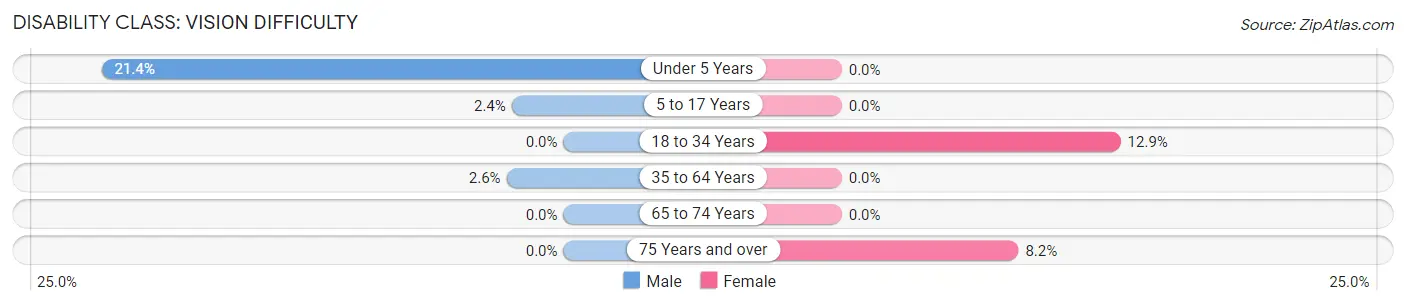
| Age Bracket | Male | Female |
| Under 5 Years | 6 (21.4%) | 0 (0.0%) |
| 5 to 17 Years | 5 (2.4%) | 0 (0.0%) |
| 18 to 34 Years | 0 (0.0%) | 26 (12.9%) |
| 35 to 64 Years | 10 (2.6%) | 0 (0.0%) |
| 65 to 74 Years | 0 (0.0%) | 0 (0.0%) |
| 75 Years and over | 0 (0.0%) | 5 (8.2%) |
Disability Class: Cognitive Difficulty
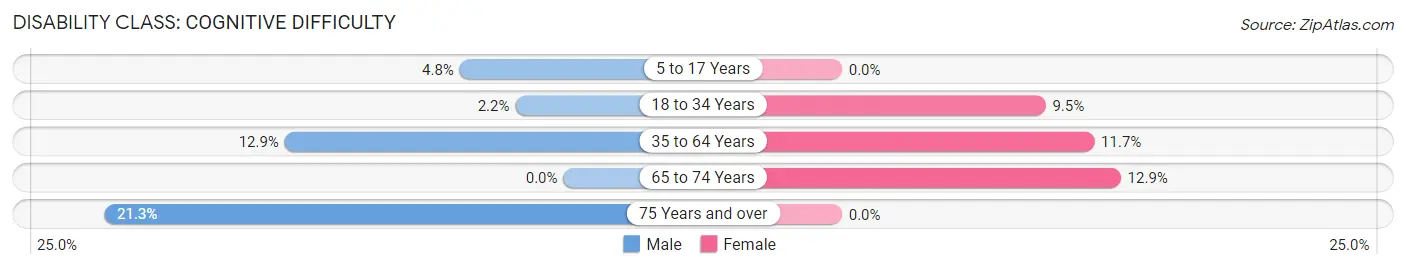
| Age Bracket | Male | Female |
| 5 to 17 Years | 10 (4.8%) | 0 (0.0%) |
| 18 to 34 Years | 4 (2.2%) | 19 (9.5%) |
| 35 to 64 Years | 49 (12.9%) | 48 (11.7%) |
| 65 to 74 Years | 0 (0.0%) | 11 (12.9%) |
| 75 Years and over | 13 (21.3%) | 0 (0.0%) |
Disability Class: Ambulatory Difficulty
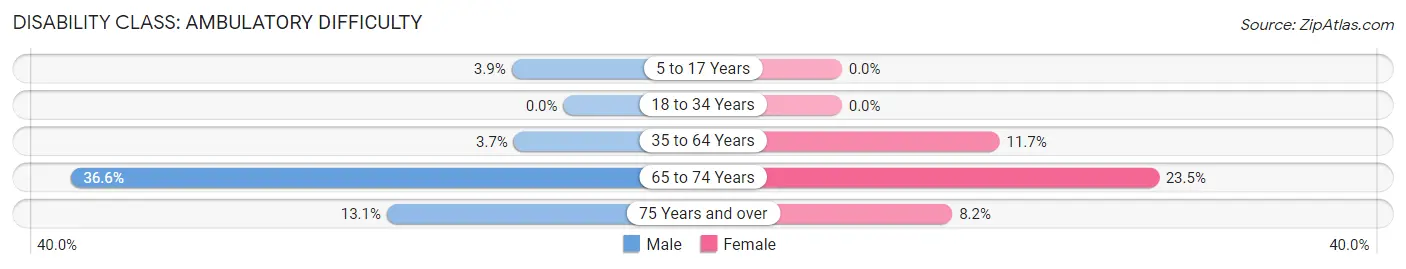
| Age Bracket | Male | Female |
| 5 to 17 Years | 8 (3.8%) | 0 (0.0%) |
| 18 to 34 Years | 0 (0.0%) | 0 (0.0%) |
| 35 to 64 Years | 14 (3.7%) | 48 (11.7%) |
| 65 to 74 Years | 30 (36.6%) | 20 (23.5%) |
| 75 Years and over | 8 (13.1%) | 5 (8.2%) |
Disability Class: Self-Care Difficulty
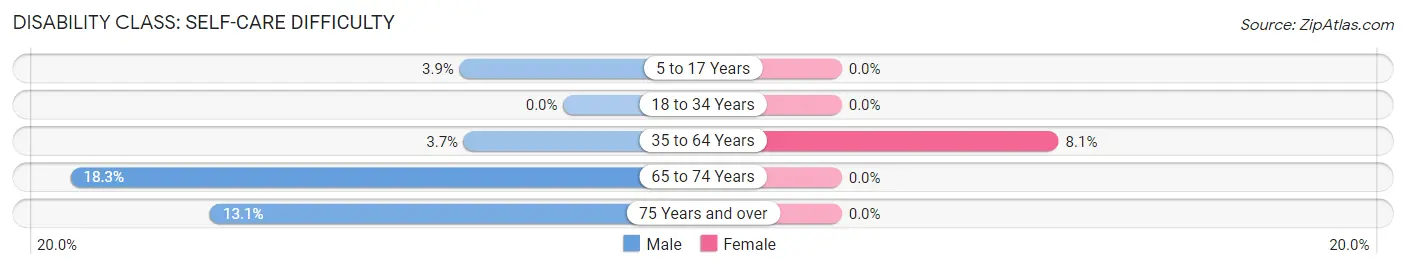
| Age Bracket | Male | Female |
| 5 to 17 Years | 8 (3.8%) | 0 (0.0%) |
| 18 to 34 Years | 0 (0.0%) | 0 (0.0%) |
| 35 to 64 Years | 14 (3.7%) | 33 (8.1%) |
| 65 to 74 Years | 15 (18.3%) | 0 (0.0%) |
| 75 Years and over | 8 (13.1%) | 0 (0.0%) |
Technology Access in Sesser
Computing Device Access in Sesser
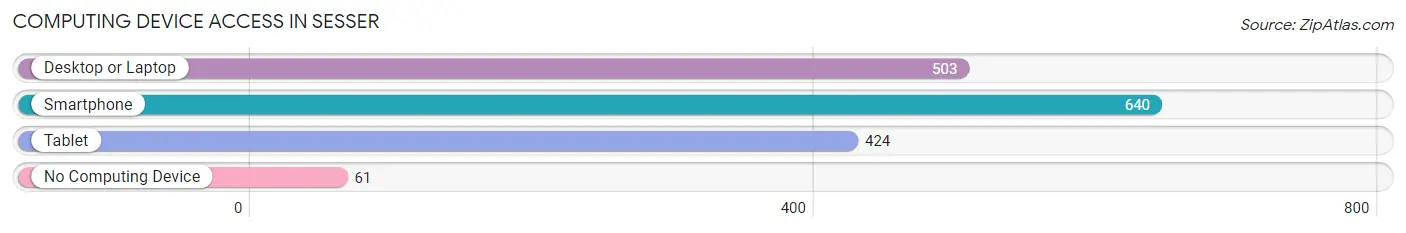
| Device Type | # Households | % Households |
| Desktop or Laptop | 503 | 69.7% |
| Smartphone | 640 | 88.6% |
| Tablet | 424 | 58.7% |
| No Computing Device | 61 | 8.5% |
| Total | 722 | 100.0% |
Internet Access in Sesser
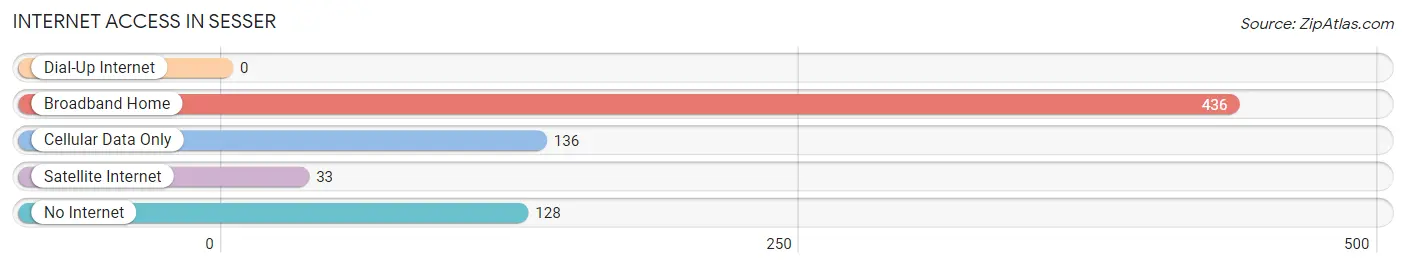
| Internet Type | # Households | % Households |
| Dial-Up Internet | 0 | 0.0% |
| Broadband Home | 436 | 60.4% |
| Cellular Data Only | 136 | 18.8% |
| Satellite Internet | 33 | 4.6% |
| No Internet | 128 | 17.7% |
| Total | 722 | 100.0% |
Sesser Summary
Sesser is a small city located in Franklin County, Illinois. It is situated in the southern part of the state, about 50 miles east of St. Louis, Missouri. The city has a population of 2,128 people, according to the 2010 census.
Geography
Sesser is located in the southeastern part of Franklin County, Illinois. It is situated in the southern part of the state, about 50 miles east of St. Louis, Missouri. The city is located on the banks of the Big Muddy River, which flows through the city. The city is surrounded by rolling hills and farmland. The climate in Sesser is humid continental, with hot summers and cold winters.
Economy
Sesser’s economy is largely based on agriculture and manufacturing. The city is home to several large manufacturing companies, including Sesser Manufacturing, which produces a variety of products, including automotive parts, furniture, and appliances. The city is also home to several small businesses, including restaurants, retail stores, and service providers.
Demographics
According to the 2010 census, Sesser has a population of 2,128 people. The population is predominantly white, with a small percentage of African Americans and Hispanics. The median household income in Sesser is $37,917, and the median age is 41. The city has a high rate of poverty, with 24.3% of the population living below the poverty line.
History
Sesser was founded in 1883 by William Sesser, a local businessman. The city was originally known as Sesser Station, and was a stop on the Cairo and St. Louis Railroad. The city was incorporated in 1891, and the name was changed to Sesser. The city grew rapidly in the early 20th century, and by the 1950s, it had become a major industrial center. The city’s economy declined in the late 20th century, but it has since seen a resurgence in recent years.
Sesser is a small city with a rich history and a bright future. It is home to a diverse population and a thriving economy. The city is a great place to live, work, and play, and is a great example of the American Dream.
Common Questions
What is Per Capita Income in Sesser?
Per Capita income in Sesser is $25,028.
What is the Median Family Income in Sesser?
Median Family Income in Sesser is $61,250.
What is the Median Household income in Sesser?
Median Household Income in Sesser is $49,681.
What is Income or Wage Gap in Sesser?
Income or Wage Gap in Sesser is 21.8%.
Women in Sesser earn 78.2 cents for every dollar earned by a man.
What is Inequality or Gini Index in Sesser?
Inequality or Gini Index in Sesser is 0.43.
What is the Total Population of Sesser?
Total Population of Sesser is 1,909.
What is the Total Male Population of Sesser?
Total Male Population of Sesser is 937.
What is the Total Female Population of Sesser?
Total Female Population of Sesser is 972.
What is the Ratio of Males per 100 Females in Sesser?
There are 96.40 Males per 100 Females in Sesser.
What is the Ratio of Females per 100 Males in Sesser?
There are 103.74 Females per 100 Males in Sesser.
What is the Median Population Age in Sesser?
Median Population Age in Sesser is 38.6 Years.
What is the Average Family Size in Sesser
Average Family Size in Sesser is 3.1 People.
What is the Average Household Size in Sesser
Average Household Size in Sesser is 2.6 People.
How Large is the Labor Force in Sesser?
There are 852 People in the Labor Forcein in Sesser.
What is the Percentage of People in the Labor Force in Sesser?
56.3% of People are in the Labor Force in Sesser.
What is the Unemployment Rate in Sesser?
Unemployment Rate in Sesser is 9.5%.