Prairie City, IL Map & Demographics
Prairie City Map
Prairie City Overview
$22,454
PER CAPITA INCOME
$67,656
AVG FAMILY INCOME
$39,167
AVG HOUSEHOLD INCOME
34.9%
WAGE / INCOME GAP [ % ]
65.1¢/ $1
WAGE / INCOME GAP [ $ ]
0.41
INEQUALITY / GINI INDEX
349
TOTAL POPULATION
161
MALE POPULATION
188
FEMALE POPULATION
85.64
MALES / 100 FEMALES
116.77
FEMALES / 100 MALES
51.3
MEDIAN AGE
3.0
AVG FAMILY SIZE
2.3
AVG HOUSEHOLD SIZE
140
LABOR FORCE [ PEOPLE ]
48.6%
PERCENT IN LABOR FORCE
2.1%
UNEMPLOYMENT RATE
Prairie City Zip Codes
Prairie City Area Codes
Income in Prairie City
Income Overview in Prairie City
Per Capita Income in Prairie City is $22,454, while median incomes of families and households are $67,656 and $39,167 respectively.
| Characteristic | Number | Measure |
| Per Capita Income | 349 | $22,454 |
| Median Family Income | 91 | $67,656 |
| Mean Family Income | 91 | $65,220 |
| Median Household Income | 144 | $39,167 |
| Mean Household Income | 144 | $50,067 |
| Income Deficit | 91 | $0 |
| Wage / Income Gap (%) | 349 | 34.92% |
| Wage / Income Gap ($) | 349 | 65.08¢ per $1 |
| Gini / Inequality Index | 349 | 0.41 |
Earnings by Sex in Prairie City
Average Earnings in Prairie City are $36,500, $48,500 for men and $31,563 for women, a difference of 34.9%.
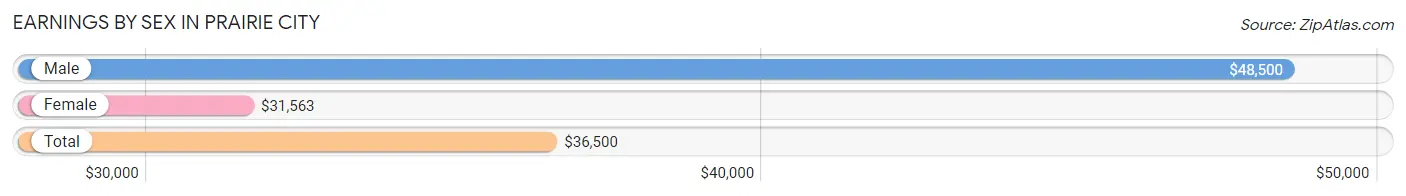
| Sex | Number | Average Earnings |
| Male | 74 (51.4%) | $48,500 |
| Female | 70 (48.6%) | $31,563 |
| Total | 144 (100.0%) | $36,500 |
Earnings by Sex by Income Bracket in Prairie City
The most common earnings brackets in Prairie City are $50,000 to $54,999 for men (12 | 16.2%) and $30,000 to $34,999 for women (13 | 18.6%).
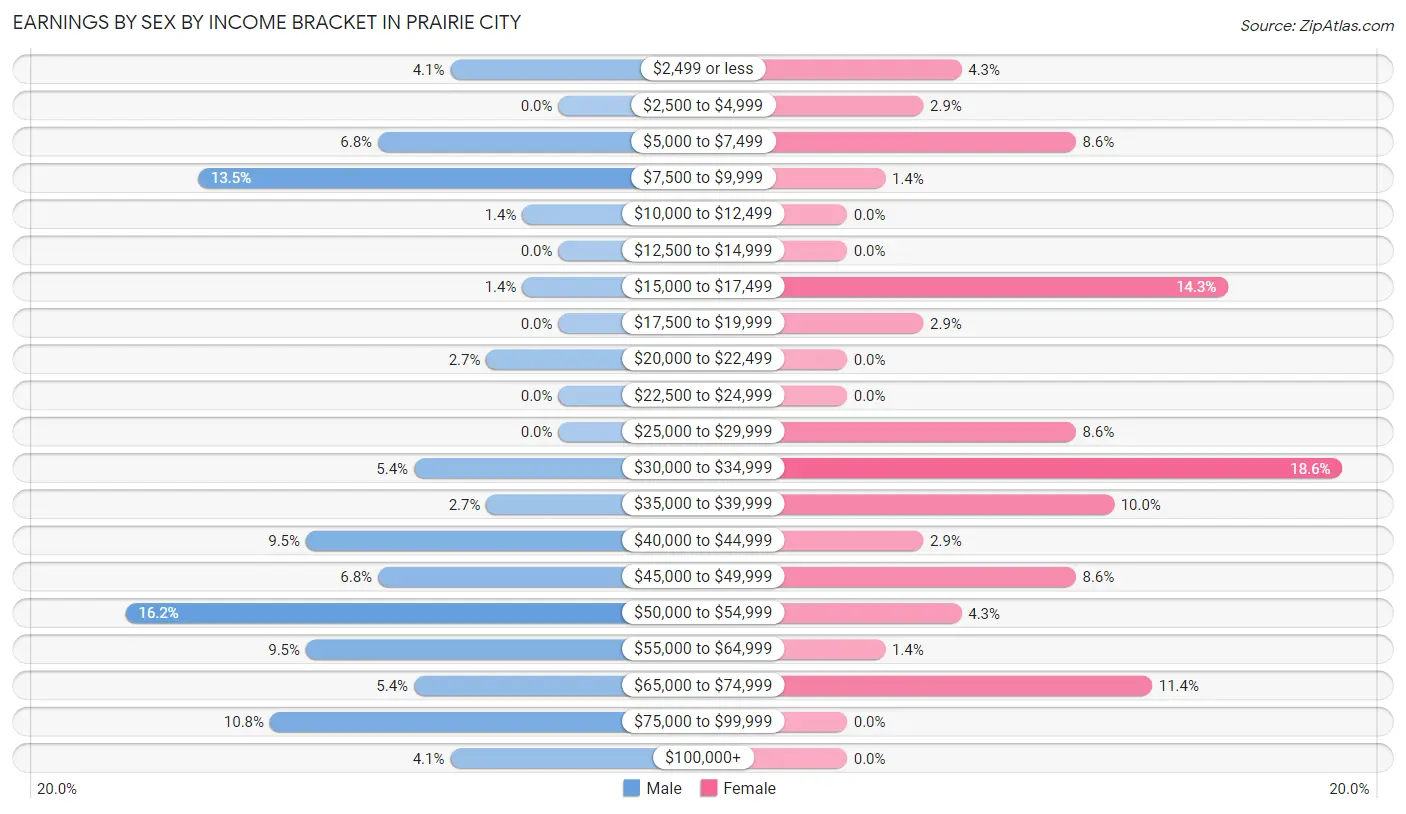
| Income | Male | Female |
| $2,499 or less | 3 (4.1%) | 3 (4.3%) |
| $2,500 to $4,999 | 0 (0.0%) | 2 (2.9%) |
| $5,000 to $7,499 | 5 (6.8%) | 6 (8.6%) |
| $7,500 to $9,999 | 10 (13.5%) | 1 (1.4%) |
| $10,000 to $12,499 | 1 (1.3%) | 0 (0.0%) |
| $12,500 to $14,999 | 0 (0.0%) | 0 (0.0%) |
| $15,000 to $17,499 | 1 (1.3%) | 10 (14.3%) |
| $17,500 to $19,999 | 0 (0.0%) | 2 (2.9%) |
| $20,000 to $22,499 | 2 (2.7%) | 0 (0.0%) |
| $22,500 to $24,999 | 0 (0.0%) | 0 (0.0%) |
| $25,000 to $29,999 | 0 (0.0%) | 6 (8.6%) |
| $30,000 to $34,999 | 4 (5.4%) | 13 (18.6%) |
| $35,000 to $39,999 | 2 (2.7%) | 7 (10.0%) |
| $40,000 to $44,999 | 7 (9.5%) | 2 (2.9%) |
| $45,000 to $49,999 | 5 (6.8%) | 6 (8.6%) |
| $50,000 to $54,999 | 12 (16.2%) | 3 (4.3%) |
| $55,000 to $64,999 | 7 (9.5%) | 1 (1.4%) |
| $65,000 to $74,999 | 4 (5.4%) | 8 (11.4%) |
| $75,000 to $99,999 | 8 (10.8%) | 0 (0.0%) |
| $100,000+ | 3 (4.1%) | 0 (0.0%) |
| Total | 74 (100.0%) | 70 (100.0%) |
Earnings by Sex by Educational Attainment in Prairie City
Average earnings in Prairie City are $50,000 for men and $33,000 for women, a difference of 34.0%. Men with an educational attainment of high school diploma enjoy the highest average annual earnings of $54,063, while those with college or associate's degree education earn the least with $41,429. Women with an educational attainment of college or associate's degree earn the most with the average annual earnings of $37,000, while those with college or associate's degree education have the smallest earnings of $37,000.
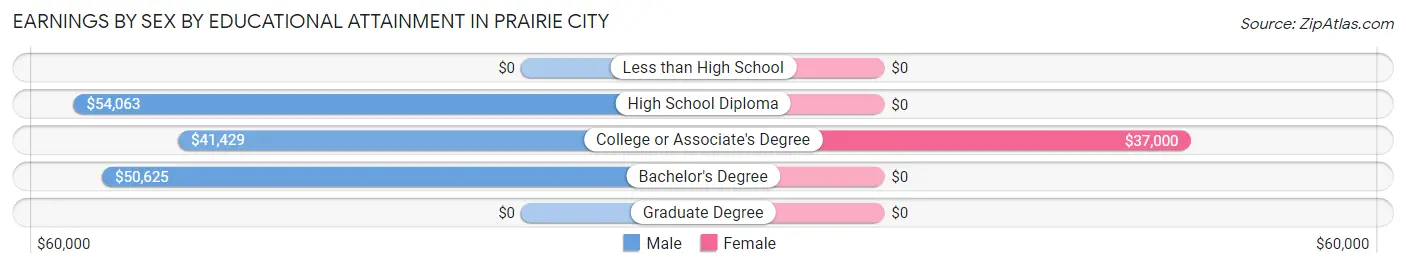
| Educational Attainment | Male Income | Female Income |
| Less than High School | - | - |
| High School Diploma | $54,063 | $0 |
| College or Associate's Degree | $41,429 | $37,000 |
| Bachelor's Degree | $50,625 | $0 |
| Graduate Degree | - | - |
| Total | $50,000 | $33,000 |
Family Income in Prairie City
Family Income Brackets in Prairie City
According to the Prairie City family income data, there are 24 families falling into the $50,000 to $74,999 income range, which is the most common income bracket and makes up 26.4% of all families.
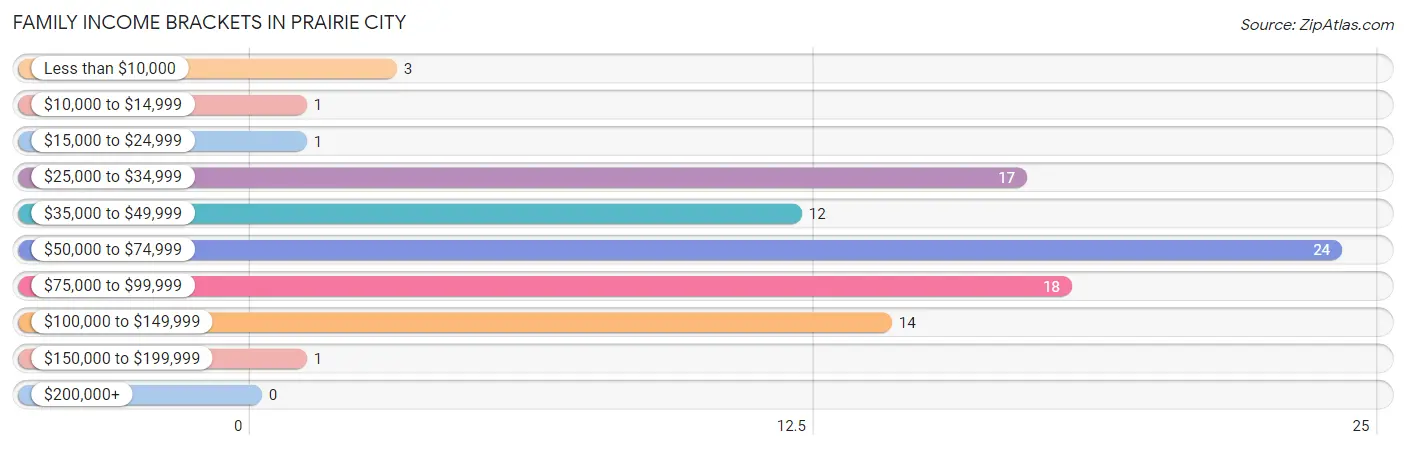
| Income Bracket | # Families | % Families |
| Less than $10,000 | 3 | 3.3% |
| $10,000 to $14,999 | 1 | 1.1% |
| $15,000 to $24,999 | 1 | 1.1% |
| $25,000 to $34,999 | 17 | 18.7% |
| $35,000 to $49,999 | 12 | 13.2% |
| $50,000 to $74,999 | 24 | 26.4% |
| $75,000 to $99,999 | 18 | 19.8% |
| $100,000 to $149,999 | 14 | 15.4% |
| $150,000 to $199,999 | 1 | 1.1% |
| $200,000+ | 0 | 0.0% |
Family Income by Famaliy Size in Prairie City
4-person families (16 | 17.6%) account for the highest median family income in Prairie City with $84,063 per family, while 2-person families (55 | 60.4%) have the highest median income of $29,625 per family member.
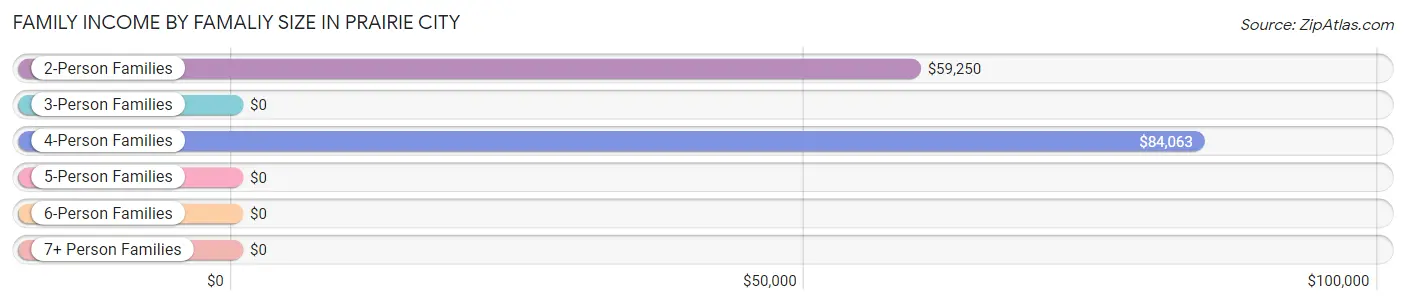
| Income Bracket | # Families | Median Income |
| 2-Person Families | 55 (60.4%) | $59,250 |
| 3-Person Families | 10 (11.0%) | $0 |
| 4-Person Families | 16 (17.6%) | $84,063 |
| 5-Person Families | 7 (7.7%) | $0 |
| 6-Person Families | 1 (1.1%) | $0 |
| 7+ Person Families | 2 (2.2%) | $0 |
| Total | 91 (100.0%) | $67,656 |
Family Income by Number of Earners in Prairie City
The median family income in Prairie City is $67,656, with families comprising 3+ earners (4) having the highest median family income of $126,250, while families with no earners (15) have the lowest median family income of $29,250, accounting for 4.4% and 16.5% of families, respectively.
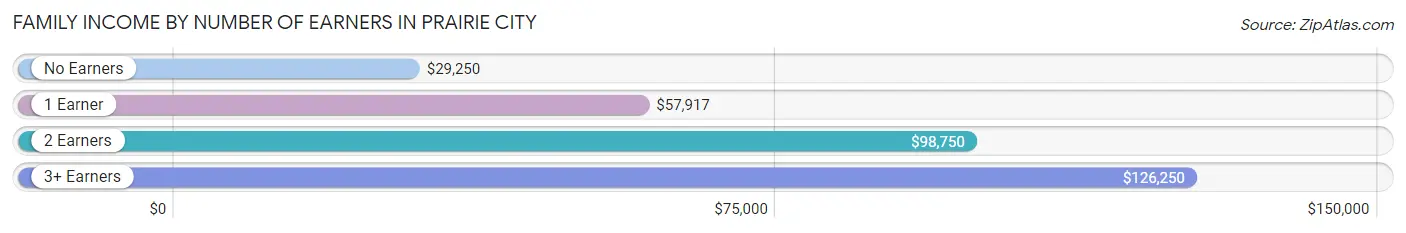
| Number of Earners | # Families | Median Income |
| No Earners | 15 (16.5%) | $29,250 |
| 1 Earner | 47 (51.6%) | $57,917 |
| 2 Earners | 25 (27.5%) | $98,750 |
| 3+ Earners | 4 (4.4%) | $126,250 |
| Total | 91 (100.0%) | $67,656 |
Household Income in Prairie City
Household Income Brackets in Prairie City
With 29 households falling in the category, the $50,000 to $74,999 income range is the most frequent in Prairie City, accounting for 20.1% of all households.
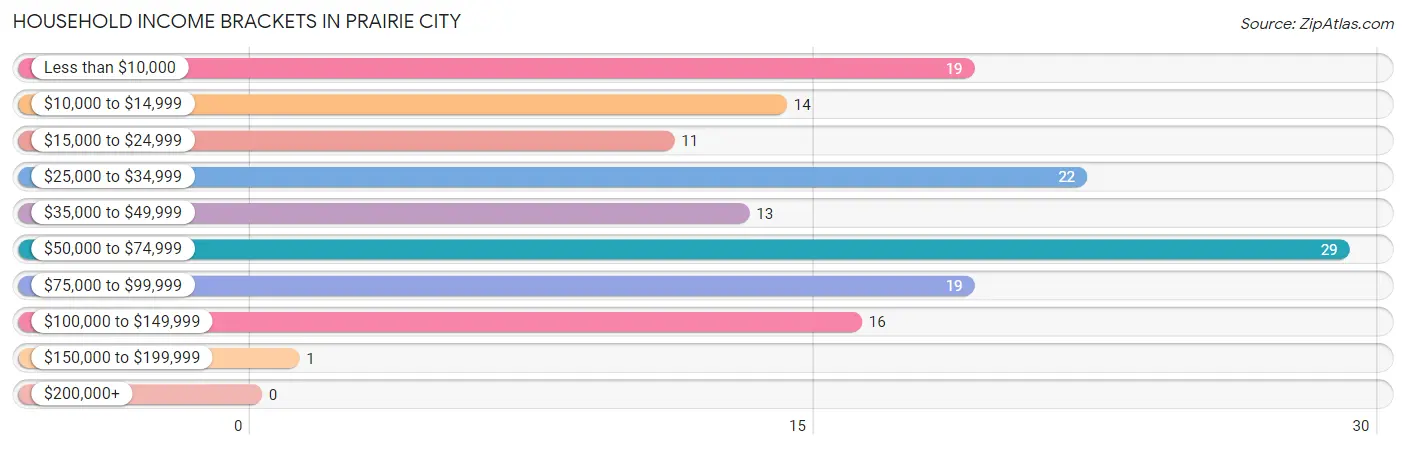
| Income Bracket | # Households | % Households |
| Less than $10,000 | 19 | 13.2% |
| $10,000 to $14,999 | 14 | 9.7% |
| $15,000 to $24,999 | 11 | 7.6% |
| $25,000 to $34,999 | 22 | 15.3% |
| $35,000 to $49,999 | 13 | 9.0% |
| $50,000 to $74,999 | 29 | 20.1% |
| $75,000 to $99,999 | 19 | 13.2% |
| $100,000 to $149,999 | 16 | 11.1% |
| $150,000 to $199,999 | 1 | 0.7% |
| $200,000+ | 0 | 0.0% |
Household Income by Householder Age in Prairie City
The median household income in Prairie City is $39,167, with the highest median household income of $76,250 found in the 25 to 44 years age bracket for the primary householder. A total of 30 households (20.8%) fall into this category. Meanwhile, the 15 to 24 years age bracket for the primary householder has the lowest median household income of $0, with 5 households (3.5%) in this group.
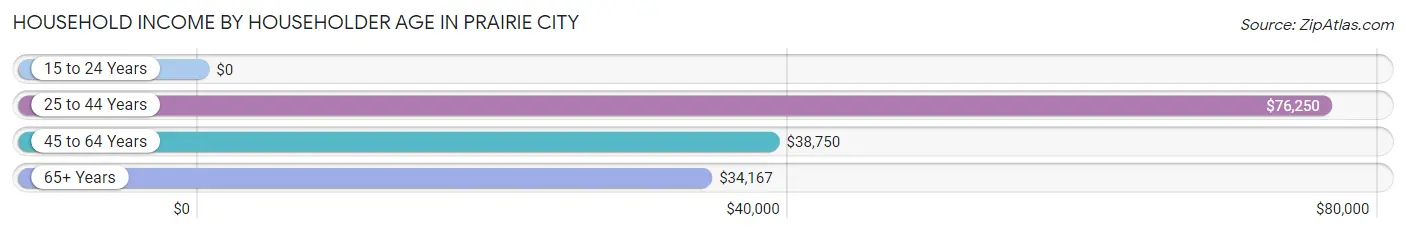
| Income Bracket | # Households | Median Income |
| 15 to 24 Years | 5 (3.5%) | $0 |
| 25 to 44 Years | 30 (20.8%) | $76,250 |
| 45 to 64 Years | 49 (34.0%) | $38,750 |
| 65+ Years | 60 (41.7%) | $34,167 |
| Total | 144 (100.0%) | $39,167 |
Poverty in Prairie City
Income Below Poverty by Sex and Age in Prairie City
With 18.8% poverty level for males and 6.2% for females among the residents of Prairie City, 55 to 64 year old males and 45 to 54 year old females are the most vulnerable to poverty, with 12 males (41.4%) and 4 females (16.7%) in their respective age groups living below the poverty level.
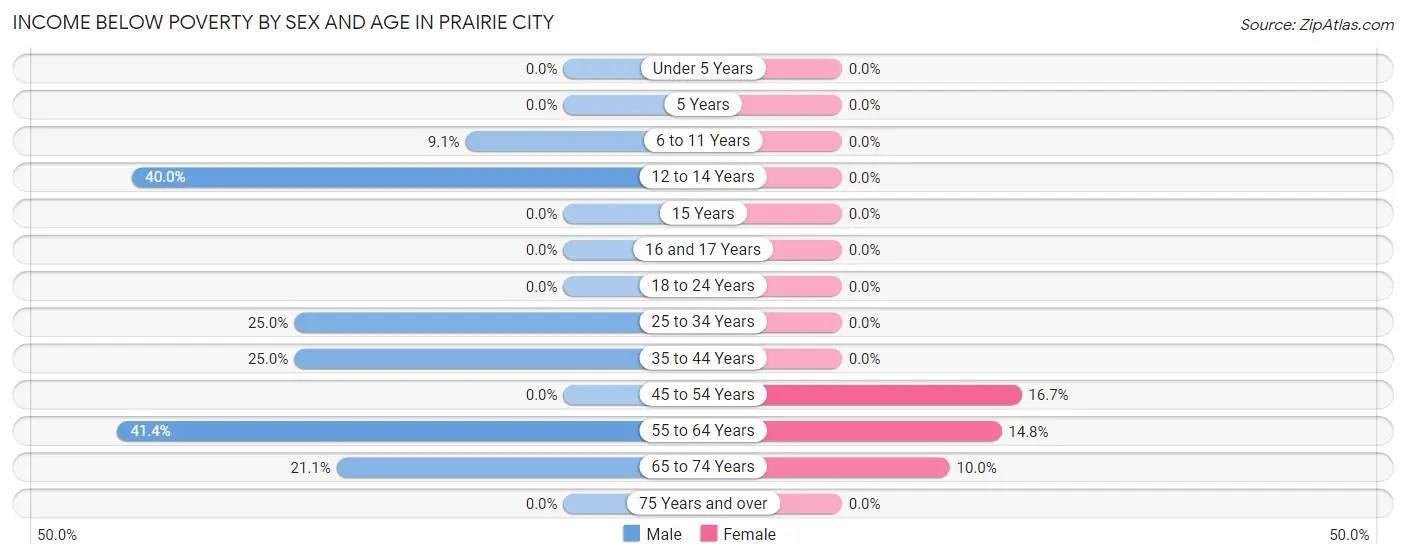
| Age Bracket | Male | Female |
| Under 5 Years | 0 (0.0%) | 0 (0.0%) |
| 5 Years | 0 (0.0%) | 0 (0.0%) |
| 6 to 11 Years | 1 (9.1%) | 0 (0.0%) |
| 12 to 14 Years | 2 (40.0%) | 0 (0.0%) |
| 15 Years | 0 (0.0%) | 0 (0.0%) |
| 16 and 17 Years | 0 (0.0%) | 0 (0.0%) |
| 18 to 24 Years | 0 (0.0%) | 0 (0.0%) |
| 25 to 34 Years | 1 (25.0%) | 0 (0.0%) |
| 35 to 44 Years | 5 (25.0%) | 0 (0.0%) |
| 45 to 54 Years | 0 (0.0%) | 4 (16.7%) |
| 55 to 64 Years | 12 (41.4%) | 4 (14.8%) |
| 65 to 74 Years | 8 (21.0%) | 3 (10.0%) |
| 75 Years and over | 0 (0.0%) | 0 (0.0%) |
| Total | 29 (18.8%) | 11 (6.2%) |
Income Above Poverty by Sex and Age in Prairie City
According to the poverty statistics in Prairie City, males aged under 5 years and females aged under 5 years are the age groups that are most secure financially, with 100.0% of males and 100.0% of females in these age groups living above the poverty line.
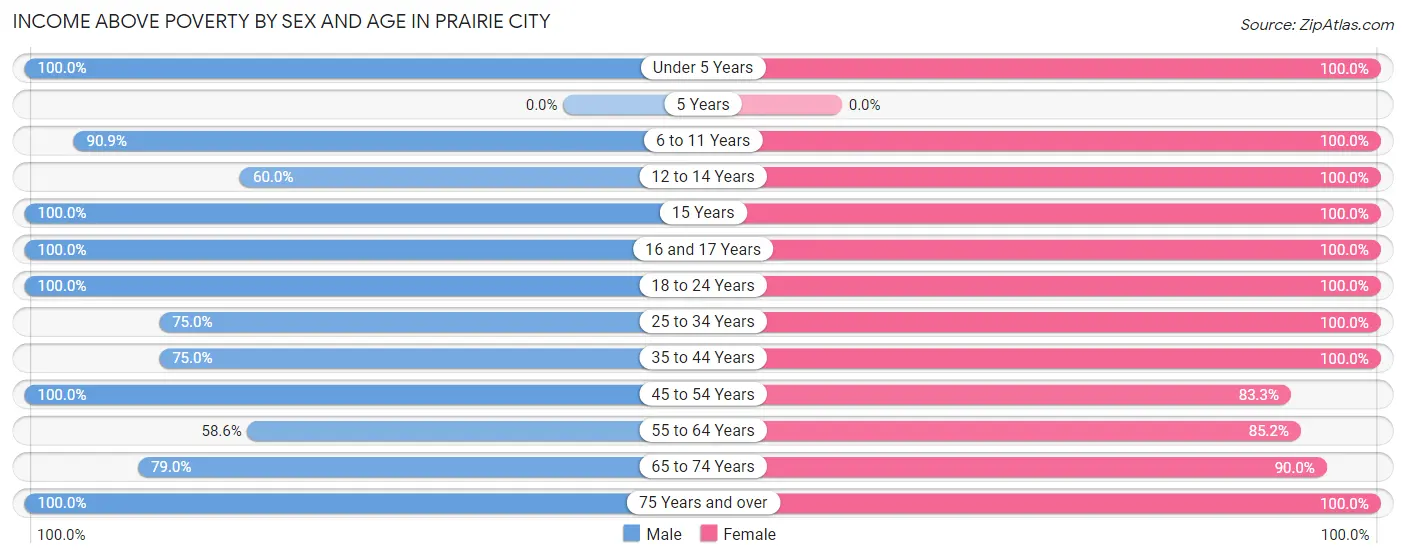
| Age Bracket | Male | Female |
| Under 5 Years | 8 (100.0%) | 5 (100.0%) |
| 5 Years | 0 (0.0%) | 0 (0.0%) |
| 6 to 11 Years | 10 (90.9%) | 8 (100.0%) |
| 12 to 14 Years | 3 (60.0%) | 11 (100.0%) |
| 15 Years | 11 (100.0%) | 2 (100.0%) |
| 16 and 17 Years | 2 (100.0%) | 2 (100.0%) |
| 18 to 24 Years | 6 (100.0%) | 28 (100.0%) |
| 25 to 34 Years | 3 (75.0%) | 8 (100.0%) |
| 35 to 44 Years | 15 (75.0%) | 22 (100.0%) |
| 45 to 54 Years | 17 (100.0%) | 20 (83.3%) |
| 55 to 64 Years | 17 (58.6%) | 23 (85.2%) |
| 65 to 74 Years | 30 (78.9%) | 27 (90.0%) |
| 75 Years and over | 3 (100.0%) | 9 (100.0%) |
| Total | 125 (81.2%) | 165 (93.8%) |
Income Below Poverty Among Married-Couple Families in Prairie City
The poverty statistics for married-couple families in Prairie City show that 4.5% or 3 of the total 66 families live below the poverty line. Families with no children have the highest poverty rate of 7.7%, comprising of 3 families. On the other hand, families with 1 or 2 children have the lowest poverty rate of 0.0%, which includes 0 families.
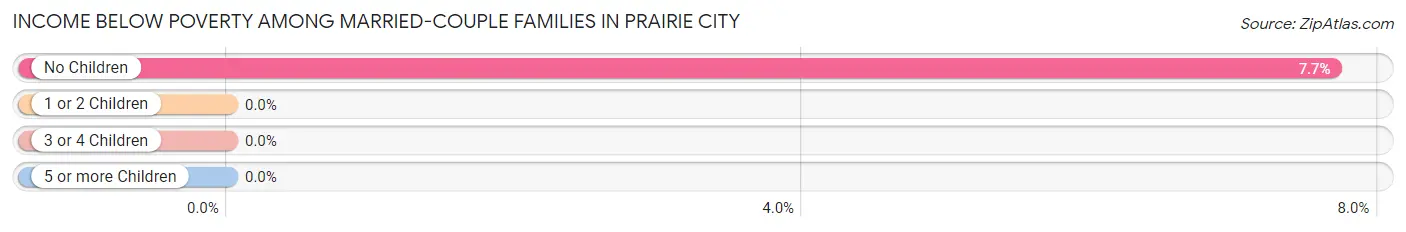
| Children | Above Poverty | Below Poverty |
| No Children | 36 (92.3%) | 3 (7.7%) |
| 1 or 2 Children | 25 (100.0%) | 0 (0.0%) |
| 3 or 4 Children | 0 (0.0%) | 0 (0.0%) |
| 5 or more Children | 2 (100.0%) | 0 (0.0%) |
| Total | 63 (95.5%) | 3 (4.5%) |
Income Below Poverty Among Single-Parent Households in Prairie City
According to the poverty data in Prairie City, 9.1% or 1 single-father households and 7.1% or 1 single-mother households are living below the poverty line. Among single-father households, those with 1 or 2 children have the highest poverty rate, with 1 households (50.0%) experiencing poverty. Likewise, among single-mother households, those with 1 or 2 children have the highest poverty rate, with 1 households (12.5%) falling below the poverty line.
| Children | Single Father | Single Mother |
| No Children | 0 (0.0%) | 0 (0.0%) |
| 1 or 2 Children | 1 (50.0%) | 1 (12.5%) |
| 3 or 4 Children | 0 (0.0%) | 0 (0.0%) |
| 5 or more Children | 0 (0.0%) | 0 (0.0%) |
| Total | 1 (9.1%) | 1 (7.1%) |
Income Below Poverty Among Married-Couple vs Single-Parent Households in Prairie City
The poverty data for Prairie City shows that 3 of the married-couple family households (4.5%) and 2 of the single-parent households (8.0%) are living below the poverty level. Within the married-couple family households, those with no children have the highest poverty rate, with 3 households (7.7%) falling below the poverty line. Among the single-parent households, those with 1 or 2 children have the highest poverty rate, with 2 household (20.0%) living below poverty.
| Children | Married-Couple Families | Single-Parent Households |
| No Children | 3 (7.7%) | 0 (0.0%) |
| 1 or 2 Children | 0 (0.0%) | 2 (20.0%) |
| 3 or 4 Children | 0 (0.0%) | 0 (0.0%) |
| 5 or more Children | 0 (0.0%) | 0 (0.0%) |
| Total | 3 (4.5%) | 2 (8.0%) |
Race in Prairie City
The most populous races in Prairie City are White / Caucasian (277 | 79.4%), Two or more Races (49 | 14.0%), and Black / African American (12 | 3.4%).
| Race | # Population | % Population |
| Asian | 11 | 3.2% |
| Black / African American | 12 | 3.4% |
| Hawaiian / Pacific | 0 | 0.0% |
| Hispanic or Latino | 11 | 3.2% |
| Native / Alaskan | 0 | 0.0% |
| White / Caucasian | 277 | 79.4% |
| Two or more Races | 49 | 14.0% |
| Some other Race | 0 | 0.0% |
| Total | 349 | 100.0% |
Ancestry in Prairie City
The most populous ancestries reported in Prairie City are German (58 | 16.6%), English (34 | 9.7%), Irish (24 | 6.9%), American (18 | 5.2%), and Indian (Asian) (16 | 4.6%), together accounting for 43.0% of all Prairie City residents.
| Ancestry | # Population | % Population |
| American | 18 | 5.2% |
| Cherokee | 2 | 0.6% |
| Dutch | 3 | 0.9% |
| English | 34 | 9.7% |
| Ethiopian | 2 | 0.6% |
| European | 5 | 1.4% |
| German | 58 | 16.6% |
| Indian (Asian) | 16 | 4.6% |
| Irish | 24 | 6.9% |
| Italian | 13 | 3.7% |
| Korean | 16 | 4.6% |
| Lithuanian | 6 | 1.7% |
| Mexican | 11 | 3.2% |
| Scotch-Irish | 5 | 1.4% |
| Scottish | 2 | 0.6% |
| Subsaharan African | 2 | 0.6% | View All 16 Rows |
Immigrants in Prairie City
The most numerous immigrant groups reported in Prairie City came from Asia (3 | 0.9%), Malaysia (3 | 0.9%), South Eastern Asia (3 | 0.9%), Africa (2 | 0.6%), and Eastern Africa (2 | 0.6%), together accounting for 3.7% of all Prairie City residents.
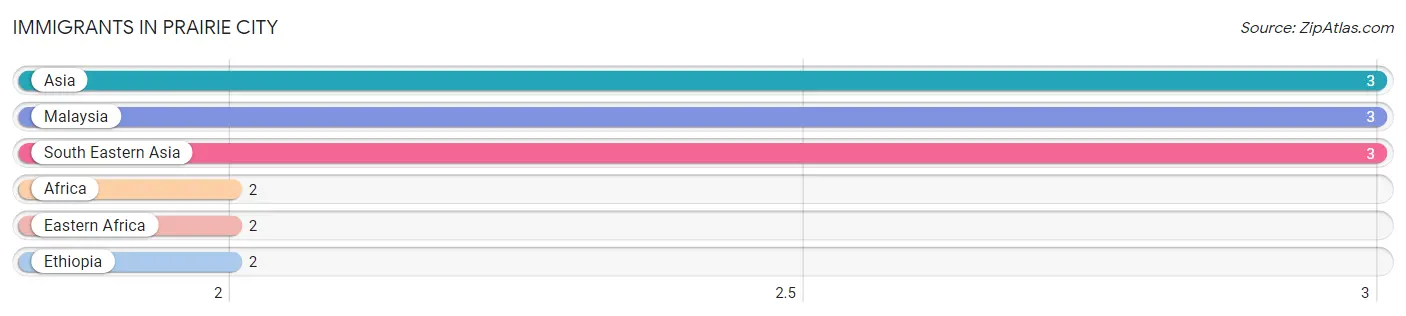
| Immigration Origin | # Population | % Population |
| Africa | 2 | 0.6% |
| Asia | 3 | 0.9% |
| Eastern Africa | 2 | 0.6% |
| Ethiopia | 2 | 0.6% |
| Malaysia | 3 | 0.9% |
| South Eastern Asia | 3 | 0.9% | View All 6 Rows |
Sex and Age in Prairie City
Sex and Age in Prairie City
The most populous age groups in Prairie City are 65 to 69 Years (25 | 15.5%) for men and 20 to 24 Years (21 | 11.2%) for women.
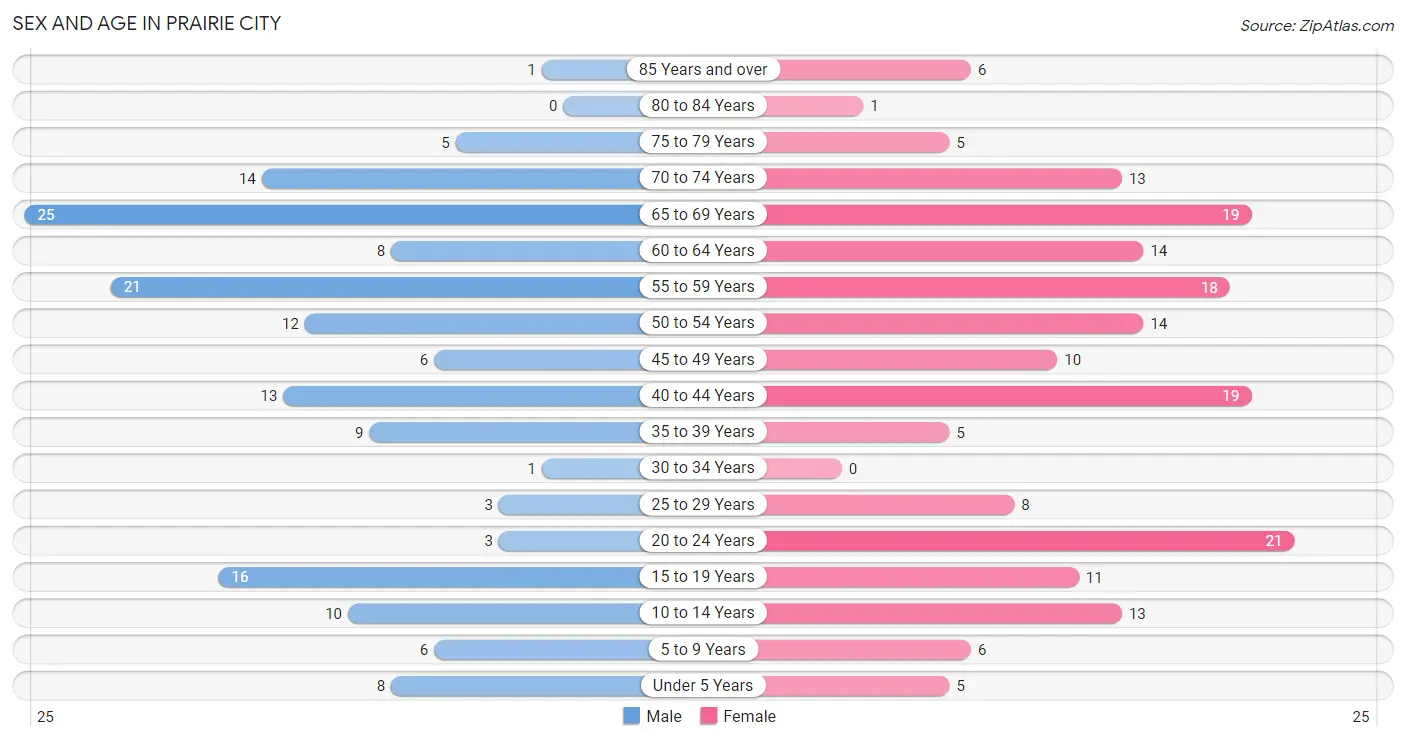
| Age Bracket | Male | Female |
| Under 5 Years | 8 (5.0%) | 5 (2.7%) |
| 5 to 9 Years | 6 (3.7%) | 6 (3.2%) |
| 10 to 14 Years | 10 (6.2%) | 13 (6.9%) |
| 15 to 19 Years | 16 (9.9%) | 11 (5.9%) |
| 20 to 24 Years | 3 (1.9%) | 21 (11.2%) |
| 25 to 29 Years | 3 (1.9%) | 8 (4.3%) |
| 30 to 34 Years | 1 (0.6%) | 0 (0.0%) |
| 35 to 39 Years | 9 (5.6%) | 5 (2.7%) |
| 40 to 44 Years | 13 (8.1%) | 19 (10.1%) |
| 45 to 49 Years | 6 (3.7%) | 10 (5.3%) |
| 50 to 54 Years | 12 (7.4%) | 14 (7.4%) |
| 55 to 59 Years | 21 (13.0%) | 18 (9.6%) |
| 60 to 64 Years | 8 (5.0%) | 14 (7.4%) |
| 65 to 69 Years | 25 (15.5%) | 19 (10.1%) |
| 70 to 74 Years | 14 (8.7%) | 13 (6.9%) |
| 75 to 79 Years | 5 (3.1%) | 5 (2.7%) |
| 80 to 84 Years | 0 (0.0%) | 1 (0.5%) |
| 85 Years and over | 1 (0.6%) | 6 (3.2%) |
| Total | 161 (100.0%) | 188 (100.0%) |
Families and Households in Prairie City
Median Family Size in Prairie City
The median family size in Prairie City is 3.01 persons per family, with married-couple families (66 | 72.5%) accounting for the largest median family size of 3.32 persons per family. On the other hand, single male/father families (11 | 12.1%) represent the smallest median family size with 2.00 persons per family.
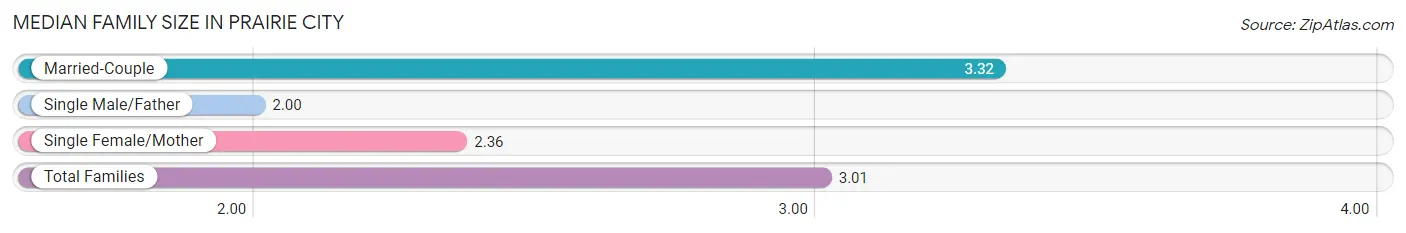
| Family Type | # Families | Family Size |
| Married-Couple | 66 (72.5%) | 3.32 |
| Single Male/Father | 11 (12.1%) | 2.00 |
| Single Female/Mother | 14 (15.4%) | 2.36 |
| Total Families | 91 (100.0%) | 3.01 |
Median Household Size in Prairie City
The median household size in Prairie City is 2.29 persons per household, with married-couple households (66 | 45.8%) accounting for the largest median household size of 3.32 persons per household. non-family households (53 | 36.8%) represent the smallest median household size with 1.02 persons per household.
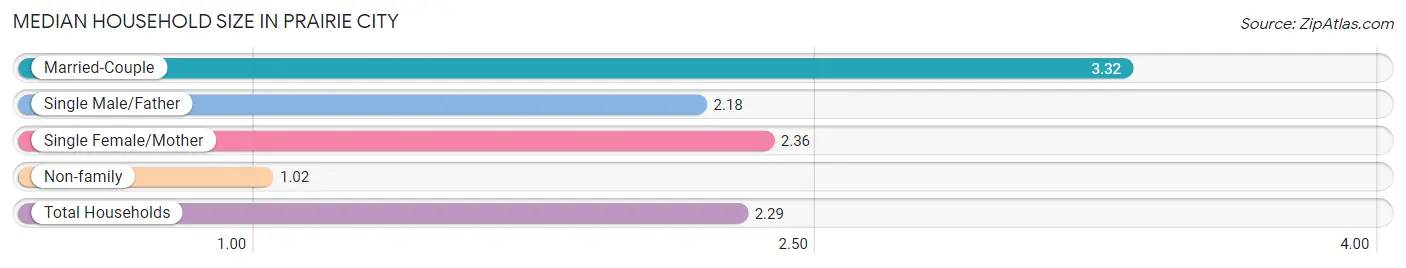
| Household Type | # Households | Household Size |
| Married-Couple | 66 (45.8%) | 3.32 |
| Single Male/Father | 11 (7.6%) | 2.18 |
| Single Female/Mother | 14 (9.7%) | 2.36 |
| Non-family | 53 (36.8%) | 1.02 |
| Total Households | 144 (100.0%) | 2.29 |
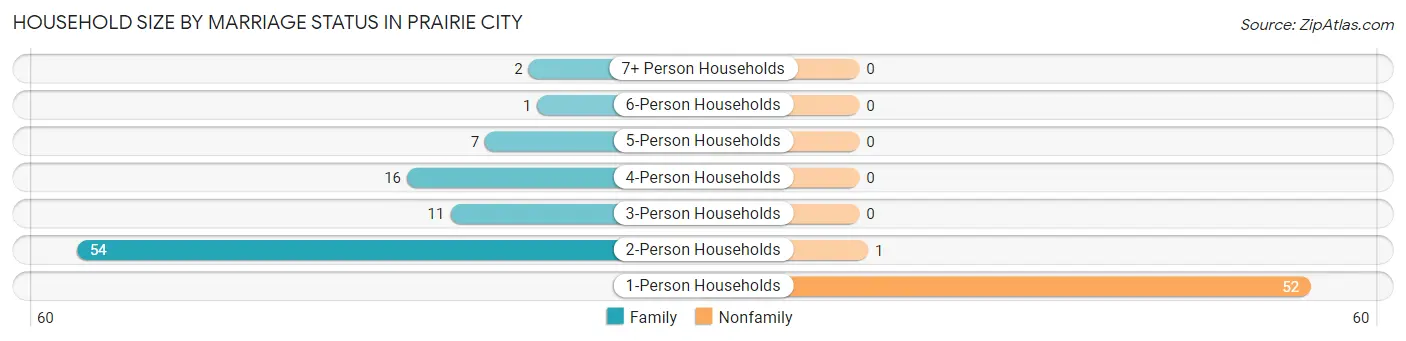
Household Size by Marriage Status in Prairie City
Out of a total of 144 households in Prairie City, 91 (63.2%) are family households, while 53 (36.8%) are nonfamily households. The most numerous type of family households are 2-person households, comprising 54, and the most common type of nonfamily households are 1-person households, comprising 52.
| Household Size | Family Households | Nonfamily Households |
| 1-Person Households | - | 52 (36.1%) |
| 2-Person Households | 54 (37.5%) | 1 (0.7%) |
| 3-Person Households | 11 (7.6%) | 0 (0.0%) |
| 4-Person Households | 16 (11.1%) | 0 (0.0%) |
| 5-Person Households | 7 (4.9%) | 0 (0.0%) |
| 6-Person Households | 1 (0.7%) | 0 (0.0%) |
| 7+ Person Households | 2 (1.4%) | 0 (0.0%) |
| Total | 91 (63.2%) | 53 (36.8%) |
Female Fertility in Prairie City
Fertility by Age in Prairie City
| Age Bracket | Women with Births | Births / 1,000 Women |
| 15 to 19 years | 0 (0.0%) | 0.0 |
| 20 to 34 years | 0 (0.0%) | 0.0 |
| 35 to 50 years | 0 (0.0%) | 0.0 |
| Total | 0 (0.0%) | 0.0 |
Fertility by Age by Marriage Status in Prairie City
| Age Bracket | Married | Unmarried |
| 15 to 19 years | 0 (0.0%) | 0 (0.0%) |
| 20 to 34 years | 0 (0.0%) | 0 (0.0%) |
| 35 to 50 years | 0 (0.0%) | 0 (0.0%) |
| Total | 0 (0.0%) | 0 (0.0%) |
Fertility by Education in Prairie City
| Educational Attainment | Women with Births | Births / 1,000 Women |
| Less than High School | 0 (0.0%) | 0.0 |
| High School Diploma | 0 (0.0%) | 0.0 |
| College or Associate's Degree | 0 (0.0%) | 0.0 |
| Bachelor's Degree | 0 (0.0%) | 0.0 |
| Graduate Degree | 0 (0.0%) | 0.0 |
| Total | 0 (0.0%) | 0.0 |
Fertility by Education by Marriage Status in Prairie City
| Educational Attainment | Married | Unmarried |
| Less than High School | 0 (0.0%) | 0 (0.0%) |
| High School Diploma | 0 (0.0%) | 0 (0.0%) |
| College or Associate's Degree | 0 (0.0%) | 0 (0.0%) |
| Bachelor's Degree | 0 (0.0%) | 0 (0.0%) |
| Graduate Degree | 0 (0.0%) | 0 (0.0%) |
| Total | 0 (0.0%) | 0 (0.0%) |
Employment Characteristics in Prairie City
Employment by Class of Employer in Prairie City
Among the 137 employed individuals in Prairie City, private company employees (84 | 61.3%), local government employees (13 | 9.5%), and state government employees (13 | 9.5%) make up the most common classes of employment.
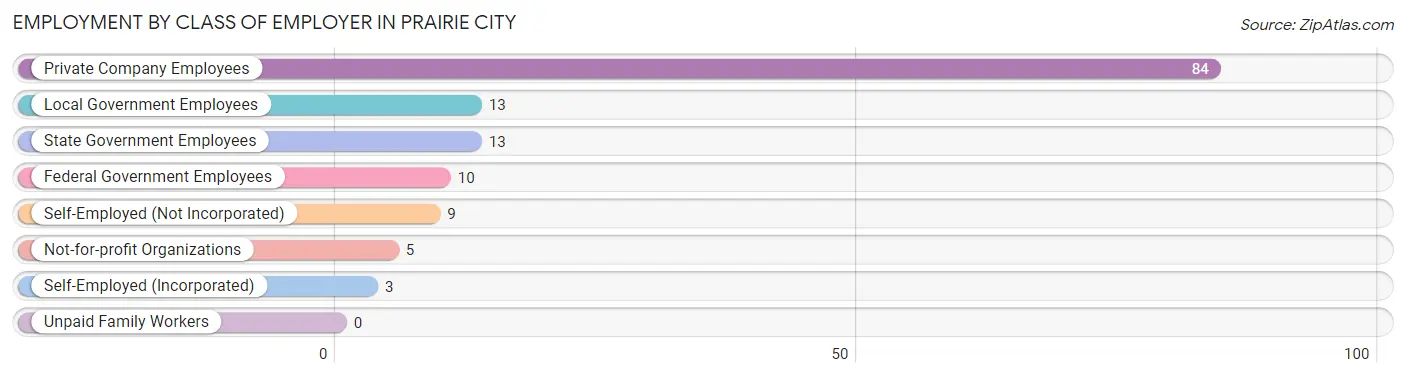
| Employer Class | # Employees | % Employees |
| Private Company Employees | 84 | 61.3% |
| Self-Employed (Incorporated) | 3 | 2.2% |
| Self-Employed (Not Incorporated) | 9 | 6.6% |
| Not-for-profit Organizations | 5 | 3.6% |
| Local Government Employees | 13 | 9.5% |
| State Government Employees | 13 | 9.5% |
| Federal Government Employees | 10 | 7.3% |
| Unpaid Family Workers | 0 | 0.0% |
| Total | 137 | 100.0% |
Employment Status by Age in Prairie City
According to the labor force statistics for Prairie City, out of the total population over 16 years of age (288), 48.6% or 140 individuals are in the labor force, with 2.1% or 3 of them unemployed. The age group with the highest labor force participation rate is 25 to 29 years, with 100.0% or 11 individuals in the labor force. Within the labor force, the 35 to 44 years age range has the highest percentage of unemployed individuals, with 9.4% or 3 of them being unemployed.
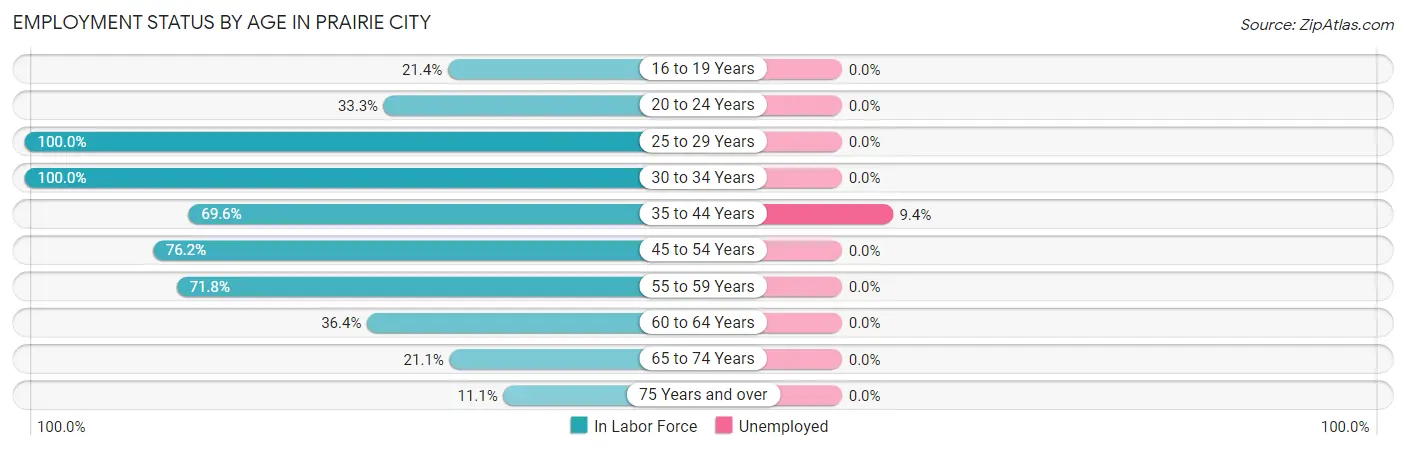
| Age Bracket | In Labor Force | Unemployed |
| 16 to 19 Years | 3 (21.4%) | 0 (0.0%) |
| 20 to 24 Years | 8 (33.3%) | 0 (0.0%) |
| 25 to 29 Years | 11 (100.0%) | 0 (0.0%) |
| 30 to 34 Years | 1 (100.0%) | 0 (0.0%) |
| 35 to 44 Years | 32 (69.6%) | 3 (9.4%) |
| 45 to 54 Years | 32 (76.2%) | 0 (0.0%) |
| 55 to 59 Years | 28 (71.8%) | 0 (0.0%) |
| 60 to 64 Years | 8 (36.4%) | 0 (0.0%) |
| 65 to 74 Years | 15 (21.1%) | 0 (0.0%) |
| 75 Years and over | 2 (11.1%) | 0 (0.0%) |
| Total | 140 (48.6%) | 3 (2.1%) |
Employment Status by Educational Attainment in Prairie City
According to labor force statistics for Prairie City, 69.6% of individuals (112) out of the total population between 25 and 64 years of age (161) are in the labor force, with 2.7% or 3 of them being unemployed. The group with the highest labor force participation rate are those with the educational attainment of college / associate degree, with 80.3% or 57 individuals in the labor force. Within the labor force, individuals with college / associate degree education have the highest percentage of unemployment, with 5.3% or 3 of them being unemployed.
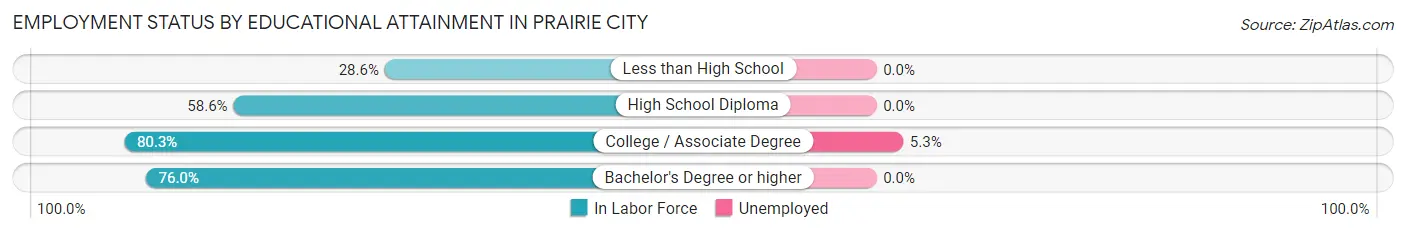
| Educational Attainment | In Labor Force | Unemployed |
| Less than High School | 2 (28.6%) | 0 (0.0%) |
| High School Diploma | 34 (58.6%) | 0 (0.0%) |
| College / Associate Degree | 57 (80.3%) | 4 (5.3%) |
| Bachelor's Degree or higher | 19 (76.0%) | 0 (0.0%) |
| Total | 112 (69.6%) | 4 (2.7%) |
Employment Occupations by Sex in Prairie City
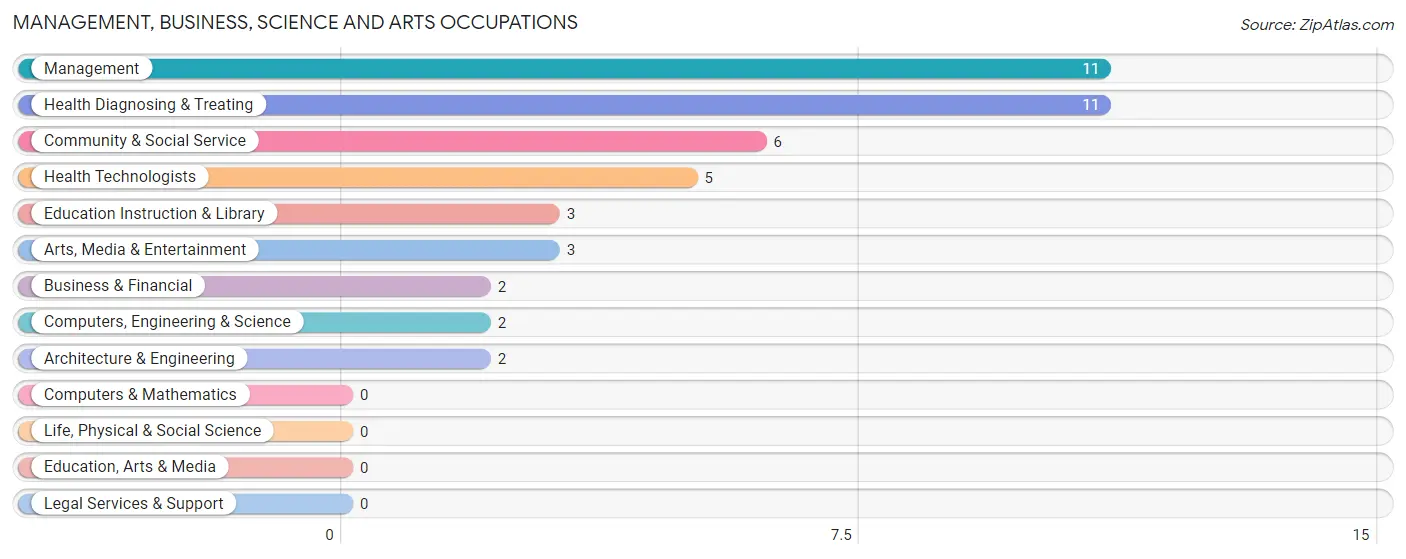
Management, Business, Science and Arts Occupations
The most common Management, Business, Science and Arts occupations in Prairie City are Management (11 | 8.0%), Health Diagnosing & Treating (11 | 8.0%), Community & Social Service (6 | 4.4%), Health Technologists (5 | 3.6%), and Education Instruction & Library (3 | 2.2%).
Management, Business, Science and Arts Occupations by Sex
Within the Management, Business, Science and Arts occupations in Prairie City, the most male-oriented occupations are Management (100.0%), Computers, Engineering & Science (100.0%), and Architecture & Engineering (100.0%), while the most female-oriented occupations are Business & Financial (100.0%), Community & Social Service (100.0%), and Education Instruction & Library (100.0%).
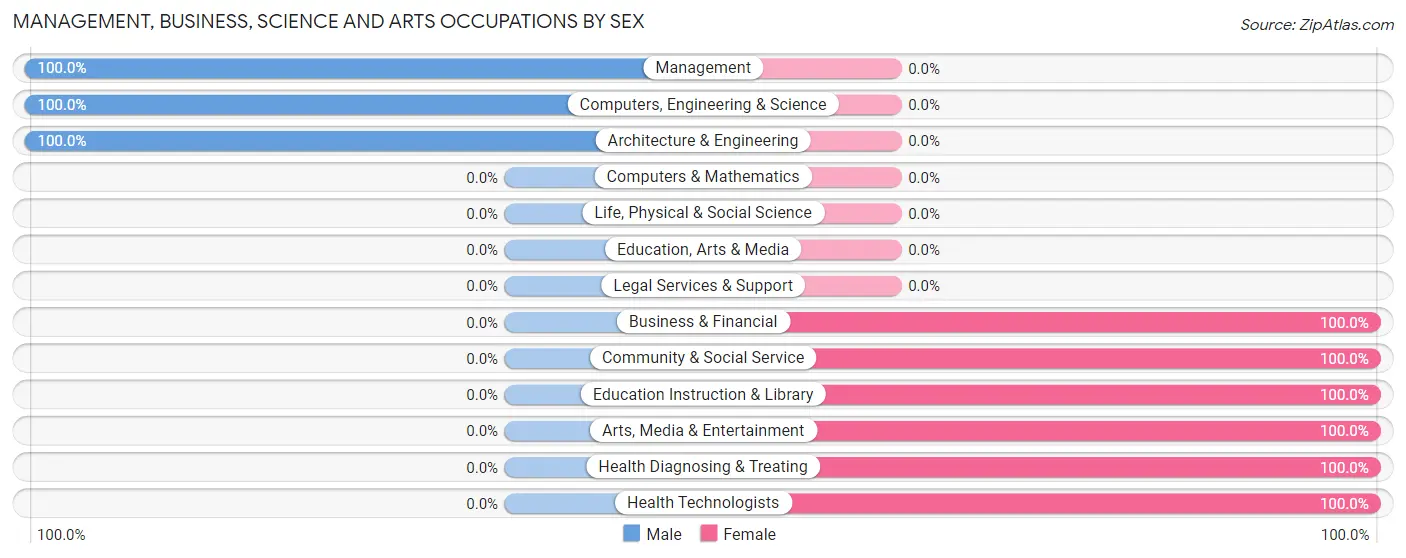
| Occupation | Male | Female |
| Management | 11 (100.0%) | 0 (0.0%) |
| Business & Financial | 0 (0.0%) | 2 (100.0%) |
| Computers, Engineering & Science | 2 (100.0%) | 0 (0.0%) |
| Computers & Mathematics | 0 (0.0%) | 0 (0.0%) |
| Architecture & Engineering | 2 (100.0%) | 0 (0.0%) |
| Life, Physical & Social Science | 0 (0.0%) | 0 (0.0%) |
| Community & Social Service | 0 (0.0%) | 6 (100.0%) |
| Education, Arts & Media | 0 (0.0%) | 0 (0.0%) |
| Legal Services & Support | 0 (0.0%) | 0 (0.0%) |
| Education Instruction & Library | 0 (0.0%) | 3 (100.0%) |
| Arts, Media & Entertainment | 0 (0.0%) | 3 (100.0%) |
| Health Diagnosing & Treating | 0 (0.0%) | 11 (100.0%) |
| Health Technologists | 0 (0.0%) | 5 (100.0%) |
| Total (Category) | 13 (40.6%) | 19 (59.4%) |
| Total (Overall) | 68 (49.6%) | 69 (50.4%) |
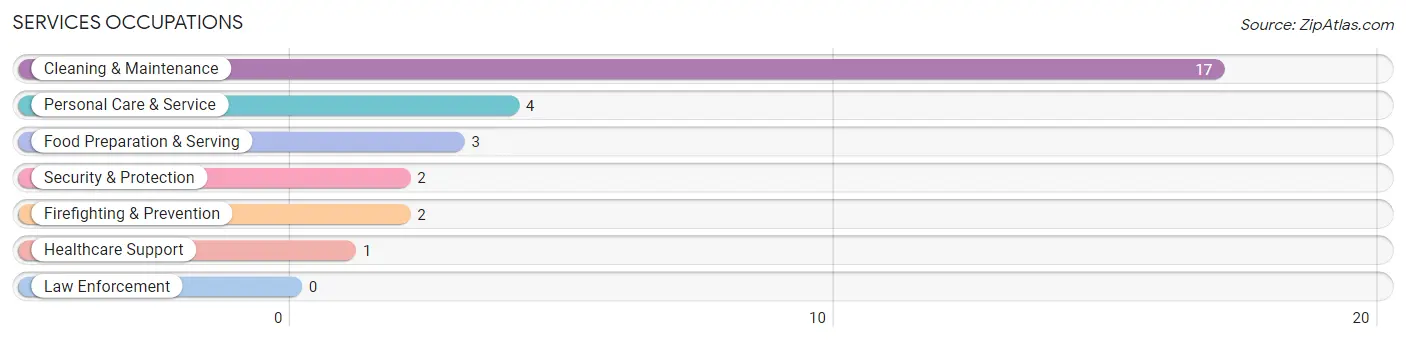
Services Occupations
The most common Services occupations in Prairie City are Cleaning & Maintenance (17 | 12.4%), Personal Care & Service (4 | 2.9%), Food Preparation & Serving (3 | 2.2%), Security & Protection (2 | 1.5%), and Firefighting & Prevention (2 | 1.5%).
Services Occupations by Sex
Within the Services occupations in Prairie City, the most male-oriented occupations are Security & Protection (100.0%), Firefighting & Prevention (100.0%), and Cleaning & Maintenance (47.1%), while the most female-oriented occupations are Healthcare Support (100.0%), Food Preparation & Serving (100.0%), and Personal Care & Service (100.0%).
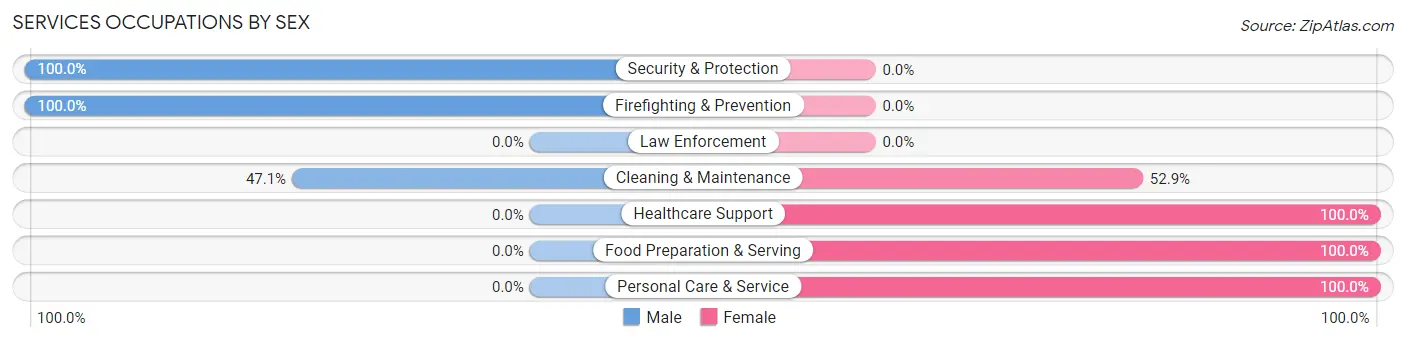
| Occupation | Male | Female |
| Healthcare Support | 0 (0.0%) | 1 (100.0%) |
| Security & Protection | 2 (100.0%) | 0 (0.0%) |
| Firefighting & Prevention | 2 (100.0%) | 0 (0.0%) |
| Law Enforcement | 0 (0.0%) | 0 (0.0%) |
| Food Preparation & Serving | 0 (0.0%) | 3 (100.0%) |
| Cleaning & Maintenance | 8 (47.1%) | 9 (52.9%) |
| Personal Care & Service | 0 (0.0%) | 4 (100.0%) |
| Total (Category) | 10 (37.0%) | 17 (63.0%) |
| Total (Overall) | 68 (49.6%) | 69 (50.4%) |
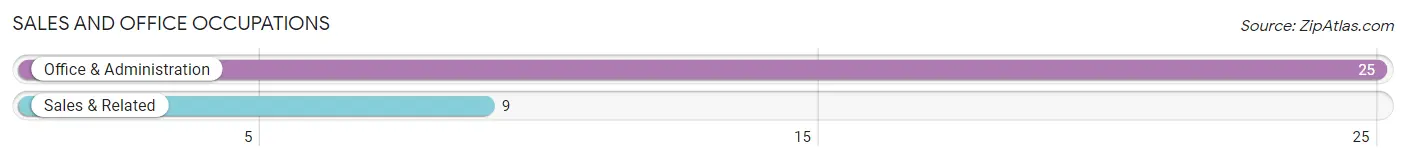
Sales and Office Occupations
The most common Sales and Office occupations in Prairie City are Office & Administration (25 | 18.2%), and Sales & Related (9 | 6.6%).
Sales and Office Occupations by Sex
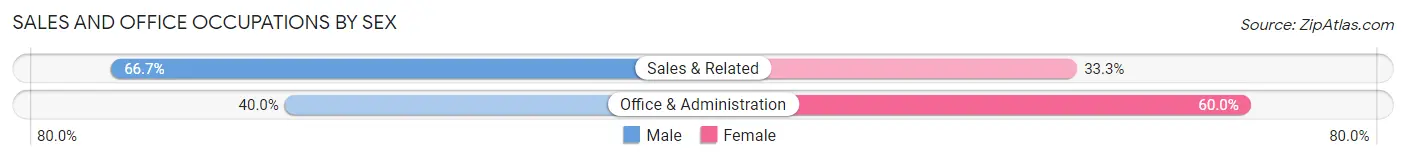
| Occupation | Male | Female |
| Sales & Related | 6 (66.7%) | 3 (33.3%) |
| Office & Administration | 10 (40.0%) | 15 (60.0%) |
| Total (Category) | 16 (47.1%) | 18 (52.9%) |
| Total (Overall) | 68 (49.6%) | 69 (50.4%) |
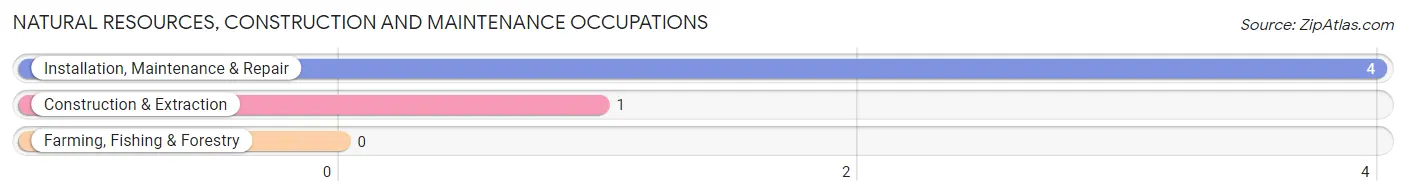
Natural Resources, Construction and Maintenance Occupations
The most common Natural Resources, Construction and Maintenance occupations in Prairie City are Installation, Maintenance & Repair (4 | 2.9%), and Construction & Extraction (1 | 0.7%).
Natural Resources, Construction and Maintenance Occupations by Sex
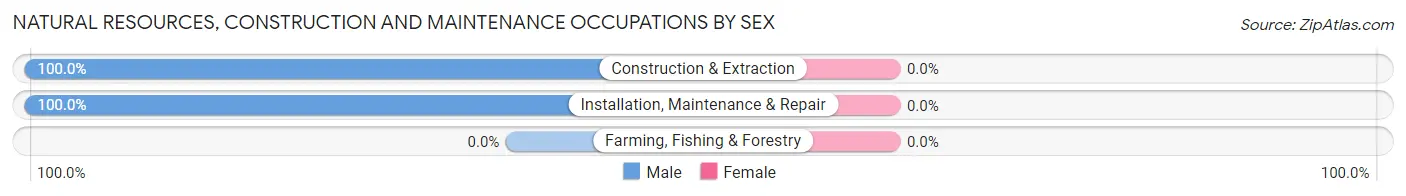
| Occupation | Male | Female |
| Farming, Fishing & Forestry | 0 (0.0%) | 0 (0.0%) |
| Construction & Extraction | 1 (100.0%) | 0 (0.0%) |
| Installation, Maintenance & Repair | 4 (100.0%) | 0 (0.0%) |
| Total (Category) | 5 (100.0%) | 0 (0.0%) |
| Total (Overall) | 68 (49.6%) | 69 (50.4%) |
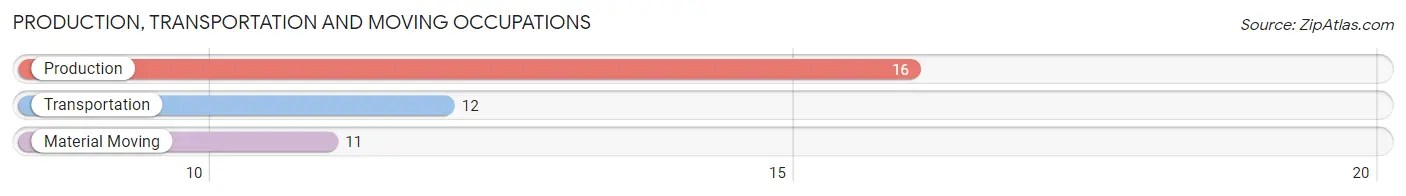
Production, Transportation and Moving Occupations
The most common Production, Transportation and Moving occupations in Prairie City are Production (16 | 11.7%), Transportation (12 | 8.8%), and Material Moving (11 | 8.0%).
Production, Transportation and Moving Occupations by Sex
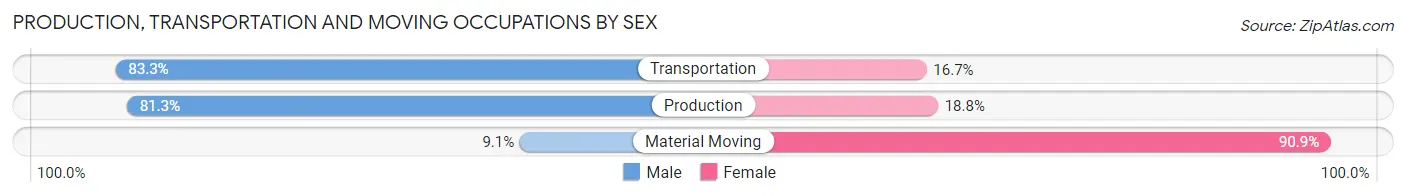
| Occupation | Male | Female |
| Production | 13 (81.2%) | 3 (18.8%) |
| Transportation | 10 (83.3%) | 2 (16.7%) |
| Material Moving | 1 (9.1%) | 10 (90.9%) |
| Total (Category) | 24 (61.5%) | 15 (38.5%) |
| Total (Overall) | 68 (49.6%) | 69 (50.4%) |
Employment Industries by Sex in Prairie City
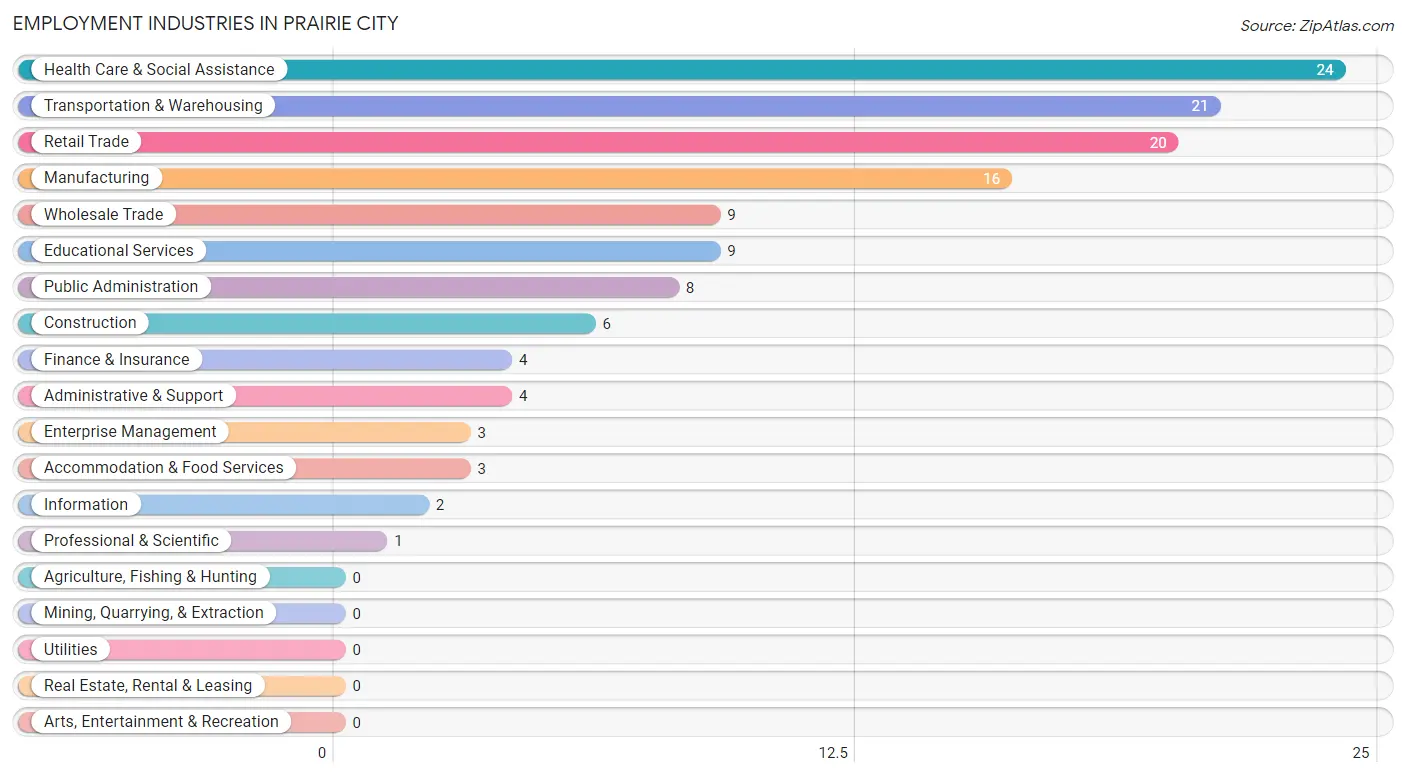
Employment Industries in Prairie City
The major employment industries in Prairie City include Health Care & Social Assistance (24 | 17.5%), Transportation & Warehousing (21 | 15.3%), Retail Trade (20 | 14.6%), Manufacturing (16 | 11.7%), and Wholesale Trade (9 | 6.6%).
Employment Industries by Sex in Prairie City
The Prairie City industries that see more men than women are Construction (100.0%), Transportation & Warehousing (100.0%), and Professional & Scientific (100.0%), whereas the industries that tend to have a higher number of women are Information (100.0%), Finance & Insurance (100.0%), and Health Care & Social Assistance (100.0%).
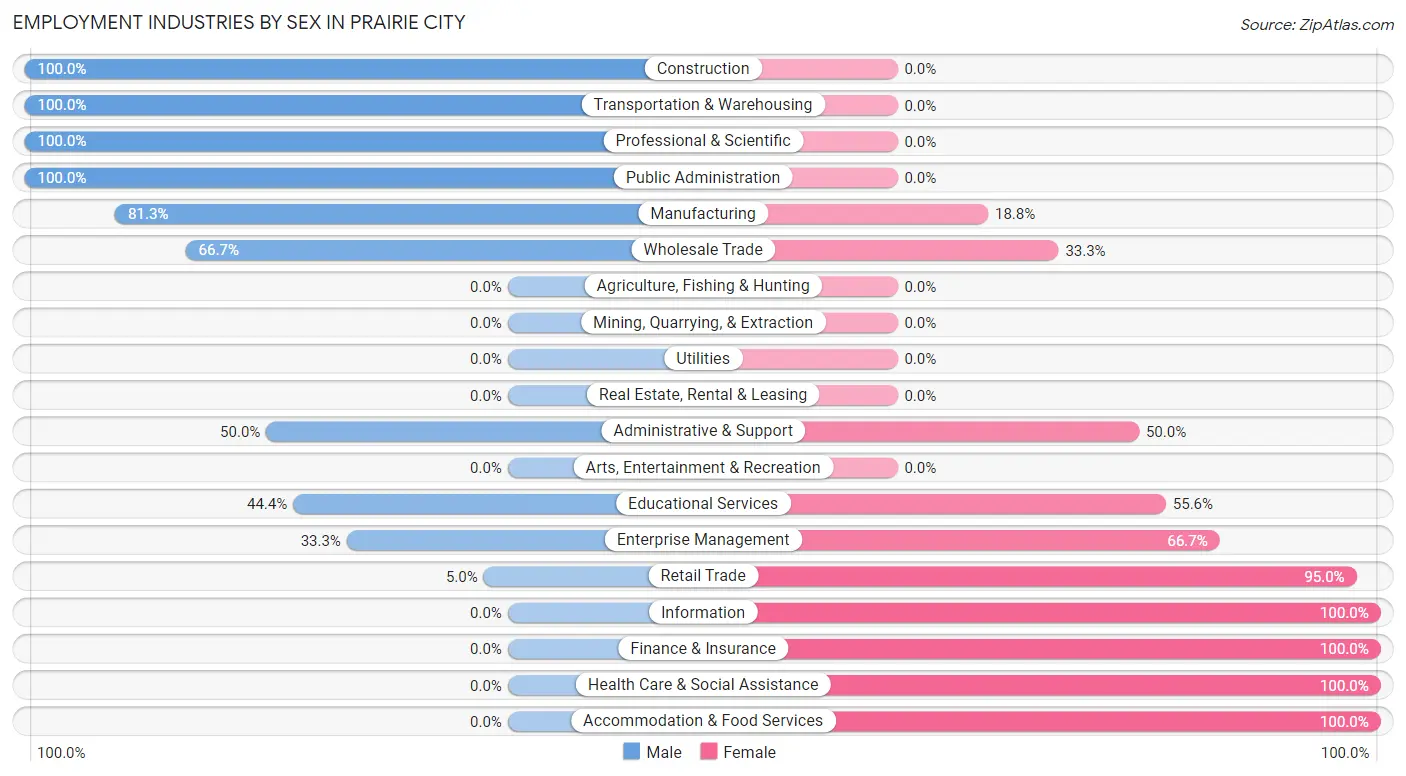
| Industry | Male | Female |
| Agriculture, Fishing & Hunting | 0 (0.0%) | 0 (0.0%) |
| Mining, Quarrying, & Extraction | 0 (0.0%) | 0 (0.0%) |
| Construction | 6 (100.0%) | 0 (0.0%) |
| Manufacturing | 13 (81.2%) | 3 (18.8%) |
| Wholesale Trade | 6 (66.7%) | 3 (33.3%) |
| Retail Trade | 1 (5.0%) | 19 (95.0%) |
| Transportation & Warehousing | 21 (100.0%) | 0 (0.0%) |
| Utilities | 0 (0.0%) | 0 (0.0%) |
| Information | 0 (0.0%) | 2 (100.0%) |
| Finance & Insurance | 0 (0.0%) | 4 (100.0%) |
| Real Estate, Rental & Leasing | 0 (0.0%) | 0 (0.0%) |
| Professional & Scientific | 1 (100.0%) | 0 (0.0%) |
| Enterprise Management | 1 (33.3%) | 2 (66.7%) |
| Administrative & Support | 2 (50.0%) | 2 (50.0%) |
| Educational Services | 4 (44.4%) | 5 (55.6%) |
| Health Care & Social Assistance | 0 (0.0%) | 24 (100.0%) |
| Arts, Entertainment & Recreation | 0 (0.0%) | 0 (0.0%) |
| Accommodation & Food Services | 0 (0.0%) | 3 (100.0%) |
| Public Administration | 8 (100.0%) | 0 (0.0%) |
| Total | 68 (49.6%) | 69 (50.4%) |
Education in Prairie City
School Enrollment in Prairie City
The most common levels of schooling among the 57 students in Prairie City are high school (26 | 45.6%), middle school (12 | 21.0%), and elementary school (8 | 14.0%).
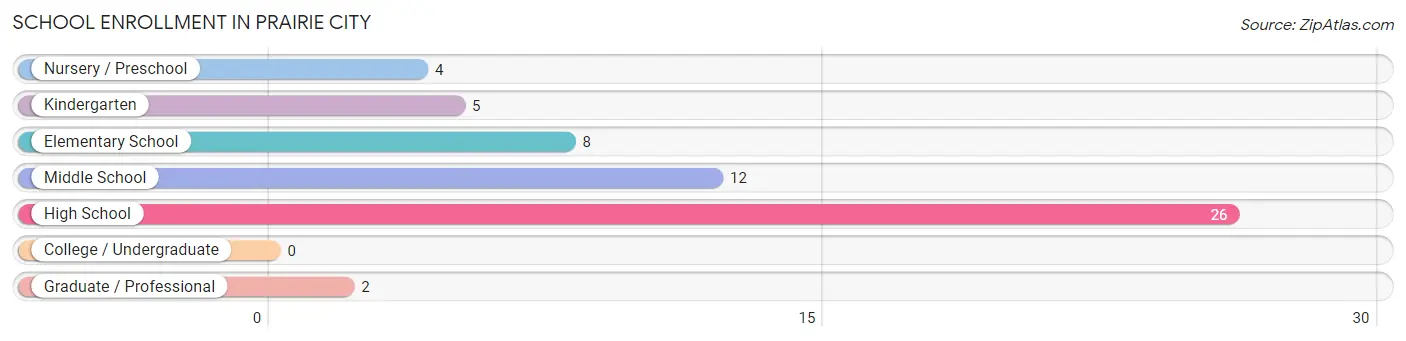
| School Level | # Students | % Students |
| Nursery / Preschool | 4 | 7.0% |
| Kindergarten | 5 | 8.8% |
| Elementary School | 8 | 14.0% |
| Middle School | 12 | 21.0% |
| High School | 26 | 45.6% |
| College / Undergraduate | 0 | 0.0% |
| Graduate / Professional | 2 | 3.5% |
| Total | 57 | 100.0% |
School Enrollment by Age by Funding Source in Prairie City
Out of a total of 57 students who are enrolled in schools in Prairie City, 24 (42.1%) attend a private institution, while the remaining 33 (57.9%) are enrolled in public schools. The age group of 3 to 4 year olds has the highest likelihood of being enrolled in private schools, with 4 (100.0% in the age bracket) enrolled. Conversely, the age group of 35 years and over has the lowest likelihood of being enrolled in a private school, with 2 (100.0% in the age bracket) attending a public institution.
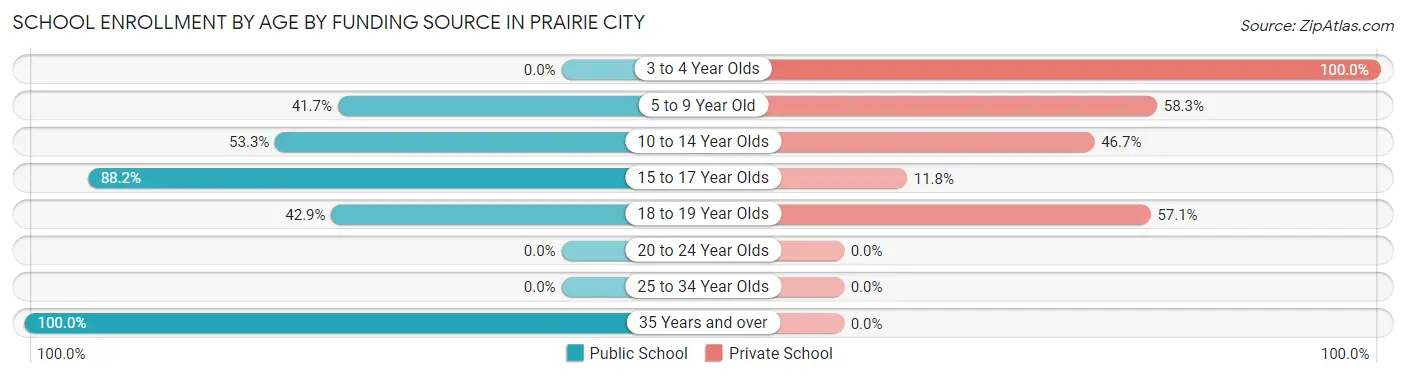
| Age Bracket | Public School | Private School |
| 3 to 4 Year Olds | 0 (0.0%) | 4 (100.0%) |
| 5 to 9 Year Old | 5 (41.7%) | 7 (58.3%) |
| 10 to 14 Year Olds | 8 (53.3%) | 7 (46.7%) |
| 15 to 17 Year Olds | 15 (88.2%) | 2 (11.8%) |
| 18 to 19 Year Olds | 3 (42.9%) | 4 (57.1%) |
| 20 to 24 Year Olds | 0 (0.0%) | 0 (0.0%) |
| 25 to 34 Year Olds | 0 (0.0%) | 0 (0.0%) |
| 35 Years and over | 2 (100.0%) | 0 (0.0%) |
| Total | 33 (57.9%) | 24 (42.1%) |
Educational Attainment by Field of Study in Prairie City
Psychology (13 | 46.4%), business (4 | 14.3%), liberal arts & history (4 | 14.3%), bio, nature & agricultural (2 | 7.1%), and education (2 | 7.1%) are the most common fields of study among 28 individuals in Prairie City who have obtained a bachelor's degree or higher.
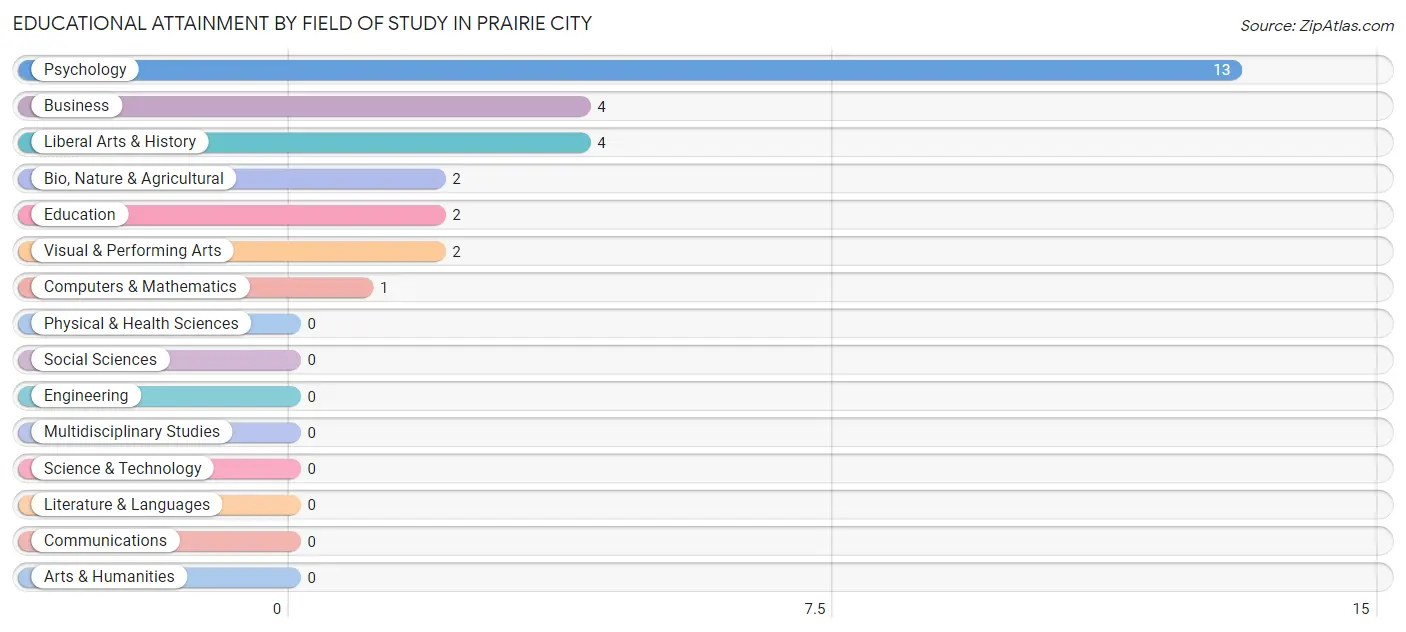
| Field of Study | # Graduates | % Graduates |
| Computers & Mathematics | 1 | 3.6% |
| Bio, Nature & Agricultural | 2 | 7.1% |
| Physical & Health Sciences | 0 | 0.0% |
| Psychology | 13 | 46.4% |
| Social Sciences | 0 | 0.0% |
| Engineering | 0 | 0.0% |
| Multidisciplinary Studies | 0 | 0.0% |
| Science & Technology | 0 | 0.0% |
| Business | 4 | 14.3% |
| Education | 2 | 7.1% |
| Literature & Languages | 0 | 0.0% |
| Liberal Arts & History | 4 | 14.3% |
| Visual & Performing Arts | 2 | 7.1% |
| Communications | 0 | 0.0% |
| Arts & Humanities | 0 | 0.0% |
| Total | 28 | 100.0% |
Transportation & Commute in Prairie City
Vehicle Availability by Sex in Prairie City
The most prevalent vehicle ownership categories in Prairie City are males with 2 vehicles (32, accounting for 47.1%) and females with 2 vehicles (25, making up 46.4%).
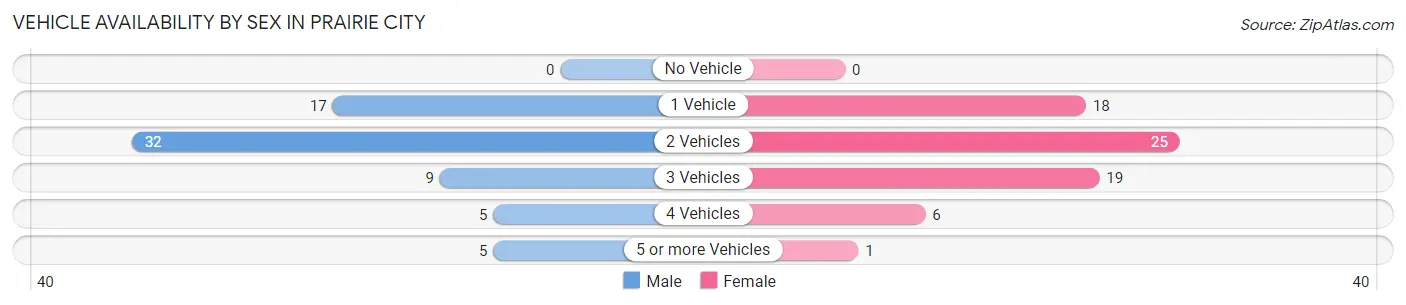
| Vehicles Available | Male | Female |
| No Vehicle | 0 (0.0%) | 0 (0.0%) |
| 1 Vehicle | 17 (25.0%) | 18 (26.1%) |
| 2 Vehicles | 32 (47.1%) | 25 (36.2%) |
| 3 Vehicles | 9 (13.2%) | 19 (27.5%) |
| 4 Vehicles | 5 (7.3%) | 6 (8.7%) |
| 5 or more Vehicles | 5 (7.3%) | 1 (1.5%) |
| Total | 68 (100.0%) | 69 (100.0%) |
Commute Time in Prairie City
The most frequently occuring commute durations in Prairie City are 30 to 34 minutes (28 commuters, 20.6%), 25 to 29 minutes (22 commuters, 16.2%), and 5 to 9 minutes (18 commuters, 13.2%).
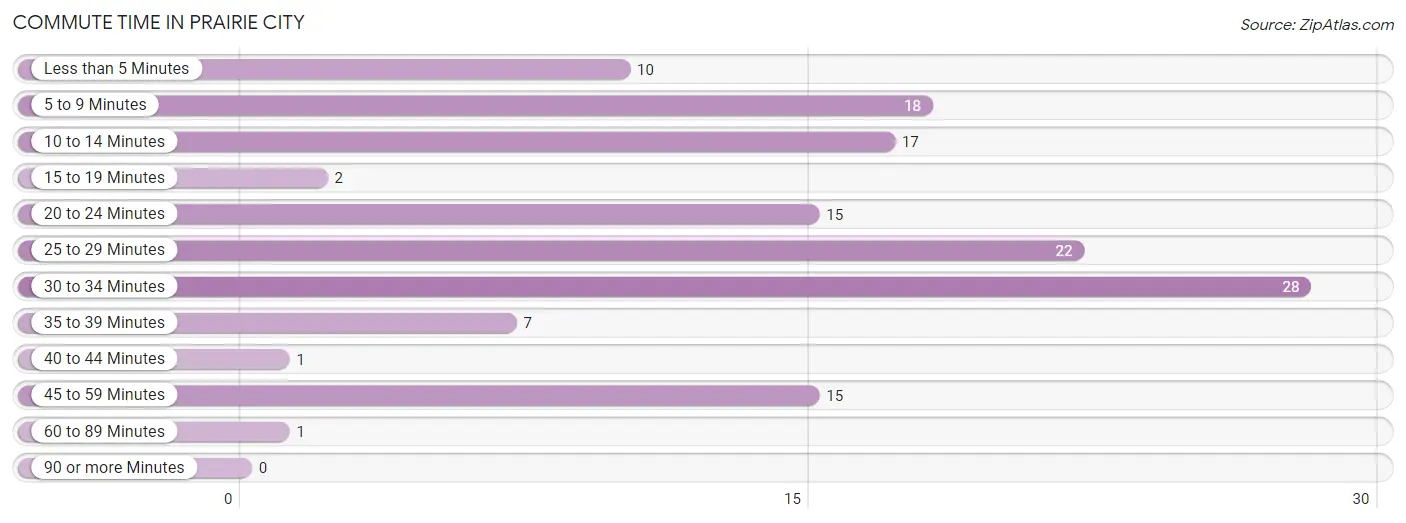
| Commute Time | # Commuters | % Commuters |
| Less than 5 Minutes | 10 | 7.3% |
| 5 to 9 Minutes | 18 | 13.2% |
| 10 to 14 Minutes | 17 | 12.5% |
| 15 to 19 Minutes | 2 | 1.5% |
| 20 to 24 Minutes | 15 | 11.0% |
| 25 to 29 Minutes | 22 | 16.2% |
| 30 to 34 Minutes | 28 | 20.6% |
| 35 to 39 Minutes | 7 | 5.1% |
| 40 to 44 Minutes | 1 | 0.7% |
| 45 to 59 Minutes | 15 | 11.0% |
| 60 to 89 Minutes | 1 | 0.7% |
| 90 or more Minutes | 0 | 0.0% |
Commute Time by Sex in Prairie City
The most common commute times in Prairie City are 5 to 9 minutes (17 commuters, 25.0%) for males and 25 to 29 minutes (21 commuters, 30.9%) for females.
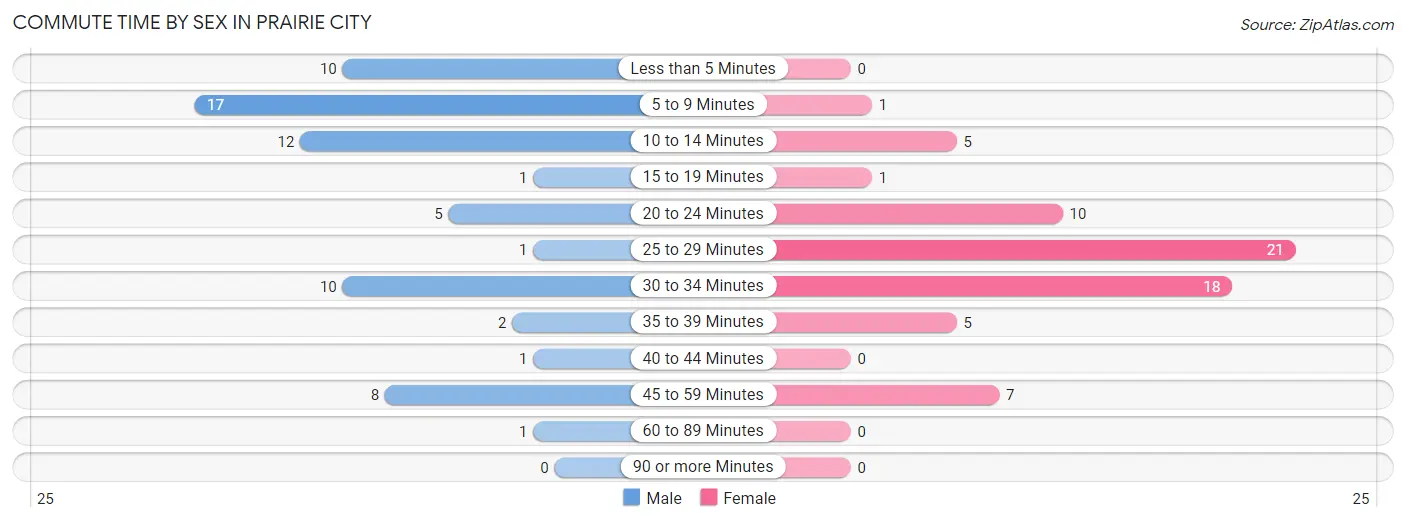
| Commute Time | Male | Female |
| Less than 5 Minutes | 10 (14.7%) | 0 (0.0%) |
| 5 to 9 Minutes | 17 (25.0%) | 1 (1.5%) |
| 10 to 14 Minutes | 12 (17.6%) | 5 (7.3%) |
| 15 to 19 Minutes | 1 (1.5%) | 1 (1.5%) |
| 20 to 24 Minutes | 5 (7.3%) | 10 (14.7%) |
| 25 to 29 Minutes | 1 (1.5%) | 21 (30.9%) |
| 30 to 34 Minutes | 10 (14.7%) | 18 (26.5%) |
| 35 to 39 Minutes | 2 (2.9%) | 5 (7.3%) |
| 40 to 44 Minutes | 1 (1.5%) | 0 (0.0%) |
| 45 to 59 Minutes | 8 (11.8%) | 7 (10.3%) |
| 60 to 89 Minutes | 1 (1.5%) | 0 (0.0%) |
| 90 or more Minutes | 0 (0.0%) | 0 (0.0%) |
Time of Departure to Work by Sex in Prairie City
The most frequent times of departure to work in Prairie City are 6:00 AM to 6:29 AM (17, 25.0%) for males and 4:00 PM to 11:59 PM (15, 22.1%) for females.
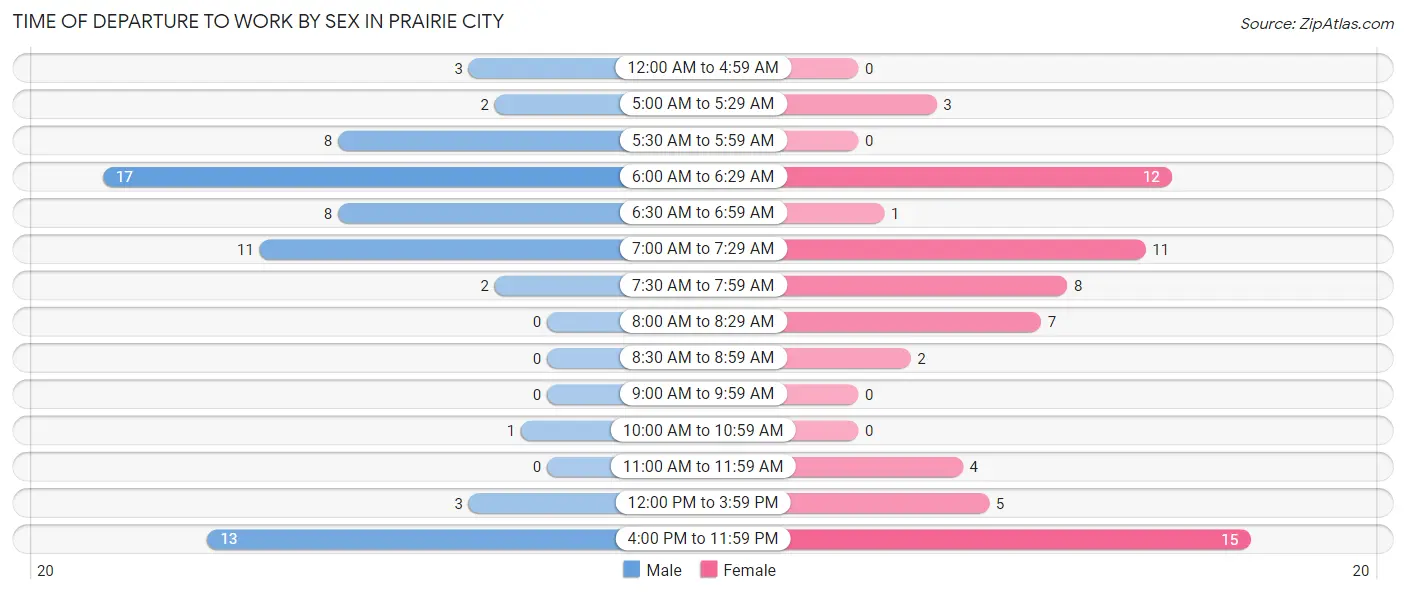
| Time of Departure | Male | Female |
| 12:00 AM to 4:59 AM | 3 (4.4%) | 0 (0.0%) |
| 5:00 AM to 5:29 AM | 2 (2.9%) | 3 (4.4%) |
| 5:30 AM to 5:59 AM | 8 (11.8%) | 0 (0.0%) |
| 6:00 AM to 6:29 AM | 17 (25.0%) | 12 (17.6%) |
| 6:30 AM to 6:59 AM | 8 (11.8%) | 1 (1.5%) |
| 7:00 AM to 7:29 AM | 11 (16.2%) | 11 (16.2%) |
| 7:30 AM to 7:59 AM | 2 (2.9%) | 8 (11.8%) |
| 8:00 AM to 8:29 AM | 0 (0.0%) | 7 (10.3%) |
| 8:30 AM to 8:59 AM | 0 (0.0%) | 2 (2.9%) |
| 9:00 AM to 9:59 AM | 0 (0.0%) | 0 (0.0%) |
| 10:00 AM to 10:59 AM | 1 (1.5%) | 0 (0.0%) |
| 11:00 AM to 11:59 AM | 0 (0.0%) | 4 (5.9%) |
| 12:00 PM to 3:59 PM | 3 (4.4%) | 5 (7.3%) |
| 4:00 PM to 11:59 PM | 13 (19.1%) | 15 (22.1%) |
| Total | 68 (100.0%) | 68 (100.0%) |
Housing Occupancy in Prairie City
Occupancy by Ownership in Prairie City
Of the total 144 dwellings in Prairie City, owner-occupied units account for 126 (87.5%), while renter-occupied units make up 18 (12.5%).
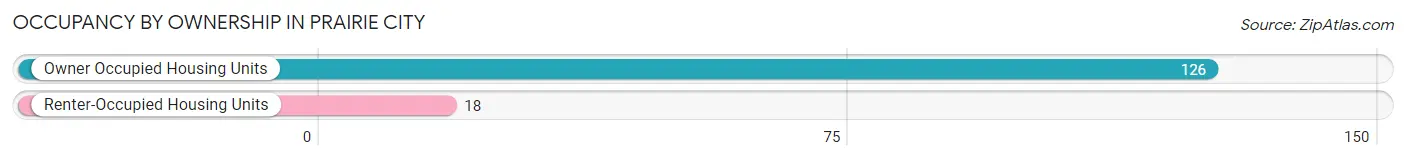
| Occupancy | # Housing Units | % Housing Units |
| Owner Occupied Housing Units | 126 | 87.5% |
| Renter-Occupied Housing Units | 18 | 12.5% |
| Total Occupied Housing Units | 144 | 100.0% |
Occupancy by Household Size in Prairie City
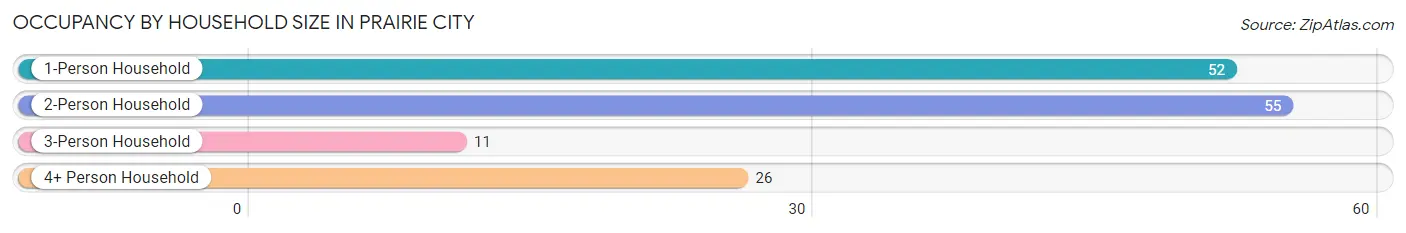
| Household Size | # Housing Units | % Housing Units |
| 1-Person Household | 52 | 36.1% |
| 2-Person Household | 55 | 38.2% |
| 3-Person Household | 11 | 7.6% |
| 4+ Person Household | 26 | 18.1% |
| Total Housing Units | 144 | 100.0% |
Occupancy by Ownership by Household Size in Prairie City
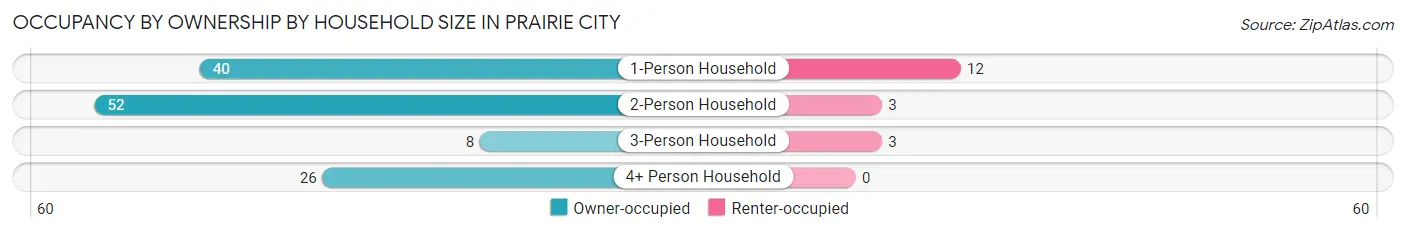
| Household Size | Owner-occupied | Renter-occupied |
| 1-Person Household | 40 (76.9%) | 12 (23.1%) |
| 2-Person Household | 52 (94.6%) | 3 (5.4%) |
| 3-Person Household | 8 (72.7%) | 3 (27.3%) |
| 4+ Person Household | 26 (100.0%) | 0 (0.0%) |
| Total Housing Units | 126 (87.5%) | 18 (12.5%) |
Occupancy by Educational Attainment in Prairie City
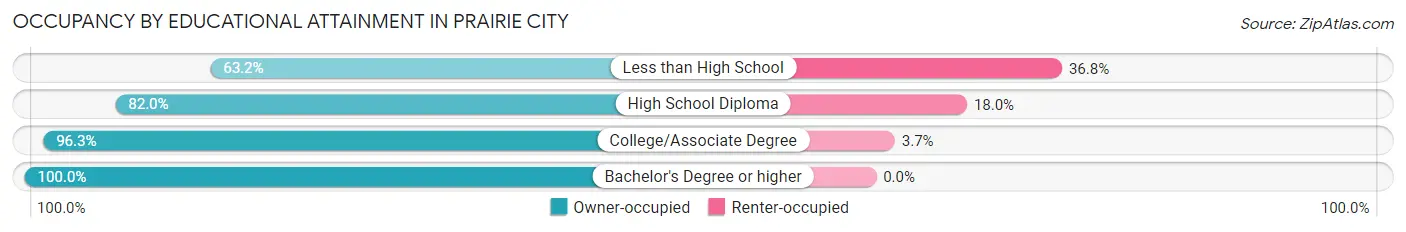
| Household Size | Owner-occupied | Renter-occupied |
| Less than High School | 12 (63.2%) | 7 (36.8%) |
| High School Diploma | 41 (82.0%) | 9 (18.0%) |
| College/Associate Degree | 52 (96.3%) | 2 (3.7%) |
| Bachelor's Degree or higher | 21 (100.0%) | 0 (0.0%) |
Occupancy by Age of Householder in Prairie City
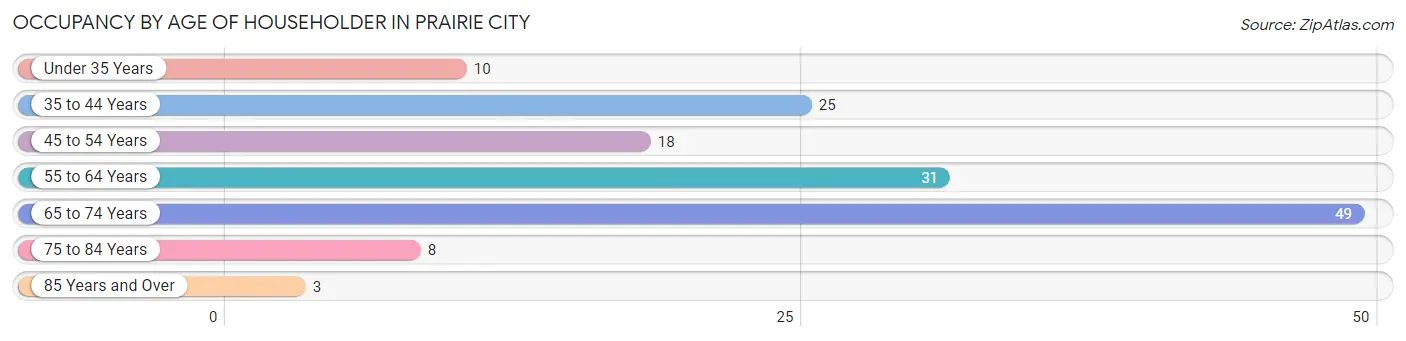
| Age Bracket | # Households | % Households |
| Under 35 Years | 10 | 6.9% |
| 35 to 44 Years | 25 | 17.4% |
| 45 to 54 Years | 18 | 12.5% |
| 55 to 64 Years | 31 | 21.5% |
| 65 to 74 Years | 49 | 34.0% |
| 75 to 84 Years | 8 | 5.6% |
| 85 Years and Over | 3 | 2.1% |
| Total | 144 | 100.0% |
Housing Finances in Prairie City
Median Income by Occupancy in Prairie City
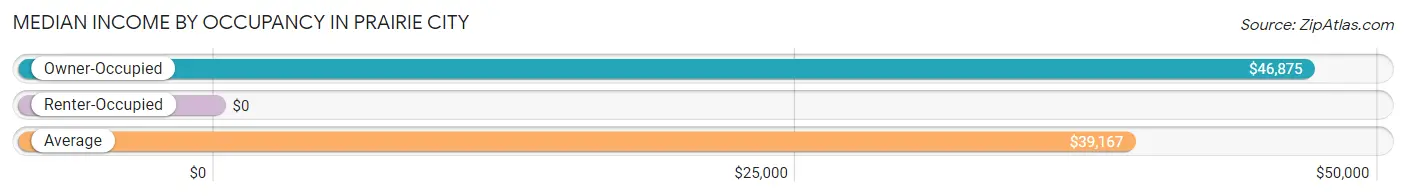
| Occupancy Type | # Households | Median Income |
| Owner-Occupied | 126 (87.5%) | $46,875 |
| Renter-Occupied | 18 (12.5%) | $0 |
| Average | 144 (100.0%) | $39,167 |
Occupancy by Householder Income Bracket in Prairie City
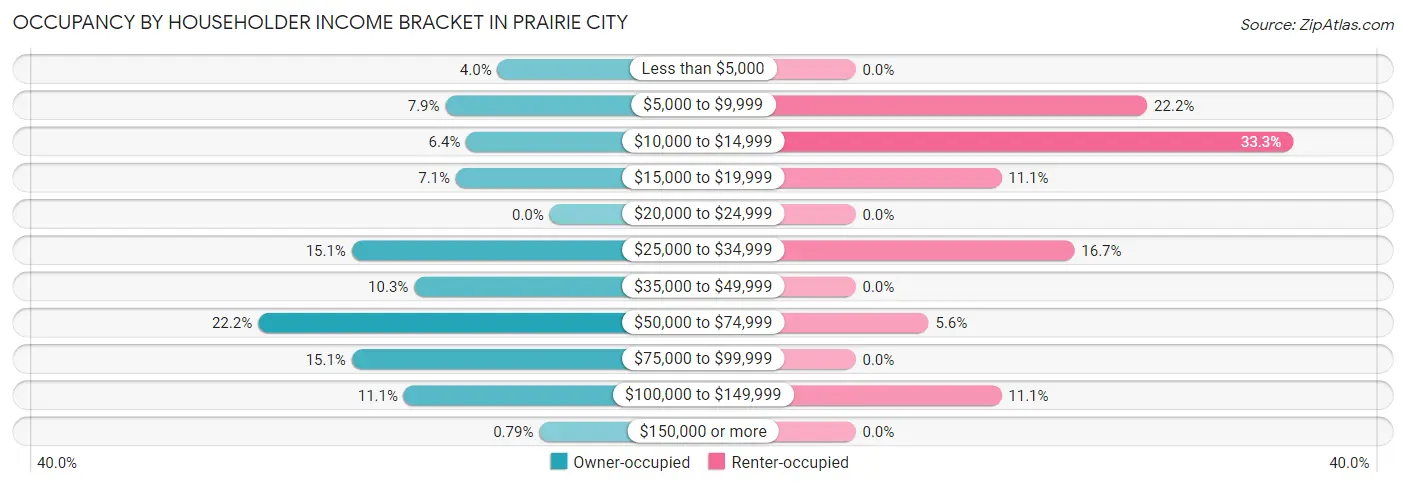
| Income Bracket | Owner-occupied | Renter-occupied |
| Less than $5,000 | 5 (4.0%) | 0 (0.0%) |
| $5,000 to $9,999 | 10 (7.9%) | 4 (22.2%) |
| $10,000 to $14,999 | 8 (6.4%) | 6 (33.3%) |
| $15,000 to $19,999 | 9 (7.1%) | 2 (11.1%) |
| $20,000 to $24,999 | 0 (0.0%) | 0 (0.0%) |
| $25,000 to $34,999 | 19 (15.1%) | 3 (16.7%) |
| $35,000 to $49,999 | 13 (10.3%) | 0 (0.0%) |
| $50,000 to $74,999 | 28 (22.2%) | 1 (5.6%) |
| $75,000 to $99,999 | 19 (15.1%) | 0 (0.0%) |
| $100,000 to $149,999 | 14 (11.1%) | 2 (11.1%) |
| $150,000 or more | 1 (0.8%) | 0 (0.0%) |
| Total | 126 (100.0%) | 18 (100.0%) |
Monthly Housing Cost Tiers in Prairie City
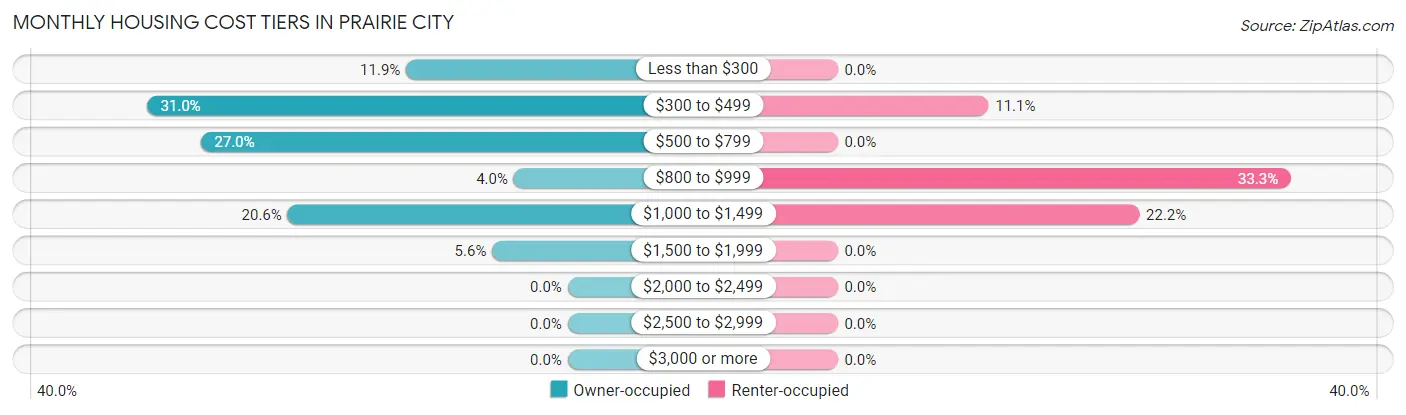
| Monthly Cost | Owner-occupied | Renter-occupied |
| Less than $300 | 15 (11.9%) | 0 (0.0%) |
| $300 to $499 | 39 (30.9%) | 2 (11.1%) |
| $500 to $799 | 34 (27.0%) | 0 (0.0%) |
| $800 to $999 | 5 (4.0%) | 6 (33.3%) |
| $1,000 to $1,499 | 26 (20.6%) | 4 (22.2%) |
| $1,500 to $1,999 | 7 (5.6%) | 0 (0.0%) |
| $2,000 to $2,499 | 0 (0.0%) | 0 (0.0%) |
| $2,500 to $2,999 | 0 (0.0%) | 0 (0.0%) |
| $3,000 or more | 0 (0.0%) | 0 (0.0%) |
| Total | 126 (100.0%) | 18 (100.0%) |
Physical Housing Characteristics in Prairie City
Housing Structures in Prairie City
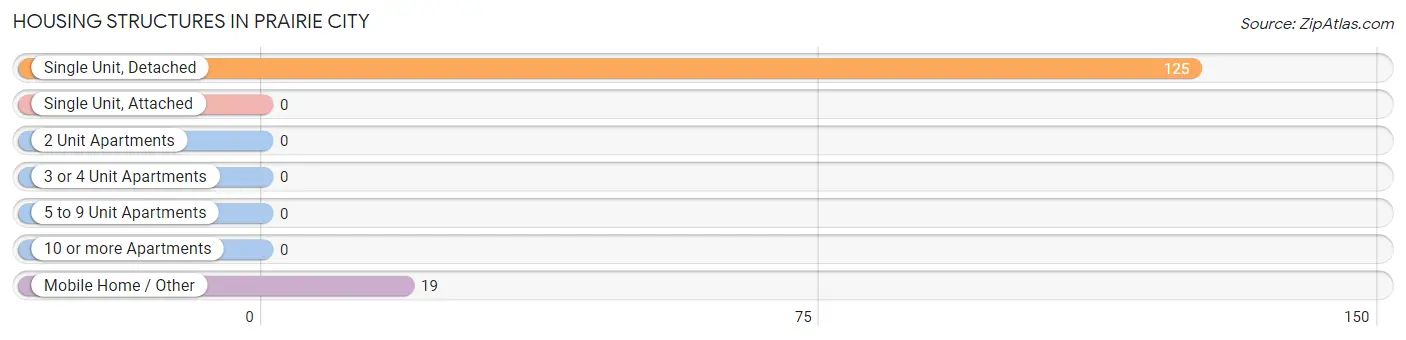
| Structure Type | # Housing Units | % Housing Units |
| Single Unit, Detached | 125 | 86.8% |
| Single Unit, Attached | 0 | 0.0% |
| 2 Unit Apartments | 0 | 0.0% |
| 3 or 4 Unit Apartments | 0 | 0.0% |
| 5 to 9 Unit Apartments | 0 | 0.0% |
| 10 or more Apartments | 0 | 0.0% |
| Mobile Home / Other | 19 | 13.2% |
| Total | 144 | 100.0% |
Housing Structures by Occupancy in Prairie City
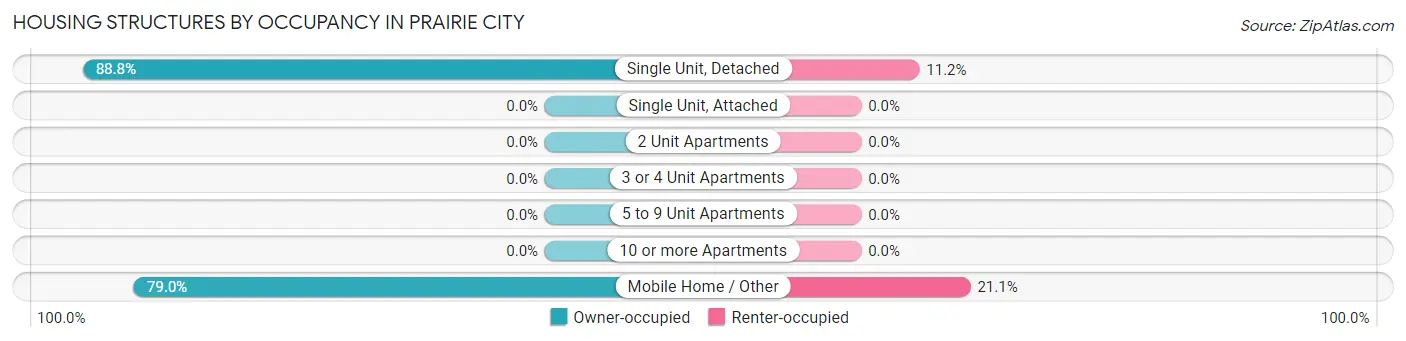
| Structure Type | Owner-occupied | Renter-occupied |
| Single Unit, Detached | 111 (88.8%) | 14 (11.2%) |
| Single Unit, Attached | 0 (0.0%) | 0 (0.0%) |
| 2 Unit Apartments | 0 (0.0%) | 0 (0.0%) |
| 3 or 4 Unit Apartments | 0 (0.0%) | 0 (0.0%) |
| 5 to 9 Unit Apartments | 0 (0.0%) | 0 (0.0%) |
| 10 or more Apartments | 0 (0.0%) | 0 (0.0%) |
| Mobile Home / Other | 15 (78.9%) | 4 (21.0%) |
| Total | 126 (87.5%) | 18 (12.5%) |
Housing Structures by Number of Rooms in Prairie City
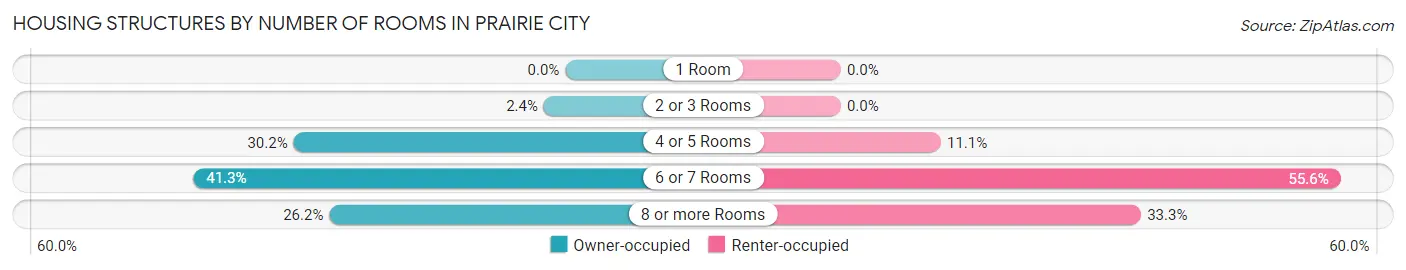
| Number of Rooms | Owner-occupied | Renter-occupied |
| 1 Room | 0 (0.0%) | 0 (0.0%) |
| 2 or 3 Rooms | 3 (2.4%) | 0 (0.0%) |
| 4 or 5 Rooms | 38 (30.2%) | 2 (11.1%) |
| 6 or 7 Rooms | 52 (41.3%) | 10 (55.6%) |
| 8 or more Rooms | 33 (26.2%) | 6 (33.3%) |
| Total | 126 (100.0%) | 18 (100.0%) |
Housing Structure by Heating Type in Prairie City
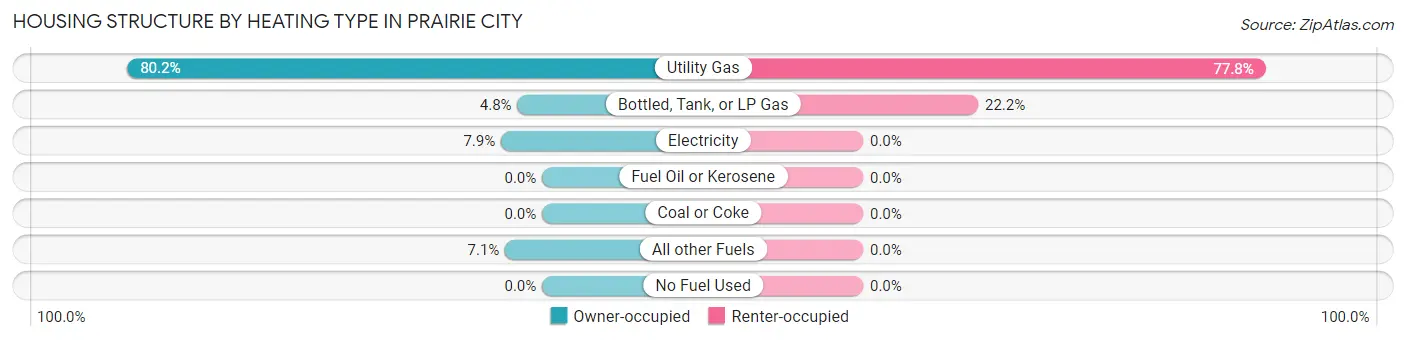
| Heating Type | Owner-occupied | Renter-occupied |
| Utility Gas | 101 (80.2%) | 14 (77.8%) |
| Bottled, Tank, or LP Gas | 6 (4.8%) | 4 (22.2%) |
| Electricity | 10 (7.9%) | 0 (0.0%) |
| Fuel Oil or Kerosene | 0 (0.0%) | 0 (0.0%) |
| Coal or Coke | 0 (0.0%) | 0 (0.0%) |
| All other Fuels | 9 (7.1%) | 0 (0.0%) |
| No Fuel Used | 0 (0.0%) | 0 (0.0%) |
| Total | 126 (100.0%) | 18 (100.0%) |
Household Vehicle Usage in Prairie City
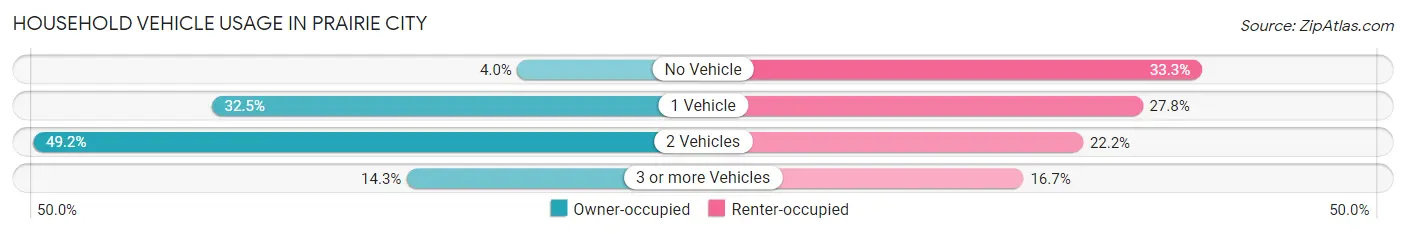
| Vehicles per Household | Owner-occupied | Renter-occupied |
| No Vehicle | 5 (4.0%) | 6 (33.3%) |
| 1 Vehicle | 41 (32.5%) | 5 (27.8%) |
| 2 Vehicles | 62 (49.2%) | 4 (22.2%) |
| 3 or more Vehicles | 18 (14.3%) | 3 (16.7%) |
| Total | 126 (100.0%) | 18 (100.0%) |
Real Estate & Mortgages in Prairie City
Real Estate and Mortgage Overview in Prairie City
| Characteristic | Without Mortgage | With Mortgage |
| Housing Units | 65 | 61 |
| Median Property Value | $57,200 | $88,800 |
| Median Household Income | $28,750 | $1 |
| Monthly Housing Costs | $417 | $0 |
| Real Estate Taxes | $700 | $2 |
Property Value by Mortgage Status in Prairie City
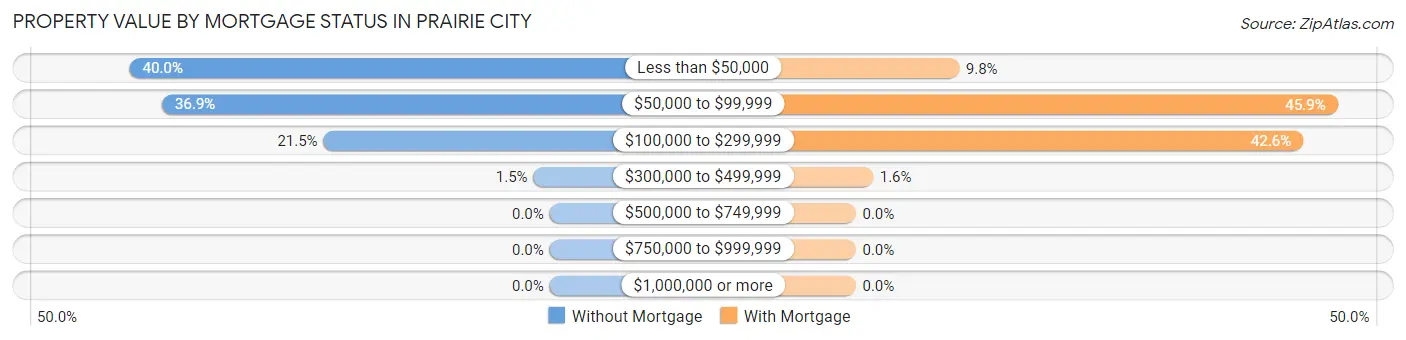
| Property Value | Without Mortgage | With Mortgage |
| Less than $50,000 | 26 (40.0%) | 6 (9.8%) |
| $50,000 to $99,999 | 24 (36.9%) | 28 (45.9%) |
| $100,000 to $299,999 | 14 (21.5%) | 26 (42.6%) |
| $300,000 to $499,999 | 1 (1.5%) | 1 (1.6%) |
| $500,000 to $749,999 | 0 (0.0%) | 0 (0.0%) |
| $750,000 to $999,999 | 0 (0.0%) | 0 (0.0%) |
| $1,000,000 or more | 0 (0.0%) | 0 (0.0%) |
| Total | 65 (100.0%) | 61 (100.0%) |
Household Income by Mortgage Status in Prairie City
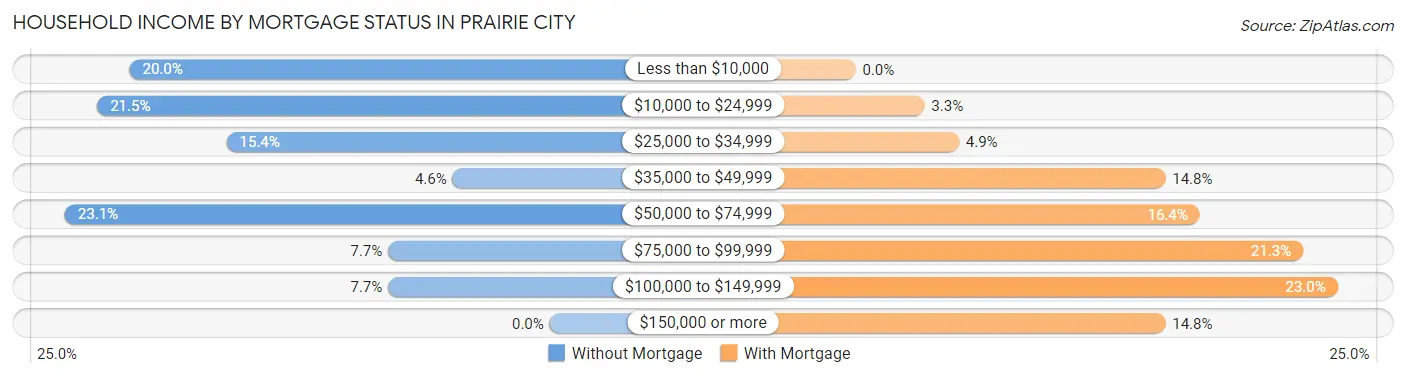
| Household Income | Without Mortgage | With Mortgage |
| Less than $10,000 | 13 (20.0%) | 0 (0.0%) |
| $10,000 to $24,999 | 14 (21.5%) | 2 (3.3%) |
| $25,000 to $34,999 | 10 (15.4%) | 3 (4.9%) |
| $35,000 to $49,999 | 3 (4.6%) | 9 (14.7%) |
| $50,000 to $74,999 | 15 (23.1%) | 10 (16.4%) |
| $75,000 to $99,999 | 5 (7.7%) | 13 (21.3%) |
| $100,000 to $149,999 | 5 (7.7%) | 14 (23.0%) |
| $150,000 or more | 0 (0.0%) | 9 (14.7%) |
| Total | 65 (100.0%) | 61 (100.0%) |
Property Value to Household Income Ratio in Prairie City
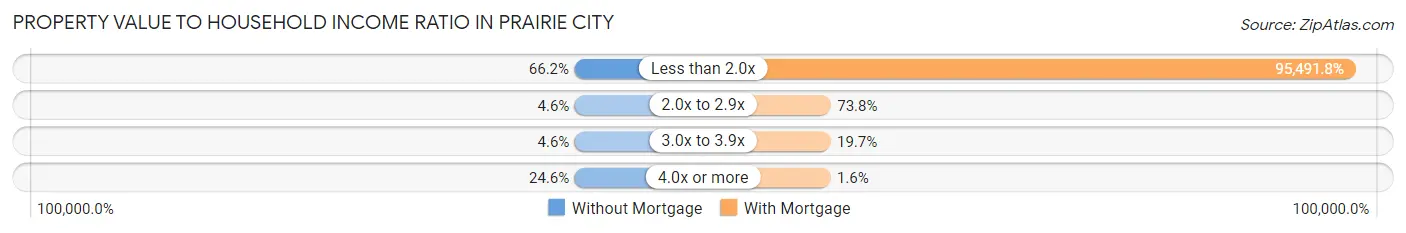
| Value-to-Income Ratio | Without Mortgage | With Mortgage |
| Less than 2.0x | 43 (66.1%) | 58,250 (95,491.8%) |
| 2.0x to 2.9x | 3 (4.6%) | 45 (73.8%) |
| 3.0x to 3.9x | 3 (4.6%) | 12 (19.7%) |
| 4.0x or more | 16 (24.6%) | 1 (1.6%) |
| Total | 65 (100.0%) | 61 (100.0%) |
Real Estate Taxes by Mortgage Status in Prairie City
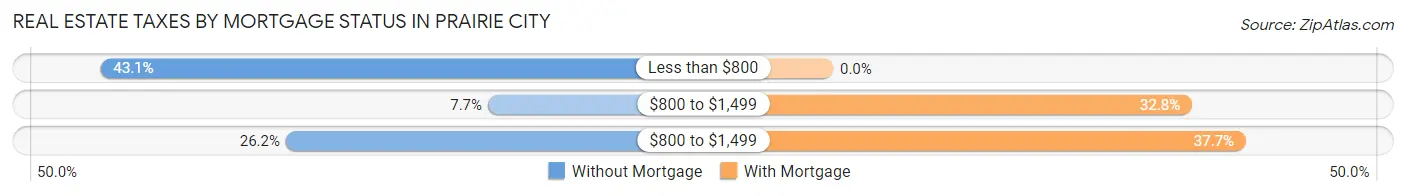
| Property Taxes | Without Mortgage | With Mortgage |
| Less than $800 | 28 (43.1%) | 0 (0.0%) |
| $800 to $1,499 | 5 (7.7%) | 20 (32.8%) |
| $800 to $1,499 | 17 (26.2%) | 23 (37.7%) |
| Total | 65 (100.0%) | 61 (100.0%) |
Health & Disability in Prairie City
Health Insurance Coverage by Age in Prairie City
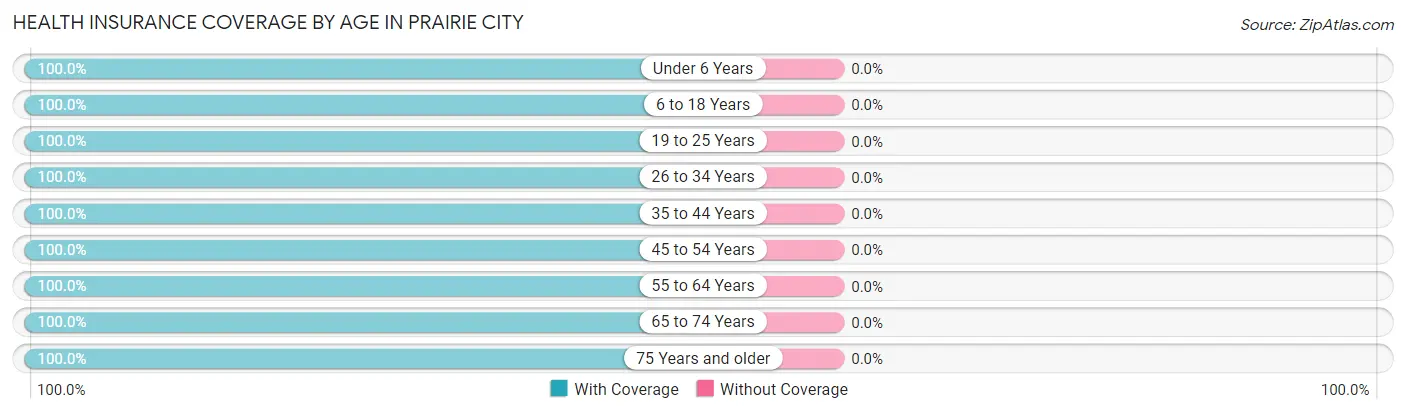
| Age Bracket | With Coverage | Without Coverage |
| Under 6 Years | 13 (100.0%) | 0 (0.0%) |
| 6 to 18 Years | 59 (100.0%) | 0 (0.0%) |
| 19 to 25 Years | 31 (100.0%) | 0 (0.0%) |
| 26 to 34 Years | 8 (100.0%) | 0 (0.0%) |
| 35 to 44 Years | 42 (100.0%) | 0 (0.0%) |
| 45 to 54 Years | 41 (100.0%) | 0 (0.0%) |
| 55 to 64 Years | 56 (100.0%) | 0 (0.0%) |
| 65 to 74 Years | 68 (100.0%) | 0 (0.0%) |
| 75 Years and older | 12 (100.0%) | 0 (0.0%) |
| Total | 330 (100.0%) | 0 (0.0%) |
Health Insurance Coverage by Citizenship Status in Prairie City
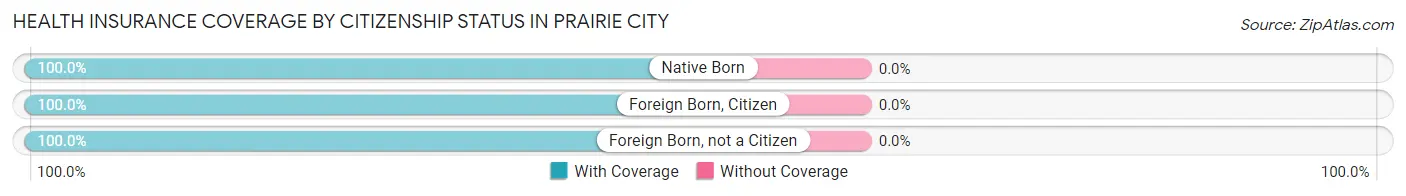
| Citizenship Status | With Coverage | Without Coverage |
| Native Born | 13 (100.0%) | 0 (0.0%) |
| Foreign Born, Citizen | 59 (100.0%) | 0 (0.0%) |
| Foreign Born, not a Citizen | 31 (100.0%) | 0 (0.0%) |
Health Insurance Coverage by Household Income in Prairie City
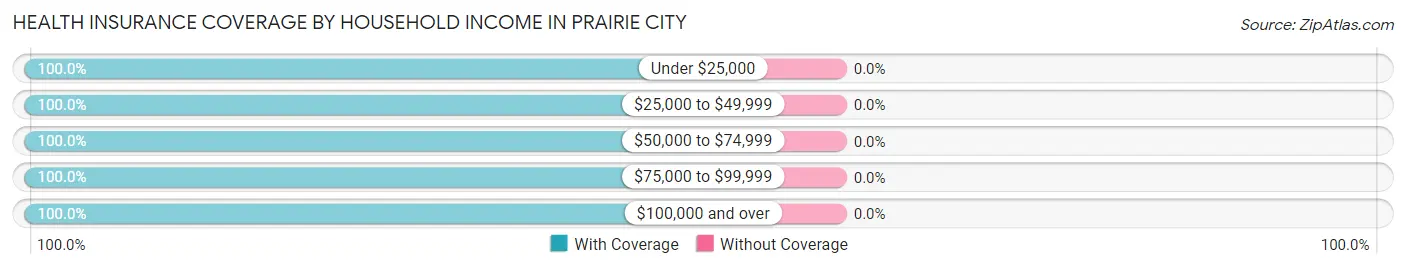
| Household Income | With Coverage | Without Coverage |
| Under $25,000 | 51 (100.0%) | 0 (0.0%) |
| $25,000 to $49,999 | 96 (100.0%) | 0 (0.0%) |
| $50,000 to $74,999 | 74 (100.0%) | 0 (0.0%) |
| $75,000 to $99,999 | 54 (100.0%) | 0 (0.0%) |
| $100,000 and over | 55 (100.0%) | 0 (0.0%) |
Public vs Private Health Insurance Coverage by Age in Prairie City
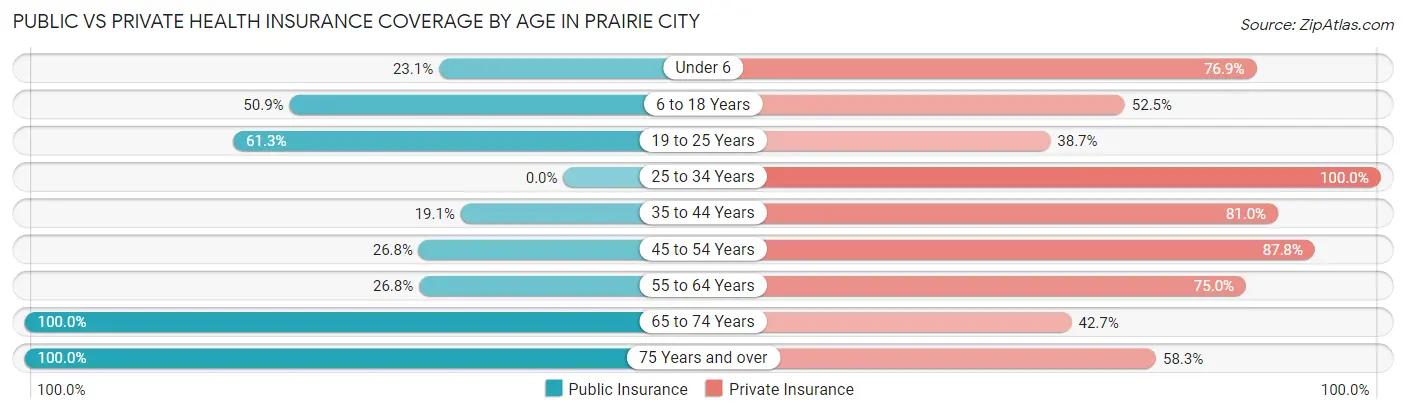
| Age Bracket | Public Insurance | Private Insurance |
| Under 6 | 3 (23.1%) | 10 (76.9%) |
| 6 to 18 Years | 30 (50.8%) | 31 (52.5%) |
| 19 to 25 Years | 19 (61.3%) | 12 (38.7%) |
| 25 to 34 Years | 0 (0.0%) | 8 (100.0%) |
| 35 to 44 Years | 8 (19.1%) | 34 (80.9%) |
| 45 to 54 Years | 11 (26.8%) | 36 (87.8%) |
| 55 to 64 Years | 15 (26.8%) | 42 (75.0%) |
| 65 to 74 Years | 68 (100.0%) | 29 (42.6%) |
| 75 Years and over | 12 (100.0%) | 7 (58.3%) |
| Total | 166 (50.3%) | 209 (63.3%) |
Disability Status by Sex by Age in Prairie City
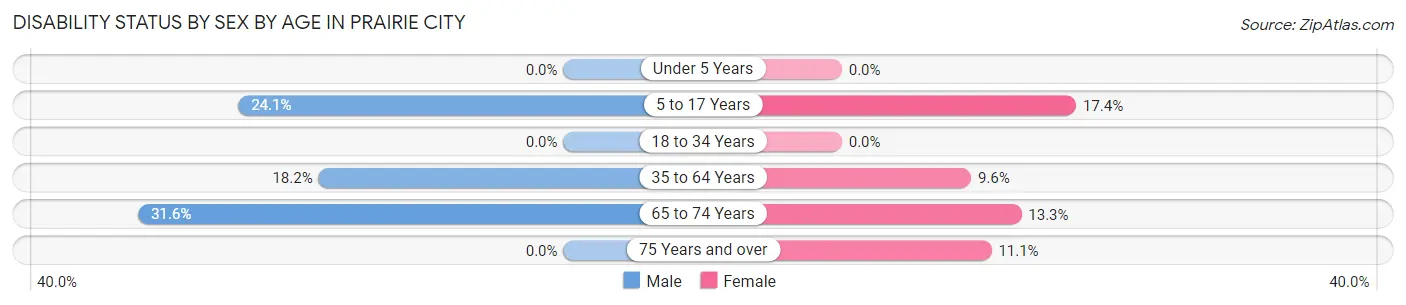
| Age Bracket | Male | Female |
| Under 5 Years | 0 (0.0%) | 0 (0.0%) |
| 5 to 17 Years | 7 (24.1%) | 4 (17.4%) |
| 18 to 34 Years | 0 (0.0%) | 0 (0.0%) |
| 35 to 64 Years | 12 (18.2%) | 7 (9.6%) |
| 65 to 74 Years | 12 (31.6%) | 4 (13.3%) |
| 75 Years and over | 0 (0.0%) | 1 (11.1%) |
Disability Class by Sex by Age in Prairie City
Disability Class: Hearing Difficulty
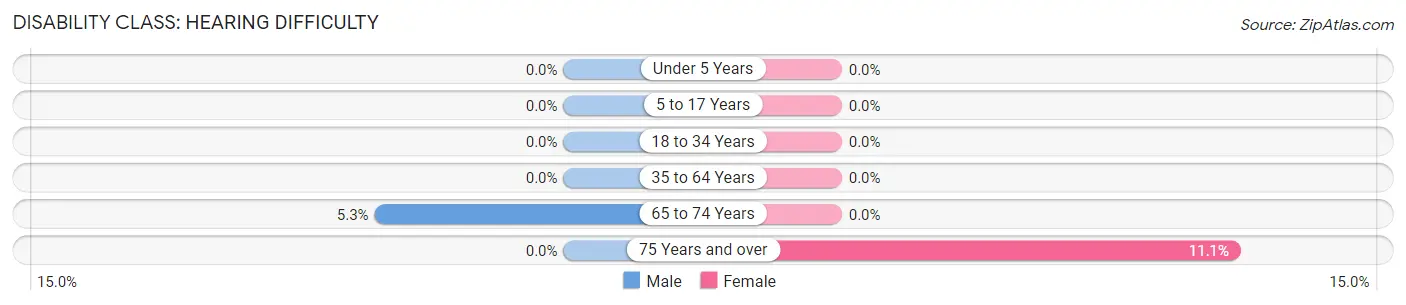
| Age Bracket | Male | Female |
| Under 5 Years | 0 (0.0%) | 0 (0.0%) |
| 5 to 17 Years | 0 (0.0%) | 0 (0.0%) |
| 18 to 34 Years | 0 (0.0%) | 0 (0.0%) |
| 35 to 64 Years | 0 (0.0%) | 0 (0.0%) |
| 65 to 74 Years | 2 (5.3%) | 0 (0.0%) |
| 75 Years and over | 0 (0.0%) | 1 (11.1%) |
Disability Class: Vision Difficulty
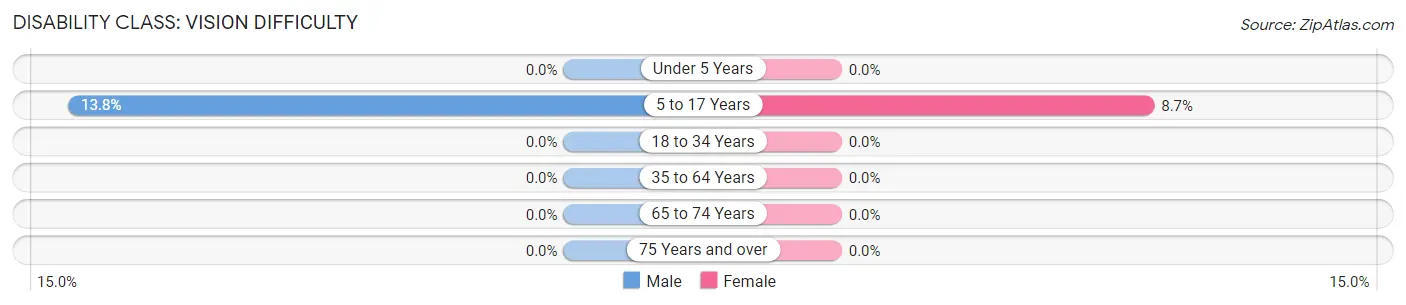
| Age Bracket | Male | Female |
| Under 5 Years | 0 (0.0%) | 0 (0.0%) |
| 5 to 17 Years | 4 (13.8%) | 2 (8.7%) |
| 18 to 34 Years | 0 (0.0%) | 0 (0.0%) |
| 35 to 64 Years | 0 (0.0%) | 0 (0.0%) |
| 65 to 74 Years | 0 (0.0%) | 0 (0.0%) |
| 75 Years and over | 0 (0.0%) | 0 (0.0%) |
Disability Class: Cognitive Difficulty
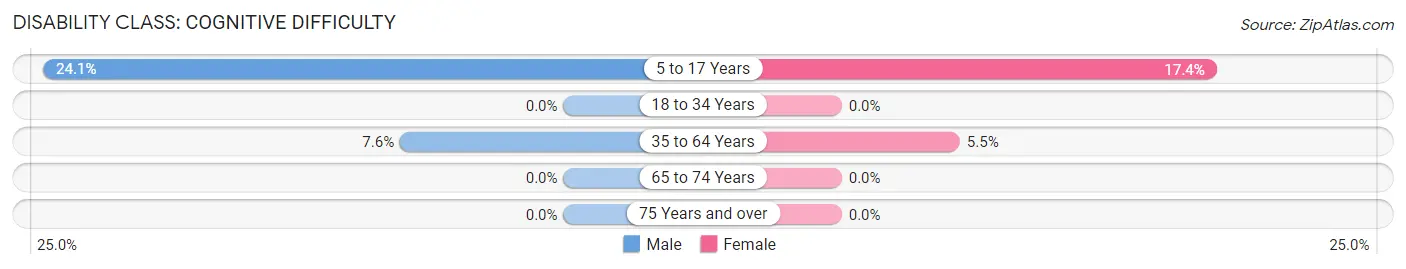
| Age Bracket | Male | Female |
| 5 to 17 Years | 7 (24.1%) | 4 (17.4%) |
| 18 to 34 Years | 0 (0.0%) | 0 (0.0%) |
| 35 to 64 Years | 5 (7.6%) | 4 (5.5%) |
| 65 to 74 Years | 0 (0.0%) | 0 (0.0%) |
| 75 Years and over | 0 (0.0%) | 0 (0.0%) |
Disability Class: Ambulatory Difficulty
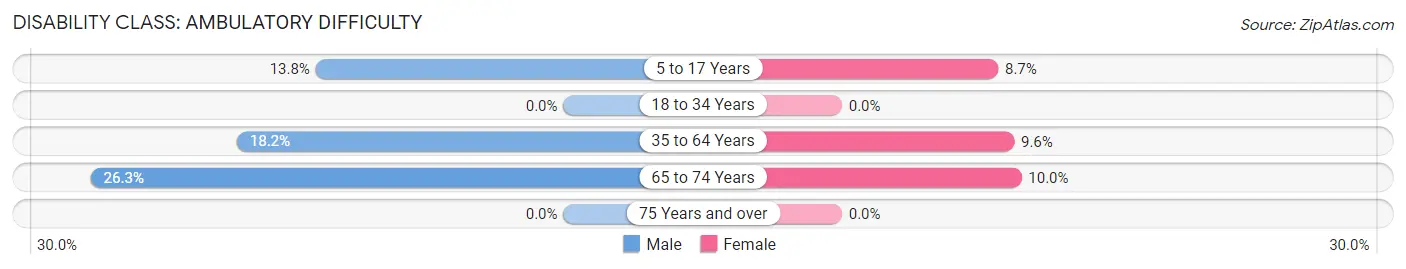
| Age Bracket | Male | Female |
| 5 to 17 Years | 4 (13.8%) | 2 (8.7%) |
| 18 to 34 Years | 0 (0.0%) | 0 (0.0%) |
| 35 to 64 Years | 12 (18.2%) | 7 (9.6%) |
| 65 to 74 Years | 10 (26.3%) | 3 (10.0%) |
| 75 Years and over | 0 (0.0%) | 0 (0.0%) |
Disability Class: Self-Care Difficulty
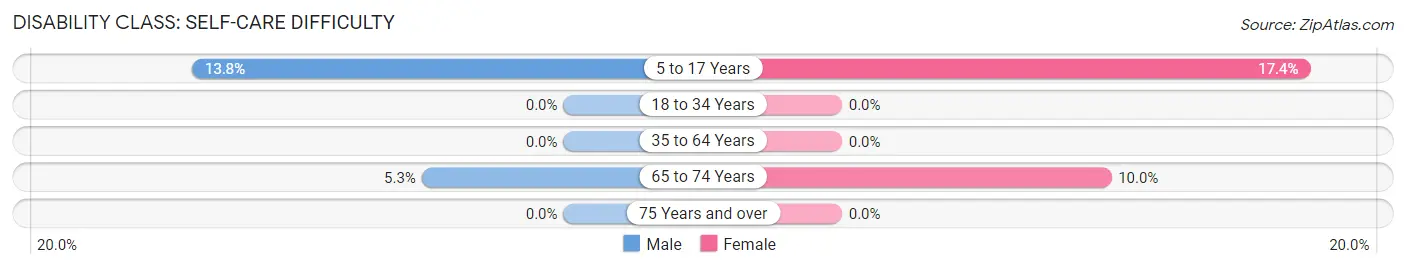
| Age Bracket | Male | Female |
| 5 to 17 Years | 4 (13.8%) | 4 (17.4%) |
| 18 to 34 Years | 0 (0.0%) | 0 (0.0%) |
| 35 to 64 Years | 0 (0.0%) | 0 (0.0%) |
| 65 to 74 Years | 2 (5.3%) | 3 (10.0%) |
| 75 Years and over | 0 (0.0%) | 0 (0.0%) |
Technology Access in Prairie City
Computing Device Access in Prairie City
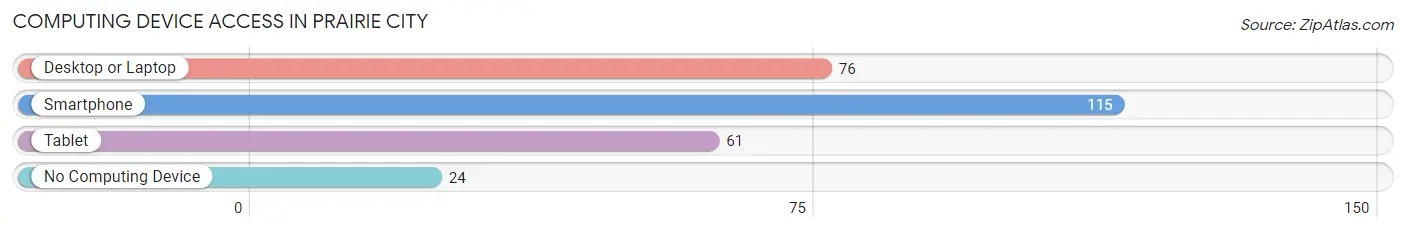
| Device Type | # Households | % Households |
| Desktop or Laptop | 76 | 52.8% |
| Smartphone | 115 | 79.9% |
| Tablet | 61 | 42.4% |
| No Computing Device | 24 | 16.7% |
| Total | 144 | 100.0% |
Internet Access in Prairie City
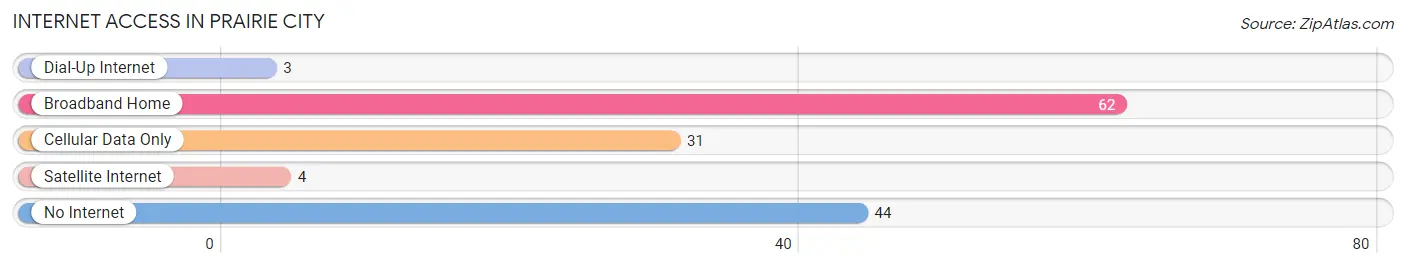
| Internet Type | # Households | % Households |
| Dial-Up Internet | 3 | 2.1% |
| Broadband Home | 62 | 43.1% |
| Cellular Data Only | 31 | 21.5% |
| Satellite Internet | 4 | 2.8% |
| No Internet | 44 | 30.6% |
| Total | 144 | 100.0% |
Prairie City Summary
Prairie City, Illinois is a small village located in the northern part of the state, in the county of McDonough. It is situated on the banks of the Mississippi River, and is part of the Macomb-Colchester Micropolitan Statistical Area. The village has a population of just over 1,000 people, and is known for its rural charm and small-town atmosphere.
History
Prairie City was founded in 1836 by a group of settlers from the nearby town of Colchester. The settlers were looking for a place to settle and farm, and the area around Prairie City was ideal for this purpose. The village was named after the prairie grass that grew in abundance in the area. The first settlers built a log cabin and a small store, and the village quickly grew. By the late 1800s, Prairie City had become a thriving agricultural community, with a population of over 1,000 people.
In the early 1900s, the village began to experience a decline in population as many of the residents moved away to larger cities. However, the village was able to maintain its rural charm and small-town atmosphere. In the 1950s, the village was incorporated, and the population began to slowly increase. Today, Prairie City is a small but vibrant community, with a population of just over 1,000 people.
Geography
Prairie City is located in the northern part of the state of Illinois, in the county of McDonough. It is situated on the banks of the Mississippi River, and is part of the Macomb-Colchester Micropolitan Statistical Area. The village is surrounded by rolling hills and farmland, and is located approximately 30 miles south of the city of Peoria.
The climate in Prairie City is typical of the Midwest, with hot summers and cold winters. The average temperature in the summer months is around 75 degrees Fahrenheit, while the average temperature in the winter months is around 25 degrees Fahrenheit. The village receives an average of 40 inches of precipitation per year, with most of it falling in the spring and summer months.
Economy
The economy of Prairie City is largely based on agriculture. The village is home to several farms, which produce a variety of crops, including corn, soybeans, and wheat. In addition, the village is home to several small businesses, including a grocery store, a hardware store, and a few restaurants.
The village also has a small manufacturing sector, which produces a variety of products, including furniture, clothing, and automotive parts. The village is also home to a few small technology companies, which provide services to the local community.
Demographics
As of the 2010 census, the population of Prairie City was 1,072. The racial makeup of the village was 97.3% White, 0.7% African American, 0.3% Native American, 0.2% Asian, 0.1% Pacific Islander, and 1.4% from other races. The median household income in the village was $45,000, and the median age was 40.
Conclusion
Prairie City, Illinois is a small village located in the northern part of the state, in the county of McDonough. It is situated on the banks of the Mississippi River, and is part of the Macomb-Colchester Micropolitan Statistical Area. The village has a population of just over 1,000 people, and is known for its rural charm and small-town atmosphere. The economy of Prairie City is largely based on agriculture, and the village is home to several small businesses. The racial makeup of the village is predominantly White, with a small percentage of African American, Native American, Asian, and Pacific Islander residents.
Common Questions
What is Per Capita Income in Prairie City?
Per Capita income in Prairie City is $22,454.
What is the Median Family Income in Prairie City?
Median Family Income in Prairie City is $67,656.
What is the Median Household income in Prairie City?
Median Household Income in Prairie City is $39,167.
What is Income or Wage Gap in Prairie City?
Income or Wage Gap in Prairie City is 34.9%.
Women in Prairie City earn 65.1 cents for every dollar earned by a man.
What is Inequality or Gini Index in Prairie City?
Inequality or Gini Index in Prairie City is 0.41.
What is the Total Population of Prairie City?
Total Population of Prairie City is 349.
What is the Total Male Population of Prairie City?
Total Male Population of Prairie City is 161.
What is the Total Female Population of Prairie City?
Total Female Population of Prairie City is 188.
What is the Ratio of Males per 100 Females in Prairie City?
There are 85.64 Males per 100 Females in Prairie City.
What is the Ratio of Females per 100 Males in Prairie City?
There are 116.77 Females per 100 Males in Prairie City.
What is the Median Population Age in Prairie City?
Median Population Age in Prairie City is 51.3 Years.
What is the Average Family Size in Prairie City
Average Family Size in Prairie City is 3.0 People.
What is the Average Household Size in Prairie City
Average Household Size in Prairie City is 2.3 People.
How Large is the Labor Force in Prairie City?
There are 140 People in the Labor Forcein in Prairie City.
What is the Percentage of People in the Labor Force in Prairie City?
48.6% of People are in the Labor Force in Prairie City.
What is the Unemployment Rate in Prairie City?
Unemployment Rate in Prairie City is 2.1%.