Cities with the Highest Percentage of Korean Population in Montana
RELATED REPORTS & OPTIONS
Korean
Montana
Compare Cities
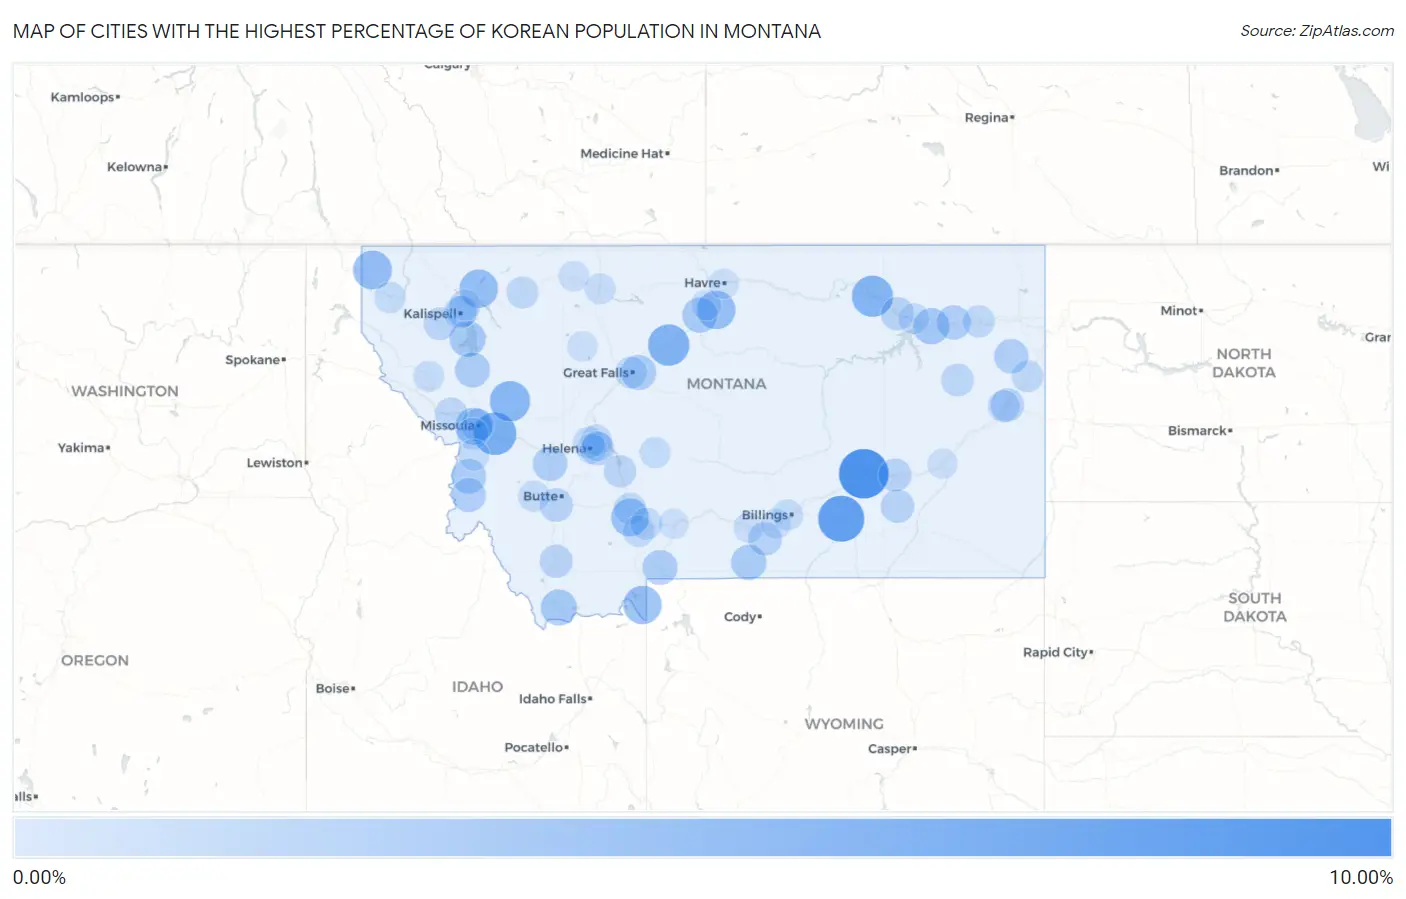
Map of Cities with the Highest Percentage of Korean Population in Montana
0.00%
10.00%
Cities with the Highest Percentage of Korean Population in Montana
| City | Korean | vs State | vs National | |
| 1. | Hysham | 8.19% | 0.50%(+7.69)#1 | 1.31%(+6.88)#345 |
| 2. | Hardin | 6.73% | 0.50%(+6.23)#2 | 1.31%(+5.42)#451 |
| 3. | Clinton | 5.23% | 0.50%(+4.74)#3 | 1.31%(+3.92)#652 |
| 4. | Fort Benton | 4.66% | 0.50%(+4.16)#4 | 1.31%(+3.35)#764 |
| 5. | Hinsdale | 4.60% | 0.50%(+4.10)#5 | 1.31%(+3.29)#776 |
| 6. | Seeley Lake | 4.21% | 0.50%(+3.72)#6 | 1.31%(+2.90)#863 |
| 7. | Sylvanite | 3.57% | 0.50%(+3.07)#7 | 1.31%(+2.26)#1,074 |
| 8. | St Pierre | 3.47% | 0.50%(+2.97)#8 | 1.31%(+2.16)#1,115 |
| 9. | West Glacier | 3.45% | 0.50%(+2.95)#9 | 1.31%(+2.14)#1,125 |
| 10. | West Yellowstone | 3.40% | 0.50%(+2.90)#10 | 1.31%(+2.09)#1,141 |
| 11. | Amsterdam | 3.12% | 0.50%(+2.63)#11 | 1.31%(+1.82)#1,264 |
| 12. | Orchard Homes | 2.77% | 0.50%(+2.27)#12 | 1.31%(+1.46)#1,475 |
| 13. | Frazer | 2.47% | 0.50%(+1.97)#13 | 1.31%(+1.16)#1,668 |
| 14. | Lima | 2.39% | 0.50%(+1.89)#14 | 1.31%(+1.08)#1,717 |
| 15. | Rollins | 2.38% | 0.50%(+1.88)#15 | 1.31%(+1.07)#1,728 |
| 16. | Big Sandy | 2.13% | 0.50%(+1.63)#16 | 1.31%(+0.820)#1,954 |
| 17. | Red Lodge | 2.07% | 0.50%(+1.57)#17 | 1.31%(+0.758)#2,033 |
| 18. | Malmstrom Afb | 2.01% | 0.50%(+1.51)#18 | 1.31%(+0.699)#2,089 |
| 19. | Ronan | 1.98% | 0.50%(+1.48)#19 | 1.31%(+0.671)#2,115 |
| 20. | Corwin Springs | 1.94% | 0.50%(+1.44)#20 | 1.31%(+0.626)#2,167 |
| 21. | Hamilton | 1.87% | 0.50%(+1.37)#21 | 1.31%(+0.563)#2,248 |
| 22. | Deer Lodge | 1.82% | 0.50%(+1.32)#22 | 1.31%(+0.505)#2,332 |
| 23. | Fox Lake | 1.72% | 0.50%(+1.23)#23 | 1.31%(+0.414)#2,469 |
| 24. | Wolf Point | 1.71% | 0.50%(+1.21)#24 | 1.31%(+0.398)#2,495 |
| 25. | Darby | 1.64% | 0.50%(+1.14)#25 | 1.31%(+0.329)#2,611 |
| 26. | Joliet | 1.40% | 0.50%(+0.901)#26 | 1.31%(+0.090)#3,069 |
| 27. | Colstrip | 1.33% | 0.50%(+0.834)#27 | 1.31%(+0.022)#3,220 |
| 28. | East Helena | 1.31% | 0.50%(+0.814)#28 | 1.31%(+0.002)#3,268 |
| 29. | Butte Silver Bow Balance | 1.31% | 0.50%(+0.812)#29 | 1.31%(+0.001)#3,272 |
| 30. | Glendive | 1.30% | 0.50%(+0.798)#30 | 1.31%(-0.014)#3,304 |
| 31. | Glasgow | 1.25% | 0.50%(+0.749)#31 | 1.31%(-0.063)#3,407 |
| 32. | Forsyth | 1.23% | 0.50%(+0.736)#32 | 1.31%(-0.075)#3,430 |
| 33. | Dillon | 1.19% | 0.50%(+0.689)#33 | 1.31%(-0.122)#3,533 |
| 34. | Marion | 1.07% | 0.50%(+0.568)#34 | 1.31%(-0.244)#3,853 |
| 35. | Missoula | 1.05% | 0.50%(+0.550)#35 | 1.31%(-0.262)#3,911 |
| 36. | Circle | 1.04% | 0.50%(+0.537)#36 | 1.31%(-0.275)#3,951 |
| 37. | Kalispell | 0.98% | 0.50%(+0.483)#37 | 1.31%(-0.329)#4,132 |
| 38. | Alberton | 0.94% | 0.50%(+0.440)#38 | 1.31%(-0.372)#4,266 |
| 39. | Townsend | 0.92% | 0.50%(+0.421)#39 | 1.31%(-0.391)#4,339 |
| 40. | Manhattan | 0.81% | 0.50%(+0.307)#40 | 1.31%(-0.504)#4,793 |
| 41. | Poplar | 0.79% | 0.50%(+0.293)#41 | 1.31%(-0.518)#4,853 |
| 42. | East Glacier Park Village | 0.76% | 0.50%(+0.265)#42 | 1.31%(-0.547)#4,959 |
| 43. | Great Falls | 0.74% | 0.50%(+0.237)#43 | 1.31%(-0.575)#5,088 |
| 44. | West Glendive | 0.73% | 0.50%(+0.234)#44 | 1.31%(-0.578)#5,101 |
| 45. | Evergreen | 0.72% | 0.50%(+0.218)#45 | 1.31%(-0.593)#5,188 |
| 46. | Savage | 0.68% | 0.50%(+0.182)#46 | 1.31%(-0.630)#5,375 |
| 47. | Gallatin Gateway | 0.68% | 0.50%(+0.179)#47 | 1.31%(-0.633)#5,385 |
| 48. | Bozeman | 0.68% | 0.50%(+0.178)#48 | 1.31%(-0.633)#5,388 |
| 49. | Helena Valley West Central | 0.67% | 0.50%(+0.172)#49 | 1.31%(-0.640)#5,426 |
| 50. | Lolo | 0.61% | 0.50%(+0.114)#50 | 1.31%(-0.698)#5,704 |
| 51. | Libby | 0.53% | 0.50%(+0.027)#51 | 1.31%(-0.785)#6,261 |
| 52. | Anaconda Deer Lodge County | 0.52% | 0.50%(+0.021)#52 | 1.31%(-0.791)#6,303 |
| 53. | Stevensville | 0.49% | 0.50%(-0.008)#53 | 1.31%(-0.819)#6,490 |
| 54. | White Sulphur Springs | 0.45% | 0.50%(-0.049)#54 | 1.31%(-0.860)#6,765 |
| 55. | Helena Valley Northeast | 0.42% | 0.50%(-0.074)#55 | 1.31%(-0.886)#6,916 |
| 56. | Billings | 0.42% | 0.50%(-0.082)#56 | 1.31%(-0.893)#6,972 |
| 57. | Helena Flats | 0.37% | 0.50%(-0.125)#57 | 1.31%(-0.936)#7,264 |
| 58. | Plains | 0.34% | 0.50%(-0.160)#58 | 1.31%(-0.971)#7,542 |
| 59. | Nashua | 0.32% | 0.50%(-0.180)#59 | 1.31%(-0.991)#7,700 |
| 60. | Shelby | 0.29% | 0.50%(-0.204)#60 | 1.31%(-1.02)#7,891 |
| 61. | Cut Bank | 0.23% | 0.50%(-0.270)#61 | 1.31%(-1.08)#8,450 |
| 62. | Rocky Boy West | 0.21% | 0.50%(-0.285)#62 | 1.31%(-1.10)#8,576 |
| 63. | Columbus | 0.21% | 0.50%(-0.291)#63 | 1.31%(-1.10)#8,624 |
| 64. | Helena | 0.12% | 0.50%(-0.378)#64 | 1.31%(-1.19)#9,387 |
| 65. | Choteau | 0.12% | 0.50%(-0.382)#65 | 1.31%(-1.19)#9,413 |
| 66. | Miles City | 0.11% | 0.50%(-0.392)#66 | 1.31%(-1.20)#9,495 |
| 67. | Havre | 0.096% | 0.50%(-0.402)#67 | 1.31%(-1.21)#9,571 |
| 68. | Helena Valley Southeast | 0.085% | 0.50%(-0.413)#68 | 1.31%(-1.22)#9,649 |
| 69. | Laurel | 0.084% | 0.50%(-0.415)#69 | 1.31%(-1.23)#9,666 |
| 70. | Livingston | 0.071% | 0.50%(-0.428)#70 | 1.31%(-1.24)#9,746 |
1
2Common Questions
What are the Top 10 Cities with the Highest Percentage of Korean Population in Montana?
Top 10 Cities with the Highest Percentage of Korean Population in Montana are:
#1
8.19%
#2
6.73%
#3
5.23%
#4
4.66%
#5
4.60%
#6
4.21%
#7
3.57%
#8
3.47%
#9
3.45%
#10
3.40%
What city has the Highest Percentage of Korean Population in Montana?
Hysham has the Highest Percentage of Korean Population in Montana with 8.19%.
What is the Percentage of Korean Population in the State of Montana?
Percentage of Korean Population in Montana is 0.50%.
What is the Percentage of Korean Population in the United States?
Percentage of Korean Population in the United States is 1.31%.