Cities with the Highest Percentage of Korean Population in Arkansas
RELATED REPORTS & OPTIONS
Korean
Arkansas
Compare Cities
Map of Cities with the Highest Percentage of Korean Population in Arkansas
0.00%
5.00%
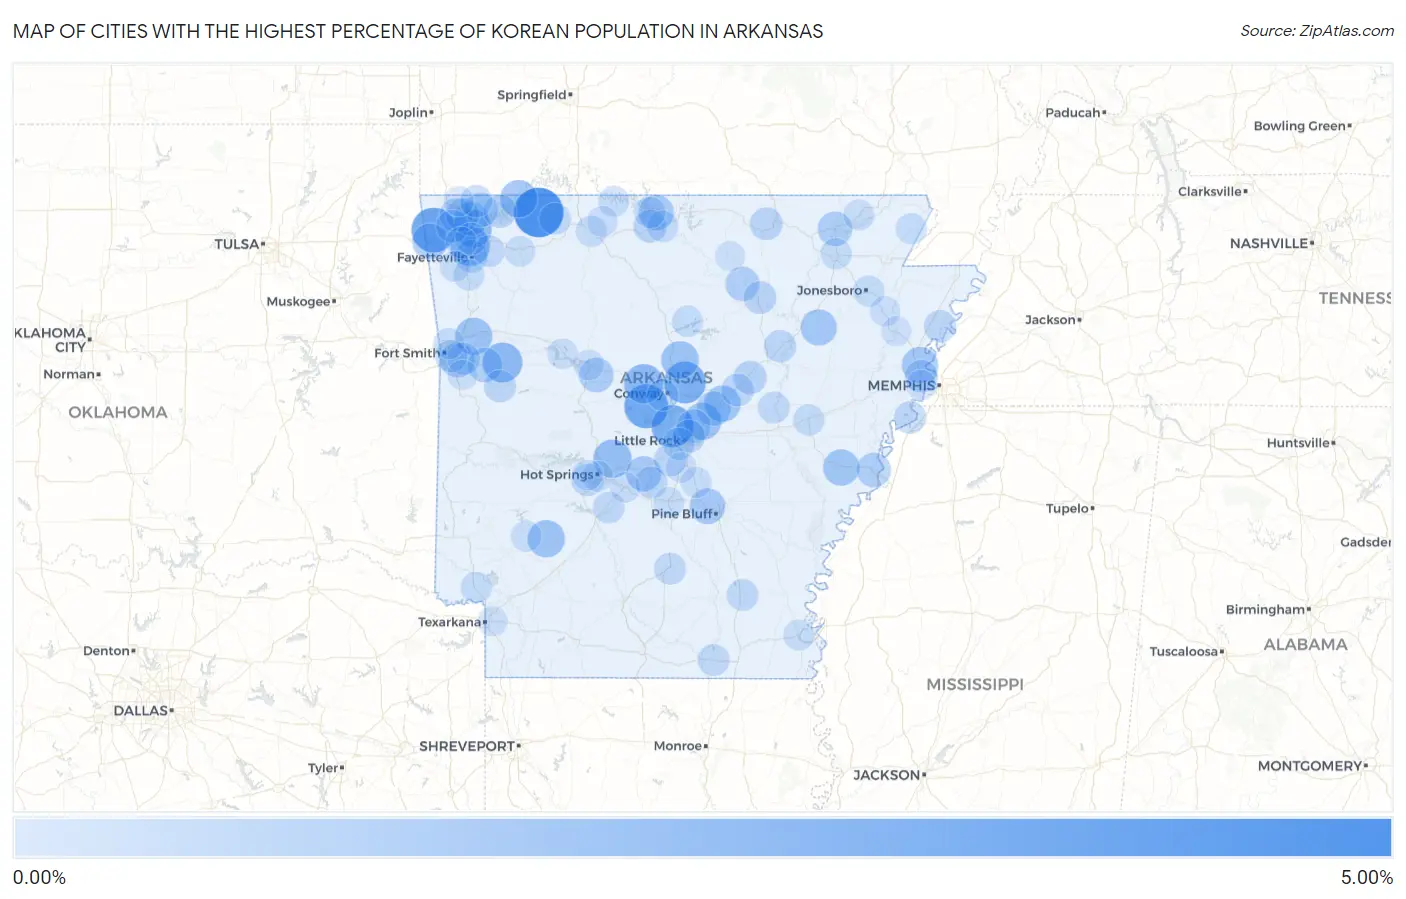
Cities with the Highest Percentage of Korean Population in Arkansas
| City | Korean | vs State | vs National | |
| 1. | Berryville | 4.22% | 0.34%(+3.88)#1 | 1.31%(+2.91)#862 |
| 2. | Gentry | 3.14% | 0.34%(+2.81)#2 | 1.31%(+1.83)#1,251 |
| 3. | Bigelow | 2.98% | 0.34%(+2.64)#3 | 1.31%(+1.67)#1,339 |
| 4. | Maumelle | 2.62% | 0.34%(+2.28)#4 | 1.31%(+1.31)#1,575 |
| 5. | Holland | 2.53% | 0.34%(+2.19)#5 | 1.31%(+1.22)#1,633 |
| 6. | Ratcliff | 2.11% | 0.34%(+1.78)#6 | 1.31%(+0.803)#1,985 |
| 7. | Johnson | 2.02% | 0.34%(+1.69)#7 | 1.31%(+0.715)#2,070 |
| 8. | Plumerville | 2.00% | 0.34%(+1.66)#8 | 1.31%(+0.685)#2,101 |
| 9. | Lowell | 1.79% | 0.34%(+1.45)#9 | 1.31%(+0.479)#2,371 |
| 10. | Fountain Lake | 1.77% | 0.34%(+1.43)#10 | 1.31%(+0.461)#2,394 |
| 11. | Cincinnati | 1.62% | 0.34%(+1.28)#11 | 1.31%(+0.306)#2,654 |
| 12. | Guy | 1.62% | 0.34%(+1.28)#12 | 1.31%(+0.306)#2,655 |
| 13. | Holiday Island | 1.57% | 0.34%(+1.23)#13 | 1.31%(+0.259)#2,732 |
| 14. | Jacksonville | 1.56% | 0.34%(+1.23)#14 | 1.31%(+0.255)#2,740 |
| 15. | Delight | 1.54% | 0.34%(+1.21)#15 | 1.31%(+0.234)#2,787 |
| 16. | Dyer | 1.53% | 0.34%(+1.19)#16 | 1.31%(+0.217)#2,820 |
| 17. | Ward | 1.41% | 0.34%(+1.08)#17 | 1.31%(+0.105)#3,045 |
| 18. | Marvell | 1.36% | 0.34%(+1.03)#18 | 1.31%(+0.054)#3,147 |
| 19. | Clarkedale | 1.35% | 0.34%(+1.01)#19 | 1.31%(+0.035)#3,190 |
| 20. | Amagon | 1.30% | 0.34%(+0.962)#20 | 1.31%(-0.011)#3,300 |
| 21. | Siloam Springs | 1.21% | 0.34%(+0.877)#21 | 1.31%(-0.096)#3,475 |
| 22. | White Hall | 1.21% | 0.34%(+0.869)#22 | 1.31%(-0.105)#3,491 |
| 23. | Lakeview | 1.16% | 0.34%(+0.822)#23 | 1.31%(-0.151)#3,607 |
| 24. | Haskell | 1.15% | 0.34%(+0.814)#24 | 1.31%(-0.159)#3,630 |
| 25. | Barling | 1.06% | 0.34%(+0.719)#25 | 1.31%(-0.255)#3,892 |
| 26. | Pottsville | 1.02% | 0.34%(+0.682)#26 | 1.31%(-0.291)#3,995 |
| 27. | Charleston | 1.01% | 0.34%(+0.669)#27 | 1.31%(-0.304)#4,043 |
| 28. | Cabot | 1.00% | 0.34%(+0.665)#28 | 1.31%(-0.308)#4,056 |
| 29. | Pocahontas | 0.99% | 0.34%(+0.652)#29 | 1.31%(-0.321)#4,098 |
| 30. | Helena West Helena | 0.98% | 0.34%(+0.645)#30 | 1.31%(-0.328)#4,126 |
| 31. | Cushman | 0.89% | 0.34%(+0.558)#31 | 1.31%(-0.415)#4,432 |
| 32. | Rogers | 0.87% | 0.34%(+0.537)#32 | 1.31%(-0.437)#4,509 |
| 33. | Sherwood | 0.86% | 0.34%(+0.519)#33 | 1.31%(-0.454)#4,572 |
| 34. | Avoca | 0.83% | 0.34%(+0.491)#34 | 1.31%(-0.482)#4,695 |
| 35. | Centerton | 0.77% | 0.34%(+0.430)#35 | 1.31%(-0.543)#4,946 |
| 36. | Bentonville | 0.75% | 0.34%(+0.414)#36 | 1.31%(-0.560)#5,019 |
| 37. | Higginson | 0.71% | 0.34%(+0.377)#37 | 1.31%(-0.596)#5,203 |
| 38. | Lost Bridge Village | 0.69% | 0.34%(+0.355)#38 | 1.31%(-0.618)#5,310 |
| 39. | Flippin | 0.66% | 0.34%(+0.322)#39 | 1.31%(-0.651)#5,481 |
| 40. | North Little Rock | 0.62% | 0.34%(+0.279)#40 | 1.31%(-0.694)#5,675 |
| 41. | Cherokee Village | 0.61% | 0.34%(+0.276)#41 | 1.31%(-0.697)#5,702 |
| 42. | Batesville | 0.61% | 0.34%(+0.272)#42 | 1.31%(-0.701)#5,724 |
| 43. | Marion | 0.60% | 0.34%(+0.265)#43 | 1.31%(-0.709)#5,768 |
| 44. | Highfill | 0.60% | 0.34%(+0.259)#44 | 1.31%(-0.714)#5,806 |
| 45. | Mcrae | 0.59% | 0.34%(+0.249)#45 | 1.31%(-0.724)#5,870 |
| 46. | Shannon Hills | 0.56% | 0.34%(+0.222)#46 | 1.31%(-0.751)#6,033 |
| 47. | Central City | 0.55% | 0.34%(+0.212)#47 | 1.31%(-0.761)#6,104 |
| 48. | Rockwell | 0.55% | 0.34%(+0.210)#48 | 1.31%(-0.763)#6,115 |
| 49. | Bradford | 0.54% | 0.34%(+0.206)#49 | 1.31%(-0.767)#6,149 |
| 50. | Fayetteville | 0.53% | 0.34%(+0.193)#50 | 1.31%(-0.781)#6,226 |
| 51. | Pea Ridge | 0.53% | 0.34%(+0.189)#51 | 1.31%(-0.784)#6,258 |
| 52. | Fort Smith | 0.52% | 0.34%(+0.179)#52 | 1.31%(-0.794)#6,323 |
| 53. | Horseshoe Lake | 0.51% | 0.34%(+0.172)#53 | 1.31%(-0.801)#6,378 |
| 54. | Booneville | 0.50% | 0.34%(+0.161)#54 | 1.31%(-0.812)#6,450 |
| 55. | Wilson | 0.49% | 0.34%(+0.150)#55 | 1.31%(-0.823)#6,513 |
| 56. | Little Rock | 0.47% | 0.34%(+0.137)#56 | 1.31%(-0.836)#6,614 |
| 57. | Springdale | 0.47% | 0.34%(+0.134)#57 | 1.31%(-0.839)#6,637 |
| 58. | Tull | 0.46% | 0.34%(+0.125)#58 | 1.31%(-0.848)#6,697 |
| 59. | Green Forest | 0.43% | 0.34%(+0.092)#59 | 1.31%(-0.881)#6,890 |
| 60. | Des Arc | 0.43% | 0.34%(+0.092)#60 | 1.31%(-0.881)#6,891 |
| 61. | West Crossett | 0.42% | 0.34%(+0.081)#61 | 1.31%(-0.892)#6,958 |
| 62. | Goshen | 0.42% | 0.34%(+0.081)#62 | 1.31%(-0.892)#6,959 |
| 63. | Monticello | 0.41% | 0.34%(+0.078)#63 | 1.31%(-0.895)#6,982 |
| 64. | Fordyce | 0.41% | 0.34%(+0.077)#64 | 1.31%(-0.896)#6,993 |
| 65. | Midway | 0.40% | 0.34%(+0.061)#65 | 1.31%(-0.912)#7,095 |
| 66. | Conway | 0.38% | 0.34%(+0.047)#66 | 1.31%(-0.926)#7,204 |
| 67. | Gassville | 0.36% | 0.34%(+0.028)#67 | 1.31%(-0.945)#7,325 |
| 68. | Bull Shoals | 0.34% | 0.34%(-0.002)#68 | 1.31%(-0.975)#7,561 |
| 69. | Brinkley | 0.33% | 0.34%(-0.003)#69 | 1.31%(-0.976)#7,569 |
| 70. | Tontitown | 0.33% | 0.34%(-0.004)#70 | 1.31%(-0.978)#7,585 |
| 71. | Jonesboro | 0.32% | 0.34%(-0.020)#71 | 1.31%(-0.994)#7,718 |
| 72. | Harrison | 0.31% | 0.34%(-0.025)#72 | 1.31%(-0.998)#7,761 |
| 73. | Fairfield Bay | 0.31% | 0.34%(-0.031)#73 | 1.31%(-1.00)#7,806 |
| 74. | West Fork | 0.29% | 0.34%(-0.042)#74 | 1.31%(-1.02)#7,884 |
| 75. | Rector | 0.28% | 0.34%(-0.058)#75 | 1.31%(-1.03)#8,025 |
| 76. | Walnut Ridge | 0.28% | 0.34%(-0.060)#76 | 1.31%(-1.03)#8,039 |
| 77. | Ashdown | 0.26% | 0.34%(-0.079)#77 | 1.31%(-1.05)#8,196 |
| 78. | Van Buren | 0.26% | 0.34%(-0.080)#78 | 1.31%(-1.05)#8,207 |
| 79. | Lake Village | 0.24% | 0.34%(-0.097)#79 | 1.31%(-1.07)#8,351 |
| 80. | Reyno | 0.24% | 0.34%(-0.100)#80 | 1.31%(-1.07)#8,373 |
| 81. | Huntsville | 0.24% | 0.34%(-0.101)#81 | 1.31%(-1.07)#8,388 |
| 82. | Murfreesboro | 0.23% | 0.34%(-0.102)#82 | 1.31%(-1.08)#8,390 |
| 83. | Hot Springs | 0.23% | 0.34%(-0.111)#83 | 1.31%(-1.08)#8,472 |
| 84. | Diamond City | 0.23% | 0.34%(-0.112)#84 | 1.31%(-1.08)#8,479 |
| 85. | Sheridan | 0.22% | 0.34%(-0.117)#85 | 1.31%(-1.09)#8,524 |
| 86. | Redfield | 0.21% | 0.34%(-0.124)#86 | 1.31%(-1.10)#8,579 |
| 87. | Prairie Grove | 0.18% | 0.34%(-0.154)#87 | 1.31%(-1.13)#8,840 |
| 88. | East End | 0.18% | 0.34%(-0.158)#88 | 1.31%(-1.13)#8,866 |
| 89. | Piney | 0.18% | 0.34%(-0.161)#89 | 1.31%(-1.13)#8,885 |
| 90. | Bergman | 0.16% | 0.34%(-0.179)#90 | 1.31%(-1.15)#9,035 |
| 91. | Russellville | 0.14% | 0.34%(-0.195)#91 | 1.31%(-1.17)#9,183 |
| 92. | Knoxville | 0.13% | 0.34%(-0.203)#92 | 1.31%(-1.18)#9,250 |
| 93. | Trumann | 0.12% | 0.34%(-0.215)#93 | 1.31%(-1.19)#9,370 |
| 94. | Rockport | 0.11% | 0.34%(-0.224)#94 | 1.31%(-1.20)#9,451 |
| 95. | Texarkana | 0.095% | 0.34%(-0.242)#95 | 1.31%(-1.21)#9,578 |
| 96. | Greenwood | 0.094% | 0.34%(-0.242)#96 | 1.31%(-1.22)#9,584 |
| 97. | Marked Tree | 0.086% | 0.34%(-0.251)#97 | 1.31%(-1.22)#9,642 |
| 98. | Bella Vista | 0.083% | 0.34%(-0.254)#98 | 1.31%(-1.23)#9,678 |
| 99. | Melbourne | 0.082% | 0.34%(-0.254)#99 | 1.31%(-1.23)#9,683 |
| 100. | West Memphis | 0.078% | 0.34%(-0.259)#100 | 1.31%(-1.23)#9,704 |
Common Questions
What are the Top 10 Cities with the Highest Percentage of Korean Population in Arkansas?
Top 10 Cities with the Highest Percentage of Korean Population in Arkansas are:
#1
4.22%
#2
3.14%
#3
2.98%
#4
2.62%
#5
2.53%
#6
2.11%
#7
2.02%
#8
2.00%
#9
1.79%
#10
1.77%
What city has the Highest Percentage of Korean Population in Arkansas?
Berryville has the Highest Percentage of Korean Population in Arkansas with 4.22%.
What is the Percentage of Korean Population in the State of Arkansas?
Percentage of Korean Population in Arkansas is 0.34%.
What is the Percentage of Korean Population in the United States?
Percentage of Korean Population in the United States is 1.31%.