Zip Codes with the Highest Percentage of Population Employed in Food Preparation & Serving in Gillette, WY
RELATED REPORTS & OPTIONS
Food Preparation & Serving
Gillette
Compare Zip Codes
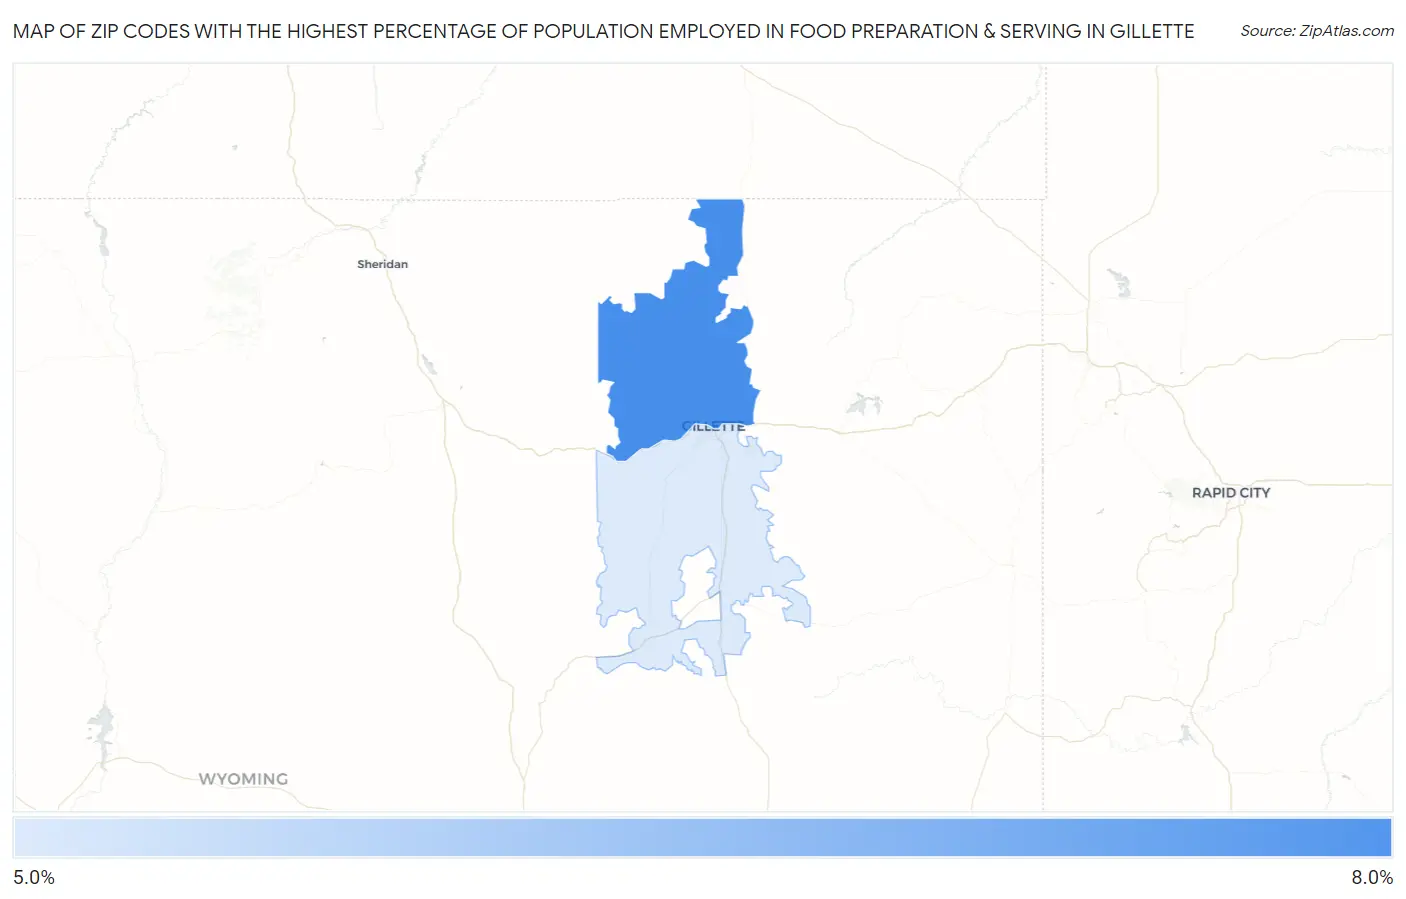
Map of Zip Codes with the Highest Percentage of Population Employed in Food Preparation & Serving in Gillette
5.3%
6.9%
Zip Codes with the Highest Percentage of Population Employed in Food Preparation & Serving in Gillette, WY
| Zip Code | % Employed | vs State | vs National | |
| 1. | 82716 | 6.9% | 5.9%(+1.02)#37 | 5.3%(+1.59)#6,870 |
| 2. | 82718 | 5.3% | 5.9%(-0.601)#56 | 5.3%(-0.030)#11,936 |
1
Common Questions
What are the Top Zip Codes with the Highest Percentage of Population Employed in Food Preparation & Serving in Gillette, WY?
Top Zip Codes with the Highest Percentage of Population Employed in Food Preparation & Serving in Gillette, WY are:
What zip code has the Highest Percentage of Population Employed in Food Preparation & Serving in Gillette, WY?
82716 has the Highest Percentage of Population Employed in Food Preparation & Serving in Gillette, WY with 6.9%.
What is the Percentage of Population Employed in Food Preparation & Serving in Gillette, WY?
Percentage of Population Employed in Food Preparation & Serving in Gillette is 6.8%.
What is the Percentage of Population Employed in Food Preparation & Serving in Wyoming?
Percentage of Population Employed in Food Preparation & Serving in Wyoming is 5.9%.
What is the Percentage of Population Employed in Food Preparation & Serving in the United States?
Percentage of Population Employed in Food Preparation & Serving in the United States is 5.3%.