Zip Codes with the Highest Percentage of Population Employed in Food Preparation & Serving in Cheyenne, WY
RELATED REPORTS & OPTIONS
Food Preparation & Serving
Cheyenne
Compare Zip Codes
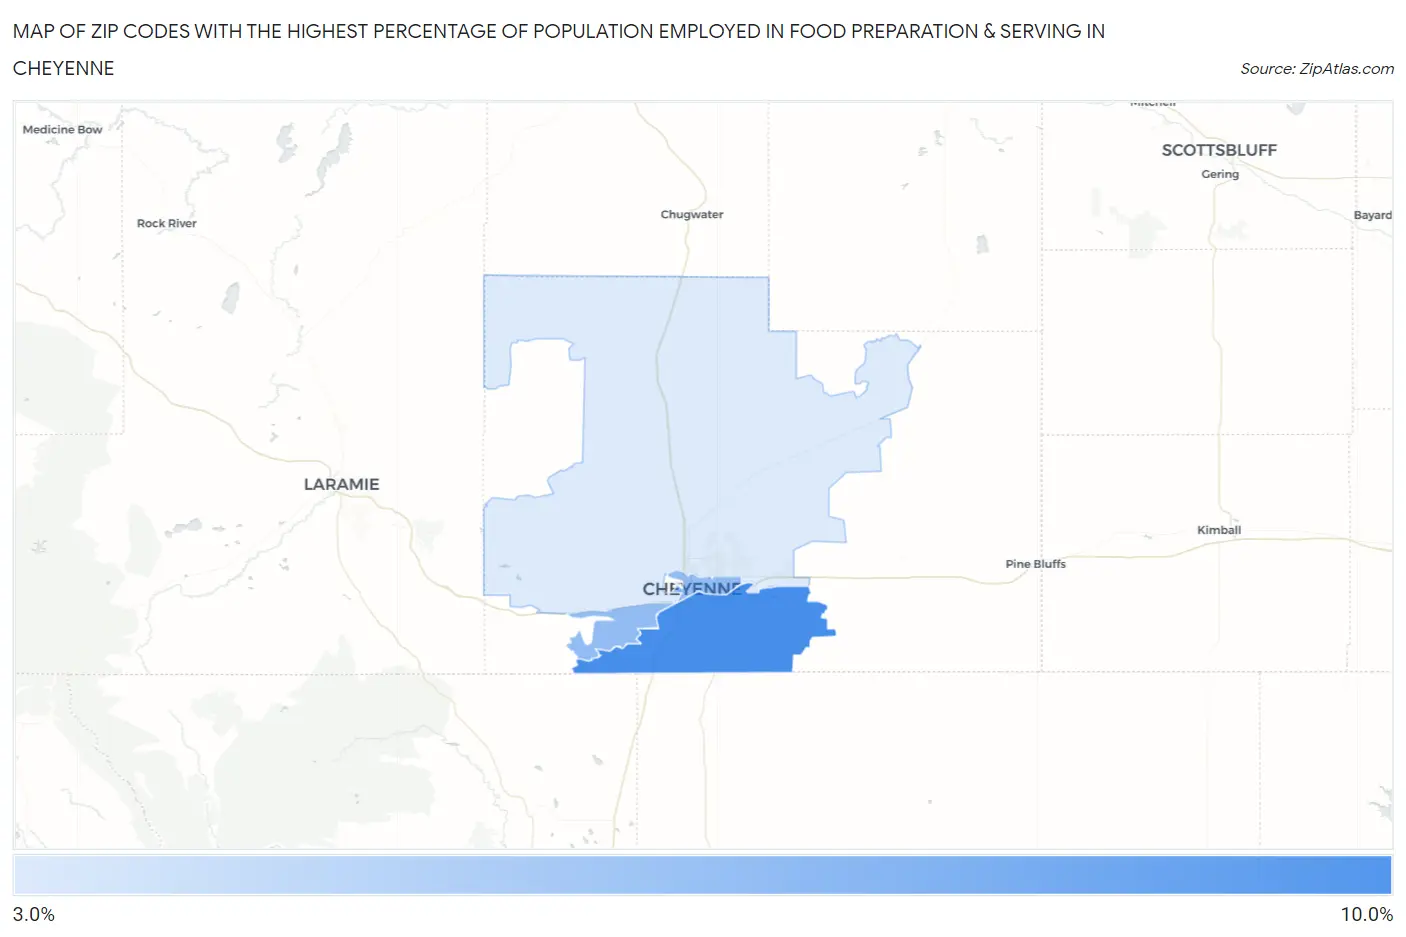
Map of Zip Codes with the Highest Percentage of Population Employed in Food Preparation & Serving in Cheyenne
3.9%
8.8%
Zip Codes with the Highest Percentage of Population Employed in Food Preparation & Serving in Cheyenne, WY
| Zip Code | % Employed | vs State | vs National | |
| 1. | 82007 | 8.8% | 5.9%(+2.98)#22 | 5.3%(+3.55)#3,674 |
| 2. | 82001 | 6.3% | 5.9%(+0.403)#43 | 5.3%(+0.974)#8,545 |
| 3. | 82009 | 3.9% | 5.9%(-2.00)#80 | 5.3%(-1.43)#17,727 |
1
Common Questions
What are the Top Zip Codes with the Highest Percentage of Population Employed in Food Preparation & Serving in Cheyenne, WY?
Top Zip Codes with the Highest Percentage of Population Employed in Food Preparation & Serving in Cheyenne, WY are:
What zip code has the Highest Percentage of Population Employed in Food Preparation & Serving in Cheyenne, WY?
82007 has the Highest Percentage of Population Employed in Food Preparation & Serving in Cheyenne, WY with 8.8%.
What is the Percentage of Population Employed in Food Preparation & Serving in Cheyenne, WY?
Percentage of Population Employed in Food Preparation & Serving in Cheyenne is 6.0%.
What is the Percentage of Population Employed in Food Preparation & Serving in Wyoming?
Percentage of Population Employed in Food Preparation & Serving in Wyoming is 5.9%.
What is the Percentage of Population Employed in Food Preparation & Serving in the United States?
Percentage of Population Employed in Food Preparation & Serving in the United States is 5.3%.